Article

Adequacy Analysis Using UAV of Heavy Rainfall Disaster Reduction Facilities According to Urban Development in Republic of Korea

1
Department of Fire and Disaster Prevention, Konkuk University, Chungju 27478, Republic of Korea
2
Department of Aeronautics and Civil Engineering, Hanseo University, Seosan 31962, Republic of Korea
3
Department of Civil Environmental Engineering, Dongshin University, Naju 582452, Republic of Korea
*
Author to whom correspondence should be addressed.
Remote Sens. 2023, 15(23), 5518; https://doi.org/10.3390/rs15235518
Submission received: 25 September 2023 / Revised: 17 November 2023 / Accepted: 24 November 2023 / Published: 27 November 2023
(This article belongs to the Special Issue New Perspectives in Natural Hazards Remote Sensing)

Abstract

:
Urban development is a project that enhances human life, but its hydrological impact increases runoff by expanding impervious areas. Furthermore, localized and intense rainfall resulting from the effects of climate change is exacerbating damage to urban areas. The Republic of Korea has established detention ponds as reduction facilities for heavy rainfall disasters, and the law stipulates that the impact of disasters that increase due to the development projects will remain unchanged from before. However, ensuring precision in millimeter or centimeter units during the design of reduction facilities is challenging. In this study, our aim is to assess the suitability of using unmanned aerial vehicles (UAVs) for the detention pond, a facility that reduces runoff resulting from urban development. The target area is a detention pond located in Innovation City, Ulsan Metropolitan City, Republic of Korea. We compared and analyzed design drawings and topographical data. The increased runoff due to the development project was 0.59 m3/s, and the effectiveness of disaster reduction was evaluated by the installation of a detention pond. The detention pond’s reduction effect was analyzed to be 1.16 m3/s for the design drawing and 1.57 m3/s for the topographical analysis. The detention pond currently in place in the target area was found to provide additional disaster reduction benefits compared to the original design plan. The findings of this study can be utilized in relevant laws and guidelines as a method to evaluate the suitability of future reduction facilities.

1. Introduction

Recently, disasters have been occurring frequently worldwide, and natural disasters like typhoons, heavy rainfall, and earthquakes have resulted in numerous casualties. Urban development, in particular, has a significant impact on people’s lives and can offer various benefits, including public health and welfare [1,2]. In the Republic of Korea, a country with 70% of its land area covered by mountains, there is a legal requirement to install facilities aimed at reducing impervious areas and runoff resulting from urban development. In the Republic of Korea, increased runoff due to urban development necessitates the installation of reduction facilities based on a 50-year design frequency. This is performed to maintain the disaster impact at pre-development levels. Detention ponds are the primary type of reduction facilities installed, but the effectiveness of detention pond performance is not assessed post-installation. Detention ponds serve as temporary storage for runoff during heavy rain events and demand ongoing maintenance. However, there are no regulations in the Republic of Korea’s governing measurements and evaluation methods to confirm a detention pond’s capacity to reduce runoff following installation.
Lately, 3D topographic surveys using unmanned aerial vehicles (UAVs) have gained attention in many countries. Advances in aerial photogrammetry methods using UAVs have elevated the collection and construction of topographical information, ensuring convenience and reliability [3,4,5,6,7,8]. UAV-based topographic surveys generate detailed 3D topographic and spatial surface data for X, Y, and Z coordinates [9,10,11,12]. Additionally, they provide insights not only into the ground’s topographical features, as realized by the digital elevation model (DEM) and digital terrain model (DTM), but also the characteristics of natural and man-made objects through the digital surface model (DSM) [13,14,15,16,17]. Furthermore, aerial photography or LiDAR surveys utilizing UAVs contribute to the creation of precise terrain models [18,19]. UAV data enable the creation of a 3D point cloud via the structure from motion (SfM) analysis method, developed in 1993 [16]. This involves processing images using observed data within a feature matching algorithm with mathematical parameters [20,21,22]. Presently, software such as Pix4D and Photoscan are employed for point cloud generation, DSM creation, orthophotos, mesh modeling, 3D modeling, and mapping through image analysis [23,24,25,26,27,28,29,30].
To mitigate the increased runoff resulting from urban development, the installation of a detention pond is mandated. In the field of hydrology, researchers have explored the utility of UAVs in various aspects, including topographic surveying, flow observation, and terrain runoff characteristics analysis. UAVs have been employed to survey rivers, ascertain riverbed particle sizes, and analyze the riverbed roughness coefficient (n) as per the Manning formula to calculate discharge [31,32]. Some studies have focused on monitoring surface flow velocities of rivers and estimating runoff volumes based on non-contact imagery [33,34,35,36,37,38]. Following river floods, research has delved into the analysis of maximum discharge and sediment movements through topographic surveys that account for river sediments [39,40]. In addition to direct discharge calculations, investigations have centered on slope analysis, a geographical feature influencing discharge, river monitoring considering temporal changes, and discharge estimation in uncharted rivers employing UAVs [41,42,43,44,45,46,47]. Nonetheless, the majority of discharge calculations in hydrology have revolved around topographical river analysis, flow velocity measurements, and monitoring, with limited attention to discharge analysis in urban areas.
Thus, in this study, we evaluate the suitability of employing UAVs for assessing the effectiveness of detention ponds installed to help disaster reduction arising from urban development. We apply the discharge calculation procedure outlined in the practical guidelines mandated by law for urban development. In the case of the detention pond, we conducted topographic surveys utilizing UAVs and constructed 3D topographic data using orthophotos, point clouds, and digital surface models (DSM) with PIx4D. We then compare the storage capacity of the detention pond as based on the urban development design report with the storage capacity analyzed using UAV data after installation. Our objective is to assess the effectiveness of heavy rainfall disaster reduction facilities installed due to urban development.

2. Materials and Methods

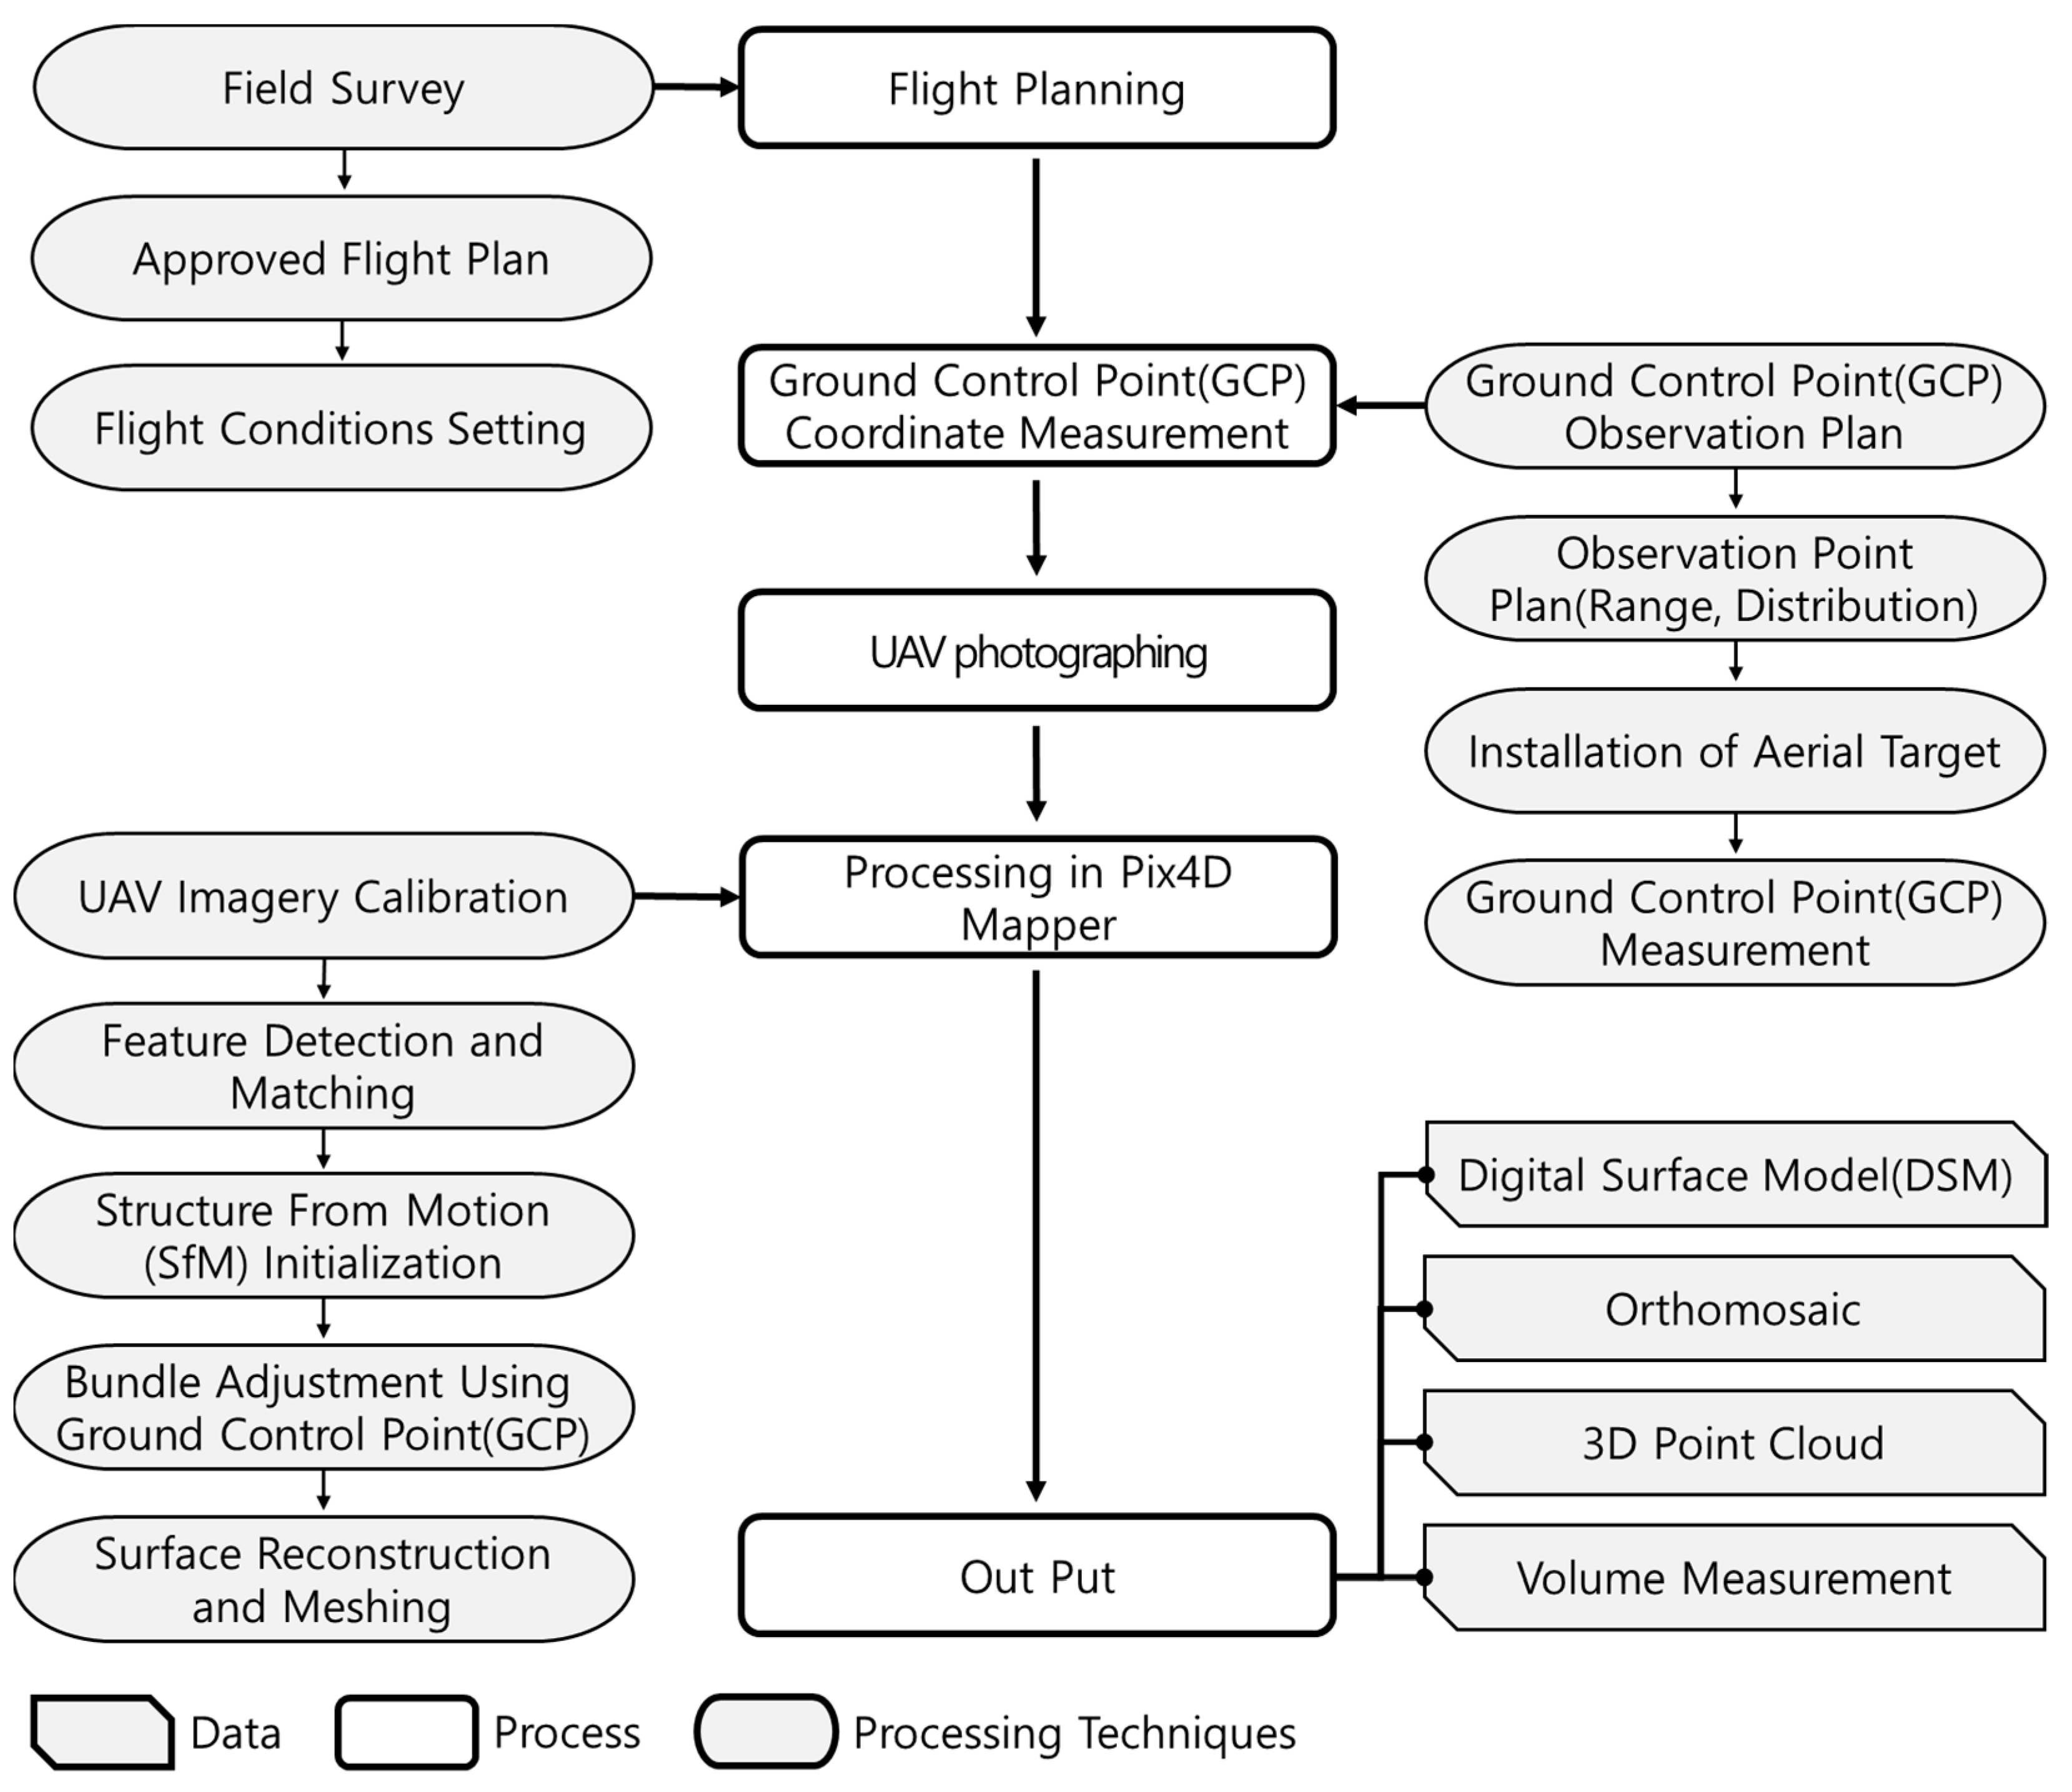
2.1. Analysis Method of Unmanned Aerial Vehicle

The construction of topographic data using UAVs has enabled the creation of maps with higher resolution compared to existing satellite photos, aerial photos, and digital elevation models (DEMs). UAVs are finding applications in numerous industrial sectors beyond being a mere hobby. They have exhibited rapid technological advancements and versatility by integrating with various industries, including photography, surveying, and observation. In this study, we focused on the utilization of UAVs in the field of topographic surveying among their various applications. The research methodology for generating terrain data using UAVs is depicted in Figure 1.
To construct terrain data using a UAV, orthoimagery, digital surface model (DSM), and a 3D point cloud are analyzed through a process involving flight planning, ground control point (GCP) surveying, aerial photography, and Pix4D Mapper analysis. The flight plan is carefully designed, taking into consideration the terrain, structures, and weather conditions of the target area. After completing the field survey of the target area, an application for flight plan approval, specifying flight area, aircraft details, flight range, and UAV information, is submitted to the Republic of Korea Transportation Safety Authority. Once the flight plan receives approval, the number and placement of GCP observation points within the target area are determined and surveying activities are carried out. Following the completion of flight plan approval and GCP observation, aerial photography using a UAV is conducted over the target area.
Aerial photographs taken by UAV and the observed GCP data were analyzed using Pix4D Mapper. Aerial photos are merged by aligning identical images based on their coordinates. The topographical coordinates of these images are used to generate a point cloud through triangulation, and initial structure from motion (SfM) settings are applied. The elevation data from the aerial photos and topographic information are calibrated by incorporating the observed GCP points into the primary topographic data. The analyzed topographic data are orthophotos, DSM, 3D point cloud, and volume survey. Various options can be configured to view terrain data, point cloud coordinates, and contour maps.

2.2. Estimation Method of Discharge

In the Republic of Korea, the calculation of discharge based on design frequency is essential for predicting the potential scale of disasters in diverse design and planning contexts, including rivers, hydraulic structures, and disaster reduction. In 2012, the Ministry of Land, Infrastructure and Transport released the ‘Design Discharge Calculation Guidelines’ to assess different standards and theories for discharge calculation. These guidelines aimed to minimize the subjective judgment of designers, which had been a point of contention in the past [48]. Prior to the publication of these guidelines, various calculation methods had been applied, taking into account regional and topographical characteristics. However, since 2012, a uniform standard for design discharge calculation has been implemented across all designs and plans in the Republic of Korea. The process for calculating discharge in the Republic of Korea is illustrated in Figure 2.
The ‘Design Discharge Calculation Guidelines,’ established by the Ministry of Land, Infrastructure, and Transport in 2012, are organized into six chapters, providing the theory and calculation standards for parameters essential for design discharge analysis. Section 1 of the ‘Design Discharge Calculation Guidelines’ serves as an introduction, while Section 2 focuses on rainfall analysis. Section 3 covers the calculation of basin characteristic factors, Section 4 deals with effective rainfall calculation, and Section 5 outlines the discharge calculation method. Lastly, Section 6 is dedicated to flood hydrograph analysis. Table 1 presents the parameter analysis method for each chapter related to the design discharge calculation suitable for the Republic of Korea, while Equations (1)–(9) depict the parameter calculation formulas.
Y = 0.1346 × X 1.4170 + 1.0014
f x = 1 σ e x p ( x μ ) σ e p x ( x μ ) σ
Here, Y is a conversion coefficient, x is rainfall data (mm), μ is the location parameter, and σ is the scale parameter.
I n I = a + b I n t h + c ( I n t h ) 2 + d ( I n t h ) 3 + e I n t h 4 + f I n t h 5 + g I n t h 6
A R F A = 1 M · e x p ( a A b ) 1
Here, I is rainfall intensity according to rainfall duration (mm/h); t h is the rainfall duration (h); a, b, c, d, e, f, g, n, etc., are regression constants; ARF (A) is the basin area (A (km2)); M, a, b are the regression constants of the area rainwater conversion coefficient regression equation,
T c = 16.667 L V
( S 3 400 ) : V = 4.592 0.01194 S ,   V m a x = 4.5   m / s
S 3 400 : V = 35,151.515 S 2 79.393939 S + 1.6181818 ,       V m i n = 1.6   m / s
Here, T c is the time of concentration (min), L is the flow path extension (km), S is the average slope (dimensionless), and V is the average flow velocity (m/s).
K = T c 1.46 0.0867 L 2 A
S = K O + x ( I O = K x I + 1 x O
K is travel time (h), T c is the time of concentration (h), L is the flow path extension (km), A is the basin area (km2), S is total storage (m3), I is inflow, O is outflow, and x is the weighting factor.

2.3. Analysis Method of Detention Pond

A detention pond is a facility designed to reduce the time it takes to reach maximum discharge or minimize flood damage by temporarily storing concentrated discharge during rainfall events. It is usually used as an empty lot, park, playground, or parking lot and is defined as a facility for storing rainwater storage in case rainfall occurs. Detention ponds are disaster reduction facilities strategically installed to mitigate increased discharge resulting from urban development. Detention ponds are typically located downstream of urban rivers.
The analysis method for detention ponds is based on the retention equation, a hydrological flood estimation approach. Detention ponds regulate the outflow to downstream areas by employing flood gates in the spillway or outlet. The volume of outflow is determined by the hydraulic characteristics and operational capacity of the discharge structure, while the inflow and storage volume of the detention pond are determined by the design frequency. The storage equation for detention ponds employs the modified PLUS reservoir flood tracking method, as depicted in Equation (10).
I a v g O a v g = S t
Here, I a v g : average inflow during time interval; O a v g : average outflow during time interval; and S : storage change
In a specified river channel section, the temporal rate of change in storage volume, or the detention pond storage volume, is determined by the variance between the inflow rate at the upstream end of the section and the outflow rate at the downstream end. When we differentiate Equation (10) with respect to time, and if floodgates control the outflow downstream of the detention pond, we can incorporate the flood control term into the storage equation, resulting in the calculation of Equation (9).
The values of I t and I t + 1 are the inflow hydrograph ordinates, perhaps computed with models described earlier in the manual. The values of O t and S t are known at the t th time interval. At t = 0 , these are the initial conditions, and at each subsequent interval, they are known from calculation in the previous interval. Thus, the quantity 2 S t + 1 t + O t + 1 can be calculated with Equation (11). For an impoundment, storage and outflow are related, and with this storage–outflow relationship, the corresponding values of O t + 1 and S t + 1 can be found. The computations can be repeated for successive intervals, yielding values O t + 1 , O t + 2 , … O t + n , the required outflow hydrograph ordinates.
2 S t + 1 t + O t + 1 = I t + I t + 1 + ( 2 S t t O t )
Here, t : index of time interval; I t + 1 : the inflow values at the beginning and end of the tth time interval; O t and O t + 1 : the corresponding outflow values; S t and S t + 1 : corresponding storage values.

3. Detention Pond Analysis Using Unmanned Aerial Vehicle

3.1. Target Area and Observation Equipment

In the Republic of Korea, the principle of assigning responsibility for compensation and disaster recovery in the event of a catastrophe is based on identifying the root cause. Discharge, which escalates due to the development projects, is regulated to ensure the establishment of more secure reduction measures, guided by a 50-year design frequency, compared to conditions prior to the development. Ulsan Metropolitan City is an area where disaster impact assessment was established as an innovative city development project in 2010. Five detention ponds were installed in 10 watersheds to reduce design discharge due to urban development. However, following the innovative city development project, instances of flooding damage occurred downstream during Typhoon ‘Chaba’ in 2016 and Typhoon ‘Ohmais’ in 2021. These events underscored the challenge of the detention pond’s flood reduction effectiveness. Therefore, in this study, the detention pond of the Sagokcheon basin, which has the largest watershed area among the watersheds of Ulsan Innovation City, was selected as the target area (Figure 3).
The Sagokcheon basin in Ulsan Innovation City is situated on the left side of the city, covering a basin area of 1.39 km2, which constitutes approximately 10% of the total area of Innovation City. Flowing through the center of the basin is Sagokcheon, and plans are in place to develop an innovative city on a 0.17 km2 in the downstream region. To mitigate the escalating discharge resulting from urban development, a detention pond spanning an area of 6685 km2 was constructed downstream within the basin. Table 2 provides an overview of the current status of the Sagokcheon basin.
Topographic surveying using UAV necessitates the use of equipment equipped with real-time kinematic (RTK) capabilities, enabling real-time reception of GPS and location information. Moreover, to enhance the precision of topographical data, the ground control point (GCP) must be surveyed using equipment equipped with the global navigation satellite system (GNSS). In this study, UAV-based topographic surveying was executed employing the Phantom 4 RTK and Trimble R4s systems, focusing on the detention pond situated within the Sagokcheon basin (Figure 4).
The Phantom 4 RTK weighs approximately 1.4 kg and boasts a diagonal length of 35 cm. Its camera is equipped with a 24 mm lens and a 1-inch CMOS sensor, enabling high-resolution aerial photography. On the other hand, the Trimble R4s utilizes satellites to furnish information regarding the location, altitude, and speed of terrestrial objects. It facilitates GNSS surveying, providing valuable data. With its ability to receive GNSS signals from 240 channels, it ensures reliable reception even in mountainous and urban terrains, allowing for precise surveying with an error margin of approximately 3 mm for stationary positioning and about 8 to 15 mm for VRS (Table 3).

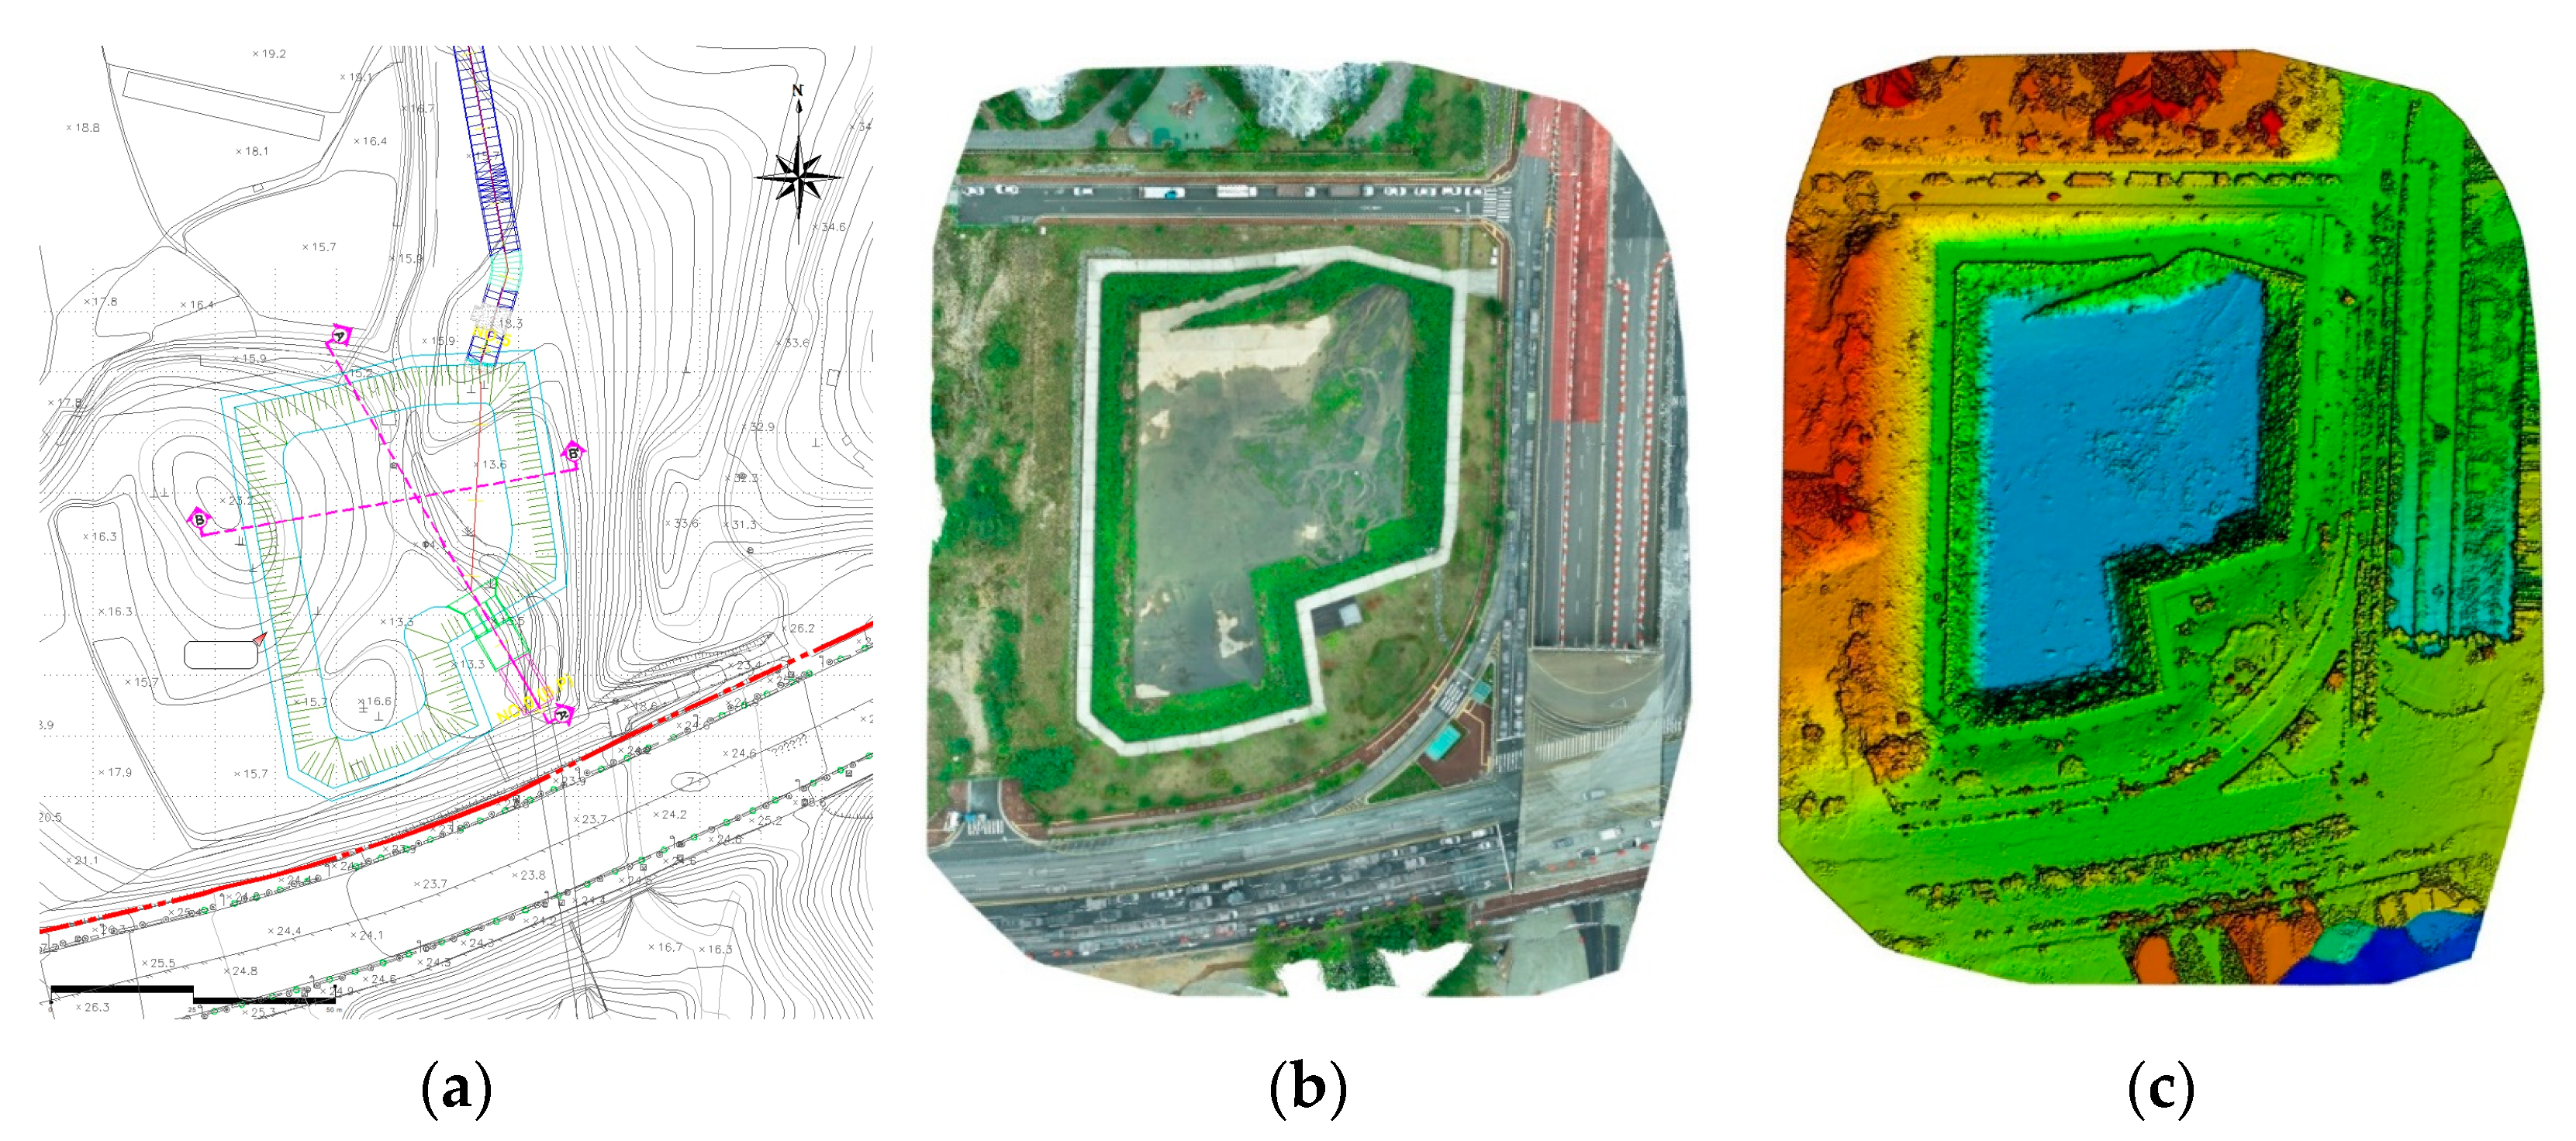
3.2. Survey of Detention Pond Using UAV

A flight plan and ground control point (GCP) observation locations were established for the topographical survey employing a UAV over the detention pond situated in the designated basin (Table 4). The UAV’s flight plan requires detailed specifications aligned with the project’s objectives, including the coverage area, altitude, photo overlap, camera angle, and coordinates. Given the detention pond’s proximity to a residential area along Sagokcheon, aerial photography was not constrained by altitude restrictions, allowing observations at the lowest feasible altitude.
The analysis zone, covering 0.032 km2, inclusive of the detention pond, had a set altitude of 30 m, minimizing interference from surrounding structures and signals. To facilitate precise photogrammetry, the camera angle was configured for planar surveying, with a 90° overlap set at 80% in both the longitudinal and transverse directions. The Phantom 4 RTK is an aircraft equipped to receive real-time location information during flight. To ensure accurate image capture by the UAV, the Ulsan Jung-gu surveillance station, serving as a satellite reference point in close proximity to the target area, was utilized.
For the topographical survey of the detention pond, aerial photographs were captured at a total of 660 designated points in accordance with the flight plan. To enhance image mapping accuracy, and the precision of the aerial photos, a total of 17 ground control points (GCP) were measured. This included 11 points positioned along the border of the detention pond and 6 points within the detention pond itself (Figure 5a). In the Republic of Korea, regulations regarding GCP surveys stipulate that a total of 10 or more points should be observed at intervals of 300 m to 500 m. In this study, more GCPs were observed than the relevant regulations to ensure accuracy.
Subsequently, image mapping was conducted on the acquired aerial photos using Pix4D Mapper. After the initial processing, the topographic data were refined through the utilization of GCP point data (Figure 5b). When mapping images using Pix4D Mapper, orthoimages are created based on each point of the aerial photo, and the error range is several centimeters. To reduce these errors, it is supplemented through GCP surveying, and topographic data are constructed with an error of less than 5 cm. The greater the number of matches between GCP points and aerial photos, the higher the level of accuracy achieved, with a minimum of four points matching being sufficient for generating highly precise results.
The GCP measurement measured 11 points at the corners of the outside of the detention pond and 6 points at the corners of the inside of the detention pond. There was no water inside of the detention pond, and no ground markers were installed, but the corners of the reduction facilities were measured. GCP survey photos of the exterior and interior of the detention pond are shown in Figure 6.
The accuracy of the X, Y, and Z observation data for GCP observation points and observation points measured using UAVs was analyzed (Table 5). Observation data from GCP and UAV were analyzed as −0.000105 m to 0.000255 m for mean and 0.003546 m to 0.005353 m for sigma. The RMS error was analyzed to be 0.003547 m for X, 0.003801 m for Y, and 0.005359 m for Z, an error of approximately 0.004 m.
The analysis outcomes of the detention pond encompass the coordinates of the aerial photographs and the location information of the photos, with geometric distortion corrected through consideration of the ground control points (GCP). The analysis of orthophotos and real terrain, conducted using Pix4D Mapper, incorporates location information for all objects. The recording area of Sagokcheon detention pond spans 0.032 km2, with a ground sampling distance (GSD) of 1.20 cm, resulting in the creation of highly precise topographic data. All captured aerial photos were employed for calibration, yielding approximately 43,726 key points extracted per image. The root mean square error (RMSE) applied to the GCP points was analyzed to exhibit an error margin of 0.004 m, substantiating the construction of high-precision topographic data (Table 6).

3.3. Comparative Analysis of Detention Pond on Design Drawings and Topographical Analysis

The construction of the detention pond was executed according to the data outlined in the disaster impact assessment report for the 2010 development project. While planning, alterations in the capacity and elevation of the detention pond were made in response to local conditions and urban development plans during the construction phase. However, there are no existing laws or regulations to verify the disaster reduction performance after the completion of the detention pond. Hence, in this study, the detention pond’s specifications were reviewed by analyzing design drawings and topographical data employing UAV technology. Figure 7 showcases the design drawing, orthophoto, and digital surface model (DSM) of the detention pond within the target area.
For comparative analysis of detention ponds, data on design drawings and topographical analysis using UAVs were constructed. The design drawings are the specifications presented in the design report of the detention pond, and the topographical analysis are the specifications measured using a UAV. The specifications for design drawing and topography analysis of the detention pond are shown in Table 7. The specifications for the design drawing and topography analysis of the detention pond are detailed in Table 7. According to the design drawing, the floor height of the detention pond was El.18.03 m, but the topography analysis indicated El.17.91 m, representing a construction that was 0.12 m lower. The discharge control reduction capacity for the design frequency of 50 years remained consistent at 15,795 m3. However, there was a disparity in the depth of the detention pond, with the design drawing indicating 3.47 m and the topography analysis showing 2.94 m, resulting in the detention pond being constructed larger than initially designed. The wave height at the top of the detention pond was El.23.15 m according to the design drawing and El.22.97 m based on topography analysis. Interestingly, the total volume and total area calculated from the topography analysis exceeded those derived from the design drawing.
Figure 8 displays the design drawing and topography analysis of the detention pond, along with its storage capacity categorized by depth. The overall depth of the detention pond was 5.12 m as per the design drawing, while the topography analysis indicated a depth of 5.06 m. In terms of total volume, the design drawing accounted for 25,916 m3, whereas the topography analysis yielded a total of 32,402 m3. Despite the actual detention pond’s depth being 0.06 m lower than that depicted in the design drawing, it still managed to secure an additional total capacity of 6486 m3. It was determined that a capacity of 16,607 m3 had been achieved, surpassing the flood control requirements for the detention pond’s design frequency of 50 years.

4. Analysis of Detention Pond Reduction Effects Due to Urban Development

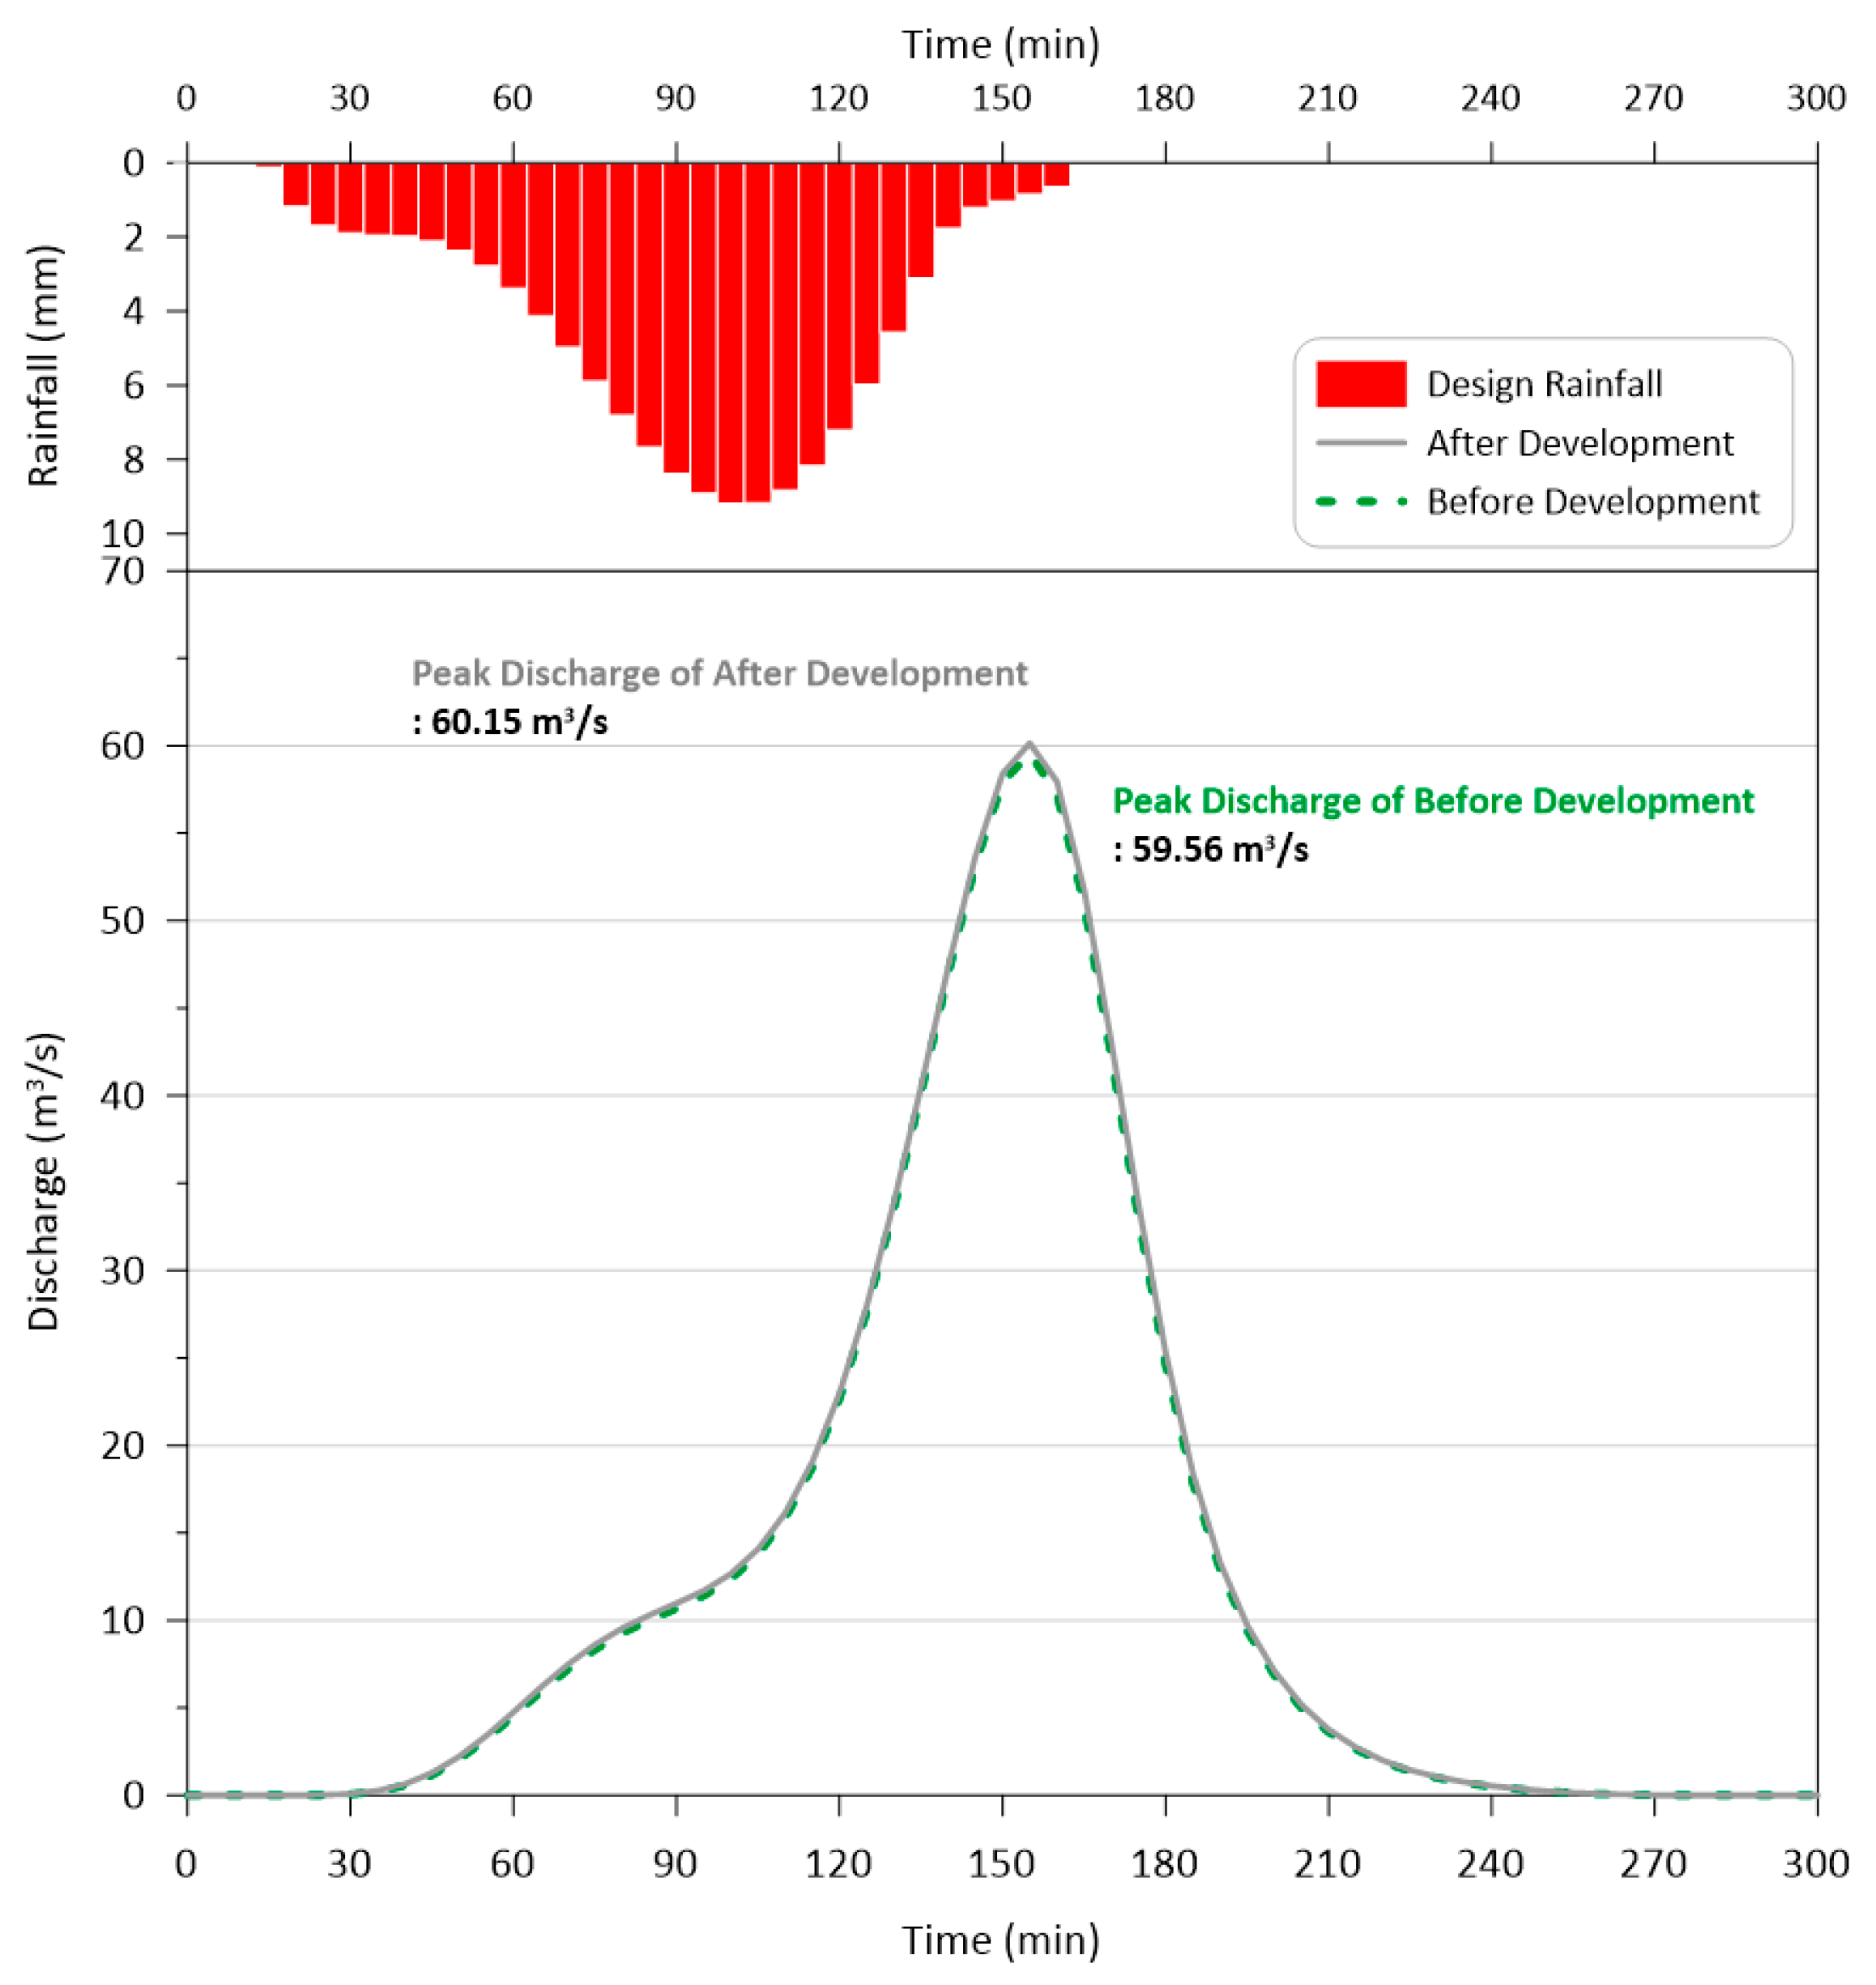
4.1. Discharge Calculation before and after Development

The focal area is the Sagokcheon basin within the scope of the Ulsan Innovation City development project, where a detention pond was installed to mitigate the surge in discharge before and after the development. One of the most significant transformations during urban development projects involves alterations in land use, exemplified by the proliferation of impervious surfaces like roads, residences, and commercial establishments. The land-use map, both pre- and post-development in the Sagokcheon basin, is depicted in Figure 9, with a total area of 1.37 km2, out of which 0.17 km2 underwent development. In alignment with pertinent laws and regulations, the planning of disaster reduction facilities for the development project included a detention pond designed to ensure that the impact of increased discharge, occurring at a 50-year design frequency, remained equivalent to pre-development conditions.
The discharge calculation method is outlined in compliance with the guidelines of the Republic of Korea, established in 2012. The discharge calculation procedure is detailed in Section 2, with the parameters before and after development provided in Table 8. In the case of the target area, the disparities in parameters before and after development are as follows: the runoff curve index increased by 0.78 m3/s, the flow path extension expanded by 0.09 km, and the storage constant rose by 0.02 h, while all other factors remained unaltered. The discharge calculation entailed an analysis spanning 600 min at 5 min intervals, ultimately culminating in the determination of the maximum discharge. This maximum discharge was computed based on a critical duration of 155 min for the target basin and a design rainfall of 128 mm.
Rainfall for the 50-year design frequency in the target basin was examined using the Huff tertile method, revealing a measurement of 128 mm at 5 min intervals. The maximum discharge, categorized by duration, amounted to 59.56 m3/s before development and 60.15 m3/s after development, signifying an increase of 0.59 m3/s due to urban development. The critical duration time for the target basin, both before and after development, remains consistent at 155 min, with the maximum rainfall recorded with a lag time of 55 min and a duration of 100 min. The distribution of rainfall within the target basin and the discharge, both pre- and post-development, delineated by duration, is illustrated in Figure 10.

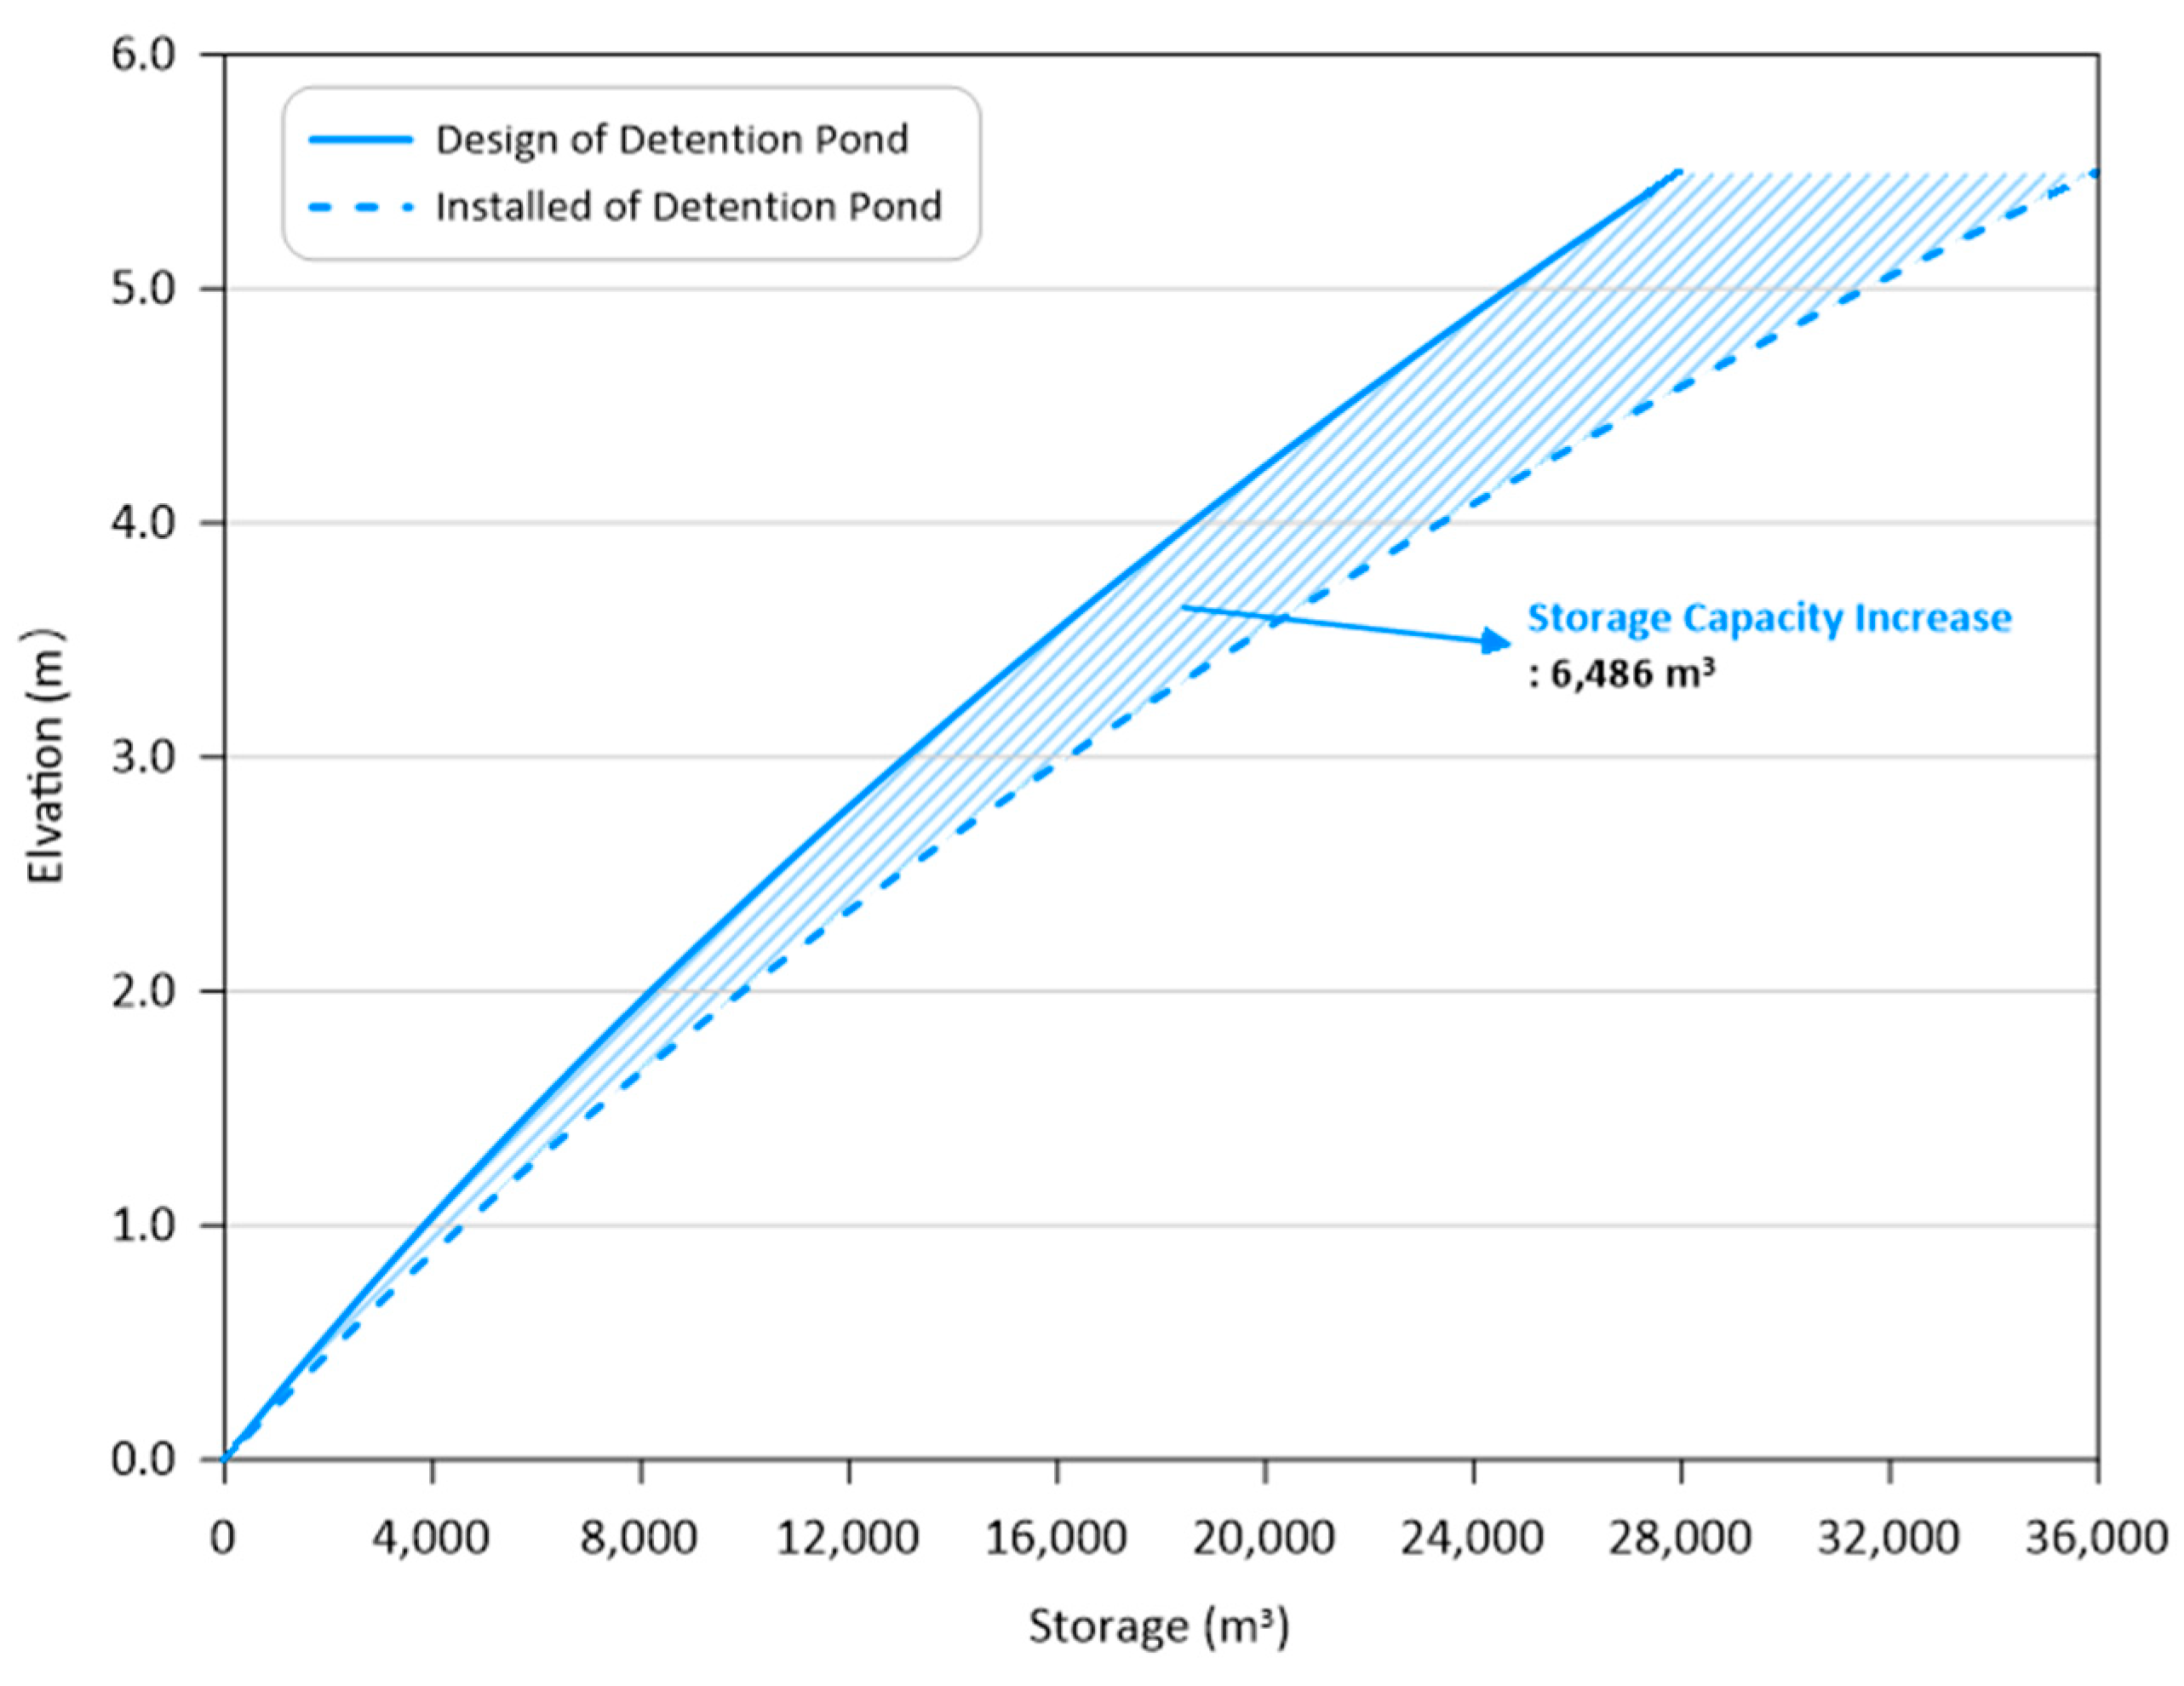
4.2. Reduction Effect Analysis on Detention Pond Using Design Drawing and Topography Analysis

The discharge, both before and after development, was assessed for the 50-year design frequency within the target basin. In an effort to mitigate the increased discharge resulting from development, a detention pond was installed and subsequently analyzed through design drawings and topography assessments employing UAV technology. The laws and regulations governing development projects emphasize the need to maintain the same level of disaster impact as existed before development, based on the principle of attributing responsibility to the cause.
Upon conducting the analysis, it was determined that the detention pond in the target basin exhibited no adverse disaster impact for a design frequency of 50 years, as evidenced in both the design drawing and topography analysis (Figure 11).
Following the installation of the detention pond as part of the development project, the discharge measured 58.99 m3/s in the design drawing and 58.57 m3/s in the topography analysis. This represented a reduction of 0.57 m3/s and 0.99 m3/s, respectively, when compared to the discharge prior to development.
Additionally, the storage capacity for discharge control, in accordance with the design frequency, was determined to be 11,693 m3 in the design drawing and 15,094 m3 in the topography analysis. In addition, the depth and storage capacity of discharge control according to design frequency were analyzed as 3.47 m and 11,693 m3 for design drawing and 2.94 m and 15,094 m3 for topography analysis. It was analyzed that the reduction effect on disasters was secured. Specifically, the storage capacity for discharge control at the design frequency was assessed to have secured an additional 4102 m3 in the design drawing and 701 m3 in the topography analysis.
The target basin was assessed for its disaster reduction capabilities in accordance with the development project, both through design drawing and topography analysis. The installation of disaster reduction facilities is specified in government laws and regulations to ensure not only compliance with the target design frequency but also an additional discharge control depth. The design stipulates the necessity to secure an extra discharge control depth and clearance of 0.6 m. Section 3 of the detention pond specifications revealed that 1.65 m of free space was secured in the design drawing and 2.12 m in the topography analysis. Therefore, both the design drawing and topography analysis of the storage volume and water level of the Sagokcheon Detention Pond were assessed to ascertain additional disaster reduction capacity.
Excluding the discharge control capacity, the detention pond possesses an additional capacity of 10,121 m3 in the design drawing and 16,607 m3 in the topography analysis. It was determined that the currently installed detention pond exceeds the storage capacity required for discharge control, thereby securing supplementary disaster reduction effects (Figure 12a). The overall water depth of the detention pond is 5.12 m in accordance with the design drawing and 5.06 m according to the topography analysis, representing a slight elevation difference of 0.06 m. However, the depth of water up to the discharge control was measured at 3.47 m for the design drawing and 2.94 m for the topography analysis, resulting in a larger retention area for the detention pond. Additionally, in consideration of discharge control, the depth to the wave height was assessed at 1.65 m for the design drawing and 2.12 m for the topography analysis, further enhancing its disaster reduction capacity (Figure 12b).
The installation of the detention pond in the target basin aimed to reduce discharge resulting from urban development projects. As indicated by the topography analysis, it was determined that the detention pond has secured additional disaster reduction impact compared to the existing design drawing. This is expected to result in a more robust disaster reduction effect, even in the event of rainfall exceeding the design frequency, such as the recent surge in precipitation attributed to climate change and heavy rain events.

5. Discussion

In this study, the adequacy of disaster reduction facilities installed during urban development was assessed. Detention ponds were installed to mitigate the increased runoff resulting from urban development, yet no regulations or guidelines existed to validate the effectiveness of these reduction facilities. While differences in design and construction were identified in the target basin of this study, the reduction effect was found to increase due to urban development. UAVs find applications across various fields, and the accuracy of topographical surveying has improved with an error rate in centimeters [1,2,3,4,5,6,7,8,9,10]. Moreover, through image analysis, it is possible to analyze not only topographical information but also three-dimensional characteristics of buildings or facilities [13,14,15,16,17,20,21,22,23,24,25,26,27,28,29,30].
Some studies have suggested a root mean square error (RMSE) of topographic data constructed using UAVs to be between 2 cm to 10 cm [49,50,51,52]. The precision of the detention pond constructed in this study was 1.20 cm for ground sampling distance (GSD) and 0.4 cm for RMSE, demonstrating a high-precision measurement performance. This is attributed to the fact that in previous studies, the UAV’s shooting altitude exceeded 100 m or the GCP count was less than 10. In contrast, this study employed a shooting altitude of 30 m and 17 GCPs, resulting in the creation of high-precision topographic data. Leveraging the utility of UAVs to evaluate the adequacy of disaster reduction facilities is expected to highlight potential issues related to design, construction, or maintenance of reduction capabilities.
Currently, detention ponds situated in urban areas are scheduled for maintenance and relocation during the heavy rain season in the Republic of Korea, from June to September. However, this maintenance primarily involves the removal of sediment or suspended solids deposited in the detention pond and does not encompass an evaluation of the performance of the reduction facilities.
Discharge calculations in the field of hydrology employ various analysis methods contingent upon the characteristics of each country. Research on discharge calculation using UAVs has primarily focused on river roughness coefficients, flow velocity measurements, monitoring, and discharge estimation [33,34,35,36,37,38,41,42,43,44,45,46,47]. Most studies have selected target basins centered around rivers, and the methodology for calculating discharge in urban areas has not been extensively investigated. This is partly because the target basin areas are generally large, making continuous operation with current battery performance challenging. Surveying using a UAV requires a lot of expense and time depending on the area, so it is difficult to use it for the entire watershed area. GCP surveying is conducted for accuracy, but it is expensive to secure all elevation differences in urban areas. Additionally, in urban areas, obtaining flight approval is complicated due to the elevated risk posed by high-rise buildings, social infrastructure, and population density.
Therefore, in this study, discharge in the target basin was calculated by applying the ‘Design Discharge Calculation Guidelines’ established by the Ministry of Land, Infrastructure and Transport in 2012 to analyze the impact before and after development [48]. The detention pond installed in the target basin secures 3401 m3 of additional storage volume at a design frequency of 50 years, as indicated by the results of topography analysis compared to the design drawing. Furthermore, even in the event of a flood exceeding the design frequency, an additional storage capacity of 6486 m3 is secured. This analysis reveals that the currently installed detention pond can accommodate more storage capacity during heavy rainfall and surpasses the design frequency. With the anticipated advancement of UAV battery performance and safety measures in the future, it is expected that calculating discharge by applying land-use conditions according to urban development will become feasible.

6. Conclusions

In this study, we assessed the adequacy of reduction facilities installed to maintain the increased discharge resulting from urban development at a level equivalent to the pre-development impact. The discharge calculations for urban development zones were based on the ‘Design Discharge Calculation Guidelines’ established by the Ministry of Land, Infrastructure and Transport of the Republic of Korea in 2012. We compared the impacts before and after development. As the discharge increased due to the development project, a topographic survey was conducted using a UAV to assess the disaster reduction detention pond’s performance. We evaluated this by comparing design drawings with topography analysis. The precision of the constructed detention pond was found to have an error of 1.20 cm in ground sampling distance (GSD) and 0.004 m in root mean square error (RMSE) for the ground control point (GCP), thereby achieving high-precision topographic data.
Based on the 50-year frequency, the discharge that increases due to urban development was analyzed to be 59.56 m3/s before development and 60.15 m3/s after development, representing an increase of 0.59 m3/s. Disaster reduction facilities aim to reduce the increased discharge following a development project. The reduction effect of the detention pond was analyzed to be 58.99 m3/s, confirming that the reduction effect suggested in the design drawing was achieved. The reduction effect, as analyzed by constructing topographic data of the detention pond using a UAV, was 58.57 m3/s, indicating that additional storage volume was secured compared to the design drawing. While some discrepancies were observed when comparing the design drawing of the detention pond with the specifications of the topography analysis, such as errors in floor height, top height, and wave height, the storage capacity of the discharge control remained consistent between the design drawing and topography analysis. Moreover, the total capacity of the ridge was found to be greater in the topography analysis than in the design drawing.
The installation of facilities is typically executed based on design drawings, but it can be challenging to achieve precision at the millimeter or centimeter scale at construction sites. To address these differences between design and construction, the utilization of advanced scientific technology is essential. This study proposed a method for evaluating adequacy by constructing topographic data using a UAV. In this study, high accuracy was achieved by setting the survey conditions using a UAV to a small area and low flight altitude. However, the decrease in accuracy as the research area and flight altitude increases is something that must always be considered. It is expected that this research method can be applied to analyze the causes of damage in urban development areas affected by heavy rainfall or assess the construction quality of reduction facilities.

Author Contributions

Conceptualization, Y.S. and J.J.; methodology, Y.S.; software, J.J.; validation, Y.S., J.J., and M.P.; formal analysis, M.P.; investigation, Y.S.; resources, J.J.; data curation, Y.S.; writing—original draft preparation, Y.S.; writing—review and editing, J.J.; visualization, Y.S.; supervision, M.P.; project administration, M.P.; funding acquisition, Y.S. All authors have read and agreed to the published version of the manuscript.

Funding

This research was supported by the program of Research Program to Solve Urgent Safety Issues (2021M3E9A1103525), through the National Research Foundation of Korea (NRF), funded by the Korean government (Ministry of Science and ICT (MSIT), Ministry of the Interior and Safety (MOIS)).

Data Availability Statement

Data are contained within the article.

Conflicts of Interest

The authors declare no conflict of interest.

References

  1. Yaghmaei, N. Human Cost of Disasters: An Overview of the Last 20 Years, 2000–2019; UN Office for Disaster Risk Reduction: Geneva, Switzerland, 2020. [Google Scholar]
  2. IPCC. Climate Change 2014: Impacts, Adaptation, and Vulnerability. Part A: Global and Sectoral Aspects; Contribution of Working Group II to the Fifth Assessment Report of the Intergovernmental Panel on Climate Change; IPCC: Geneva, Switzerland, 2014. [Google Scholar]
  3. Tamminga, A.D.; Eaton, B.C.; Hugenholtz, C.H. UAS-based remote sensing of fluvial change following an extreme flood event. Earth Surf. Process. Landf. 2015, 40, 1464–1476. [Google Scholar] [CrossRef]
  4. Hemmelder, S.; Marra, W.; Markies, H.; De Jong, S.M. Monitoring river morphology & bank erosion using UAV imagery—A case study of the river Buëch, Hautes-Alpes, France. Int. J. Appl. Earth Obs. Geoinf. 2018, 73, 428–437. [Google Scholar] [CrossRef]
  5. Cao, B.; Guan, W.; Li, K.; Pan, B.; Sun, X. High-Resolution Monitoring of Glacier Mass Balance and Dynamics with Unmanned Aerial Vehicles on the Ningchan No. 1 Glacier in the Qilian Mountains, China. Remote Sens. 2021, 13, 2735. [Google Scholar] [CrossRef]
  6. Chandler, B.M.P.; Lovell, H.; Boston, C.M.; Lukas, S.; Barr, I.D.; Benediktsson, Í.Ö.; Benn, D.I.; Clark, C.D.; Darvill, C.M.; Evans, D.J.A.; et al. Glacial geomorphological mapping: A review of approaches and frameworks for best practice. Earth-Sci. Rev. 2018, 185, 806–846. [Google Scholar] [CrossRef]
  7. Śledź, S.; Ewertowski, M.W.; Piekarczyk, J. Applications of unmanned aerial vehicle (UAV) surveys and Structure from Motion photogrammetry in glacial and periglacial geomorphology. Geomorphology 2021, 378, 107620. [Google Scholar] [CrossRef]
  8. Urban, R.; Štroner, M.; Blistan, P.; Kovanič, Ľ.; Patera, M.; Jacko, S.; Ďuriška, I.; Kelemen, M.; Szabo, S. The Suitability of UAS for Mass Movement Monitoring Caused by Torrential Rainfall—A Study on the Talus Cones in the Alpine Terrain in High Tatras, Slovakia. ISPRS Int. J. Geo-Inf. 2019, 8, 317. [Google Scholar] [CrossRef]
  9. Ansari, A. Use of point cloud with a low-cost UAV system for 3D mapping. In Proceedings of the 2012 International Conference on Emerging Trends in Electrical Engineering and Energy Management (ICETEEEM), Chennai, India, 13–15 December 2012; pp. 131–134. [Google Scholar]
  10. Xiong, L.-Y.; Tang, G.-A.; Li, F.-Y.; Yuan, B.-Y.; Lu, Z.-C. Modeling the evolution of loess-covered landforms in the Loess Plateau of China using a DEM of underground bedrock surface. Geomorphology 2014, 209, 18–26. [Google Scholar] [CrossRef]
  11. Li, Z.; Zhu, C.; Gold, C. Digital Terrain Modeling: Principles and Methodology; CRC Press: Boca Raton, FL, USA, 2004. [Google Scholar]
  12. Tang, G.a.; Ge, S.; Li, F.; Zhou, J. Review of digital elevation model (DEM) based research on China Loess Plateau. J. Mt. Sci. 2005, 2, 265–270. [Google Scholar] [CrossRef]
  13. Kraus, K.; Pfeifer, N. Determination of terrain models in wooded areas with airborne laser scanner data. ISPRS J. Photogramm. Remote Sens. 1998, 53, 193–203. [Google Scholar] [CrossRef]
  14. Vosselman, G. Slope based filtering of laser altimetry data. Int. Arch. Photogramm. Remote Sens. 2000, 33, 935–942. [Google Scholar]
  15. Sithole, G.; Vosselman, G. Experimental comparison of filter algorithms for bare-Earth extraction from airborne laser scanning point clouds. ISPRS J. Photogramm. Remote Sens. 2004, 59, 85–101. [Google Scholar] [CrossRef]
  16. Bandara, K.R.M.U.; Samarakoon, L.; Shrestha, R.P.; Kamiya, Y. Automated Generation of Digital Terrain Model using Point Clouds of Digital Surface Model in Forest Area. Remote Sens. 2011, 3, 845–858. [Google Scholar] [CrossRef]
  17. Krauß, T.; Arefi, H.; Reinartz, P. Evaluation of selected methods for extracting digital terrain models from satellite born digital surface models in urban areas. In Proceedings of the SMPR2011 Conference, Tehran, Iran, 18–19 May 2011. [Google Scholar]
  18. Polat, N.; Uysal, M. Investigating performance of Airborne LiDAR data filtering algorithms for DTM generation. Measurement 2015, 63, 61–68. [Google Scholar] [CrossRef]
  19. Varlik, A.; Selvi, H.; Kalayci, I.; Karauğuz, G.; Öğütcü, S. Investigation of the Compatibility of Fasillar and Eflatunpinar Hittite Monuments with Close-Range Photogrammetric Technique. Mediterr. Archaeol. Archaeom. 2016, 16, 249–256. [Google Scholar]
  20. Boufama, B.; Mohr, R.; Veillon, F. Euclidean constraints for uncalibrated reconstruction. In Proceedings of the 1993 (4th) International Conference on Computer Vision, Berlin, Germany, 11–14 May 1993; pp. 466–470. [Google Scholar]
  21. Harris, C.; Stephens, M. A combined corner and edge detector. In Proceedings of the 4th Alvey Vision Conference, Manchester, UK, 31 August–2 September 1988; pp. 147–152. [Google Scholar]
  22. Spetsakis, M.; Aloimonos, J.Y. A multi-frame approach to visual motion perception. Int. J. Comput. Vis. 1991, 6, 245–255. [Google Scholar] [CrossRef]
  23. Schwind, M.; Starek, M. Assessing 3D Point Cloud Fidelity of UAS-SfM Software Solutions over Varying Terrain. In Proceedings of the 18th Annual JALBTCX Airborne Coastal Mapping and Charting Technical Workshop, Savannah, GA, USA, 6–8 June 2017. [Google Scholar]
  24. Burns, J.H.R.; Delparte, D. Comparison of Commercial Structure-from-Motion Photogrammety Software Used for Underwater Three-Dimensional Modeling of Coral Reef Environments. Int. Arch. Photogramm. Remote Sens. Spat. Inf. Sci. 2017, XLII-2/W3, 127–131. [Google Scholar] [CrossRef]
  25. Zecevic, Z.; Popovic, T.; Krstajic, B. Cloud based solution for automatic image mosaicking and georeferencing. In Proceedings of the 22nd International Scientific-Professional Conference Information Technology, Zabljak, Montenegro, 27 February–4 March 2017. [Google Scholar]
  26. Niederheiser, R.; Mokroš, M.; Lange, J.; Petschko, H.; Prasicek, G.; Elberink, S.O. Deriving 3D Point Clouds from Terrestrial Photographs—Comparison of Different Sensors and Software. Int. Arch. Photogramm. Remote Sens. Spat. Inf. Sci. 2016, XLI-B5, 685–692. [Google Scholar]
  27. Haala, N.; Cavegn, S. High Density Aerial Image Matching: State-of-the-Art and Future Prospects. Int. Arch. Photogramm. Remote Sens. Spat. Inf. Sci. 2016, XLI-B4, 625–630. [Google Scholar] [CrossRef]
  28. Bhandari, B.; Oli, U.; Pudasaini, U.; Panta, N. Generation of high resolution DSM using UAV images. In Proceedings of the FIG Working Week 2015, Sofia, Bulgaria, 17–21 May 2015; pp. 17–21. [Google Scholar]
  29. Remondino, F.; Spera, M.G.; Nocerino, E.; Menna, F.; Nex, F. State of the art in high density image matching. Photogramm. Rec. 2014, 29, 144–166. [Google Scholar] [CrossRef]
  30. Haala, N. The landscape of dense image matching algorithms. In Proceedings of the Photogrammetric Week 2013, Stuttgart, Germany, 9–13 September 2013; pp. 271–284. [Google Scholar]
  31. Ramesh, R.; Kalin, L.; Hantush, M.; Chaudhary, A. A secondary assessment of sediment trapping effectiveness by vegetated buffers. Ecol. Eng. 2021, 159, 106094. [Google Scholar] [CrossRef]
  32. Liu, L. Drone-based photogrammetry for riverbed characteristics extraction and flood discharge modeling in Taiwan’s mountainous rivers. Measurement 2023, 220, 113386. [Google Scholar] [CrossRef]
  33. Detert, M.; Johnson, E.D.; Weitbrecht, V. Proof-of-concept for low-cost and non-contact synoptic airborne river flow measurements. Int. J. Remote Sens. 2017, 38, 2780–2807. [Google Scholar] [CrossRef]
  34. Woodget, A.S.; Carbonneau, P.E.; Visser, F.; Maddock, I.P. Quantifying submerged fluvial topography using hyperspatial resolution UAS imagery and structure from motion photogrammetry. Earth Surf. Process. Landf. 2015, 40, 47–64. [Google Scholar] [CrossRef]
  35. Tauro, F.; Petroselli, A.; Arcangeletti, E. Assessment of drone-based surface flow observations. Hydrol. Process. 2016, 30, 1114–1130. [Google Scholar] [CrossRef]
  36. Perks, M.T.; Russell, A.J.; Large, A.R.G. Technical Note: Advances in flash flood monitoring using unmanned aerial vehicles (UAVs). Hydrol. Earth Syst. Sci. 2016, 20, 4005–4015. [Google Scholar] [CrossRef]
  37. Koutalakis, P.; Tzoraki, O.; Zaimes, G. UAVs for Hydrologic Scopes: Application of a Low-Cost UAV to Estimate Surface Water Velocity by Using Three Different Image-Based Methods. Drones 2019, 3, 14. [Google Scholar] [CrossRef]
  38. Thumser, P.; Haas, C.; Tuhtan, J.A.; Fuentes-Pérez, J.F.; Toming, G. RAPTOR-UAV: Real-time particle tracking in rivers using an unmanned aerial vehicle. Earth Surf. Process. Landf. 2017, 42, 2439–2446. [Google Scholar] [CrossRef]
  39. Hassanzadeh, Y. Hydraulics of sediment transport. In Hydrodynamics: Theory and Model; IntechOpen: Rijeka, Croatia, 2012. [Google Scholar]
  40. Shields, A. Application of Similarity Principles and Turbulence Research to Bed-Load Movement; Soil Conservation Service: Washington, DC, USA, 1936.
  41. Yang, S.; Li, C.; Lou, H.; Wang, P.; Wang, J.; Ren, X. Performance of an Unmanned Aerial Vehicle (UAV) in Calculating the Flood Peak Discharge of Ephemeral Rivers Combined with the Incipient Motion of Moving Stones in Arid Ungauged Regions. Remote Sens. 2020, 12, 1610. [Google Scholar] [CrossRef]
  42. Yang, S.; Wang, P.; Lou, H.; Wang, J.; Zhao, C.; Gong, T. Estimating River Discharges in Ungauged Catchments Using the Slope–Area Method and Unmanned Aerial Vehicle. Water 2019, 11, 2361. [Google Scholar] [CrossRef]
  43. Birkinshaw, S.J.; Moore, P.; Kilsby, C.G.; O’Donnell, G.M.; Hardy, A.J.; Berry, P.A.M. Daily discharge estimation at ungauged river sites using remote sensing. Hydrol. Process. 2014, 28, 1043–1054. [Google Scholar] [CrossRef]
  44. Kerr, J.M.; Purkis, S. An algorithm for optically-deriving water depth from multispectral imagery in coral reef landscapes in the absence of ground-truth data. Remote Sens. Environ. 2018, 210, 307–324. [Google Scholar] [CrossRef]
  45. Liu, C.; Men, B.; Song, J. Ecological Hydraulic Radius Method for Estimating Ecological Water Demand in River. Prog. Nat. Sci. 2007, 17, 42–48. [Google Scholar]
  46. Yang, S.; Wang, J.; Wang, P.; Gong, T.; Liu, H. Low Altitude Unmanned Aerial Vehicles (UAVs) and Satellite Remote Sensing Are Used to Calculated River Discharge Attenuation Coefficients of Ungauged Catchments in Arid Desert. Water 2019, 11, 2633. [Google Scholar] [CrossRef]
  47. Lagogiannis, S.; Dimitriou, E. Discharge Estimation with the Use of Unmanned Aerial Vehicles (UAVs) and Hydraulic Methods in Shallow Rivers. Water 2021, 13, 2808. [Google Scholar] [CrossRef]
  48. Ministry of Land, Transport and Maritime Affairs. Guidelines for Calculating Design Floods, 1st ed.; Ministry of Land, Transport and Maritime Affairs: Sejong-si, Republic of Korea, 2012; pp. 1–73. [Google Scholar]
  49. Benassi, F.; Dall’Asta, E.; Diotri, F.; Forlani, G.; Morra di Cella, U.; Roncella, R.; Santise, M. Testing Accuracy and Repeatability of UAV Blocks Oriented with GNSS-Supported Aerial Triangulation. Remote Sens. 2017, 9, 172. [Google Scholar] [CrossRef]
  50. Varbla, S.; Puust, R.; Ellmann, A. Accuracy assessment of RTK-GNSS equipped UAV conducted as-built surveys for construction site modelling. Surv. Rev. 2021, 53, 477–492. [Google Scholar] [CrossRef]
  51. Casella, V.; Chiabrando, F.; Franzini, M.; Manzino, A.M. Accuracy Assessment of a UAV Block by Different Software Packages, Processing Schemes and Validation Strategies. ISPRS Int. J. Geo-Inf. 2020, 9, 164. [Google Scholar] [CrossRef]
  52. Fischer, R.L.; Ruby, J.G.; Armstrong, A.J.; Edwards, J.D.; Spore, N.J.; Brodie, K.L. Geospatial Accuracy of Small Unmanned Airborne System Data in the Coastal Environment; Geospatial Research Laboratory: Alexandria, VA, USA; Coastal and Hydraulics Laboratory: Kitty Hawk, NC, USA, 2019. [Google Scholar]
Figure 1. Analysis procedure using unmanned aerial vehicle.
Remotesensing 15 05518 g001
Figure 2. Estimation procedure of discharge.
Remotesensing 15 05518 g002
Figure 3. Target area.
Remotesensing 15 05518 g003
Figure 4. Unmanned aerial vehicle and surveying equipment. (a) Phantom 4 RTK; (b) Trimble R4s.
Remotesensing 15 05518 g004
Figure 5. Aerial photography and topographic analysis of detention pond. (a) Phantom 4 RTK in UAV; (b) Pix4D Mapper.
Remotesensing 15 05518 g005
Figure 6. GCP survey points in detention pond. (a) Outside of detention pond; (b) Inside of detention pond.
Remotesensing 15 05518 g006
Figure 7. Design drawing and orthophoto of detention pond. (a) Blueprint; (b) Orthomosaic; (c) DSM.
Remotesensing 15 05518 g007
Figure 8. Depth–storage capacity graph of detention pond.
Remotesensing 15 05518 g008
Figure 9. Status of land use in the target basin before and after development.
Remotesensing 15 05518 g009
Figure 10. Comparison and analysis of discharge before and after development of the target basin.
Remotesensing 15 05518 g010
Figure 11. Analysis of reduction effect on detention pond in target basin. (a) Design drawing; (b) Topography analysis.
Remotesensing 15 05518 g011
Figure 12. Analysis of storage volume and depth for detention pond in target basin. (a) Storage volume; (b) Depth.
Remotesensing 15 05518 g012
Table 1. Analysis method for estimating discharge.
ClassMethodEquation
Rainfall analysisRainfall dataConversion factor of fixed duration—unfixed durationEquation (1)
Probability distributionsGumbel distributionEquation (2)
Rainfall intensity formulaHead count polynomialsEquation (3)
Areal rainfall quantilesEstimation of Thiessen method after areal reduction factorEquation (4)
Time distributionHuff’s method of third quartile
Basin characteristicsAreaDigital map
River lengthDigital map (length from exit of basin to starting point of basin)
River slopeDigital map (average basin)
Shape factorDigital map
Effective dischargeCurve numberAMC-Ⅲ (using land cover map and detailed soil map)
Flood dischargeUnit hydrographClark unit hydrograph method
Time of concentrationContinuous Kraven formulaEquations (5)–(7)
Storage coefficientSabol formulaEquation (8)
Flood hydrographFlood hydrographEffective rainfall and base flow
Flood routingMuskingum methodEquation (9)
Table 2. Current status of target area.
Target Area
Before DevelopmentAfter Development (Innovation City Area)Detention Pond Area
1.37 km21.37(0.17) km26685 m2
Table 3. Specification of observation equipment.
Characteristics of UAV and CameraPerformance of Trimble R4s
Weight1391 gChannel240 channels
Diagonal Length350 mmStatic positioningHorizontal: 3 mm + 0.1 ppm
Verticality: 3.5 mm + 0.4 ppm
Sensors1” CMOS, valid pixel: 20 MVRSHorizontal: 8 mm + 1 ppm
Verticality: 15 mm + 1 ppm
LensFOV 84°, 8.8 mm/24 mm, f/2.8~f/11Input/outputATOM, CMR, CMR+, RTCM, CMRx, NMEA
Table 4. Flight planning establishment and condition of GNSS observation station.
Flight Planning EstablishmentCondition of GNSS Observation Station
ClassificationContentsClassificationContents
Photographing area0.03 km2Observation stationUlsan Jung gu
Photographing altitude30 mReceiver typeTrimble alloy
Overlap rateLongitudinal: 80%,
transverse: 80%
Antenna typeTRM59800.00
Camera angle90°RTCM typeSAMC-RTCM31
Number of photographs660CoordinationLatitude: 35-33-56.5, longitude: 129-19-1.38, ellipsoid Height: 100.63
Image coordinateWGS84Address365, Jongga-ro, Jung-gu, Ulsan, Korea
Table 5. Accuracy of the X, Y, and Z observation data for GCP.
ConditionError X (m)Error Y (m)Error Z (m)
Mean (m)0.000071−0.0001050.000255
Sigma (m)0.0035460.0038000.005353
RMS error (m)0.0035470.0038010.005359
Table 6. Evaluation of the quality characteristics of topographical data.
ClassificationContents
Average ground sampling distance (GSD)1 × GSD (1.20 [cm/pixel])
Area covered0.032 km2
ImagesMedian of 43,726 key points per image
Dataset660 out of 660 images calibrated (100%), all images enabled
Camera optimization1.25% relative difference between initial and optimized internal camera parameters
MatchingMedian of 7570.94 matches per calibrated image
RMSE0.004 m
Table 7. Specifications of detention pond.
ClassificationSpecifications of Detention Pond
Design DrawingTopography Analysis
Floor height (EL.m)18.0317.91
Discharge controlDepth (m)3.472.94
Top height (EL.m)21.520.85
Volume (m3)15,79515,795
Freeboard (m)1.652.12
Wave partWave height (EL.m)23.1522.97
Total depth (m)5.125.06
Total volume (m3)25,91632,402
Total area (m2)66858795
Main spillwayB (m) × H (m) × count3.5 × 3.5@23.5 × 3.5@2
Entrance elevation (El.m)18.0317.91
Table 8. Parameters for discharge calculation before and after development.
ParameterBefore DevelopmentAfter Development
Area (km2)1.371.37
Curve number83.1583.93
River length (km)2.52.59
Average slope (%)0.0720.07
ClarkTime of concentration (h)0.870.87
Storage constant (h)0.720.74
Design frequency (yr)5050
Critical duration (min)155155
Design rainfall (mm)128128
Disclaimer/Publisher’s Note: The statements, opinions and data contained in all publications are solely those of the individual author(s) and contributor(s) and not of MDPI and/or the editor(s). MDPI and/or the editor(s) disclaim responsibility for any injury to people or property resulting from any ideas, methods, instructions or products referred to in the content.

