Article

Quantification of Vegetation Phenological Disturbance Characteristics in Open-Pit Coal Mines of Arid and Semi-Arid Regions Using Harmonized Landsat 8 and Sentinel-2

1
Key Laboratory of Mine Ecological Effects and Systematic Restoration, Ministry of Natural Resources, Beijing 100081, China
2
College of Geoscience and Surveying Engineering, China University of Mining and Technology (Beijing), Beijing 100083, China
*
Author to whom correspondence should be addressed.
Remote Sens. 2023, 15(21), 5257; https://doi.org/10.3390/rs15215257
Submission received: 25 August 2023 / Revised: 16 October 2023 / Accepted: 31 October 2023 / Published: 6 November 2023
(This article belongs to the Topic Green Mining)

Abstract

:
Open-pit mining activities inevitably affect the surrounding ecological environment. Therefore, it is crucial to clarify the disturbance characteristics of open-pit mining activities on the surrounding vegetation and scientifically implement ecological restoration projects. This study investigates the impact of open-pit coal mining in arid and semi-arid regions on surrounding vegetation from a vegetation phenology perspective. Initially, we construct a high-frequency time series of vegetation indices by Harmonized Landsat 8 and Sentinel-2 surface reflectance dataset (HLS). These time series are then fitted using the Double Logistic and Asymmetric Gaussian methods. Subsequently, we quantify three pivotal phenological phases: Start of Season (SOS), End of Season (EOS), and Length of Season (LOS) from the fitted time series. Finally, utilizing mine boundaries as spatial units, we create a buffer zone of 100 m increments to statistically analyze changes in phenological phases. The results reveal an exponential variation in vegetation phenological metrics with increasing distance from the mining areas of Heidaigou-Haerwusu (HDG-HEWS), Mengxiang (MX), and Xingda (XD) in northwest China. Then, we propose a method to identify the disturbance range. HDG-HEWS, MX, and XD mining areas exhibit disturbance ranges of 1485.39 m, 1571.47 m, and 671.92 m for SOS, and 816.72 m, 824.73 m, and 468.92 m for EOS, respectively. Mineral dust is one of the primary factors for the difference in the disturbance range. The HDG-HEWS mining area exhibits the most significant disruption to vegetation phenological metrics, resulting in a delay of 6.4 ± 3.4 days in SOS, an advancement of 4.3 ± 3.9 days in the EOS, and a shortening of 6.7 ± 3.5 days in the LOS. Furthermore, the overlapping disturbance zones of the two mining areas exacerbate the impact on phenological metrics, with disturbance intensities for SOS, EOS, and LOS being 1.38, 1.20, and 1.33 times those caused by a single mining area. These research results are expected to provide a reference for the formulation of dust suppression measures and ecological restoration plans for open-pit mining areas.

1. Introduction

Coal plays a crucial role in the economic and social development of nations [1]. In 2021, global coal consumption increased by 6.3% compared to the previous year, accounting for 26.9% of the primary energy consumption structure [2]. Driven by energy demands, China’s coal production has maintained an upward trend in recent years. Although the intensive coal mining has met the needs of economic growth, it has also triggered a series of ecological and environmental issues, including land desertification, vegetation degradation, and environmental pollution [3,4]. Particularly in the arid and semi-arid regions of northwestern China, mining activities have caused detrimental effects on the local vegetation that relies on groundwater for survival due to groundwater depletion and the disruption of hydrogeological structures caused by mining [5], and the inherent vulnerability of the geological environment makes the local ecosystem more sensitive to external disturbances [6]. Therefore, it is essential to clarify the impact of mining activities on the surrounding environment to carry out targeted ecological restoration and optimize landscape patterns. Remote sensing technology offers a practical solution for monitoring vegetation disturbance in mining areas. Yang et al. constructed multi-temporal mining disturbance templates using a long-term Landsat NDVI time series from 1984 to 2015 and identified disturbed pixels through the coefficient of variation and maximum value methods [7]. Yang et al. utilized the LandTrendr algorithm to monitor vegetation changes and historical dynamic characteristics around mining areas [8]. Although these analyses establish continuous vegetation monitoring information, the limited monitoring frequency hampers the representation of intra-annual vegetation dynamic disturbance effects under continuous mining influences. Some scholars have employed indicators such as fraction vegetation cover [9], remote sensing ecological index [10], and landscape ecological health index [11] to quantify the impact of mining activities on the ecological environment. However, these indicators can only depict the external characteristics of surface vegetation at a certain moment and do not reflect growth conditions of vegetation. Recent research suggests that vegetation phenology can serve as a quantifiable indicator of disturbances caused by mining activities in the surrounding environment [12,13], as vegetation phenological metrics can characterize the phased changes in vegetation growth stages. Notably, mining activities not only physically damage vegetation during excavation and transportation but can also cause vertical groundwater leakage, which may lead to vegetation degradation within and around the mining area, subsequently affecting vegetation phenology [14,15]. Hence, this study quantifies the range and intensity of mining disturbance through the response of vegetation phenology around the mining area.
Lieth defined phenology as the study of recurring life cycle stages of plants and animals [16]. Vegetation phenology refers to specific life cycle events of individual plants and serves as a sensitive indicator of terrestrial ecosystem responses to climate fluctuations and human activities [17,18]. Investigating vegetation phenology requires frequent monitoring of the vegetation growth status to accurately capture key stages of vegetation growth. The spatiotemporal development of land surface vegetation from a satellite sensor perspective is referred to as Land Surface Phenology (LSP) [19]. LSP metrics utilize spectral information from remote sensing imagery to explain intra- and inter-annual variations in vegetation, including the onset, end, peak, and duration of the growing season. The datasets produced by Advanced Very High Resolution Radiometer (AVHRR) and Moderate-resolution Imaging Spectroradiometer (MODIS) are suitable for large-scale and single landscape LSP monitoring, but their coarse spatial resolution limits the study of heterogeneous landscape LSP [20,21]. Landsat 8 imagery with 30 m spatial resolution can satisfy small-scale vegetation change monitoring, yet its 16-day temporal resolution constrains the detection of rapidly changing vegetation phenological events. Since 2017, the Sentinel satellite constellation has provided optical imagery with a revisit cycle of 5 days and spatial resolutions ranging from 10 to 60 m, improving the quality of LSP observations. Nonetheless, frequent cloud cover remains a challenge for optical imagery-based vegetation phenology detection [22]. In recent years, NASA’s Harmonized Landsat 8 and Sentinel-2 (HLS) project has supplied near-daily surface reflectance products globally [23], showing significant potential for LSP monitoring. Notably, Minkyu Moon et al. performed a comparative assessment of vegetation index time series derived from HLS dataset, daily 3 m spatial resolution commercial PlanetScope imagery, and PhenoCam imagery, which demonstrated a remarkable consistency [24]. Thus, in this study, the HLS dataset was employed to construct a 2022 vegetation index time series for the mining areas.
Mining activities cause spatiotemporal differences in the surrounding vegetation condition and accumulate effects over time, consequently exacerbating the impact on natural ecosystems and biodiversity [25]. Some scholars utilize NDVI or remote sensing ecological indices to quantify the long-term cumulative ecological effects of specific mining areas, finding that the cumulative ecosystem service value decreases to varying intensities around the mining area as mining activities continue [26,27]. At present, research on the cumulative disturbance effects between mining areas is relatively scarce. Our study involves a quantitative analysis of the phenological response intensity of neighboring mining areas, which will facilitate a more targeted delineation of ecological management zones.
The dynamic and externality of mining activities result in continuous disturbances with vegetation growth within a certain range. Particularly in ecologically vulnerable arid and semi-arid regions of Northwestern China, it is imperative to elucidate the environmental quality and spatial patterns around mining areas to provide theoretical guidance for ecological restoration schemes. Therefore, this study focuses on how to quantify the disturbance characteristics of surface coal mining through vegetation phenology. The primary objectives encompass three aspects: (1) to reveal the distance and intensity of the disturbance to the surrounding vegetation phenology by mining activities; (2) to explore the cumulative effect of disturbances between mining areas; and (3) to analyze the quantitative effects of mining dust on vegetation phenology.

2. Study Area and Materials

2.1. Study Area

We selected four clustered mining areas in the eastern part of Zhungeer City, Inner Mongolia Autonomous Region, China, as the study area (Figure 1a,b), with geographical coordinates ranging from 111°12′ to 111°24′E and 39°41′ to 39°49′N. Located in the northern portion of the Ordos Loess Plateau, this region features a characteristic eroded hilly topography and is part of the Yellow River basin, constituting a primary tributary of the Yellow River [28]. The study area is situated within the semi-arid continental monsoon climate zone falling within the middle temperate zone. It undergoes dry and blustery springs, short yet intense hot summers, gentle and enjoyable autumns, and cold and generally snowless winters. Based on their spatial characteristics, the four mining areas are categorized into three study units: Heidaigou-Haerwusu, Mengxiang, and Xingda open-pit mining areas (Figure 1c). The study area is endowed with abundant mineral resources, as indicated by the annual production capacities of 6.9, 1.8, and 1.2 million tons, respectively, based on the national energy statistics by the end of 2019.
The process of open-pit mining involves the extensive removal of rock and soil layers, leading to the disruption of the natural landscape pattern (Figure 1d,e) and posing a significant threat to the ecological environment in the vicinity of the mining area [29]. The vegetation in this region is predominantly composed of natural grasslands, and the climatic conditions and geological features are generally uniform across the mining areas. Therefore, the study area is suitable for investigating the quantitative impact of open-pit mining activities on the phenology of surrounding vegetation.

2.2. Data Acquisition and Preprocessing

The temporal variation in the Normalized Vegetation Index (NDVI) is closely related to the vegetation growth condition, and thus, it is widely used for phenological characterization [30,31]. The NDVI is calculated by spectrally computing data from the red band, sensitive to chlorophyll content, and the near-infrared band, responsive to variations in the internal leaf structure. The high-frequency NDVI time series in this study was computed using the HLS v1.5 dataset, sourced from the Landsat 8 Operational Land Imager (OLI) and Sentinel 2 Multi Spectral Instrument (MSI) sensors. NASA performed a series of processing steps on this dataset including atmospheric correction, spatial registration, BRDF correction, bandpass adjustment, and resampling, resulting in uniform projection onto the Military Grid Reference System [32]. Initially, we utilized a Python web crawler to acquire the HLS dataset for MGWR tiles 49TDE, 49TEE, 49SDD, and 49SED [33]. Subsequently, these tiles underwent preprocessing involving mosaicking and cropping. Furthermore, the quality information band FMASK, generated using the Fmask 4.2 algorithm, is employed to delete pixels affected by cloud cover, snow, and cloud shadows. Ultimately, this process yielded a total of 189 NDVI images covering the study area, including 46 Landsat 8 NDVI images and 143 Sentinel-2 NDVI images (Figure 2). For duplicate dates, Landsat 8 and Sentinel-2 images were mosaic using the maximum value to obtain the corresponding daily image.
This study focuses on the extent of ecological disruption caused by mining disturbances in the surrounding environment. The phenological changes of farmland vegetation are more sensitive to seasonal drought than grassland and forest land [34]. However, the agricultural growth processes are influenced by human activities, while there are significant differences in the forest and grassland phenological phases [35]. Therefore, we used the global 10 m land use type data (https://livingatlas.arcgis.com/ (accessed on 10 March 2023)) to mask agricultural and forested areas. Through visual interpretation and validation on Google Earth, we rectified classification errors and formed a high-quality thematic map of grassland patches in the study area. In addition, the high-quality 1 km monthly PM2.5 and PM10 dataset for China (https://data.tpdc.ac.cn/ (accessed on 25 April 2023)) and the 1 km monthly precipitation dataset for China (https://data.tpdc.ac.cn/ (accessed on 25 April 2023)) were used to investigate the driving mechanisms of vegetation phenology in areas disturbed by dust and precipitation. To address data scale discrepancies between the mineral dust and phenological metrics, the data resolution of PM2.5 and PM10 were downscaled to 30 m using the bilinear interpolation method.

3. Methodology

The overall process of this study is shown in Figure 3, which is divided into three parts: constructing an NDVI spatiotemporal cube, developing a disturbance identification model for mining areas, and analyzing the cumulative effects of open-pit mining and the impact of mineral dust on vegetation phenological metrics. (1) The grassland NDVI spatiotemporal cube was initially constructed from the HLS dataset, subsequently polluted pixels were removed using the “Fmask” quality band, and pixels of grassland were extracted using the land use type. (2) The pixel-wise NDVI time series were fitted through the utilization of the Double Logistic and Asymmetric Gaussian algorithm, followed by the extraction of vegetation phenology metrics using the dynamic threshold method, then we developed a disturbance identification model for open-pit mining by counting the changes in phenological metrics in the gradual buffer zone. (3) Identify the disturbance ranges of all mining areas and create a rectangular array of mining areas for two mining areas with overlapping disturbance ranges to quantitatively analyze the change characteristics of phenological metrics. A correlation analysis was performed between the pixels within the superimposed disturbance range and the mine dust data (PM2.5, PM10).

3.1. Data Smoothing

A time series curve of the vegetation index calculated from remote sensing image bands is not always a regular curve, and the mining activities in the study area continuously affect the surrounding vegetation, resulting in a fluctuation in the vegetation index value within a certain range. The time series fitting methods enable a more objective approximation of the dynamic growth trajectory of vegetation, effectively reducing the impact of data noise [36]. Double Logistic (DL) and Asymmetric Gaussian (AG) are widely used in the reconstruction of vegetation index time series for several scenarios [37]. In this study, these two filtering algorithms with superior performance are utilized to reconstruct the NDVI time series of the study area’s 2022 HLS dataset. Furthermore, both methods are employed to perform the consistency tests of subsequent phenological metrics calculation and disturbance range identification.

3.1.1. Double Logistic

Beck et al. developed the DL algorithm based on approximating the Sigmoid function to the cumulative distribution function and the accumulation characteristics of vegetation green coverage over time [38]. Specifically, a positive sigmoid logistic function is employed to fit the phases of vegetation growth and greening, while a negative sigmoid logistic function is used to fit the phases of vegetation senescence and leaf fall. The general expression of the DL is
f d l t = v 1 + v 2 × 1 1 + exp m 1 t m 2 1 1 + exp m 3 t m 4
where f d l t represents the smoothed NDVI value at time t . The linear parameters v 1 and v 2 correspond to the background value and amplitude of NDVI over the entire year. The nonlinear parameters m 1 and m 2 represent the phase and slope of the vegetation greening period, respectively, while m 3 and m 4 represent the phase and slope of the vegetation senescence period, respectively.

3.1.2. Asymmetric Gaussian

The AG function is divided according to the maximum (minimum) value of the fitted time series, the local functions are, respectively, fitted by exponential functions, then the NDVI time series is reconstructed by smooth connection [39]. The general expression for AG function is
f a g t = v 1 + v 2 × exp t m 1 m 2 m 3 ,   t > m 1 v 3 + v 4 × exp m 1 t m 4 m 5 ,   t < m 1
where f a g t represents the smoothed NDVI value at time t . The intervals ( v 1 , v 2 ) and ( v 3 , v 4 ) are the minimum and the magnitude of change for f a g t within their respective segments. m 1 signifies the independent time corresponding to the maximum or minimum in the time series, while m 2 and m 4 ,   respectively , denote the width and flatness of the right and left parts of the function. The linear parameters are denoted as v 1 , v 2 , v 3 , v 4 and the nonlinear parameters as m 1 , m 2 , m 3 , m 4 , m 5 .
To ensure consistency between the fitted function and actual observed NDVI, it is necessary to constrain the nonlinear parameters of the aforementioned model within a defined range. The linear parameters in the model are determined via the least squares method, while the nonlinear parameters are computed using the Levenberg–Marquardt method. The DL and AG fitting methods are implemented in Python language.

3.2. Extraction of Vegetation Phenological Metrics

Vegetation phenological metrics extraction methods include the maximum derivative method, threshold extraction, and change detection, among others. The study area is situated in a typical arid and semi-arid region with sparse vegetation, and the extent of the mining activity’s impact on surrounding vegetation NDVI remains uncertain. Thus, the simple and effective dynamic threshold extraction method was chosen to calculate the phenological metrics of each pixel. We mainly focus on three phenological metrics, namely start of the growing season (SOS), end of the growing season (EOS), and length of growing season (LOS).
The SOS, EOS, and LOS were calculated using the following formula:
S O S = f 1 t h r e s h o l d × max f t min f l e f t t + min f l e f t t
E O S = f 1 t h r e s h o l d × max f t min f r i g h t t + min f r i g h t t
L O S = E O S S O S
where the critical threshold is set to 0.2 based on previous research [40,41], f 1 is the corresponding time when the NDVI value is ∗, f t signifies the NDVI value at time t as determined by the DL or AG, f l e f t t denotes the fitting sequence of the left part, and f r i g h t t indicates the fitting sequence of the right part.

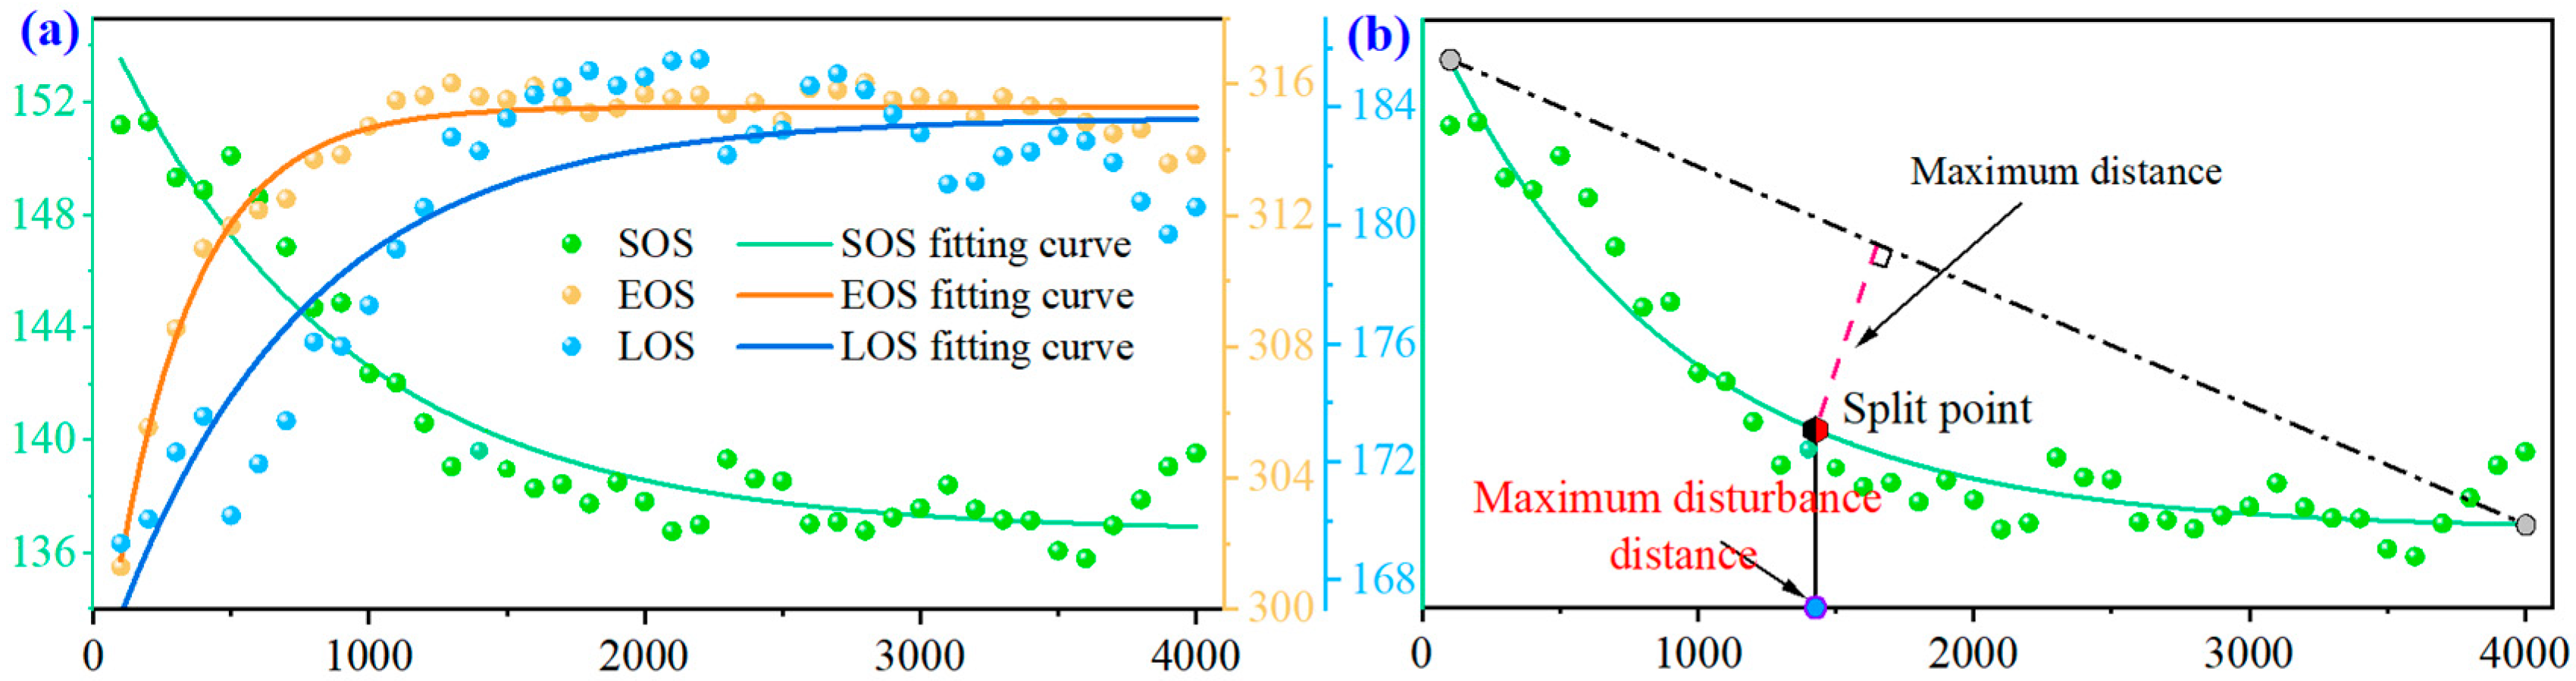
3.3. Identification Method of Disturbance Range in a Single Mining Area

According to the first law of geography, as objects get closer, their correlation increases. Hence, we first quantified the disturbance characteristics of the surrounding vegetation by open-pit mining through a buffer zone analysis, then explored the disturbance rules of distance and vegetation phenology metrics, and finally determined the disturbance distance. Specifically, 40 buffer rings with a step length of 100 m were created within 4 km of the mining area boundary in 2022, and the average vegetation phenology in each buffer ring was counted. We found that the mean value of SOS for three mining areas exhibit exponential decrease with increasing distance from the mining zones, while EOS and LOS exhibit exponential growth trends (Figure 4a), consistent with the findings by SUN et al. [12]. The general equation for the vegetation phenology fitting function is as follows:
f x = a × exp b × x + c
where x represents the distance from the mining area. a signifies the maximum divergence within the buffer ring mean sequence (SOS: a > 0 ; EOS and LOS: a < 0 ), and b denotes the rate of variation within the phenological mean sequence. c denotes the horizontal asymptotic of the exponential function value.
Furthermore, various human activities within the 4 km buffer zone also exert a certain degree of influence on vegetation phenology, which leads to oscillatory characteristics in the mean sequence of the buffer ring. Leveraging the principles akin to the Douglas–Peuker algorithm, we first construct a line segment that connects the endpoints of the fitted exponential function. Subsequently, we identify the point along this fitted curve that corresponds to the maximum distance to the aforementioned line segment. This point denotes which is the disturbance segmentation point, and its corresponding abscissa represents the maximum disturbance range of a single mining area (Figure 4b). This method overcomes the drawback of not being able to determine the maximum disturbance point caused by the absence of inflection points in exponential functions. Different vegetation index time series models result in differences in fitting sequences. In order to balance the model differences, the ultimate disturbance range for phenological metrics is determined by calculating the average of the disturbance points using both the DL and AG methods.

4. Results

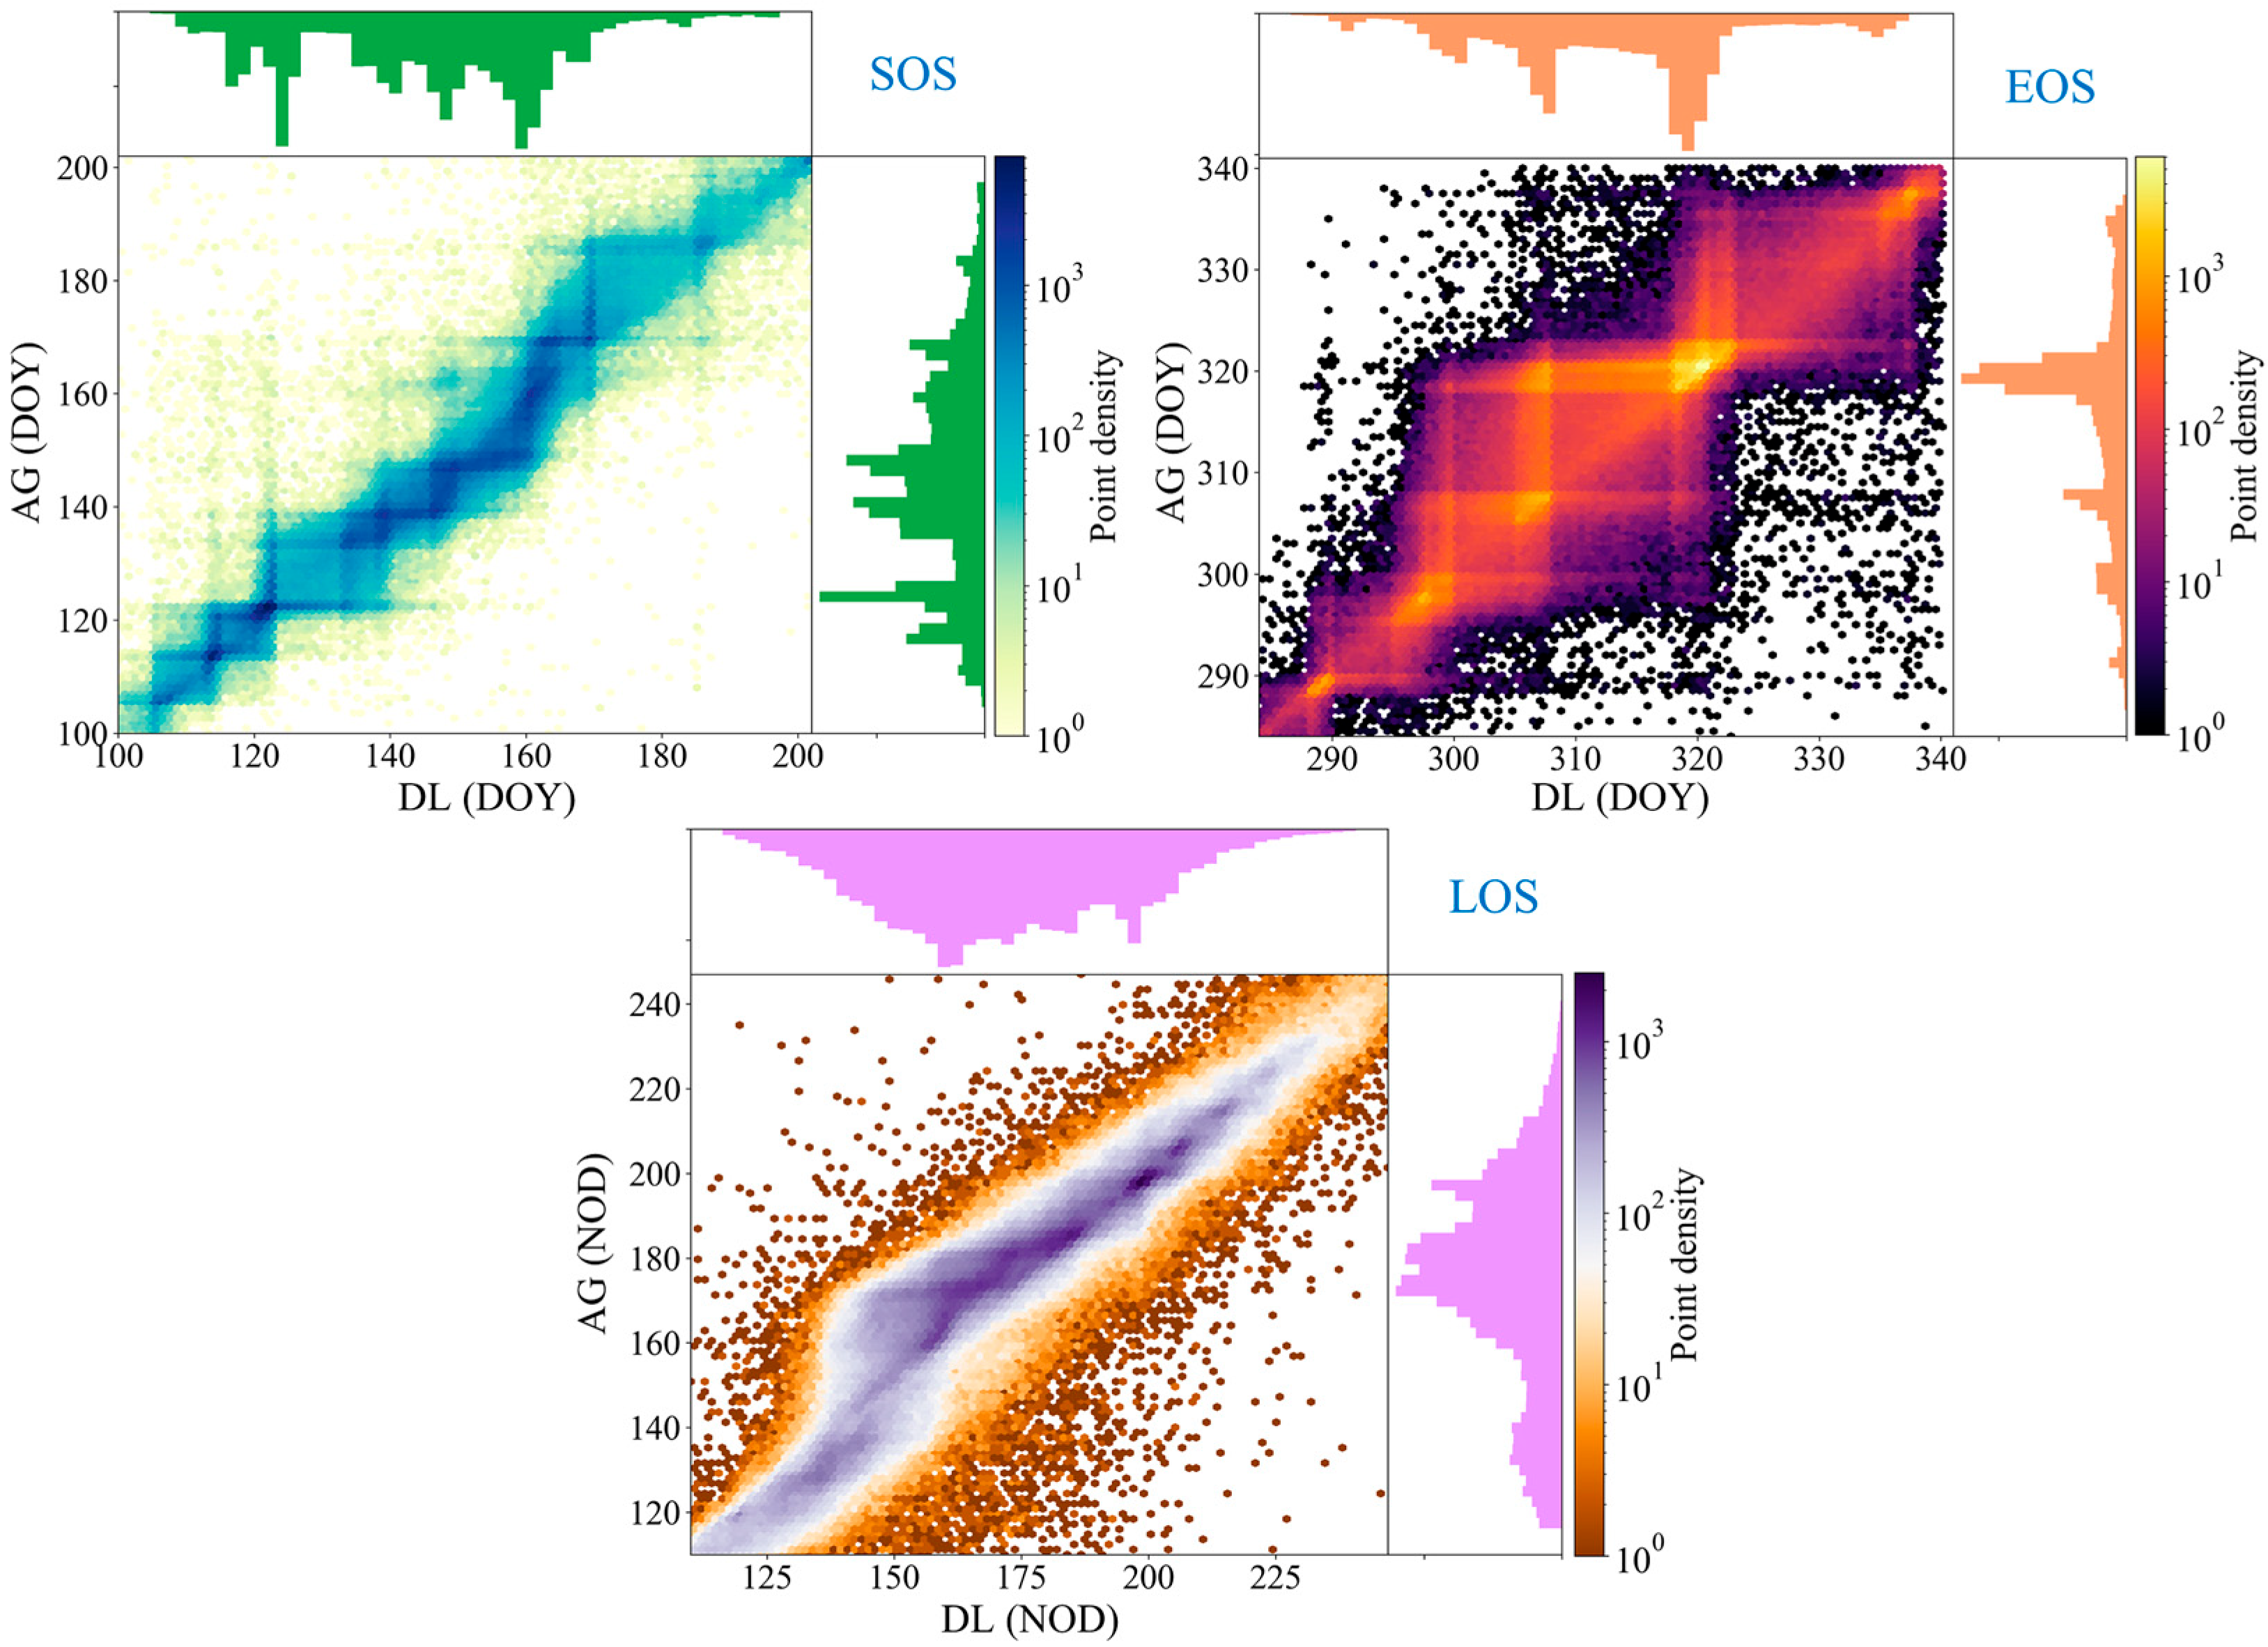
4.1. Cross Validation of Phenological Metrics Extraction Results

Figure 5 illustrates the high similarity in the extracted vegetation phenological parameters of the study area using both DL and AG, and the similarity of SOS is significantly higher than that of EOS and LOS. To be specific, the R2 for SOS, EOS, and LOS are 0.92, 0.75, and 0.86, respectively, with corresponding RMSE values of 5.81, 5.53, and 9.68, respectively. This further emphasizes the consistency of the results obtained via the DL and AG algorithms’ extraction. The DL and AG algorithms exhibit inherent differences in constructing NDVI time series leading to variations in the phenological metric results, but our study focused more on the consistency of the phenology metric variations. The phenological metric histograms generated by both methods demonstrate highly similar trends, making them suitable for studying vegetation phenological disturbance characteristics in the vicinity of mining areas.

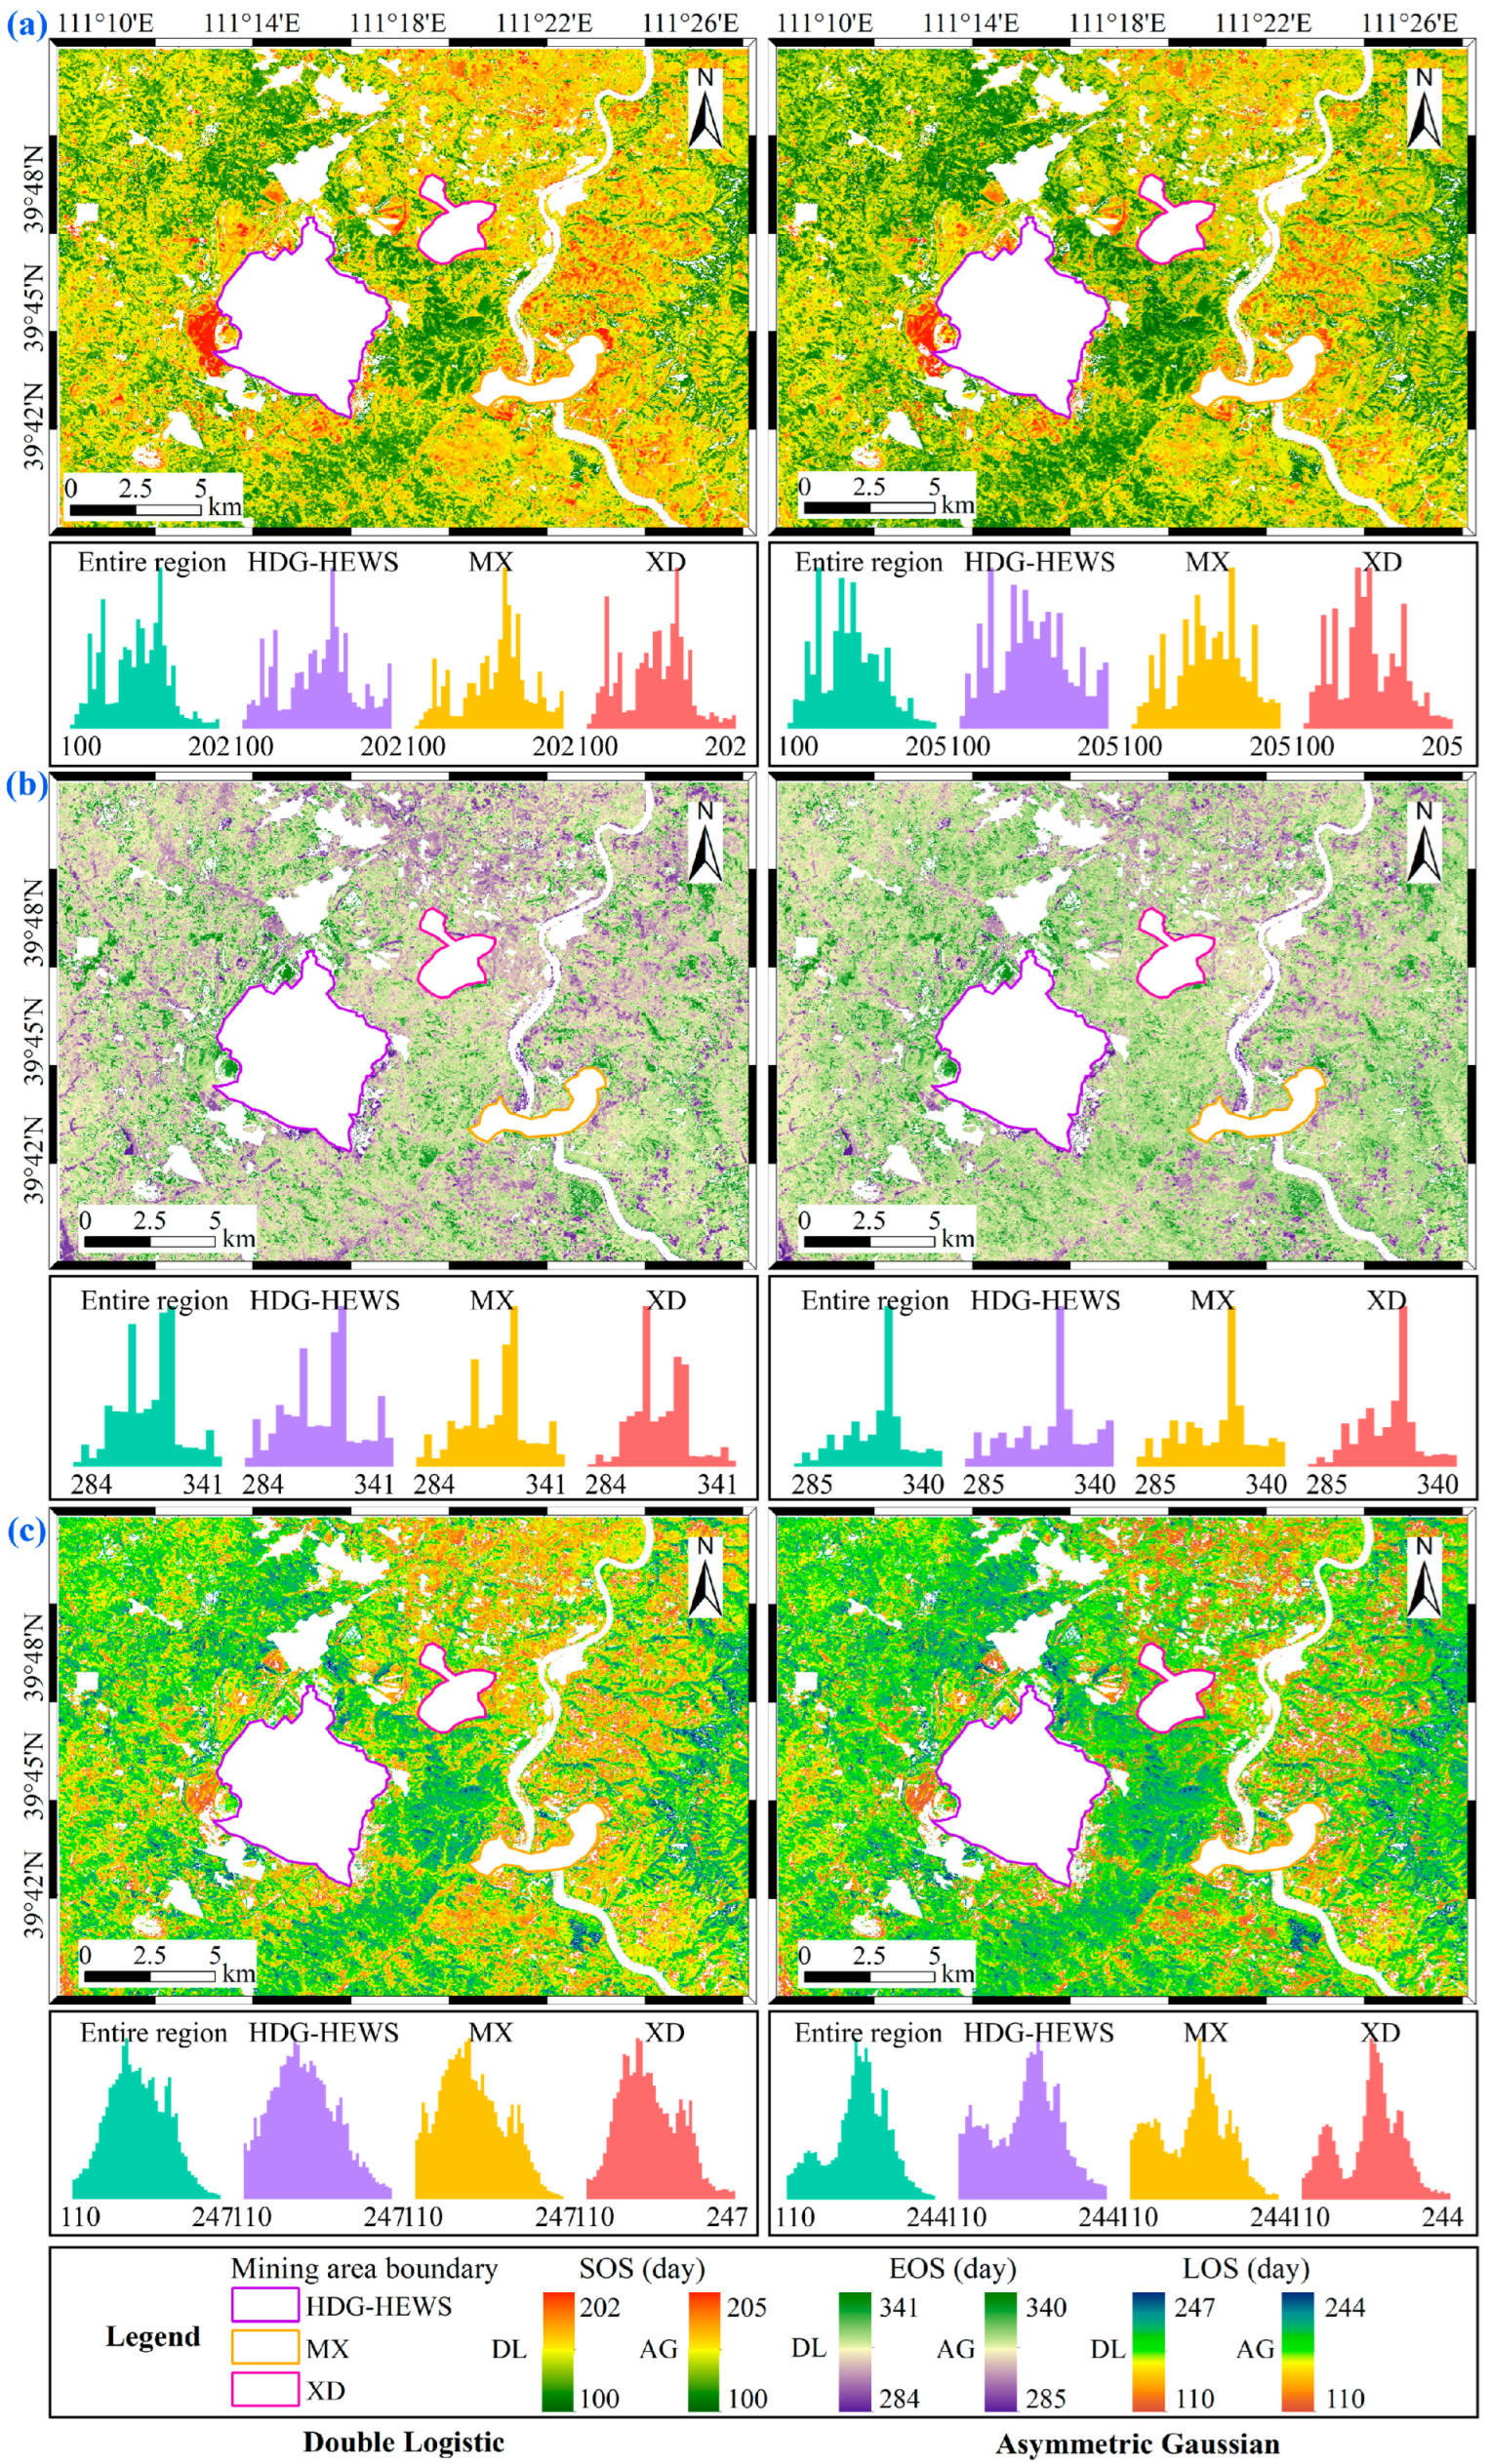
4.2. Phenological Metrics Mapping

The spatial distribution of the three phenological metrics in the study area differs to varying intensities (Figure 6). Phenological metrics were characterized by a gradual lagging of the SOS, advancing of the EOS, and shortening of the LOS from west to east. The spatial mapping of phenological metrics using both the DL and AG fitting methods exhibits a high degree of consistency. The phenological metrics within a certain range of the three open-pit mining areas display similar spatial patterns. Subsequently, the means of the phenological metrics were computed for the entire region and within a 1000 m distance from the mining boundaries (Table 1). The results from both DL and AG fitting methods consistently revealed a delayed SOS and shortened LOS, while EOS showed no significant variation. The mean values of SOS within a 1000 m radius from the mining boundaries for the HDG-HEWS, MX, and XD mining areas lagged behind the entire region by 7.1, 10.5, and 1.0 days, respectively.

4.3. Disturbance Distance and Intensity of Vegetation Phenology from Open-Pit Mining Activities

The mean sequences of phenological metrics in the 100 m buffer ring were fitted by exponential functions (Figure 7), which showed highly similar variation characteristics on both the DL and AG methods. Open-pit mining activities disrupt the surrounding vegetation growth to varying degrees. According to the proposed disturbance identification method, the disturbance range was extracted (Table 2). Disturbance ranges of the SOS and LOS in the three open-pit mining areas were greater than the EOS, and the disturbance range showed MX > HDG-HEWS > XD. The maximum disturbance distance of the LOS to the surrounding vegetation in the MX mining area was 1625.53 m, which shortened the vegetation phenological growth cycle by 3.1 ± 2.2 days. Although the disturbance distance was not the farthest, the degree of disturbance to the surrounding vegetation by HDG-HEWS was significantly higher than that of the other mining areas. Overall, the mean SOS of the HDG-HEWS mining area lagged by 2.8 and 4.4 days, respectively, the mean EOS was advanced by 2.5 and 3.1 days, and the average LOS was shortened by 3.6 and 4.2 days compared to the MX and XD mining areas.
Furthermore, we observed a significant exponential relationship in the calculated mean disturbance range for the HDG-HEWS mining area, whereas the exponential characteristics in the XD mining area were not pronounced (Figure 7). Beyond the 1800 m buffer zone of the XD mining area, the fluctuations in the disturbance characteristics of the mean value of the regional phenological metrics indicate influences on its vegetation phenology from external conditions in addition to the mining area itself. Hence, apart from focusing on the identification of disturbance ranges for single open-pit mining, this study also gives special attention to whether the overlapping regions of disturbance ranges accumulate effects on vegetation phenology.

4.4. Cumulative Effect of Mining Disturbance

Several 100 m step rectangular arrays were created in the direction from the HDG-HEWS to the XD mining area. The spatial distribution of vegetation phenological metrics on the rectangular arrays reveals (Figure 8) varying degrees of exacerbation in the SOS lag, EOS advancement, and LOS shortening in the central region. The histogram distribution of phenological metrics was calculated for each rectangular array, and the results indicated that the disturbance characteristics of phenological metrics were more significant in the rectangular array area from 700 m to 1300 m. The cumulative disturbance effects of the SOS and LOS were greater than that of the EOS. Specifically, the cumulative effects of the disturbance resulted in the overlapping areas of the SOS lagging by 6.3 ± 5.9 days, the EOS advancing by 1.2 ± 1.0 days, and the LOS shortening by 6.8 ± 4.8 days. The disturbance degrees for the SOS, EOS, and LOS were 1.38, 1.20, and 1.33 times the degree of disturbance in a single mining area, respectively.

5. Discussion

5.1. Effects of Mineral Dust on Vegetation Phenology

A substantial volume of dust was generated in the open-pit mining area during the blasting of the rock mass, stripping of the rock and soil, and transportation. Affected by the wind flow, the dust particles will cover the vegetation, causing a rise in leaf temperature and consequent dehydration, which hinders the photosynthetic activity of plants [42]. The dust in open-pit mines is small particle dust, including PM10 and PM2.5 with aerodynamic diameters less than 10 μm and 2.5 μm [43]. According to the Ambient Air Quality Standards (GB 3095-2012), the annual average concentration limits for PM2.5 and PM10 are 35 μg/m3 and 70 μg/m3, respectively. Within the vegetation disturbance range of the study area, PM2.5 remains below the critical concentration (29.1~31.8 μg/m3), while PM10 is significantly higher than the critical concentration. The disturbed pixel concentration for PM10 exceeds the critical concentration by 20~32 μg/m3. PM10 is the primary air quality pollutant in this region [44]. Therefore, monthly cumulative dust data and vegetation phenological metrics were utilized for the pixel-level response analysis. The PM2.5 and PM10 data were divided into equal concentration gradients, and the mean phenological metrics for each gradient were calculated for the subsequent Pearson correlation analysis. Correlation analysis between the monthly PM2.5 and PM10 data of open-pit coal mining during April–June and October–November and the vegetation phenology within the disturbance range (Figure 9) reveals that as the concentration of PM2.5 and PM10 levels rise, the SOS date gradually lags behind, and the EOS date gradually advances. Additionally, there is a strong negative correlation between the EOS and the concentrations of both PM2.5 and PM10. However, the correlation between the SOS and PM10 concentration is not significant, which may be caused by rainfall. The study area has ample rainfall during the spring and summer, with average precipitation ranging from 57.6 to 63.1 mm between April and June, whereas from 11.8 to 15.6 mm between October and November. Rainfall can to some extent mitigate larger particulate matter like PM10, but it faces difficulty in mitigating PM2.5 [45]. Drought is considered a key factor in controlling the SOS and EOS in arid and semi-arid regions, and arid soil conditions make the phenological growth period of grassland vegetation more sensitive to precipitation [46,47]. In winter, continuous drought and a lack of rainfall in the study area hinder the implementation of dust inhibitors, leading to a prolonged dust pollution duration and accumulation of PM10 on the surface of vegetation leaves. As a result, this postpones the onset of the SOS for the vegetation.

5.2. Analysis of Key Factors within the Mining Disturbance Area

The production capacities of the three open-pit mines of HDG-HEWS (69 million tons/year), MX (1.8 million tons/year), and XD (1.2 million tons/year) are directly proportional to their impact on vegetation phenological metrics. The greater the mining intensity, the more significant the threat to the surrounding vegetation. However, even though HDG-HEWS has a significantly higher production capacity than the other mining areas, the disturbance ranges on phenological metrics were not consistently the largest. Previous research supports this conclusion. Sun et al. analyzed the disturbance range of mining areas at different latitudes, indicating a weak correlation between the open-pit coal mining intensity and disturbance range, and topography and climate factors also affect the disturbance range to some extent [12]. Since 2011, the HDG-HEWS open-pit mining area has prioritized ecological construction, afforestation, and road dust suppression projects. These measures have improved the ecological environment of the abandoned dump site, slowed down the diffusion and accumulation of dust to the surrounding environment, and shortened the mining disturbance distance. The MX and XD mining areas began production in 2017 and 2022, respectively, the production scales are smaller than that of the HDG-HEWS mining area, and only ecological restoration projects have been carried out for some waste dump sites. Hence, there should be targeted implementation of necessary dust control measures and ecological restoration projects to reduce the disturbance range to vegetation caused by open-pit mining. Especially, the MX mining area’s disturbance zone encompasses villages and cultivated land. We suggest prioritizing dust monitoring and prevention, enabling concurrent mining production and ecological restoration for harmonious regional green development.

5.3. Advantages of the HLS Dataset in Studying Vegetation Phenology in Mining Areas

Extracting vegetation phenology by integrating multi-source remote sensing data is a highly effective approach, especially for LSP derivation of seasonal vegetation with a small greenness amplitude in arid and semi-arid regions [26,48]. Despite existing studies showing that image super-resolution using deep learning can provide high spatiotemporal resolution data, the current fusion cost is expensive, and the accuracy of fusion results still needs to be measured [49]. Therefore, NASA’s harmonized Landsat 8 and Sentinel-2 dataset is considered the preferred choice for extracting LSP. This study successfully utilized the HLS dataset to capture grassland LSP in arid and semi-arid regions, confirming the dataset’s applicability in mining-scale scenarios. The reliability of LSP derivation depends on the vegetation index time series [50]. To build a high-frequency NDVI time series, Sun et al. used three years of Sentinel-2 MSI data [12], which makes it difficult to adapt to phenological extraction in mining scenarios and apply the results to ecological restoration planning for the subsequent year. Due to the dynamic nature of mining activities and variations in annual climate conditions, NDVI differences on the same day may occur, potentially causing deviations in Sun et al.’s phenological metric extraction results compared to the actual phenological phases. Therefore, we believe that the HLS dataset can be effectively applied to LSP extraction in small-scale scenarios in arid and semi-arid regions.

5.4. Limitations and Future Work

Based on the perspective of phenology, this study scientifically analyzed the disturbance range and threat degree of open-pit mining in arid and semi-arid areas to the surrounding vegetation. The limitations of this study mainly exist in the following aspects: The research object is the global buffer zone of the mining area; the landscape pattern of open-pit mining varies in different directions. Future research should concentrate on understanding the cumulative disturbance effects and characteristics of the mining area under different scenarios. Secondly, the study unit was grassland phenology in a broad sense; however, the phenological responses of different grassland vegetation types to mining area disturbances might not be consistent. In the future, integrating unmanned aerial vehicle imagery and on-site investigations will be essential to acquire more refined grassland classification products. Furthermore, the research method we proposed is suitable for identifying the disturbance range of a single open-pit mining area, but when disturbed by other human projects (e.g., a city and another mine), the vegetation phenology metrics are superimposed and disturbed, which makes the modeling sequence oscillate, resulting in an underestimated determination of the distance of disturbance. Establishing a mining disturbance range identification model in complex scenarios is the focus of future research.

6. Conclusions

This study focuses on the disturbance characteristics of the surrounding vegetation caused by open-pit coal mining in arid and semi-arid areas from the perspective of vegetation phenology. We observed that open-pit mining leads to delayed greening, advanced senescence, and shortened vegetation growth cycles. As the distance from the mining area increases, phenological metrics exhibit exponential changes. This paper proposes a simple and effective method to identify the disturbance range of a single open-pit coal mine mining. Open-pit mining activities have significant differences for the disturbance range of vegetation growth at different stages, and the disturbance range of the vegetation senescence phase is smaller than other phenological metrics. The maximum disturbance distances of vegetation phenological metrics caused by HDG-HEWS, MX, and XD open-pit mining are 1485.39 m, 1625.53 m, and 781.23 m, respectively. Accumulated deposition of PM10 and PM2.5 from mine dust affects vegetation photosynthesis and threatens normal vegetation growth. With the expansion of the mining area production scale and intensity, the disturbance range of vegetation phenology does not show a significant alteration, but the degree of disruption is intensified. Notably, the overlapping disturbance zones of adjacent mining areas will also increase the disturbance degree of vegetation phenology, with disturbance degrees for the SOS, EOS, and LOS being 1.38, 1.20, and 1.33 times that of a single mining area. In conclusion, our research findings can serve as a pertinent reference for coal mining enterprises to implement targeted ecological restoration plans, while also offering novel insights into identifying the range and degree of disturbance to the surrounding vegetation caused by open-pit mining activities.

Author Contributions

B.W. proposed the research methodology, designed and performed the experiments, and wrote the manuscript. P.L. helped in manuscript review, editing and acquired the funding. X.Z. made great contributions to the methodology and analysis. All authors have read and agreed to the published version of the manuscript.

Funding

This study was funded by the Fundamental Research Funds for the Key Laboratory of Mine Ecological Effects and Systematic Restoration, Ministry of Natural Resources (Grant No. MEER-2023-06), the Ecological-Smart Mines Joint Research Fund of the Natural Science Foundation of Hebei Province (Grant No. E2020402086), and open funds from the State Key Laboratory of Coal Mining and Clean Utilization (Granted No.2021-CMCU-KF014).

Data Availability Statement

I have shared the relevant links for data acquisition in this manuscript.

Acknowledgments

The European Space Agency and Copernicus program management and staff, and the USGS Landsat program management and staff are thanked for the free provision of the Sentinel-2 and Landsat-8 data, respectively. We thank the anonymous reviewers for their constructive comments and suggestions that improved the quality of this paper.

Conflicts of Interest

The authors declare no conflict of interest.

References

  1. Jie, D.; Xu, X.; Guo, F. The Future of Coal Supply in China Based on Non-Fossil Energy Development and Carbon Price Strategies. Energy 2021, 220, 119644. [Google Scholar] [CrossRef]
  2. Statistical Review of World Energy 2022. Available online: https://www.bp.com/en/global/corporate/energy-economics/statistical-review-of-world-energy.html (accessed on 16 April 2023).
  3. Guan, Y.; Wang, J.; Zhou, W.; Bai, Z.; Cao, Y. Identification of Land Reclamation Stages Based on Succession Characteristics of Rehabilitated Vegetation in the Pingshuo Opencast Coal Mine. J. Environ. Manag. 2022, 305, 114352. [Google Scholar] [CrossRef] [PubMed]
  4. Odell, S.D.; Bebbington, A.; Frey, K.E. Mining and Climate Change: A Review and Framework for Analysis. Extr. Ind. Soc. 2018, 5, 201–214. [Google Scholar] [CrossRef]
  5. Shen, Z.; Zhang, Q.; Chen, D.; Singh, V.P. Varying Effects of Mining Development on Ecological Conditions and Groundwater Storage in Dry Region in Inner Mongolia of China. J. Hydrol. 2021, 597, 125759. [Google Scholar] [CrossRef]
  6. Li, P.; Wang, B.; Chen, P.; Zhang, Y.; Zhao, S. Vulnerability Assessment of the Eco-Geo-Environment of Mining Cities in Arid and Semi-Arid Areas: A Case Study from Zhungeer, China. Ecol. Indic. 2023, 152, 110364. [Google Scholar] [CrossRef]
  7. Yang, Z.; Li, J.; Zipper, C.E.; Shen, Y.; Miao, H.; Donovan, P.F. Identification of the Disturbance and Trajectory Types in Mining Areas Using Multitemporal Remote Sensing Images. Sci. Total Environ. 2018, 644, 916–927. [Google Scholar] [CrossRef]
  8. Yang, Y.; Erskine, P.D.; Lechner, A.M.; Mulligan, D.; Zhang, S.; Wang, Z. Detecting the Dynamics of Vegetation Disturbance and Recovery in Surface Mining Area via Landsat Imagery and LandTrendr Algorithm. J. Clean. Prod. 2018, 178, 353–362. [Google Scholar] [CrossRef]
  9. Zhang, C.; Zheng, H.; Li, J.; Qin, T.; Guo, J.; Du, M. A Method for Identifying the Spatial Range of Mining Disturbance Based on Contribution Quantification and Significance Test. Int. J. Environ. Res. Public Health 2022, 19, 5176. [Google Scholar] [CrossRef]
  10. Xu, F.; Li, H.; Li, Y. Ecological Environment Quality Evaluation and Evolution Analysis of a Rare Earth Mining Area under Different Disturbance Conditions. Environ. Geochem Health 2021, 43, 2243–2256. [Google Scholar] [CrossRef] [PubMed]
  11. Wu, Z.; Lei, S.; Lu, Q.; Bian, Z.; Ge, S. Spatial Distribution of the Impact of Surface Mining on the Landscape Ecological Health of Semi-Arid Grasslands. Ecol. Indic. 2020, 111, 105996. [Google Scholar] [CrossRef]
  12. Sun, X.; Yuan, L.; Liu, M.; Liang, S.; Li, D.; Liu, L. Quantitative Estimation for the Impact of Mining Activities on Vegetation Phenology and Identifying Its Controlling Factors from Sentinel-2 Time Series. Int. J. Appl. Earth Obs. Geoinf. 2022, 111, 102814. [Google Scholar] [CrossRef]
  13. Liu, Y.; Wang, L.; Lu, Y.; Zou, Q.; Yang, L.; He, Y.; Gao, W.; Li, Q. Identification and Optimization Methods for Delineating Ecological Red Lines in Sichuan Province of Southwest China. Ecol. Indic. 2023, 146, 109786. [Google Scholar] [CrossRef]
  14. Yang, Y.; Erskine, P.D.; Zhang, S.; Wang, Y.; Bian, Z.; Lei, S. Effects of Underground Mining on Vegetation and Environmental Patterns in a Semi-Arid Watershed with Implications for Resilience Management. Environ. Earth Sci 2018, 77, 605. [Google Scholar] [CrossRef]
  15. Liu, S.; Li, W.; Wang, Q. Zoning Method for Environmental Engineering Geological Patterns in Underground Coal Mining Areas. Sci. Total Environ. 2018, 634, 1064–1076. [Google Scholar] [CrossRef]
  16. Lieth, H. Purposes of a Phenology Book. In Phenology and Seasonality Modeling; Lieth, H., Ed.; Ecological Studies; Springer: Berlin/Heidelberg, Germany, 1974; Volume 8, pp. 3–19. ISBN 978-3-642-51865-2. [Google Scholar]
  17. Verhegghen, A.; Bontemps, S.; Defourny, P. A Global NDVI and EVI Reference Data Set for Land-Surface Phenology Using 13 Years of Daily SPOT-VEGETATION Observations. Int. J. Remote Sens. 2014, 35, 2440–2471. [Google Scholar] [CrossRef]
  18. Buyantuyev, A.; Wu, J. Urbanization Diversifies Land Surface Phenology in Arid Environments: Interactions among Vegetation, Climatic Variation, and Land Use Pattern in the Phoenix Metropolitan Region, USA. Landsc. Urban Plan. 2012, 105, 149–159. [Google Scholar] [CrossRef]
  19. De Beurs, K.M.; Henebry, G.M. Spatio-Temporal Statistical Methods for Modelling Land Surface Phenology. In Phenological Research; Hudson, I.L., Keatley, M.R., Eds.; Springer: Dordrecht, The Netherlands, 2010; pp. 177–208. ISBN 978-90-481-3334-5. [Google Scholar]
  20. Moody, A.; Johnson, D.M. Land-Surface Phenologies from AVHRR Using the Discrete Fourier Transform. Remote Sens. Environ. 2001, 75, 305–323. [Google Scholar] [CrossRef]
  21. Ganguly, S.; Friedl, M.A.; Tan, B.; Zhang, X.; Verma, M. Land Surface Phenology from MODIS: Characterization of the Collection 5 Global Land Cover Dynamics Product. Remote Sens. Environ. 2010, 114, 1805–1816. [Google Scholar] [CrossRef]
  22. Zeng, L.; Wardlow, B.D.; Xiang, D.; Hu, S.; Li, D. A Review of Vegetation Phenological Metrics Extraction Using Time-Series, Multispectral Satellite Data. Remote Sens. Environ. 2020, 237, 111511. [Google Scholar] [CrossRef]
  23. Griffiths, P.; Nendel, C.; Pickert, J.; Hostert, P. Towards National-Scale Characterization of Grassland Use Intensity from Integrated Sentinel-2 and Landsat Time Series. Remote Sens. Environ. 2020, 238, 111124. [Google Scholar] [CrossRef]
  24. Moon, M.; Richardson, A.D.; Friedl, M.A. Multiscale Assessment of Land Surface Phenology from Harmonized Landsat 8 and Sentinel-2, PlanetScope, and PhenoCam Imagery. Remote Sens. Environ. 2021, 266, 112716. [Google Scholar] [CrossRef]
  25. Li, H.; Xie, M.; Wang, H.; Li, S.; Xu, M. Spatial Heterogeneity of Vegetation Response to Mining Activities in Resource Regions of Northwestern China. Remote Sens. 2020, 12, 3247. [Google Scholar] [CrossRef]
  26. Peng, D.; Wang, Y.; Xian, G.; Huete, A.R.; Huang, W.; Shen, M.; Wang, F.; Yu, L.; Liu, L.; Xie, Q.; et al. Investigation of Land Surface Phenology Detections in Shrublands Using Multiple Scale Satellite Data. Remote Sens. Environ. 2021, 252, 112133. [Google Scholar] [CrossRef]
  27. Li, J.; Liang, J.; Wu, Y.; Yin, S.; Yang, Z.; Hu, Z. Quantitative Evaluation of Ecological Cumulative Effect in Mining Area Using a Pixel-Based Time Series Model of Ecosystem Service Value. Ecol. Indic. 2021, 120, 106873. [Google Scholar] [CrossRef]
  28. Zhao, Y.; Wang, Y.; Zhang, Z.; Zhou, Y.; Huang, H.; Chang, M. The Evolution of Landscape Patterns and Its Ecological Effects of Open-Pit Mining: A Case Study in the Heidaigou Mining Area, China. Int. J. Environ. Res. Public Health 2023, 20, 4394. [Google Scholar] [CrossRef] [PubMed]
  29. Xiao, W.; Deng, X.; He, T.; Guo, J. Using POI and Time Series Landsat Data to Identify and Rebuilt Surface Mining, Vegetation Disturbance and Land Reclamation Process Based on Google Earth Engine. J. Environ. Manag. 2023, 327, 116920. [Google Scholar] [CrossRef] [PubMed]
  30. Peng, D.; Wu, C.; Li, C.; Zhang, X.; Liu, Z.; Ye, H.; Luo, S.; Liu, X.; Hu, Y.; Fang, B. Spring Green-up Phenology Products Derived from MODIS NDVI and EVI: Intercomparison, Interpretation and Validation Using National Phenology Network and AmeriFlux Observations. Ecol. Indic. 2017, 77, 323–336. [Google Scholar] [CrossRef]
  31. Kariyeva, J.; Van Leeuwen, W. Environmental Drivers of NDVI-Based Vegetation Phenology in Central Asia. Remote Sens. 2011, 3, 203–246. [Google Scholar] [CrossRef]
  32. Claverie, M.; Ju, J.; Masek, J.G.; Dungan, J.L.; Vermote, E.F.; Roger, J.-C.; Skakun, S.V.; Justice, C. The Harmonized Landsat and Sentinel-2 Surface Reflectance Data Set. Remote Sens. Environ. 2018, 219, 145–161. [Google Scholar] [CrossRef]
  33. Zhang, J.; Zou, T.; Lai, Y. Novel Method for Industrial Sewage Outfall Detection: Water Pollution Monitoring Based on Web Crawler and Remote Sensing Interpretation Techniques. J. Clean. Prod. 2021, 312, 127640. [Google Scholar] [CrossRef]
  34. Ge, C.; Sun, S.; Yao, R.; Sun, P.; Li, M.; Bian, Y. Long-Term Vegetation Phenology Changes and Response to Multi-Scale Meteorological Drought on the Loess Plateau, China. J. Hydrol. 2022, 614, 128605. [Google Scholar] [CrossRef]
  35. Zhou, X.; Geng, X.; Yin, G.; Hänninen, H.; Hao, F.; Zhang, X.; Fu, Y.H. Legacy Effect of Spring Phenology on Vegetation Growth in Temperate China. Agric. For. Meteorol. 2020, 281, 107845. [Google Scholar] [CrossRef]
  36. Zhang, X. Reconstruction of a Complete Global Time Series of Daily Vegetation Index Trajectory from Long-Term AVHRR Data. Remote Sens. Environ. 2015, 156, 457–472. [Google Scholar] [CrossRef]
  37. Zhao, Y.; Lee, C.K.F.; Wang, Z.; Wang, J.; Gu, Y.; Xie, J.; Law, Y.K.; Song, G.; Bonebrake, T.C.; Yang, X.; et al. Evaluating Fine-Scale Phenology from PlanetScope Satellites with Ground Observations across Temperate Forests in Eastern North America. Remote Sens. Environ. 2022, 283, 113310. [Google Scholar] [CrossRef]
  38. Beck, P.S.A.; Atzberger, C.; Høgda, K.A.; Johansen, B.; Skidmore, A.K. Improved Monitoring of Vegetation Dynamics at Very High Latitudes: A New Method Using MODIS NDVI. Remote Sens. Environ. 2006, 100, 321–334. [Google Scholar] [CrossRef]
  39. Jonsson, P.; Eklundh, L. Seasonality Extraction by Function Fitting to Time-Series of Satellite Sensor Data. IEEE Trans. Geosci. Remote Sens. 2002, 40, 1824–1832. [Google Scholar] [CrossRef]
  40. Xu, L.; Niu, B.; Zhang, X.; He, Y. Dynamic Threshold of Carbon Phenology in Two Cold Temperate Grasslands in China. Remote Sens. 2021, 13, 574. [Google Scholar] [CrossRef]
  41. Shang, R.; Liu, R.; Xu, M.; Liu, Y.; Zuo, L.; Ge, Q. The Relationship between Threshold-Based and Inflexion-Based Approaches for Extraction of Land Surface Phenology. Remote Sens. Environ. 2017, 199, 167–170. [Google Scholar] [CrossRef]
  42. Wang, Z.; Zhou, W.; Jiskani, I.M.; Ding, X.; Luo, H. Dust Pollution in Cold Region Surface Mines and Its Prevention and Control. Environ. Pollut. 2022, 292, 118293. [Google Scholar] [CrossRef]
  43. Entwistle, J.A.; Hursthouse, A.S.; Marinho Reis, P.A.; Stewart, A.G. Metalliferous Mine Dust: Human Health Impacts and the Potential Determinants of Disease in Mining Communities. Curr. Pollut. Rep 2019, 5, 67–83. [Google Scholar] [CrossRef]
  44. Trechera, P.; Moreno, T.; Córdoba, P.; Moreno, N.; Zhuang, X.; Li, B.; Li, J.; Shangguan, Y.; Dominguez, A.O.; Kelly, F.; et al. Comprehensive Evaluation of Potential Coal Mine Dust Emissions in an Open-Pit Coal Mine in Northwest China. Int. J. Coal Geol. 2021, 235, 103677. [Google Scholar] [CrossRef]
  45. Liu, Z.; Shen, L.; Yan, C.; Du, J.; Li, Y.; Zhao, H. Analysis of the Influence of Precipitation and Wind on PM2.5 and PM10 in the Atmosphere. Adv. Meteorol. 2020, 2020, 5039613. [Google Scholar] [CrossRef]
  46. Kang, W.; Wang, T.; Liu, S. The Response of Vegetation Phenology and Productivity to Drought in Semi-Arid Regions of Northern China. Remote Sens. 2018, 10, 727. [Google Scholar] [CrossRef]
  47. Yuan, M.; Zhao, L.; Lin, A.; Wang, L.; Li, Q.; She, D.; Qu, S. Impacts of Preseason Drought on Vegetation Spring Phenology across the Northeast China Transect. Sci. Total Environ. 2020, 738, 140297. [Google Scholar] [CrossRef]
  48. Zhan, Y.; Ma, C.; Yan, Y.; Zhu, J.; Ji, Y.; Ma, C.; Luo, Y. Spatial Differentiation Characteristics of Vegetation Greening Rates and Climate Attribution in China’s Arid and Semi-Arid Regions. Glob. Ecol. Conserv. 2023, 46, e02563. [Google Scholar] [CrossRef]
  49. Wang, Z.; Chen, J.; Hoi, S.C.H. Deep Learning for Image Super-Resolution: A Survey. IEEE Trans. Pattern Anal. Mach. Intell. 2021, 43, 3365–3387. [Google Scholar] [CrossRef]
  50. Tian, J.; Zhu, X.; Chen, J.; Wang, C.; Shen, M.; Yang, W.; Tan, X.; Xu, S.; Li, Z. Improving the Accuracy of Spring Phenology Detection by Optimally Smoothing Satellite Vegetation Index Time Series Based on Local Cloud Frequency. ISPRS J. Photogramm. Remote Sens. 2021, 180, 29–44. [Google Scholar] [CrossRef]
Figure 1. Geographic location of the study area. (a) Zhungeer City in China; (b) Shendong open-pit mines location; (c) image of the open-pit mines in 2022; (d,e) unmanned aerial vehicle photos of the Heidaigou mining area.
Remotesensing 15 05257 g001
Figure 2. Date distribution of NDVI images in the study area.
Remotesensing 15 05257 g002
Figure 3. Overview of methodology.
Remotesensing 15 05257 g003
Figure 4. Schematic diagram of disturbance range identification. (a) Variation characteristics of phenological metrics with distance from mining area; (b) Identification of maximum disturbance range in a single mining area.
Remotesensing 15 05257 g004
Figure 5. Comparison of phenological metric extraction results using DL and AG. Note: DOY: date of year; NOD: number of days.
Remotesensing 15 05257 g005
Figure 6. Spatial distribution of phenological metrics. (a) SOS; (b) EOS; (c) LOS.
Remotesensing 15 05257 g006
Figure 7. Changes in phenological metrics within the disturbance range of the mining area. (a) HDG-HEWS mining area; (b) MX mining area; (c) XD mining area.
Remotesensing 15 05257 g007
Figure 8. Changes in vegetation phenology in disturbed overlapping areas. (a) DL; (b) AG.
Remotesensing 15 05257 g008
Figure 9. Correlation analysis of phenological metrics between mineral dust and vegetation.
Remotesensing 15 05257 g009
Table 1. Means of phenological metrics within 1 km of open-pit mines and the entire area.
SOS (Days)EOS (Days)LOS (Days)
DLAGDLAGDLAG
Entire region145.0143.9313.3315.4170.6174.2
HDG-HEWS152.1151.3313.9316.3166.2169.9
MX155.5154.8314.3314.8163.1166.8
XD146.0145.4311.9314.3167.9171.0
Table 2. Disturbance range and degree of mining area from different phenological metrics.
Mining AreaHDG-HEWSMXXD
Smax (m)∆t (Days)Smax (m)∆t (Days)Smax (m)∆t (Days)
SOS1485.396.4 ± 3.41571.473.6 ± 2.7671.922.0 ± 1.4
EOS816.724.3 ± 3.9824.731.8 ± 1.6468.921.2 ± 1.0
LOS1377.286.7 ± 3.51625.533.1 ± 2.2781.232.5 ± 2.6
Smax: Maximum disturbance distance. ∆t: Time difference of phenological metrics within the disturbance range.
Disclaimer/Publisher’s Note: The statements, opinions and data contained in all publications are solely those of the individual author(s) and contributor(s) and not of MDPI and/or the editor(s). MDPI and/or the editor(s) disclaim responsibility for any injury to people or property resulting from any ideas, methods, instructions or products referred to in the content.

