
The Impact of Dam Construction on Downstream Vegetation Area in Dry Areas Using Satellite Remote Sensing: A Case Study


Abstract
:1. Introduction
2. Data and Method
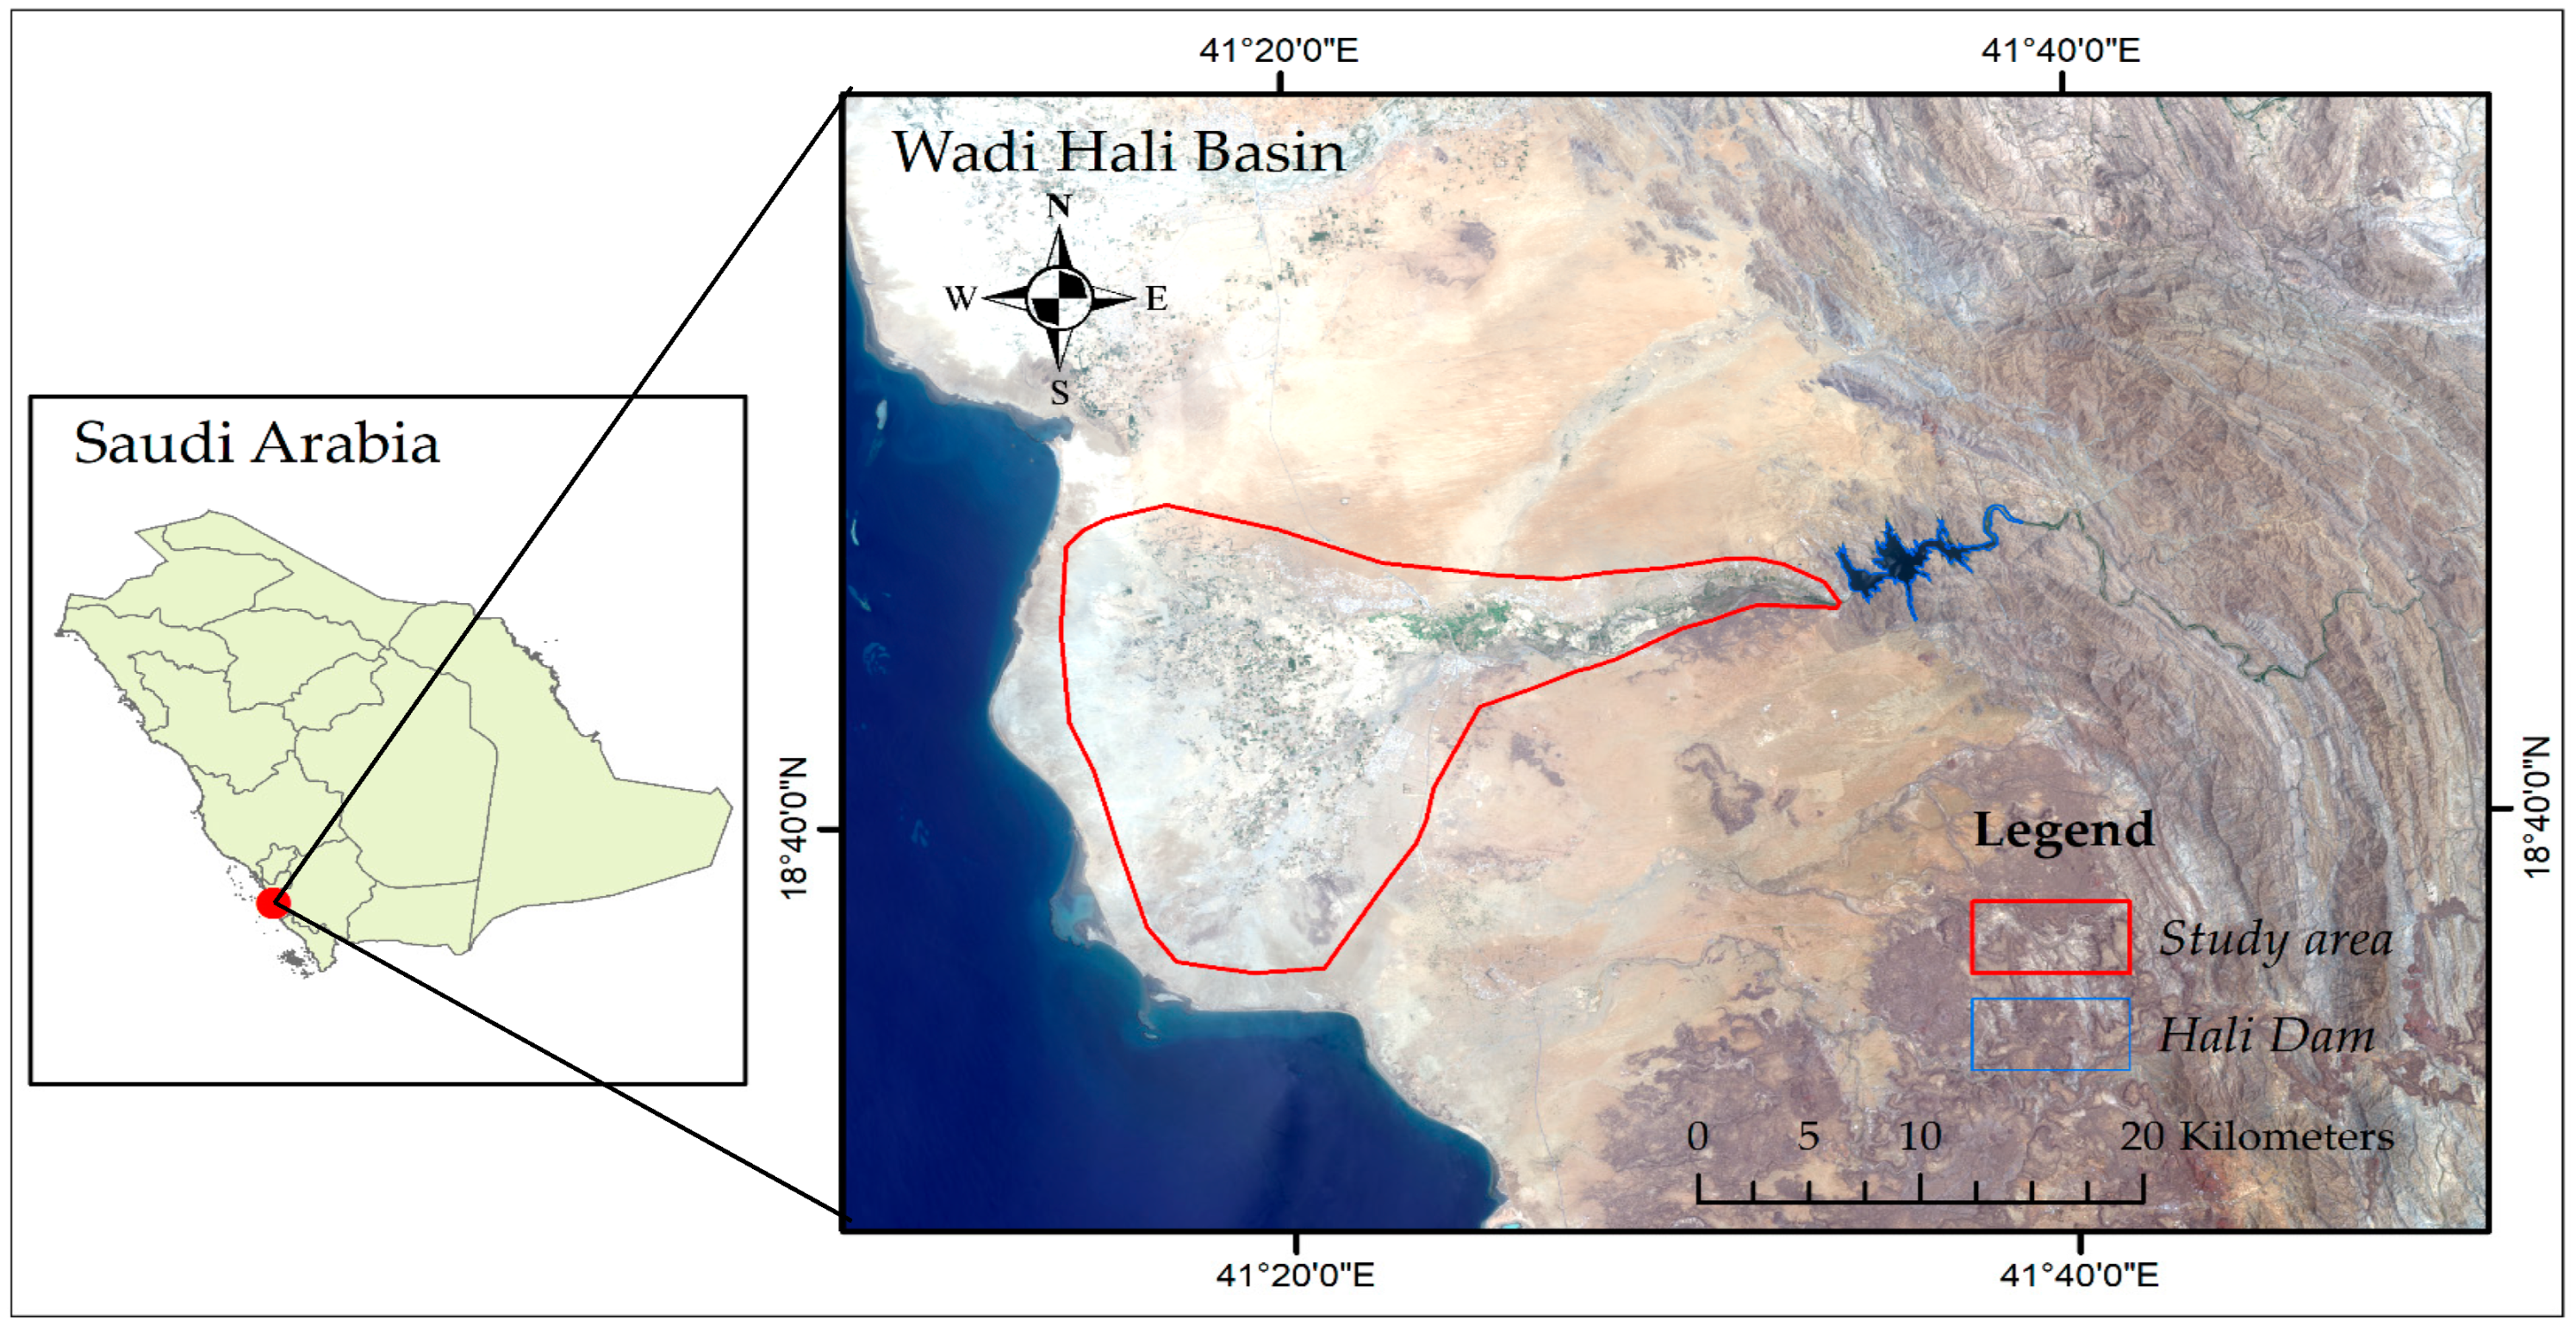
2.1. Case Study
2.2. Database
2.2.1. Satellite Data Source and Pre-Processing
2.2.2. Climate Variables Selection and Data
2.2.3. Equivalent Water Thickness (EWT)
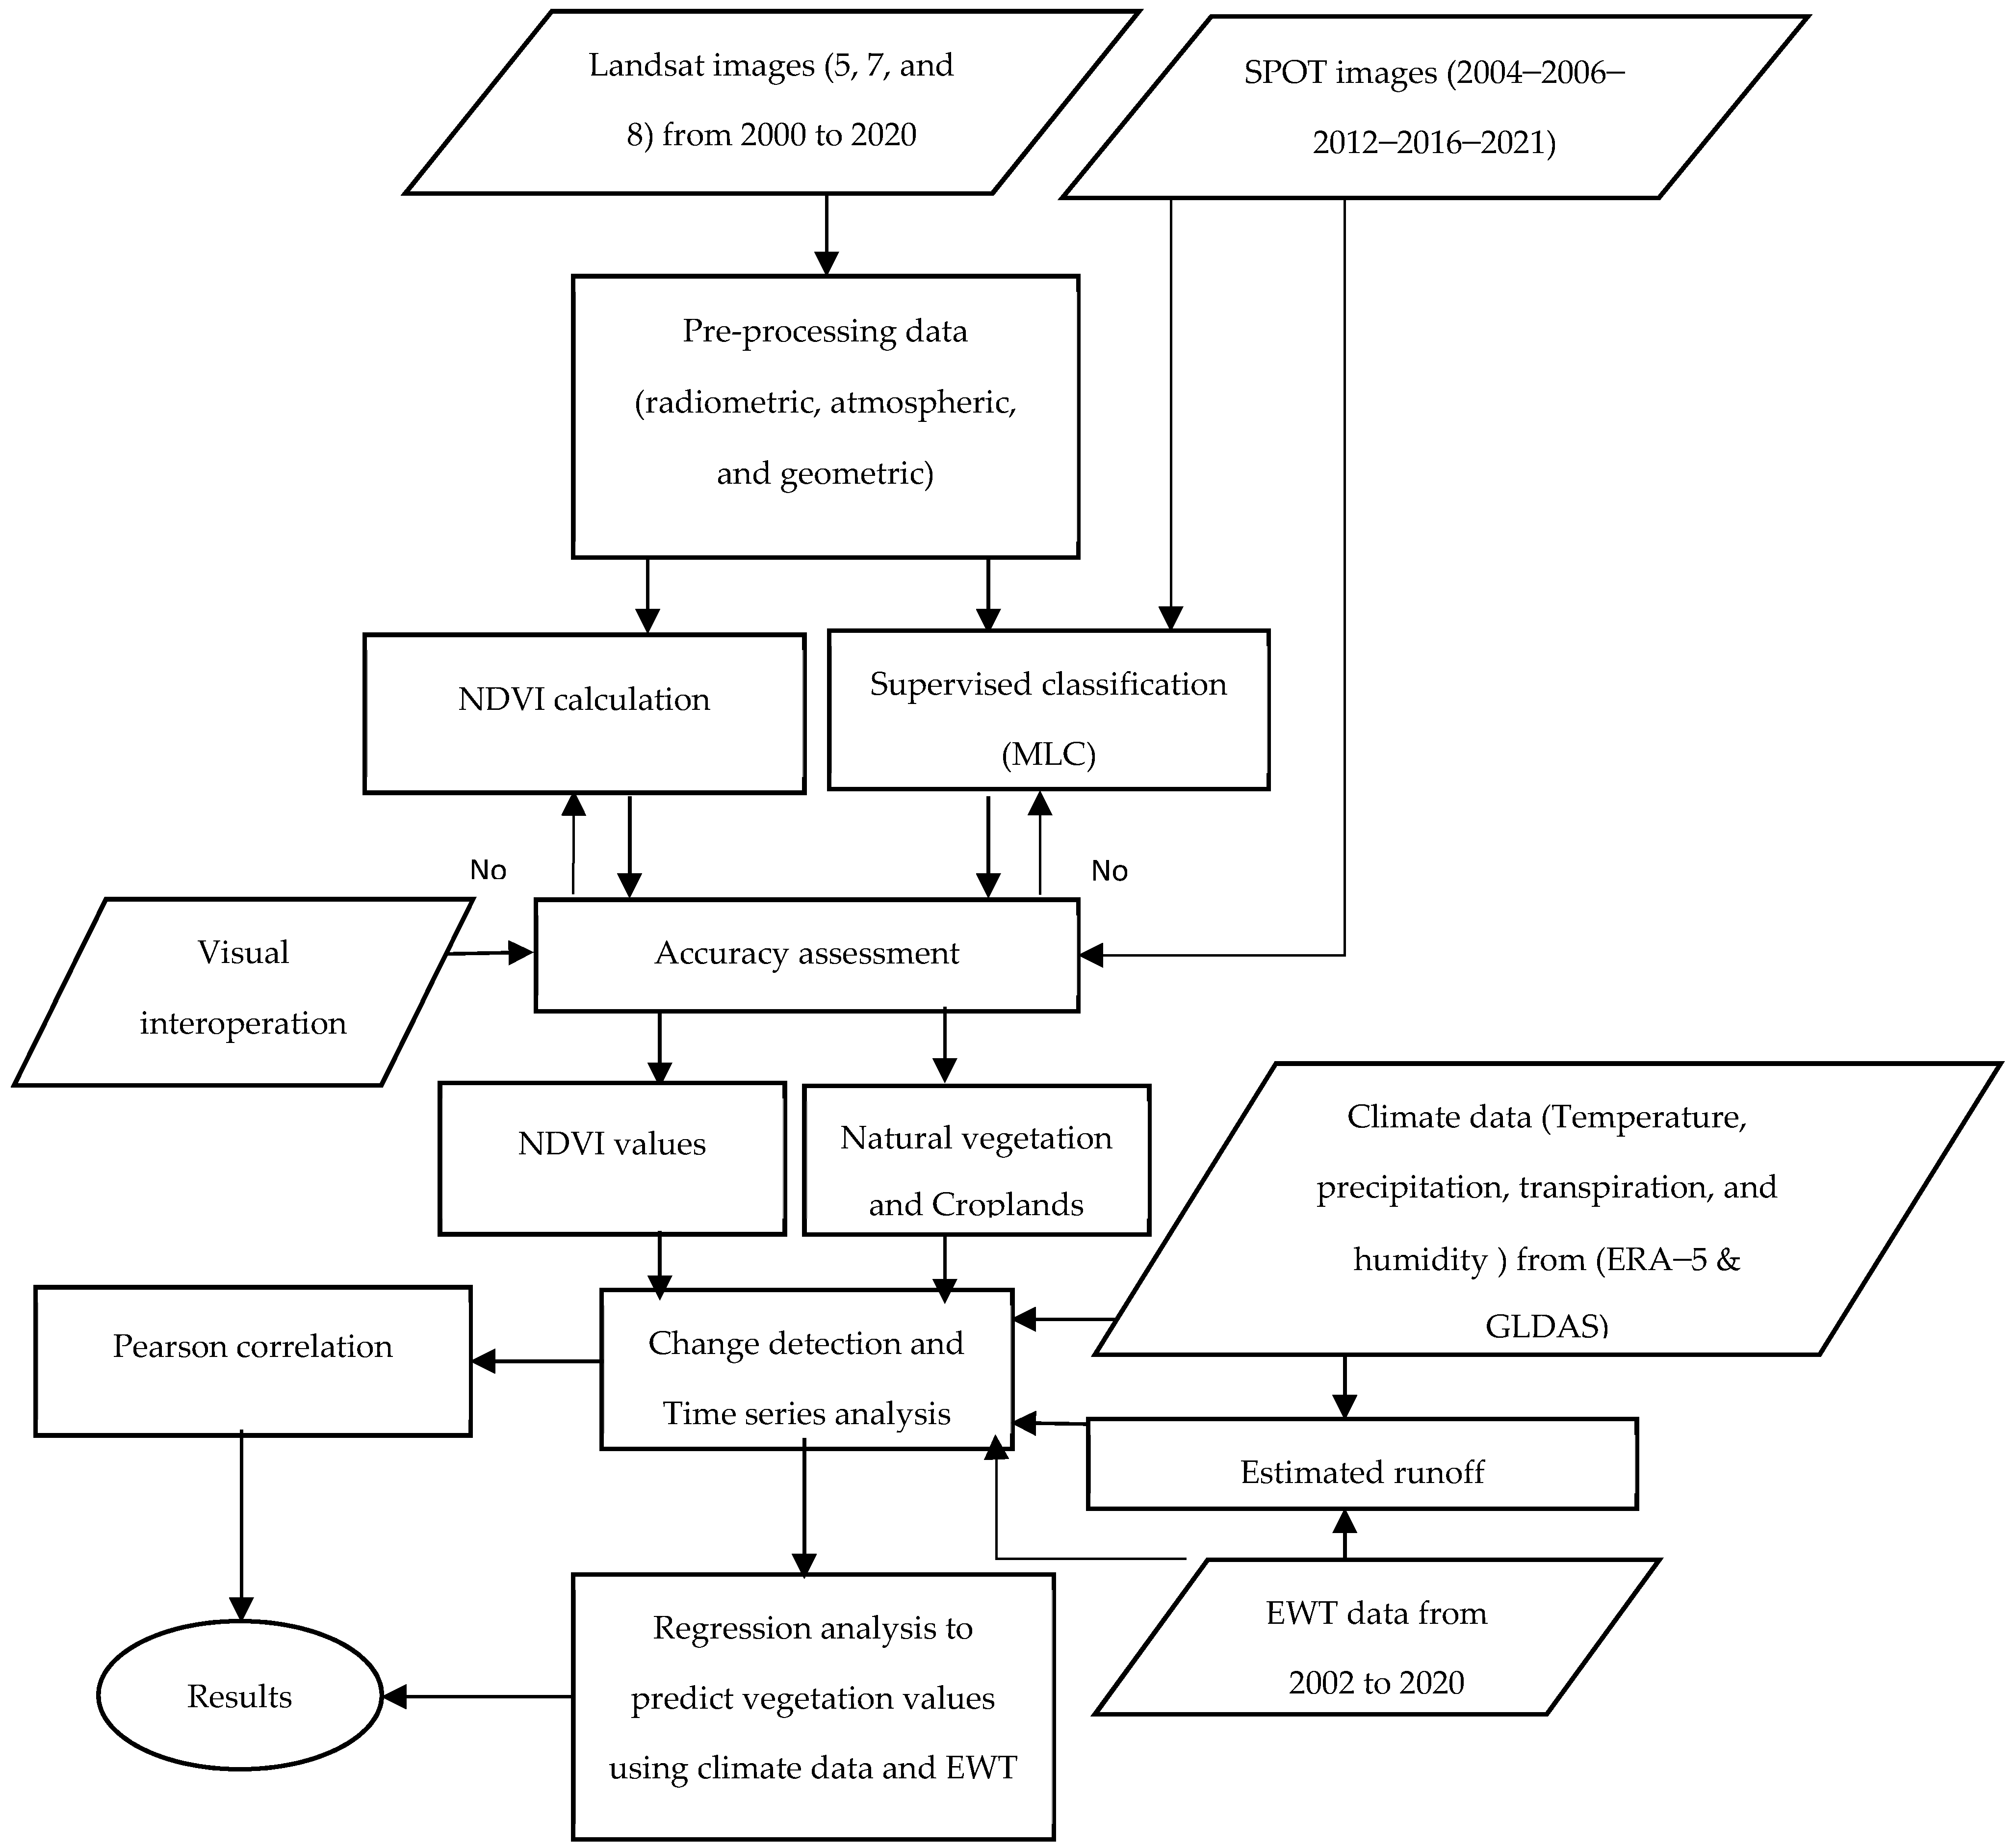
2.3. Methods
2.3.1. Image Classification and Accuracy Assessment
2.3.2. NDVI Calculation
2.3.3. Estimation of Runoff
2.3.4. Pearson’s Correlation and Multivariate Regression Analysis
3. Results
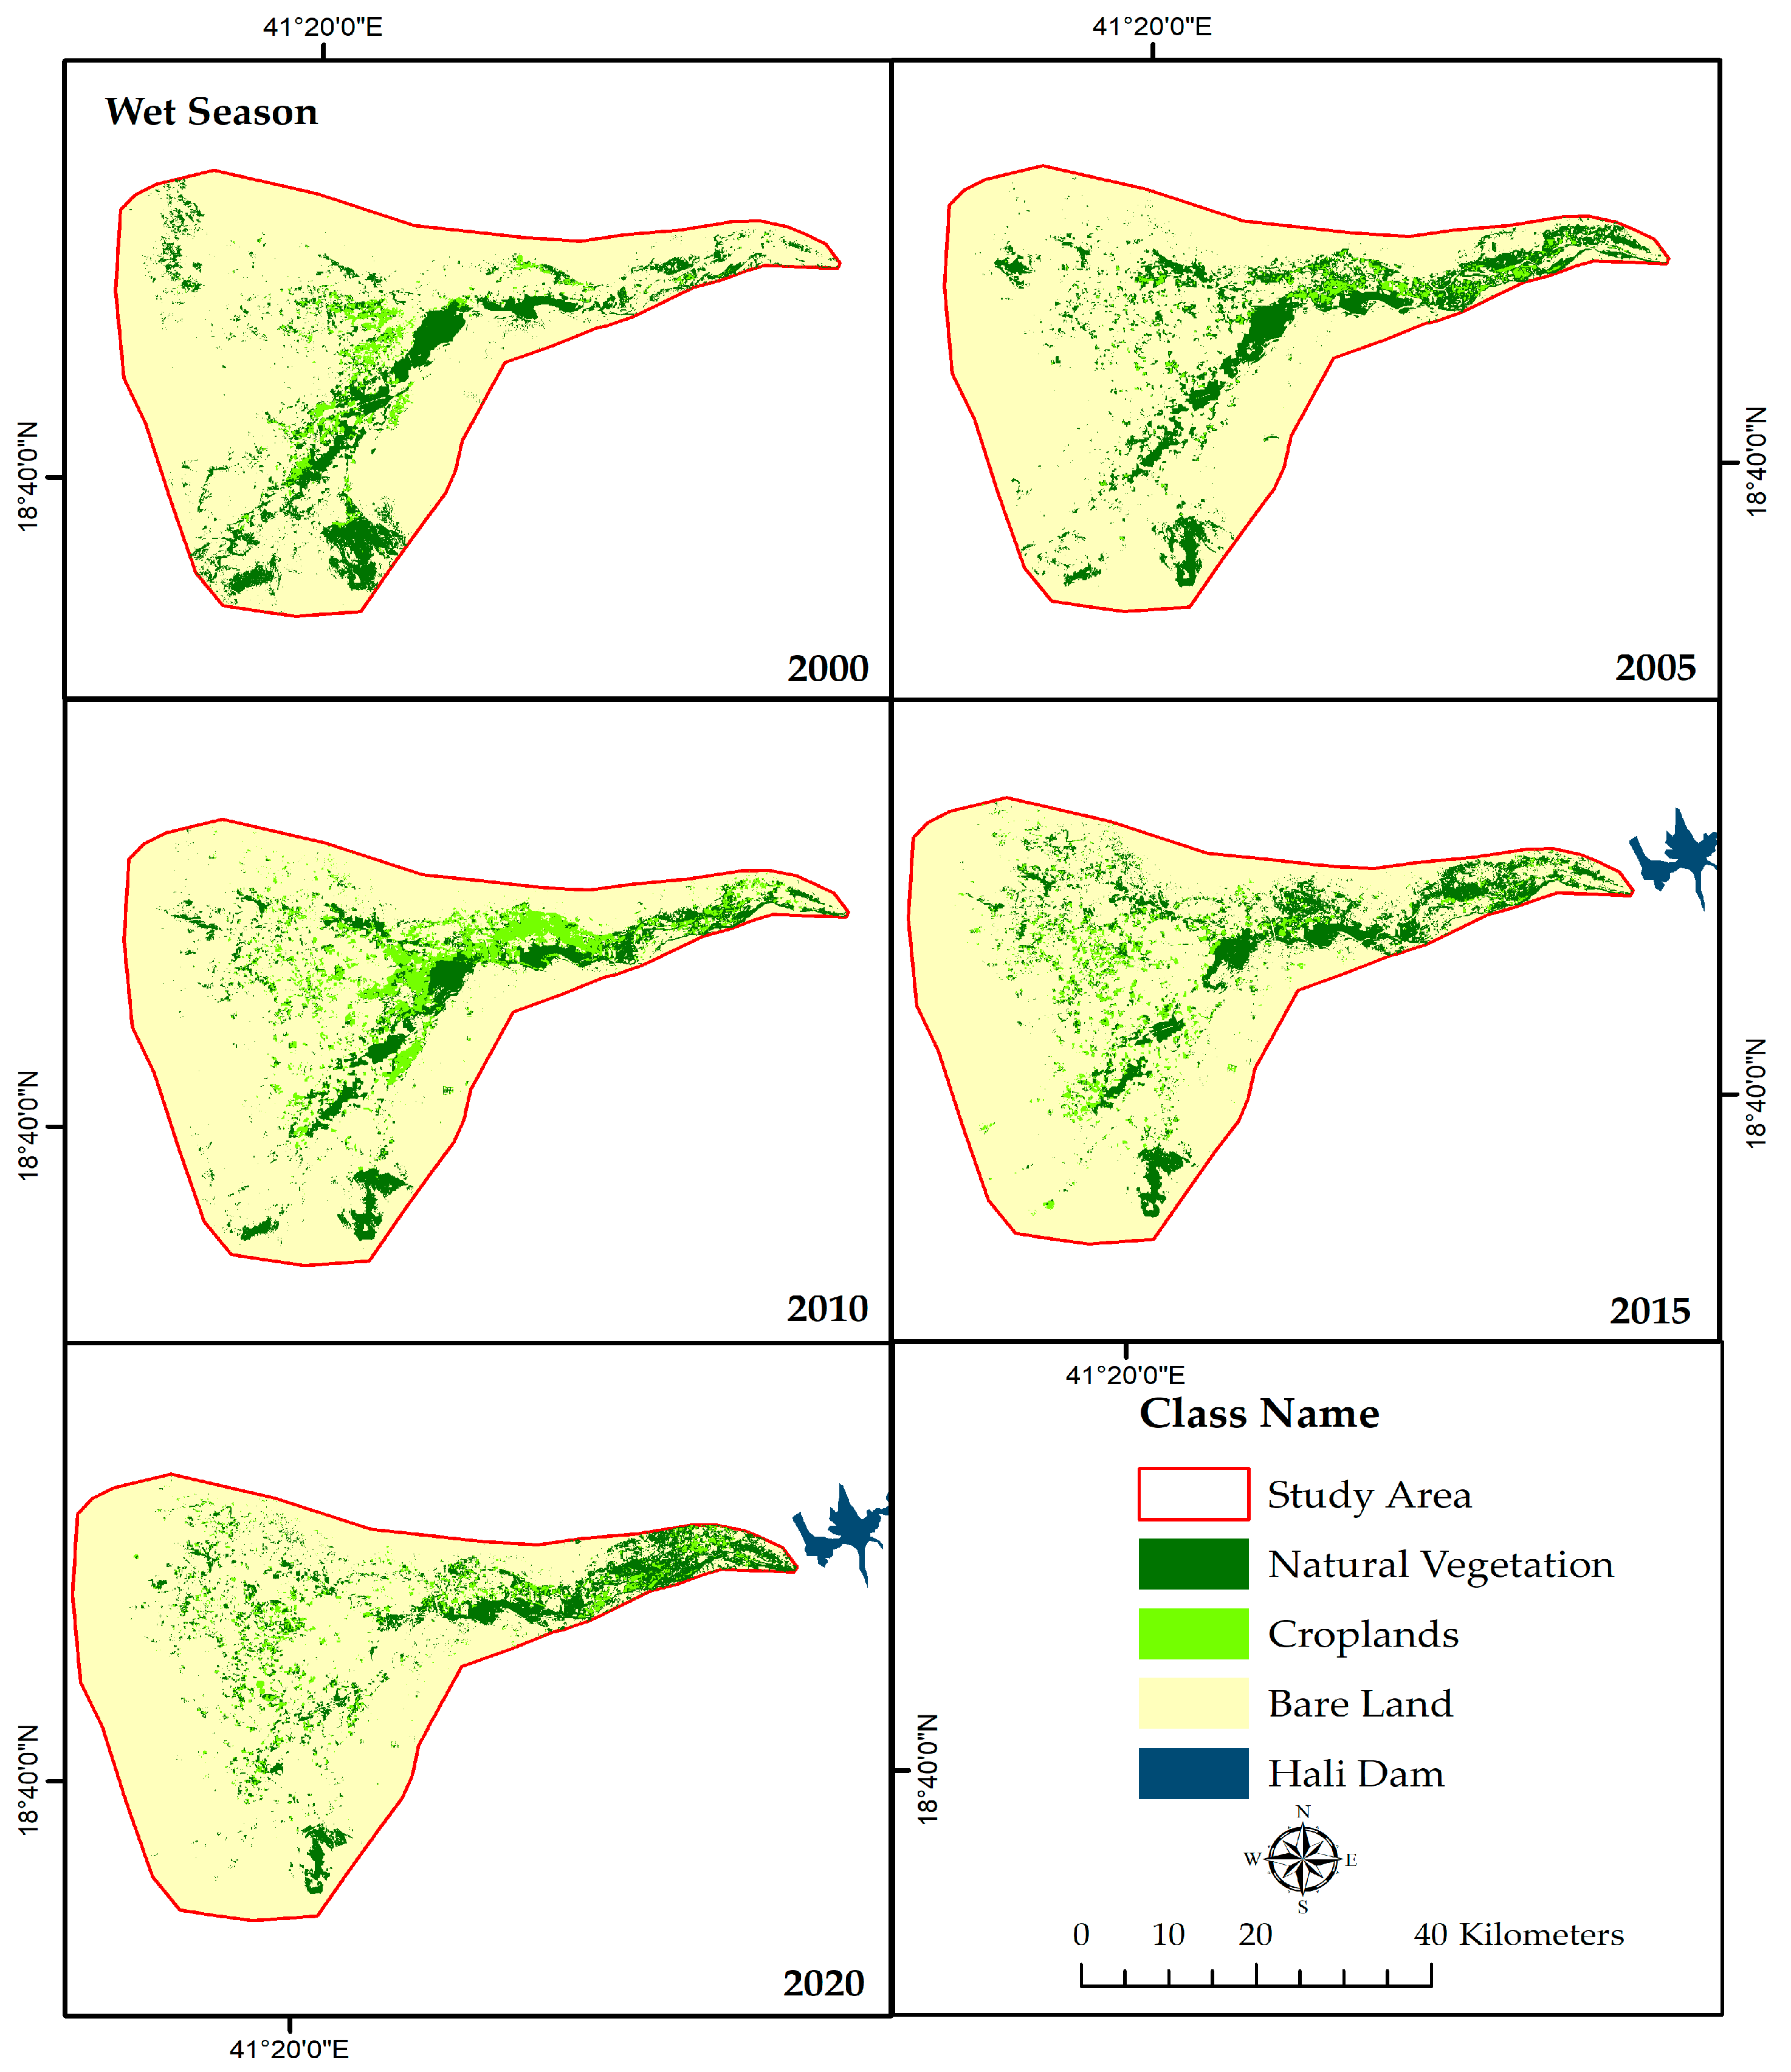
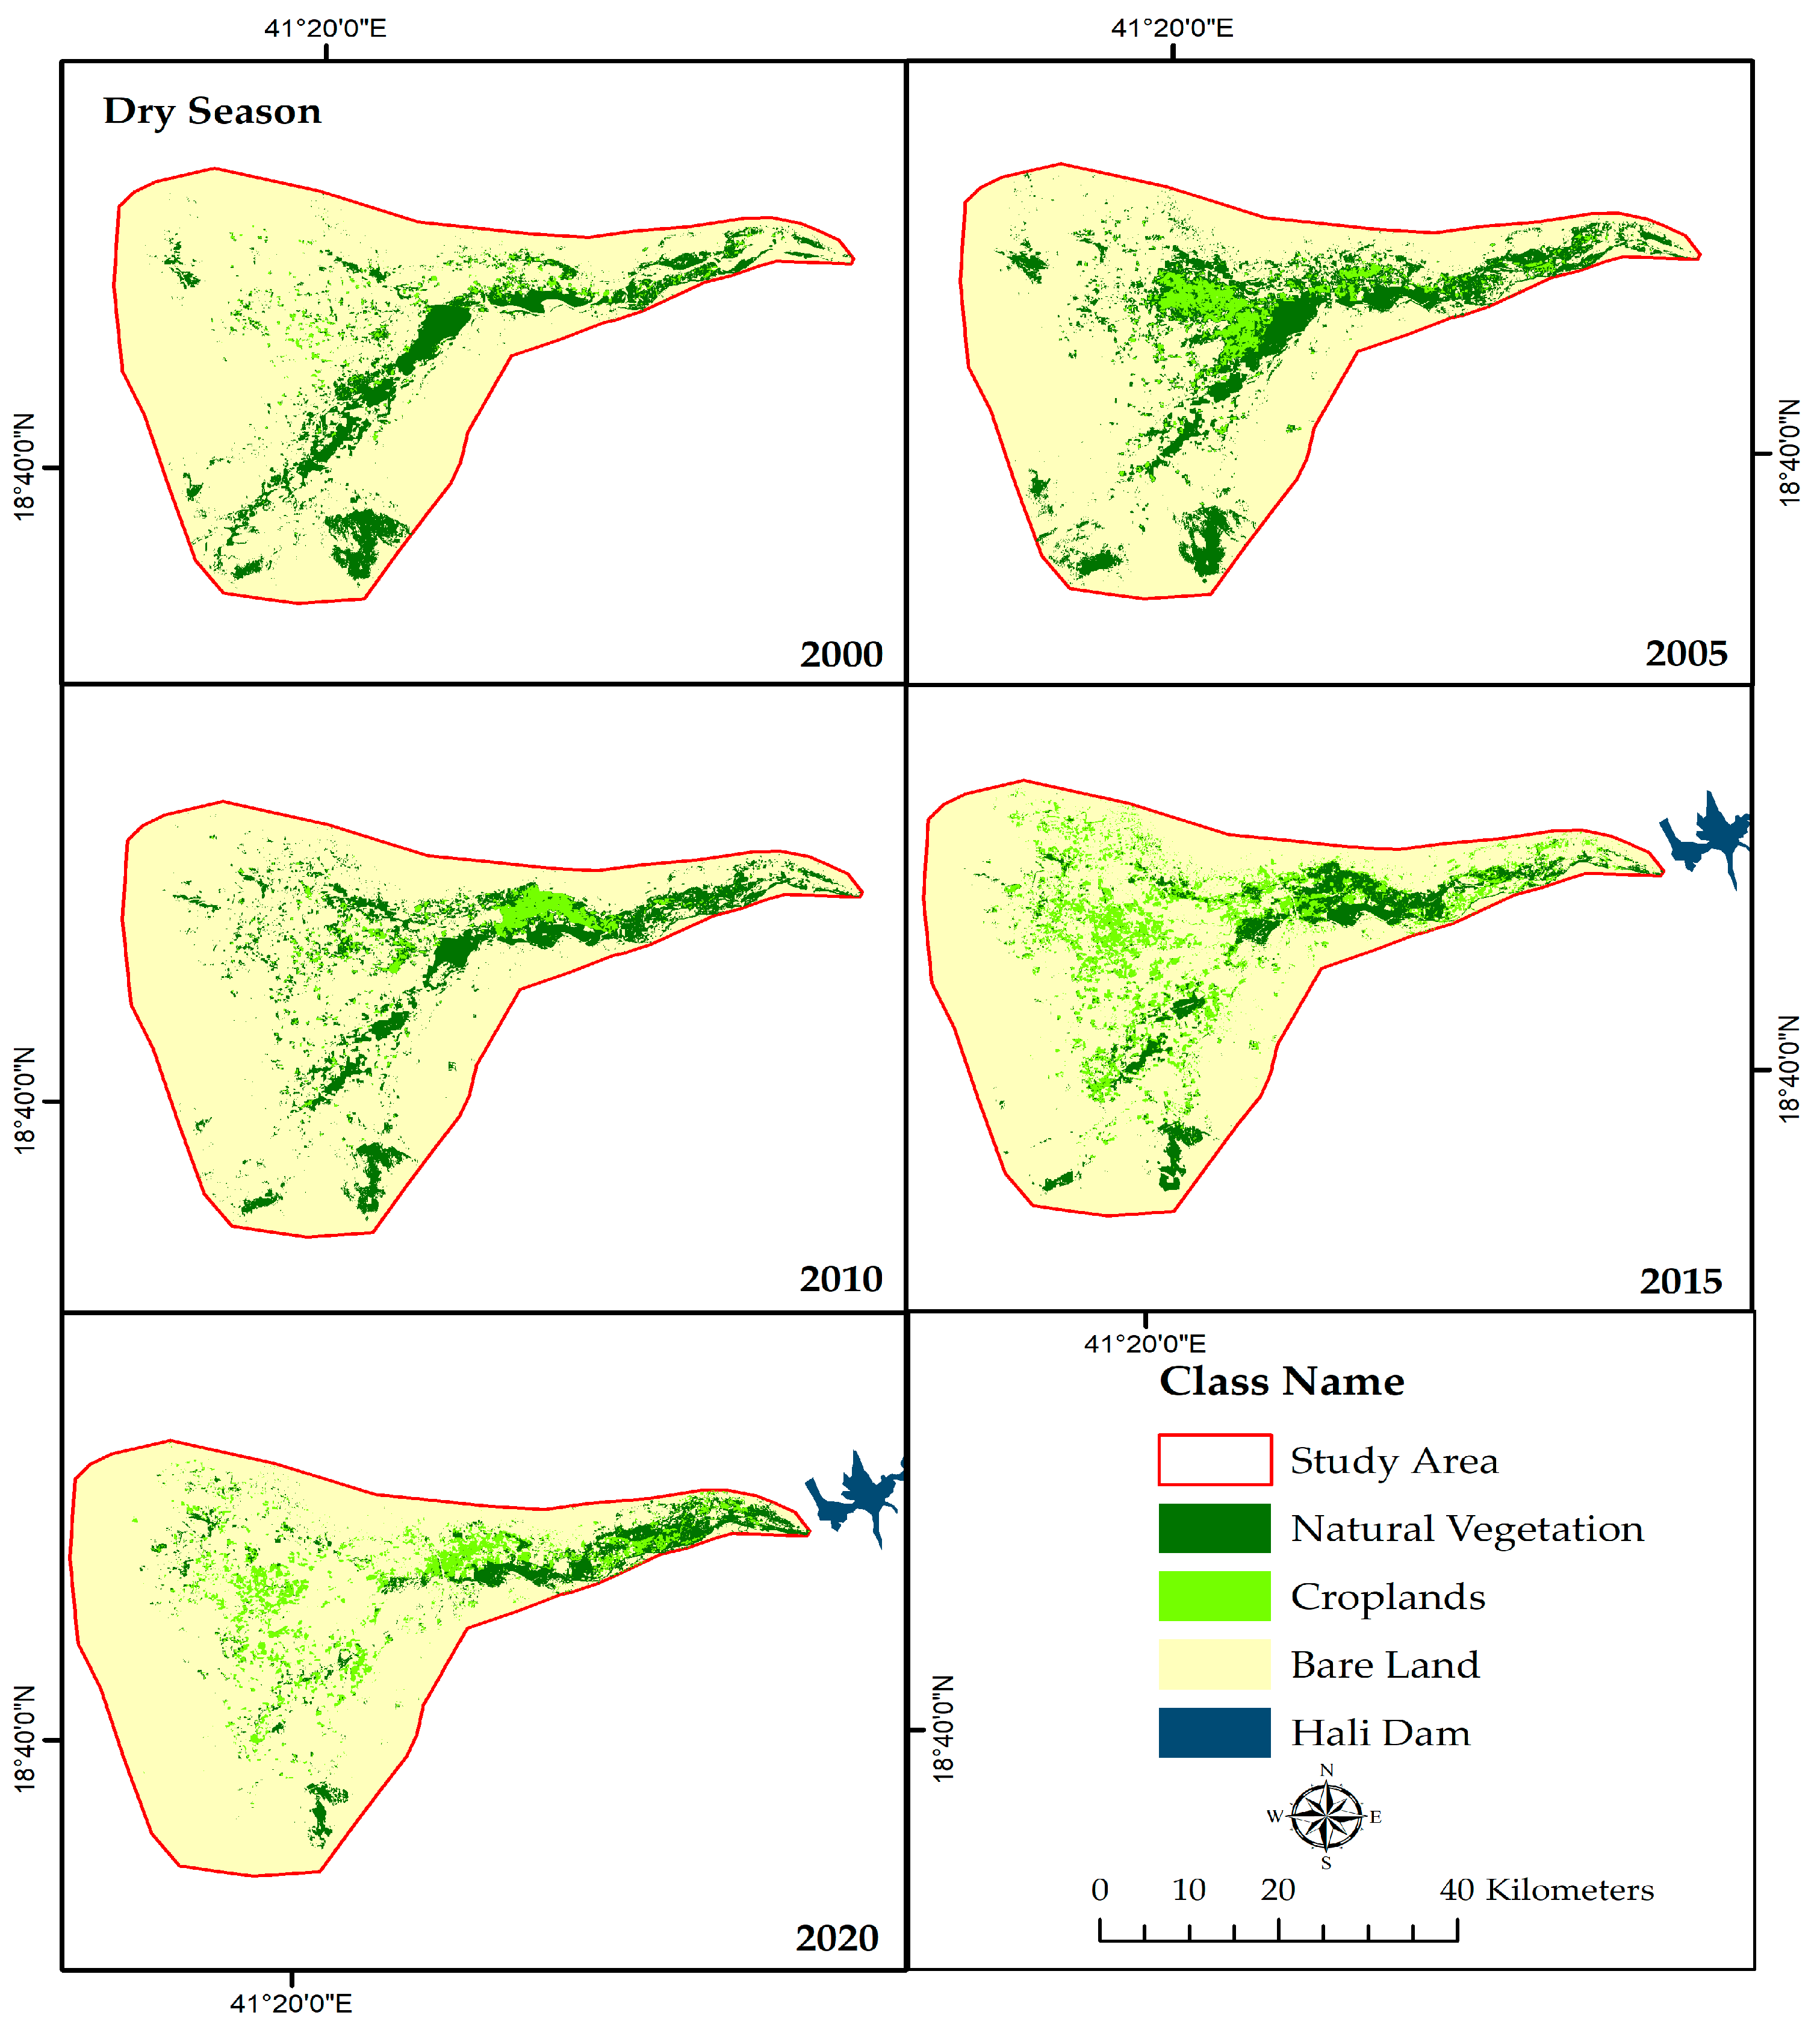
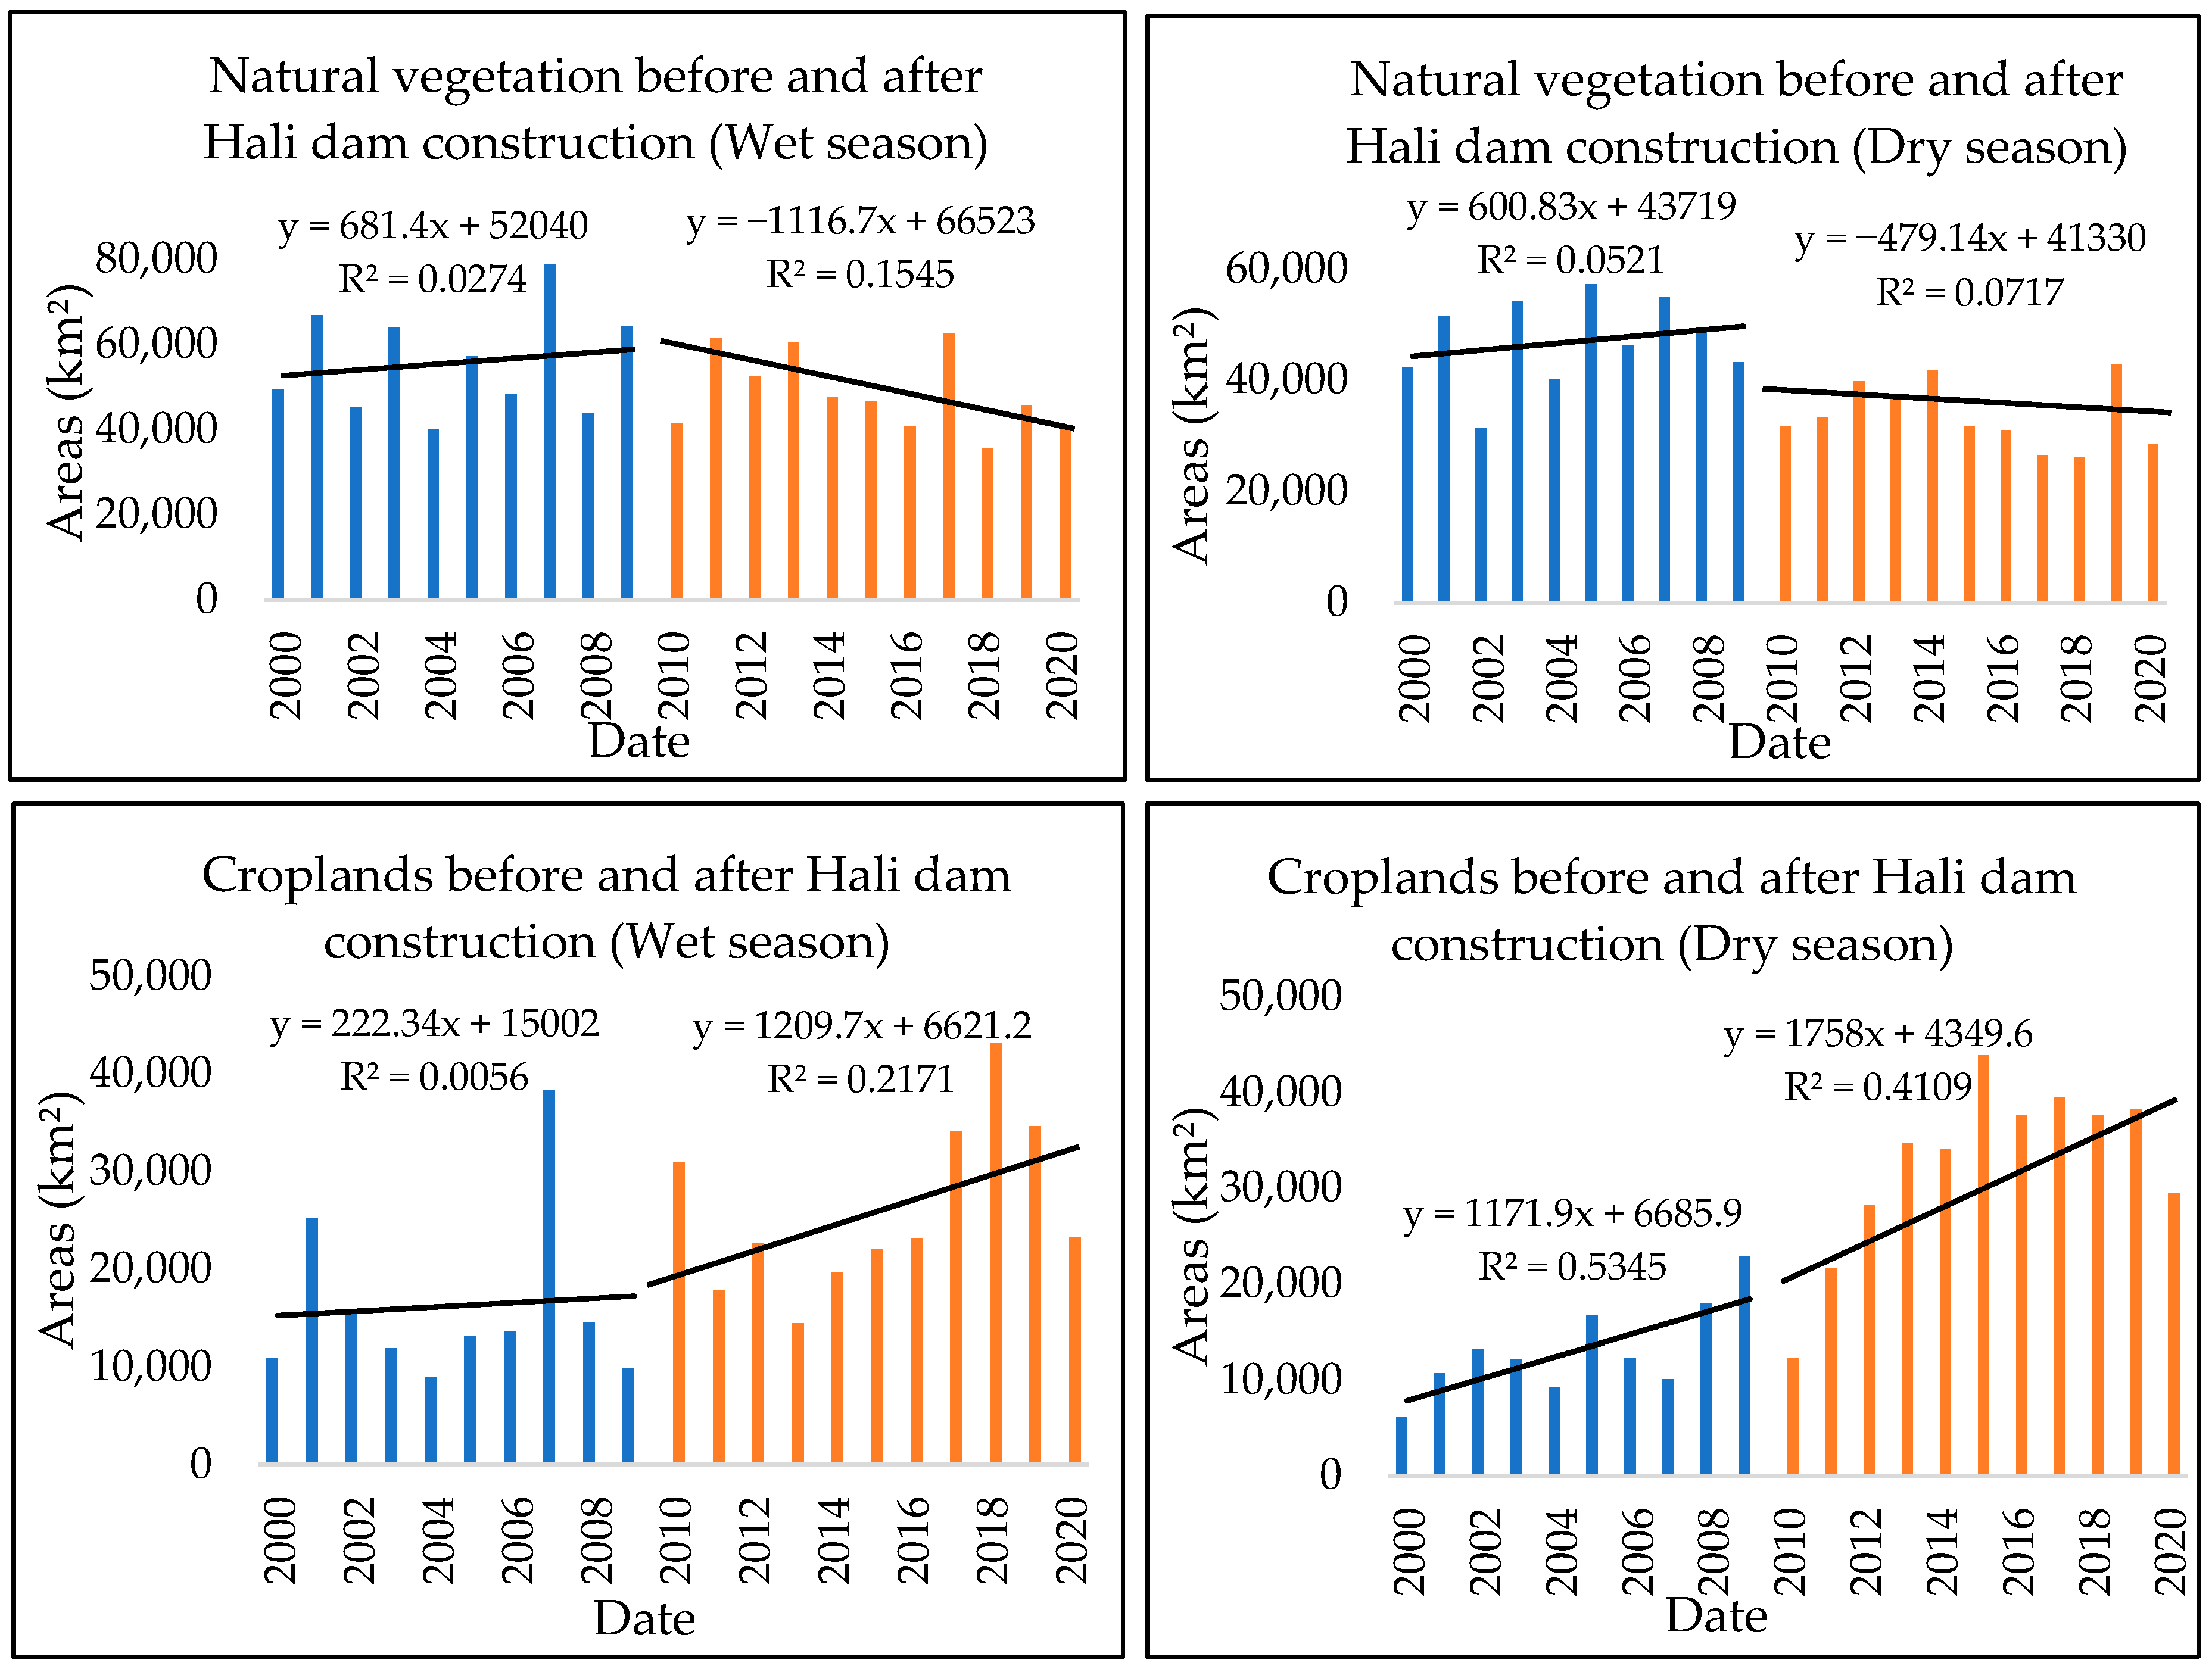
3.1. Annual and Seasonal Variation of Vegetation Areas
3.1.1. Vegetation Areas Using Supervised Classification (MLC)
3.1.2. Accuracy Assessment of Vegetation Areas Using Supervised Classification
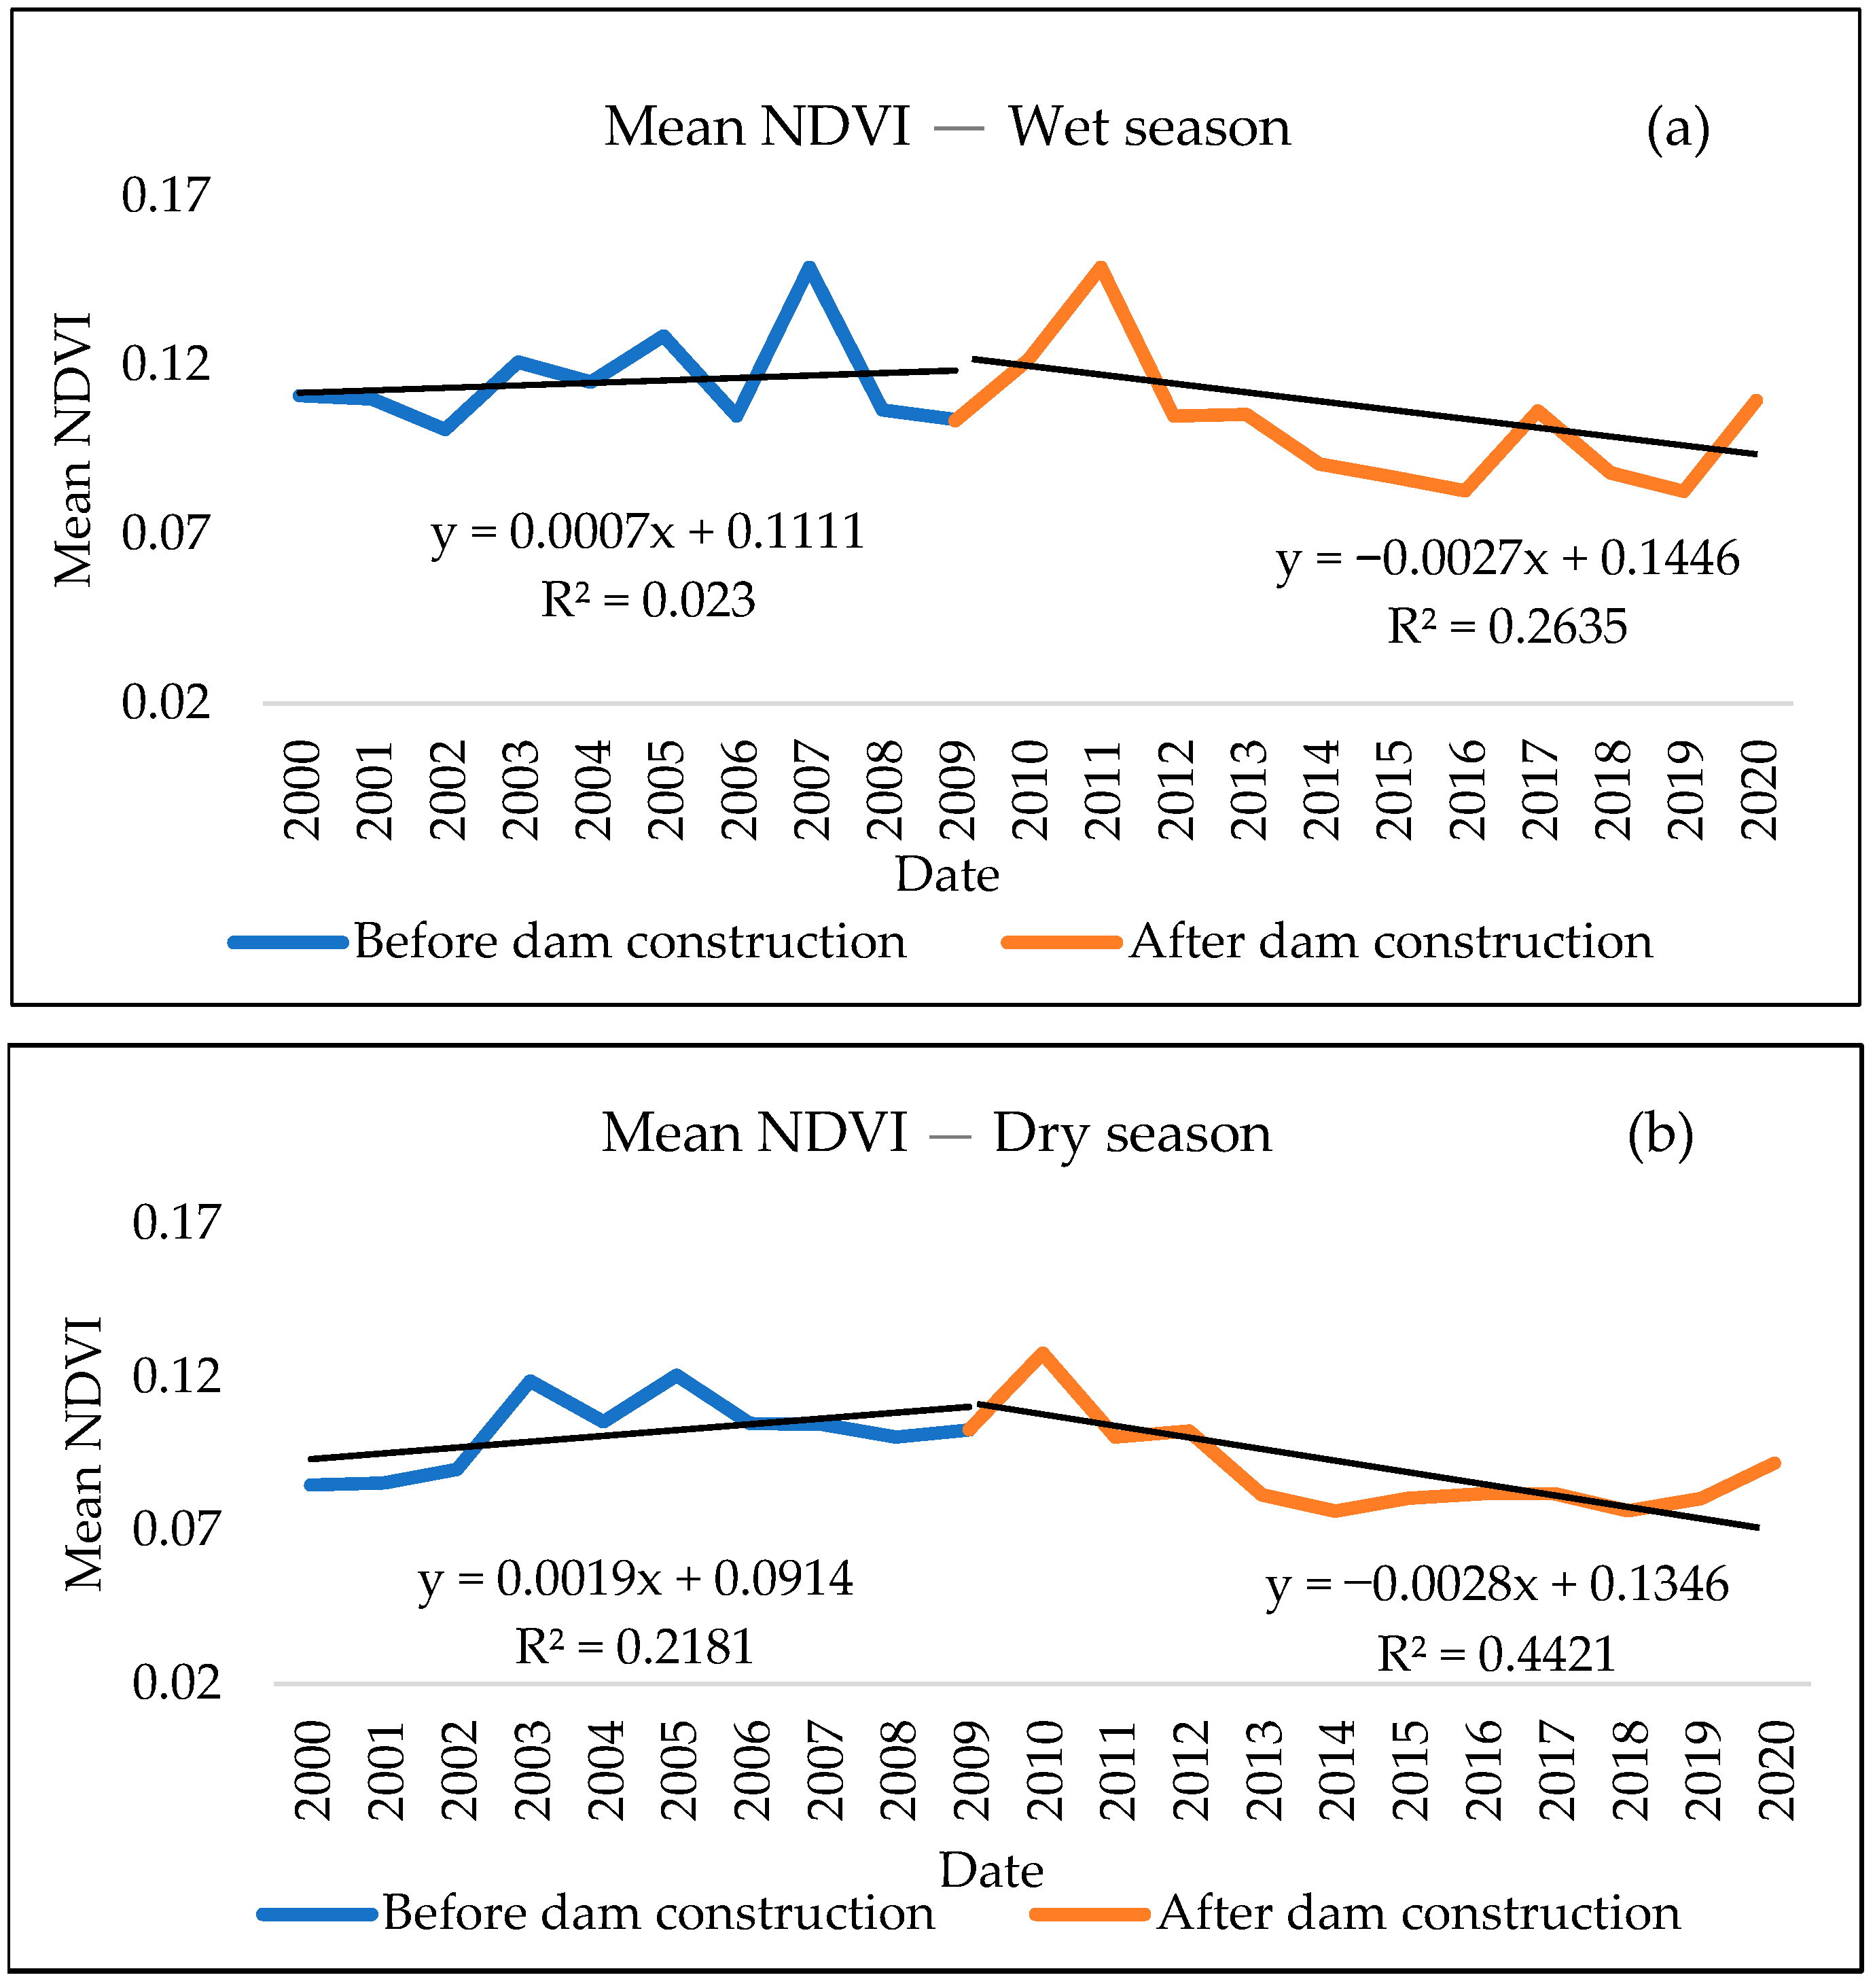
3.2. Annual and Seasonal Variation of NDVI
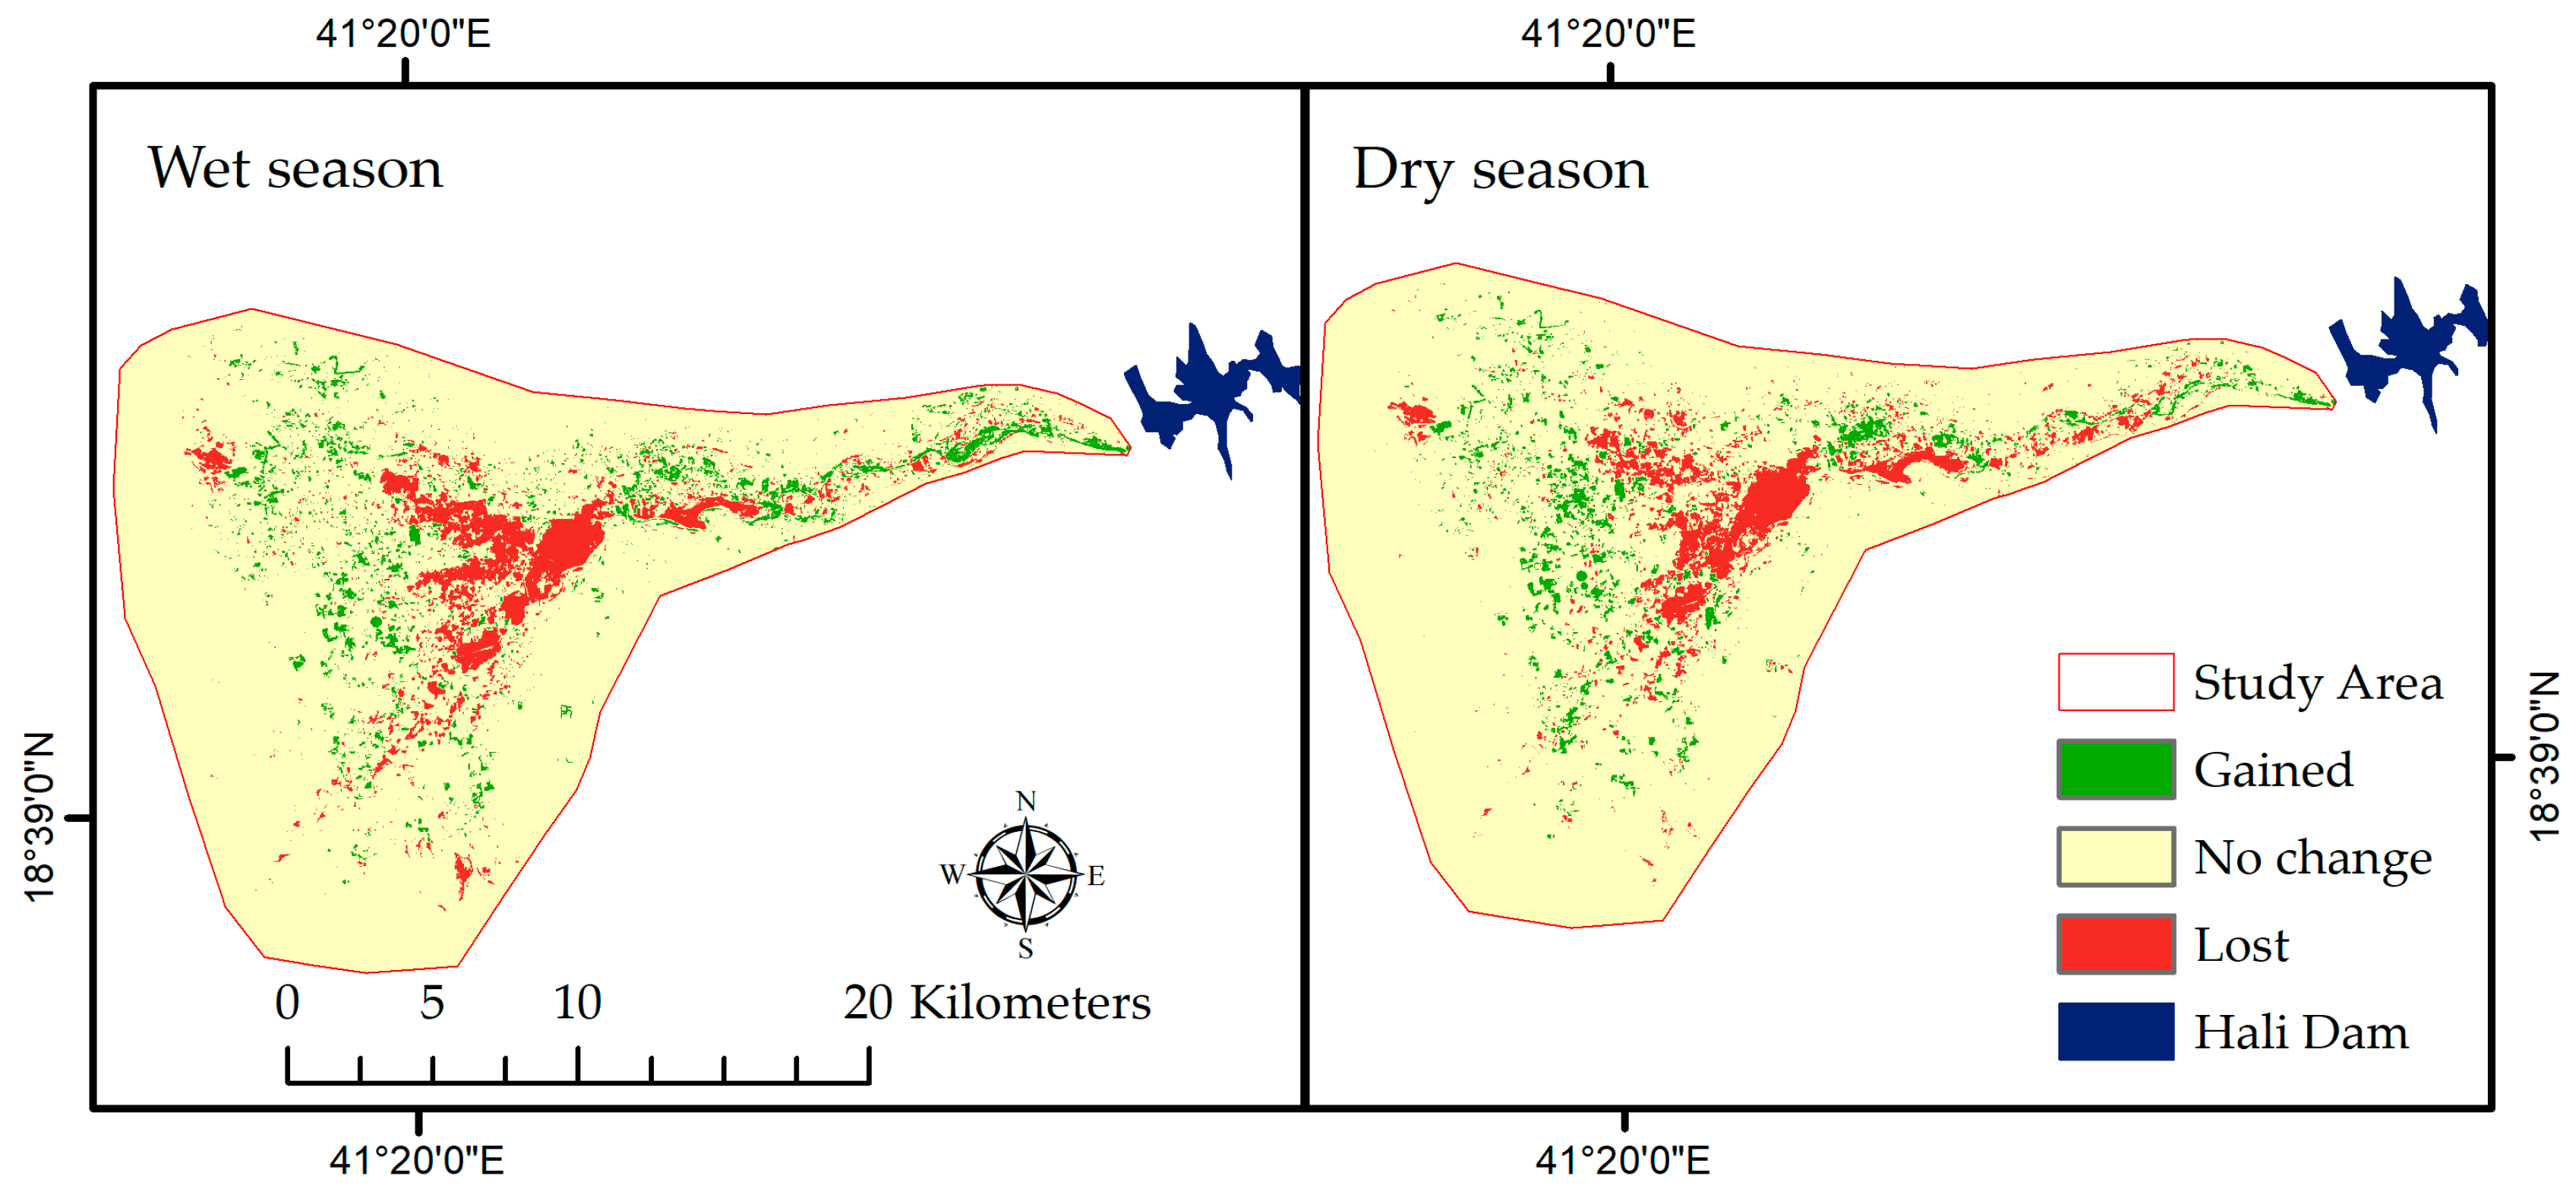
3.3. Spatial Variations of NDVI
3.4. Inter-Annual Variations of Climatic Variables
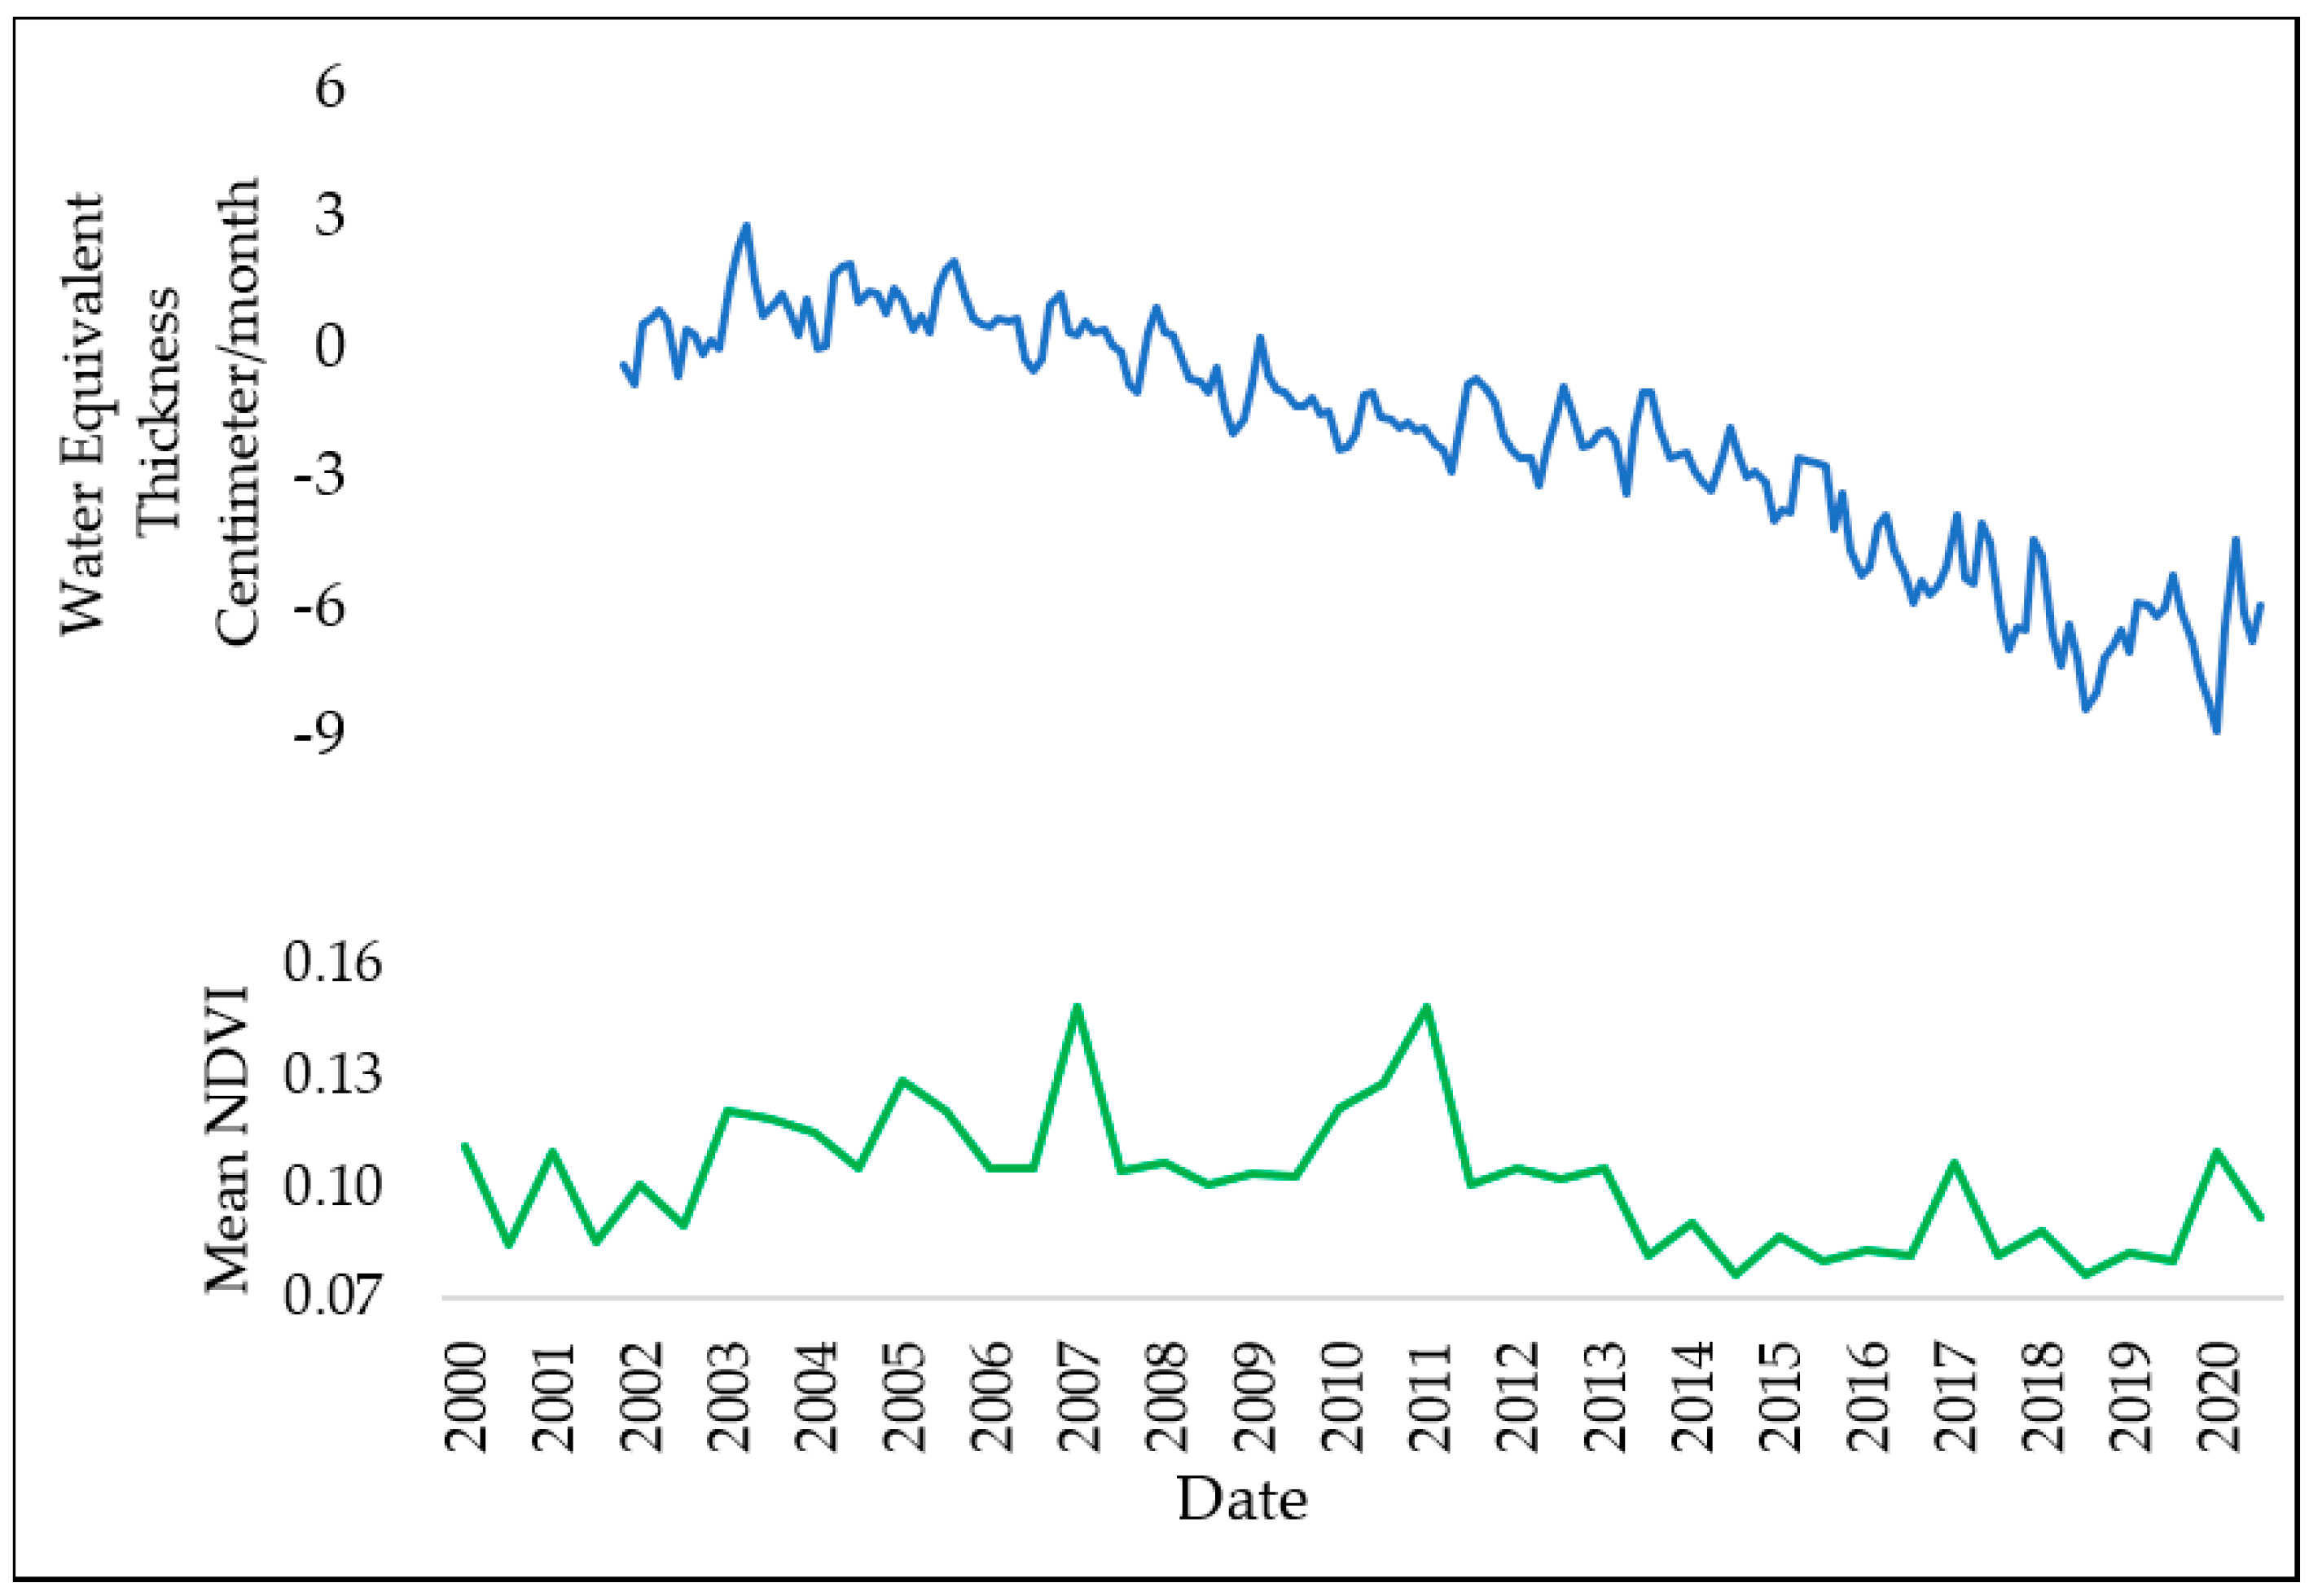
3.5. Annual Variations of EWT
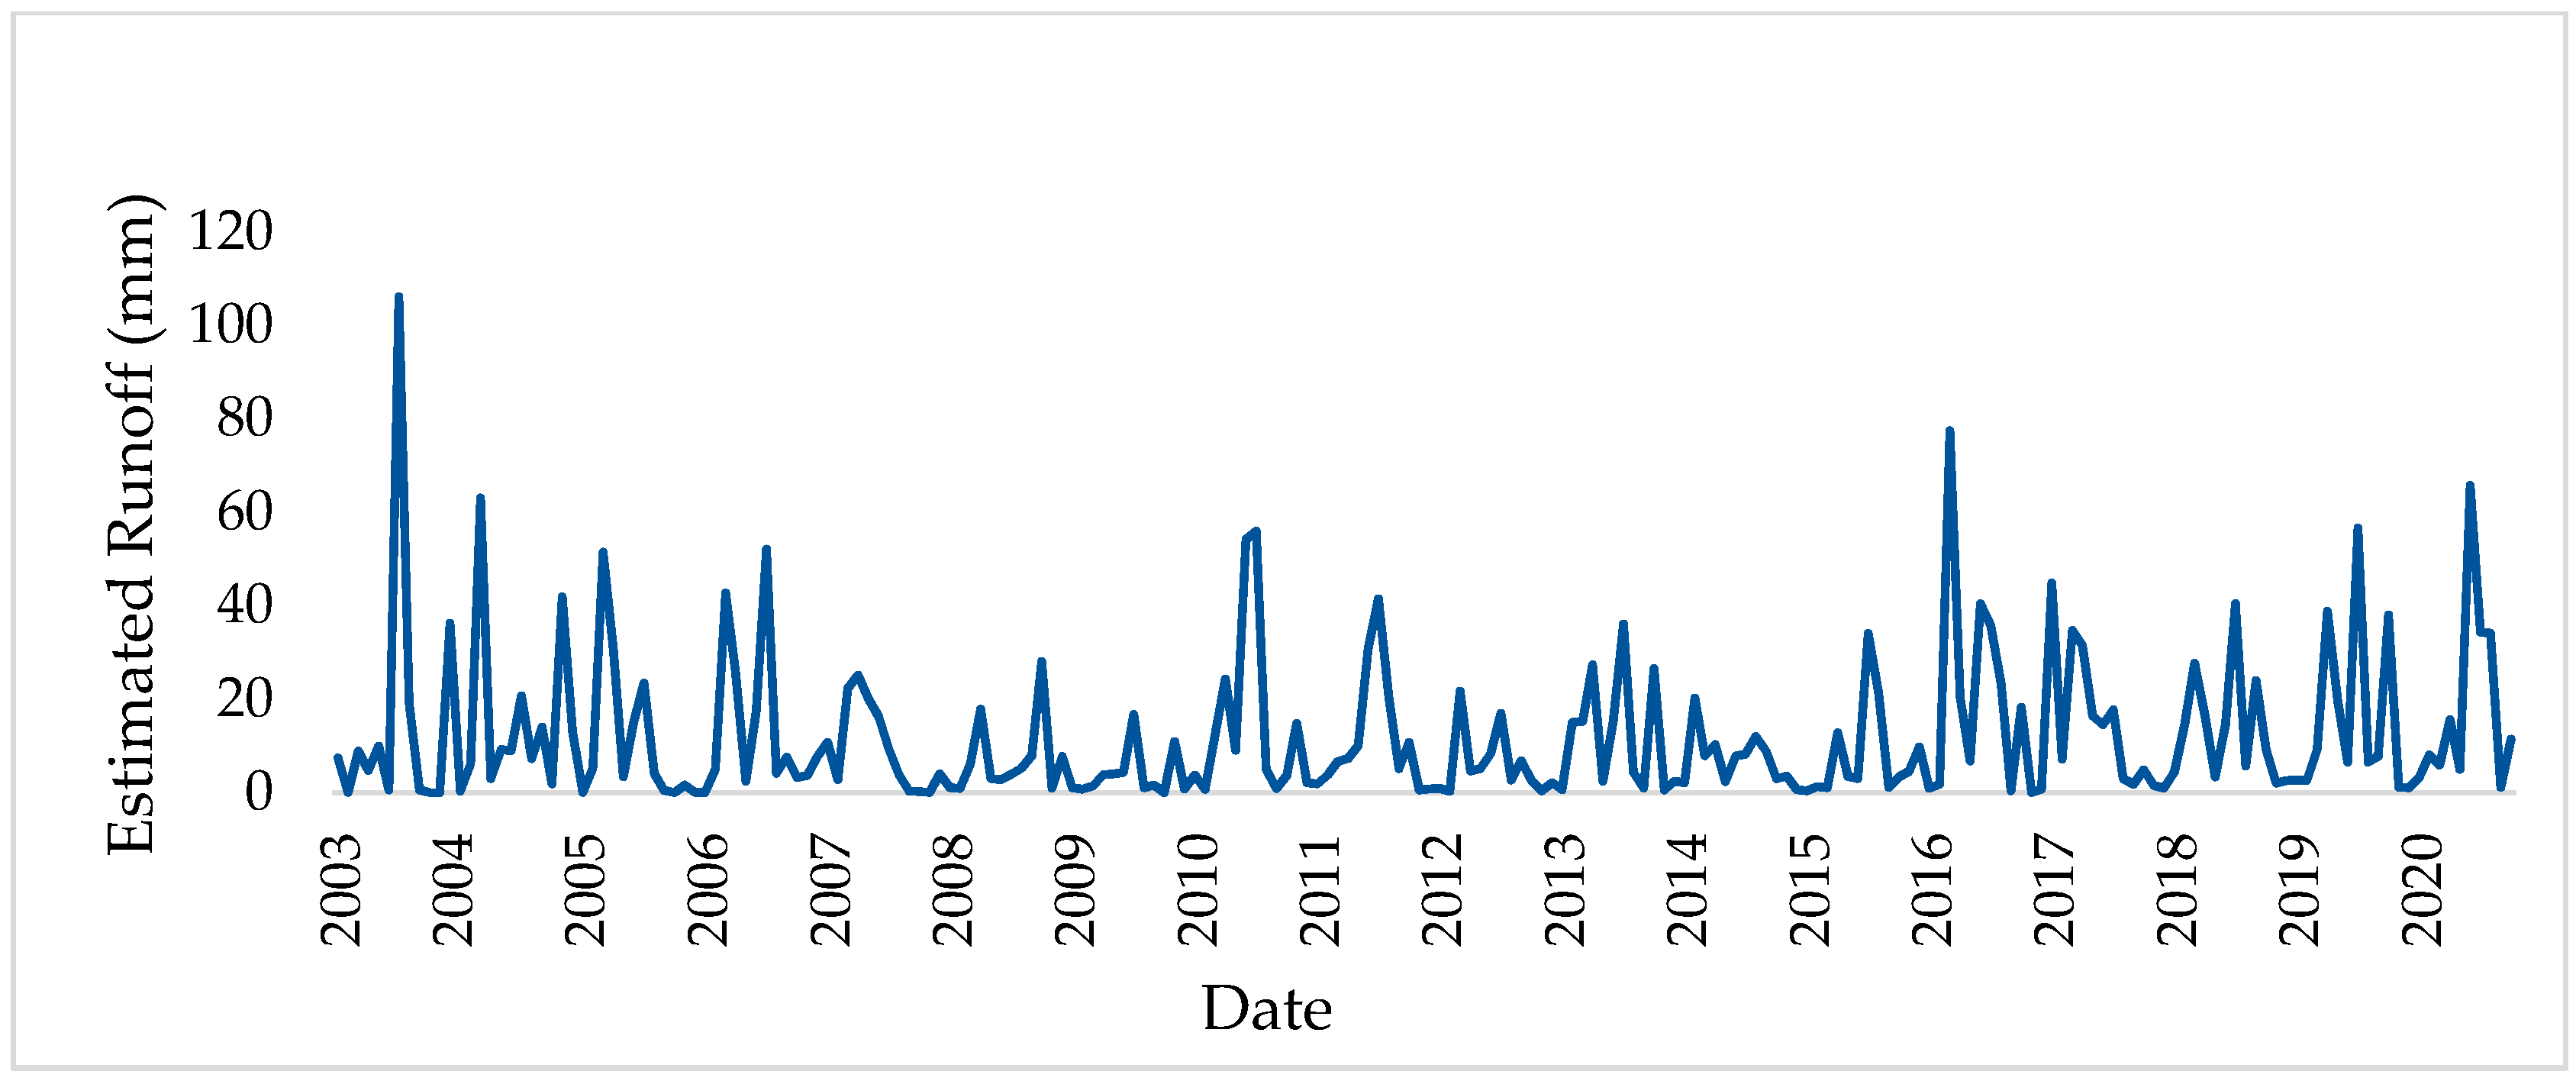
3.6. Monthly Variations of Runoff
3.7. Correlation Coefficient Analysis
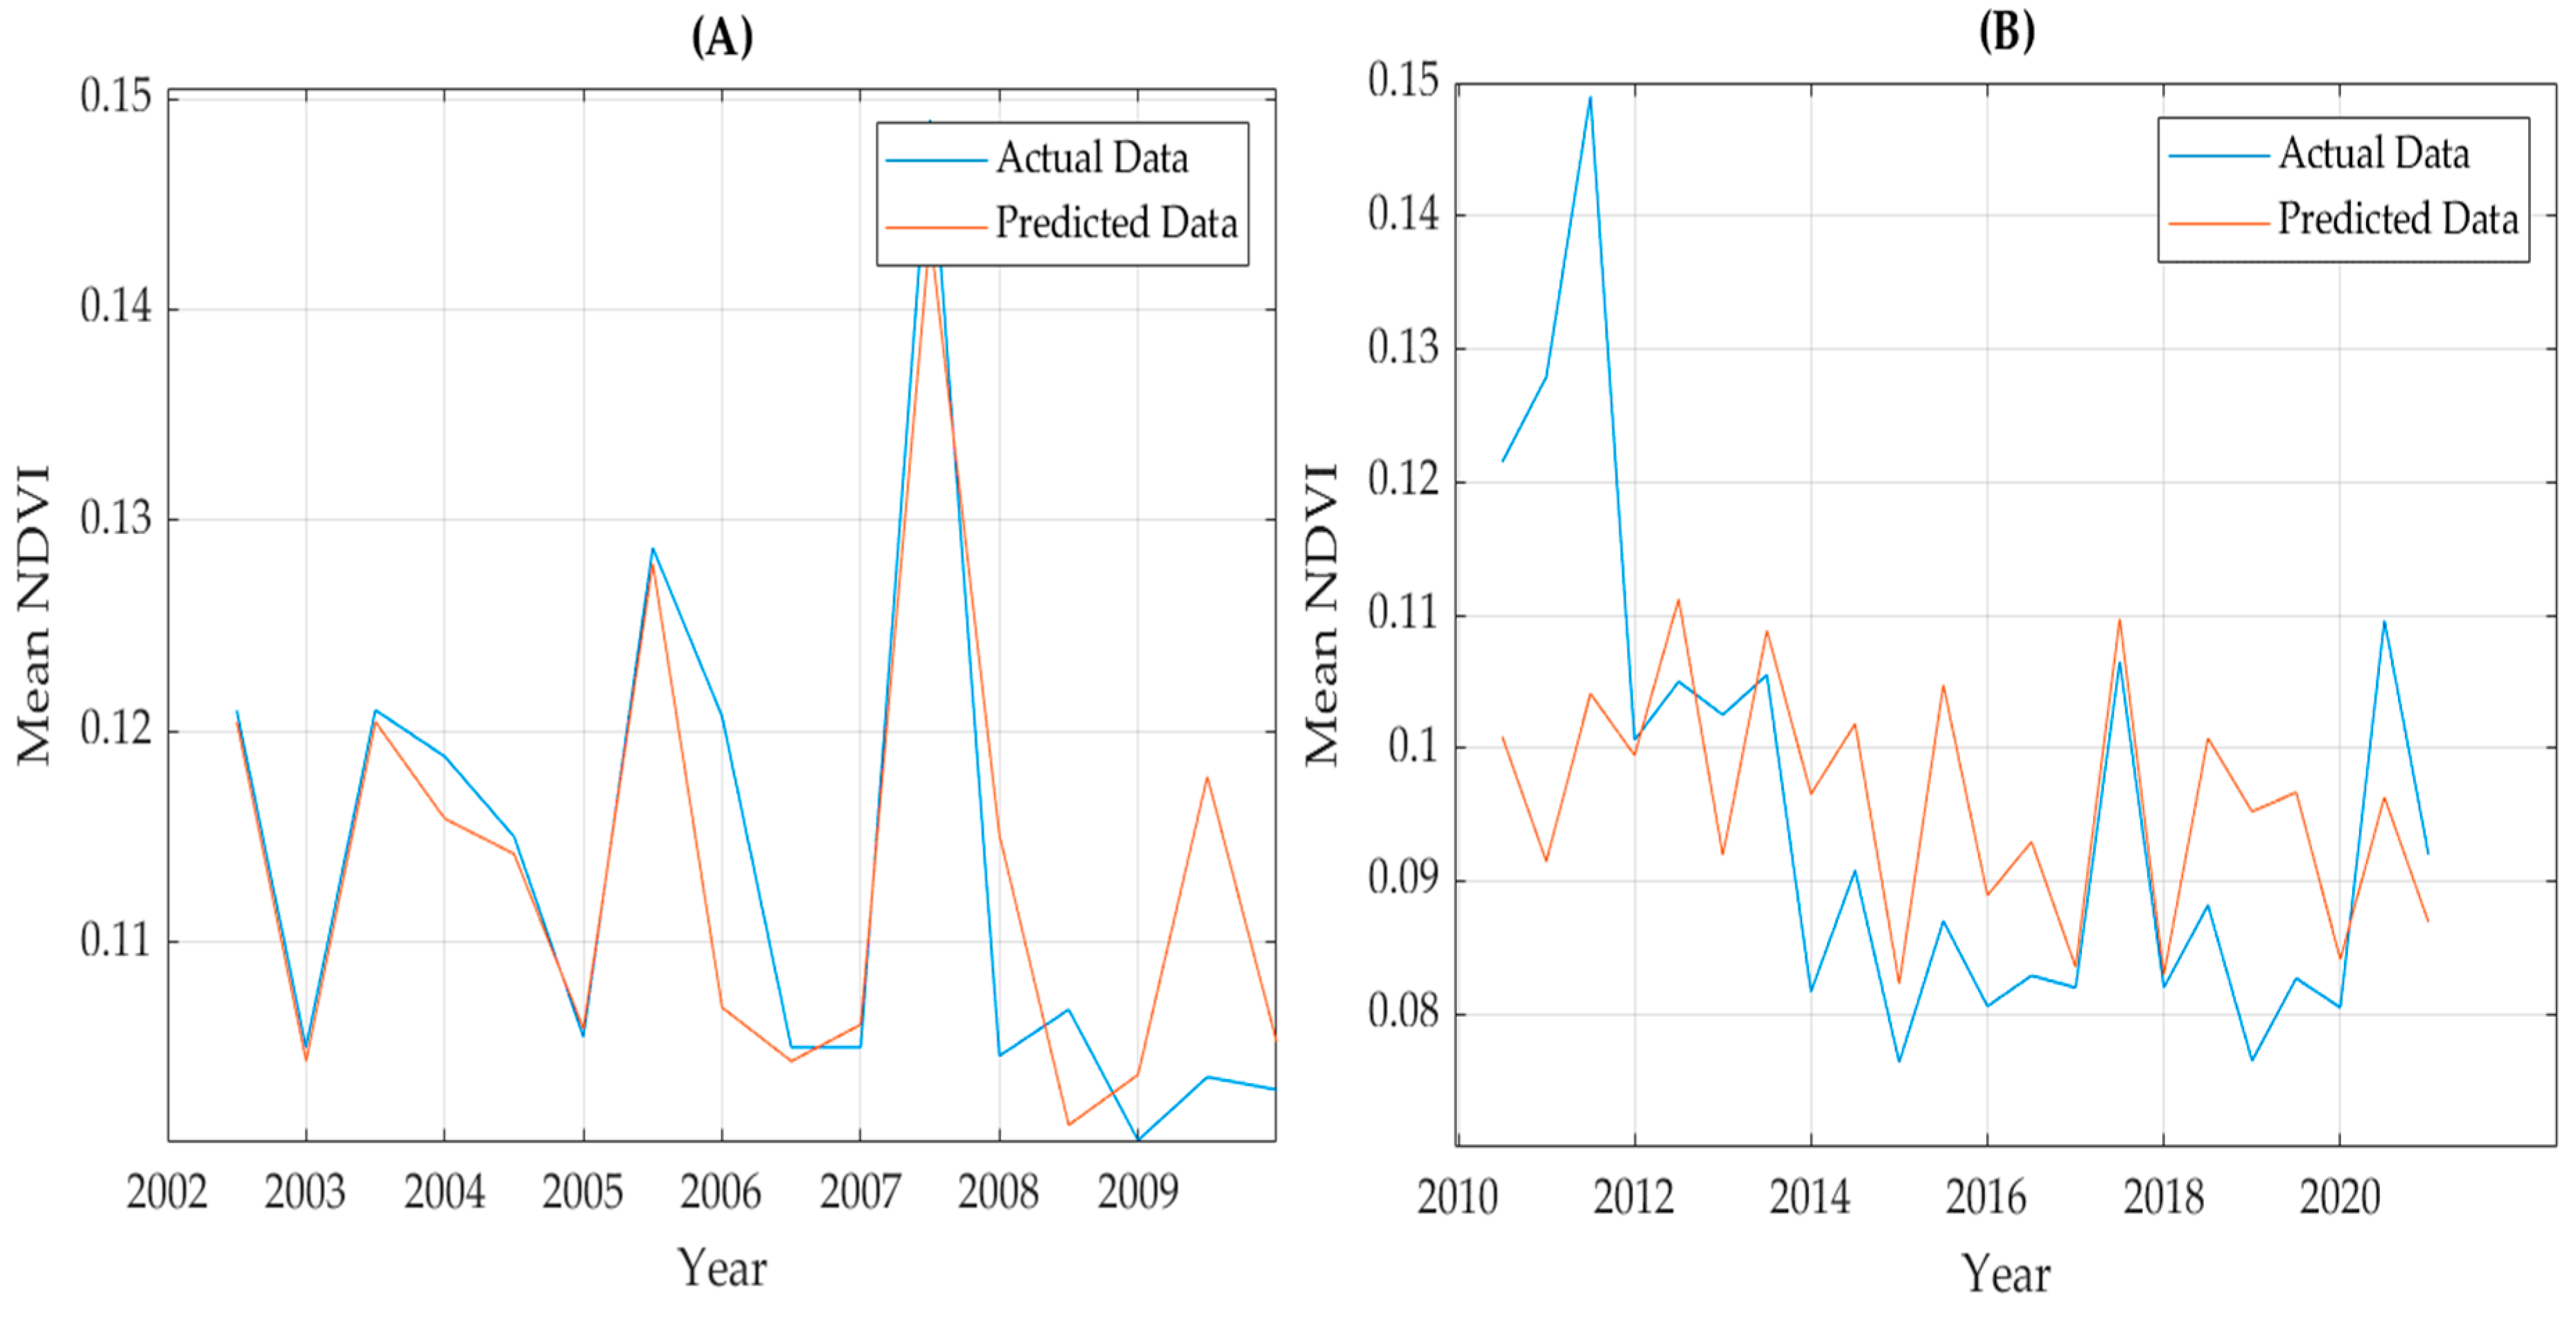
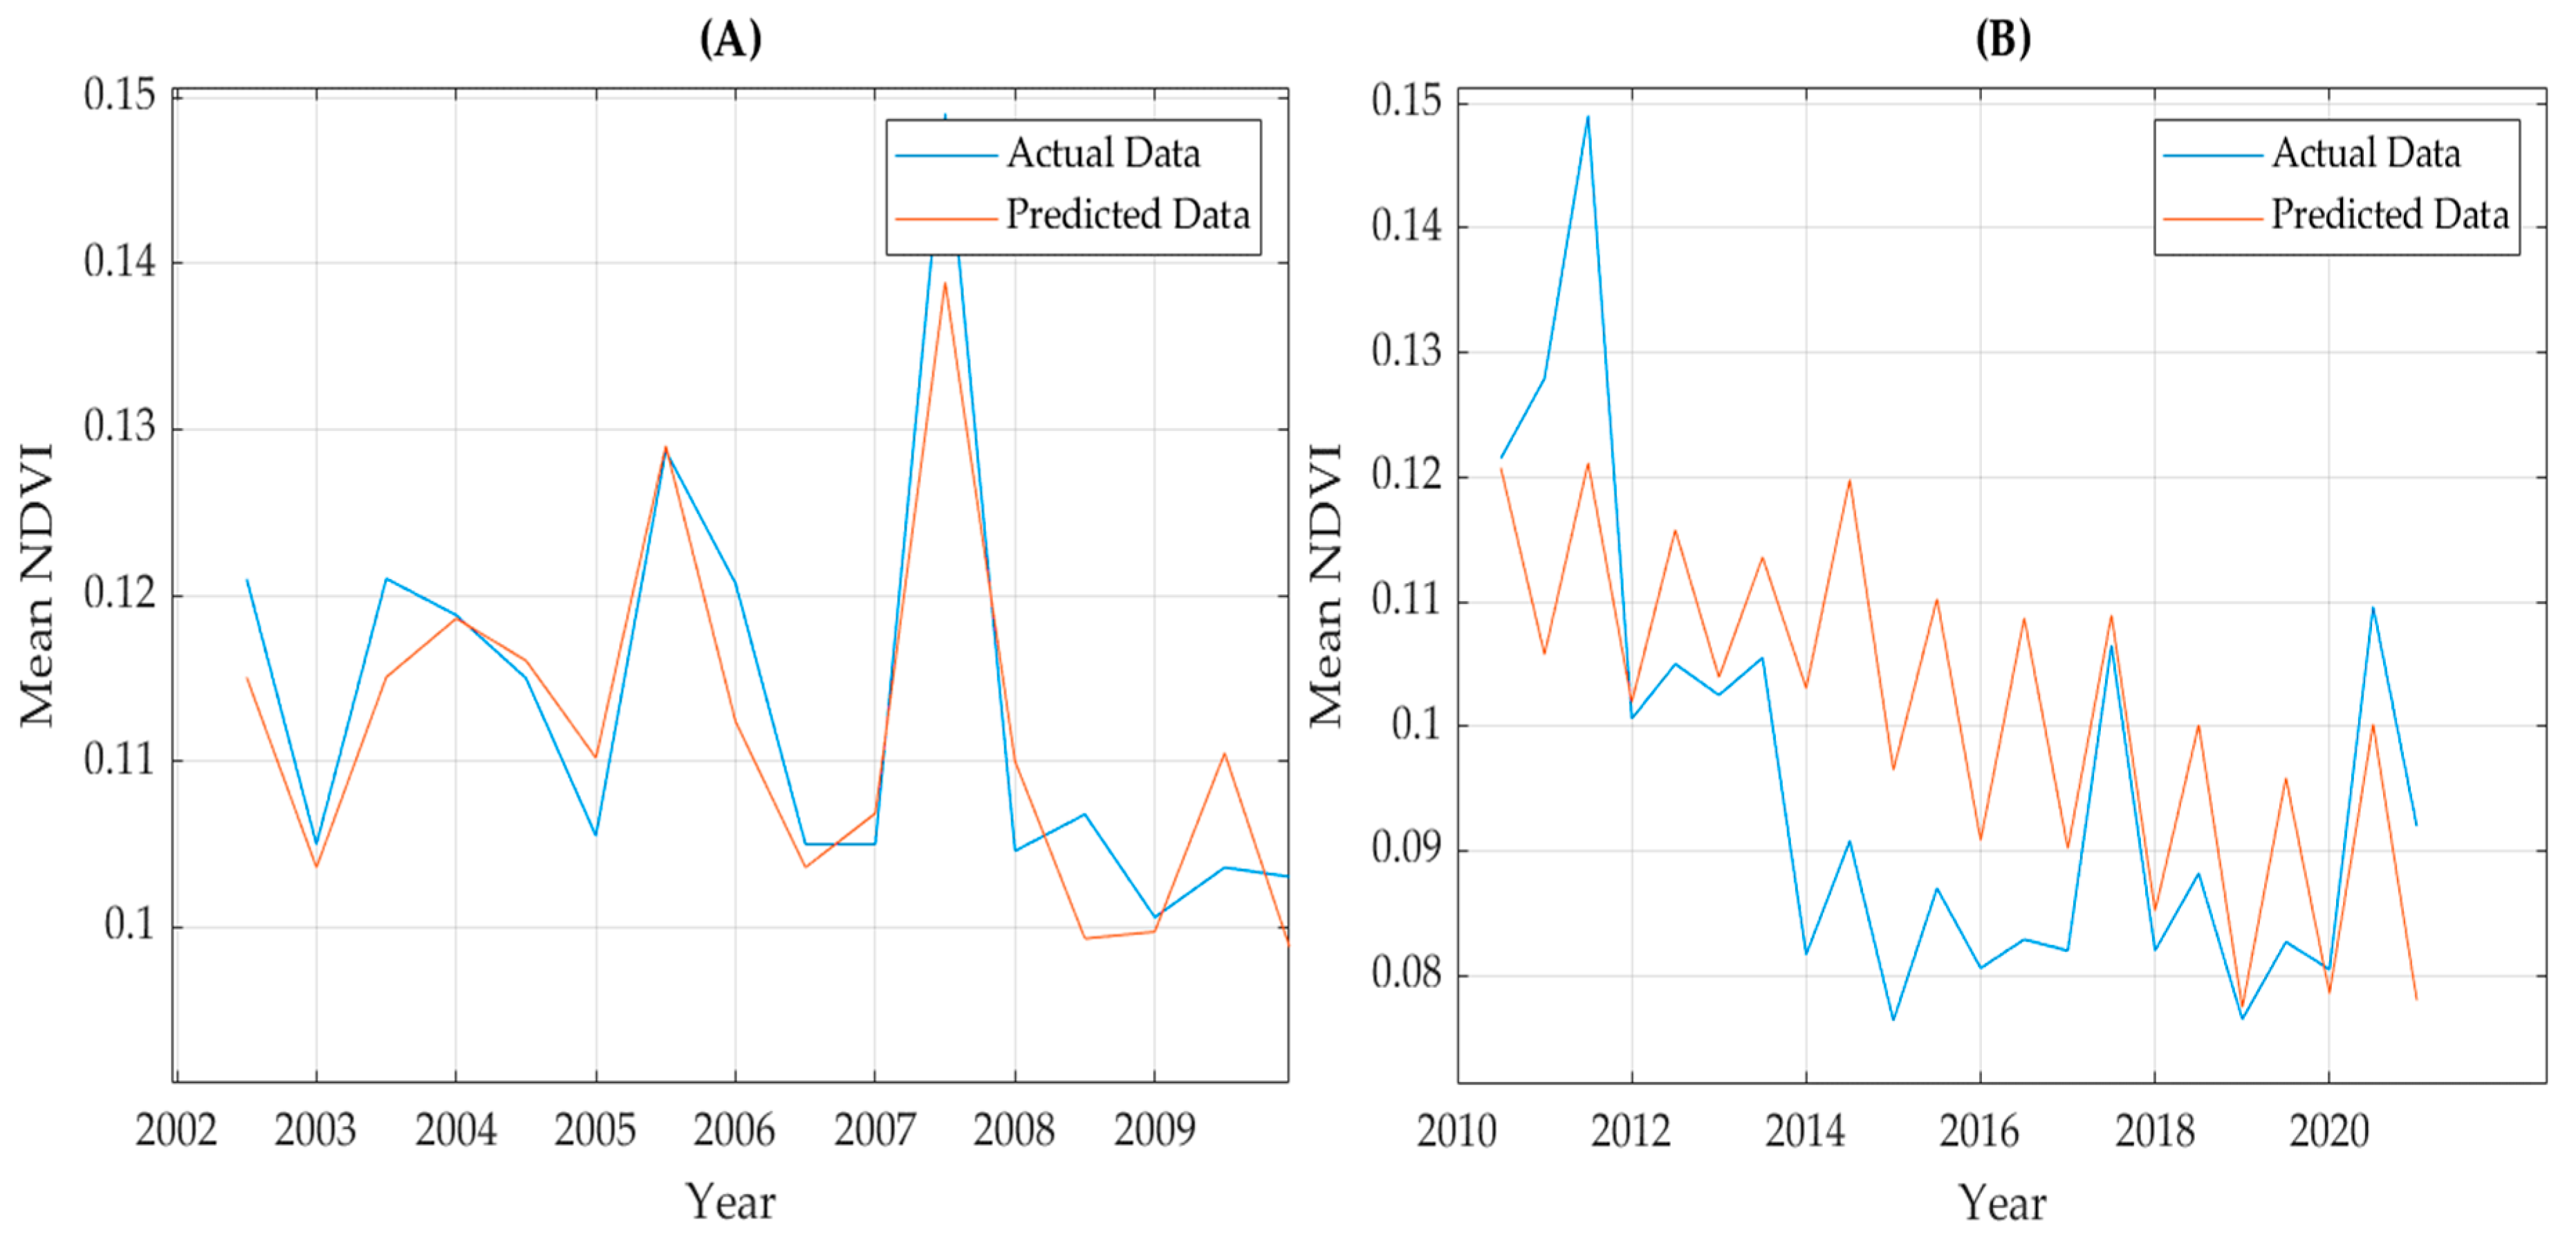
3.8. Multivariate Regression Analysis
4. Discussion
5. Conclusions
Author Contributions
Funding
Data Availability Statement
Acknowledgments
Conflicts of Interest
Abbreviations
| NDVI | Normalized Difference Vegetation Index |
| EWT | Equivalent Water Thickness |
| P | Precipitation |
| E | Evaporation |
| R | Runoff |
| MLC | Maximum Likelihood Classification |
| SPOT | Satellite Pour l’Observation de la Terre |
| LULC | Land Use Land Cover |
| GIS | Geographical Information System |
| TWS | Total Water Storage |
| GRACE | Gravity Recovery and Climate Experiment |
| USGS | United States Geological Survey |
| ERA-5 | European Centre for Medium-Range Weather Forecasts Integrated Forecasting System, the fifth-generation reanalysis |
| GLDAS | Global Land Data Assimilation System |
| NIR | Near-infrared |
| RED | Red Band |
References
- AghaKouchak, A.; Mirchi, A.; Madani, K.; Di Baldassarre, G.; Nazemi, A.; Alborzi, A.; Anjileli, H.; Azarderakhsh, M.; Chiang, F.; Hassanzadeh, E. Anthropogenic Drought: Definition, Challenges, and Opportunities; Wiley Online Library: Hoboken, NJ, USA, 2021. [Google Scholar]
- McDowell, N.; Pockman, W.T.; Allen, C.D.; Breshears, D.D.; Cobb, N.; Kolb, T.; Plaut, J.; Sperry, J.; West, A.; Williams, D.G. Mechanisms of plant survival and mortality during drought: Why do some plants survive while others succumb to drought? New Phytol. 2008, 178, 719–739. [Google Scholar] [CrossRef]
- Jiang, M.; Tian, S.; Zheng, Z.; Zhan, Q.; He, Y. Human activity influences on vegetation cover changes in Beijing, China, from 2000 to 2015. Remote Sens. 2017, 9, 271. [Google Scholar] [CrossRef]
- Hobbs, R.J.; Harris, J.A. Restoration ecology: Repairing the earth’s ecosystems in the new millennium. Restor. Ecol. 2001, 9, 239–246. [Google Scholar] [CrossRef]
- Soepboer, W.; Sugita, S.; Lotter, A.F. Regional vegetation-cover changes on the Swiss Plateau during the past two millennia: A pollen-based reconstruction using the REVEALS model. Quat. Sci. Rev. 2010, 29, 472–483. [Google Scholar] [CrossRef]
- Leavesley, G.H. Modeling the effects of climate change on water resources—A review. Clim. Chang. 1994, 28, 159–177. [Google Scholar] [CrossRef]
- Wang, J.; Rich, P.M.; Price, K.P. Temporal responses of NDVI to precipitation and temperature in the central Great Plains, USA. Int. J. Remote Sens. 2003, 24, 2345–2364. [Google Scholar] [CrossRef]
- Nageswara Rao, P.; Shobha, S.; Ramesh, K.; Somashekhar, R. Satellite-based assessment of agricultural drought in Karnataka state. J. Indian Soc. Remote Sens. 2005, 33, 429–434. [Google Scholar] [CrossRef]
- Bhandari, A.; Kumar, A.; Singh, G. Feature extraction using Normalized Difference Vegetation Index (NDVI): A case study of Jabalpur city. Procedia Technol. 2012, 6, 612–621. [Google Scholar] [CrossRef]
- Gandhi, G.M.; Parthiban, S.; Thummalu, N.; Christy, A. Ndvi: Vegetation change detection using remote sensing and gis–A case study of Vellore District. Procedia Comput. Sci. 2015, 57, 1199–1210. [Google Scholar] [CrossRef]
- Jamieson, M.A.; Trowbridge, A.M.; Raffa, K.F.; Lindroth, R.L. Consequences of climate warming and altered precipitation patterns for plant-insect and multitrophic interactions. Plant Physiol. 2012, 160, 1719–1727. [Google Scholar] [CrossRef]
- Li, L.; Ustin, S.L.; Lay, M. Application of AVIRIS data in detection of oil-induced vegetation stress and cover change at Jornada, New Mexico. Remote Sens. Environ. 2005, 94, 1–16. [Google Scholar] [CrossRef]
- Xu, Y.; Yang, J.; Chen, Y. NDVI-based vegetation responses to climate change in an arid area of China. Theor. Appl. Climatol. 2016, 126, 213–222. [Google Scholar] [CrossRef]
- Lian, X.; Piao, S.; Chen, A.; Huntingford, C.; Fu, B.; Li, L.Z.; Huang, J.; Sheffield, J.; Berg, A.M.; Keenan, T.F. Multifaceted characteristics of dryland aridity changes in a warming world. Nat. Rev. Earth Environ. 2021, 2, 232–250. [Google Scholar] [CrossRef]
- Maliva, R.; Missimer, T. Arid Lands Water Evaluation and Management; Springer Science & Business Media: Berlin/Heidelberg, Germany, 2012. [Google Scholar]
- Gaur, M.K.; Squires, V.R. Geographic Extent and Characteristics of the World’s Arid Zones and Their Peoples. In Climate Variability Impacts on Land Use and Livelihoods in Drylands; Springer: Berlin/Heidelberg, Germany, 2018; pp. 3–20. [Google Scholar]
- Foody, G. Geographical weighting as a further refinement to regression modelling: An example focused on the NDVI–rainfall relationship. Remote Sens. Environ. 2003, 88, 283–293. [Google Scholar] [CrossRef]
- Fayech, D.; Tarhouni, J. Climate variability and its effect on normalized difference vegetation index (NDVI) using remote sensing in semi-arid area. Model. Earth Syst. Environ. 2021, 7, 1667–1682. [Google Scholar] [CrossRef]
- Schmidt, H.; Karnieli, A. Remote sensing of the seasonal variability of vegetation in a semi-arid environment. J. Arid Environ. 2000, 45, 43–59. [Google Scholar] [CrossRef]
- Xie, B.; Jia, X.; Qin, Z.; Shen, J.; Chang, Q. Vegetation dynamics and climate change on the Loess Plateau, China: 1982–2011. Reg. Environ. Chang. 2016, 16, 1583–1594. [Google Scholar] [CrossRef]
- Shi, Y.; Shen, Y.; Kang, E.; Li, D.; Ding, Y.; Zhang, G.; Hu, R. Recent and future climate change in northwest China. Clim. Chang. 2007, 80, 379–393. [Google Scholar] [CrossRef]
- Zhou, W.; Gang, C.; Zhou, L.; Chen, Y.; Li, J.; Ju, W.; Odeh, I. Dynamic of grassland vegetation degradation and its quantitative assessment in the northwest China. Acta Oecol. 2014, 55, 86–96. [Google Scholar] [CrossRef]
- Tong, S.; Zhang, J.; Bao, Y.; Lai, Q.; Lian, X.; Li, N.; Bao, Y. Analyzing vegetation dynamic trend on the Mongolian Plateau based on the Hurst exponent and influencing factors from 1982–2013. J. Geogr. Sci. 2018, 28, 595–610. [Google Scholar] [CrossRef]
- Degu, A.M.; Hossain, F.; Niyogi, D.; Pielke Sr, R.; Shepherd, J.M.; Voisin, N.; Chronis, T. The influence of large dams on surrounding climate and precipitation patterns. Geophys. Res. Lett. 2011, 38, L04405. [Google Scholar] [CrossRef]
- Zhao, Y.; Liu, S.; Shi, H. Impacts of dams and reservoirs on local climate change: A global perspective. Environ. Res. Lett. 2021, 16, 104043. [Google Scholar] [CrossRef]
- Chen, P. Material Science and Environmental Engineering: Proceedings of the 3rd Annual 2015 International Conference on Material Science and Environmental Engineering (ICMSEE2015, Wuhan, Hubei, China, 5–6 June 2015); CRC Press: Boca Raton, FL, USA, 2015. [Google Scholar]
- Miller, N.L.; Jin, J.; Tsang, C.F. Local climate sensitivity of the Three Gorges Dam. Geophys. Res. Lett. 2005, 32, L16704. [Google Scholar] [CrossRef]
- Wu, L.; Zhang, Q.; Jiang, Z. Three Gorges Dam affects regional precipitation. Geophys. Res. Lett. 2006, 33, L13806. [Google Scholar] [CrossRef]
- Missimer, T.M.; Drewes, J.E.; Amy, G.; Maliva, R.G.; Keller, S. Restoration of wadi aquifers by artificial recharge with treated waste water. Groundwater 2012, 50, 514–527. [Google Scholar] [CrossRef]
- Tarawneh, Q.Y.; Chowdhury, S. Trends of climate change in Saudi Arabia: Implications on water resources. Climate 2018, 6, 8. [Google Scholar] [CrossRef]
- Almalki, R.; Khaki, M.; Saco, P.M.; Rodriguez, J.F. Monitoring and Mapping Vegetation Cover Changes in Arid and Semi-Arid Areas Using Remote Sensing Technology: A Review. Remote Sens. 2022, 14, 5143. [Google Scholar] [CrossRef]
- Belal, A.-A.; El-Ramady, H.R.; Mohamed, E.S.; Saleh, A.M. Drought risk assessment using remote sensing and GIS techniques. Arab. J. Geosci. 2014, 7, 35–53. [Google Scholar] [CrossRef]
- Ahmed, S. Assessment of urban heat islands and impact of climate change on socioeconomic over Suez Governorate using remote sensing and GIS techniques. Egypt. J. Remote Sens. Space Sci. 2018, 21, 15–25. [Google Scholar] [CrossRef]
- Hu, M.Q.; Mao, F.; Sun, H.; Hou, Y.Y. Study of normalized difference vegetation index variation and its correlation with climate factors in the three-river-source region. Int. J. Appl. Earth Obs. Geoinf. 2011, 13, 24–33. [Google Scholar] [CrossRef]
- Srivastava, S.; Jayaraman, V.; Nageswara Rao, P.; Manikiam, B.; Chandrasekhar, M. Interlinkages of NOAA/AVHRR derived integrated NDVI to seasonal precipitation and transpiration in dryland tropics. Int. J. Remote Sens. 1997, 18, 2931–2952. [Google Scholar] [CrossRef]
- Ji, L.; Peters, A.J. A spatial regression procedure for evaluating the relationship between AVHRR-NDVI and climate in the northern Great Plains. Int. J. Remote Sens. 2004, 25, 297–311. [Google Scholar] [CrossRef]
- Tangdamrongsub, N.; Han, S.-C.; Jasinski, M.F.; Šprlák, M. Quantifying water storage change and land subsidence induced by reservoir impoundment using GRACE, Landsat, and GPS data. Remote Sens. Environ. 2019, 233, 111385. [Google Scholar] [CrossRef]
- Alshehri, F.; Mohamed, A. Analysis of Groundwater Storage Fluctuations Using GRACE and Remote Sensing Data in Wadi As-Sirhan, Northern Saudi Arabia. Water 2023, 15, 282. [Google Scholar] [CrossRef]
- Alarifi, S.S.; Abdelkareem, M.; Abdalla, F.; Alotaibi, M. Flash Flood Hazard Mapping Using Remote Sensing and GIS Techniques in Southwestern Saudi Arabia. Sustainability 2022, 14, 14145. [Google Scholar] [CrossRef]
- Hasanean, H.; Almazroui, M. Rainfall: Features and variations over Saudi Arabia, a review. Climate 2015, 3, 578–626. [Google Scholar] [CrossRef]
- Zhong, L.; Ma, Y.; Hu, Z.; Fu, Y.; Hu, Y.; Wang, X.; Cheng, M.; Ge, N. Estimation of hourly land surface heat fluxes over the Tibetan Plateau by the combined use of geostationary and polar-orbiting satellites. Atmos. Chem. Phys. 2019, 19, 5529–5541. [Google Scholar] [CrossRef]
- Xie, Z.; Huete, A.; Cleverly, J.; Phinn, S.; McDonald-Madden, E.; Cao, Y.; Qin, F. Multi-climate mode interactions drive hydrological and vegetation responses to hydroclimatic extremes in Australia. Remote Sens. Environ. 2019, 231, 111270. [Google Scholar] [CrossRef]
- Borsa, A.A.; Agnew, D.C.; Cayan, D.R. Ongoing drought-induced uplift in the western United States. Science 2014, 345, 1587–1590. [Google Scholar] [CrossRef]
- Otukei, J.R.; Blaschke, T. Land cover change assessment using decision trees, support vector machines and maximum likelihood classification algorithms. Int. J. Appl. Earth Obs. Geoinf. 2010, 12, S27–S31. [Google Scholar] [CrossRef]
- Richards, J.A.; Richards, J. Remote Sensing Digital Image Analysis; Springer: Berlin/Heidelberg, Germany, 1999; Volume 3. [Google Scholar]
- Mohajane, M.; Essahlaoui, A.; Oudija, F.; Hafyani, M.E.; Hmaidi, A.E.; Ouali, A.E.; Randazzo, G.; Teodoro, A.C. Land use/land cover (LULC) using landsat data series (MSS, TM, ETM+ and OLI) in Azrou Forest, in the Central Middle Atlas of Morocco. Environments 2018, 5, 131. [Google Scholar] [CrossRef]
- Zaidi, S.M.; Akbari, A.; Abu Samah, A.; Kong, N.S.; Gisen, A.; Isabella, J. Landsat-5 Time Series Analysis for Land Use/Land Cover Change Detection Using NDVI and Semi-Supervised Classification Techniques. Pol. J. Environ. Stud. 2017, 26, 2833–2840. [Google Scholar] [CrossRef] [PubMed]
- Munier, S.; Aires, F.; Schlaffer, S.; Prigent, C.; Papa, F.; Maisongrande, P.; Pan, M. Combining data sets of satellite-retrieved products for basin-scale water balance study: 2. Evaluation on the Mississippi Basin and closure correction model. J. Geophys. Res. Atmos. 2014, 119, 12–100. [Google Scholar] [CrossRef]
- Sheffield, J.; Ferguson, C.R.; Troy, T.J.; Wood, E.F.; McCabe, M.F. Closing the terrestrial water budget from satellite remote sensing. Geophys. Res. Lett. 2009, 36, L07403. [Google Scholar] [CrossRef]
- Tranmer, M.; Elliot, M. Multiple linear regression. Cathie Marsh Cent. Census Surv. Res. 2008, 5, 1–5. [Google Scholar]
- Morgounov, A.; Abubakr, M.; Alhendi, A.; Alkhatran, A.; Alhuwaymil, H.; Ghosh, K. Agroclimatic Zones and Cropping Systems in the Southwestern Regions of the Kingdom of Saudi Arabia: Characterization, Classification and Improvement Potential. Crops 2022, 2, 186–201. [Google Scholar] [CrossRef]
- Guarino, L.; Al-Juwaeid, A.A. Wheat Collecting in Saudi Arabia. In 2 Food and Agriculture Organization of the United Nations@ Organisation Des Nations Unies Pour L’alimentation Et L’agriculture Organizacion De Las Naciones Unidas Para La Agricultura Y La Alimentacion; Food and Agriculture Organization: Rome, Italy, 1990; Volume 36. [Google Scholar]
- Congalton, R.G. A review of assessing the accuracy of classifications of remotely sensed data. Remote Sens. Environ. 1991, 37, 35–46. [Google Scholar] [CrossRef]
- Dehwah, A.H.; Al-Mashharawi, S.; Missimer, T.M. Mapping to assess feasibility of using subsurface intakes for SWRO, Red Sea coast of Saudi Arabia. Desalination Water Treat. 2014, 52, 2351–2361. [Google Scholar] [CrossRef]
- Lopez, O.; Stenchikov, G.; Missimer, T. Water management during climate change using aquifer storage and recovery of stormwater in a dunefield in western Saudi Arabia. Environ. Res. Lett. 2014, 9, 075008. [Google Scholar] [CrossRef]
- Almazroui, M.; Nazrul Islam, M.; Athar, H.; Jones, P.; Rahman, M.A. Recent climate change in the Arabian Peninsula: Annual rainfall and temperature analysis of Saudi Arabia for 1978–2009. Int. J. Climatol. 2012, 32, 953–966. [Google Scholar] [CrossRef]
- Almazroui, M. Changes in temperature trends and extremes over Saudi Arabia for the period 1978–2019. Adv. Meteorol. 2020, 2020, 8828421. [Google Scholar] [CrossRef]
- Sehler, R.; Li, J.; Reager, J.; Ye, H. Investigating relationship between soil moisture and precipitation globally using remote sensing observations. J. Contemp. Water Res. Educ. 2019, 168, 106–118. [Google Scholar] [CrossRef]
- Guillod, B.P.; Orlowsky, B.; Miralles, D.G.; Teuling, A.J.; Seneviratne, S.I. Reconciling spatial and temporal soil moisture effects on afternoon rainfall. Nat. Commun. 2015, 6, 6443. [Google Scholar] [CrossRef]
- Alrwis, K.N.; Ghanem, A.M.; Alnashwan, O.S.; Al Duwais, A.A.M.; Alaagib, S.A.B.; Aldawdahi, N.M. Measuring the impact of water scarcity on agricultural economic development in Saudi Arabia. Saudi J. Biol. Sci. 2021, 28, 191–195. [Google Scholar] [CrossRef]
- Şen, Z.; Al Alsheikh, A.; Al-Turbak, A.; Al-Bassam, A.; Al-Dakheel, A. Climate change impact and runoff harvesting in arid regions. Arab. J. Geosci. 2013, 6, 287–295. [Google Scholar] [CrossRef]
- Almazroui, M. Rainfall trends and extremes in Saudi Arabia in recent decades. Atmosphere 2020, 11, 964. [Google Scholar] [CrossRef]
- Liu, B.; Zou, X.; Yi, S.; Sneeuw, N.; Cai, J.; Li, J. Identifying and separating climate-and human-driven water storage anomalies using GRACE satellite data. Remote Sens. Environ. 2021, 263, 112559. [Google Scholar] [CrossRef]
- Yang, X.-D.; Ali, A.; Xu, Y.-L.; Jiang, L.-M.; Lv, G.-H. Soil moisture and salinity as main drivers of soil respiration across natural xeromorphic vegetation and agricultural lands in an arid desert region. Catena 2019, 177, 126–133. [Google Scholar] [CrossRef]
- Sallam, A.; Bader Alharbi, A.; Usman, A.R.; Hussain, Q.; Ok, Y.S.; Alshayaa, M.; Al-Wabel, M. Environmental consequences of dam construction: A case study from Saudi Arabia. Arab. J. Geosci. 2018, 11, 47. [Google Scholar] [CrossRef]
- Khalifa, H.; Moussa, H. Soil and agriculture after the Aswan High Dam. In Irrigated Agriculture in Egypt: Past, Present and Future; Spinger: Berlin/Heidelberg, Germany, 2017; pp. 81–124. ISBN 978-3-319-30216-4. [Google Scholar] [CrossRef]
- Chowdhury, S.; Al-Zahrani, M. Reuse of treated wastewater in Saudi Arabia: An assessment framework. J. Water Reuse Desalination 2013, 3, 297–314. [Google Scholar] [CrossRef]
- Abderrahman, W.; Al-Harazin, I. Assessment of Climate Changes on Water Resources in the Kingdom of Saudi Arabia, GCC Environment and Sustainable Development Symposium, 28–30 January 2008, Dhahran, Saudi Arabia; Wiley Online Library: Hoboken, NJ, USA, 2008; pp. D-1-1–D-1-13. [Google Scholar]
- Mallick, J.; AlMesfer, M.K.; Singh, V.P.; Falqi, I.I.; Singh, C.K.; Alsubih, M.; Kahla, N.B. Evaluating the NDVI–rainfall relationship in Bisha watershed, Saudi Arabia using non-stationary modeling technique. Atmosphere 2021, 12, 593. [Google Scholar] [CrossRef]
- IWMI. Strategy 2014–2018—Solutions for a Water-Secure World; International Water Management Institute Colombo: Battaramulla, Sri Lanka, 2014. [Google Scholar]
- Tangdamrongsub, N.; Han, S.-C.; Decker, M.; Yeo, I.-Y.; Kim, H. On the use of the GRACE normal equation of inter-satellite tracking data for estimation of soil moisture and groundwater in Australia. Hydrol. Earth Syst. Sci. 2018, 22, 1811–1829. [Google Scholar] [CrossRef]
- Pan, Y.; Zhang, C.; Gong, H.; Yeh, P.J.F.; Shen, Y.; Guo, Y.; Huang, Z.; Li, X. Detection of human-induced evapotranspiration using GRACE satellite observations in the Haihe River basin of China. Geophys. Res. Lett. 2017, 44, 190–199. [Google Scholar] [CrossRef]
- Almalki, R.; Piwowar, J.; Siemer, J. Geographical considerations in site selection for small modular reactors in Saskatchewan. Geosciences 2019, 9, 402. [Google Scholar] [CrossRef]


| Year | Wet Season | Dry Season | Year | Wet Season | Dry Season |
|---|---|---|---|---|---|
| 2000 | 81% | 73% | 2011 | 73% | 80% |
| 2001 | 73% | 73% | 2012 | 76% | 92% |
| 2002 | 72% | 80% | 2013 | 74% | 82% |
| 2003 | 75% | 72% | 2014 | 71% | 80% |
| 2004 | 79% | 80% | 2015 | 76% | 81% |
| 2005 | 78% | 78% | 2016 | 80% | 82% |
| 2006 | 76% | 76% | 2017 | 78% | 78% |
| 2007 | 78% | 73% | 2018 | 74% | 80% |
| 2008 | 75% | 79% | 2019 | 92% | 87% |
| 2009 | 74% | 75% | 2020 | 81% | 87% |
| 2010 | 71% | 77% |
| Before Dam Construction: Wet Season | ||||||||||
| Precipitation | Evaporation | Temperature | Humidity | EWT | ||||||
| R | P | R | P | R | P | R | P | R | P | |
| Natural vegetation area | 0.77 | 0.009 | −0.77 | 0.009 | −0.36 | 0.312 | −0.05 | 0.989 | 0.1 | 0.82 |
| Croplands area | 0.66 | 0.039 | −0.58 | 0.082 | −0.33 | 0.353 | −0.08 | 0.822 | −0.3 | 0.467 |
| Mean NDVI | 0.8 | 0.005 | −0.76 | 0.011 | −0.14 | 0.708 | 0.42 | 0.232 | 0.24 | 0.566 |
| After Dam Construction: Wet Season | ||||||||||
| Precipitation | Evaporation | Temperature | Humidity | EWT | ||||||
| R | P | R | P | R | P | R | P | R | P | |
| Natural vegetation area | 0.04 | 0.899 | 0.41 | 0.207 | 0.03 | 0.941 | −0.52 | 0.103 | 0.57 | 0.065 |
| Croplands area | 0.04 | 0.916 | 0.29 | 0.382 | 0.22 | 0.516 | 0.62 | 0.04 | −0.66 | 0.023 |
| Mean NDVI | 0.03 | 0.927 | 0.2 | 0.557 | −0.13 | 0.697 | −0.17 | 0.612 | 0.5 | 0.157 |
| Before Dam Construction: Dry Season | ||||||||||
| Precipitation | Evaporation | Temperature | Humidity | EWT | ||||||
| R | P | R | P | R | P | R | P | R | P | |
| Natural vegetation area | 0.28 | 0.43 | 0.45 | 0.188 | 0.72 | 0.019 | 0.25 | 0.477 | 0.34 | 0.125 |
| Croplands area | −0.25 | 0.487 | 0.23 | 0.524 | 0.54 | 0.33 | −0.56 | 0.092 | −0.5 | 0.204 |
| Mean NDVI | −0.07 | 0.851 | −0.1 | 0.775 | 0.56 | 0.09 | 0.13 | 0.704 | 0.11 | 0.79 |
| After Dam Construction: Dry Season | ||||||||||
| Precipitation | Evaporation | Temperature | Humidity | EWT | ||||||
| R | P | R | P | R | P | R | P | R | P | |
| Natural vegetation area | 0.12 | 0.715 | −0.1 | 0.762 | −0.28 | 0.4 | 0.29 | 0.376 | 0.48 | 0.276 |
| Croplands area | 0.11 | 0.74 | −0.05 | 0.893 | 0.42 | 0.199 | 0.38 | 0.245 | −0.49 | 0.155 |
| Mean NDVI | −0.17 | 0.626 | 0.27 | 0.428 | −0.18 | 0.595 | −0.28 | 0.395 | 0.5 | 0.143 |
Disclaimer/Publisher’s Note: The statements, opinions and data contained in all publications are solely those of the individual author(s) and contributor(s) and not of MDPI and/or the editor(s). MDPI and/or the editor(s) disclaim responsibility for any injury to people or property resulting from any ideas, methods, instructions or products referred to in the content. |
© 2023 by the authors. Licensee MDPI, Basel, Switzerland. This article is an open access article distributed under the terms and conditions of the Creative Commons Attribution (CC BY) license (https://creativecommons.org/licenses/by/4.0/).
Share and Cite
Almalki, R.; Khaki, M.; Saco, P.M.; Rodriguez, J.F. The Impact of Dam Construction on Downstream Vegetation Area in Dry Areas Using Satellite Remote Sensing: A Case Study. Remote Sens. 2023, 15, 5252. https://doi.org/10.3390/rs15215252
Almalki R, Khaki M, Saco PM, Rodriguez JF. The Impact of Dam Construction on Downstream Vegetation Area in Dry Areas Using Satellite Remote Sensing: A Case Study. Remote Sensing. 2023; 15(21):5252. https://doi.org/10.3390/rs15215252
Chicago/Turabian StyleAlmalki, Raid, Mehdi Khaki, Patricia M. Saco, and Jose F. Rodriguez. 2023. "The Impact of Dam Construction on Downstream Vegetation Area in Dry Areas Using Satellite Remote Sensing: A Case Study" Remote Sensing 15, no. 21: 5252. https://doi.org/10.3390/rs15215252