Communication

GPU-Accelerated Monte Carlo Simulation for a Single-Photon Underwater Lidar

State Key Laboratory of Marine Environmental Science, College of Ocean and Earth Sciences, Xiamen University, Xiamen 361102, China
*
Author to whom correspondence should be addressed.
Remote Sens. 2023, 15(21), 5245; https://doi.org/10.3390/rs15215245
Submission received: 18 September 2023 / Revised: 24 October 2023 / Accepted: 3 November 2023 / Published: 5 November 2023
(This article belongs to the Special Issue Recent Advances in Underwater and Terrestrial Remote Sensing)

Abstract

:
The Monte Carlo (MC) simulation, due to its ability to accurately simulate the backscattered signal of lidar, plays a crucial role in the design, optimization, and interpretation of the backscattered signal in lidar systems. Despite the development of several MC models for lidars, a suitable MC simulation model for underwater single-photon lidar, which is a vital ocean remote sensing technique utilized in underwater scientific investigations, obstacle avoidance for underwater platforms, and deep-sea environmental exploration, is still lacking. There are two main challenges in underwater lidar simulation. Firstly, the simulation results are significantly affected by near-field abnormal signals. Secondly, the simulation process is time-consuming due to the requirement of a high number of random processes to obtain reliable results. To address these issues, an algorithm is proposed to minimize the impacts of abnormal simulation signals. Additionally, a graphics processing unit (GPU)-accelerated semi-analytic MC simulation with a compute unified device architecture is proposed. The performance of the GPU-based program was validated using 109 photons and compared to a central processing unit (CPU)-based program. The GPU-based program achieved up to 68 times higher efficiency and a maximum relative deviation of less than 1.5%. Subsequently, the MC model was employed to simulate the backscattered signal in inhomogeneous water using the Henyey–Greenstein phase functions. By utilizing the look-up table method, simulations of backscattered signals were achieved using different scattering phase functions. Finally, a comparison between the simulation results and measurements derived from an underwater single-photon lidar demonstrated the reliability and robustness of our GPU-based MC simulation model.

1. Introduction

Oceanic lidar technology is an important complement to passive ocean color remote sensing [1,2] and has been applied in various fields, including underwater target detection [3], bathymetric measurement [4], phytoplankton [5], bubbles [6], and the inherent optical parameters (IOPs) of water [7]. Due to the ability of lidar to penetrate the air–water interface, it has the flexibility to be deployed on various platforms, such as ships [7], unmanned aerial vehicles (UAVs) [8], aircraft and even satellites [4]. However, despite the significant importance of the underwater deployment of lidar for underwater scientific investigations, obstacle avoidance for underwater platforms, and deep-sea environmental exploration, the development of underwater lidar is very limited [9]. To improve the signal-to-noise ratio (SNR) in lidar technology, an effective approach is to utilize high-energy pulses, typically in the range of tens of millijoules, along with large apertures, typically in the range of tens of cm. However, this results in high power consumption and large system volume, making it difficult to achieve the underwater deployment of lidar.
To achieve underwater deployment of lidar, the miniaturization of lidar is required. Although some compact lidar systems have been proposed and used in UAV-based oceanic lidar, such as RIEGL VQ-840-G [10], ASTRALiTe edge™ [11], and Fugro RAMMS [12], these systems are usually limited to detecting water depths below 10 m. Fortunately, the emergence of single-photon detection technology has driven the development of oceanic lidar towards miniaturization and low power consumption. By improving the detection sensitivity to the single-photon level, single-photon lidar can achieve long-range and high-precision parameter detection while being compact and low power [6]. As a result, this system has been widely applied in atmospheric remote sensing [13,14,15], underwater target imaging [9], ship-mounted lidar [16], and, more recently, underwater lidar systems [6,17]. However, despite the development of single-photon underwater lidar systems, there is a lack of simulation techniques for accurately simulating their backscattered signals. These simulation techniques are crucial for designing, optimizing instrument parameters, and interpreting the backscattered signals in underwater single-photon lidar systems.
There are two main methods for simulating the backscattered signals of lidar. One is the lidar equation [18], and the other is Monte Carlo (MC) simulation [19]. Due to the presence of a significant amount of multiple scattering information in the backscattered signals of ocean lidar, the simulation using the lidar equation has certain limitations. Fortunately, MC simulation based on statistical theory can accurately simulate lidar signals. It has been widely adopted in various applications such as oceanic [20], atmospheric [21], and target detection [22] lidar, as well as lidar systems on different platforms, including shipborne [20], airborne [23,24], and spaceborne lidar [25].
In oceanic lidar, various MC simulation models have been developed [26], including simulations of the elastic [26] and inelastic [27] scattering of lidar, as well as polarization [28], and the consistency between simulated and measured results has been experimentally verified [20]. At the same time, MC simulation techniques have played an important role in establishing the relationship between two parameters of lidar direct inversion, namely volume scattering function at 180° (β, in sr−1m−1) and the lidar attenuation coefficient (Klidar, in m−1), and the inherent optical properties (IOPs) of water, promoting the application of lidar in the ocean. Furthermore, Klidar represents the rate at which the lidar signal is attenuated while propagating through water. For example, MC simulation has been used to establish the relationship between Klidar, the beam attenuation coefficient (c, in m−1), and the diffuse attenuation coefficient (Kd, in m−1) [24,29,30], as well as the relationship between Klidar of spaceborne lidar and IOPs of seawater [25]. Kd quantifies how quickly light is absorbed or scattered as it travels through water, while c describes the rate at which a laser beam undergoes attenuation as it passes through water. However, MC simulation requires many random processes and is computationally intensive. Therefore, to improve the computational efficiency, a white MC method, along with a semi-analytical model, has been developed [31,32]. White MC is a variant of the MC method used in computational simulations, where “white” signifies that the random samples are generated independently and identically distributed. Furthermore, in the semi-analytical model, the calculation of the expected received signal is based on the probability distribution of the scattering phase function. This methodology optimizes photon utilization, resulting in reduced time requirements for achieving an equivalent SNR compared to standard MC simulations conducted under the same conditions. However, the computational efficiency of these methods remains relatively low. Fortunately, since Alerstam et al. first applied graphics processing unit (GPU) acceleration to MC simulation in 2009 [31], GPU technology based on massively threaded parallel computing has greatly improved the efficiency of MC simulation and been applied in various fields. Ren et al. used GPU-accelerated MC simulation to parallelly compute photon propagation in complex tissue media [33]. Li et al. proposed an untruncated framework to replace the truncated framework, further improving the computational speed of the MC simulation of polarized photon scattering in anisotropic media [34]. In addition, Yang constructed a model of the wind-generated bubble layer in the upper ocean and used GPU parallel MC simulation to simulate reflection and transmission spectra [35,36].
In summary, when using standard MC simulations to obtain high SNR backscattered signals for underwater lidar, the simulation time can be quite extensive. Typically, it ranges from several tens of minutes to even longer periods, depending on the computational performance of the processor and the parameter settings. Therefore, there is an urgent need to develop a MC simulation method based on GPU computing to improve the simulation speed of underwater single-photon lidar. This paper is structured as follows: Firstly, the MC simulation model and the framework for GPU parallel computing will be proposed. Then, the accuracy of GPU-based MC will be validated by comparing it to the CPU-MC results, and the simulation results will be presented for different scattering phase functions and non-uniform water. Finally, the comparison between the GPU-based MC simulation results and the measurement results from a self-developed single-photon underwater lidar system will be carried out to validate the effectiveness of the model.

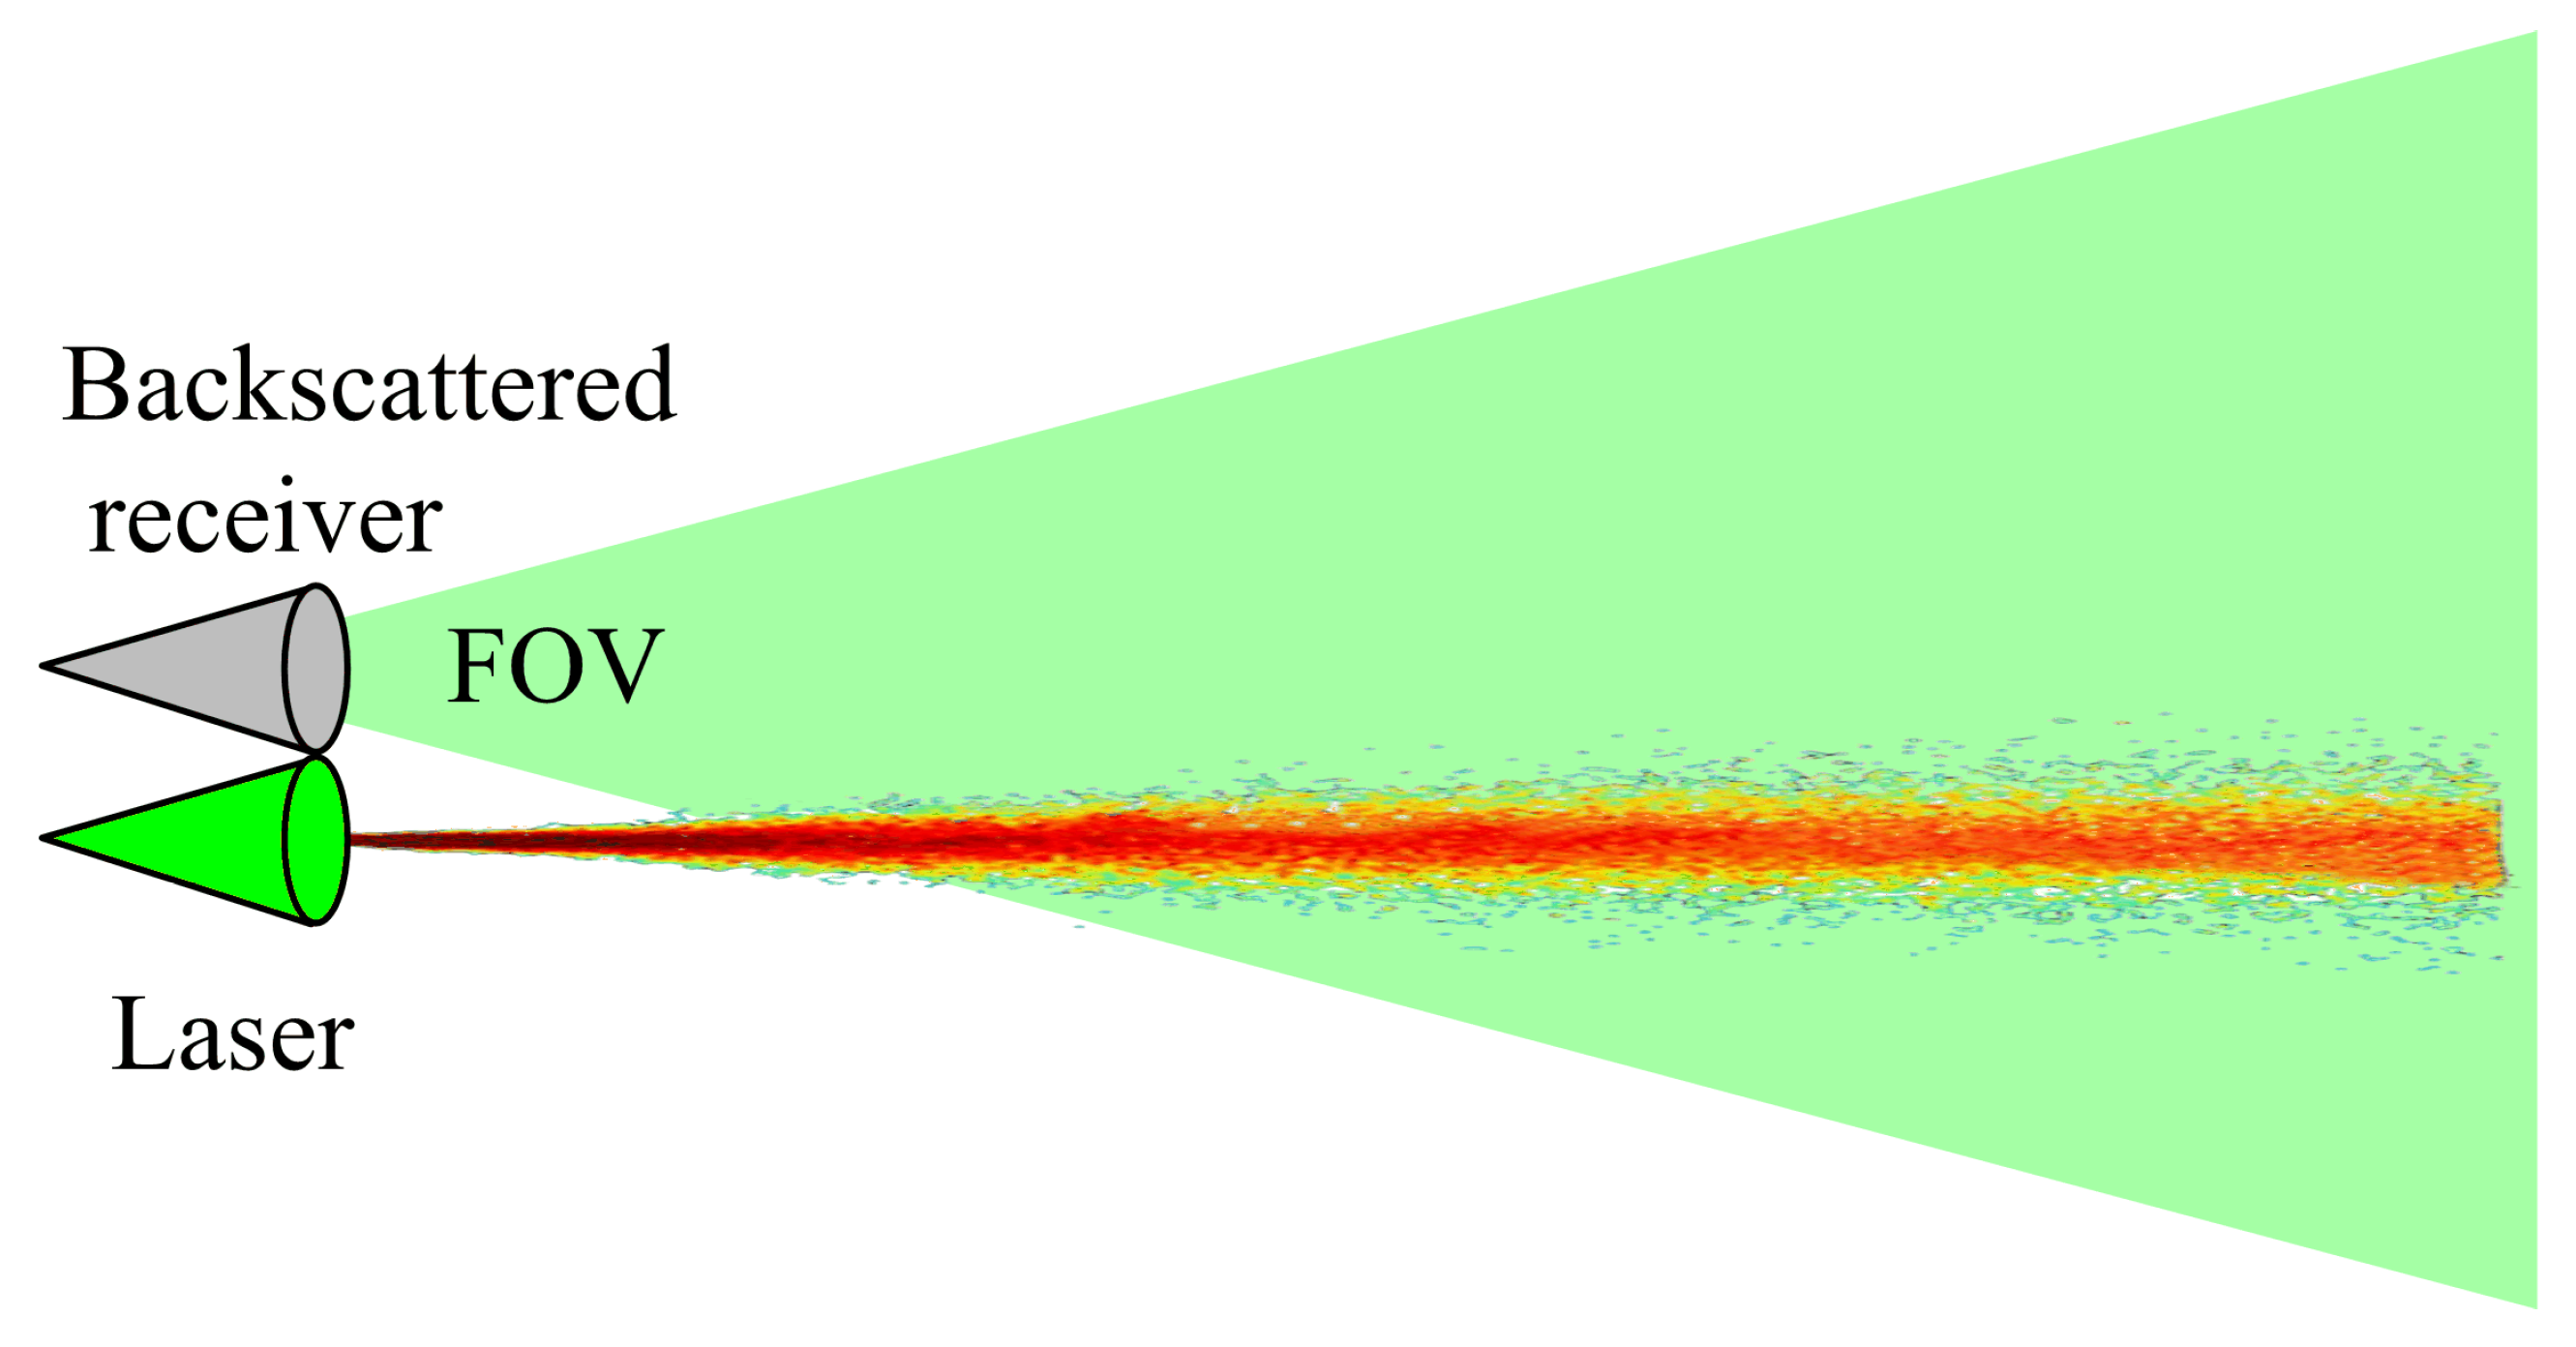
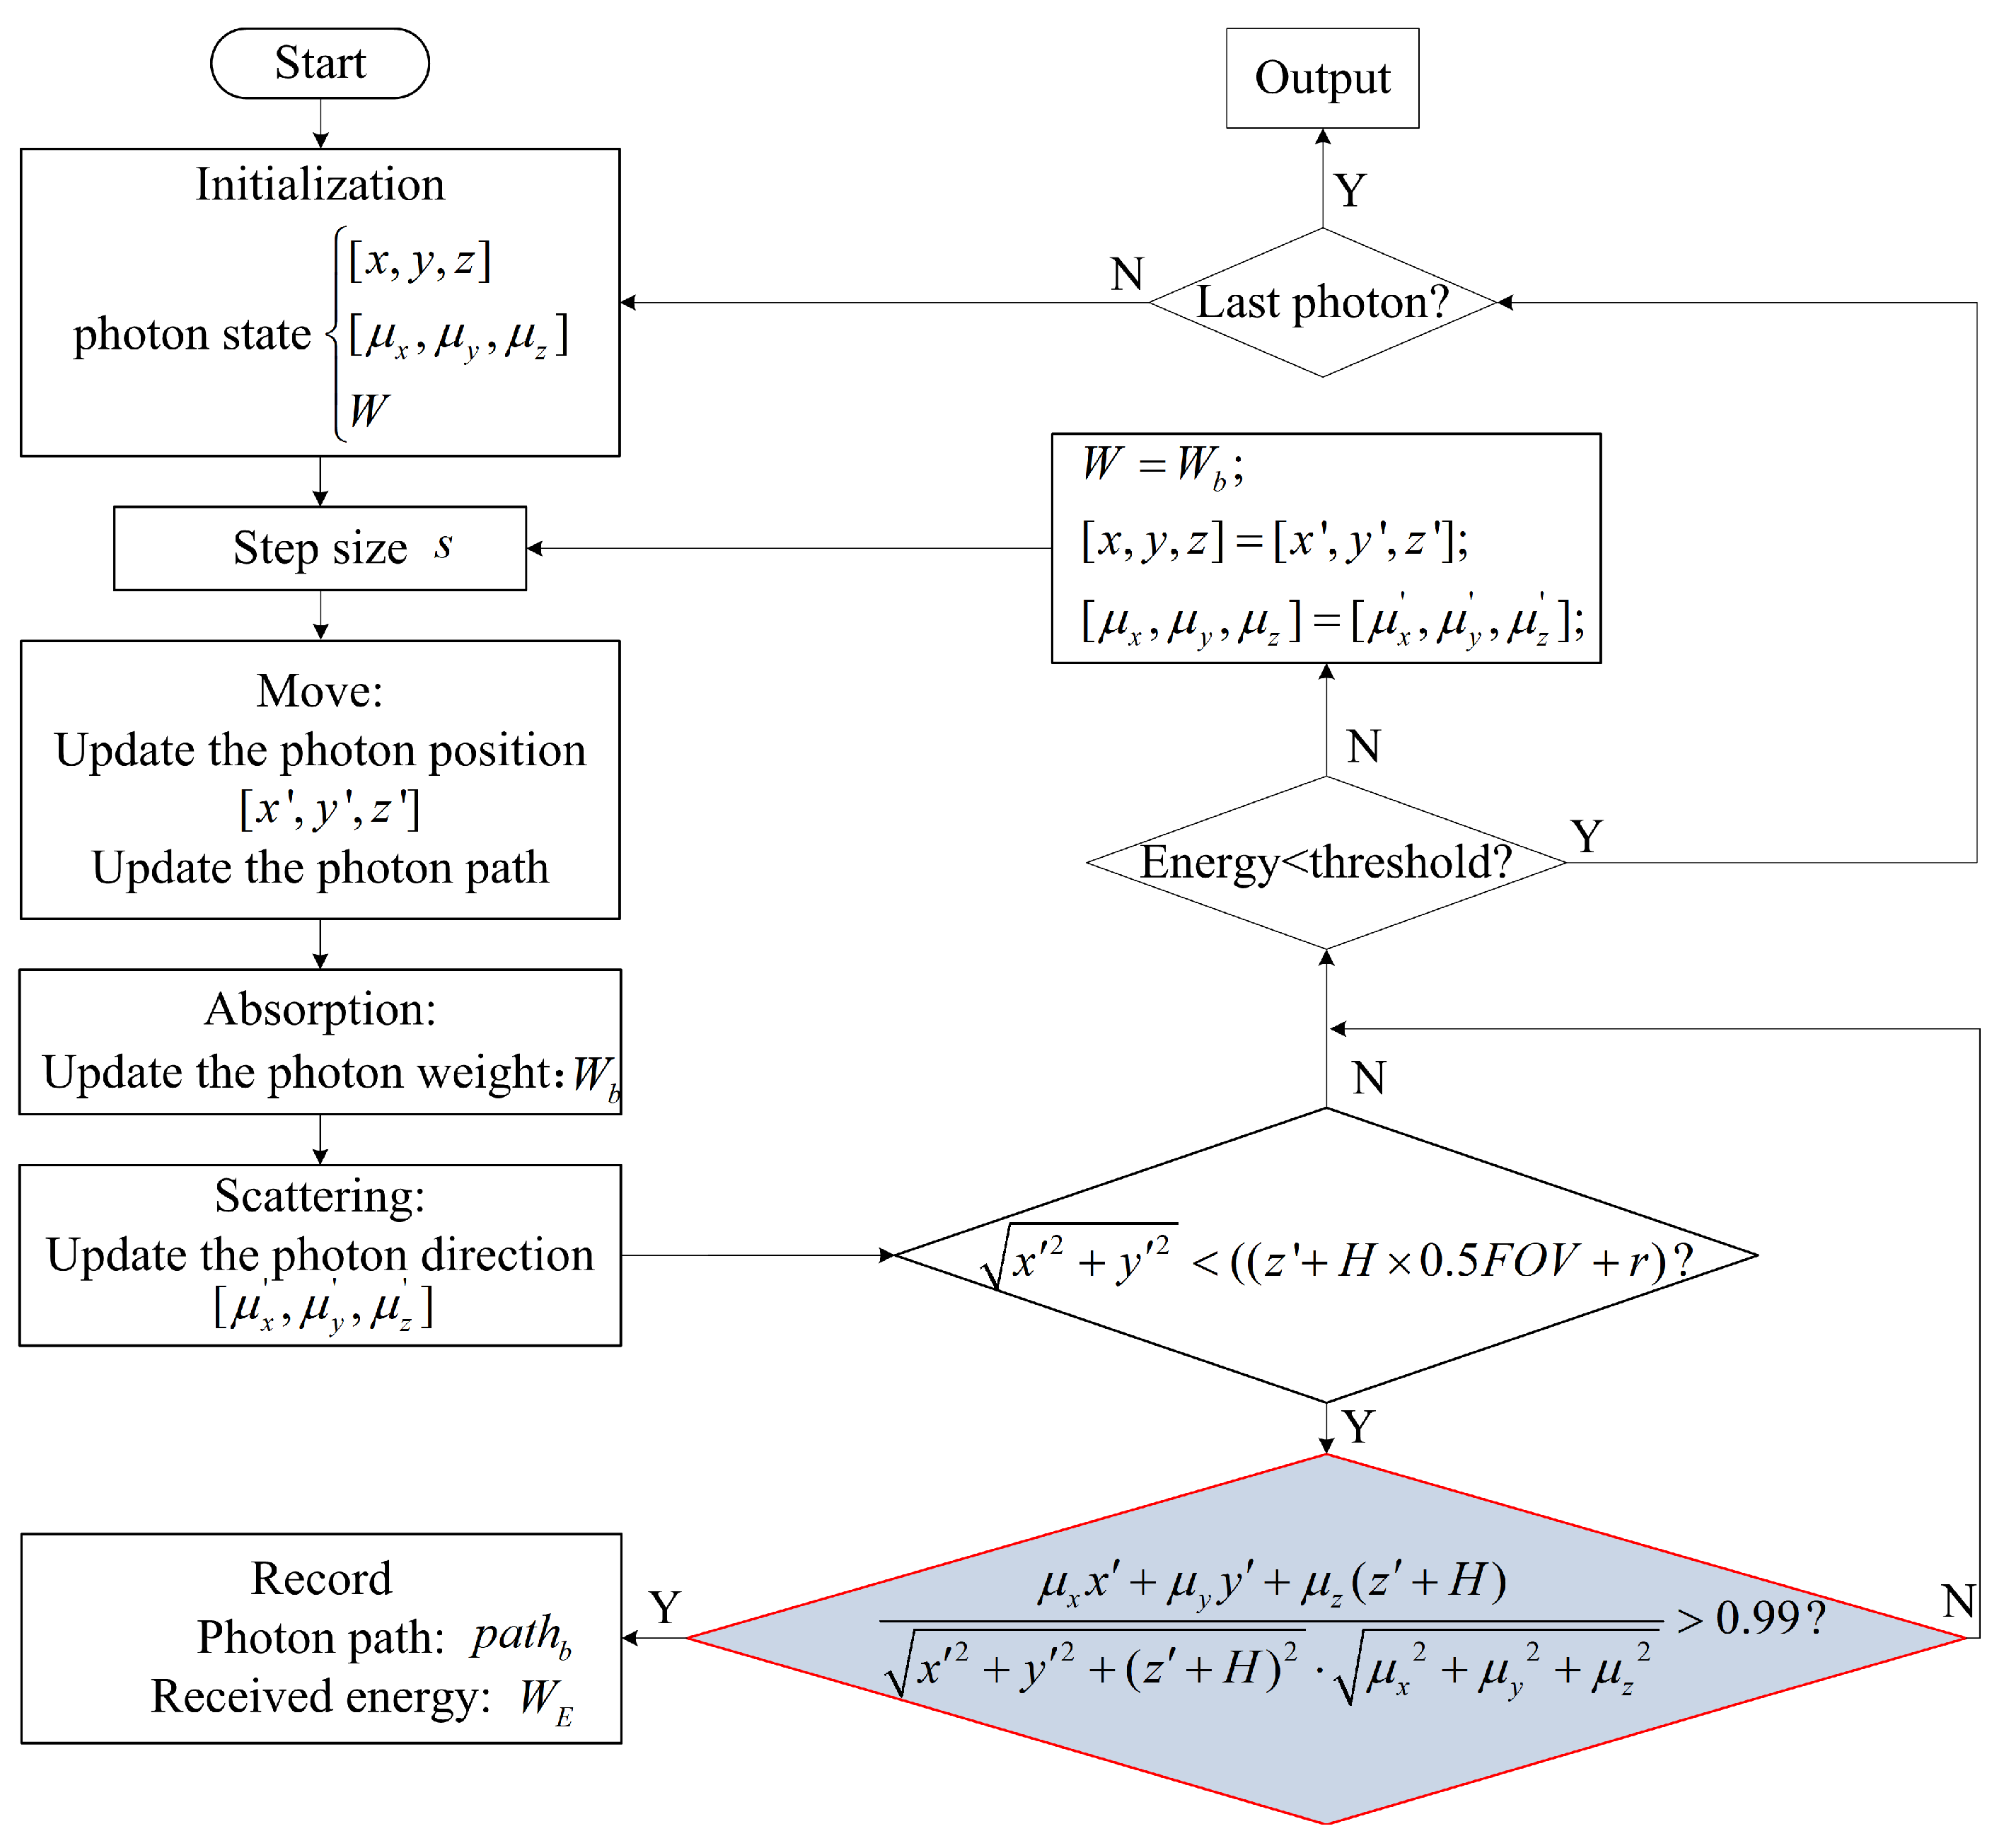
2. Principle and Implement of the MC Methods

The MC method is used to simulate the random trajectories of photon propagation in a specific medium. Both the step and direction are determined based on the scattering and absorption properties of the medium. The step refers to the distance or interval traveled during each random sampling iteration, while the direction denotes the path taken by the photon. The MC method ignores the photon’s wave properties, and the propagation of laser signal in the water is defined as the combination of many photon trajectories. The attenuation of laser energy is determined based on three factors: the absorption of the medium, the scattering probability, and the probability distribution of the steps. Thus, the MC method is widely utilized to simulate the photon propagation trajectories and monitor the energy changes. In this work, the MC algorithm is applied to simulate the backscattered signal of an underwater lidar. The framework of lidar transmission and reception are presented in Figure 1. The MC simulation could be divided into two categories, namely a standard model and a semi-analytic model. The standard MC model assumes that the motion of photon from emission to the receiver is completely random, and it can, therefore, theoretically reconstruct the real situation. However, due to the low backscattering probability and the limitations of small-aperture receiving, only a small percentage of photons can meet the reception conditions. To obtain high SNR backscattered signals, a large number of photons is required. As for semi-analytic MC simulation, whenever each photon moves to a new position, as long as it falls within the receiver’s field of view (FOV), the expected energy in the direction of the receiver due to photon scattering is calculated based on the probability distribution of the scattering phase function [32].
Figure 2 shows the framework of the semi-analytic MC model. The entire program can be broadly divided into three parts: the initialization of photon emission state, the propagation of photons in water, and the reception of photon energy using the telescope. Before each photon is emitted, its position and energy are initialized. Once emitted, the photon moves to a new position in random steps and can be subject to absorption and scattering events during this process. Subsequently, the photon’s position is assessed, and if it falls within the FOV and satisfies certain noise reduction threshold conditions, its received energy is calculated and recorded. The photon then continues to move until it is extinguished, and the simulation concludes when all emitted photons have ceased to exist. For a more comprehensive understanding of the simulation process, it is advisable to refer to a recent article [26]. The MC model is coded and tested using MATLAB software (MATLAB 2021b). The main simulation input parameters are listed in Table 1. If not otherwise specified, the input parameters of GPU program are the same as those shown in Table 1.
In the semi-analytic MC model, every photon in the telescope FOV will return its expected value of energy and record its position. The expected value Wb is calculated as follows:
W b = K P f exp [ c d z / ( z + H ) ] / d 2 ,
where K is related to the photon energy and the aperture of the receiver, Pf is the probability of the cumulative distribution phase function between the light propagation direction and the axis from the photon to the telescope, z is the photon position on the z axis, H is the distance from the lidar to the water, and d is the position parameter and can be represented as follows:
d = x 2 + y 2 + ( z + H ) 2 ,
where x, y, and z represent the position of a photon in Cartesian coordinates.
The simulated signals are shown in Figure 3. During the simulation process, the overall profile of the lidar backscattered signals and the vertical distribution of the single scattering, as well as multiple scattering signal components, including second-, third-, and higher-order scattering signals, were statistically analyzed. Based on the figure, it could be observed that in the near-field backscattered signals, the proportion of multiple scattering signals was relatively low compared to the total signal. However, as the depth increased, the proportion of multiple scattering signals gradually increased. Moreover, abnormal high values, characterized by random peak values, were obvious in the simulated signals, particularly in the multiple scattering signals. In the underwater lidar setup, the small value of H, representing the distance from the lidar to the water surface (approximately 5 cm in this study), increased the likelihood of encountering a small denominator (d), as shown in Equation (1). Additionally, the scattering phase function of water particles exhibited strong forward scattering, leading to the potential for large values in the term Pf in Equation (1). Both of these factors contributed to the occurrence of anomalous high values when calculating the expected value Wb using Equation (1). To minimize this abnormal signal, we set the cosine value of the angle between the photon propagation direction and the receiver telescope to be less than 0.99 of the threshold value of energy expectation via a statistical analysis of the photon state with the abnormal signals, as shown in the red rhombic box in Figure 2. Subsequently, most abnormal signals were eliminated, as shown in Figure 3b.

3. GPU Program

3.1. GPU-Accelerated MC Simulation

The Compute Unified Device Architecture (CUDA) was developed and proposed by NVIDIA in 2006, and it is recognized as a powerful platform and programming model for performing parallel computations. Parallel computation is the key kernel of the device, derived by the threads in GPU. During the GPU acceleration, the computing tasks of the GPU are defined and dispatched under CPU’s command, including parallel and sequential computation.
The flowchart using GPU parallel acceleration computation is displayed in Figure 4, where the parameter settings of threads and optical parameters of water are completed in CPU and later transferred to GPU. In the GPU-based MC simulation, including the photon status initialization, the random motion of photons and the photon reception via the telescope are completed in each thread of GPU. Furthermore, the photon idle of MC simulation is independently determined in each thread, and they are collected together to make sure each thread has completed its MC simulation. Finally, the data recorded in the GPU are transferred to the CPU and saved in a certain format.

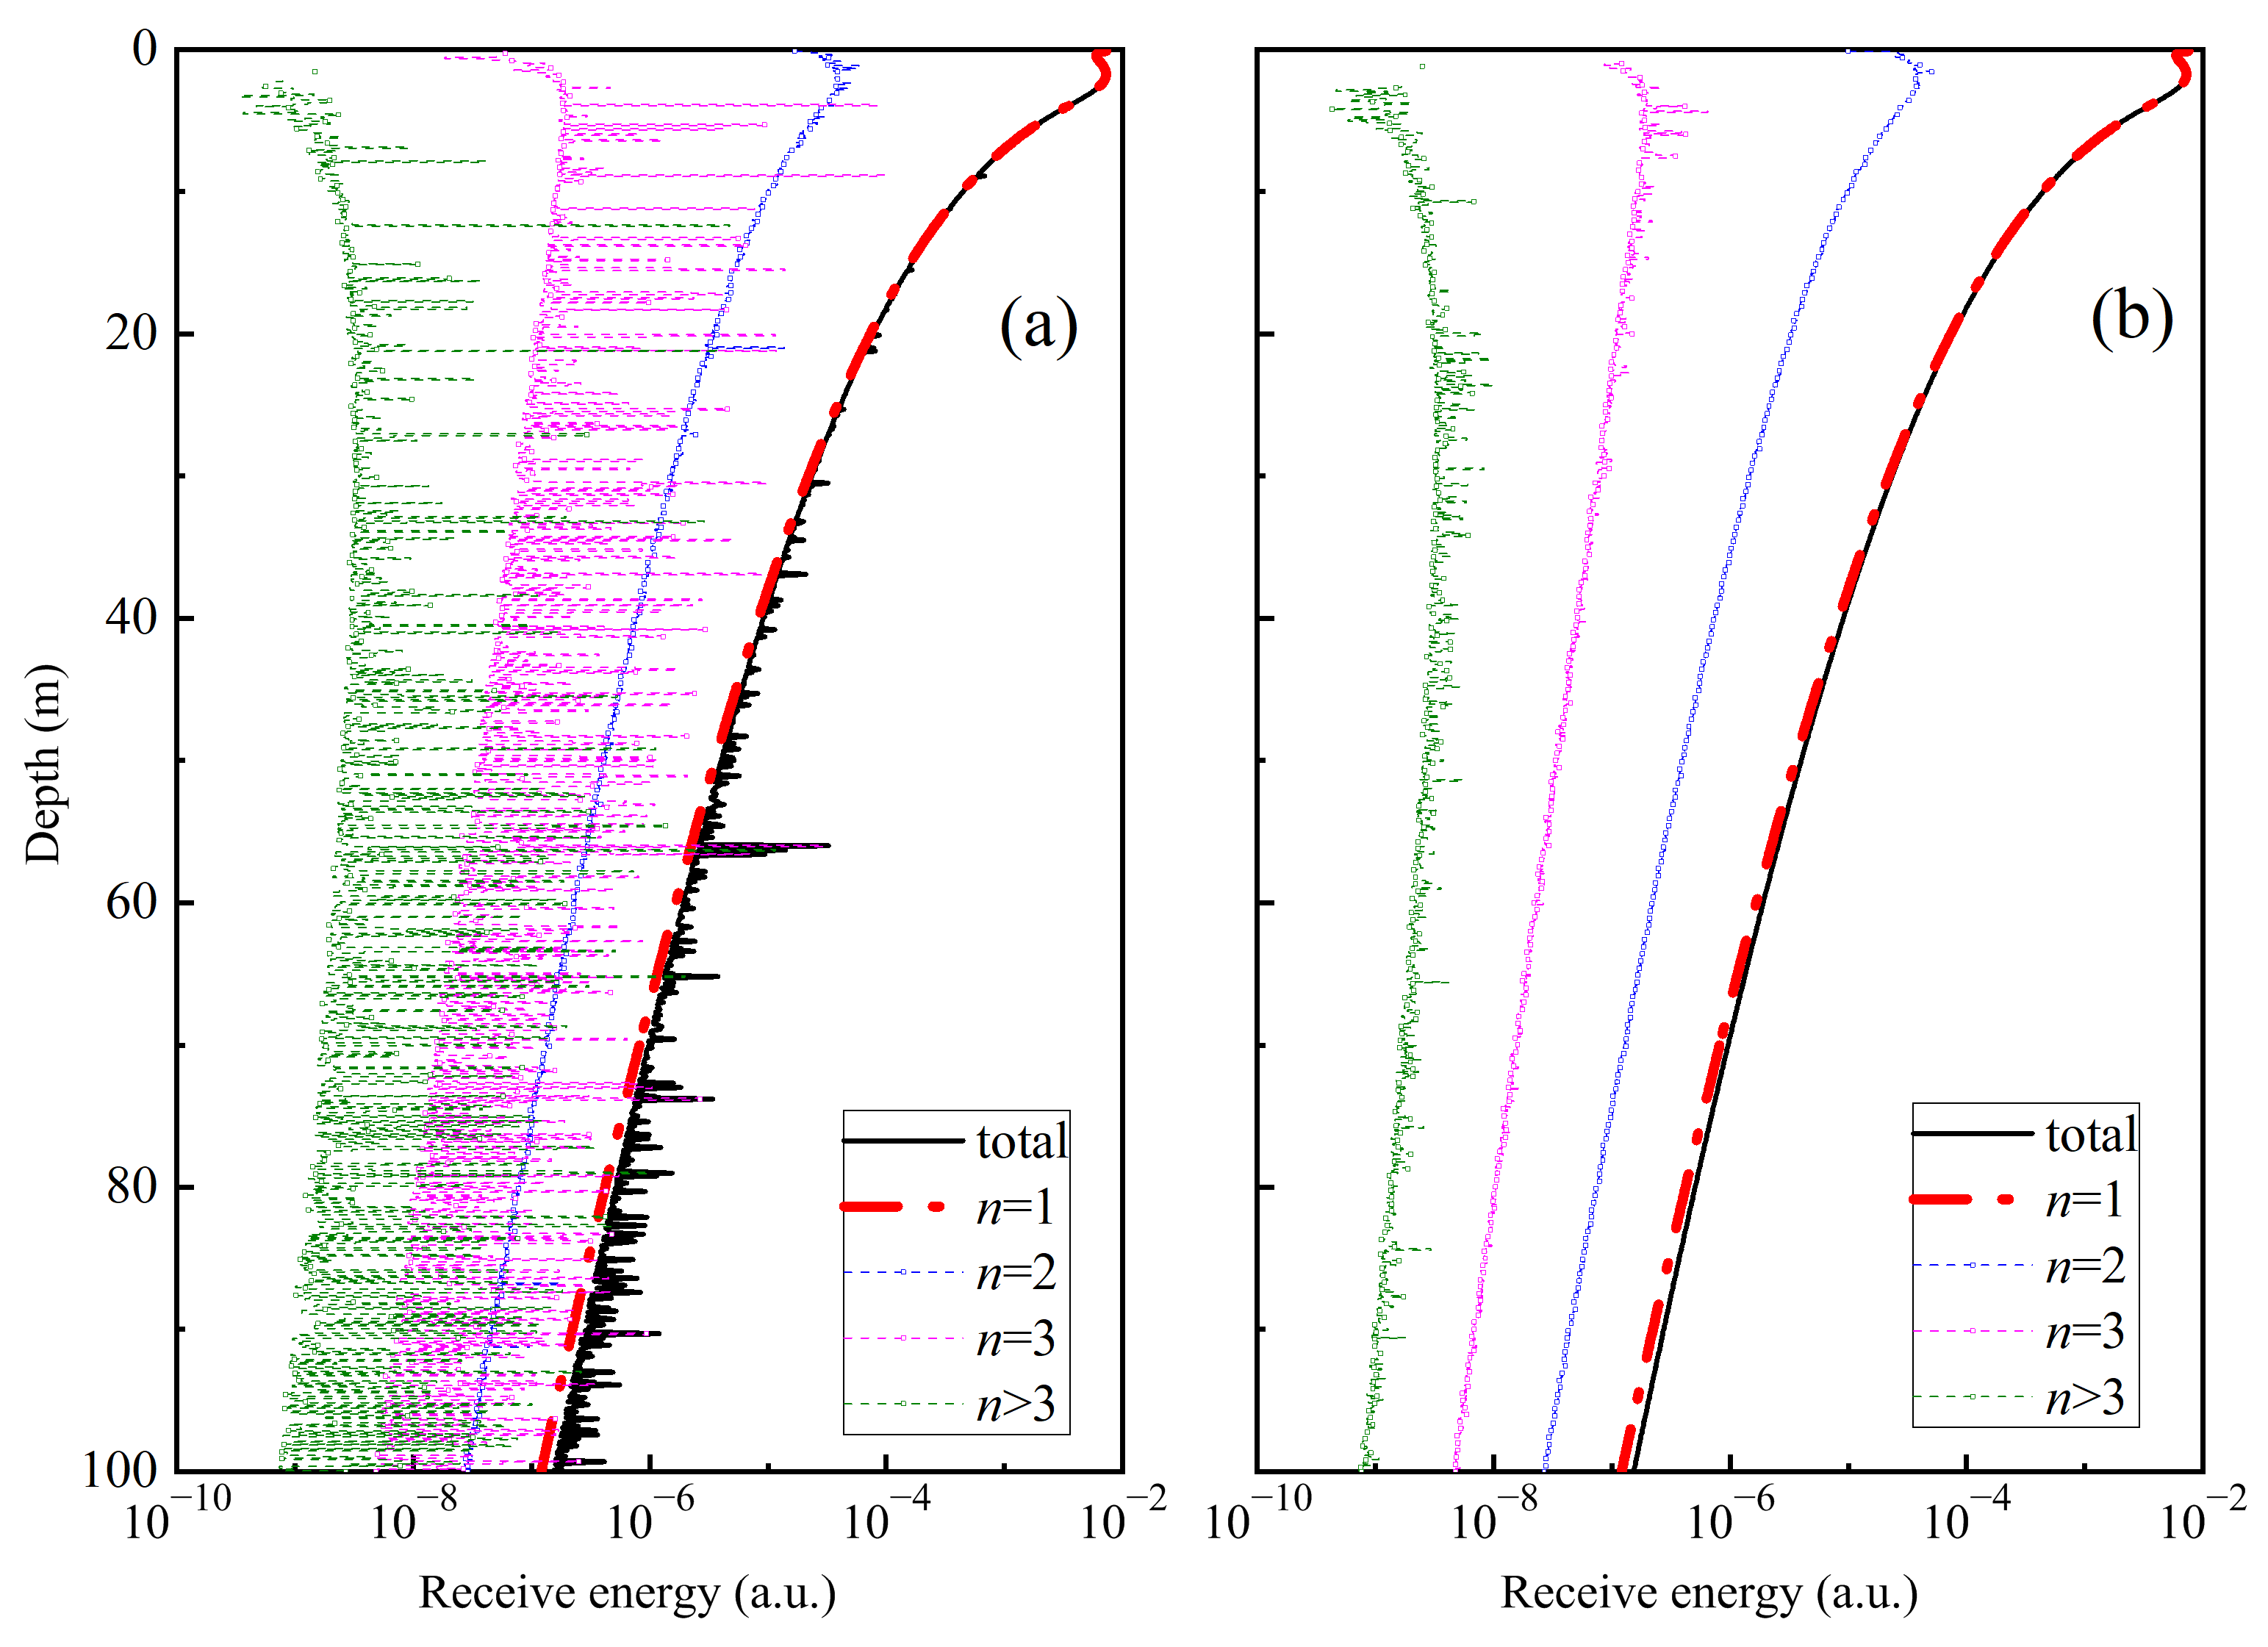
3.2. Verification of GPU Simulation

The results of the GPU-based MC simulation and the CPU-based simulation are compared to 109 photons, as shown in Figure 5. The verification of parallel computation program is tested on a laptop equipped with Intel i7-8750H (using single thread) CPU and NVIDIA Geforce® GTX 1050Ti GPU. The GPU is equipped with 768 CUDA cores running at a clock frequency of 1.12 GHz, while the CPU has 6 physical cores with a base clock frequency of 2.2 GHz and the capability to reach a maximum turbo frequency of 4.1 GHz. In terms of performance evaluation, the CPU achieved a single-core benchmark score of 1059 in Cinebench R23. The relative deviation is calculated as follows:
δ = 100 × | G P U C P U | / m e a n ( G P U + C P U ) ,
where GPU is result of the GPU-based model, and the CPU is result of the CPU-based model.
In Figure 5a, it can be seen that the results of the GPU-based simulation are consistent with those of the CPU-based simulation. Moreover, Figure 5b demonstrates that within a depth range of 100 m, the relative deviation is within 1.5%. Due to the inherent randomness of the simulation, even with a sufficient number of photons, errors are unavoidable. Additionally, as the depth increases, the simulated lidar backscattered signals become weaker, leading to a poorer SNR and, consequently, an increase in deviation with depth.

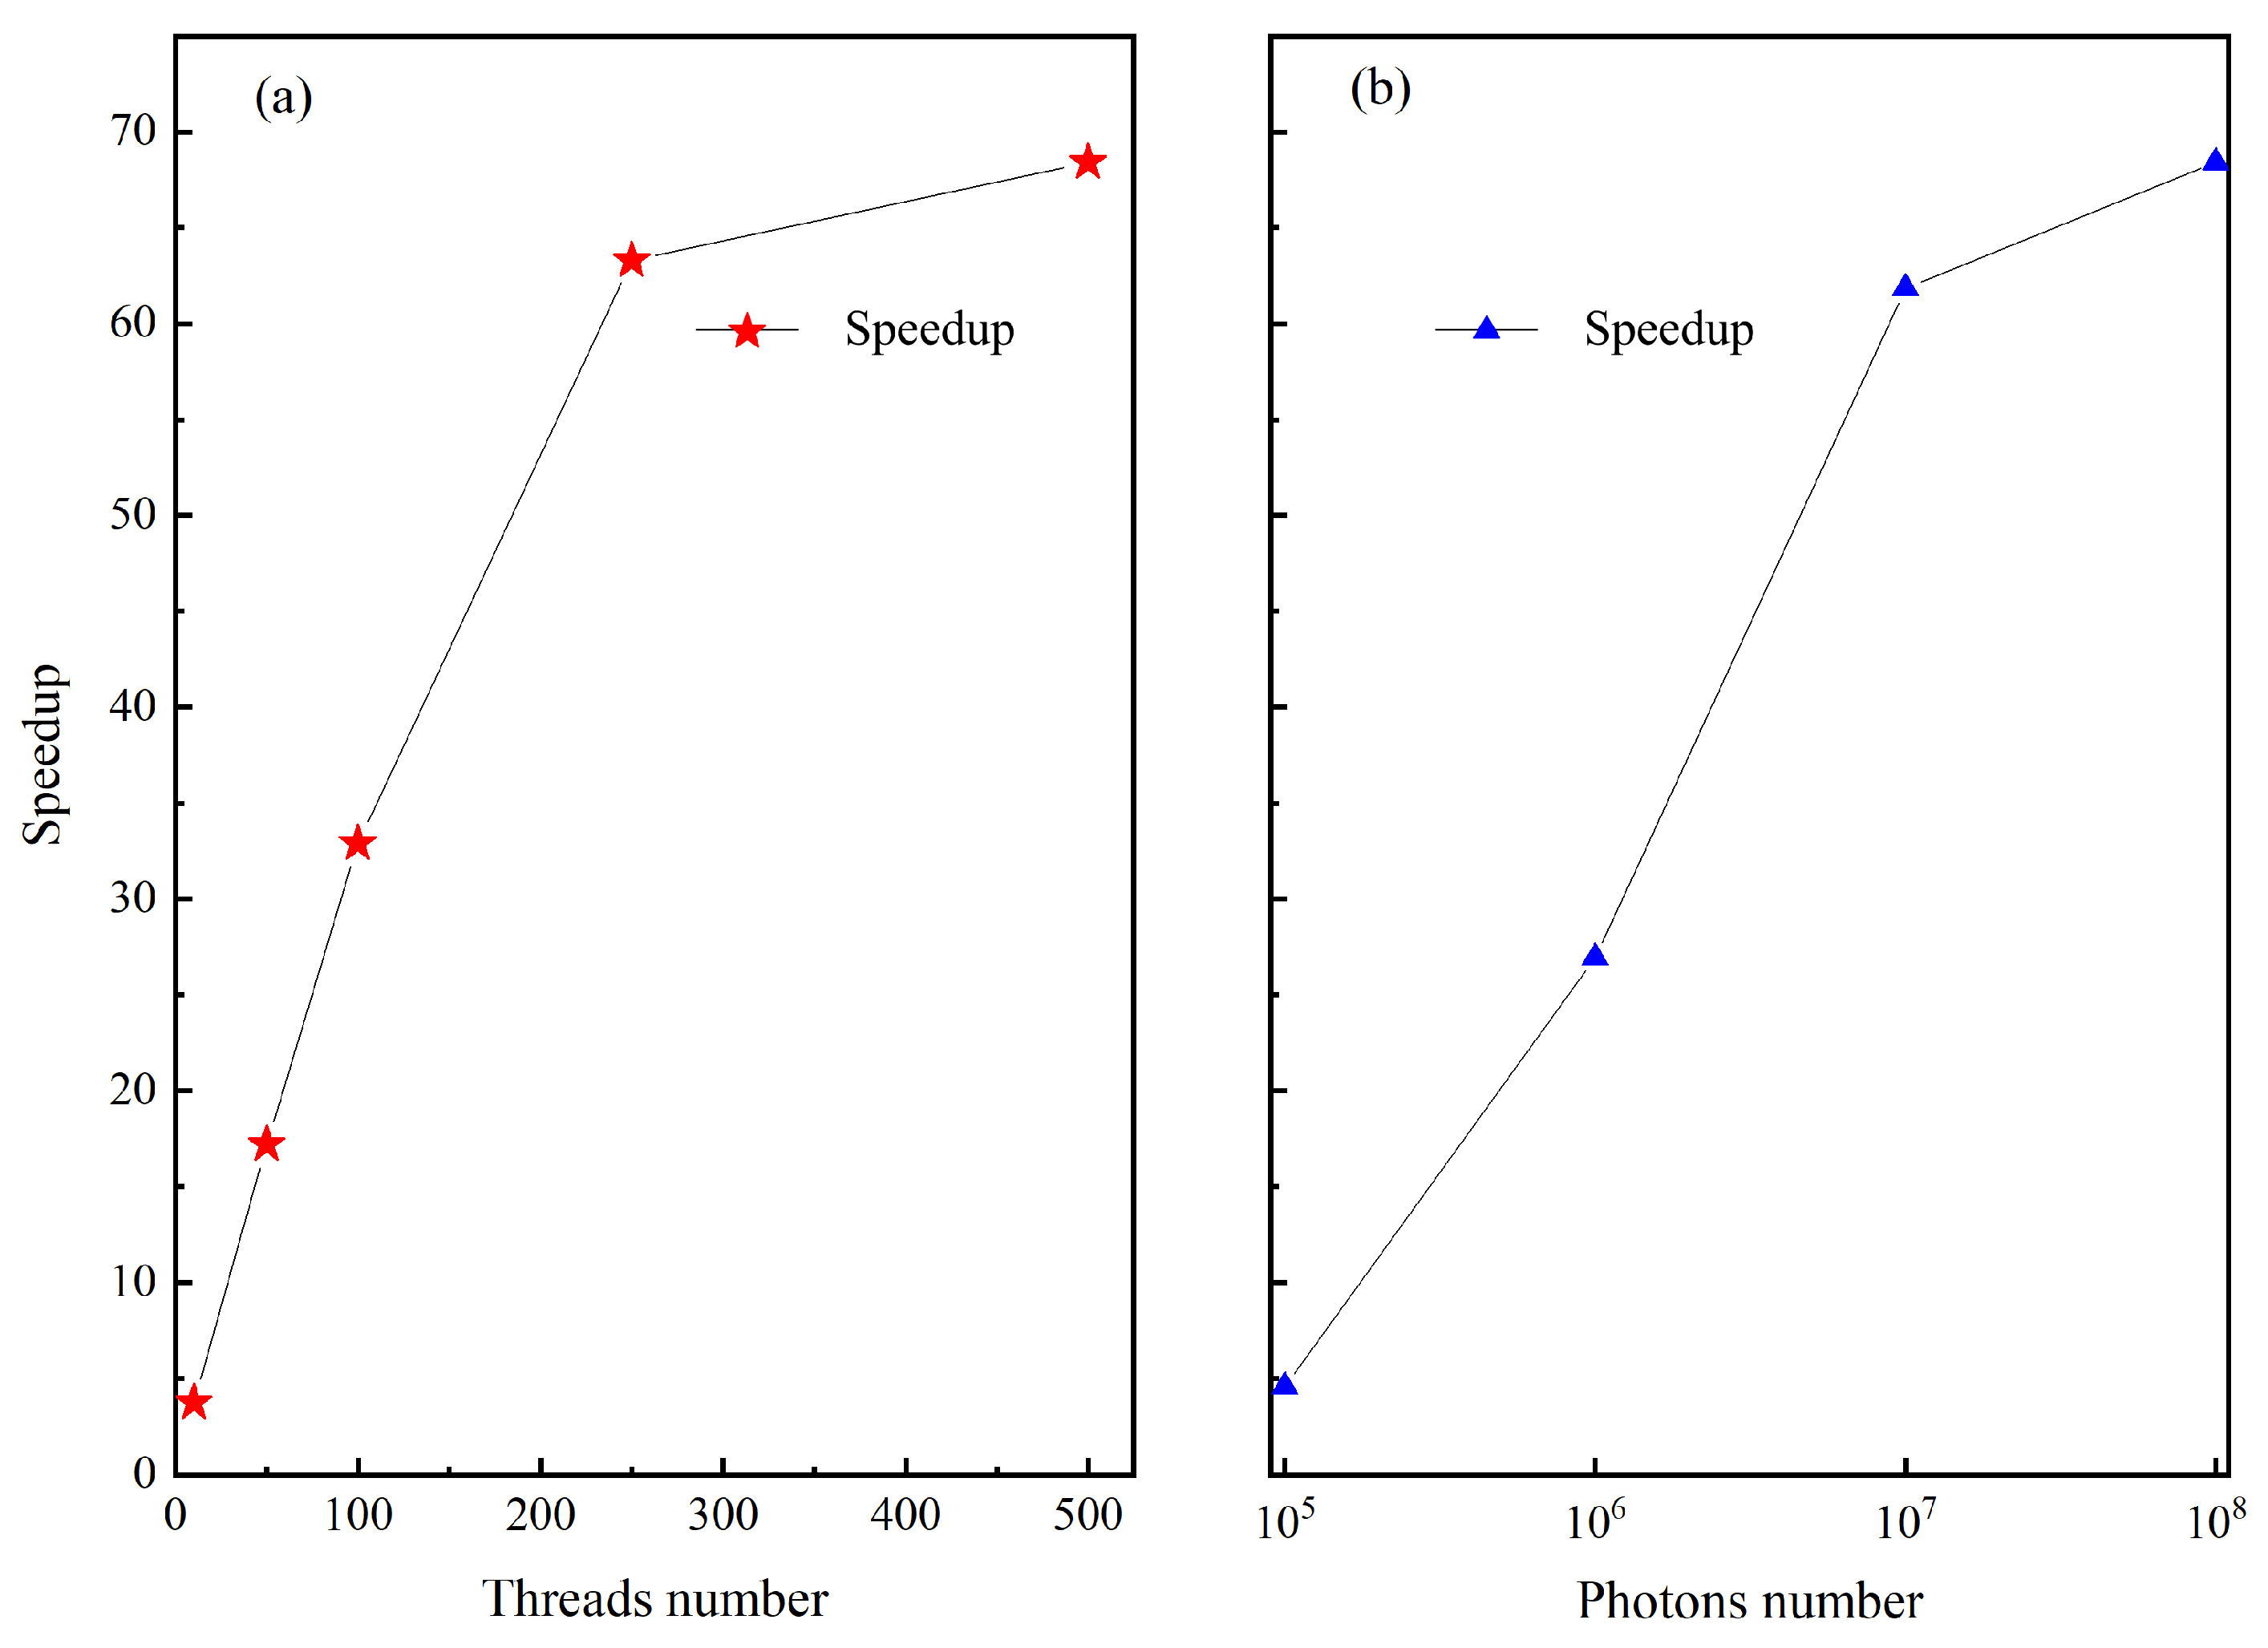
3.3. Estimation of Speedup Rate

Both the number of photons and the number of threads have a significant effect on the GPU speedup rate. Thus, the effect of these two parameters is independently evaluated: under 108 photons, the GPU and CPU computations are executed 10 times in different threads, and the runtime of the program is averaged to calculate its speedup rate, as shown in Figure 6a. Similarly, under 500 threads, the GPU and CPU computations are executed 10 times with different photon numbers, as shown in Figure 6b. It should be noted that due to variations in the time required for each thread to complete a single-photon calculation, the coordination of output and initialization is necessary. After all threads have completed the calculation for a single photon, the next photon calculation is initiated. As the number of threads increases, the waiting time for other threads to complete their calculations also increases, resulting in a deviation from the linear relationship between the number of threads and the calculation speed, as shown in Figure 6a. A similar pattern can be observed when considering the number of photons used in the calculation, as shown in Figure 6b. The testing involved a specific type of simulation scenario: a homogeneous water medium with the Henyey–Greenstein (HG) scattering phase function. The HG phase function has been widely applied in several studies, which only requires an anisotropic constant and is easily programmed and computed. As the number of photons and threads increased, the speedup gradually improved. When utilizing 500 GPU threads to simulate 108 photons, the CPU simulation took 2192 s, while the GPU simulation was completed in just 32 s with an average memory consumption of 224 MB, resulting in a speedup of 68.4.

3.4. Simulation in Inhomogeneous Sea Water

To validate the GPU-based MC simulation, the model is developed to study propagation of laser in inhomogeneous seawater. One of the hierarchical Gaussian mixture models for inhomogeneous water, proposed by Kameda et al., as shown in Figure 7a, has been selected for our MC simulation [37]. The corresponding absorption coefficient and scattering coefficient can been calculated as follows [38]:
a ( λ ) = a w ( λ ) + 0.06 A ( λ ) C 0.65 + a y ( λ ) ,
a y ( λ ) = a y ( 440 ) exp [ 0.014 ( λ 440 ) ] ,
a y ( 440 ) = 0.2 ( a w ( 440 ) + 0.06 A ( 440 ) C 0.65 ) ,
b p = 550 λ × 0.416 × C 0.766 ,
where a (in m−1) is the total absorption coefficient of water, aw (in m−1) is the absorption coefficient of pure seawater, A is the normalized spectral absorption values of phytoplankton pigments, C (in mg/m3) is the chlorophyll concentration, ay (in m−1) is the absorption coefficient of yellow substance, λ is the wavelength of light, and bp (in m−1) is the scattering coefficient of particles. The profiles of the chlorophyll concentration, the corresponding absorption, and scattering coefficient are shown in Figure 7.
The HG phase function, which only requires an anisotropic constant and is easily programmed and computed, has been adopted to simulate the backscattered signal in inhomogeneous sea water [34]. During the simulation process, the anisotropy factor value was set to 0.9185, and the backscattering ratio (the ratio of backscattering coefficient to scattering coefficient) was set to 0.0183, which is consistent with the backscattering ratio of the Petzold phase function [39]. Figure 7c presents the MC simulation result in stratified water layers using 109 photons. The vertical distribution of the absorption and the scattering coefficients are shown in Figure 7a,b, respectively. Since the c is the sum of the absorption and scattering coefficients, the vertical distribution of c can be obtained from Figure 7a,b.

3.5. Simulation with Different Scattering Phase Functions

The HG phase function has been widely applied in several studies, as it only requires an anisotropic constant and is easily programmed and computed [40]. However, the HG phase function shows a relatively poor performance with small and large angles. Therefore, in the subsequent simulations, both the Fourier–Forand phase function and the Petzold phase function will be utilized. The Fourier–Forand phase function, based on Fourier series expansion, accurately represents scattering phenomena at both small and large angles [39,41]. On the other hand, the Petzold phase function is derived from actual measurement data, providing a highly accurate description of the scattering distribution in water [40]. We conducted the GPU parallel computation MC simulation using selected phase functions based on the LUT methods from previous researches [42]. Four phase functions, namely Founier–Forand, Petzold, small particle phase function, and large particle phase function, have been chosen to test the GPU acceleration performance of the MC simulation. Figure 8 presents the corresponding MC simulation results with four phase functions. The simulation result is good at presenting the characteristics of the probability distribution of those scattering phase functions at the forward angles. Among them, the MC simulation of the small particle phase function, which has the minimum forward scattering, shows a much smaller signal attenuation in the water body of the first 10 m than the other three scattering phase functions. With the other scattering phase functions, the stronger the forward scattering of the scattering phase function, the greater the signal attenuation of the MC simulation results.

4. Validation

To verify the simulation ability of MC model, a field experiment was conducted using the single-photon underwater lidar in a swimming pool with dimensions of 50 × 25 × 2 m3 (length × width × depth). The single-photon underwater lidar is composed of a green pulse laser, an optical receiver, a single-photon avalanche diode (SPAD), a time-to-digital converter (TDC), and a function generator (FG). The 532 nm laser emits a pulse with a pulse duration of 501 ps and a repetition rate of 1 MHz. The laser system employs a master oscillator power amplifier (MOPA) structure, which incorporates a single-mode pulsed seed laser operating at 1064 nm. The seed laser undergoes two stages of amplification, first through a single-mode ytterbium-doped fiber amplifier (SM-YDFA) and then through a high-power ytterbium-doped fiber amplifier (HP-YDFA). The amplified laser output then passes through a lithium borate crystal (LBO), which converts the 1064 nm fundamental frequency light to 532 nm green light using second harmonic generation. Finally, up to 1.0 W of average power is achieved. The telescope diameter is ~20 mm, and the FOV is ~10 mrad.
To achieve a miniaturized and robust structure for the single-photon underwater lidar, a fiber-connected configuration was adopted. The backscattered signal from the water is coupled in a multimode fiber (MMF) via a collimator. This narrow receiving FOV in our lidar system offered significant backscattering noise suppression. The distance between the transmitted laser and the received collimator is ~15 mm. A 1-inch filter is placed in front of the collimator to filter out background radiation noise, with a central wavelength of 532 nm and a bandwidth of 0.08 nm. The backscattered elastic signal is then detected via a corresponding SPAD. The output of the SPAD is then connected to a time-to-digital converter (TDC). After the histogram statistic, the TDC sends the collected photon signals via the serial port to a personal computer (PC) for display. The photo of the single-photon underwater lidar is shown in Figure 9b. The lidar chamber is made of titanium alloy with high-pressure resistance characteristics, meaning that the lidar can operate underwater at depths of up to 1 km. The optical window of the lidar is made of a sapphire lens, which can maintain >96% transmission under high pressure. The cylindrical lidar has a diameter of 20 cm and a length of 40 cm. The average power consumption of the lidar is ~80 W, and it weighs 15 kg. It should be noted that the direction of the lidar is parallel to the axial direction of the lidar chamber. The direction of the lidar can be adjusted by modifying the arrangement of the lidar chamber. The key parameters of the single-photon underwater lidar are present in Table 2.
To extend the detection distance, a 300 × 300 mm2 reflective mirror with high reflection (≥98%) at 532 nm was placed on the wall of the pool to reflect the laser. The simulation signals are obtained via the MC simulation model derived using the GPU parallel computations with a photon number of 109. The raw profile with 2 s temporal resolution and 0.5 ns sample ratio is plotted in Figure 10a. Using an absorption and attenuation meter AC-9 (WET Labs, Inc., Philomath, OR, USA), the absorption coefficient (a, in m−1) and the beam attenuation coefficient (c, in m−1) at 532 nm were simultaneously measured. The Petzold was adopted as the scattering phase function in the simulation. The simulation signals were compared to the measurement signals after being normalized, as illustrated in Figure 10a. It is found that the simulation signals are consistent with the measurement signals, and the measurement signals show a peak value in 55 m, which is due to the reflection of the total reflector placed on the wall of the swimming pool. Figure 10b shows the regression diagram of the simulated signals and experimental signals. The simulation signals show an excellent consistency with experimental signals with a high R-square of 0.98, as shown in Figure 10b. The results demonstrated that the GPU-accelerated MC simulation program can efficiently simulate the experimental signals in clean water.

5. Conclusions

In this study, a semi-analytic MC simulation algorithm based on GPU parallel computation was proposed to simulate lidar signals. The implementation of the semi-analytic simulation program on a laptop demonstrated a speedup ratio of up to 68. The LUT method was utilized in the simulation model with different scattering phase functions. An algorithm was introduced to effectively minimize abnormal simulation signals. A comparison between the simulated and experimental signals showed a relatively high level of agreement.
Despite achieving a nearly 68-fold speed improvement, there remains potential for the further optimization and acceleration of GPU computation and programming. Firstly, modifying the program architecture by adopting a non-stop scheme instead of the conventional cut-off approach could better utilize CUDA threads [43]. Additionally, optimizing the codes to minimize command divisions would significantly reduce computation time. Moreover, optimizing the data storage structure can reduce data transfer time and volume during simulation. In this study, only the HG scattering phase function was used for simulation in inhomogeneous water. In future studies, other scattering phase functions, including the double HG phase function, Petzold phase function, large particle phase function, and small particle phase function will also be adopted. In addition, the MC simulation simulated not only the elastic unpolarized scattering signals of water bodies but also the inelastic or polarized scattering signals. In future research, this model will be applied not only in pristine water but also in coastal and oceanic environments to further validate its performance. Efforts will be made to further enhance the computation speed of the GPU-based semi-analytic MC simulation and use this model to simulate polarization and fluorescence signals.

Author Contributions

Conceptualization, M.S.; methodology, M.S. and Y.L.; software, Z.Y., Y.L. and Z.L.; validation, Y.W. and S.L.; formal analysis, Y.L., Y.W. and S.L; investigation, M.S., Z.Y. and Z.L.; resources, M.S.; data curation, Y.L. and Y.W.; writing—original draft preparation, M.S. and Y.L.; writing—review and editing, M.S.; visualization, M.S. and Y.L.; supervision, M.S.; project administration, M.S.; funding acquisition, M.S. All authors have read and agreed to the published version of the manuscript.

Funding

This research was funded by National Key Research and Development Program of China (2022YFB3901704), the Joint Funds of the National Natural Science Foundation of China (No. U2106210), the Natural Science Foundation of Fujian Province of China (No. 2020J01026), and the MEL-RLAB Joint Fund for Marine Science and Technology Innovation.

Data Availability Statement

The data that support the findings of this study are available from the corresponding author upon reasonable request.

Conflicts of Interest

The authors declare no conflict of interest.

References

  1. Hostetler, C.A.; Behrenfeld, M.J.; Hu, Y.; Hair, J.W.; Schulien, J.A. Spaceborne lidar in the study of marine systems. Annu. Rev. Mar. Sci. 2018, 10, 121–147. [Google Scholar] [CrossRef] [PubMed]
  2. Jamet, C.; Ibrahim, A.; Ahmad, Z.; Angelini, F.; Babin, M.; Behrenfeld, M.J.; Boss, E.; Cairns, B.; Churnside, J.; Chowdhary, J. Going beyond standard ocean color observations: Lidar and polarimetry. Front. Mar. Sci. 2019, 6, 251. [Google Scholar] [CrossRef]
  3. Pellen, F.; Jezequel, V.; Zion, G.; Le Jeune, B. Detection of an underwater target through modulated lidar experiments at grazing incidence in a deep wave basin. Appl. Opt. 2012, 51, 7690–7700. [Google Scholar] [CrossRef] [PubMed]
  4. Ma, Y.; Xu, N.; Liu, Z.; Yang, B.; Yang, F.; Wang, X.H.; Li, S. Satellite-derived bathymetry using the ICESat-2 lidar and Sentinel-2 imagery datasets. Remote Sens. Environ. 2020, 250, 112047. [Google Scholar] [CrossRef]
  5. Hoge, F.E.; Swift, R.N. Airborne dual laser excitation and mapping of phytoplankton photopigments in a Gulf Stream warm core ring. Appl. Opt. 1983, 22, 2272–2281. [Google Scholar] [CrossRef] [PubMed]
  6. Shangguan, M.; Yang, Z.; Lin, Z.; Lee, Z.; Xia, H.; Weng, Z. Compact long-range single-photon underwater lidar with high spatial-temporal resolution. IEEE Geosci. Remote Sens. Lett. 2023, 20, 1501905. [Google Scholar] [CrossRef]
  7. Shangguan, M.; Liao, Z.; Guo, Y.; Lee, Z. Sensing the profile of particulate beam attenuation coefficient through a single-photon oceanic Raman lidar. Opt. Express 2023, 31, 25398–25414. [Google Scholar] [CrossRef]
  8. Wang, D.; Xing, S.; He, Y.; Yu, J.; Xu, Q.; Li, P. Evaluation of a New Lightweight UAV-Borne Topo-Bathymetric LiDAR for Shallow Water Bathymetry and Object Detection. Sensors 2022, 22, 1379. [Google Scholar] [CrossRef]
  9. Maccarone, A.; Drummond, K.; McCarthy, A.; Steinlehner, U.K.; Tachella, J.; Garcia, D.A.; Pawlikowska, A.; Lamb, R.A.; Henderson, R.K.; McLaughlin, S. Submerged single-photon LiDAR imaging sensor used for real-time 3D scene reconstruction in scattering underwater environments. Opt. Express 2023, 31, 16690–16708. [Google Scholar] [CrossRef] [PubMed]
  10. Mandlburger, G.; Pfennigbauer, M.; Schwarz, R.; Flöry, S.; Nussbaumer, L. Concept and performance evaluation of a novel UAV-borne topo-bathymetric LiDAR sensor. Remote Sens. 2020, 12, 986. [Google Scholar] [CrossRef]
  11. Mitchell, S.E.; Thayer, J.P. Ranging through shallow semitransparent media with polarization lidar. J. Atmos. Ocean. Technol. 2014, 31, 681–697. [Google Scholar] [CrossRef]
  12. Ventura, D. Coastal zone mapping with the world’s first airborne multibeam bathymetric lidar mapping system. Hydrogr. Nachrichten 2020, 115, 48–53. [Google Scholar]
  13. Yu, C.; Shangguan, M.; Xia, H.; Zhang, J.; Dou, X.; Pan, J.-W. Fully integrated free-running InGaAs/InP single-photon detector for accurate lidar applications. Opt. Express 2017, 25, 14611–14620. [Google Scholar] [CrossRef]
  14. Shangguan, M.; Xia, H.; Wang, C.; Qiu, J.; Lin, S.; Dou, X.; Zhang, Q.; Pan, J.-W. Dual-frequency Doppler lidar for wind detection with a superconducting nanowire single-photon detector. Opt. Lett. 2017, 42, 3541–3544. [Google Scholar] [CrossRef]
  15. Shangguan, M.; Xia, H.; Wang, C.; Qiu, J.; Shentu, G.; Zhang, Q.; Dou, X.; Pan, J.-w. All-fiber upconversion high spectral resolution wind lidar using a Fabry-Perot interferometer. Opt. Express 2016, 24, 19322–19336. [Google Scholar] [CrossRef] [PubMed]
  16. Shen, X.; Kong, W.; Chen, P.; Chen, T.; Huang, G.; Shu, R. A shipborne photon-counting lidar for depth-resolved ocean observation. Remote Sens. 2022, 14, 3351. [Google Scholar] [CrossRef]
  17. Shangguan, M.; Yang, Z.; Shangguan, M.; Lin, Z.; Liao, Z.; Guo, Y.; Liu, C. Remote sensing oil in water with an all-fiber underwater single-photon Raman lidar. Appl. Opt. 2023, 62, 5301–5305. [Google Scholar] [CrossRef] [PubMed]
  18. Walker, R.E.; McLean, J.W. Lidar equations for turbid media with pulse stretching. Appl. Opt. 1999, 38, 2384–2397. [Google Scholar] [CrossRef] [PubMed]
  19. James, F. Monte Carlo theory and practice. Rep. Prog. Phys. 1980, 43, 1145–1189. [Google Scholar] [CrossRef]
  20. Liu, D.; Xu, P.; Zhou, Y.; Chen, W.; Han, B.; Zhu, X.; He, Y.; Mao, Z.; Le, C.; Chen, P. Lidar remote sensing of seawater optical properties: Experiment and Monte Carlo simulation. IEEE Trans. Geosci. Remote Sens. 2019, 57, 9489–9498. [Google Scholar] [CrossRef]
  21. Prigarin, S. Monte Carlo simulation of the effects caused by multiple scattering of ground-based and spaceborne lidar pulses in clouds. Atmos. Ocean. Opt. 2017, 30, 79–83. [Google Scholar] [CrossRef]
  22. Liang, J.; Yang, K.; Xia, M.; Zhang, X.; Lei, X.; Zheng, Y.; Tan, D. Monte Carlo simulation for modulated pulse bathymetric light detecting and ranging systems. J. Opt. A: Pure Appl. Opt. 2006, 8, 415–422. [Google Scholar] [CrossRef]
  23. Gastellu-Etchegorry, J.-P.; Yin, T.; Lauret, N.; Grau, E.; Rubio, J.; Cook, B.D.; Morton, D.C.; Sun, G. Simulation of satellite, airborne and terrestrial LiDAR with DART (I): Waveform simulation with quasi-Monte Carlo ray tracing. Remote Sens. Environ. 2016, 184, 418–435. [Google Scholar] [CrossRef]
  24. Gordon, H.R. Interpretation of airborne oceanic lidar: Effects of multiple scattering. Appl. Opt. 1982, 21, 2996–3001. [Google Scholar] [CrossRef] [PubMed]
  25. Liu, Q.; Cui, X.; Jamet, C.; Zhu, X.; Mao, Z.; Chen, P.; Bai, J.; Liu, D. A semianalytic Monte Carlo simulator for spaceborne oceanic LiDAR: Framework and preliminary results. Remote Sens. 2020, 12, 2820. [Google Scholar] [CrossRef]
  26. Chen, P.; Pan, D.; Mao, Z.; Liu, H. Semi-analytic Monte Carlo radiative transfer model of laser propagation in inhomogeneous sea water within subsurface plankton layer. Opt. Laser Technol. 2019, 111, 1–5. [Google Scholar] [CrossRef]
  27. Chen, S.; Chen, P.; Ding, L.; Pan, D. A New Semi-Analytical MC Model for Oceanic LIDAR Inelastic Signals. Remote Sens. 2023, 15, 684. [Google Scholar] [CrossRef]
  28. Liu, Q.; Cui, X.; Chen, W.; Liu, C.; Bai, J.; Zhang, Y.; Zhou, Y.; Liu, Z.; Xu, P.; Che, H. A semianalytic Monte Carlo radiative transfer model for polarized oceanic lidar: Experiment-based comparisons and multiple scattering effects analyses. J. Quant. Spectrosc. Radiat. Transf. 2019, 237, 106638. [Google Scholar] [CrossRef]
  29. Krekov, G.M.; Krekova, M.M.; Shamanaev, V.S. Laser sensing of a subsurface oceanic layer. I. Effect of the atmosphere and wind-driven sea waves. Appl. Opt. 1998, 37, 1589–1595. [Google Scholar] [CrossRef]
  30. Krekov, G.M.; Krekova, M.M.; Shamanaev, V.S. Laser sensing of a subsurface oceanic layer. II. Polarization characteristics of signals. Appl. Opt. 1998, 37, 1596–1601. [Google Scholar] [CrossRef]
  31. Alerstam, E.; Andersson-Engels, S.; Svensson, T. White Monte Carlo for time-resolved photon migration. J. Biomed. Opt. 2008, 13, 041304–041310. [Google Scholar] [CrossRef] [PubMed]
  32. Poole, L.R.; Venable, D.D.; Campbell, J.W. Semianalytic Monte Carlo radiative transfer model for oceanographic lidar systems. Appl. Opt. 1981, 20, 3653–3656. [Google Scholar] [CrossRef]
  33. Ren, N.; Liang, J.; Qu, X.; Li, J.; Lu, B.; Tian, J. GPU-based Monte Carlo simulation for light propagation in complex heterogeneous tissues. Opt. Express 2010, 18, 6811–6823. [Google Scholar] [CrossRef] [PubMed]
  34. Li, P.; Liu, C.; Li, X.; He, H.; Ma, H. GPU acceleration of Monte Carlo simulations for polarized photon scattering in anisotropic turbid media. Appl. Opt. 2016, 55, 7468–7476. [Google Scholar] [CrossRef] [PubMed]
  35. Kokhanenko, G.; Balin, Y.S.; Penner, I.; Shamanaev, V. Lidar and in situ measurements of the optical parameters of water surface layers in Lake Baikal. Atmos. Ocean. Opt. 2011, 24, 478–486. [Google Scholar] [CrossRef]
  36. Yang, Y.; Guo, L. Parallel Monte Carlo simulation algorithm for the spectral reflectance and transmittance of the wind-generated bubble layers in the upper ocean using CUDA. Opt. Express 2020, 28, 33538–33555. [Google Scholar] [CrossRef] [PubMed]
  37. Kameda, T.; Matsumura, S. Chlorophyll biomass off Sanriku, northwestern Pacific, estimated by Ocean Color and Temperature Scanner (OCTS) and a vertical distribution model. J. Oceanogr. 1998, 54, 509–516. [Google Scholar] [CrossRef]
  38. Morel, A. Light and marine photosynthesis: A spectral model with geochemical and climatological implications. Prog. Oceanogr. 1991, 26, 263–306. [Google Scholar] [CrossRef]
  39. Petzold, T.J. Volume Scattering Functions for Selected Ocean Waters; Naval Air Development Center: Warminster, PA, USA, 1972. [Google Scholar]
  40. Henyey, L.G.; Greenstein, J.L. Diffuse radiation in the galaxy. Astrophys. J. 1941, 93, 70–83. [Google Scholar] [CrossRef]
  41. Fournier, G.R.; Forand, J.L. Analytic phase function for ocean water. In Proceedings of the Ocean Optics XII, Bergen, Norway, 13–15 June 1994; pp. 194–201. [Google Scholar]
  42. Chen, P.; Pan, D.; Mao, Z.; Liu, H. Semi-analytic Monte Carlo model for oceanographic lidar systems: Lookup table method used for randomly choosing scattering angles. Appl. Sci. 2018, 9, 48. [Google Scholar] [CrossRef]
  43. Wang, L.; Jacques, S.L.; Zheng, L. MCML—Monte Carlo modeling of light transport in multi-layered tissues. Comput. Methods Programs Biomed. 1995, 47, 131–146. [Google Scholar] [CrossRef] [PubMed]
Figure 1. Schematic diagram of lidar transceiver structure.
Remotesensing 15 05245 g001
Figure 2. Flow chart of the MC model.
Remotesensing 15 05245 g002
Figure 3. The simulation results (a) before and (b) after removing the abnormal signals with 109 photons. The number n represents the order of scattering, and the “total” represents the total backscattered signal.
Remotesensing 15 05245 g003
Figure 4. Framework of the GPU program.
Remotesensing 15 05245 g004
Figure 5. (a) Comparison between GPU-based results and CPU-based results (109 photons). (b) Relative deviation between GPU-based and CPU-based results calculated using Equation (3).
Remotesensing 15 05245 g005
Figure 6. (a) Acceleration effect of GPU under a different number of threads. (b) Acceleration effect of GPU under a different number of photons.
Remotesensing 15 05245 g006
Figure 7. (a) The chloroplast Gaussian stratification. (b) The corresponding absorption coefficient stratification and scattering coefficient stratification. (c) The simulation results obtained using HG phase function. The value of n represents the order of scattering, and the “total” represents the full multiple scattering signal.
Remotesensing 15 05245 g007
Figure 8. (a) Simulation results obtained using the Peztold phase function (a) and the Fournier–Forand (FF) phase function (b). The large particle phase function (c) and the small particle phase function (d). The n represents the order of scattering, and the “total” represents the full multiple scattering signal.
Remotesensing 15 05245 g008
Figure 9. (a) Optical layout of the single-photon underwater lidar. SM-YDFA: single-mode ytterbium-doped fiber amplifier; HP-YDFA: high-power ytterbium-doped fiber amplifier; L: lens; LBO: lithium borate; MMF: multimode fiber; SPAD: single-photon avalanche diode; TDC: time-to-digital converter; FG: function generator; PC: personal computer. (b) Photo of the underwater lidar.
Remotesensing 15 05245 g009
Figure 10. (a) Comparison between experimental and simulated data. (b) Linear regression of experimental and simulated data.
Remotesensing 15 05245 g010
Table 1. Main parameter settings of MC simulation.
ParameterValue
Radius of laser beam10 mm
Laser divergence angle1 mrad
Diameter of telescope20 mm
FOV of telescope10 mrad
Distance between emission and reception axis15 mm
Absorption coefficient0.1 m−1
Scattering coefficient0.1 m−1
Refractive index of water1.33
Table 2. Key parameters of single-photon underwater lidar.
ParameterValue
Pulse duration of the laser501 ps
Pulse energy of the laser1 μJ
Pulse repetition rate of the laser1 MHz
Diameter of the telescope 20 mm
Detection efficiency at 532 nm52%
Dark count100 cps
Size of the lidarΦ20 cm × 40 cm
Power consumption of the lidar≈80 W
Disclaimer/Publisher’s Note: The statements, opinions and data contained in all publications are solely those of the individual author(s) and contributor(s) and not of MDPI and/or the editor(s). MDPI and/or the editor(s) disclaim responsibility for any injury to people or property resulting from any ideas, methods, instructions or products referred to in the content.

