
A Year of Volcanic Hot-Spot Detection over Mediterranean Europe Using SEVIRI/MSG


Abstract
:
1. Introduction
2. Data and Methods
2.1. Study Area
2.2. Data
2.3. Methods
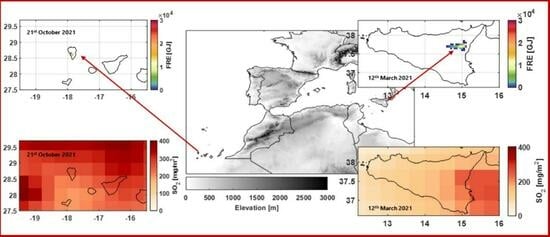
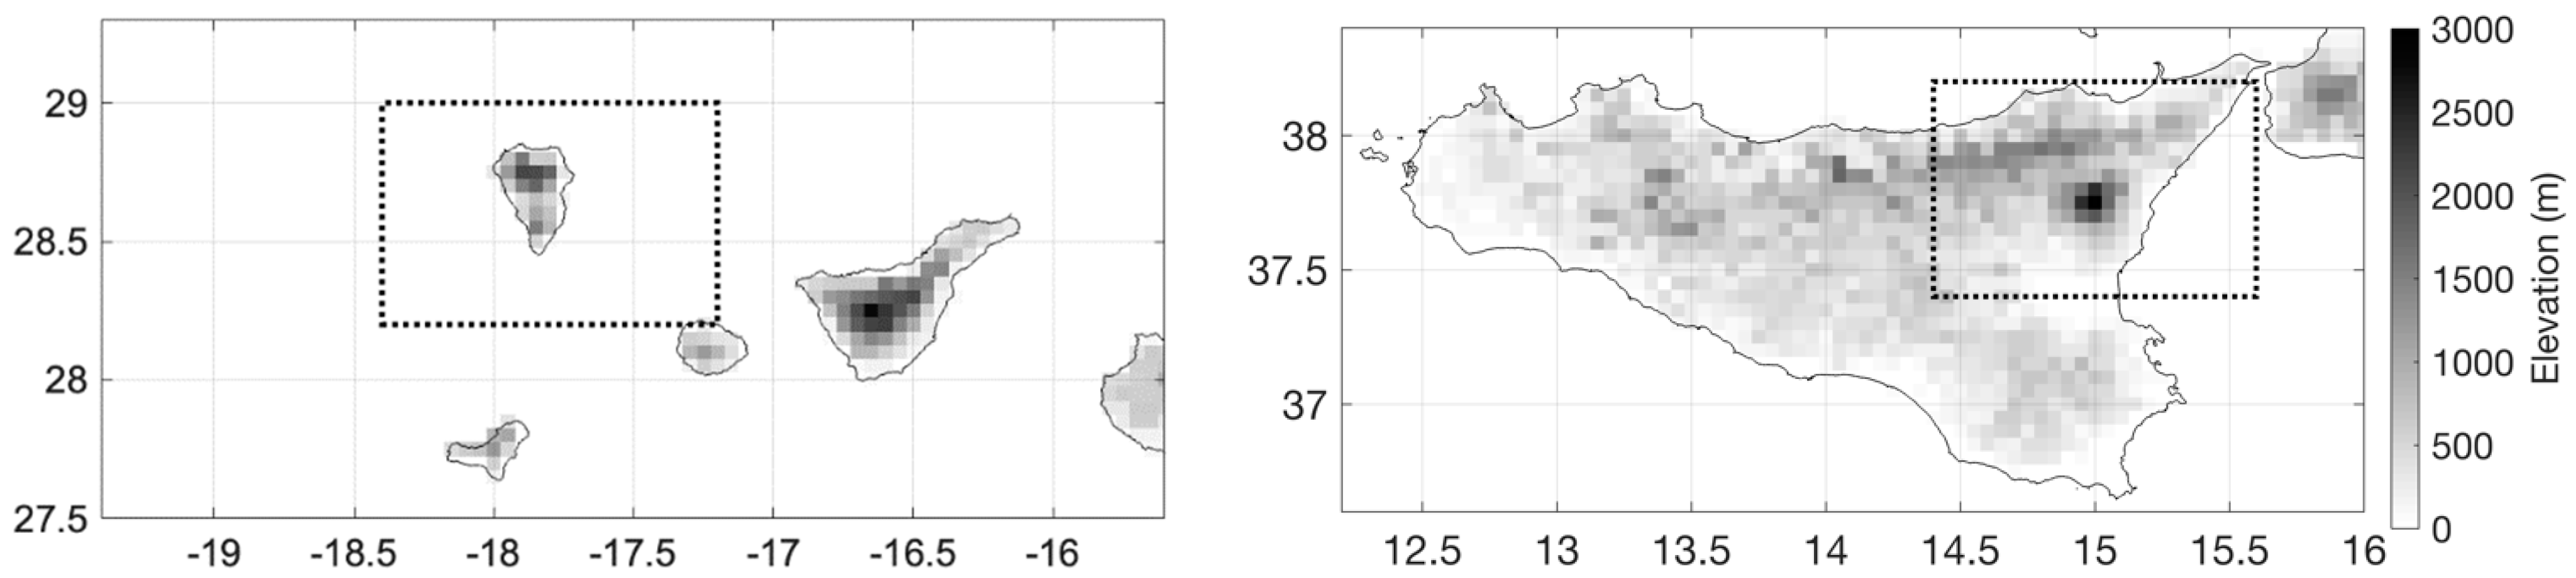
3. Results
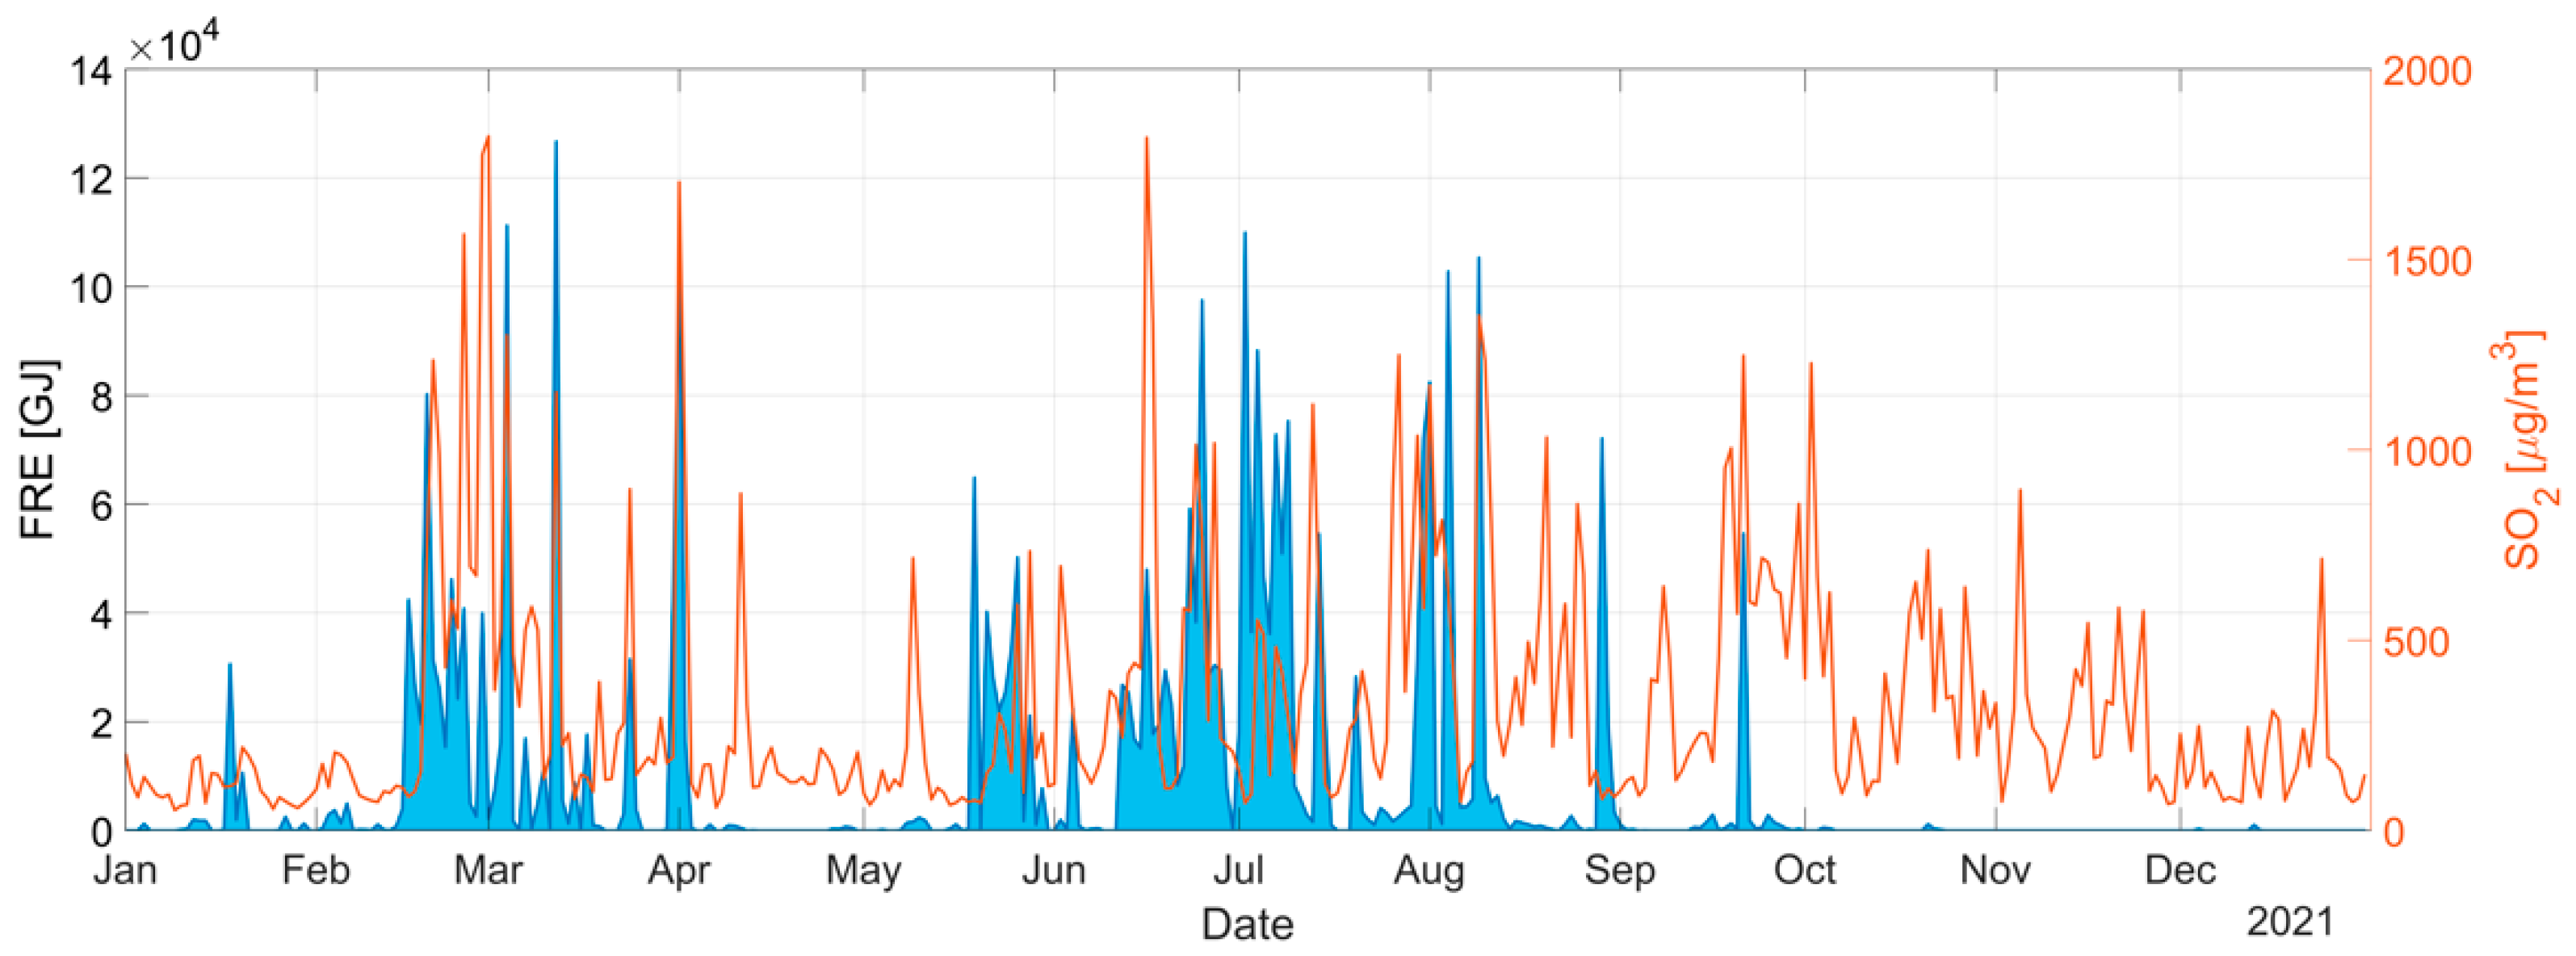
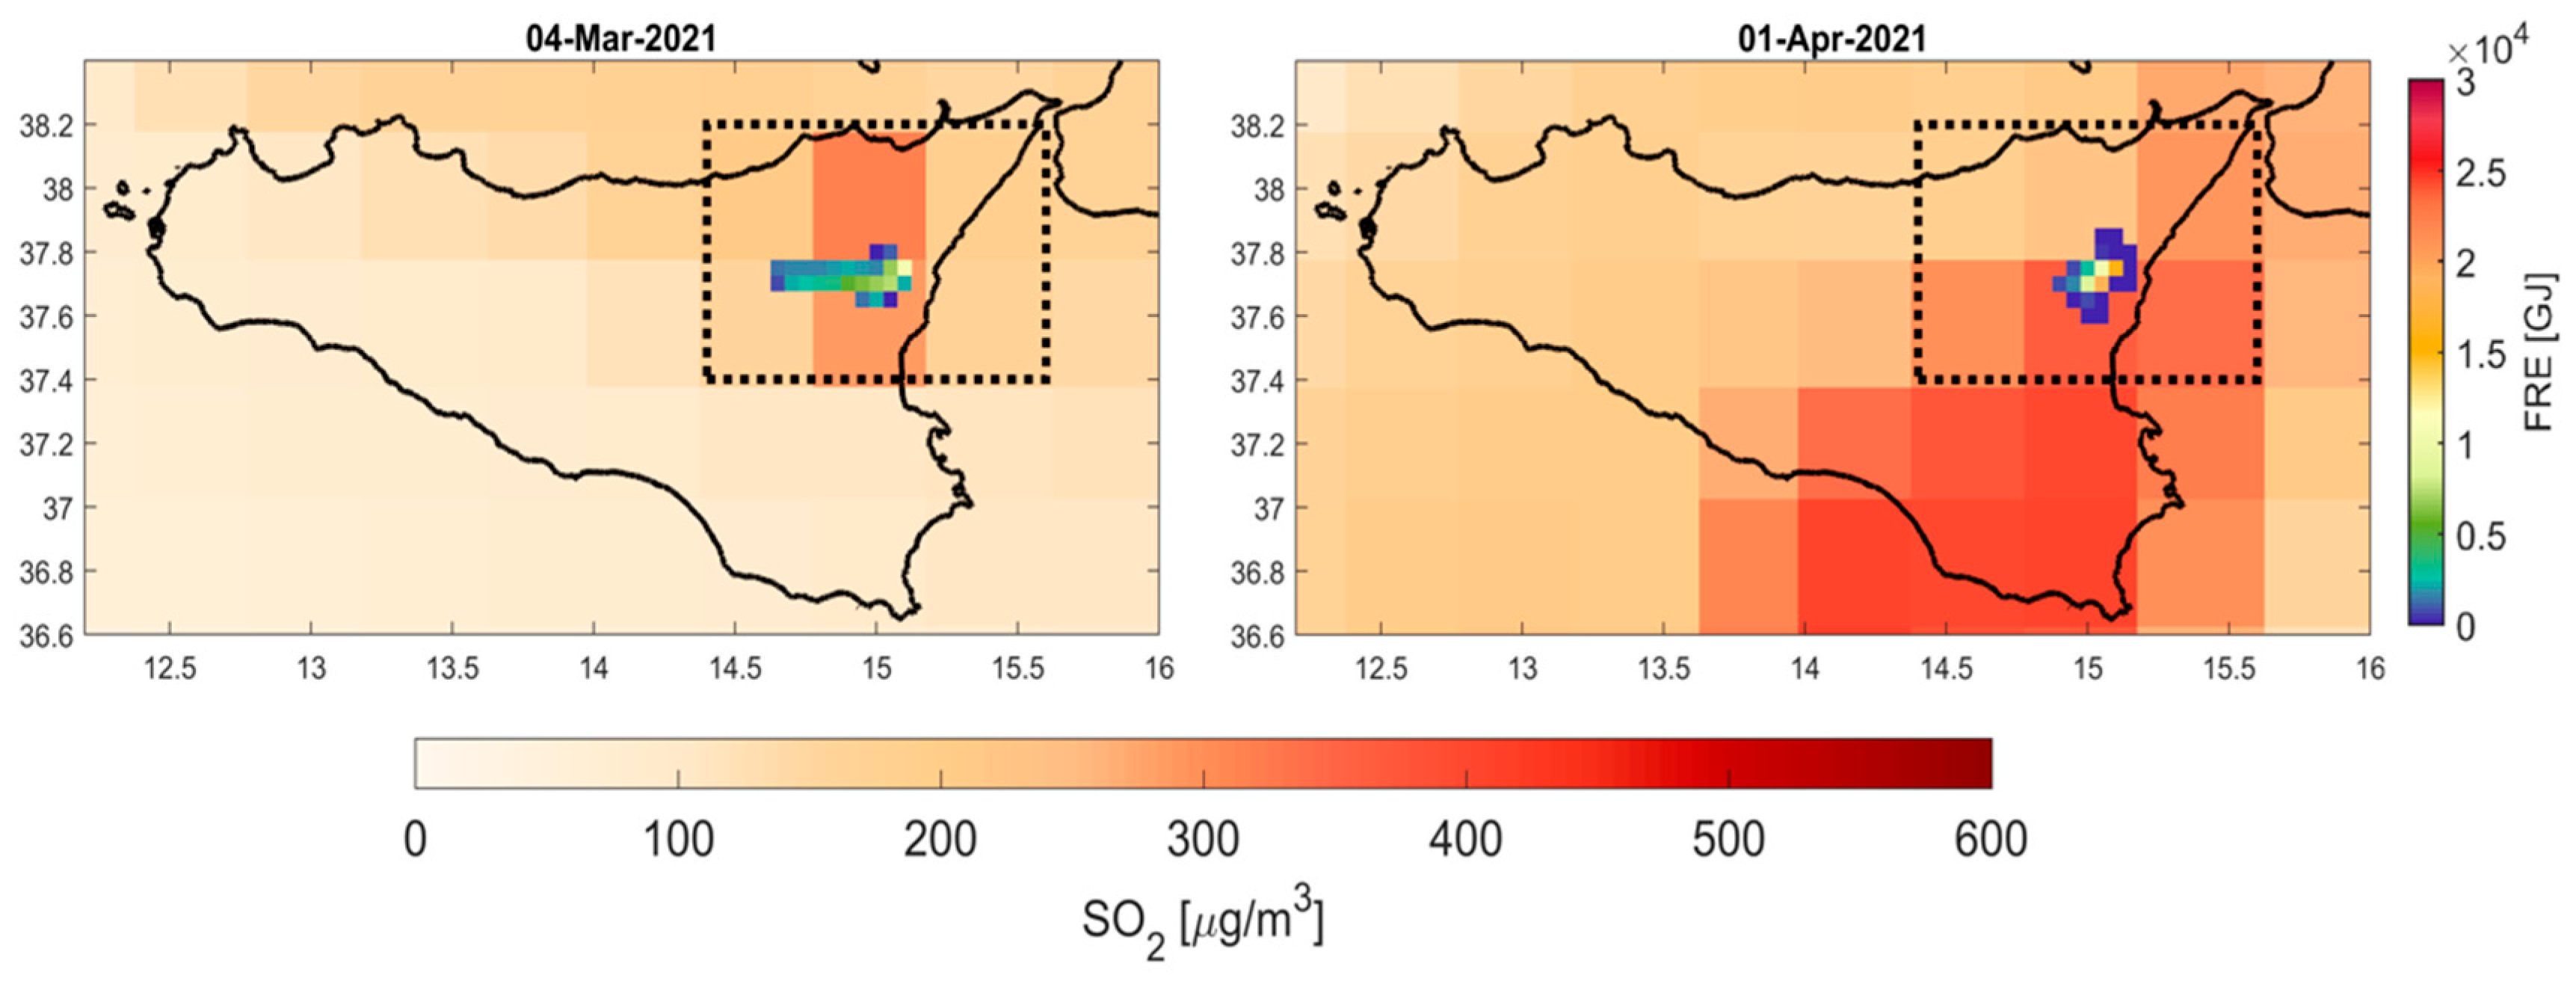
3.1. Volcanic Activity in Mount Etna
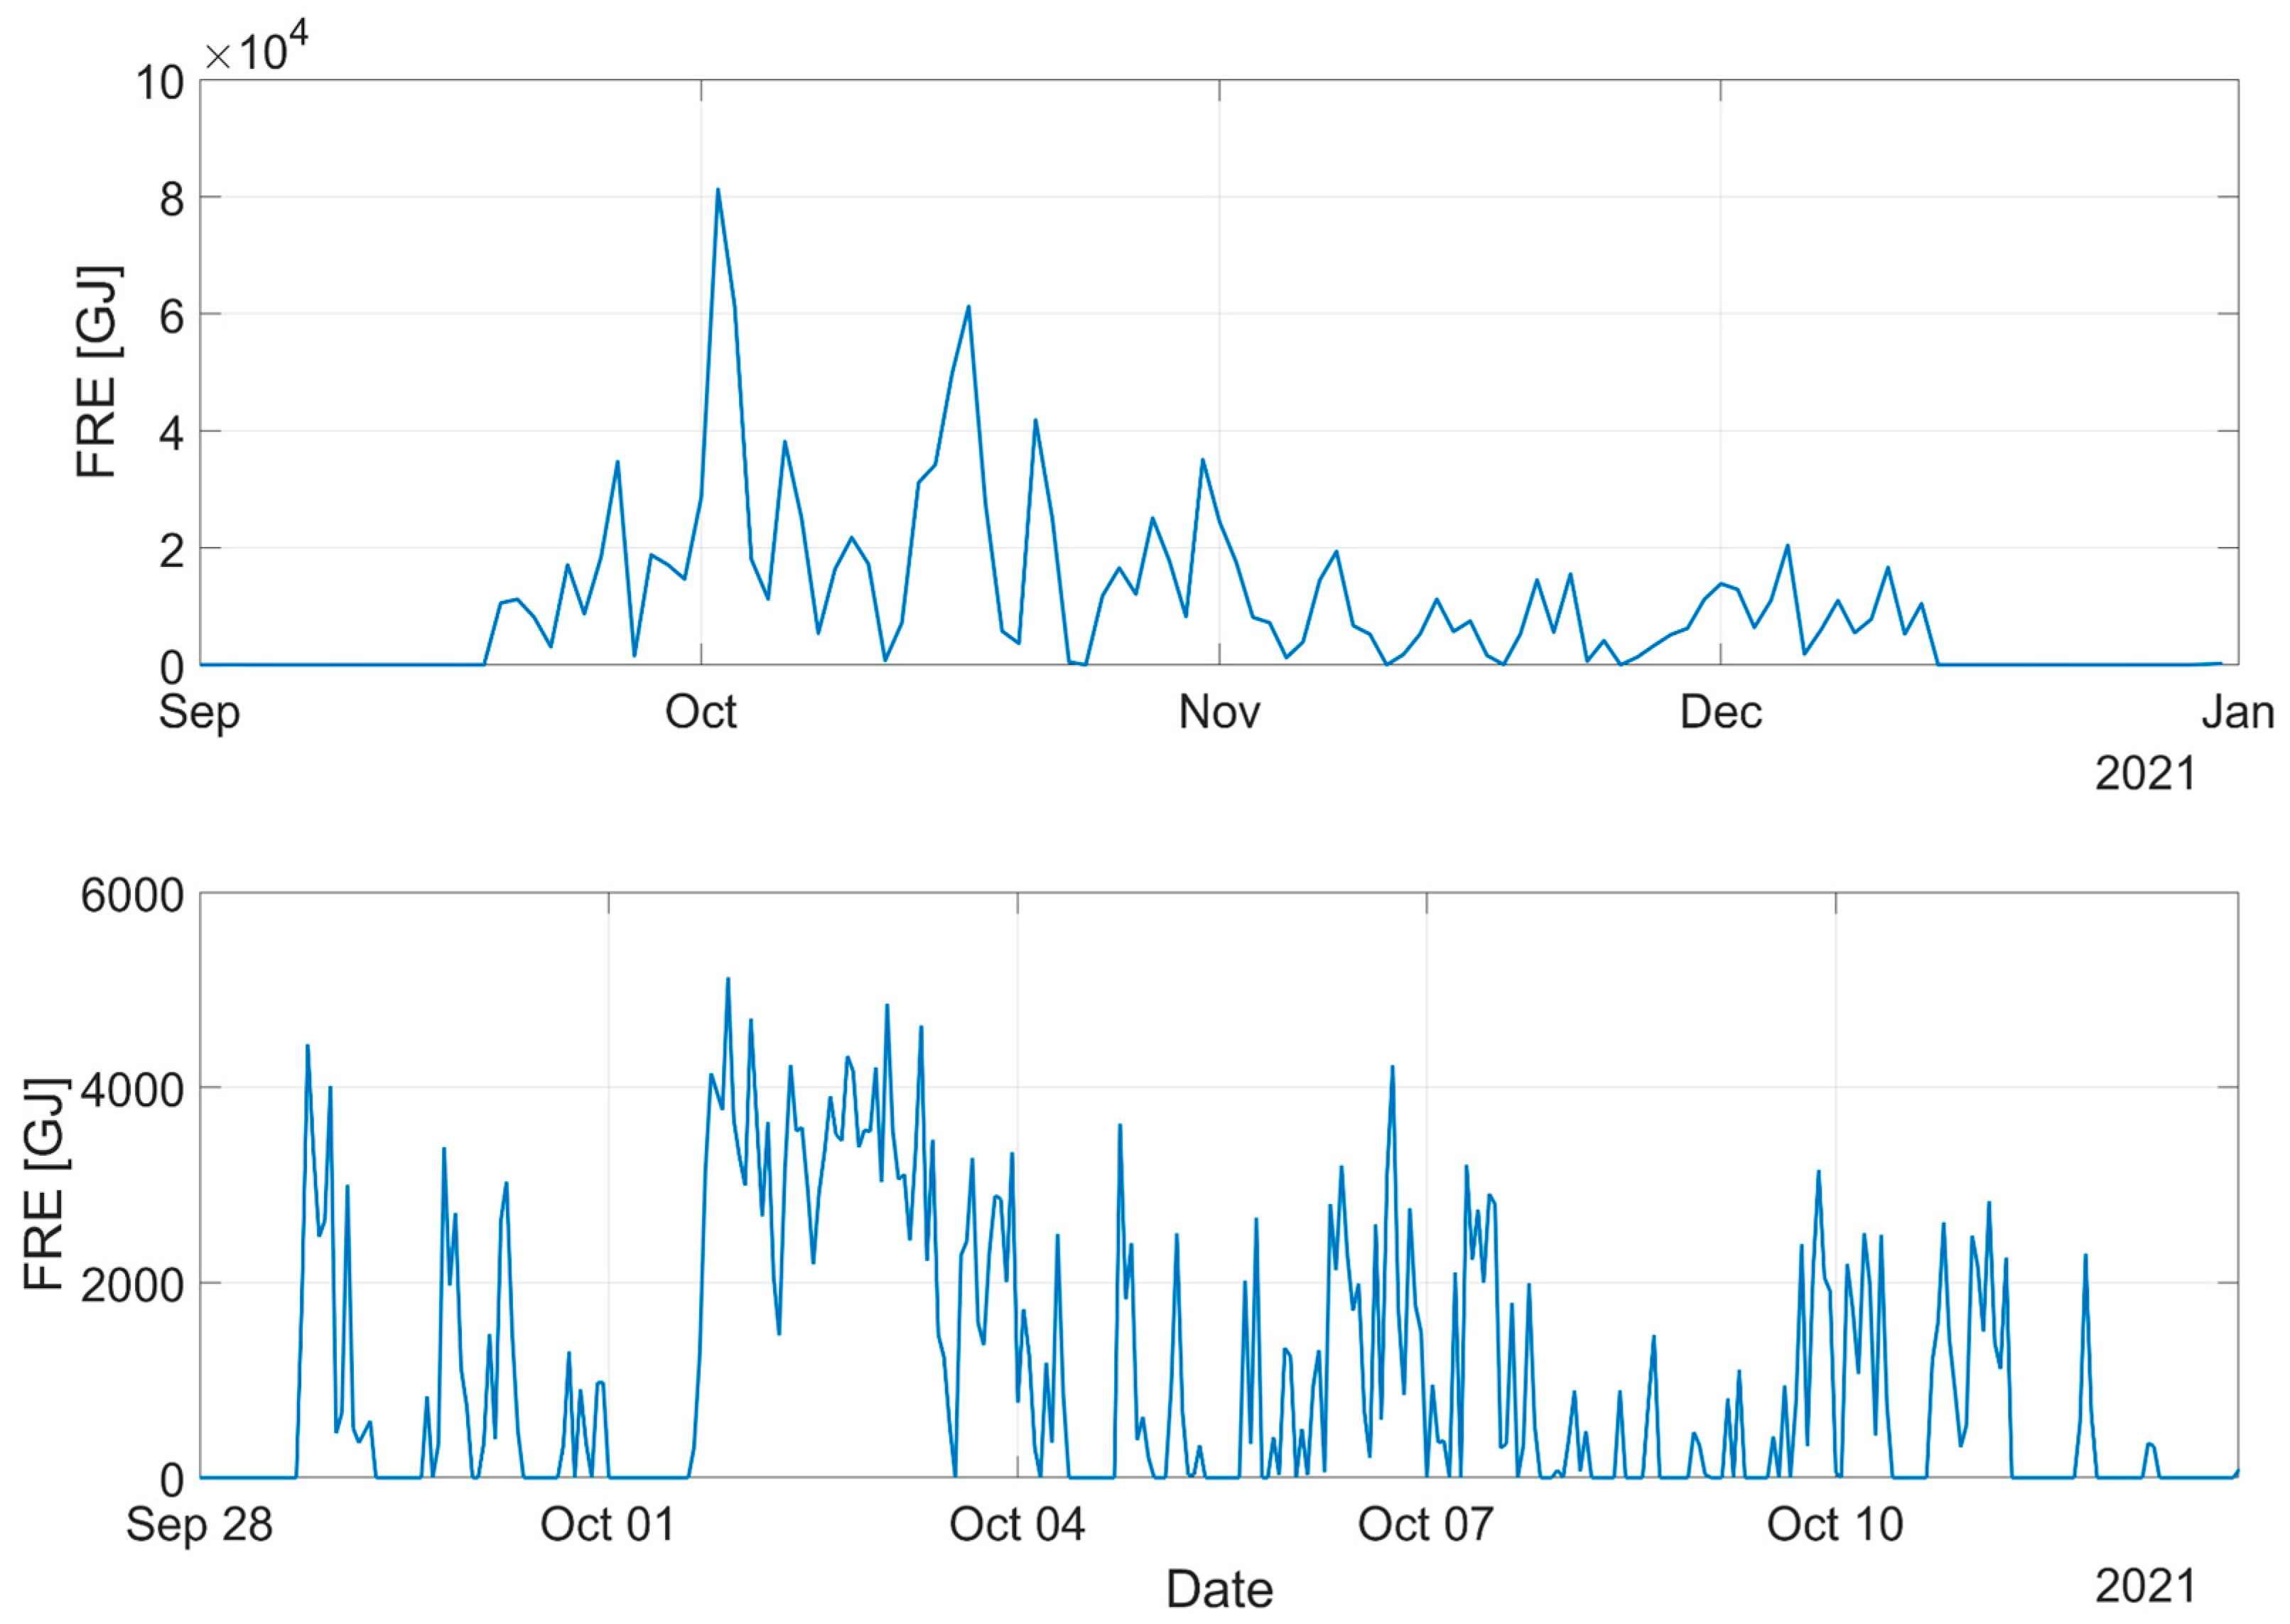
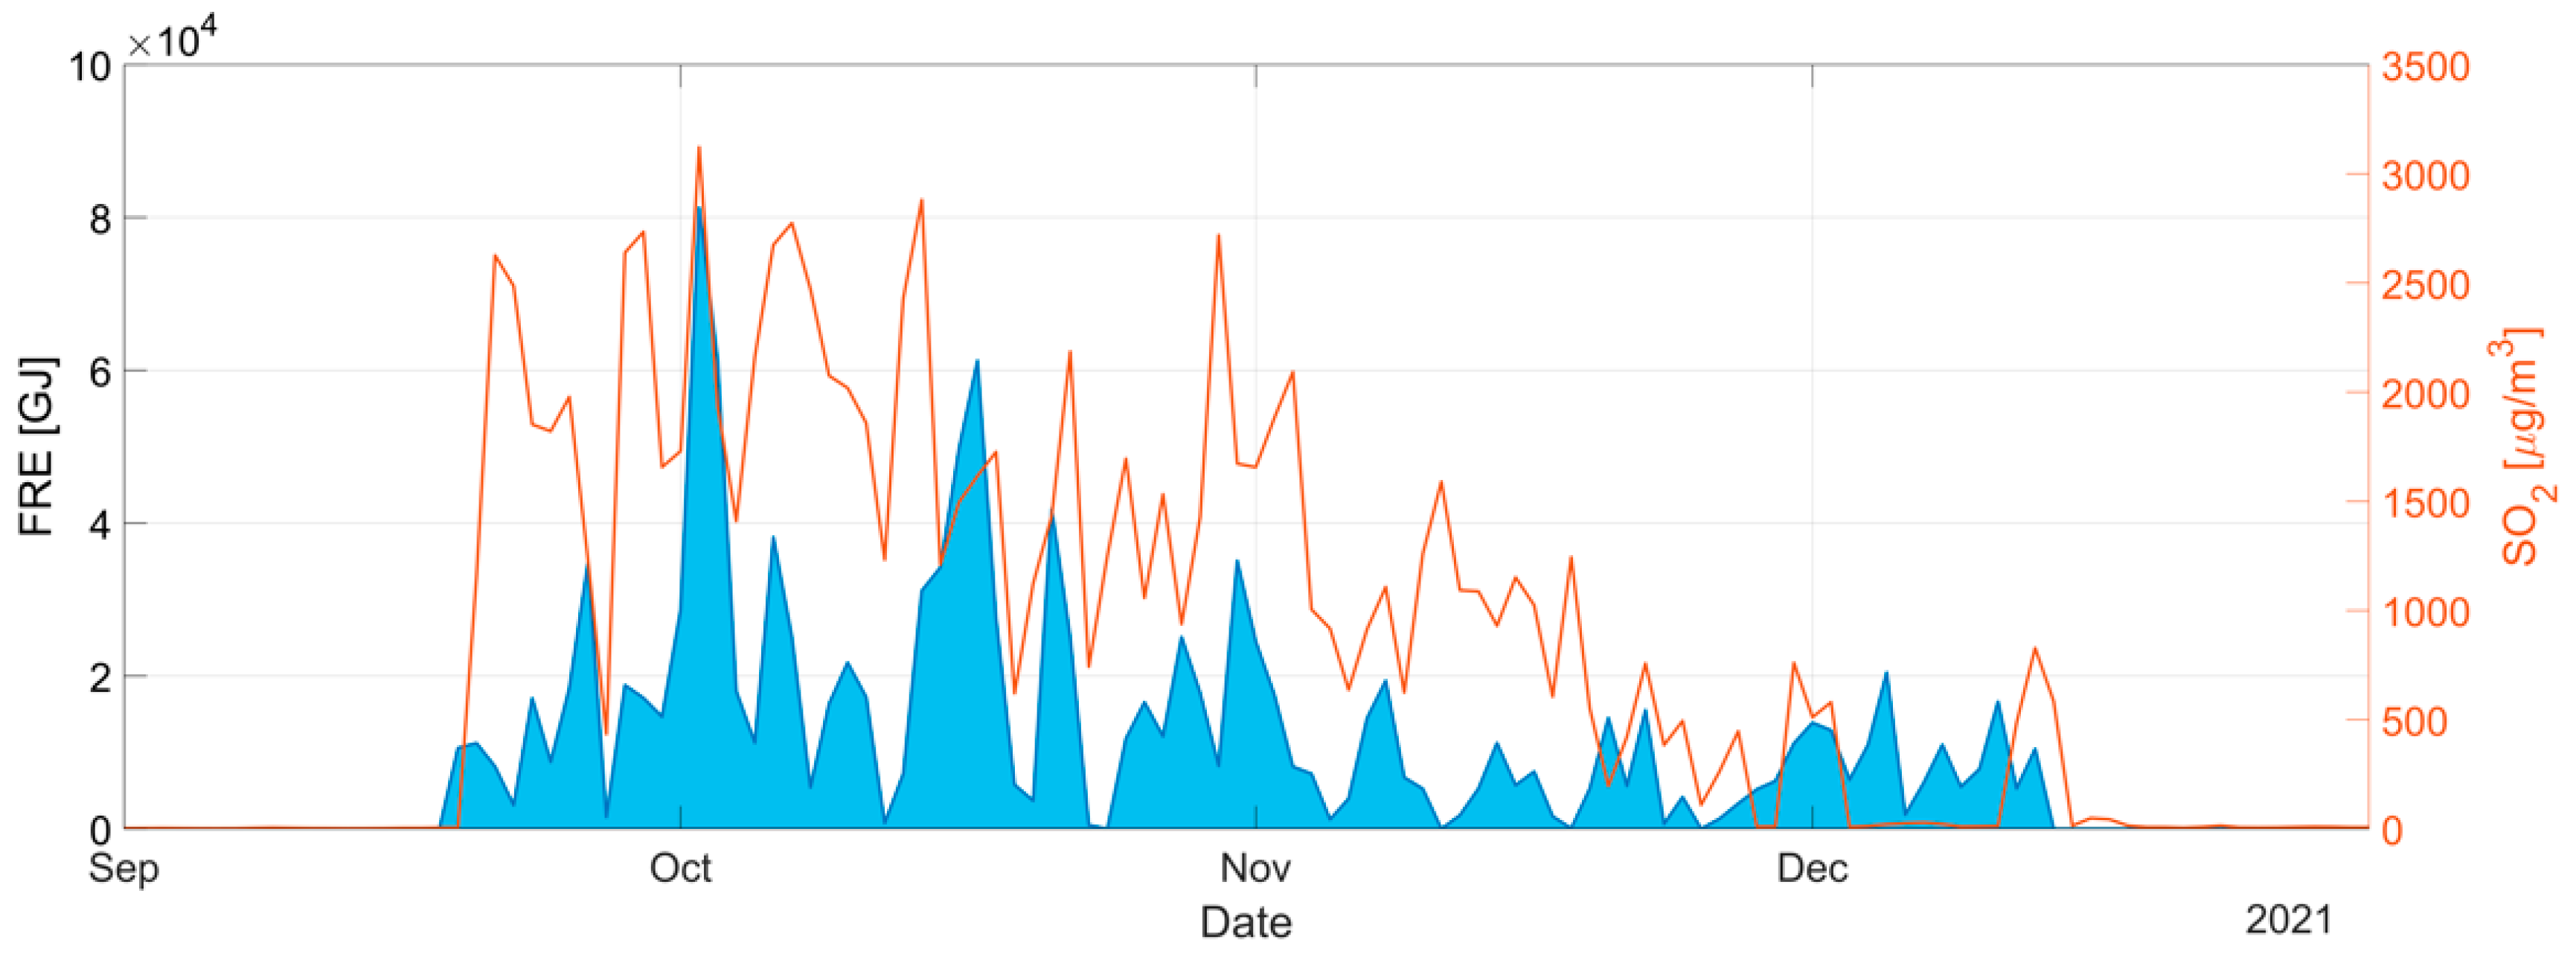
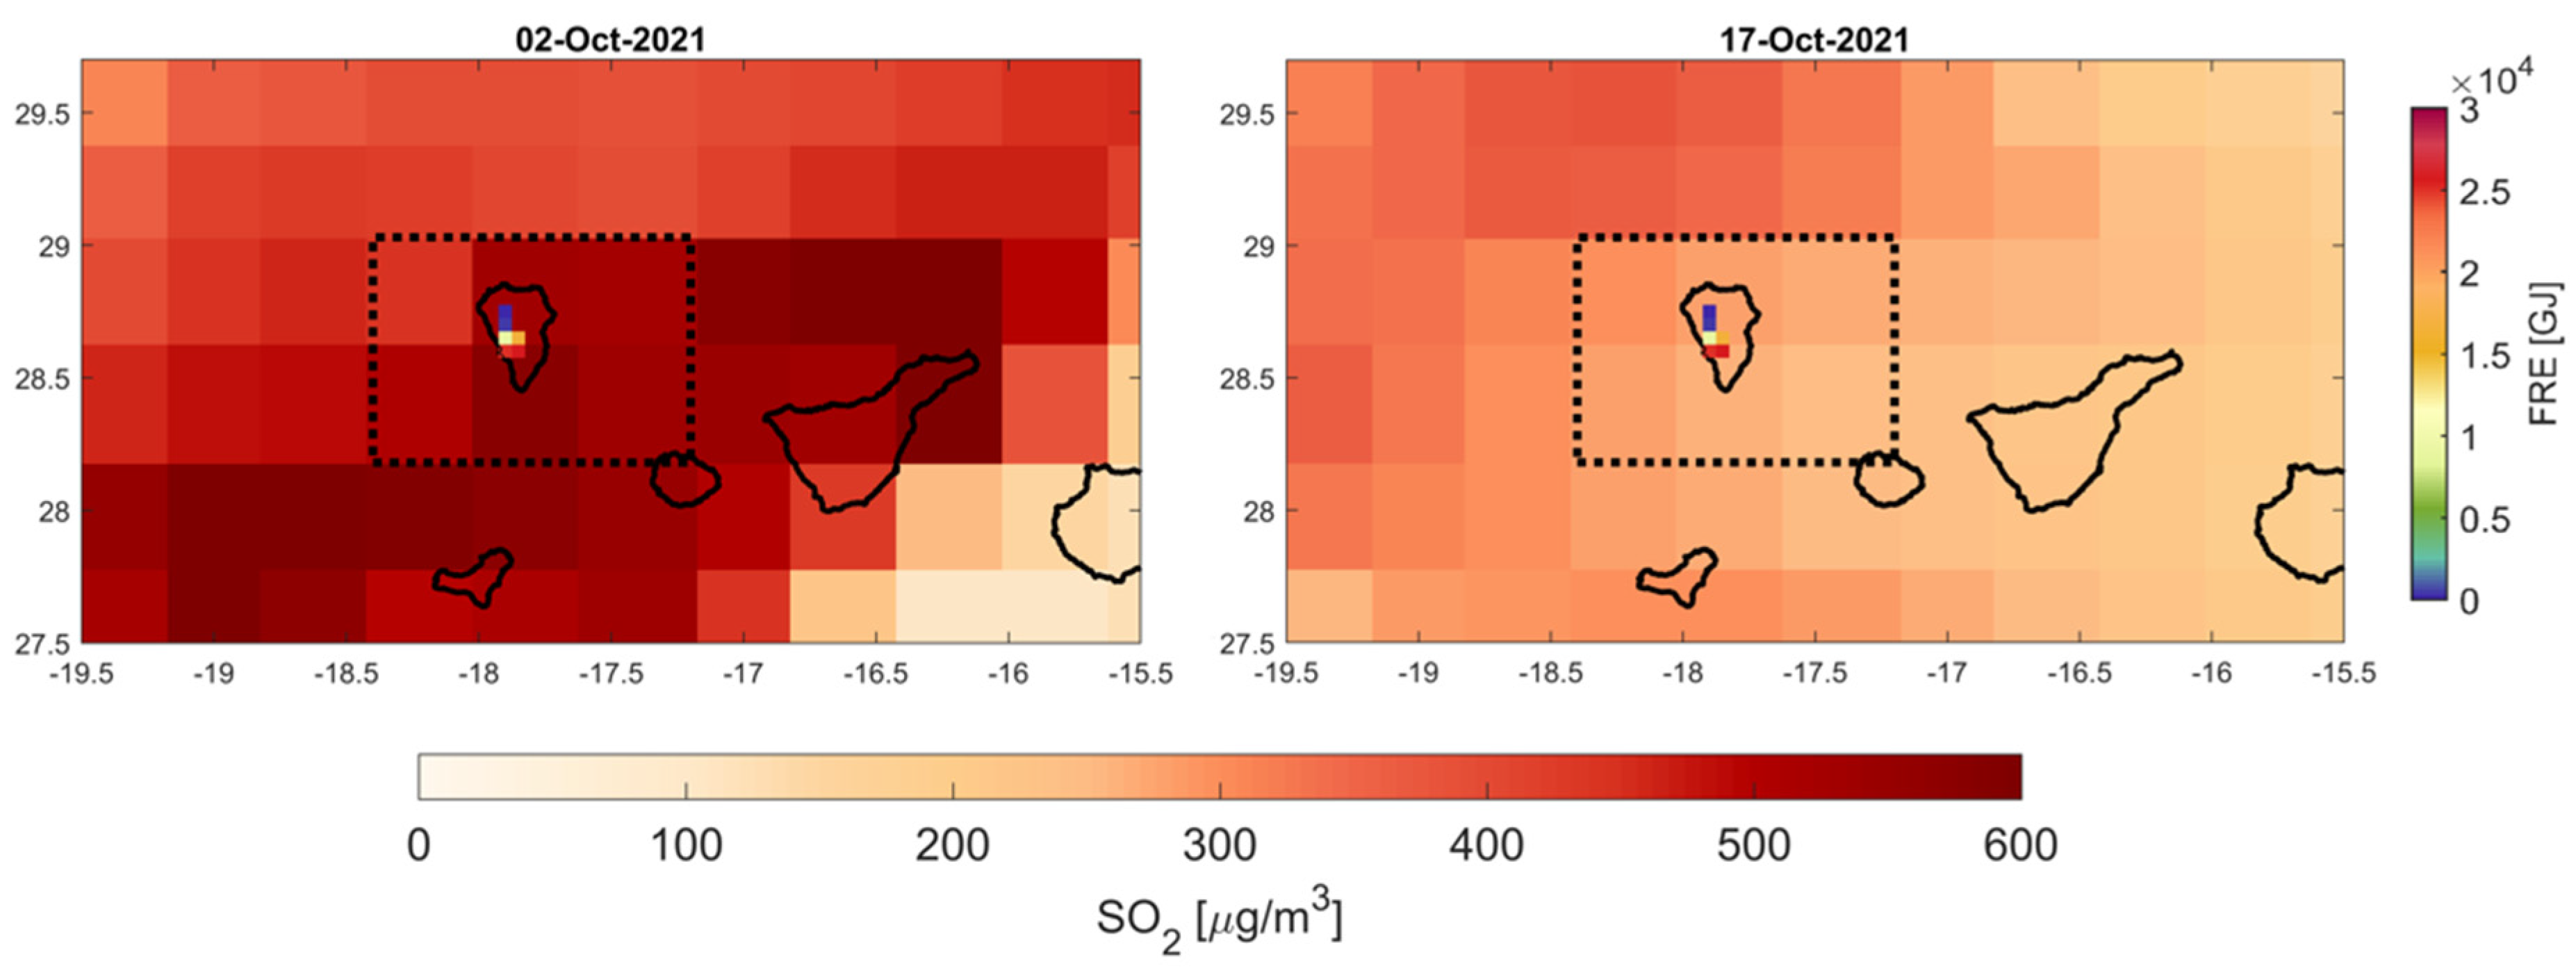
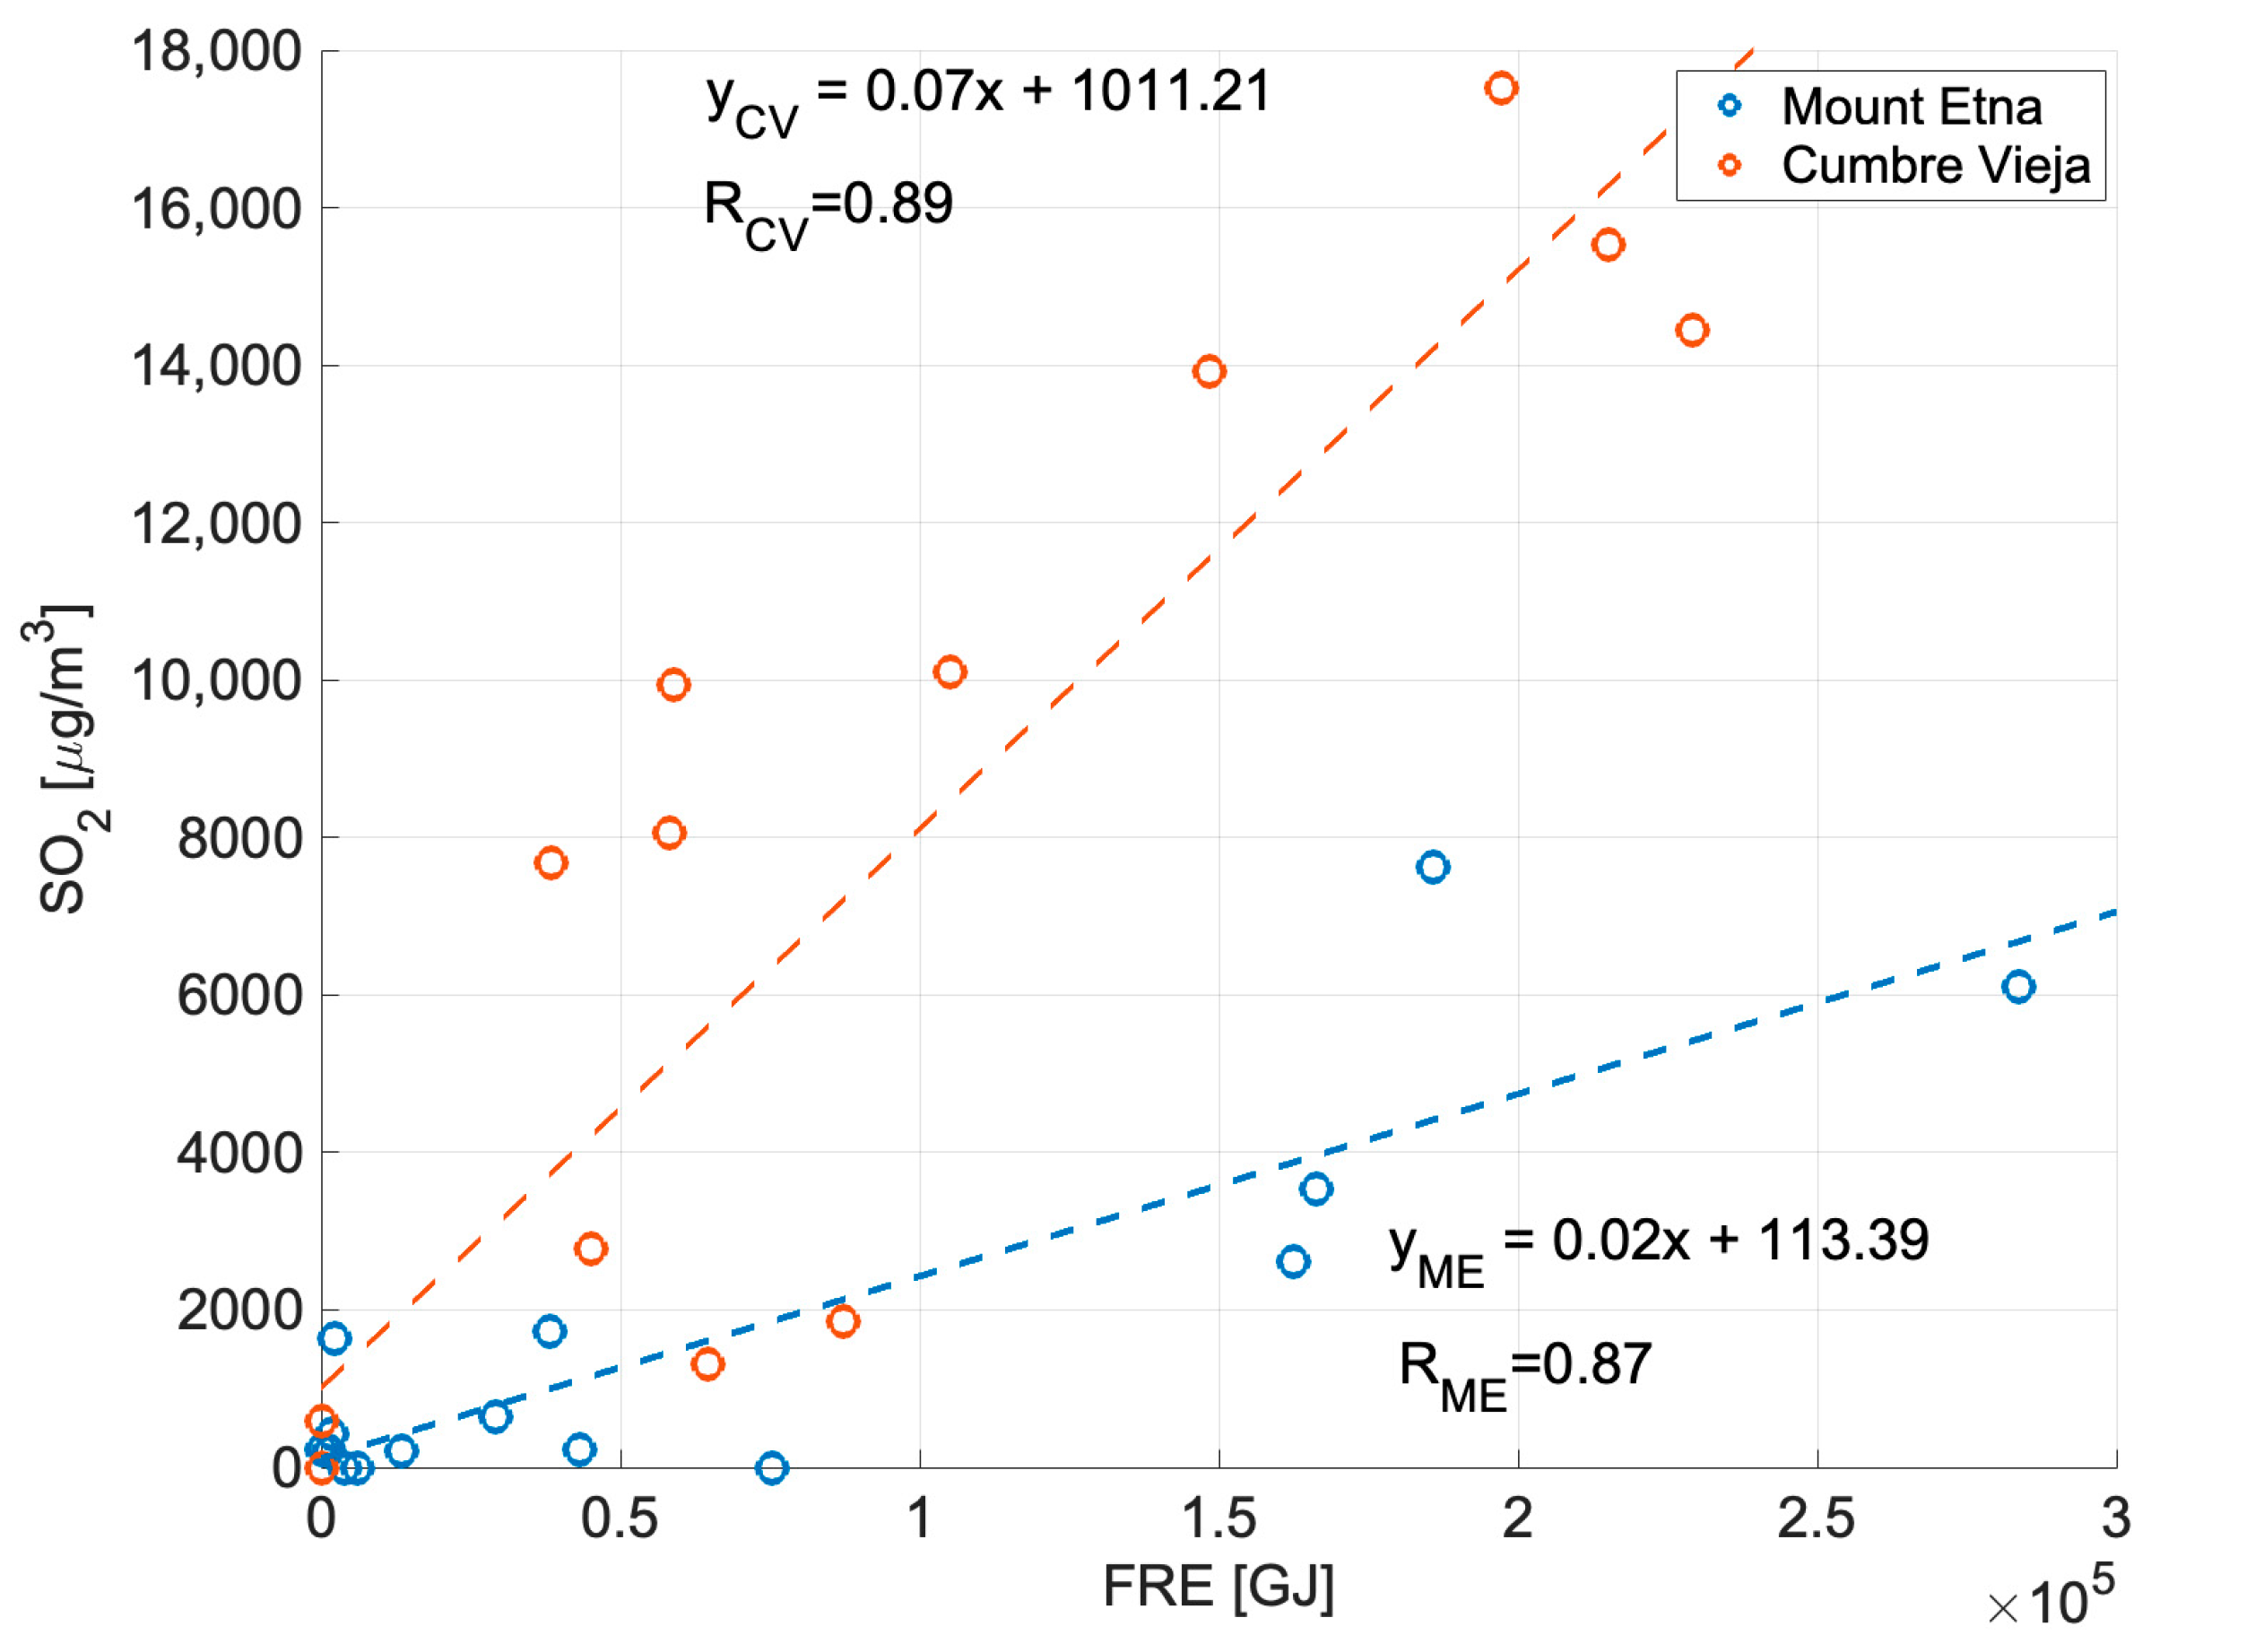
3.2. Volcanic Activity in the Cumbre Vieja
4. Discussion
5. Conclusions
Author Contributions
Funding
Data Availability Statement
Acknowledgments
Conflicts of Interest
References
- United Nations Office for Disaster Risk Reduction. Global Assessment Report on Disaster Risk Reduction 2022: Our World at Risk: Transforming Governance for a Resilient Future; UNDRR: Geneva, Switzerland, 2022; ISBN 92-1-001505-3. [Google Scholar]
- Edwards, J.; Anchukaitis, K.J.; Gunnarson, B.E.; Pearson, C.; Seftigen, K.; von Arx, G.; Linderholm, H.W. The Origin of Tree-ring Reconstructed Summer Cooling in Northern Europe during the 18th Century Eruption of Laki. Paleoceanogr. Paleoclimatology 2022, 37, e2021PA004386. [Google Scholar] [CrossRef]
- Trigo, R.M.; Vaquero, J.M.; Alcoforado, M.-J.; Barriendos, M.; Taborda, J.; García-Herrera, R.; Luterbacher, J. Iberia in 1816, the Year without a Summer. Int. J. Climatol. 2009, 29, 99–115. [Google Scholar] [CrossRef]
- Mani, L.; Tzachor, A.; Cole, P. Global Catastrophic Risk from Lower Magnitude Volcanic Eruptions. Nat. Commun. 2021, 12, 4756. [Google Scholar] [CrossRef]
- Wilson, N.; Valler, V.; Cassidy, M.; Boyd, M.; Mani, L.; Brönnimann, S. Impact of the Tambora Volcanic Eruption of 1815 on Islands and Relevance to Future Sunlight-Blocking Catastrophes. Sci. Rep. 2023, 13, 3649. [Google Scholar] [CrossRef] [PubMed]
- Branca, S.; Del Carlo, P. Eruptions of Mt. Etna during the Past 3,200 Years: A Revised Compilation Integrating the Historical and Stratigraphic Records. In Mt. Etna: Volcano Laboratory; Geophysical Monograph Series; American Geophysical Union: Washington, DC, USA, 2004; Volume 143, pp. 1–27. ISBN 978-0-87590-408-5. [Google Scholar]
- Gudmundsson, M.T.; Thordarson, T.; Höskuldsson, Á.; Larsen, G.; Björnsson, H.; Prata, F.J.; Oddsson, B.; Magnússon, E.; Högnadóttir, T.; Petersen, G.N.; et al. Ash Generation and Distribution from the April–May 2010 Eruption of Eyjafjallajökull, Iceland. Sci. Rep. 2012, 2, 572. [Google Scholar] [CrossRef]
- Oxford Economics. The Economic Impacts of Air Travel Restrictions Due to Volcanic Ash; Oxford Economics: Oxford, UK, 2010; pp. 1–15. [Google Scholar]
- Rodríguez-Hernández, Á.; Díaz-Díaz, R.; Zumbado, M.; Bernal-Suárez, M.d.M.; Acosta-Dacal, A.; Macías-Montes, A.; Travieso-Aja, M.d.M.; Rial-Berriel, C.; Henríquez Hernández, L.A.; Boada, L.D.; et al. Impact of Chemical Elements Released by the Volcanic Eruption of La Palma (Canary Islands, Spain) on Banana Agriculture and European Consumers. Chemosphere 2022, 293, 133508. [Google Scholar] [CrossRef]
- Caricchi, L.; Townsend, M.; Rivalta, E.; Namiki, A. The Build-up and Triggers of Volcanic Eruptions. Nat. Rev. Earth Environ. 2021, 2, 458–476. [Google Scholar] [CrossRef]
- Lewis, N.; Moretti, A. Understanding Volcano Hazards and Preventing Volcanic Disasters: A Science Strategy for the Volcano Hazards Program 2004–2008. In Volcanoes: Formation, Eruptions and Modelling; Nova Science Publishers: Hauppauge, NY, USA, 2009; pp. 243–314. [Google Scholar]
- Sparks, R.S.J. Forecasting Volcanic Eruptions. Earth Planet. Sci. Lett. 2003, 210, 1–15. [Google Scholar] [CrossRef]
- Sparks, R.S.J.; Biggs, J.; Neuberg, J.W. Monitoring Volcanoes. Science 2012, 335, 1310–1311. [Google Scholar] [CrossRef]
- Tilling, R.I. The Critical Role of Volcano Monitoring in Risk Reduction. Adv. Geosci. 2008, 14, 3–11. [Google Scholar] [CrossRef]
- Phillipson, G.; Sobradelo, R.; Gottsmann, J. Global Volcanic Unrest in the 21st Century: An Analysis of the First Decade. J. Volcanol. Geotherm. Res. 2013, 264, 183–196. [Google Scholar] [CrossRef]
- Pallister, J.; McNutt, S.R. Chapter 66—Synthesis of Volcano Monitoring. In The Encyclopedia of Volcanoes, 2nd ed.; Sigurdsson, H., Ed.; Academic Press: Amsterdam, The Netherlands, 2015; pp. 1151–1171. ISBN 978-0-12-385938-9. [Google Scholar]
- Reath, K.; Pritchard, M.; Poland, M.; Delgado, F.; Carn, S.; Coppola, D.; Andrews, B.; Ebmeier, S.K.; Rumpf, E.; Henderson, S.; et al. Thermal, Deformation, and Degassing Remote Sensing Time Series (CE 2000–2017) at the 47 Most Active Volcanoes in Latin America: Implications for Volcanic Systems. J. Geophys. Res. Solid Earth 2019, 124, 195–218. [Google Scholar] [CrossRef]
- Corradini, S.; Guerrieri, L.; Stelitano, D.; Salerno, G.; Scollo, S.; Merucci, L.; Prestifilippo, M.; Musacchio, M.; Silvestri, M.; Lombardo, V.; et al. Near Real-Time Monitoring of the Christmas 2018 Etna Eruption Using SEVIRI and Products Validation. Remote Sens. 2020, 12, 1336. [Google Scholar] [CrossRef]
- Guerrieri, L.; Merucci, L.; Corradini, S.; Pugnaghi, S. Evolution of the 2011 Mt. Etna Ash and SO2 Lava Fountain Episodes Using SEVIRI Data and VPR Retrieval Approach. J. Volcanol. Geotherm. Res. 2015, 291, 63–71. [Google Scholar] [CrossRef]
- Andronico, D.; Lodato, L. Effusive Activity at Mount Etna Volcano (Italy) During the 20th Century: A Contribution to Volcanic Hazard Assessment. Nat. Hazards 2005, 36, 407–443. [Google Scholar] [CrossRef]
- Xu, W.; Xie, L.; Aoki, Y.; Rivalta, E.; Jónsson, S. Volcano-Wide Deformation after the 2017 Erta Ale Dike Intrusion, Ethiopia, Observed With Radar Interferometry. J. Geophys. Res. Solid Earth 2020, 125, e2020JB019562. [Google Scholar] [CrossRef]
- Grainger, R.G.; Highwood, E.J. Changes in Stratospheric Composition, Chemistry, Radiation and Climate Caused by Volcanic Eruptions. Geol. Soc. Lond. Spec. Publ. 2003, 213, 329–347. [Google Scholar] [CrossRef]
- Salgueiro, V.; Guerrero-Rascado, J.L.; Costa, M.J.; Román, R.; Cazorla, A.; Serrano, A.; Molero, F.; Sicard, M.; Córdoba-Jabonero, C.; Bortoli, D.; et al. Characterization of Tajogaite Volcanic Plumes Detected over the Iberian Peninsula from a Set of Satellite and Ground-Based Remote Sensing Instrumentation. Remote Sens. Environ. 2023, 295, 113684. [Google Scholar] [CrossRef]
- Minnis, P.; Harrison, E.F.; Stowe, L.L.; Gibson, G.G.; Denn, F.M.; Doelling, D.R.; Smith, W.L. Radiative Climate Forcing by the Mount Pinatubo Eruption. Science 1993, 259, 1411–1415. [Google Scholar] [CrossRef]
- Millán, L.; Santee, M.L.; Lambert, A.; Livesey, N.J.; Werner, F.; Schwartz, M.J.; Pumphrey, H.C.; Manney, G.L.; Wang, Y.; Su, H.; et al. The Hunga Tonga-Hunga Ha’apai Hydration of the Stratosphere. Geophys. Res. Lett. 2022, 49, e2022GL099381. [Google Scholar] [CrossRef]
- Graf, H.-F.; Feichter, J.; Langmann, B. Volcanic Sulfur Emissions: Estimates of Source Strength and Its Contribution to the Global Sulfate Distribution. J. Geophys. Res. 1997, 102, 10727–10738. [Google Scholar] [CrossRef]
- Takebayashi, M.; Onishi, M.; Iguchi, M. Large Volcanic Eruptions and Their Influence on Air Transport: The Case of Japan. J. Air Transp. Manag. 2021, 97, 102136. [Google Scholar] [CrossRef]
- Krotkov, N.A.; Schoeberl, M.R.; Morris, G.A.; Carn, S.; Yang, K. Dispersion and Lifetime of the SO 2 Cloud from the August 2008 Kasatochi Eruption. J. Geophys. Res. 2010, 115, D00L20. [Google Scholar] [CrossRef]
- Wang, J.; Park, S.; Zeng, J.; Ge, C.; Yang, K.; Carn, S.; Krotkov, N.; Omar, A.H. Modeling of 2008 Kasatochi Volcanic Sulfate Direct Radiative Forcing: Assimilation of OMI SO2 Plume Height Data and Comparison with MODIS and CALIOP Observations. Atmos. Chem. Phys. 2013, 13, 1895–1912. [Google Scholar] [CrossRef]
- van Thriel, C.; Schäper, M.; Kleinbeck, S.; Kiesswetter, E.; Blaszkewicz, M.; Golka, K.; Nies, E.; Raulf-Heimsoth, M.; Brüning, T. Sensory and Pulmonary Effects of Acute Exposure to Sulfur Dioxide (SO2). Toxicol. Lett. 2010, 196, 42–50. [Google Scholar] [CrossRef]
- Hansell, A.; Oppenheimer, C. Health Hazards from Volcanic Gases: A Systematic Literature Review. Arch. Environ. Health Int. J. 2004, 59, 628–639. [Google Scholar] [CrossRef]
- Manisalidis, I.; Stavropoulou, E.; Stavropoulos, A.; Bezirtzoglou, E. Environmental and Health Impacts of Air Pollution: A Review. Front. Public Health 2020, 8, 14. [Google Scholar] [CrossRef]
- Pavlidou, E.; Hecker, C.; Van Der Werff, H.; Van Der Meijde, M. Study of Volcanic Activity at Different Time Scales Using Hypertemporal Land Surface Temperature Data: Study of Volcanic Activity With LST Data. J. Geophys. Res. Solid Earth 2017, 122, 7613–7625. [Google Scholar] [CrossRef]
- Coppola, D.; Laiolo, M.; Cigolini, C.; Massimetti, F.; Delle Donne, D.; Ripepe, M.; Arias, H.; Barsotti, S.; Parra, C.B.; Centeno, R.G.; et al. Thermal Remote Sensing for Global Volcano Monitoring: Experiences From the MIROVA System. Front. Earth Sci. 2020, 7, 362. [Google Scholar] [CrossRef]
- Ganci, G.; Harris, A.J.L.; Del Negro, C.; Guehenneux, Y.; Cappello, A.; Labazuy, P.; Calvari, S.; Gouhier, M. A Year of Lava Fountaining at Etna: Volumes from SEVIRI. Geophys. Res. Lett. 2012, 39, L06305. [Google Scholar] [CrossRef]
- Gouhier, M.; Harris, A.; Calvari, S.; Labazuy, P.; Guéhenneux, Y.; Donnadieu, F.; Valade, S. Lava Discharge during Etna’s January 2011 Fire Fountain Tracked Using MSG-SEVIRI. Bull. Volcanol. 2012, 74, 787–793. [Google Scholar] [CrossRef]
- Corradini, S.; Montopoli, M.; Guerrieri, L.; Ricci, M.; Scollo, S.; Merucci, L.; Marzano, F.S.; Pugnaghi, S.; Prestifilippo, M.; Ventress, L.J.; et al. A Multi-Sensor Approach for Volcanic Ash Cloud Retrieval and Eruption Characterization: The 23 November 2013 Etna Lava Fountain. Remote Sens. 2016, 8, 58. [Google Scholar] [CrossRef]
- Wooster, M.J.; Roberts, G.; Freeborn, P.H.; Xu, W.; Govaerts, Y.; Beeby, R.; He, J.; Lattanzio, A.; Fisher, D.; Mullen, R. LSA SAF Meteosat FRP Products—Part 1: Algorithms, Product Contents, and Analysis. Atmos. Chem. Phys. 2015, 15, 13217–13239. [Google Scholar] [CrossRef]
- Philpotts, A.R.; Ague, J.J. Principles of Igneous and Metamorphic Petrology, 3rd ed.; Cambridge University Press: Cambridge, UK, 2022; ISBN 978-1-108-63141-9. [Google Scholar]
- Smith, A.M.S.; Wooster, M.J. Remote Classification of Head and Backfire Types from MODIS Fire Radiative Power and Smoke Plume Observations. Int. J. Wildland Fire 2005, 14, 249–254. [Google Scholar] [CrossRef]
- Johnston, J.M.; Wooster, M.J.; Paugam, R.; Wang, X.; Lynham, T.J.; Johnston, L.M. Direct Estimation of Byram’s Fire Intensity from Infrared Remote Sensing Imagery. Int. J. Wildland Fire 2017, 26, 668–684. [Google Scholar] [CrossRef]
- Barberi, F.; Carapezza, M.L.; Valenza, M.; Villari, L. The Control of Lava Flow during the 1991–1992 Eruption of Mt. Etna. J. Volcanol. Geotherm. Res. 1993, 56, 1–34. [Google Scholar] [CrossRef]
- Harris, A.; Steffke, A.; Calvari, S.; Spampinato, L. Thirty Years of Satellite-Derived Lava Discharge Rates at Etna: Implications for Steady Volumetric Output. J. Geophys. Res. 2011, 116, B08204. [Google Scholar] [CrossRef]
- Proietti, C.; Coltelli, M.; Marsella, M.; Martino, M.; Scifoni, S.; Giannone, F. Towards a Satellite-Based Approach to Measure Eruptive Volumes at Mt. Etna Using Pleiades Datasets. Bull. Volcanol. 2020, 82, 35. [Google Scholar] [CrossRef]
- Bisson, M.; Spinetti, C.; Andronico, D.; Palaseanu-Lovejoy, M.; Fabrizia Buongiorno, M.; Alexandrov, O.; Cecere, T. Ten Years of Volcanic Activity at Mt Etna: High-Resolution Mapping and Accurate Quantification of the Morphological Changes by Pleiades and Lidar Data. Int. J. Appl. Earth Obs. Geoinf. 2021, 102, 102369. [Google Scholar] [CrossRef]
- Longpré, M.-A. Reactivation of Cumbre Vieja Volcano. Science 2021, 374, 1197–1198. [Google Scholar] [CrossRef]
- Branca, S.; Coltelli, M.; Groppelli, G.; Lentini, F. Geological Map of Etna Volcano, 1:50,000 Scale. Ital. J. Geosci. 2011, 130, 265–291. [Google Scholar] [CrossRef]
- Stothers, R.B.; Rampino, M.R. Historic Volcanism, European Dry Fogs, and Greenland Acid Precipitation, 1500 B.C. to A.D. 1500. Science 1983, 222, 411–413. [Google Scholar] [CrossRef] [PubMed]
- Calvari, S.; Nunnari, G. Etna Output Rate during the Last Decade (2011–2022): Insights for Hazard Assessment. Remote Sens. 2022, 14, 6183. [Google Scholar] [CrossRef]
- Mulas, M.; Cioni, R.; Andronico, D.; Mundula, F. The Explosive Activity of the 1669 Monti Rossi Eruption at Mt. Etna (Italy). J. Volcanol. Geotherm. Res. 2016, 328, 115–133. [Google Scholar] [CrossRef]
- Branca, S.; De Beni, E.; Proietti, C. The Large and Destructive 1669 AD Eruption at Etna Volcano: Reconstruction of the Lava Flow Field Evolution and Effusion Rate Trend. Bull. Volcanol. 2013, 75, 694. [Google Scholar] [CrossRef]
- Archambault, C.; Tanguy, J.C. Comparative Temperature Measurements on Mount Etna Lavas: Problems and Techniques. J. Volcanol. Geotherm. Res. 1976, 1, 113–125. [Google Scholar] [CrossRef]
- Klügel, A.; Hansteen, T.H.; Galipp, K. Magma Storage and Underplating beneath Cumbre Vieja Volcano, La Palma (Canary Islands). Earth Planet. Sci. Lett. 2005, 236, 211–226. [Google Scholar] [CrossRef]
- Bonadonna, C.; Pistolesi, M.; Biass, S.; Voloschina, M.; Romero, J.; Coppola, D.; Folch, A.; D’Auria, L.; Martin-Lorenzo, A.; Dominguez, L.; et al. Physical Characterization of Long-Lasting Hybrid Eruptions: The 2021 Tajogaite Eruption of Cumbre Vieja (La Palma, Canary Islands). J. Geophys. Res. Solid Earth 2022, 127, e2022JB025302. [Google Scholar] [CrossRef]
- Muñoz, V.; Walter, T.R.; Zorn, E.U.; Shevchenko, A.V.; González, P.J.; Reale, D.; Sansosti, E. Satellite Radar and Camera Time Series Reveal Transition from Aligned to Distributed Crater Arrangement during the 2021 Eruption of Cumbre Vieja, La Palma (Spain). Remote Sens. 2022, 14, 6168. [Google Scholar] [CrossRef]
- Plank, S.; Shevchenko, A.V.; d’Angelo, P.; Gstaiger, V.; González, P.J.; Cesca, S.; Martinis, S.; Walter, T.R. Combining Thermal, Tri-Stereo Optical and Bi-Static InSAR Satellite Imagery for Lava Volume Estimates: The 2021 Cumbre Vieja Eruption, La Palma. Sci. Rep. 2023, 13, 2057. [Google Scholar] [CrossRef]
- Durão, R.; Alonso, C.; Gouveia, C. The Performance of ECMWF Ensemble Prediction System for European Extreme Fires: Portugal/Monchique in 2018. Atmosphere 2022, 13, 1239. [Google Scholar] [CrossRef]
- Pinto, M.M.; DaCamara, C.C.; Trigo, I.F.; Trigo, R.M.; Turkman, K.F. Fire Danger Rating over Mediterranean Europe Based on Fire Radiative Power Derived from Meteosat. Nat. Hazards Earth Syst. Sci. 2018, 18, 515–529. [Google Scholar] [CrossRef]
- Durand, M.; Grattan, J. Effects of Volcanic Air Pollution on Health. Lancet 2001, 357, 164. [Google Scholar] [CrossRef]
- CAMS Monitors Transport of SO2 from La Palma Volcano|Copernicus. Available online: https://atmosphere.copernicus.eu/cams-monitors-transport-so2-la-palma-volcano (accessed on 11 September 2023).
- Global Volcanism Program. Report on Etna (Italy). In Bulletin of the Global Volcanism Network; Smithsonian Institution: Washington, DC, USA, 2021; Volume 46. [Google Scholar] [CrossRef]
- Global Volcanism Program|Report on Etna (Italy)—17 February–23 February 2021. Available online: https://volcano.si.edu/ShowReport.cfm?wvar=GVP.WVAR20210217-211060 (accessed on 11 September 2023).
- Global Volcanism Program|Report on Etna (Italy)—30 June–6 July 2021. Available online: https://volcano.si.edu/ShowReport.cfm?wvar=GVP.WVAR20210630-211060 (accessed on 11 September 2023).
- Global Volcanism Program. Report on La Palma (Spain). In Bulletin of the Global Volcanism Network; Smithsonian Institution: Washington, DC, USA, 2021; Volume 46. [Google Scholar] [CrossRef]
- Wooster, M.J.; Roberts, G.; Perry, G.L.W.; Kaufman, Y.J. Retrieval of Biomass Combustion Rates and Totals from Fire Radiative Power Observations: FRP Derivation and Calibration Relationships between Biomass Consumption and Fire Radiative Energy Release. J. Geophys. Res. 2005, 110, D24311. [Google Scholar] [CrossRef]
- Directive 2008/50/EC of the European Parliament and of the Council of 21 May 2008 on Ambient Air Quality and Cleaner Air for Europe; OJ L 152; Special edition in Croatian; European Parliament, Council of the European Union: London, UK, 2008; Volume 029.


Disclaimer/Publisher’s Note: The statements, opinions and data contained in all publications are solely those of the individual author(s) and contributor(s) and not of MDPI and/or the editor(s). MDPI and/or the editor(s) disclaim responsibility for any injury to people or property resulting from any ideas, methods, instructions or products referred to in the content. |
© 2023 by the authors. Licensee MDPI, Basel, Switzerland. This article is an open access article distributed under the terms and conditions of the Creative Commons Attribution (CC BY) license (https://creativecommons.org/licenses/by/4.0/).
Share and Cite
Alonso, C.; Durão, R.; Gouveia, C.M. A Year of Volcanic Hot-Spot Detection over Mediterranean Europe Using SEVIRI/MSG. Remote Sens. 2023, 15, 5219. https://doi.org/10.3390/rs15215219
Alonso C, Durão R, Gouveia CM. A Year of Volcanic Hot-Spot Detection over Mediterranean Europe Using SEVIRI/MSG. Remote Sensing. 2023; 15(21):5219. https://doi.org/10.3390/rs15215219
Chicago/Turabian StyleAlonso, Catarina, Rita Durão, and Célia M. Gouveia. 2023. "A Year of Volcanic Hot-Spot Detection over Mediterranean Europe Using SEVIRI/MSG" Remote Sensing 15, no. 21: 5219. https://doi.org/10.3390/rs15215219