1. Introduction
The Portuguese coastal zone has one of the most energetic wave climates in the world, and it also faces intense anthropic pressure, with its main public and private infrastructures located in this area, as well as housing about 75% of the Portuguese population [
1]. Therefore, it has been suffering from systematic coastal flooding episodes at several spots, with an increasing trend being observed in recent decades [
2]. Although many of the occupied zones on the Portuguese coast are heavily modified with defence structures, such as groins, breakwaters, and artificial nourishment, it has been showing an insufficient capability of preventing such hazardous events, resulting in risk to the population and economic assets. The climate change scenario is likely to dramatically increase these risk situations within the next decades, with mean sea level rises and extreme events, which has already confirmed this concern with the recent increased episodes of coastal flooding.
Coastal flooding occurrence is not likely to depend on a single factor but a combination of variables, which makes it a so-called compound event [
3]. While tides and waves are the more apparent variables, a multitude of others, including wind, currents, rainfall, erosion, storm surges, and river discharges, interplay and intensify the situation. Extreme weather conditions, especially with the increasing frequency and intensity of tropical and extra-tropical cyclones [
4], further compound these interactions, exacerbating vulnerabilities in several coastal areas. Nonetheless, in Portugal, coastal flooding predominantly results from wave-induced events, correlating with high-energy storms in the North Atlantic, often originated by extra-tropical cyclones [
5], that result in long-period waves, which have been found to be critical for wave overtopping situations, especially in harbour resonance and coastal defence structures [
6,
7]. Furthermore, shore retreat and unsuitable developments in vulnerable areas have also potentialised this scenario. Furadouro (N 40°53′2.0″, W 8°40′24.9″) is one of the hotspots for these episodes, and it will be assessed in this case study.
A robust approach to analyse wave-induced coastal flooding is through numerical models that are capable of solving the wave transformation process from off-shore to nearshore (e.g., SWAN [
8]), coupled with techniques to estimate the flooded extension and intensity that can also be based on numerical models (e.g., LISFLOOD) or through GIS tools. However, most of the GIS-based tools are meant for continental floods [
9], and despite the possibility of adaptation [
10], they usually neglect the influence of waves [
11], which, in the case of Portugal, are an essential part of coastal flooding assessment.
The ‘bathtub approach’, which is a static inundation method where areas hydraulic connected to the sea and below the maximum vertical elevation that waves can reach (wave run-up) are flooded, is a widely used approach due to its straightforwardness [
12]. Despite accounting for wave contributions, the ‘bathtub approach’ often results in significant overestimations, particularly in coastal areas with low-lying terrain profiles beyond berm or dune crests. This method does not account for any form of dissipation or the temporal and spatial variability inherent to wave overtopping mechanisms [
11]. A few adaptations of this approach can implement terrain roughness or permeability with a potential increase in its accuracy [
12]. Alternatively, a reduction coefficient based on past flood observations derived from remote sensing can be implemented into the approach to bring more accuracy to the flood extension estimation.
This paper proposes an adaptation of the bathtub approach (BTA), called the Tilted Bathtub Approach (TBTA) [
13], based on both in situ and remotely sensed observations of past flooding events to reduce the typical over-estimation from the method. In comparison, a robust approach based on the coupling of a non-hydrostatic model for wave propagation on shallow waters (SWASH, [
14,
15]) and a dynamic inundation model (LISFLOOD-FP, [
16]) was also implemented to compare the results. Both approaches carve out innovative paths in flood modelling.
The coupling of SWASH and LISFLOOD-FP investigates a relatively unexplored convergence of these specific models, connecting nearshore wave modelling with a hydrological model. This coupling is a processes-based method that requires a certain level of computational capacity and modelling skills, combined with the need for data for validation. On the other hand, the TBTA provides a scarcely documented yet practically validated [
13] method for refining flood prediction and management. Together, they introduce methodological innovations, bridging the gap between field-applicable models and theoretical research.
Study Site Description
Furadouro beach is located on the Council of Ovar, Aveiro’s district, and the initial stages of its occupation were connected to fishing activities by the century XVIII [
17], but more recently, the area’s main economic activity was gradually becoming tourism, which today represents the most important activity. The first episodes of coastal flooding were reported in 1857, when a few local fishermen’s haystacks were damaged, similarly in 1863, 1887, 1889, and 1912, as well as in the early 1940s, when more urban structures were already in existence [
18]. The anthropogenic push for tourism edification protection prompted authorities to act in 1958, when the first major intervention to alleviate this risk was carried out, consisting of a 600 m long seawall.
Later, in 1974, a more decisive intervention was carried out, consisting of fortifying the existing seawall up to 9 m high, but more critically, three groynes of approximately 200 m extension and 5.5 m height were built 350 m apart. One of them was buried in the late 1990s, but the other two have survived to this day with a few modifications. Following this intervention, occurrences appear to have been less hazardous since only four reports of damage were recorded in the 1990s, all of which reported damages only to defence structures [
19].
However, in this century, incidents of wave overtopping have increased dramatically in frequency and intensity, particularly since 2010, when urban structures, both commercial and residential, were harmed. During this last decade, a succession of hazardous events occurred, with the years 2014 and 2018 being emphasised for having many incidents, with events in early 2014 producing the most severe damages so far (
Figure 1), including one injured person, and the year 2018 presenting the most amount of number of occurrences [
19]. Therefore, the pattern of impacts shifted from mild impacts in the 1980s and 1990s to severe material impacts in the last two decades, with a focus on damage to buildings, public places, and coastal protection systems [
2].
Between 2018 and 2020, the costs related to overtopping in Furadouro amounted to EUR 214,882.00. This could escalate to between EUR 2.5 and 3.7 million over the next 20 years. Factoring in the impacts of climate change, especially sea level rise, these costs could surge by approximately 2 to 7 times if no preventive measures are implemented [
20,
21,
22]. Given the substantial financial implications and potential damage escalation due to climate change, a comprehensive understanding of the overtopping phenomenon in Furadouro is crucial. Moreover, its recent history, marked by recurrent interventions and intense episodes, underscores its suitability as an ideal location for such an investigation.
2. Materials and Methods
This study’s methodology is outlined in
Figure 2. Data on wave climate, tides, topography, and observations of a significant storm (
Hs = 5.67 m,
Tp = 19.0 s, and
Tide = 4.0 m) event at Furadouro were collected. In response to this event, local authorities have created a map depicting the impacted areas, which serves as a validation event for this study. Two approaches for assessing the flood extension were carried out, one based on robust numerical methods and another one based on an offset of the affected area of the validation event derived from wave run-up levels. An extreme values analysis was carried out in order to obtain expected values for wave heights and periods, and both methods were applied in order to estimate expected flooded areas according to them. The resulting flood maps were carried out using GIS tools.
2.1. Oceanographic and Topographic Data
This study adopts an adaptation of the regional wave model introduced by [
23], which encompasses the full expanse of the Portuguese coast. The computational domain spans approximately 115,000 km
2 and employs a structured grid with a resolution of 2 m by 2 m. Wave boundary conditions are sourced from the Spanish State Port Authority (Puertos del Estado) via the SIMAR-44 data sets. These sets are derived from the synergy of the high-resolution atmospheric model REMO [
24] and the spectral wave model WAM [
25]. For the specific needs of this case study, the propagated sea states were extracted from the coordinates 40.81°N 8.73°W. These data have a time resolution of one hour and span a 30-year period from 1990 to 2020.
Additionally, sea level measurements were collected from an in-situ equipment located in a nearby port (Leixoes).
Local topography was obtained through the Program for Coastal Monitoring of Continental Portugal (COSMO), where it is possible to assess the beach slope, which is essential for the wave run-up evaluation, and the critical thresholds, i.e., the heights of points where flooding starts (dune crests or maximum height of defence structures). The topo-hydrographic survey with a 0.3 m resolution is the result of combining various acquisition techniques. An aerophotogrammetric survey was conducted in August 2018, with an initial resolution of 0.03 m and horizontal and vertical quadratic error of 0.053 m. Missing areas were interpolated using a geographic information system, with single-beam surveys and multi-beam surveys conducted at different depths. Hydrographic zero (ZH) was used as the reference plan, which is established 2.00 m below the mean sea level (MSL) in mainland Portugal, except for the port of Lisbon, where it is considered to be 2.08 m.
As this survey only accounts for the nearshore topography, an additional LIDAR survey was obtained through the Diretorio Nacional do Territorio (DGT) to assess the inland topography. The digital model of the terrain in the coastal zones of mainland Portugal was created in 2011 with a 2 m resolution. It includes both bathymetric and topographic information, roughly 400 m to land and 600 m to sea, and is in the PT-TM06/ETRS89 reference system with the altimetric datum of Cascais Helmert 38.
2.2. Numerical Models
This study uses two numerical models in its core, the LISFLOOD-FP to simulate the distribution of water volume from the wave overtopping process on dry land, and the SWASH non-hydrostatic was used to estimate the overtopping discharges as input for LISFLOOD.
2.2.1. SWASH
SWASH is a wave-flow model based on a Non-Linear Shallow Water equation with non-hydrostatic pressure terms, and in this case, in a 1D mode (flume-like). The decision for a 1D model was primarily motivated by the need for computational efficiency, taking into account the high resolution of the topographic data and relatively uniform cross sections of the nearshore topography. This uniformity is attributed to the presence of a permanent seawall installed along the study site.
The setup was modelled based on the procedures outlined by reference [
14], which had been executed, calibrated, and verified in a study area with similar wave conditions and topographical surveys. Simulations were conducted using the SWASH model in one-dimensional mode with a computational period of 500 waves and a spin-up period of 15% of the computational period. The simulations used an initial time step of 0.008 s, an automatic time step control, and a maximum Courant number of 0.5 and a minimum of 0.1. Perpendicular wave conditions were considered for the simulations.
The mean overtopping discharge, represented by q, was identified at the critical point—specifically, the crest of the existing seawall—where wave overtopping typically occurs. This was achieved by simulating the instantaneous overtopping discharge at each time step using the DISCH command. The average overtopping discharge was computed by dividing the sum of individual discharges by the computational time, which corresponds to the total number of instantaneous discharges captured in the output. Maximum overtopping discharge was also assessed but found to be unrealistic due to an apparent overestimation when compared to the existing literature.
The boundary conditions consisted of a JONSWAP spectrum representing perpendicular irregular waves. This spectrum had a significant wave height (Hs) and wave peak period (Tp) mirroring the sea state observed in February 2014, which served as validation for this study. Subsequently, a bi-variate extreme values analysis was conducted to estimate the expected values of Hs and Tp for different return periods, specifically 5, 10, 25, 50, and 100 years. Therefore, this analysis consisted of six separate simulations. In each simulation, the sea level was set at 4 m, representing a typical spring high tide level observed in tide gauges’ time series near the study area.
2.2.2. LISFLOOD
The potentially flooded area was evaluated with the LISFLOOD-FP. The model LISFLOOD is a grid-based hydrological model that can distribute volumes of water on a topography, normally related to either rainfall or rivers, that can be adapted for coastal flooding assessment [
26].The LISFLOOD-FP diffusive version was used [
26], which considers a uniform flow and an adaptive time step, which is provided by
where
is the time step of the model,
is the water-free surface height, and
z and
represent the depth through which water can flow between two cells. The continuity equation was employed to simulate mass conservation [
16], expressed as follows:
Here,
represents the flow between cells, calculated at the cell faces using a centred difference scheme that is decoupled in the
or
directions. h denotes the water depth at the centre of each cell,
is the width of the cell, and
and
are the spatial indices of the cell. However, there is a distinction in how
is calculated at each face of a cell between the two hydraulic models. In LISFLOOD-FP, a uniform flow formula is employed to determine the flow over a time step between two faces.
where
is the cell bed elevation, n is Manning’s roughness coefficient, and
is the depth between cells through which water can flow [
27].
In this case, the input discharges were extracted from the average wave overtopping outputs from SWASH 1D. The computational domain (
Figure 3) covered an area of 0.5 km
2 with a spatial resolution of 2 m. The flood model was forced with constant discharge imposed along the coastline boundary, characterised by the crest of a seawall of about 7 m in height. The fixed time-step 2D solver version was applied. The infiltration coefficient was set to the default values considering the characteristics of the urban area. The friction coefficient (i.e., Manning’s n value) was also default. The total simulation time was 432 s.
2.3. Observation
In an initial effort to evaluate prior coastal flooding events, especially the extent of the flooding, satellite images from prominent sources such as Sentinel 2, LandSat 7 and 8 were analysed. Nevertheless, it was concluded that those satellite images were unsuitable for this study due to limited resolution, weather-related constraints (clouds), and the unavailability of satellite imagery at the precise time of the flooding. However, it may be plausible to employ on-demand, paid satellite imagery as a valuable source for the evaluation of past coastal flooding events.
Alternatively, this study utilised a map detailing the affected areas, prepared by the Ovar Municipality, from the flooding event on 2 February 2014—the most destructive storm to date. The map was crafted after consulting the impacts of this event and the subsequent damages, delineating the perimeter of the area impacted by that specific coastal flooding episode, predominantly driven by waves. During this event, a total of 12 hectares were inundated, with the floodwaters extending up to 340 m inland from the beach. Numerous damages to both private and public properties were observed, including cafes, restaurants, hotels, and houses. Pathways were disrupted, and debris was scattered throughout the area.
It is likely that this event was potentialised by a previous hazardous event one month prior to this one, during the remarkable “Hercules” storm. This event has also caused great damage at Furadouro, although a smaller affected area was identified, as well as smaller damages [
28].
2.4. Tilted Bathtub Approach
To evaluate inundation risk and severity, the bathtub approach is a common method used to define the flood-prone area. This technique posits that all coastal areas connected to the sea and lying below the total water level are susceptible to flooding. In the context of wave-induced coastal flooding, the total water level is often referred to as the wave run-up. This term signifies the highest vertical rise of the water level oscillating in the nearshore due to ocean waves. Nonetheless, this method tends to overestimate flooding predictions [
12,
29]. The primary cause of this overestimation stems from its disregard for wave dynamics, including temporal and spatial variations, due to its inherent static nature. The model presumes that the overtopping water volume uniformly fills the landscape below the peak run-up level, thereby neglecting the dynamic nature of the phenomenon.
An effective strategy to improve the representation of flooding involves modifying the bathtub approach by incorporating historical records of flooding. By considering the known maximum overwash extension and its correlation with corresponding run-up values at a particular event, a more accurate depiction of the affected area can be achieved for following events. This approach allows for potential expansion of the affected area based on higher wave-run-up values, introducing an offset to the flooding extension. Therefore, the run-up estimation is required.
2.4.1. Wave Run-Up Estimation
Wave run-up is evaluated by testing several of the most well-established empirical formulas available in the literature by comparing them with reports of wave overtopping in the last three decades [
30,
31,
32,
33,
34,
35,
36,
37].
Early laboratory experiments and studies [
30,
38] have provided evidence that the run-up phenomenon primarily relies on specific factors such as the significant wave height (
H₀), wave period (
T), wavelength (
L₀), and the local beach slope or steepness (
β). These variables are interrelated through a linear dispersion relationship, with the wave period playing a crucial role. Together, they contribute to the calculation of the Iribarren number (
ξ). The Iribarren number serves as a critical dimensionless indicator of the wave transformation processes occurring on sloped beaches, particularly the nature of wave breaking, which can manifest as spilling, plunging, collapsing, or surging. Additionally, this relationship sheds light on the dynamic interaction between the beach profile and incoming waves, determining whether the beach exhibits a dissipative, intermediate, or reflective response.
Subsequent studies have extensively explored the relationship between these essential variables, incorporating empirical coefficients to account for roughness and permeability factors. These investigations have encompassed various coastal environments, including gravel, sand, and rocky beaches, as well as the presence of hard defence structures [
30,
31,
32,
33,
39,
40,
41]. Consequently, multiple empirical formulas have been developed to estimate wave run-up, each tailored to specific environments and objectives. In this study, six of the most widely recognised empirical formulas were evaluated to identify the one that best fits the requirements of the case study. In the context of wave run-up,
represents the elevation exceeded by the top 2% of wave run-up events, serving as a critical metric to assess the potential for wave-induced coastal inundation.
This study employed a 30-year hindcast of hourly wave climate data as inputs for the five selected empirical formulas. Additionally, the beach slope was derived from the aforementioned Digital Terrain Model (DTM); in this case, the representative beach slope has
β = 0.04. A preliminary analysis was conducted to evaluate the performance of each formula, taking into account factors such as probability of occurrence and comparison with previous studies, including the work by [
2]. Historical sea level was also incorporated in the calculations, although some lack of data for a few observations was identified. Most of the formulas only consider wave and topography parameters; however, reference [
37] also considers a roughness, or friction, coefficient, which, in this case, r = 3 × 10
−5 m (observed by [
42]) for an asphalt bed.
To determine which formula most accurately represents Furadouro’s specific situation, a sensitivity test was performed. This involved examining whether the wave run-up results from the formulas surpassed the critical 10 m threshold, approximately the height of the existing seawall’s crown. Additionally, reviewing significant storm events from previous years in Portugal that caused extensive damage, as per references [
2,
28], made it possible to validate and compare the performance of each formula against actual events.
2.4.2. Flood Extension Estimation
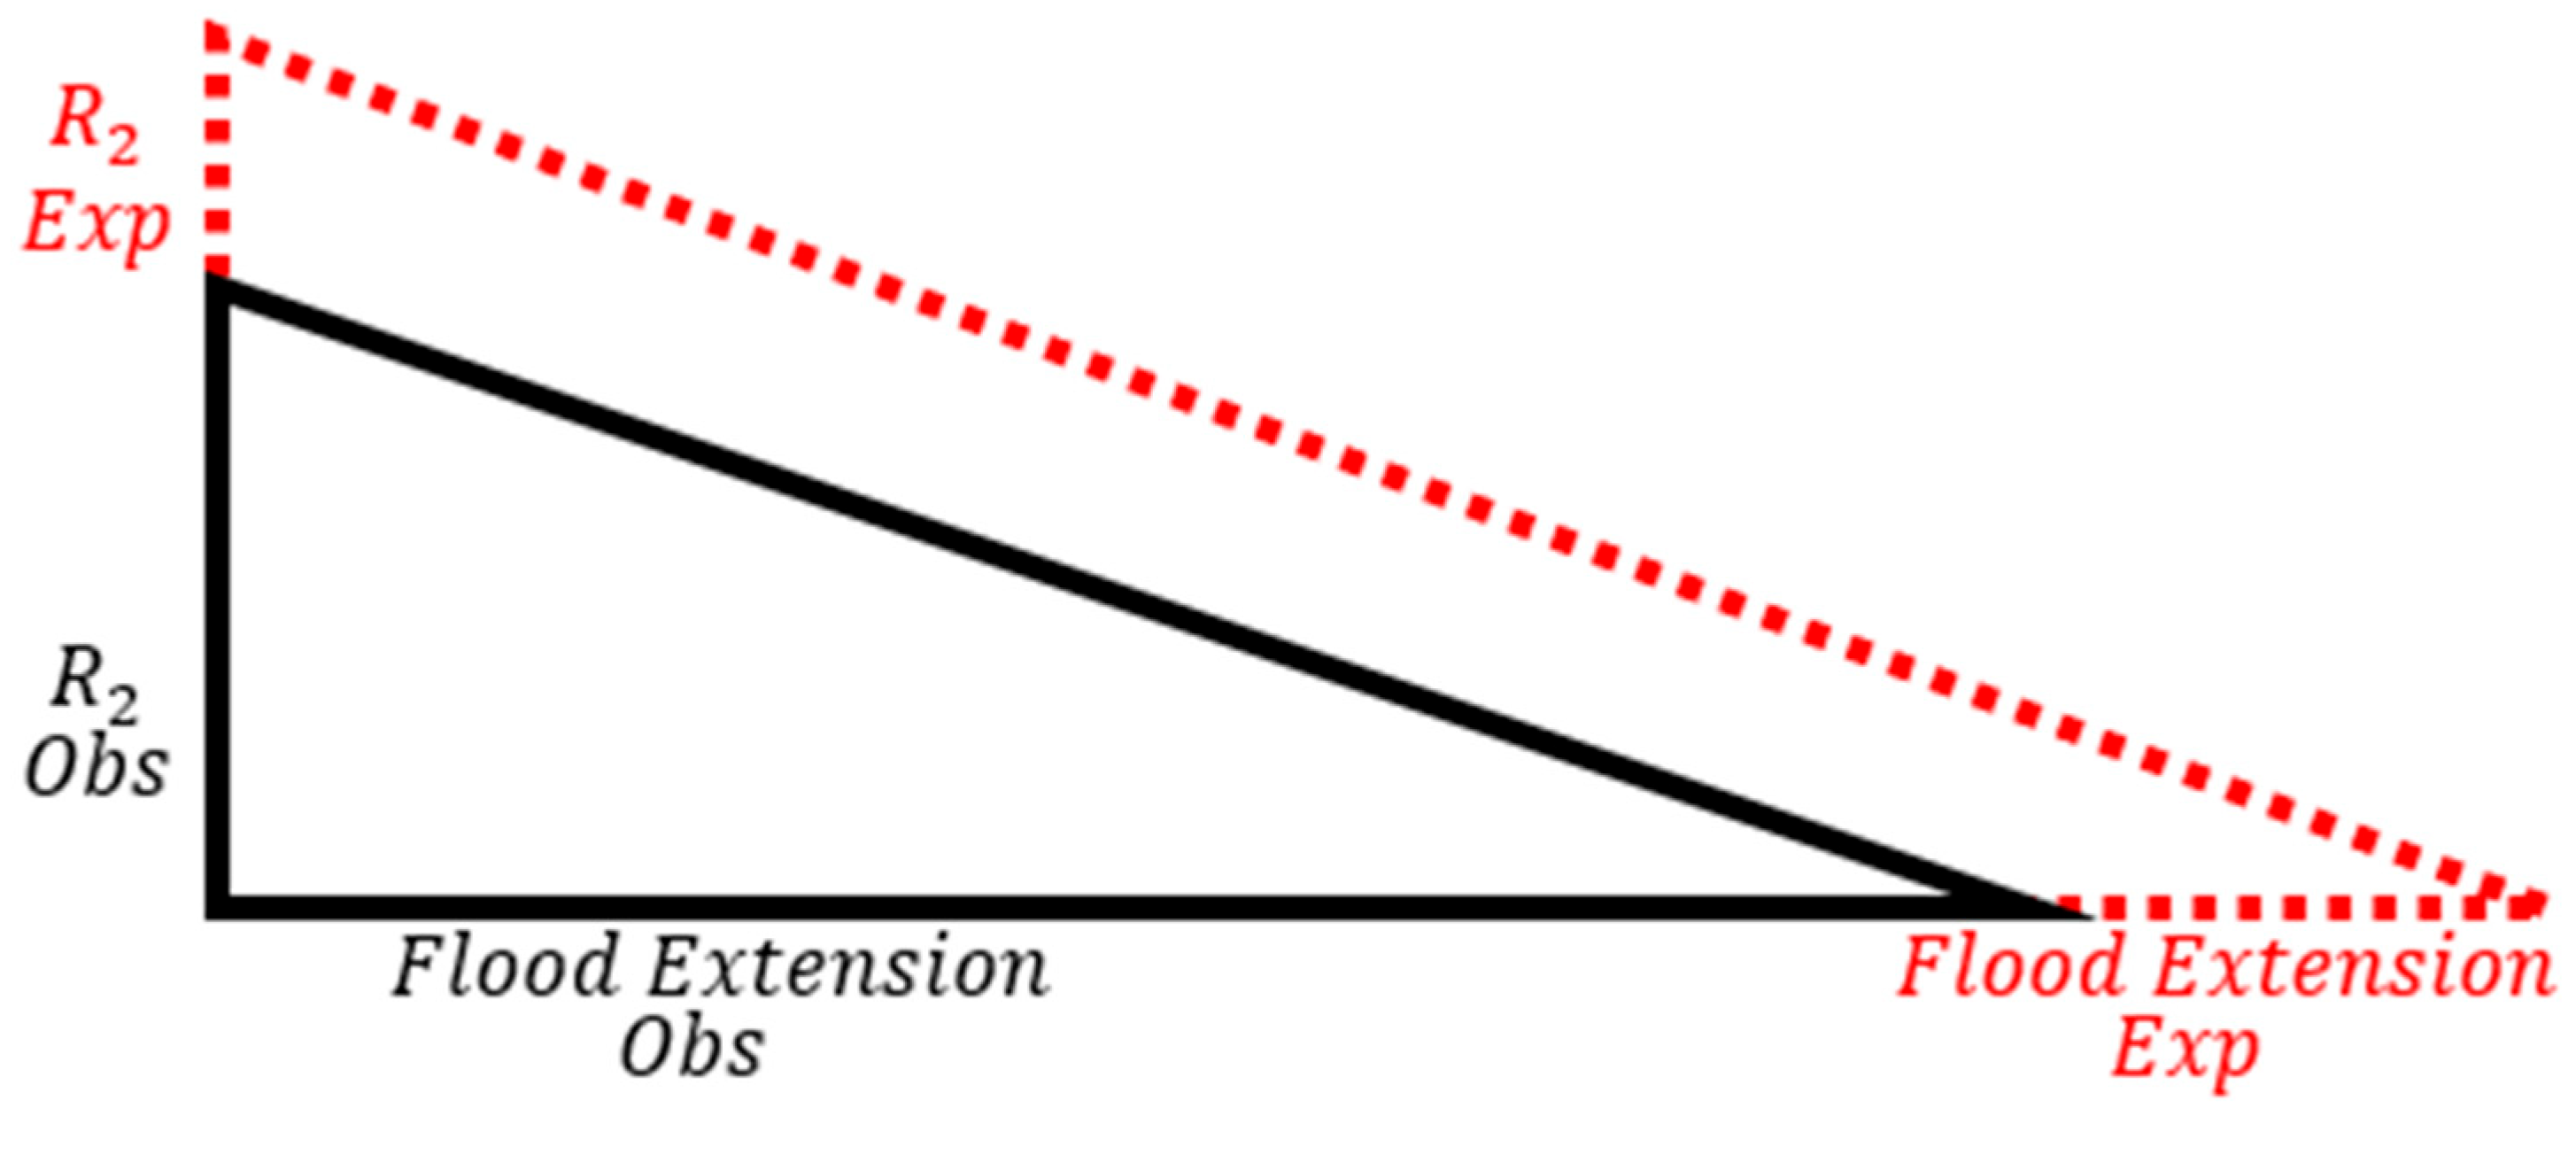
Once the most representative formula was validated for the case study, an analysis of extreme values was conducted to determine the expected wave run-up values for different return periods, specifically 5, 10, 25, 50, and 100 years. The analysis utilised the Peak Over Threshold (POT) univariate sampling method, which involved identifying run-up values exceeding a critical threshold defined by the crest of the seawall in this particular scenario. Subsequently, a probabilistic curve was fitted to the data to estimate the expected values corresponding to the different return periods using a Generalised Pareto Distribution. Furthermore, the expected flood extension was estimated using the rules of triangle resemblance. This involved measuring the relationship between the observed flood extension and its corresponding characteristic run-up and extrapolating it to account for extreme run-up conditions, creating a sort of offset in the flooded area (
Figure 4).
4. Discussion
This study has successfully presented and compared two approaches for coastal flood mapping: the Tilted Bathtub Approach (TBTA) based on run-up levels and an event of validation, as well as the coupling of the SWASH and LISFLOOD models. The results have demonstrated the potential of these approaches in accurately assessing the extent of wave-induced coastal flooding.
The TBTA provides a straightforward and simplistic method for estimating flood extension in potential wave-induced coastal flooding events. This approach offers several advantages over more complex numerical or physical models, as it is relatively simple to implement and understand. Moreover, compared to the conventional “bathtub” approach commonly used in such scenarios, the TBTA brings notable enhancements by incorporating additional factors derived from observation and validation events. This incorporation enhances the fidelity of the approach and improves its alignment with real-world conditions. Furthermore, the Tilted Bathtub Approach (TBTA) can serve as a streamlined tool for local authorities and coastal planners to easily assess potential flood extents under various sea state conditions, aiding in the development of resilient urban planning strategies and tailored community outreach and preparedness programs.
The coupling of SWASH and LISFLOOD models has been shown to offer significant advantages over traditional physical models in terms of simplicity, cost-effectiveness, and computational efficiency. By accounting for wave overtopping discharges, flow directions, and velocities, this approach provides a more comprehensive understanding of coastal flooding dynamics compared to static GIS-based methods. It can facilitate a thorough depiction and analysis of coastal flooding dynamics, which is pivotal for designing robust coastal protection structures and formulating actionable emergency response plans. In particular, these methods can assist in identifying vulnerable coastal sectors, thereby guiding the strategic placement of defence structures and ensuring optimal allocation of resources for repair and reinforcement activities.
However, it is important to acknowledge the limitations and areas for improvement identified in this study. The need for more accurate data, such as Digital Elevation Models, to better represent topographic features and obstacles in flood modelling has been highlighted. Additionally, incorporating multiple validation events with detailed mapping of affected areas, such as categorising impacts by hazard levels, could significantly enhance the results. Using multiple validation events rather than a singular one might lead to a more refined TBTA, employing a more robust statistical approach to correlate various flooding events with their respective wave setup characteristics. Further refinements on the SWASH implementation, for instance, incorporating 2D effects, such as wave obliquity and better representation of the wave reflection from the existing groyne, could increase the accuracy of the SWASH outputs.
While these methods emphasise wave run-up and overtopping-induced coastal flooding, they overlook other factors often present in hazardous coastal events in other coastal setups, such as river discharges, storm surges, tidal bores, rainfall, and wind. Consequently, their applicability might be restricted in coastal contexts vastly different from our study site, particularly where waves are not a major influence. Nonetheless, since coastal flooding in Portugal is predominantly wave-driven, and the data from the Furadouro case is widely available, these methods could be effectively applied to other Portuguese sites experiencing similar conditions.
5. Conclusions
Despite these limitations, the findings of this study contribute to the scientific understanding of wave-induced coastal flooding and provide valuable insights for coastal planners and stakeholders. The identified advantages of the coupled SWASH and LISFLOOD models, along with the potential for future advancements and refinements, make them promising tools for enhancing coastal risk assessment, informing decision-making processes, and implementing effective measures to mitigate the impacts of coastal flooding.
Further research directions should focus on replicating this validated method for extreme event scenarios and incorporating considerations of climate change, such as sea level rise. Moving forward, investigating the integration of real-time data for more accurate flood prediction and delving into the socio-economic impacts of coastal flooding within the study area could also be potential areas for improvement. By addressing these challenges and building upon the findings of this study, coastal communities can work towards resilience and develop sustainable strategies for managing coastal flooding risks.

 ,
, 


