Article

Multi-Scale Ground Deformation Analysis and Investigation of Driver Factors Based on Remote Sensing Data: A Case Study of Zhuhai City

Haiqin Building 4, School of Earth Sciences and Engineering, Sun Yat sen University, Tangjiawan Town, Zhuhai 519080, China
*
Author to whom correspondence should be addressed.
Remote Sens. 2023, 15(21), 5155; https://doi.org/10.3390/rs15215155
Submission received: 17 August 2023 / Revised: 6 October 2023 / Accepted: 19 October 2023 / Published: 28 October 2023

Abstract

:
Ground deformation poses an imminent threat to urban development. This study uses the multiscale geographically weighted regression (MGWR) model to investigate the spatial heterogeneity in factors influencing ground deformation, thereby elucidating the drivers behind regional variations in ground deformation patterns. To gain insights into the characteristics of ground deformation in Zhuhai, China, and its spatial relationship with natural and anthropogenic features, we initially utilized the small baseline subset interferometric synthetic aperture radar (SBAS-InSAR) method to collect data on ground deformation and its distribution across the entire area. Concurrently, remote sensing imagery was used to identify the various mechanisms affecting ground deformation during the same period, including geotectonic conditions, geographic environment, and human activities. Subsequently, we used the MGWR model to quantitatively estimate the effects of these driving force factors on ground deformation in Zhuhai. Our findings reveal significant ground deformation in specific areas, including Baijiao Town (Doumen District), Hongqi Town (Jinwan District), the Gaolan Port Economic Zone, and the northern part of Hengqin Town, with peak deformation rates reaching 117 mm/y. Key drivers of ground deformation in Zhuhai include NDVI, groundwater extraction intensity, and soft soil thickness. The application of the MGWR model, with an R-sq value of 0.910, outperformed both the global regression model ordinary least squares (OLS), with an R-sq value of 0.722, and the local regression model geographically weighted regression (GWR), with an R-sq value of 0.770, in identifying driving forces. This study can provide valuable insights for government policies aimed at mitigating the disaster risks associated with urban ground deformation.

1. Introduction

In general, ground deformation is mainly a geological phenomenon in which the ground elevation changes in a certain range under the combined influence of natural factors and human activities [1,2,3]. Ground deformation is gradually becoming one of the major geological hazards in cities and is a prevalent environmental geological problem in the process of urbanization in various countries [4]. Due to the compaction and consolidation of impact sediments [5], ground deformation occurs more frequently in densely populated deltaic areas [6,7]. Uneven deformation of the ground surface has a considerable impact on a city’s buildings, people’s safety, and the local economy [8]. Owing to its unique geographic location, where most of the area is below mean sea level [9] and is susceptible to extreme weather events like typhoons [10], the Pearl River Delta is vulnerable to disasters such as ground subsidence, flooding, and coastline erosion. Meanwhile, Zhuhai, as a special economic zone in China, has undergone rapid economic development in recent years, with increased urban expansion and human engineering activities, such as groundwater exploitation [11], further damaging the local ecological environment and exacerbating the occurrence of ground deformation. Therefore, it is of great practical significance to explore the characteristics of ground deformation in Zhuhai as well as the rule of change.
Many scholars have been interested in the research of ground deformation drivers [12,13]. Ground deformation occurs to a considerable extent due to the dynamic and static perturbation of ground loads, where the protruding strata are dominated by soft soils or loose clays [14]. The groundwater level is lowered by overexploitation of groundwater for household, agricultural, and aquaculture purposes, which leads to ground deformation [15]. At the same time, the production of ground deformation by different land use types and water use cannot be ignored [16]. The generation of ground deformation is the result of a variety of factors, including natural factors and the geotectonic conditions of the region in which it is located. The impact of ground deformation cannot be ignored, such as fracture tectonics, the thickness of the soft soil layer, precipitation, stratigraphy, lithology [17,18,19,20], and other factors that have a long-term effect on the occurrence of ground deformation. Most of the ground deformation mechanisms in previous studies were obtained from field measurements, which can be limited by cost, spatial coverage, and time.
Remote sensing technology makes it possible to monitor the development of ground deformation in a timely manner and provides efficient access to data on the mechanisms at the same time. Synthetic aperture radar interferometry (InSAR), a novel type of ground observation technology, has been widely used in large-scale ground deformation detection due to its high monitoring accuracy, wide range, rapidity, and efficiency [21,22,23,24]. Antonio Pepe et al. [25] summarized synthetic aperture radar interferometry (InSAR) principles and recent developments in multitrack InSAR methods, emphasizing their importance for monitoring earth surface deformation and geodynamic phenomena. Alberico Sonnessa et al. [26] used MTInSAR with COSMO-SkyMed and Sentinel-1 SAR data to investigate surface displacements in Chieuti, Italy, focusing on evolution, sector characteristics, displacement trends, and deep-seated landslide mechanisms. David A. Schmidt et al. [27] used SAR data to analyze time-varying topographic changes in the Santa Clara Valley, California. They identified patterns of uplift and subsidence and examined the impact of the Silver Creek fault on groundwater flow. R. Tomás et al. [28] used multi-source SAR imagery to remotely monitor ground subsidence brought on by overexploitation of aquifers, and Tang et al. [29] used the Sentinel-1 dataset to analyze the spatial pattern and temporal evolution of seasonal deformation in the Taiyuan Basin. The accuracy of the ground deformation results obtained with their use of satellite data could reach a millimeter level. In addition to accessing ground deformation information, it is equally important to explore the causes of ground deformation. In general, mechanisms are mostly acquired with time-consuming and ineffective field surveys [30,31], so these methods might not be suitable for large-scale driver identification and feature extraction. A useful platform for gaining access to resources is provided by the development of remote-sensing images. Umarhadi et al. [32] used decadal Landsat images to obtain land use change in Indonesia and study its relationship with ground deformation. Rateb et al. [33] used the Landsat-derived normalized difference vegetation index (NDVI) to estimate the expansion of agricultural land in the Nile Delta’s perimeter and analyze the influence factors of regional ground deformation during the same period. Yi et al. [34] used long-term changes in soil moisture obtained from satellite data to continually monitor ground subsidence.
There are fewer quantitative analyses of the multiple influences on ground deformation, where subtle and slow localized deformations are caused by a variety of drivers, such as urban infrastructure development, regional groundwater exploitation, and soil changes. Therefore, it is necessary to quantitatively compare the different influences and analyze their contribution to ground deformation. Based on a quantitative analysis of each influencing factor’s contribution to ground subsidence using the gradient-boosted decision tree (GBDT) model, Zhou et al. [15] discovered that a third confined aquifer had a greater influence on ground subsidence. Li et al. [35] evaluated the contribution of influencing factors to ground subsidence using Spearman rank correlation coefficient (SRCC) and extremely random tree (ERT) machine learning methods, and it was found that the largest contribution to the accumulation of ground subsidence was in the second layer of the bearing aquifer. Tzampoglou et al. [36] used a three-dimensional finite element model to determine the degree of influence of factors affecting regional ground deformation and found that groundwater pumping was the factor that had the greatest influence on ground deformation. However, previous studies have given less consideration to the spatial relationship between ground deformation and the influencing factors.
The causes of regional ground deformation are as spatially heterogeneous as the ground deformation itself, and how to quantitatively analyze the driving factors of regional ground deformation and consider the spatial relationship between their data has become an urgent problem to be solved. Fotheringham and Brunsdon et al. [37,38] proposed the geographically weighted regression (GWR) model, which, unlike global regression models such as ordinary least squares (OLS), takes into account spatial variations in a relationship and achieves the prediction of a dependent variable by weighting different geographical locations. The prediction of the dependent variable is more accurate after considering the effect of geographic location. The GWR model estimates a local linear regression for each geographic unit [39], which yields the model’s parameters and the relationships between its many variables and provides an accurate estimate of the dependent variable. Consequently, some researchers have used the GWR model in their research on ground deformation mechanisms. Cahalan et al. [40] used the GWR model to quantify the effect of control factors on sinkhole density. Yu et al. [41] considered the spatial non-stationarity of influencing factors and introduced the GWR model to obtain the degree of contribution of each influencing factor to regional ground subsidence. Although many scholars have used the GWR model to study spatial heterogeneity [42,43,44,45], the model uses a single bandwidth, which, in the case of multifactor prediction, is unable to explain the spatially varying scaling parameters of each factor. By using the back-fitting algorithm (BFA) for model calibration and setting different bandwidth structures for various parameter estimates, Fotheringham et al. [46] proposed multi-scale geographically weighted regression (MGWR), which can better predict response variables and solve the geographic multiscale problem to some extent [47].
Previous studies have examined ground subsidence and its underlying causes in various regions, but there has been limited quantitative research on ground subsidence and its drivers in Zhuhai. Sun et al. [48] investigated ground settlement in Zhuhai City and observed that tectonic cracks and factors like soft soil thickness, groundwater extraction intensity, and seasonal atmospheric precipitation influenced the distribution and evolution of ground settlement. Du et al. [11] demonstrated that localized ground subsidence in Zhuhai is primarily attributed to artificial reclamation areas, agricultural activities, and aquaculture. Liu et al. [49] identified soft soil consolidation as a major contributor to ground subsidence in Zhuhai City, particularly within land-use categories such as aquaculture zones, urban land, and agricultural land. However, prior research on the driving factors of ground deformation in Zhuhai City has insufficiently considered the spatial heterogeneity in these factors. This limitation has hindered a comprehensive understanding of ground deformation patterns and the variations in its driving forces across different regions. Additionally, there is a lack of quantitative analysis regarding the degree of influence these factors have on specific ground deformation events.
In response to the escalating issue of urban ground deformation, comprehending the present condition and trends in deformation, along with identifying the various causal mechanisms, constitutes the primary task in preventing and controlling ground deformation. Using Zhuhai City as a case study, this research applies the multiscale geographically weighted regression (MGWR) model to delve deeper into the impact of various driving factors on ground deformation. This approach offers new methods and perspectives for addressing ground deformation-related issues. This study aims to establish a crucial research foundation for managing ground deformation in Zhuhai, thereby supporting decision-making processes for researchers and government departments involved.

2. Study Area and Data

2.1. Overview of the Study Area

Located south of the Tropic of Cancer (21°48′–22°27′N; 113°03′–114°19′E), Zhuhai is an important city in the western portion of the Pearl River Delta and is close to the Macao Special Administrative Region (Figure 1) [50]. As a result of its subtropical monsoon climate, it is susceptible to typhoons and thunderstorms and experiences about 1770 mm of precipitation annually, 76% of which falls between April and August, while the relative humidity during the rainy season typically exceeds 80%. Due to its special geographic location, Zhuhai City is susceptible to typhoons, which can easily cause urban flooding, seawater inundation, and other catastrophes, posing a great threat to buildings and people’s health and safety. Meanwhile, the majority of the rock in Zhuhai City District is granite from the Yanshan Period, and the geotechnical properties of this stratum reflect the characteristics of a large natural pore ratio, high water content, high compressibility, etc. Kaolin is created through weathering and is easily softened when it comes into contact with water. Ground deformation in Zhuhai has been made worse by urban development, the transportation system, production, and living, which have strengthened the self-consolidation and compaction processes of soft soil.

2.2. Data

2.2.1. Sentinel-1 Data

The spatial resolution of the Sentinel-1 image is about 5 m × 20 m (Range Direction × Azimuth Direction). During data processing, the topographic phase was removed using a 12.5 m high-precision digital elevation model (DEM) acquired by the ALOS satellite. The precision orbit data corresponding to the imaging date of the used SAR images were provided by the European Space Agency (ESA), which were used to make orbit corrections to the images to improve the alignment and baseline estimation accuracy. The main parameters of the SAR data used for the experiments are shown in Table 1.

2.2.2. Impact Factor Data

Ground deformation is the result of a variety of influencing factors [49,51,52,53,54]. Based on the previous research, combined with the spatial and temporal characteristics of ground deformation, the factors affecting the ground deformation in Zhuhai City were selected. Impact factor data from the same period as the SAR images were acquired to better explore the driving factors of ground deformation. To attempt to analyze the driving mechanism of ground deformation in Zhuhai City from the aspects of geotectonic conditions, human activities, and geographic environment, 13 indicators were chosen for this study. The time of data acquisition and its sources for the influence factors of ground deformation in Zhuhai City used in this study are shown in Table 2.

3. Research Method

Multiple data sets and methods were used in this study. At first, the SBAS-InSAR technique was used to acquire the ground deformation data and spatial distribution of Zhuhai City. Then, the effects of the influencing factors on ground deformation were analyzed by building a regression model. Evaluation metrics such as R-sq, AICc, and residual sum of squares (RSS) were used to validate the MGWR model, and its performance was compared to that of the OLS and GWR methods. Finally, the model results were used to conduct a quantitative analysis of the factors that contributed. Figure 2 shows the study framework for this paper.

3.1. SBAS-InSAR Technology and Data Processing

In this study, we explored the ground deformation in Zhuhai City using the SBAS-InSAR technique [55]. The SBAS technique is an improved D-InSAR method that chooses, from a large amount of SAR data, a suitable combination of simple multi-view D-InSAR interferograms using a small baseline time and spatial baseline as selection characteristics and then figures out the average deformation rate and displacement sequence of the covered area during the imaging period.
For N + 1 SAR images acquired at the same time, according to the principle of small baseline distance within a set and large baseline distance between sets, the generated M interferograms satisfy:
N + 1 2 M N ( N + 1 ) 2
Assuming that the ith interferometric pair ( t 1 < t 2 ) consists of the two scenes of SAR images captured at times t 1 and t 2 , the interferometric phase at a point in this interferometric radar coordinate system can be expressed as:
δ ϕ i ( x , y ) = ϕ t 1 ( x , y ) ϕ t 2 ( x , y ) δ ϕ i (   disp   ) + δ ϕ i (   topo   ) + δ ϕ i (   atmo   ) + δ ϕ i ( n o i ) 4 π λ d t 1 ( x , y ) d t 2 ( x , y )
where δ i ( d i s p ) is the deformation phase, δ i ( t o p o ) is the terrain phase, δ i ( a t m o ) is the atmospheric phase, δ i ( n o i ) is the noise phase, λ is the radar wavelength, and d t 1 ( x , y ) and d t 2 ( x , y ) represent the accumulated deformation variables in the line of sight direction (LOS) relative to the reference time for t 1 and t 2 .
Assuming that the time when the master image is acquired from the image is denoted by I E = [ I E 1 I E 2 I E M ] and I S = [ I S 1 I S 2 I S M ] , and the time order of the master image when it meets the requirement of I E i > I S i for i = 1 , , M . Then, for any interferogram, the corresponding expression is as follows:
δ i x , y = T I E i ( T I S i ) i = 1 , , M
The set of M equations with N unknowns is expressed in matrix form as follows:
δ = A
where A is the M × N matrix. For the small baseline set interior, when M ≥ N, the above equation can be solved using the least squares method; when M < N between the various subsets, it will produce the rank-loss equation, which can be addressed using the singular value decomposition (SVD) method to find the minimum number of parameters and, consequently, obtain the regional deformation variables.
For this research, 48 views of Sentinel-1A images from January 2020 to December 2021 that covered the study area were used. Subsequently, we processed these images using SARscape software in ENVI 5.3, combining all possible interfering pairs, selecting the image acquired on 28 September 2020 as the super-master image, and setting the maximum spatio-temporal baseline to 120 to generate the optimal spatio-temporal baseline connectivity maps and interfering pair connectivity maps (as shown in Figure 3). At the same time, the interfering pairs with low coherence were also removed. The development of interference diagrams, flatness correction, filtering, coherent diagram synthesis, and phase unwrapping were all parts of the interference process. This study selected the GCP points using automatic selection during PS-InSAR processing to improve the accuracy of the results and minimize undue human influence. A digital elevation model with 12.5 m accuracy was used for terrain phase removal and alignment in the processing; a Goldstein filter was used to improve the signal-to-noise ratio of the interferogram; the true phase of the highly coherent pixels was obtained using the minimum cost flow (MCF) algorithm; the deformation rate in the study area was estimated using a linear model; and the final deformation rate was obtained by removing the atmospheric phase.

3.2. Spatial Autocorrelation

The first law of geography by Tobler [56] states that “Any element is correlated with any other element; however, closer elements will have a stronger correlation than farther ones”. Ground deformation data obtained from SAR images have spatial dependence and spatial heterogeneity [57], and their correlations can be explored with the analysis of spatial features such as location and attributes. Spatial autocorrelation refers to the importance or difference in the variable values within a specified region [58]. There are many methods for measuring spatial autocorrelation. In this work, the global autocorrelation of ground deformation was evaluated using Moran’s I index. Its formula is:
I = n i = 1 n j = 1 n W i j × i = 1 n j = 1 n W i j ( x i x ¯ ) ( x j x ¯ ) i = 1 n ( x i x ¯ ) 2
In the formula, n represents the number of spatial positions, x i and x j are the observation values of spatial positions i and j, and w i j represents the adjacency relationship between spatial positions i and j. The range of Moran’s I is [−1, 1]. When Moran’s I is positive, it indicates a high correlation between adjacent position variables, showing a clear clustering feature. The data are randomly distributed, and there is no correlation between the variables when Moran’s I approaches 0. When Moran’s I is negative, it indicates a low degree of spatial autocorrelation in the data space, showing a discrete feature. In this study, we conducted spatial autocorrelation analysis to test whether the residuals obtained using the OLS model exhibit spatial randomness and to assess the suitability of the OLS model for our study.

3.3. MGWR Model

3.3.1. Model

Ordinary least squares (OLS) is the most well-known method among multivariate regression methods. It can identify and measure the relationships between one or more explanatory variables and predict the values of continuous response variables while providing a global model for analyzing these explanatory variables [59]. However, there is regional variation among explanatory variables, and relationships among variables may alter as geographic location changes. As a result, the spatial correlation of the OLS model’s residuals is discussed in this work.
y i = β 0 + β 1 x i 1 + β 2 x i 2 + + β k x i k + ε i
where y i is the ith observation of the dependent variable, β 0 is the intercept of the regression model, x i k corresponds to the kth explanatory variable of sample i , β k is the partial regression coefficient corresponding to the kth explanatory variable, and ε i is the residual corresponding to sample i .
When applied to analyze spatial data, the OLS model for global analysis produces a suboptimal result because it is unable to reflect the spatial non-stationarity in the data. To identify spatial non-stationarity, Brunsdon et al. [37,38] proposed a local regression method based on traditional linear regression. Spatial relationship weights are introduced in the model, and the spatial location of the model is added to the regression function, resulting in regression parameters that vary with geographic spatial changes.
y i = β 0 m i , n i + k = 1 p β k ( m i , v i ) x i k + ε i
Among them, y i represents the ith observed value of the dependent variable; ( m i , n i ) denotes the latitude and longitude coordinates of the ith dependent variable; β 0 ( m i , n i ) is the constant term of the regression model for the ith observed value; β k represents the partial regression coefficient corresponding to the kth explanatory variable; x i k corresponds to the kth explanatory variable of sample i; and ε i is the residual corresponding to sample point i.
Ground deformation data have obvious spatial heterogeneity, and the factors affecting ground deformation may exist in both spatial stationarity and spatial non-stationarity types. For effective data analysis, neither a single global nor local regression model is necessary. Fotheringham et al. [46] proposed the MGWR model based on the GWR model, which can effectively distinguish between global and local variables in a geographic problem within the model. Additionally, the multi-bandwidth approach of the MGWR model method considers the optimal neighboring features for each target element to predict response variables.
y i = β 0 m i , n i + k = 1 p β b w k ( m i , v i ) x i k + ε i
where β b w k is the bandwidth used at the kth position, and each regression coefficient β b w k is obtained in the model based on local regression and has different bandwidths for different factors.
Allowing each explanatory variable to have a different bandwidth removes the limitation that all relationships at each spatial location vary on the same spatial scale. This also reduces overfitting and bias in parameter estimations during model fitting. It is worth emphasizing that we utilized MGWR software developed by Oshan [60] for implementing the MGWR method, while we utilized ArcGIS 10.7 software to obtain the results of the global regression model (OLS). In addition, for the MGWR analysis, we utilized the golden section method for bandwidth selection, opted for the Gaussian function as the model, and utilized AICc as the model optimization criterion to ensure the high accuracy and reliability of our model. Ultimately, we compared the global and local models to provide a more accurate assessment of overfitting and bias in the parameter estimates.

3.3.2. Bandwidth Selection

The model used the corrected Akaike information criteria (AICc) for bandwidth selection, which penalized smaller broadbands that lead to more complex models to avoid model overfitting. The AICc [61] is defined as:
A I C c = 2 n ln R S S n + n ln 2 π + n + t r   ( S ) n 2 t r   ( S )
where n denotes the number of observations, RSS is the residual sum of squares of the model, and tr(S) denotes the trace of the hat matrix S as well as the number of effective parameters of the model.

3.4. Model Evaluation Metrics

In this study, model fitting criteria such as the R-squared (R-sq), the corrected Akaike information criteria (AICc), and the residual sum of squares (RSS) were selected, which provide information about the performance of the model in representing the data and can better explain the model complexity. R-sq indicates the degree of variability in the dependent variable explained by the model; the higher the R-sq, the more variation the model can explain and the better the model fit. The model fit is better when the AICc and RSS values are lower since they help to explain model prediction inaccuracies. Previous studies have shown [60] that for more complex models, AICc is more applicable to the evaluation criteria of more complex models, so this study uses AICc pairs to assess model fitting.

4. Results

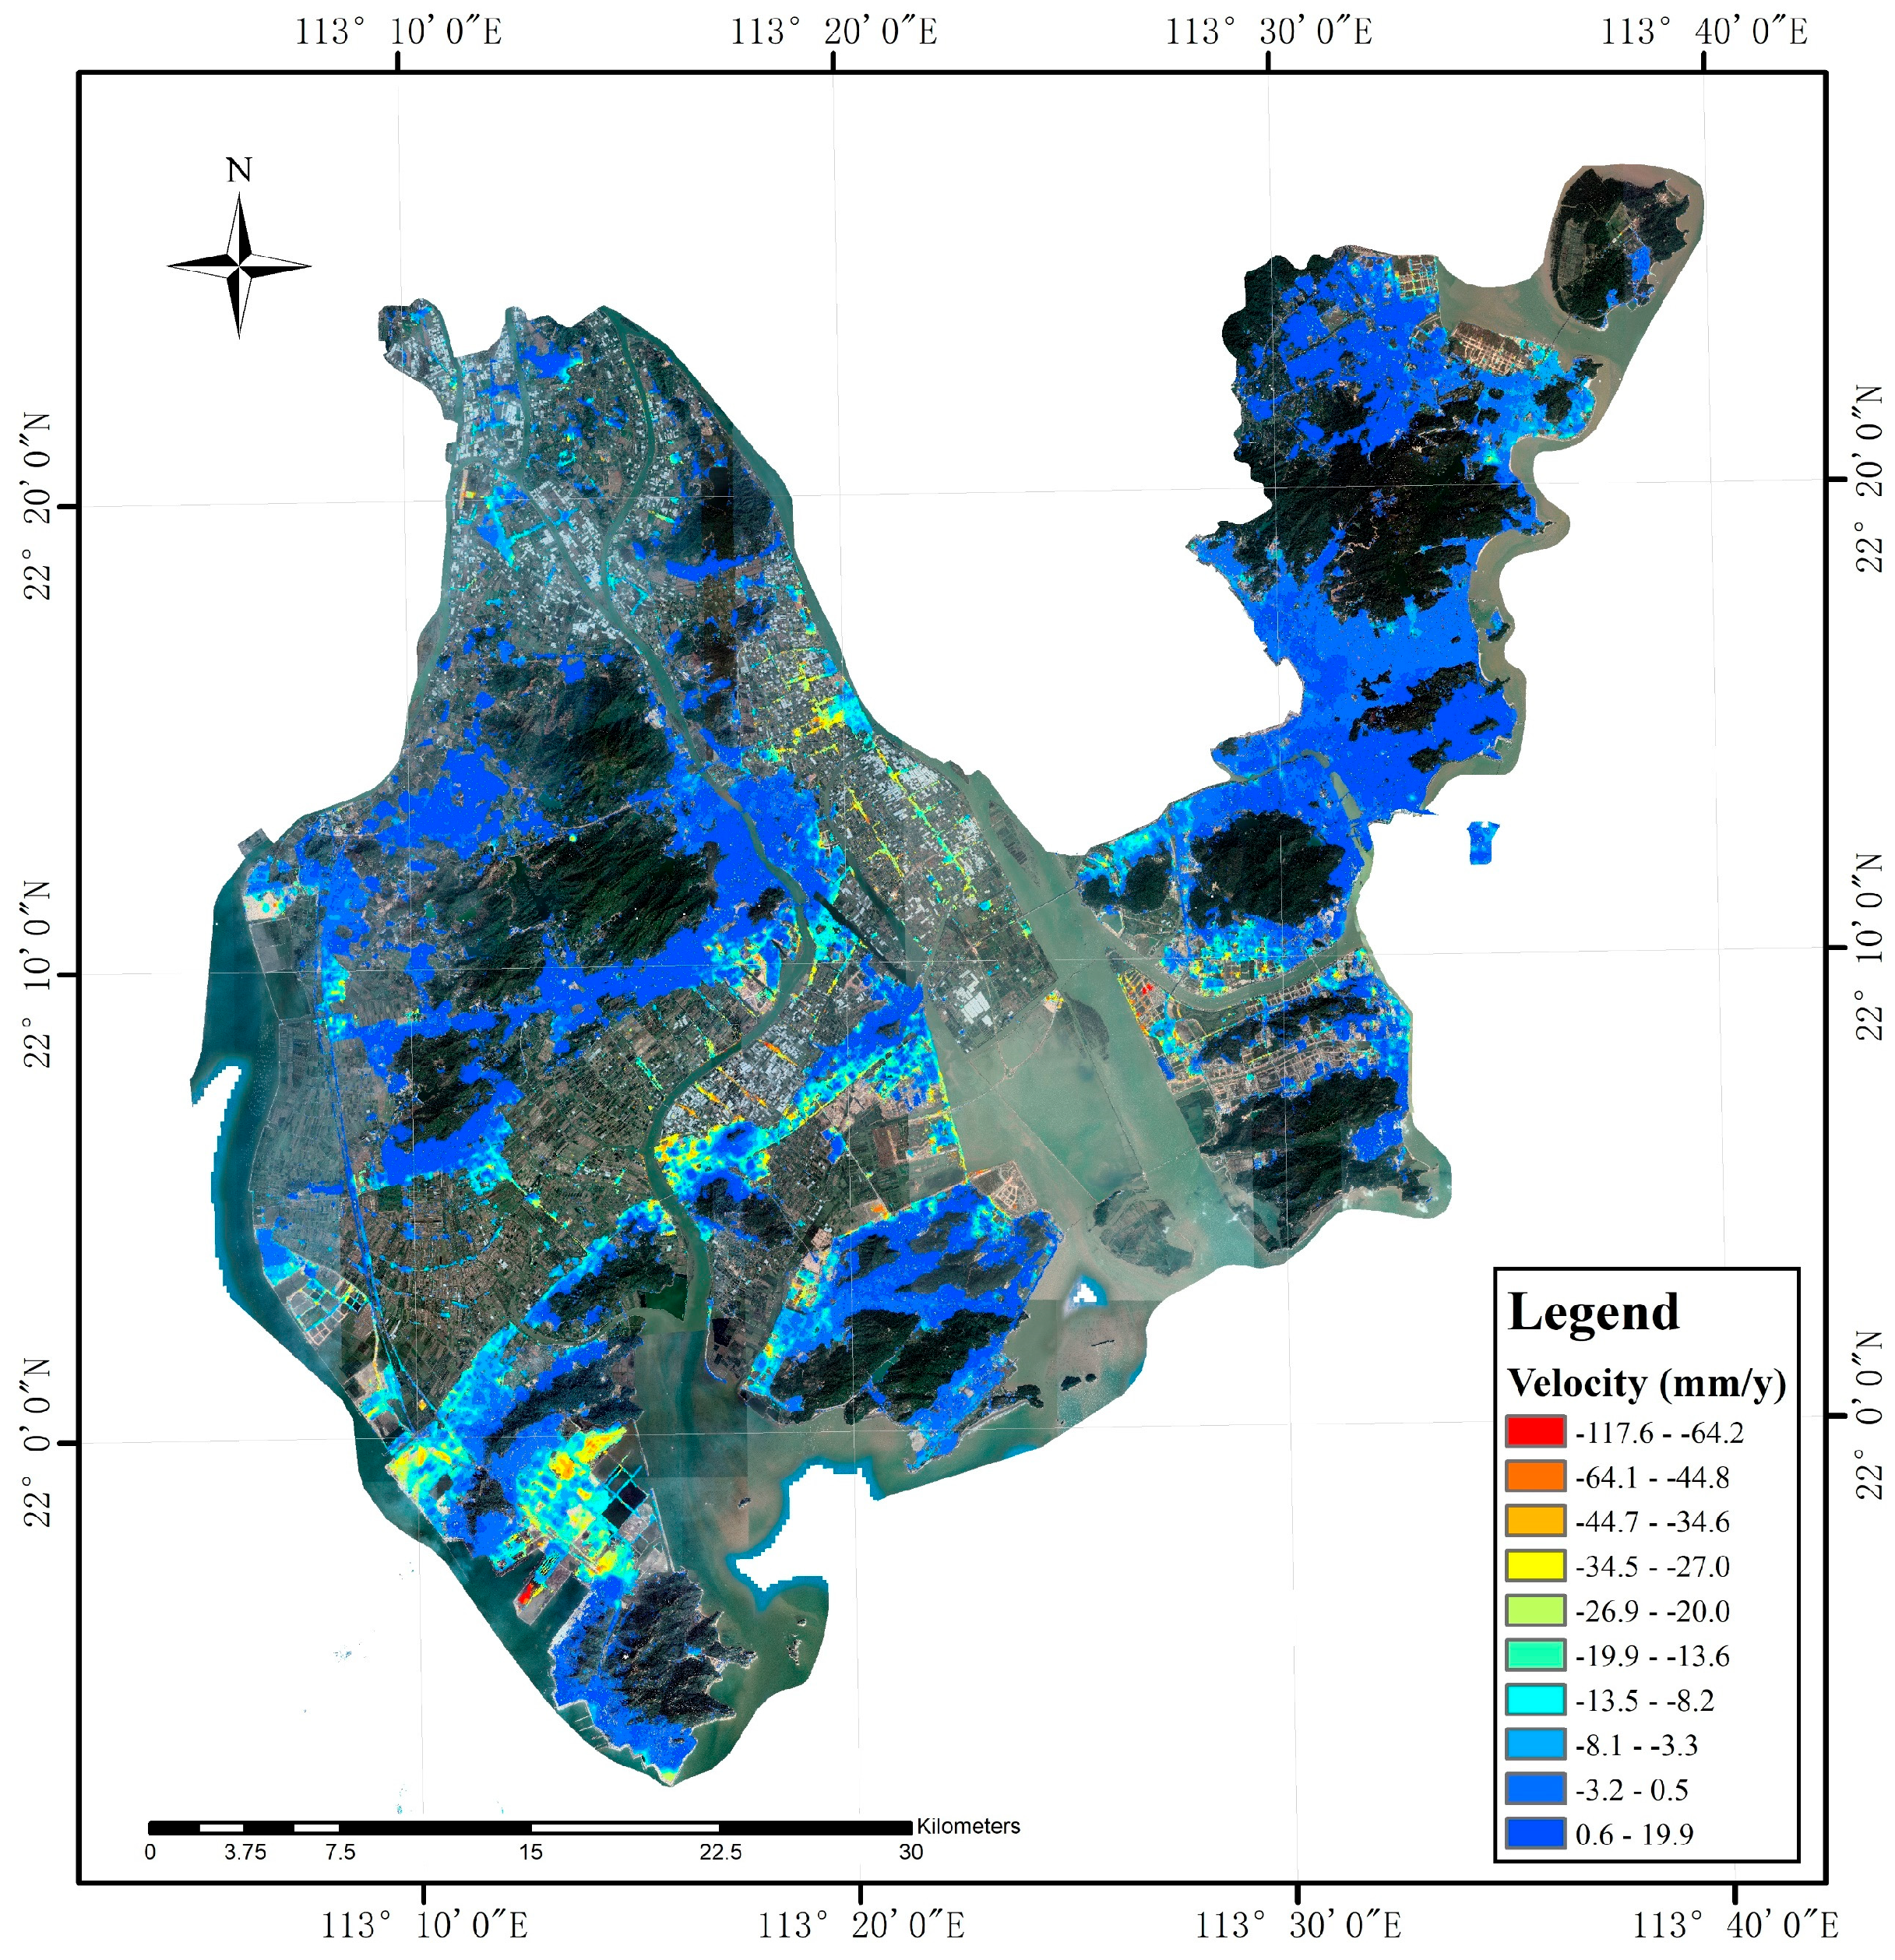
4.1. Spatial Distribution Characteristics of Ground Deformation in Zhuhai

In this study, SBAS-InSAR technology was utilized to obtain monitoring data of surface deformation in Zhuhai City during the period of 2020-2021 (Figure 4), where positive values represent the direction close to the satellite (ascending) and negative values represent the direction away from the satellite (subsidence). Ground deformation is relatively common in Zhuhai, with an average deformation rate of −3.45 mm/y, indicating a general trend of ground subsidence. The most significant uplift area is located in the northern part of Hengqin New Area, with a maximum uplift rate of 20 mm/y, while the most significant subsidence area is at the harbor of the Gaolan Port Economic Zone, with a maximum subsidence rate of 117 mm/y. According to the classification standards of the China Geological Survey [48], it has been observed that more than 97% of the monitoring points exhibit deformation rates ranging from −30 mm/y to 30 mm/y (Table 3). This suggests that the overall ground deformation in Zhuhai City is relatively stable and does not pose a direct threat to buildings. The results of ground deformation monitoring highlight the uneven spatial distribution of ground subsidence in Zhuhai, with noticeable variations in uplift and subsidence patterns across different areas. These findings provide essential foundational data and guidance for further research on the causes of ground subsidence and the implementation of appropriate geological management and risk control measures. Moreover, this study demonstrates the potential of the SBAS-InSAR technique in urban ground deformation monitoring and the effectiveness of the MGWR model in analyzing the drivers of ground deformation.
Significant regional differences are observed in the monitoring results in Figure 4, with urban areas, especially urban surfaces, exhibiting higher coherence. This indicates that we can obtain more reliable and detailed ground deformation monitoring data in these areas. In contrast, areas with high vegetation cover, such as farmland, rice paddies, and mountains, yield fewer deformation results. This phenomenon may be attributed to the impact of vegetation cover on the radar signal. In addition, the monitoring results identify four significant ground subsidence centers in Zhuhai (Figure 5), including Baijao Town in Doumen District (Area A, with an average deformation rate of −16.8 mm/y), Hongqi Town in Jinwan District (Area B, with an average deformation rate of −9.4 mm/y), Gaolan Port Economic Zone in the southern part of Jinwan District (Area C, with an average deformation rate of −8.4 mm/y), and the northern part of Hengqin Town (Area D, with an average deformation rate of −8.8 mm/y). Among these, the issue of ground settlement in the harbor area is most prominent in Area C, with a maximum deformation rate of 117 mm/y.
Under the influence of the upper loads, certain sections of the road exhibited notable deformation, particularly along the main roads (Table 4). As an essential node city in the Guangdong–Hong Kong–Macao Greater Bay Area, Zhuhai’s rapid development relies on a well-established transportation network. In addition to port trade transportation, the city of Zhuhai heavily relies on road transportation. Major roads in the city include the Gaolan Port Expressway, the Western Coastal Expressway, the Zhuhai Airport Expressway, the Guangzhou–Foshan–Jiangsu–Zhuhai Expressway, the Guangzhou–Australia Expressway, and Zhuhai Boulevard, which traverses the city. During the monitoring period, Zhuhai Avenue had the highest average deformation rate of −6.6 mm/y. The topsoil layer may become disturbed due to the dynamic and static forces associated with the construction and maintenance of a roadway, potentially resulting in ground deformation. Based on this, conducting a quantitative investigation into the factors influencing ground deformation in Zhuhai has become an urgent problem.

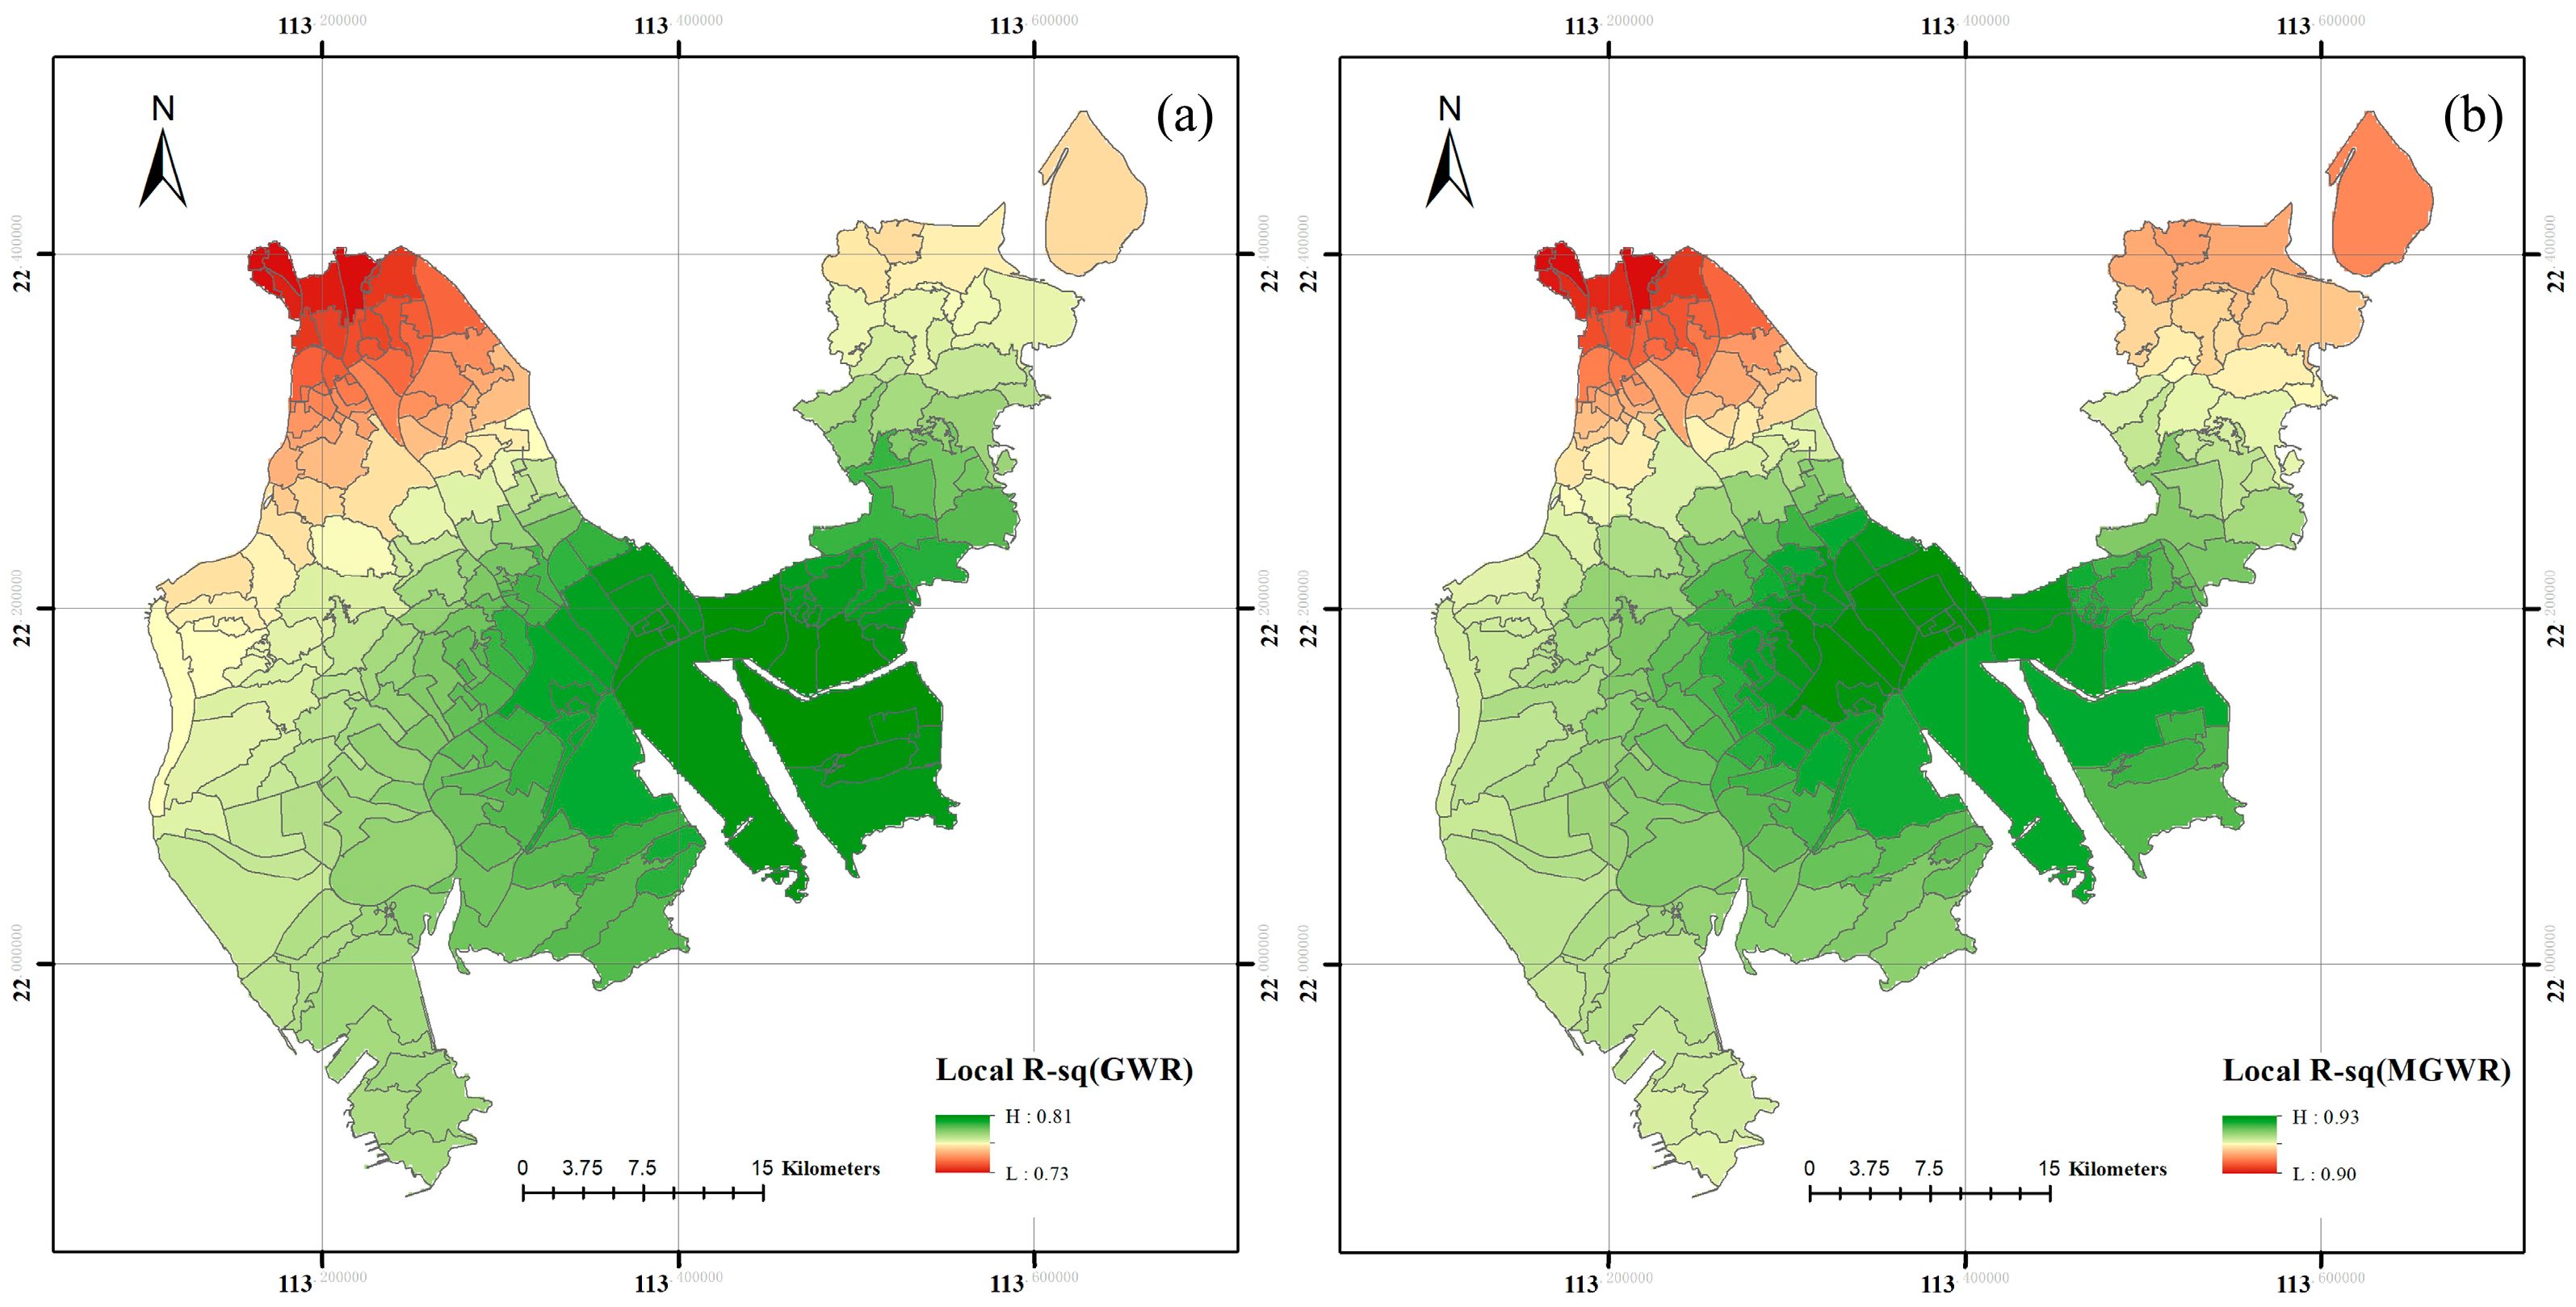
4.2. Model Results and Comparison

To thoroughly analyze the factors contributing to the spatial heterogeneity in ground deformation in Zhuhai, we used data from 2020 to 2021 in our study, encompassing several factors influencing ground deformation. We constructed a spatial regression model with ground deformation as the dependent variable and various influencing factors as the explanatory variables to uncover the spatial heterogeneity in how these factors affect ground deformation in Zhuhai. In this paper, the Zhuhai urban planning and compilation unit was selected as the basic unit for analyzing the driving factors of ground deformation in Zhuhai. Before performing the regression analysis, the selected data on ground deformation influencing factors were min–max standardized so that the results were within the range of [0, 1] due to the different data sources with different scales and magnitudes, which have a significant difference in the results. Multicollinearity will be more likely to develop when there is too much correlation between the explanatory variables, which will then impact the model’s fit. By removing variables with variance inflation factors higher than 7.5 from the explanatory variables, the variance inflation factor was used to perform local regression feature selection. The results are shown in Table 5. The results indicate that the VIF value for each explanatory variable is less than 5.0, which suggests a low correlation among the explanatory variables, specifically indicating a reduced level of multicollinearity between the variables.
An OLS analysis was conducted using data that passed the significance test. To determine whether the residuals obtained using the OLS model exhibit spatial randomness, we conducted a spatial autocorrelation analysis. The results indicate a Moran’s I statistic of 0.967, corresponding to a z-score of 3.790 and a p-value of 0.000. These results indicate that the residuals obtained using the OLS model exhibit significant spatial autocorrelation; the spatial correlation between the residuals is not random but exhibits significant spatial non-stationarity. Therefore, we can justify the use of geographically weighted regression (GWR) and multi-scale geographically weighted regression (MGWR) methods to better explain spatial patterns and correlations in the data. These methods allow for a more comprehensive consideration of the effects of geographic location on ground deformation and help to provide a more accurate understanding of the spatial patterns of change in ground deformation.
The results of the OLS, GWR, and MGWR models were compared, as shown in Table 6. The results indicate that the overall fit of the local regression models (GWR and MGWR) is better than that of the global regression model (OLS), with both GWR and MGWR having higher R-sq values compared with OLS. In particular, the MGWR model outperforms both OLS and GWR, demonstrating higher Log-likelihood and R-sq values, as well as lower AICc and RSS values. As a result, the MGWR model excels in explaining ground deformation, offering greater explanatory power and improved fitting performance.
Figure 6 displays the distribution of the three models’ regression residuals. The comparison reveals that the regression residuals of the MGWR model are generally smaller and exhibit a more random spatial distribution, indicating that the model is well-suited for most regions. In contrast, the regression residuals of the other two models are relatively large and display some spatial structure.
In the fitting results of the two localized spatial regression models (Figure 7), the R-sq values of the GWR model exhibited considerable variation among the evaluation units and were notably lower in certain areas, particularly in the northwestern part of the study area. This suggests a less accurate model fit in that specific region. In contrast, in the MGWR model, the R-sq values for all 221 evaluation units exceeded 0.90, and there was no significant variation in R-sq among these units, indicating a consistently good model fit. It is particularly noteworthy that the highest R-sq values were observed in areas such as Hengqin New Area, western Xiangzhou District, and southern Doumen District. This suggests that the combined explanatory power of known factors for ground deformation is more significant in these areas. In summary, the MGWR model significantly outperforms the OLS and GWR models in terms of fitting effectiveness.
There are variations in the degree of influence of different factors on ground deformation, thus requiring the selection of different bandwidths based on distinct explanatory variables. The traditional GWR model uses a uniform bandwidth for all explanatory variables, resulting in variations in the interpretation of the three explanatory variables: elevation, proximity to faults, and land use type, between the two models (Table 7). Specifically, elevation shows a negative correlation with the dependent variable in the GWR model, while it demonstrates a positive correlation in the MGWR model. Similarly, fault distance and land use type show a positive correlation with the dependent variable in the GWR model and a negative correlation in the MGWR model. This difference arises from the varying choice of bandwidths for each explanatory variable in the two models. The MGWR model utilizes distinct bandwidths for each explanatory variable, enabling each variable to more accurately capture the scale of its own spatial process.

4.3. Spatial Heterogeneity in the Influencing Factors

After comparative analysis, we found that the MGWR model performed well in providing the best fit. Therefore, this study used the MGWR model to obtain the regression coefficients for each explanatory variable, and these coefficients are presented in Table 8. We visualize the results to better illustrate the local effects of each explanatory variable. The color of the area in the figure indicates the degree of correlation between the variable and the ground deformation in that area, i.e., the variable is more negatively correlated with ground deformation the closer it is to blue, and it is more positively correlated with ground deformation the closer it is to red.

4.3.1. Geotectonic Conditions

As can be clearly observed in Figure 8, the influence of the geotectonic background on ground deformation is highly complex. Specifically, the influence of the slope coefficient ranges from −0.247 to 0.349, and its spatial distribution exhibits a distinct multipolar pattern. The central region is regarded as the focal point of low polarization, encompassing primarily the central part of Doumen District and the High-tech District. These areas feature significant slopes, resulting in a negative impact on ground deformation. Conversely, areas such as the northern part of Doumen District, Gaolan Port District, and Jinwan District are predominantly highly polarized areas, where the flatter topography positively influences ground deformation.
The influence of slope orientation on ground deformation is weak and is mainly observed in the central part of Doumen District, the northeastern part of Xiangzhou District, and the southern part of the High-tech District. These areas exhibit a mild negative effect on ground deformation. The influence of slope gradient and slope orientation shows spatial consistency due to their similar spatial distribution.
The estimated coefficients of the elevation parameters ranged from 0.082 to 0.118, indicating a relatively small degree of influence, although it had a significant positive effect on ground deformation. Spatially, elevation exhibits a clear stepwise distribution trend, with the high-value areas primarily located in the northern part of the study area. Among these areas, the most significant effect of elevation on ground deformation is observed in the Baijiao Town area.
The distance from the fault has a weak positive effect on ground deformation in the northern part of Doumen District, whereas it has a significant negative effect on ground deformation in other areas. Overall, this influence factor had a weak effect during the monitoring period but may be related to the fault activity in Zhuhai.
The influence of soft soil thickness and stratigraphic lithology on the ground deformation in Zhuhai City is relatively significant. The widely distributed soft soil and quaternary sediments cause negative effects on ground deformation. This influence is closely linked to the spatial distribution of soft soil layer thickness, with thicker soft soil layers having a more substantial impact on ground deformation.

4.3.2. Human Activities

The parameter estimates of building density ranged from −0.072 to 0.484, with a strong influence on ground deformation in the southeastern part of Jinwan District and the northern part of Doumen District (Figure 9). The areas with greater negative effects on ground deformation were in the High-tech District, the northeast of Xiangzhou District, and the Gaolan Port Economic Zone, but with a weaker intensity. The results shown that the denser the buildings were in the planning unit, the greater the impact on ground deformation, which is in line with the previous study on urban buildings and ground settlement [62]. The ground deformation was largely influenced positively by the road network density parameter, which was estimated to be in the range of −0.115 to 0.372. In the High-tech District and the northeast of Xiangzhou District, where the road network density was higher, the effect on ground deformation was weak, which further indicated that the road network density was not the main factor causing ground deformation in the area. Groundwater exploitation was one of the major influencing factors in urban ground deformation, and the parameter estimation of the groundwater exploitation intensity obtained using the MGWR model was negative except for some planning units in the north of Doumen District and the south of the Gaolan Port Economic Zone. The groundwater exploitation intensity had a greater impact on ground deformation in the southern and northern parts of Doumen District and Jinwan District, respectively. This was due to local aquaculture occurring there more frequently.

4.3.3. Geographical Environment

The estimated mean value of the precipitation parameter was 0.068, which was not the main factor affecting ground deformation during the monitoring period (Figure 10). It showed a spatial distribution pattern of high in the south and low in the north and had a strong and positive influence on ground deformation in the eastern part of Jinwan District and Hengqin New District. Ground deformation was negatively impacted by some planning units in places with high average annual precipitation, such as the High-tech District. The ground deformation in the study area was significantly positively influenced by NDVI, and its influence was of the highest intensity. In terms of spatial distribution, there was a more obvious polarization trend, except for the southern part of the Gaolan Port Economic Zone, Hengqin New District, and some planning units in the central part of Xiangzhou District, which had a negative influence on ground deformation, and the rest of them had a positive influence. The estimated parameter of the soil moisture parameter was in the range of 0.002–0.011, which showed a weak positive effect on ground deformation, and the spatial distribution showed a distinct stepwise distribution. The high-value areas were distributed in some of the planning units in the northern part of the Doumen District, and the soil moisture in these areas was also at higher values compared with other locations in the study area.

5. Discussion

5.1. Results of Ground Deformation in Zhuhai

The absence of field measurements in the study area during the monitoring period prevented the validation of the deformation data obtained. However, the areas with more pronounced deformation in the results align with the spatial distribution of factors such as the thickness of the soft soil layer, the intensity of groundwater extraction, and the density of buildings. Overall, the magnitude and spatial distribution of ground deformation in Zhuhai obtained in this study for the years 2020-2021 are consistent with the historical deformation patterns in Zhuhai observed by previous researchers for the years 2006–2011 [11,63] and 2015–2020 [5,10,49]. The maximum sedimentation rate, as reported in previous studies [10,11,49], is consistently observed in the reclaimed area of Zhuhai, specifically in the Gaolan Port area (Area C), which aligns with the findings of this study. Furthermore, the maximum subsidence rates reported by Ma et al. [10], Du et al. [11], and Liu et al. [49], which were −150.9 mm/y, −112.3 mm/y, and −87.3 mm/y, respectively, do not significantly differ from the maximum subsidence region and rate of −117 mm/y obtained in this study. This further confirms the reliability of the results from our study.

5.2. Validity and Applicability of the Methodology

The results indicate significant differences in the extent to which various geographic factors influence ground deformation, highlighting the need to select different bandwidths based on the characteristics of each explanatory variable. Compared with the traditional GWR model, the MGWR model uses distinct bandwidths for each explanatory variable. This feature enables the model to better reflect the spatial scale characteristics of each explanatory variable, resulting in a more accurate representation of the relationships between these variables and ground deformation (Table 7). This highlights the advantages of the MGWR model in conducting multi-scale spatial analysis and underscores its adaptability and flexibility in explaining ground deformation.
Ground deformation is the result of various interacting factors. For geographic data, the strong spatial relationship makes it impossible to analyze the influencing factors alone, so we used regression models to investigate the factors contributing to urban ground deformation in Zhuhai. The model fitting results were used to evaluate the model’s performance using metrics such as R-squared (R-sq), Akaike information criterion corrected (AICc), and residual sum of squares (RSS). The GWR model uses a uniform bandwidth for all explanatory variables, whereas the MGWR model considers the spatial scale at which each explanatory variable operates and consequently calculates a bandwidth value for each explanatory variable. The localized R-sq suggests that almost 90% of the variables in the MGWR model can be accounted for, and the overall fit of the model for the region is strong. Compared with the GWR model, the MGWR model improved R-sq by 23.5% and reduced AICc by 20.8%. Similarly, compared with the OLS model, the MGWR model improved R-sq by 26.0% and reduced AICc by 22.6%. Meanwhile, the R-sq of the GWR model was 6.4% higher than that of the OLS model, and the AICc was reduced by 2.2%. In the results of RSS, the MGWR model was reduced by 61.1% compared with the GWR and by 67.8% compared with the OLS model, indicating that the MGWR model provided a better fit. In summary, both the GWR and MGWR models provide a better fit compared with the OLS model. Among the two local regression models, the MGWR model outperforms the GWR model, showing additional reductions in AICc and RSS values. Additionally, the MGWR model exhibits smaller regression residuals and displays a more random spatial distribution. Therefore, the MGWR model fits better than the GWR model and better than the OLS model. By comparing the performance metrics of the MGWR, OLS, and GWR models, we conclude that the MGWR model excels in explaining the spatial variation in ground deformation, emphasizing the significance of considering spatial heterogeneity in ground deformation studies. Given the fundamental importance of spatial factors, the MGWR model enhances our comprehension of ground deformation by considering the distinct spatial scales of each explanatory variable, enabling a more comprehensive analysis of the role of driving factors.

5.3. Analysis of Factors Influencing Ground Deformation

Based on the model evaluation results, the MGWR model can effectively assess the driving factors of regional ground deformation and rank the importance of these influencing factors. Of the three selected influencing factors, the geographical environment during the monitoring period has the most significant impact on ground deformation in the study area. The influence of human activities should not be neglected, while the regional geotectonic background has a comparatively smaller influence on ground deformation in the short term when compared with the first two aspects.
In the four priority deformation areas, the A-region model identified building density, soft soil thickness, road network density in certain planning units, and groundwater extraction intensity as the most significant drivers, with the average absolute values of the fitted parameters exceeding 0.2. The presence of river systems in the region, including the Xijiang River to the east and the Huangyang River and the Naiwanmen Waterway to the west, has led to the accumulation of a thick layer of soft soil. This soft soil primarily consists of gray or dark gray silty sand and sandy silt, and it includes widespread under-consolidated soft soil layers, indicating poor regional stability. Consequently, the combination of frequent human activities and the geological background has contributed to the occurrence of more pronounced ground deformation in the area.
In the results obtained from the B-region model, groundwater extraction intensity and NDVI are the most important driving factors for ground deformation, with the absolute value of the average parameter estimation reaching 0.4. Additionally, building density, road network density, and soft soil layer thickness are also crucial factors, with average parameter estimations of 0.27, 0.26, and 0.22, respectively. The Hongqi Town area features a higher concentration of rivers, a thicker soft soil layer, and a thriving aquaculture industry. Residents extensively extract groundwater for aquaculture, leading to intensified groundwater extraction. Meanwhile, recent economic development and surface engineering construction have increased the ground load, resulting in a rapid subsidence rate. These factors collectively contribute to more pronounced ground deformation in areas with frequent human activities.
The thickness of the soft soil layer was identified as the primary driving factor in Areas C and D, with mean parameter estimates of −0.21 and −0.22, respectively. Area C is a significant comprehensive port in Zhuhai, and economic demand has led to its transformation into the primary reclamation area in Zhuhai, resulting in the accumulation of a substantial layer of silt-like soft soil. With the increase in trade, dynamic disturbance from the upper loads accelerates ground subsidence and becomes more severe in areas close to the coast. As a newly constructed economic zone near the Macao Special Economic Zone, Area D has seen an increase in the scope and extent of ground deformation caused by soft ground in recent years with the increase in engineering activities such as large-scale industrial construction as well as the construction of new rural areas.
Important factors that influenced ground deformation analyzed using the MGWR model are consistent with previous analyses (Table 9). Meanwhile, the MGWR model takes into account the spatial heterogeneity in the explanatory variables, which can quantitatively study the driving factors of ground deformation in different regions and help the government and its related personnel formulate appropriate strategies for ground deformation disasters.

5.4. Comparison of Research Results with Previous Studies

In order to better explore the causes of ground deformation in Zhuhai, this study combined the MGWR model and ground deformation based on remote sensing images. At the same time, remote sensing images can be acquired in a wide range, quickly, efficiently, and at a low cost, providing new ideas for real-time monitoring of regional deformation and the timely development of control strategies. Many scholars have used remote sensing image data to obtain the explanatory variables for ground deformation, but there were fewer quantitative investigations on the effects of multiple influencing factors on ground deformation. The comparison of the present study with the previous studies, as shown in Table 10, further demonstrates that MGWR compared with the GWR model has better applicability and can be combined with remote sensing datasets for high-precision monitoring of large areas of soil shape change.

5.5. Strengths and Weaknesses

This study leverages the multi-scale analysis capability of the MGWR model, enhancing its ability to capture the evolving characteristics of ground deformation at various spatial scales. Compared with traditional global regression methods, this approach improves the precision and accuracy of the analysis. Multiple potential drivers of ground deformation were considered and incorporated into the analysis, facilitating a more comprehensive understanding of the causal mechanisms behind ground deformation. By conducting an in-depth analysis of the drivers of ground deformation, this study offers valuable decision support for urban management and planning.
There are also some shortcomings in our study. The utilization of ground deformation monitoring data from a single orbit and the absence of field measurements in this study may have influenced the precision of the results. In future research, we intend to acquire higher-resolution and more precise data to enhance the accuracy of our findings. We will also explore the integration of multi-source radar data to obtain a more comprehensive understanding of ground deformation, allowing us to assess its multidimensional characteristics more accurately. Although the MGWR model can achieve spatial heterogeneity better in this study, it also introduces some complexity. Therefore, future studies will focus on the applicability and performance of the MGWR model in different regions to further assess its feasibility in other regions.
Furthermore, given that Zhuhai is situated in a low-latitude region with abundant vegetation cover, the application of the SBAS-InSAR technique is still influenced by vegetation, potentially resulting in an incoherence phenomenon [68,69,70]. Monitoring ground deformation in regions with dense vegetation cover remains a challenge to be addressed. Subsequent research endeavors could investigate more efficient approaches to overcome this limitation, in order to improve the precision of ground deformation monitoring in heavily vegetated areas.
In conclusion, despite some limitations, this study provides important insights into understanding the drivers of ground deformation and demonstrates the potential of the MGWR model for spatial heterogeneity analysis.

6. Conclusions

In the face of the increasingly serious issue of urban ground deformation, gaining timely insights into the current status and distribution patterns of ground deformation, as well as identifying its various underlying causes, are essential prerequisites for preventing and effectively managing ground deformation. In this study, remote sensing images were used to obtain ground deformation data covering Zhuhai City and the driving factors of ground deformation during the same period to explore the spatial distribution characteristics of ground deformation. Subsequently, regression models were used to assess the impact of a total of 13 influencing factors, categorized into three aspects: geotectonic conditions, human activities, and the geographic environment, on ground deformation across various geographic locations.
Firstly, we acquired Sentinel-1 images covering Zhuhai City from 2020 to 2021 and, in conjunction with SBAS-InSAR technology, obtained detailed information on the surface deformation in Zhuhai City. It quickly and efficiently provided us with regional high-resolution surface deformation data.
Secondly, we selected several surface deformation drivers and, with the application of the MGWR model, assessed the degree of influence these factors had on surface deformation as well as variations in their spatial distribution across different regions. The results of this study indicate that surface deformation in Zhuhai City exhibits significant spatial heterogeneity, with different regions being influenced by distinct driving factors. Among these factors, NDVI, groundwater extraction intensity, and soft soil thickness were identified as the primary drivers, each exerting varying degrees of influence in different areas. These differences can be attributed to the roles of drivers at various spatial scales and necessitate a consideration of influences at different scales.
Based on remote sensing images, in the results of using the MGWR model to analyze the driving factors affecting ground deformation in Zhuhai City, the MGWR model is able to describe the influencing factors of ground deformation more accurately and improve the prediction accuracy of the model by considering different bandwidth choices for each explanatory variable. Compared with the GWR model, the MGWR model exhibits better potential and greater accuracy when incorporating remote sensing data to investigate the causes of large-scale ground deformation.
This study has some limitations. The study area contains extensive vegetation cover and water bodies, which resulted in a certain level of incoherence when using radar data to obtain ground deformation information. Therefore, minimizing the impact of vegetation during the data processing stage will be a critical consideration in future research. Additionally, while this study was validated using comparisons with previous research, it still lacks field measurement data. Combining field measurements with deformation data would enhance the accuracy of the results. With the integration of geostatistical methods and remote sensing image monitoring data, this study delves into the causal mechanisms of urban ground deformation. This research provides valuable insights and decision-making support for urban planning and geological risk management. These innovations are expected to be widely used in future ground deformation studies.

Author Contributions

Y.T. conceived the idea and designed the experiments with Z.W. and B.X.; Y.T. wrote the main manuscript; Z.W. reviewed the paper. All components of this research were carried out under the supervision of Z.W. All authors have read and agreed to the published version of the manuscript.

Funding

This research is supported by the National Natural Science Foundation of China (Grant No. 41572316) and the Guangdong Province Introduced Innovative R&D Team of Big Data-Mathematical Earth Sciences and Extreme Geological Events Team (Grant No. 2021ZT09H399).

Institutional Review Board Statement

This study does not involve human or animal subjects, and thus, ethical approval is not required.

Informed Consent Statement

The research does not involve humans, and thus, this statement is not required.

Data Availability Statement

The data presented in this study are available on request from the corresponding author.

Conflicts of Interest

The authors declare no conflict of interest.

References

  1. Ma, T.; Du, Y.; Ma, R.; Xiao, C.; Liu, Y. Review: Water–rock interactions and related eco-environmental effects in typical land subsidence zones of China. Hydrogeol. J. 2018, 26, 1339–1349. [Google Scholar] [CrossRef]
  2. Milliman, J.D.; Haq, B.U. Sea-Level Rise and Coastal Subsidence: Towards Meaningful Strategies. In Sea-Level Rise and Coastal Subsidence: Causes, Consequences, and Strategies; Milliman, J.D., Haq, B.U., Eds.; Springer: Dordrecht, The Netherlands, 1996; pp. 1–9. [Google Scholar]
  3. GuangYao, D.; HuiLi, G.; Huanhuan, L.; Youquan, Z.; BeiBei, C.; KunChao, L. Monitoring and Analysis of Land Subsidence Along Beijing-Tianjin Inter-City Railway. J. Indian Soc. Remote Sens. 2016, 44, 915–931. [Google Scholar] [CrossRef]
  4. Gambolati, G.; Teatini, P. Geomechanics of subsurface water withdrawal and injection. Water Resour. Res. 2015, 51, 3922–3955. [Google Scholar] [CrossRef]
  5. Wu, Z.; Ma, P.; Zheng, Y.; Gu, F.; Liu, L.; Lin, H. Automatic detection and classification of land subsidence in deltaic metropolitan areas using distributed scatterer InSAR and Oriented R-CNN. Remote Sens. Environ. 2023, 290, 113545. [Google Scholar] [CrossRef]
  6. Huang, B.; Shu, L.; Yang, Y.S. Groundwater Overexploitation Causing Land Subsidence: Hazard Risk Assessment Using Field Observation and Spatial Modelling. Water Resour. Manag. 2012, 26, 4225–4239. [Google Scholar] [CrossRef]
  7. Schmidt, C. Alarm over a sinking delta. Science 2015, 348, 845–846. [Google Scholar] [CrossRef]
  8. Andreas, H.; Abidin, H.Z.; Sarsito, D.A.; Pradipta, D. Remotes sensing capabilities on land subsidence and coastal water hazard and disaster studies. Iop Conf. Series. Earth Environ. Sci. 2020, 500, 12036. [Google Scholar] [CrossRef]
  9. Syvitski, J.P.M.; Kettner, A.J.; Overeem, I.; Hutton, E.W.H.; Hannon, M.T.; Brakenridge, G.R.; Day, J.; Vorosmarty, C.J.; Saito, Y.; Giosan, L.; et al. Sinking deltas due to human activities. Nat. Geosci. 2009, 2, 681–686. [Google Scholar] [CrossRef]
  10. Ma, P.; Wang, W.; Zhang, B.; Wang, J.; Shi, G.; Huang, G.; Cheng, F.; Jiang, L.; Lin, H. Remotely sensing large- and small-scale ground subsidence: A case study of the Guangdong–Hong Kong–Macao Greater Bay Area of China. Remote Sens. Environ. 2019, 232, 111282. [Google Scholar] [CrossRef]
  11. Du, Y.; Feng, G.; Liu, L.; Fu, H.; Peng, X.; Wen, D. Understanding Land Subsidence Along the Coastal Areas of Guangdong, China, by Analyzing Multi-Track MTInSAR Data. Remote Sens. 2020, 12, 299. [Google Scholar] [CrossRef]
  12. Figueroa-Miranda, S.; Tuxpan-Vargas, J.; Ramos-Leal, J.A.; Hernández-Madrigal, V.M.; Villaseñor-Reyes, C.I. Land subsidence by groundwater over-exploitation from aquifers in tectonic valleys of Central Mexico: A review. Eng. Geol. 2018, 246, 91–106. [Google Scholar] [CrossRef]
  13. Galloway, D.L.; Erkens, G.; Kuniansky, E.L.; Rowland, J.C. Preface: Land subsidence processes. Hydrogeol. J. 2016, 24, 547–550. [Google Scholar] [CrossRef]
  14. Guo, H.; Bai, J.; Zhang, Y.; Wang, L.; Shi, J.; Li, W.; Zhang, Z.; Wang, Y.; Zhu, J.; Wang, H. The evolution characteristics and mechanism of the land subsidence in typical areas of the North China Plain. Geol. China 2017, 44, 1115–1127. [Google Scholar]
  15. Zhou, C.; Gong, H.; Chen, B.; Li, X.; Li, J.; Wang, X.; Gao, M.; Si, Y.; Guo, L.; Shi, M.; et al. Quantifying the contribution of multiple factors to land subsidence in the Beijing Plain, China with machine learning technology. Geomorphology. 2019, 335, 48–61. [Google Scholar] [CrossRef]
  16. Zhou, C.; Gong, H.; Chen, B.; Gao, M.; Cao, Q.; Cao, J.; Duan, L.; Zuo, J.; Shi, M. Land Subsidence Response to Different Land Use Types and Water Resource Utilization in Beijing-Tianjin-Hebei, China. Remote Sens. 2020, 12, 457. [Google Scholar] [CrossRef]
  17. Shi, X.; Zhang, S.; Jiang, M.; Pei, Y.; Qu, T.; Xu, J.; Yang, C. Spatial and temporal subsidence characteristics in Wuhan (China), during 2015–2019, inferred from Sentinel-1 synthetic aperture radar (SAR) interferometry. Nat. Hazards Earth Syst. Sci. 2021, 21, 2285–2297. [Google Scholar] [CrossRef]
  18. Han, Y.; Zou, J.; Lu, Z.; Qu, F.; Kang, Y.; Li, J. Ground Deformation of Wuhan, China, Revealed by Multi-Temporal InSAR Analysis. Remote Sens. 2020, 12, 3788. [Google Scholar] [CrossRef]
  19. Nie, L.; Zhang, M.; Jian, H. Analysis of surface subsidence mechanism and regularity under the influence of seism and fault. Nat. Hazards 2013, 66, 773–780. [Google Scholar] [CrossRef]
  20. Cigna, F.; Tapete, D. Satellite InSAR survey of structurally-controlled land subsidence due to groundwater exploitation in the Aguascalientes Valley, Mexico. Remote Sens. Environ. 2021, 254, 112254. [Google Scholar] [CrossRef]
  21. Khan, R.; Li, H.; Afzal, Z.; Basir, M.; Arif, M.; Hassan, W. Monitoring Subsidence in Urban Area by PSInSAR: A Case Study of Abbottabad City, Northern Pakistan. Remote Sens. 2021, 13, 1651. [Google Scholar] [CrossRef]
  22. Hu, J.; Motagh, M.; Guo, J.; Haghighi, M.H.; Li, T.; Qin, F.; Wu, W. Inferring subsidence characteristics in Wuhan (China) through multitemporal InSAR and hydrogeological analysis. Eng. Geol. 2022, 297, 106530. [Google Scholar] [CrossRef]
  23. Chaussard, E.; Amelung, F.; Abidin, H.; Hong, S. Land subsidence in central Mexico detected by ALOS InSAR time-series. Remote Sens. Environ. 2013, 140, 94–106. [Google Scholar] [CrossRef]
  24. Amelung, F.; Galloway, D.L.; Bell, J.W.; Zebker, H.A.; Laczniak, R.J. Sensing the ups and downs of Las Vegas: InSAR reveals structural control of land subsidence and aquifer-system deformation. Geology 1999, 27, 483–486. [Google Scholar] [CrossRef]
  25. Pepe, A.; Calò, F. A Review of Interferometric Synthetic Aperture RADAR (InSAR) Multi-Track Approaches for the Retrieval of Earth’s Surface Displacements. Appl. Sci. 2017, 7, 1264. [Google Scholar] [CrossRef]
  26. Sonnessa, A.; di Lernia, A.; Oscar Nitti, D.; Nutricato, R.; Tarantino, E.; Cotecchia, F. Integration of multi-sensor MTInSAR and ground-based geomatic data for the analysis of non-linear displacements affecting the urban area of Chieuti, Italy. Int. J. Appl. Earth Obs. Geoinf. 2023, 117, 103194. [Google Scholar] [CrossRef]
  27. Schmidt, D.A.; Bürgmann, R. Time-dependent land uplift and subsidence in the Santa Clara valley, California, from a large interferometric synthetic aperture radar data set. J. Geophys. Res. Solid Earth 2003, 108, 2416. [Google Scholar] [CrossRef]
  28. Tomás, R.; Herrera, G.; Delgado, J.; Lopez-Sanchez, J.M.; Mallorquí, J.J.; Mulas, J. A ground subsidence study based on DInSAR data: Calibration of soil parameters and subsidence prediction in Murcia City (Spain). Eng. Geol. 2010, 111, 19–30. [Google Scholar] [CrossRef]
  29. Tang, W.; Zhao, X.; Bi, G.; Chen, M.; Cheng, S.; Liao, M.; Yu, W. Quantifying seasonal ground deformation in Taiyuan basin, China, by Sentinel-1 InSAR time series analysis. J. Hydrol. 2023, 622, 129654. [Google Scholar] [CrossRef]
  30. Vetrivel, A.; Gerke, M.; Kerle, N.; Vosselman, G. Identification of damage in buildings based on gaps in 3D point clouds from very high resolution oblique airborne images. ISPRS-J. Photogramm. Remote Sens. 2015, 105, 61–78. [Google Scholar] [CrossRef]
  31. Ezquerro, P.; Del Soldato, M.; Solari, L.; Tomás, R.; Raspini, F.; Ceccatelli, M.; Fernández-Merodo, J.; Casagli, N.; Herrera, G. Vulnerability Assessment of Buildings due to Land Subsidence Using InSAR Data in the Ancient Historical City of Pistoia (Italy). Sensors 2020, 20, 2749. [Google Scholar] [CrossRef]
  32. Umarhadi, D.A.; Widyatmanti, W.; Kumar, P.; Yunus, A.P.; Khedher, K.M.; Kharrazi, A.; Avtar, R. Tropical peat subsidence rates are related to decadal LULC changes: Insights from InSAR analysis. Sci. Total Environ. 2022, 816, 151561. [Google Scholar] [CrossRef]
  33. Rateb, A.; Abotalib, A.Z. Inferencing the land subsidence in the Nile Delta using Sentinel-1 satellites and GPS between 2015 and 2019. Sci. Total Environ. 2020, 729, 138868. [Google Scholar] [CrossRef]
  34. Yi, Z.; Liu, M.; Liu, X.; Wang, Y.; Wu, L.; Wang, Z.; Zhu, L. Long-term Landsat monitoring of mining subsidence based on spatiotemporal variations in soil moisture: A case study of Shanxi Province, China. Int. J. Appl. Earth Obs. Geoinf. 2021, 102, 102447. [Google Scholar] [CrossRef]
  35. Li, F.; Gong, H.; Chen, B.; Zhou, C.; Guo, L. Analysis of the Contribution Rate of the Influencing Factors to Land Subsidence in the Eastern Beijing Plain, China Based on Extremely Randomized Trees (ERT) Method. Remote Sens. 2020, 12, 2963. [Google Scholar] [CrossRef]
  36. Tzampoglou, P.; Loupasakis, C. Numerical simulation of the factors causing land subsidence due to overexploitation of the aquifer in the Amyntaio open coal mine, Greece. Hydroresearch 2019, 1, 8–24. [Google Scholar] [CrossRef]
  37. Fotheringham, A.S.; Brunsdon, C.; Charlton, M. Quantitative Geography: Perspectives on Spatial Data Analysis; Sage Publications: London, UK, 2000. [Google Scholar]
  38. Fotheringham, A.S.; Brunsdon, C.; Charlton, M. Geographically Weighted Regression: The Analysis of Spatially Varying Relationships; John Wiley & Sons: Hoboken, NJ, USA, 2002. [Google Scholar]
  39. Wang, C.; Zhang, J.; Yan, X. The Use of Geographically Weighted Regression for the Relationship among Extreme Climate Indices in China. Math. Probl. Eng. 2012, 2012, 369539. [Google Scholar] [CrossRef]
  40. Cahalan, M.D.; Milewski, A.M. Sinkhole formation mechanisms and geostatistical-based prediction analysis in a mantled karst terrain. Catena 2018, 165, 333–344. [Google Scholar] [CrossRef]
  41. Yu, H.; Gong, H.; Chen, B.; Liu, K.; Gao, M. Analysis of the influence of groundwater on land subsidence in Beijing based on the geographical weighted regression (GWR) model. Sci. Total Environ. 2020, 738, 139405. [Google Scholar] [CrossRef]
  42. Xu, G.; Jiang, Y.; Wang, S.; Qin, K.; Ding, J.; Liu, Y.; Lu, B. Spatial disparities of self-reported COVID-19 cases and influencing factors in Wuhan, China. Sust. Cities Soc. 2022, 76, 103485. [Google Scholar] [CrossRef]
  43. Song, J.; Yu, H.; Lu, Y. Spatial-scale dependent risk factors of heat-related mortality: A multiscale geographically weighted regression analysis. Sust. Cities Soc. 2021, 74, 103159. [Google Scholar] [CrossRef]
  44. Cao, Z.; Wu, Z.; Li, S.; Guo, G.; Song, S.; Deng, Y.; Ma, W.; Sun, H.; Guan, W. Explicit Spatializing Heat-Exposure Risk and Local Associated Factors by coupling social media data and automatic meteorological station data. Environ. Res. 2020, 188, 109813. [Google Scholar] [CrossRef]
  45. Zhu, C.; Zhang, X.; Zhou, M.; He, S.; Gan, M.; Yang, L.; Wang, K. Impacts of urbanization and landscape pattern on habitat quality using OLS and GWR models in Hangzhou, China. Ecol. Indic. 2020, 117, 106654. [Google Scholar] [CrossRef]
  46. Fotheringham, A.S.; Yang, W.; Kang, W. Multiscale Geographically Weighted Regression (MGWR). Ann. Am. Assoc. Geogr. 2017, 107, 1247–1265. [Google Scholar] [CrossRef]
  47. Shabrina, Z.; Buyuklieva, B.; Ng, M.K.M. Short-Term Rental Platform in the Urban Tourism Context: A Geographically Weighted Regression (GWR) and a Multiscale GWR (MGWR) Approaches. Geogr. Anal. 2020, 53, 686–707. [Google Scholar] [CrossRef]
  48. Sun, H.; Peng, H.; Zeng, M.; Wang, S.; Pan, Y.; Pi, P.; Xue, Z.; Zhao, X.; Zhang, A.; Liu, F. Land Subsidence in a Coastal City Based on SBAS-InSAR Monitoring: A Case Study of Zhuhai, China. Remote Sens. 2023, 15, 2424. [Google Scholar] [CrossRef]
  49. Liu, Z.; Ng, A.H.; Wang, H.; Chen, J.; Du, Z.; Ge, L. Land subsidence modeling and assessment in the West Pearl River Delta from combined InSAR time series, land use and geological data. Int. J. Appl. Earth Obs. Geoinf. 2023, 118, 103228. [Google Scholar] [CrossRef]
  50. Sheng, N.; Tang, U.W. Zhuhai. Cities 2013, 32, 70–79. [Google Scholar] [CrossRef]
  51. Jinjin, J.; Jia, L.; Shutian, W.; Shan, J.; Bo, L.; Junsheng, L. Distribution Characteristics of Soft Soil and Risk Assessment of Soft Soil Subsidence in Zhuhai. J. Geol. Hazards Environ. Preserv. 2020, 31, 68–74. [Google Scholar]
  52. Shuang, W.; Xuexin, Y.; Jiang, J.; Tianliang, Y.; Jianzhong, W.; Hongshan, W. Analysis on factors affecting ground settlement in plain area of Pearl River Delta. Chin. J. Geol. Hazard Control. 2019, 30, 98–104. [Google Scholar]
  53. Zhibin, L.; Xinghai, D.; Mingxiang, C.; Jianyun, Z.; Lin, Y.; Xianyi, L.; Abdollahi, S. Subsidence monitoring and analysis of Zhuhai based on PS InSAR technology. J. Nat. Disasters 2021, 30, 38–46. [Google Scholar]
  54. Bo, L.; Jinjin, J.; Jia, L.; Abdollahi, S. Analysis of Ground Subsidence Monitoring in Zhuhai City Based on PS-InSAR Technology. Resour. Environ. Eng. 2021, 35, 241. [Google Scholar]
  55. Tizzani, P.; Berardino, P.; Casu, F.; Euillades, P.; Manzo, M.; Ricciardi, G.; Zeni, G.; Lanari, R. Surface deformation of Long Valley caldera and Mono Basin, California, investigated with the SBAS-InSAR approach. Remote Sens. Environ. 2007, 108, 277–289. [Google Scholar] [CrossRef]
  56. Tobler, W.R. Cellular Geography. In Philosophy in Geography; Gale, S., Olsson, G., Eds.; Springer: Dordrecht, The Netherlands, 1979; pp. 379–386. [Google Scholar]
  57. Anselin, L. Spatial Econometrics: Methods and Models; Springer Science and Business Media: Dordrecht, The Netherlands, 1988. [Google Scholar]
  58. Cliff, A.D.; Ord, J.K. Spatial Processes: Models and Applications; Pion Limited: London, UK, 1981; ISBN 08-85086-081-4. [Google Scholar]
  59. Hutcheson, G. The Multivariate Social Scientist; SAGE Publications: Thousand Oaks, CA, USA, 1999. [Google Scholar]
  60. Oshan, T.; Li, Z.; Kang, W.; Wolf, L.; Fotheringham, A. mgwr: A Python Implementation of Multiscale Geographically Weighted Regression for Investigating Process Spatial Heterogeneity and Scale. Isprs Int. J. Geo. Inf. 2019, 8, 269. [Google Scholar] [CrossRef]
  61. Yu, H.; Fotheringham, A.S.; Li, Z.; Oshan, T.; Wolf, L.J. On the measurement of bias in geographically weighted regression models. Spat. Stat. 2020, 38, 100453. [Google Scholar] [CrossRef]
  62. Yang, Q.; Ke, Y.; Zhang, D.; Chen, B.; Gong, H.; Lv, M.; Zhu, L.; Li, X. Multi-Scale Analysis of the Relationship between Land Subsidence and Buildings: A Case Study in an Eastern Beijing Urban Area Using the PS-InSAR Technique. Remote Sens. 2018, 10, 1006. [Google Scholar] [CrossRef]
  63. Li, G.; Feng, G.; Xiong, Z.; Liu, Q.; Xie, R.; Zhu, X.; Luo, S.; Du, Y. Surface deformation evolution in the Pearl River Delta between 2006 and 2011 derived from the ALOS1/PALSAR images. Earth Planets Space 2020, 72, 179. [Google Scholar] [CrossRef]
  64. Jingcai, L. Analysis on the Causes of Land Subsidence in the Pearl River Delta Plain. Geomat. Spat. Inf. Technol. 2022, 45, 162–165. [Google Scholar]
  65. Li, X.; Damen, M.C.J. Coastline change detection with satellite remote sensing for environmental management of the Pearl River Estuary, China. J. Mar. Syst. 2010, 82, S54–S61. [Google Scholar] [CrossRef]
  66. Blachowski, J. Application of GIS spatial regression methods in assessment of land subsidence in complicated mining conditions: Case study of the Walbrzych coal mine (SW Poland). Nat. Hazards 2016, 84, 997–1014. [Google Scholar] [CrossRef]
  67. Bayramov, E.; Buchroithner, M.; Kada, M.; Bayramov, R. Quantitative assessment of ground deformation risks, controlling factors and movement trends for onshore petroleum and gas industry using satellite Radar remote sensing and spatial statistics. Georisk 2022, 16, 283–300. [Google Scholar] [CrossRef]
  68. Palmisano, D.; Satalino, G.; Balenzano, A.; Mattia, F. Coherent and Incoherent Change Detection for Soil Moisture Retrieval From Sentinel-1 Data. IEEE Geosci. Remote Sens. 2022, 19, 1–5. [Google Scholar] [CrossRef]
  69. Bai, Z.; Fang, S.; Gao, J.; Zhang, Y.; Jin, G.; Wang, S.; Zhu, Y.; Xu, J. Could Vegetation Index be Derive from Synthetic Aperture Radar? – The Linear Relationship between Interferometric Coherence and NDVI. Sci. Rep. 2020, 10. [Google Scholar] [CrossRef]
  70. Andra Baduge, A.W.; Henschel, M.D.; Hobbs, S.; Buehler, S.A.; Ekman, J.; Lehrbass, B. Seasonal variation of coherence in SAR interferograms in Kiruna, Northern Sweden. Int. J. Remote Sens. 2016, 37, 370–387. [Google Scholar] [CrossRef]
Figure 1. Study area and dataset coverage. (a,b) denote the study area locations. The red rectangle in (b) represents the coverage area of the Sentinel-1 image. (c) displays the NDVI map of the study area.
Remotesensing 15 05155 g001
Figure 2. Research route.
Remotesensing 15 05155 g002
Figure 3. Schematic of the small baseline subset (SBAS) configuration of the Sentinel-1A images (the yellow points in the figure represent the master images, while the green points represent the slave images).
Remotesensing 15 05155 g003
Figure 4. Ground deformation rate in Zhuhai.
Remotesensing 15 05155 g004
Figure 5. Distribution of deformation in serious areas. (b) is the area of Baijiao Town, (c) is the Gaolan Port Economic Zone, (d) is the area of Hongqi Town, and (e) is the northern part of Hengqin Town. The red dashed box represents the key deformation area, while the pink solid line represents the main road.
Remotesensing 15 05155 g005
Figure 6. Space distribution of the regression residuals for OLS, GWR, and MGWR.
Remotesensing 15 05155 g006
Figure 7. Space distribution of local condition numbers for GWR and MGWR.
Remotesensing 15 05155 g007
Figure 8. Spatial distribution of geotectonic conditions parameter estimates for MGWR.
Remotesensing 15 05155 g008
Figure 9. Spatial distribution of human activity parameter estimates for MGWR.
Remotesensing 15 05155 g009
Figure 10. Spatial distribution of geographical environment parameter estimates for MGWR.
Remotesensing 15 05155 g010
Table 1. Sentinel-1 data information.
SAR SensorsOrbitBandNumber of Images
Sentinel-1A IW SLC11C-band48
TimespanTrack DirectionPolarization ModeResolution
8 January 2020 to
28 December 2021
Ascending orbitVV-polarization5 m × 20 m
Table 2. Influencing factors of ground deformation in the study area.
Conditioning FactorTimespanSourceScale
Geotectonic conditionsElevation2020–2021Drone orthophotography2 m
Slope2020–2021Drone orthophotography2 m
Aspect2020–2021Drone orthophotography2 m
Lithology2020–2021Guangdong Zhuhai Engineering Survey Institute-
Soft soil thickness2019Wang Shuang [52]-
Proximity to faults2020–2021Calculation based on the Euclidean distance through the Zhuhai fault-
Human ActivitiesLand use types2020–2021Landsat830 m
Building density2020–2021Obtained by calculating drone images200 m
Road network density2020–2021Obtained by calculating drone images200 m
Groundwater exploitation intensity2019Wang Shuang [52]-
Geographical EnvironmentNDVI2020–2021Sentinel-210 m
Soil moisture2020–2021Landsat830 m
Precipitation2020–2021CHIRPS Daily5400 m
Table 3. Proportion of grading the severity of ground deformation.
Ground Deformation (mm/y)Low
−10~10
Relatively Low
−30~−10 and >10
Medium
−50~−30
Relatively High
−80~−50
High
<−80
Total
Number of monitoring points1,154,432179,46429,45729592781,366,590
Percentage84.48%13.13%2.16%0.22%0.02%100%
Table 4. Main roads deformation information.
RoadAverage Deformation Rate (mm/y)Maximum Subsidence Rate (mm/y)Maximum Uplift Rate (mm/y)
Zhuhai Avenue−6.6−37.99.1
Gaolan Port Expressway−2.9−21.97.5
Western Coastal Highway−1.1−32.57.4
Zhuhai Airport Expressway−0.8−30.65.8
Guangzhou–Macao Expressway−4.1−46.05.4
Guangzhou Foshan Jiangmen Zhuhai Expressway−4.9−29.76.1
Table 5. VIF values of all explanatory variables.
VariableVIFVariableVIF
Intercept Proximity to faults1.444
Slope4.349Lithology1.271
Aspect1.355Road network density1.914
Elevation4.147Building density2.273
Soft soil thickness1.749Land use types1.853
Groundwater exploitation intensity1.597NDVI2.207
Precipitation1.256Soil moisture1.043
Table 6. Model diagnostics for OLS, GWR, and MGWR.
Diagnostic InformationOLSGWRMGWR
Log-likelihood−172.220−151.405−47.033
AICc376.782368.412291.755
RSS61.48850.93119.805
R-sq0.7220.7700.910
Adj. R-sq0.7040.7370.871
Table 7. Model bandwidth for MGWR.
VariableBandwidth (MGWR)VariableBandwidth (MGWR)
Intercept46.000Building density44.000
Slope60.000Soft soil thickness46.000
Aspect100.000Groundwater exploitation intensity44.000
Elevation219.000Land use types219.000
Proximity to faults181.000NDVI44.000
Lithology211.000Precipitation110.000
Road network density46.000Soil moisture219.000
Table 8. Summary statistics for MGWR parameters.
VariableMeanSTDMinMedianMaxAdj. t-Val (95%)
Intercept0.0310.116−0.1900.0220.2962.748
Slope0.0430.148−0.2470.0520.3492.684
Aspect0.0110.054−0.0910.0040.1222.404
Elevation0.1040.0100.0820.1090.1182.078
Proximity to faults−0.0160.058−0.110−0.0160.0912.341
Lithology−0.0650.019−0.092−0.068−0.0302.138
Road network density0.1770.098−0.1150.1060.3722.778
Building density0.1550.136−0.0720.1350.4842.787
Soft soil thickness−0.1820.115−0.435−0.1990.1132.749
Groundwater exploitation intensity−0.2070.214−0.620−0.2660.2572.638
Land use types−0.0170.005−0.024−0.018−0.0052.090
NDVI0.2400.176−0.1090.2750.5682.792
Precipitation0.0680.039−0.0340.0740.1392.427
Soil moisture0.0060.0020.0020.0050.0112.007
Table 9. Comparison of current research on factors that influence ground deformation in Zhuhai, China.
AreaPrevious StudiesThis Study
Baijiao Town (A)Groundwater exploitation [52]; soft soil thickness [49,54]NDVI > groundwater exploitation intensity > soft soil thickness
Hongqi Town (B)Upper loads [52]; groundwater exploitation [49,52]NDVI > groundwater exploitation intensity > building density
Gaolan Port Economic Zone (C)Soft soil thickness [49,54]; upper loads [64]Building density > soft soil thickness > road network density
Hengqin Town (D)Upper loads [64]The soft soil thickness > Building density > Road network density
ZhuhaiUpper loads [49,52,64]; soft soil thickness [49,54,64]; groundwater exploitation [49,52,65]NDVI > groundwater exploitation intensity > soft soil thickness > building density > Road network density
Table 10. Comparison of current research using GWR and MGWR.
Study AreaDataset(s)Factor(s)MethodArea SizeR-sqRefs
BeijingMeasured dataGroundwater levelGWRBig0.765 [41]
SW PolandMeasured dataThickness, inclination, and depth of coal levels and surface slopeGWRSmall0.690 [66]
AbsheronRemote sensing image datasetsEight factors, both natural and human-madeGWRBig0.10~0.33 [67]
This studyRemote sensing image datasetsThirteen factors of geotectonic conditions, geographic environment, and human activitiesMGWRBig0.910-
Disclaimer/Publisher’s Note: The statements, opinions and data contained in all publications are solely those of the individual author(s) and contributor(s) and not of MDPI and/or the editor(s). MDPI and/or the editor(s) disclaim responsibility for any injury to people or property resulting from any ideas, methods, instructions or products referred to in the content.

