1. Introduction
The most accurate terrestrial method of measuring timber volume as an irregularly shaped body is xylometry, which states that any object immersed in a liquid is pushed upwards by a force equal to the volume of the displaced liquid, i.e., Archimedes’ law. According to [
1,
2], log volume is determined depending on its similarity to a geometric 3D shape, for example cylinder, paraboloid, cone or neiloid, which is dependent on tree species (broadleaved or conifers), part of stem, age and management type. By excluding 2D and 3D measurement systems, which use infrared, ultrasound or laser technology in electronic measurement facilities, the most precise method for volume estimation in the forest stand is the sectioning method. The sectioning method truncates log length at agreed steps (usually 50 cm long). For each section, two perpendicular mid-diameters of the section are measured, followed by a volume calculation of each section without rounding [
3]. Log volume is therefore presented as the sum of all sections. The method of sectionalised volume is seldom applicable in practice because it is time-consuming and expensive.
Forestry workers still use single log measurements in motor–manual timber cutting and processing using callipers for the diameter measurement and tapes for the length measurements of each log. If felling and processing are fully mechanised (cut-to-length system involving harvesters), automatic measurements follow because harvesters automate the measurement of log dimensions, leading to volume estimation. Li et al. [
4] state that log volume estimation is a central topic in forest science research and forestry practice because accurate volume estimation is essential for commercial harvesting and sustainable forest management, while timber remains the most important source of revenue in forestry and, therefore, it is necessary to precisely estimate its volume [
5]. All authors conclude that selecting a suitable model or method of log volume estimation is essential because various models or methods could result in different estimations of log volume.
The use of remote sensing technologies in forest operations has mainly been focused on defining terrain roughness, road network planning and maintenance, and surface, i.e., soil disturbance and displacement following timber extraction from the stand to the road-side landing sites [
6]. Some authors investigated the use of unmanned aerial systems (UASs) after wind disasters in areas that are difficult to reach by forest service workers [
7] or in damaged sites where the estimation of salvage logging volume is necessary [
8]. Others used UASs in areas where the need for a fast reaction is a must due to the large volume of fallen timber followed by a probable loss in value [
9] or because of the risk of bark beetle outbreaks [
10]. The use of UASs was previously confirmed in post-logging estimation of loblolly pine (
Pinus taeda L.) stump size, area and population for identifying and counting stumps, estimating stump diameter and stump area for a faster initial detection of timber trespass or illegal timber harvesting [
11]. Log volume estimation using remote measurements was investigated for measuring wood in active river channels, which tends to accumulate and generate a wood jam, thus having great relevance in fluvial environments [
12]. A UAS was also used for surveys and quantifications of woody debris after harvesting operations in managed forests [
13].
Timber is considered one of the most important products originating from forests and represents 0.7% of the gross domestic product in Europe [
14]. Löwe et al. [
5] stated that timber is the most important source of revenue in forestry. Besides the grading of assortments, which defines price per unit in the market, it is necessary to precisely estimate volume and weight to quantify the amount of merchantable timber. Authors continue that incorrect estimates of timber quantity affect the economic vitality of enterprises and forest owners. Within the wood supply chain, the measurement of roundwood plays a key role due to its high economic impact [
15]. Longuetaud et al. [
16] confirmed that in the context of climate change and strong pressures on resources, the optimisation of the forest and wood sectors is a challenge, thus making it necessary to be able to describe the quality of the resource as early as possible in the processing chain.
The goal of this article is to compare butt-log volume estimations gained by terrestrial measurements in the forest stand and a remote approach using a UAS with photogrammetric post-processing in four different software ArcGIS 10.1 (Environmental Systems Research Institute, Inc., Redlands, CA, USA, 2010), QGIS 3.16 (QGIS.org (2023). QGIS Geographic Information System, Open Source Geospatial Foundation Project), AutoCAD 2022 (Autodesk, Inc., San Francisco, CA, USA) and Pix4D mapper. By comparing these different approaches, it will be possible to understand the difference and deviation of quicker remote methods, which could optimise the process of log volume control and/or planning of timber transport after performing motor–manual cutting and processing of timber in the forest stand. The butt-log, as the least similar 3D geometric shape to a cylinder and the most similar to a neiloid, is the most challenging part of the tree trunk for precise volume estimation, especially when considering that the most valuable assortment classes are normally gained from butt-logs.
2. Materials and Methods
In March 2023, fieldwork was undertaken in the lowland part of the country close to the capital Zagreb (φ 45°41’11”N and λ 16°9’5”E), after a finished motor–manual final felling of a 140-year old even-aged oak stand, which was conducted in the same month. The terrain of the stand was flat and covered in weeds. Thirty pedunculate oak (
Quercus robur L.) butt-logs were measured in the field and marked with numbered markings using a Garmin GPSMAP 66s GPS receiver (
Figure 1).
Terrestrial measurements were conducted with callipers and a measuring tape for length measurements [
12]. Diameter measurements consisted of measuring (1) two perpendicular diameters at the small end of each log (SED), (2) two perpendicular diameters at the large end of each log (LED), (3) two perpendicular diameters at the midlength of each log (MED) and (4) two perpendicular diameters of each 50 cm long section at small end of the section and two perpendicular diameters at the large end of the section. Volume was estimated via the sectioning method and commonly used volume formulas for processed logs: Huber’s, Smailan’s and Riecke–Newton’s [
4,
17].
Huber’s method:
Smailan’s method:
Riecke–Newton’s method: .
where
V—volume, m3;
l—length, m;
d—diameter at the small end of a log, cm;
G—cross-sectional area at the large end of a log, m2;
gs—cross-sectional area at mid-end of a log, m2;
g—cross-sectional area at small end of a log, m2;
g1, g2, g3 …—cross-sectional area of each 50 cm long section.
For remote measurements, a DJI Mavic 3 Enterprise UAV (unmanned aerial vehicle) with the RTK module enabled was used. This is a rotary-wing aircraft (quadcopter) controlled by ground remote control. The aircraft was equipped with a DJI Mavic 3E Wide Camera, which was mounted on a 3-axis gimbal. The flight plan and mapping mission were created in the application DJI Fly app. The height of the flight was 60 m. Front and side overlap was 80%, where the camera was at an angle of 90° according to the field. A total of 658 photos were recorded and the flight lasted for 7:34 min.
Photogrammetric analysis was performed in Pix4D mapper (Pix4D Inc., Lausanne, Switzerland; ver. 4.8.4) software. Data processing resulted in a point cloud, a digital surface model (DSM) and an orthophoto map. The average Ground Sampling Distance (GSD) was 1.40 cm.
Data processing in AutoCAD 2022 software was based on an orthophoto map and included the measurements of 301 diameters and 271 lengths for each section on thirty butt-logs of the sample.
To estimate volume in Pix4D, a polygon must be drawn around each butt-log. The volume is computed using the DSM. PIX4Dmapper creates the base considering the altitude of each vertex drawn around the desired object and then projects a grid with GSD spacing on the base. For each cell of the grid, its volume (
Vi) is given by the following:
where
Li = the length of the cell.
Wi = the width of the cell.
Hi = the height of the cell.
The length (Li) and width (Wi) equal the project’s GSD, where Li = Wi = GSD.
The height (
Hi) is given by the following:
where
The software calculates two types of volumes: cut and fill volumes. The cut volume (
Vc) is the volume between the base and the 3D terrain when the terrain is higher than the base.
where
3. Results
After measuring 30 processed pedunculate oak butt-logs of 4.34 ± 0.875 m average length and 67.53 ± 11.514 cm average mid-diameter, the total volume of the sample estimated using the sectioning method was 51.334 m
3. When comparing log volumes gained using the sectioning method with three commonly used volume estimation methods for processed logs, Huber’s, Smailan’s and Riecke–Newton’s (
Figure 2), Riecke–Newton’s method had the smallest relative bias of +1.74%, Huber’s method had −8.07% and Smailan’s method had +21.23%.
Remote estimation of log volumes was based on a photogrammetric analysis in three different software: ArcGIS and QGis, AutoCAD and Pix4D.
3.1. Remote Volume Estimation Using ArcGIS and QGIS
After gaining a point cloud, a 3D model and an orthophoto map of the stand were produced with the help of a Pix4D mapper and the analysis of logs lengths and diameters using ArcGIS 10.1 and QGIS 3.16 software (
Figure 3).
When the trunk border was less visible at the three-band raster, a single-band raster was produced with a QGIS Roughness Index tool. Roughness Index gives the degree of irregularity of the surface, and it is calculated using the largest inter-cell difference between a central pixel and its surrounding cell (GDAL analysis web). The analysis of log lengths and diameters lasted less than one hour for 30 oak butt-logs. The results of measured lengths and diameters (SED, MED, LED) of logs gained via the UAS were compared to those measured in the field (
Figure 4). Considering diameters, R-squared showed that the best data fit in the regression model was for MED and SED. At the same time, expectedly, since the sample consisted solely of butt-logs, the LED had the least data fit but was still high at R
2 = 0.8870. Butt-logs’ LED is highly influenced by the undercut, root flare and hinge. Logs’ lengths gained from the orthophoto showed even better data fit, and R-squared was high at R
2 = 0.9992.
The
t-test values for measured dimensions are given in
Table 1. There is a statistically significant difference between terrestrial and remote measurements in all cases but MED, which is further corroborated by the critical values of the tests.
The standard deviation of the residuals, i.e., RMSE (Root Mean Square Error), showed a better fit for length measurements as well as both volume estimations and was less favourable for diameter measurements (
Figure 5).
The t-tests for volume estimations using Huber’s method and Riecke–Newton’s method showed a statistically significant difference between terrestrial and remote volume estimations in the case of Riecke–Newton’s volume estimation method (p = 0.3285) and no statistically significant difference for Huber’s volume estimation method (p = 0.0211).
In total, volume estimations gained remotely using ArcGIS and QGIS were, in the case of Huber’s method, at +3.63% relative bias and, in the case of Riecke–Newton’s method, at +1.39% relative bias.
3.2. Remote Volume Estimation Using AutoCAD
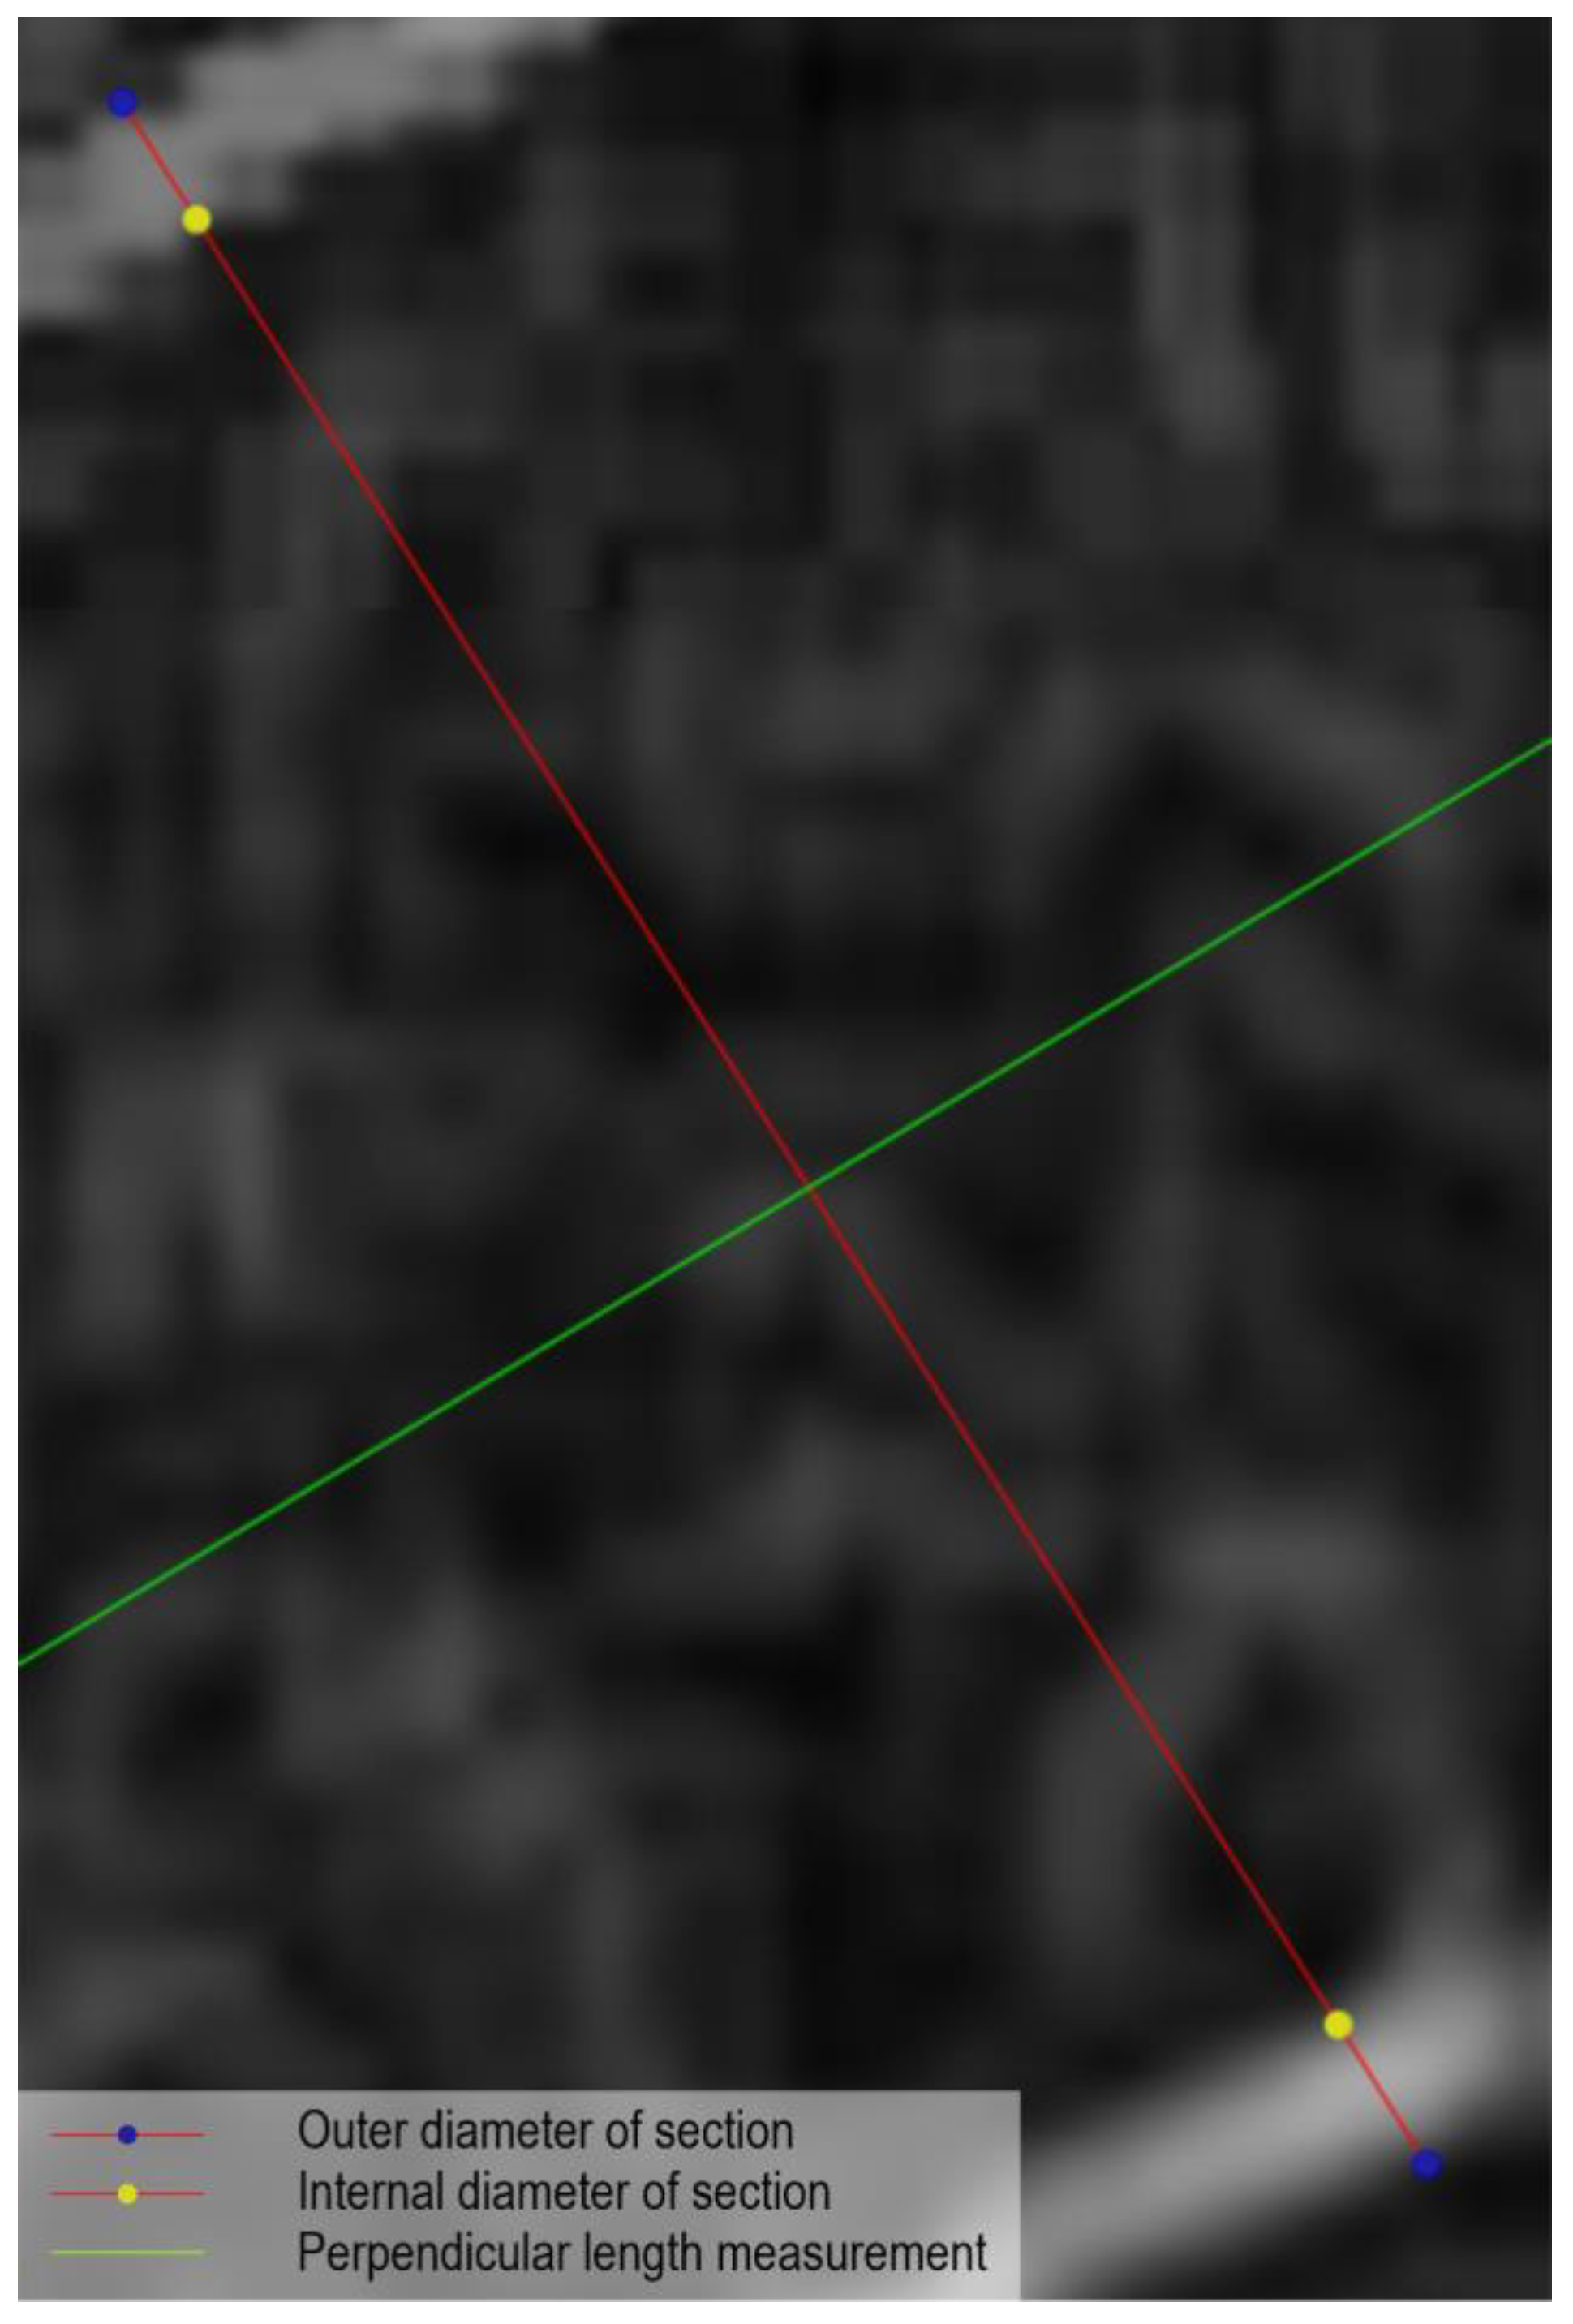
Due to the lower visibility of logs’ borders on three-band rasters (
Figure 6A), a single-band raster (
Figure 6B) created using the QGIS Roughness Index tool was used in the AutoCAD data analysis of the sectioning method (
Figure 6 and
Figure 7).
As is visible in
Figure 6, the borderline of each butt-log is represented by an inner and outer segment of pixels. Because of this, we analysed both the inner and outer log length as well as inner and outer part of diameter for each of the 271 sections. The mean values of length and diameters measurements were later compared to the terrestrial measurements (
Figure 7).
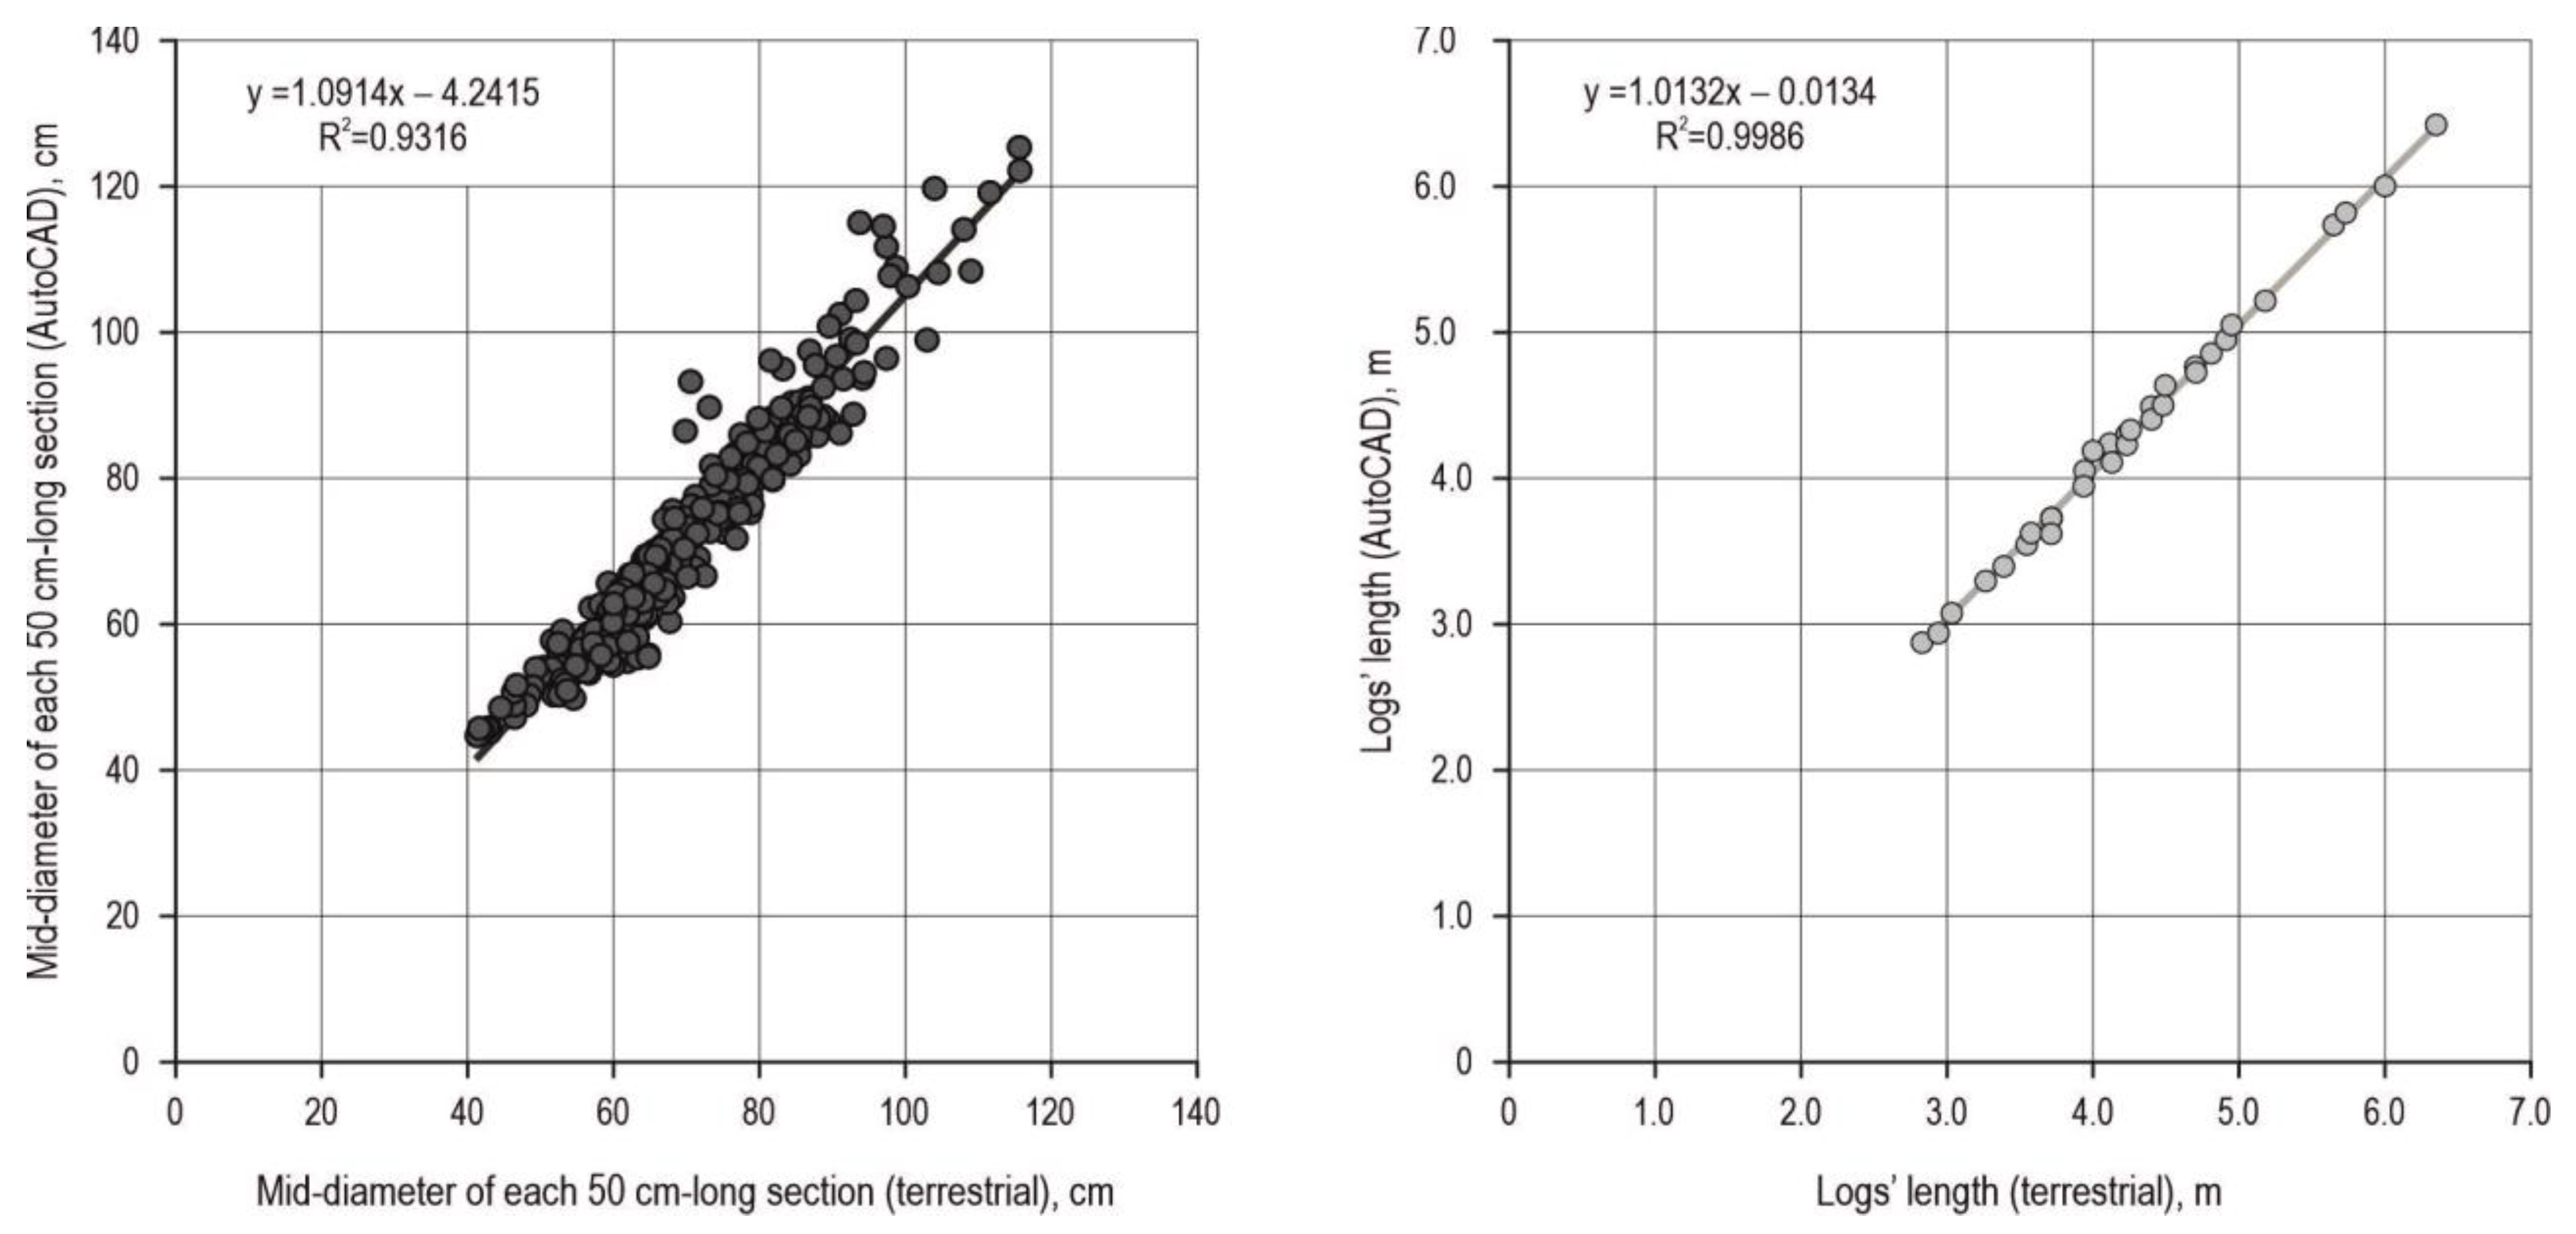
In the sectioning method, 602 diameters were measured in the field and compared to the values gained with the AutoCAD software (
Figure 8). Measuring 271 sections of 30 butt-logs for the sectioning method (50 cm long sections, two perpendicular diameters at the beginning and at the end of each section) lasted for eight hours in the field. Analysis of the prepared orthophotos in AutoCAD and Microsoft Excel lasted for fifteen hours, i.e., around thirty minutes per butt-log.
Figure 8 shows a strong correlation between measured diameters in the stand and those measured remotely in AutoCAD, with R
2 = 0.9316 for diameters and R
2 = 0.9986 for log lengths. The
t-tests showed a statistically significant difference for both data sets with
p < 0.05.
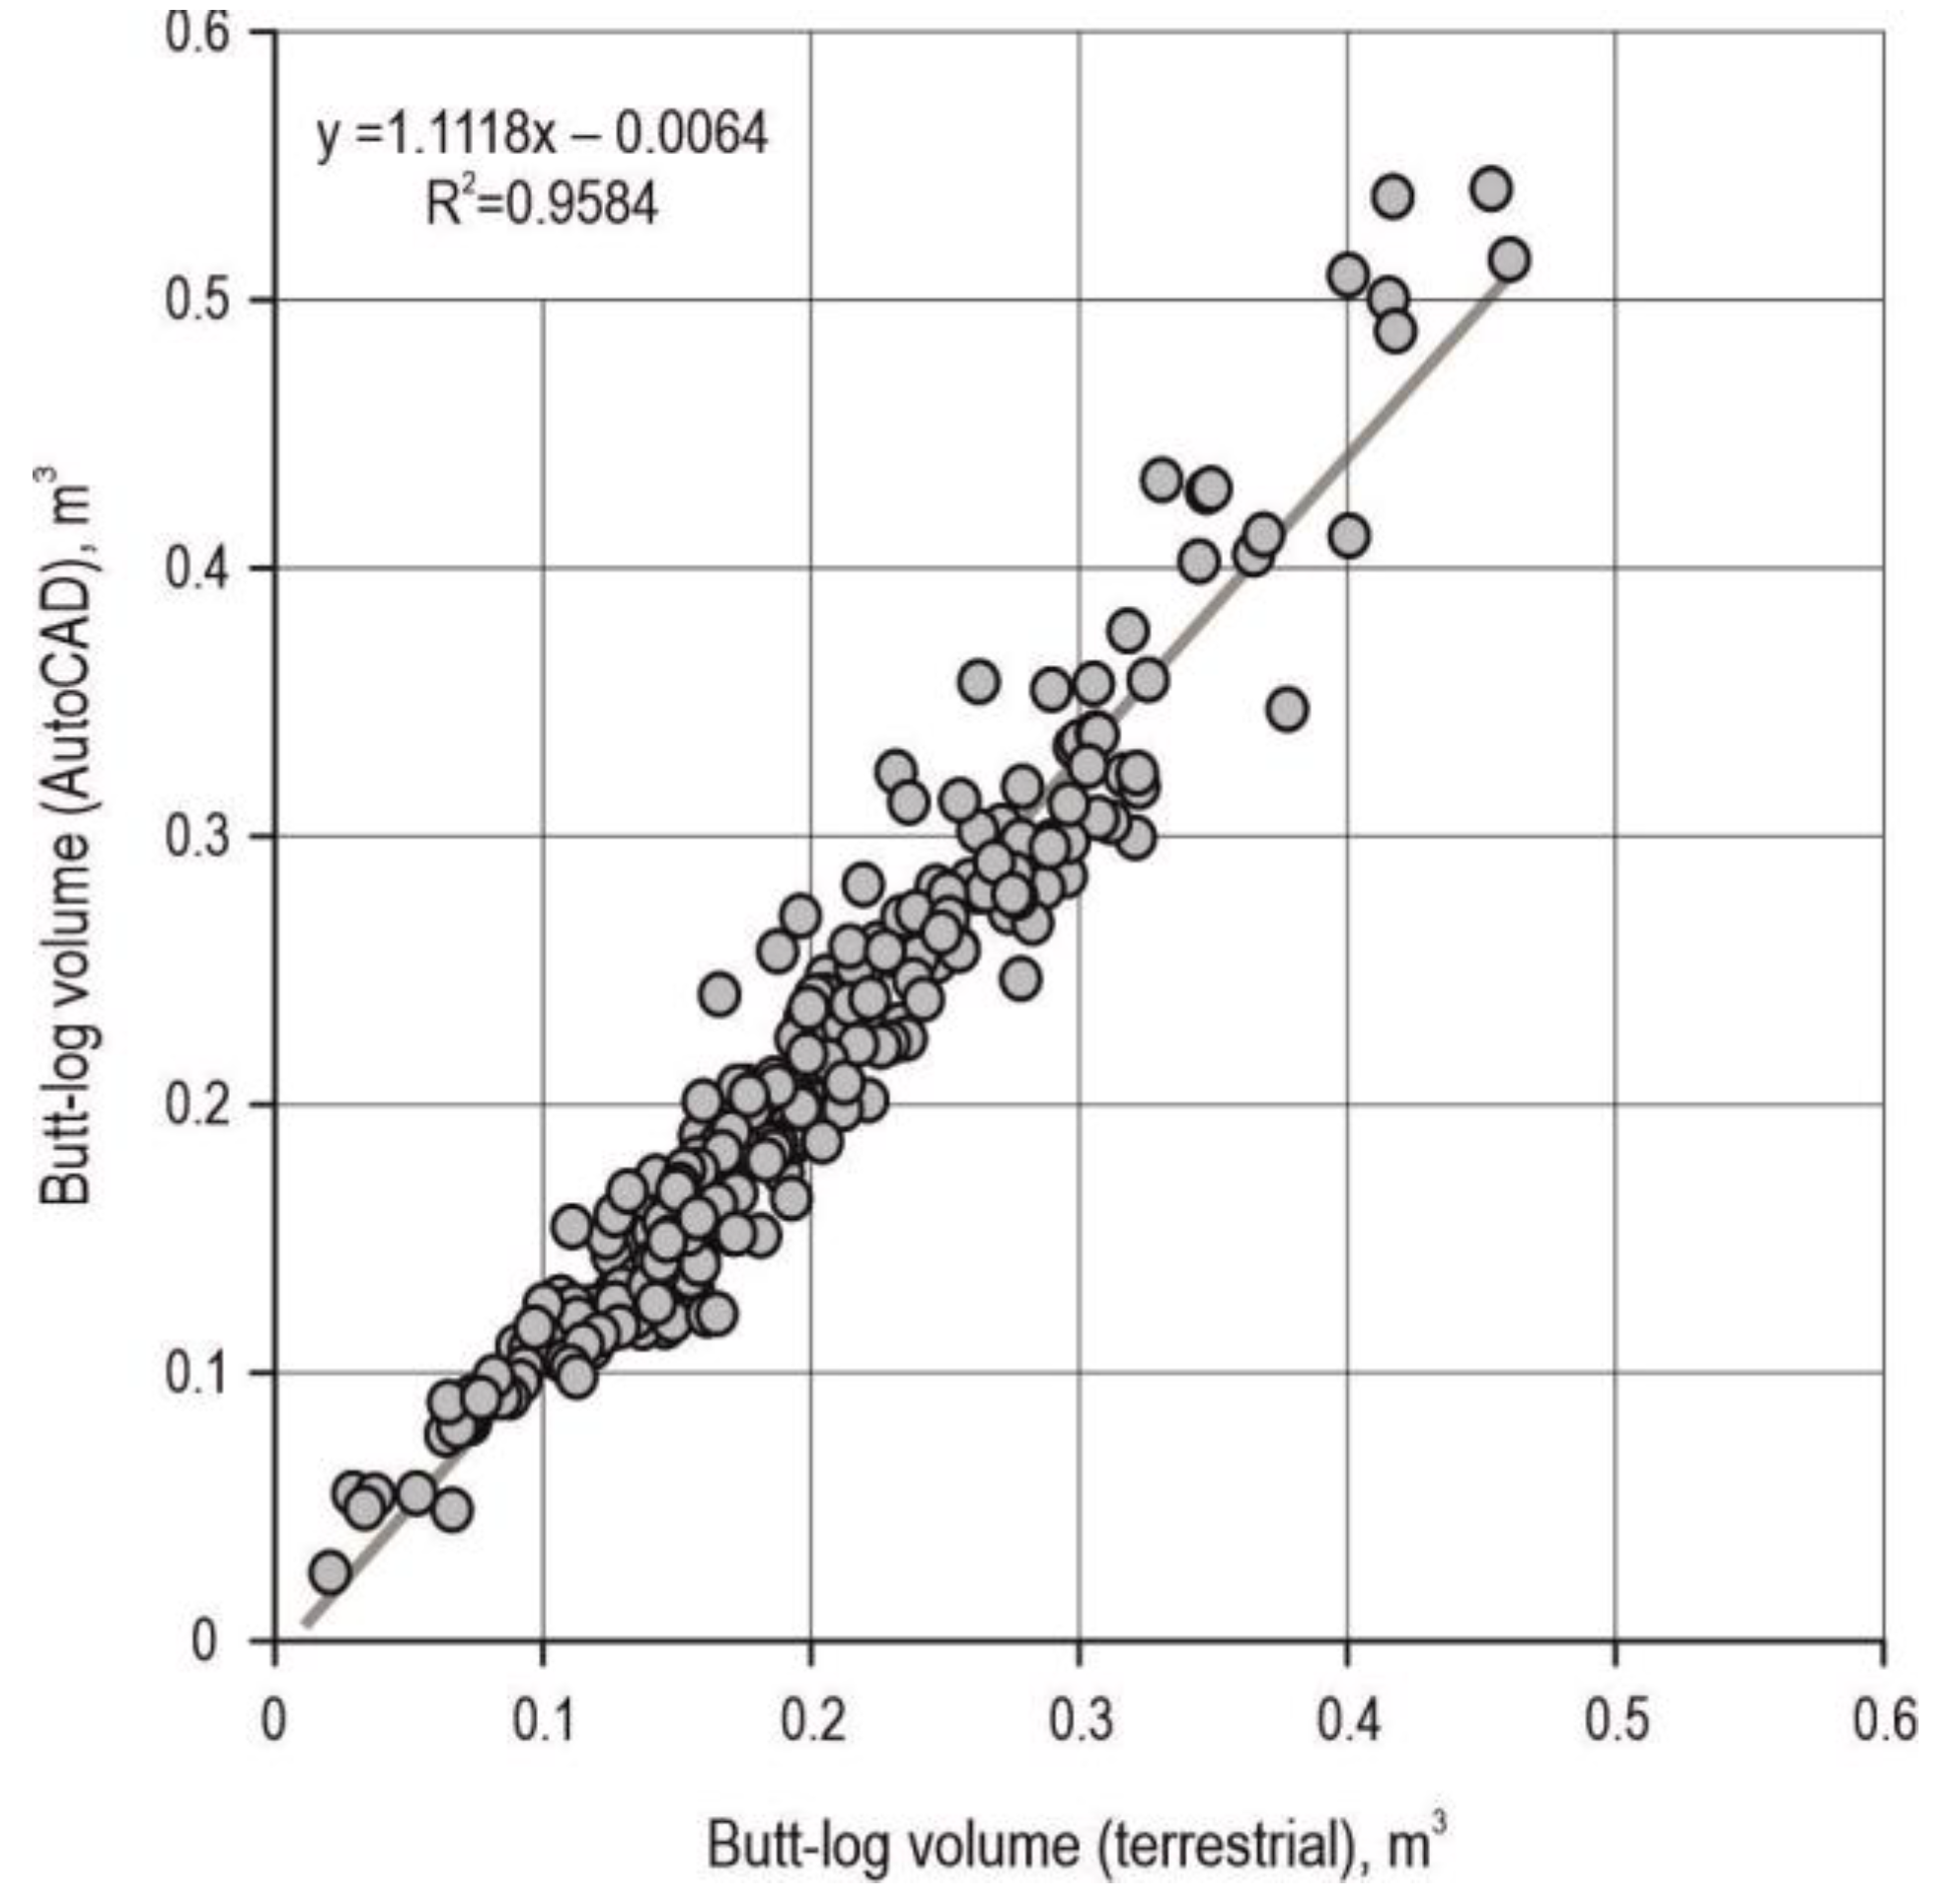
Again, strong correlation was gained when comparing volumes from the AutoCAD analysis and terrestrial measurements (
Figure 9). Volume estimation using the sectioning method resulted in a total of 51.334 m
3 for the whole sample, while the sectioning method performed with the help of the AutoCAD resulted in 55.151 m
3, i.e., +7.43% relative bias.
3.3. Remote Volume Estimation Using Pix4D
The volume calculation function within the Pix4D software was used on the generated digital surface model. When the surface was placed around the object, in this case butt-logs, whose volume was measured, the software calculated the volume of each butt-log (
Figure 10). After setting the area within which the volume was calculated, the alignment with the lowest point option was used in the calculation settings for all measured logs. This option defines the altitude of the base of the object whose volume is being calculated. In this case, it was the lowest selected pixel. For this research, cut volumes were taken into account.
Figure 10 shows a strong correlation between butt-log volumes gained in the stand using the sectioning method and those calculated via Pix4D software based on orthophotos R
2 = 0.9047. The
t-test showed a statistically significant difference for two volumes calculations with
p < 0.05.
Volume estimation of thirty oak butt-logs given by Pix4D software resulted in +9.34% relative bias (56.134 m3), while the volume of the sample estimated with the sectioning method was 51.334 m3. Volume estimation for the whole sample in Pix4D lasted up to one hour, mostly due to higher weed coverage around some butt-logs, which led to a slowing down of the process.
4. Discussion
Even though single log measurements in the forest stand or at a road-side landing site have a long tradition and involve the use of simple tools such as callipers and a measuring tape, practitioners must be well aware of the standards of each tree species (minimal dimensions of assortments, allowed wood defects) before defining the quality of each assortment, i.e., when performing a buck-to-quality method. On the other hand, some researchers [
18] showed that log quality can be estimated using a CT device and a terrestrial LiDAR device.
Li et al. [
4] stated that from the perspective of the forest value chain, wood volume can be addressed as (1) standing wood volume, expressed either as stem volume or as merchantable volume (a stem volume that has been truncated according to a given utilisation standard); (2) log volume, which is the merchantable volume that arrives at a mill’s gates, reduced as a result of losses during timber harvesting operations and transportation and/or standard classification; or (3) product volume, which is the amount that can be sold in the market, reduced as a result of mill operations. The same authors argue that it is usually assumed that differences in log volume models or methods result in equivalent estimates of log volume. They conclude that if this were true, any method could be considered as applicable as any other without concern about the accuracy of the estimation.
This study showed that remote estimation of log volume, especially as a measure of control or input for planning timber transport after conducting final felling in even-aged forests, can be compared to the sectioning method seldom used in practice due to its high costs and tediousness, i.e., in this research, the sectioning method lasted for eight hours and was performed on thirty oak butt-logs. Using orthophotos and ArcGIS or QGIS in measuring logs’ diameters and lengths is a simple and fast method (the UAS survey lasted for 7:34 min) of measuring the fundamental dimensions of logs necessary for further volume estimation. Even larger end diameters of oak butt-logs, when measured on orthophotos, showed high R-squared (R
2 = 0.8870) in comparison to terrestrial measurements. Even though Huber’s method for volume estimation is commonly used for logs throughout Europe, in this research, it was again confirmed [
19,
20,
21] that the use of the Riecke–Newton method for volume estimation had the smallest relative bias +1.74%, while for Huber’s method it was −8.07% and with Smailan’s method it was +21.23. Li et al. [
4] also confirmed a connection between volume estimation methods and timber processing methods, where under tree-length harvesting conditions, Huber’s method provided the smallest bias and Smailan’s method produced the largest bias; meanwhile, under cut-to-length harvesting conditions, Riecke–Newton’s method provided the most accurate volume estimate, even though logs were somewhat shorter (2.50 m) than in this research (4.34 m).
Han et al. [
22] estimated volumes using a “non destructive approach” for 51 buttressed trees from the Democratic Republic of Congo, Indonesia and Costa Rica by comparing the performance of the Alpha Shape Algorithm and the Slice Triangulation method on buttress volume estimation based on 30 point clouds. In this research, we used point cloud data for determining logs’ volume with the help of Pix4D software and its Volume tool [
23,
24] and, again, even though the
t-test showed a statistically significant difference between volumes gained using the sectioning method and volumes estimated remotely using the Volume tool, a strong correlation was established with R
2 = 0.9047.
Apart from using orthophotos in ArcGIS and Pix4D for volume estimations and measurement of dimensions, we used AutoCAD to question the possibility of conducting the sectioning method remotely. It involved only two diameter measurements per section (one at the smaller end of each section and one at the larger end of each section), not four perpendicular diameter measurements per section as in the stand. However, again, strong correlation was achieved (R
2 = 0.9316 for diameters and R
2 = 0.9986 for logs’ lengths) between the diameters measured in the stand and those measured remotely. The difference between total volume estimation using the sectioning method in the stand and remotely using AutoCAD on orthophotos was a +7.43% relative bias, which can be seen as quite high, but, on the other hand, the relative bias of volume estimation using Huber’s method was −8.07% versus the sectioning method of volume estimation. Croatia’s official single-log volume estimation method is Huber’s method [
25], as in many European countries. Also, one should remember that the butt-log is not only the most valuable part of a tree, but is distinctively different from a tree’s upper trunk, especially for broadleaved tree species, and is thus even more different from the cylinder (the base of Huber’s method for volume estimation) and is actually a neiloid.
Gülci et al. [
26] found that forest parameters at plot levels in stands could be quickly revealed using UAS photogrammetry. They showed that data can be evaluated as a metric measurement technique for sustainable and precise operational planning in forests. Similarly, Yiğit et al. [
27] conclude that both indoor and outdoor mapping have improved greatly with the use of laser scanning technology. In this research, the greatest challenge for measurements of diameters and lengths remotely using UAS photogrammetry was in the cases of an unclear log border, and sometimes a single-band raster had to be used to define the border more clearly. Also, it should not be ignored that this research was conducted on flat terrain at the beginning of March 2023, before the vegetation started, and the ground was covered in weeds from the last year. After a final felling in an even-aged forest, a small number of standing trees were present in the stand.
5. Conclusions
This experimental study showed that using a UAS for log volume estimation surveys has the potential for broader use, especially after final felling in even-aged forests where the remaining trees in the stand would not block photogrammetric analysis. Riecke–Newton’s method again proved to be the most accurate volume estimation method for oak butt-logs of 4.34 m mean length and 67.53 cm mean mid-diameter. Remotely measuring diameter and length and estimating volumes afterwards based on orthophotos using software (ArcGIS, AutoCAD and Pix4D) showed a very high correlation in all cases. Comparing the volume estimation gained via the sectioning method, the most expensive manual method in the field, to AutoCAD and Pix4D volume estimation, positive relative biases of +7.43% and +9.34%, respectively, were achieved. Perhaps values below 10% are not good enough for the precise control of conducted timber assortment processing, especially in situations involving oak butt-logs as the most probable logs for future veneer use, but can be helpful in planning timber transport, such as timber forwarding and long-distance truck transport. In the future, an automated approach for post-processing UAS-derived data for log volume estimation should be sought. The question of middle and top log volume estimation using UASs is still unanswered, even though we can assume that the discrepancy between terrestrial and remote measurements will be smaller. The influence of terrain slope has not been an issue in this research, but undoubtedly can affect remote volume estimation.


 ,
, 


