

Recurrent Residual Deformable Conv Unit and Multi-Head with Channel Self-Attention Based on U-Net for Building Extraction from Remote Sensing Images

Abstract
:1. Introduction
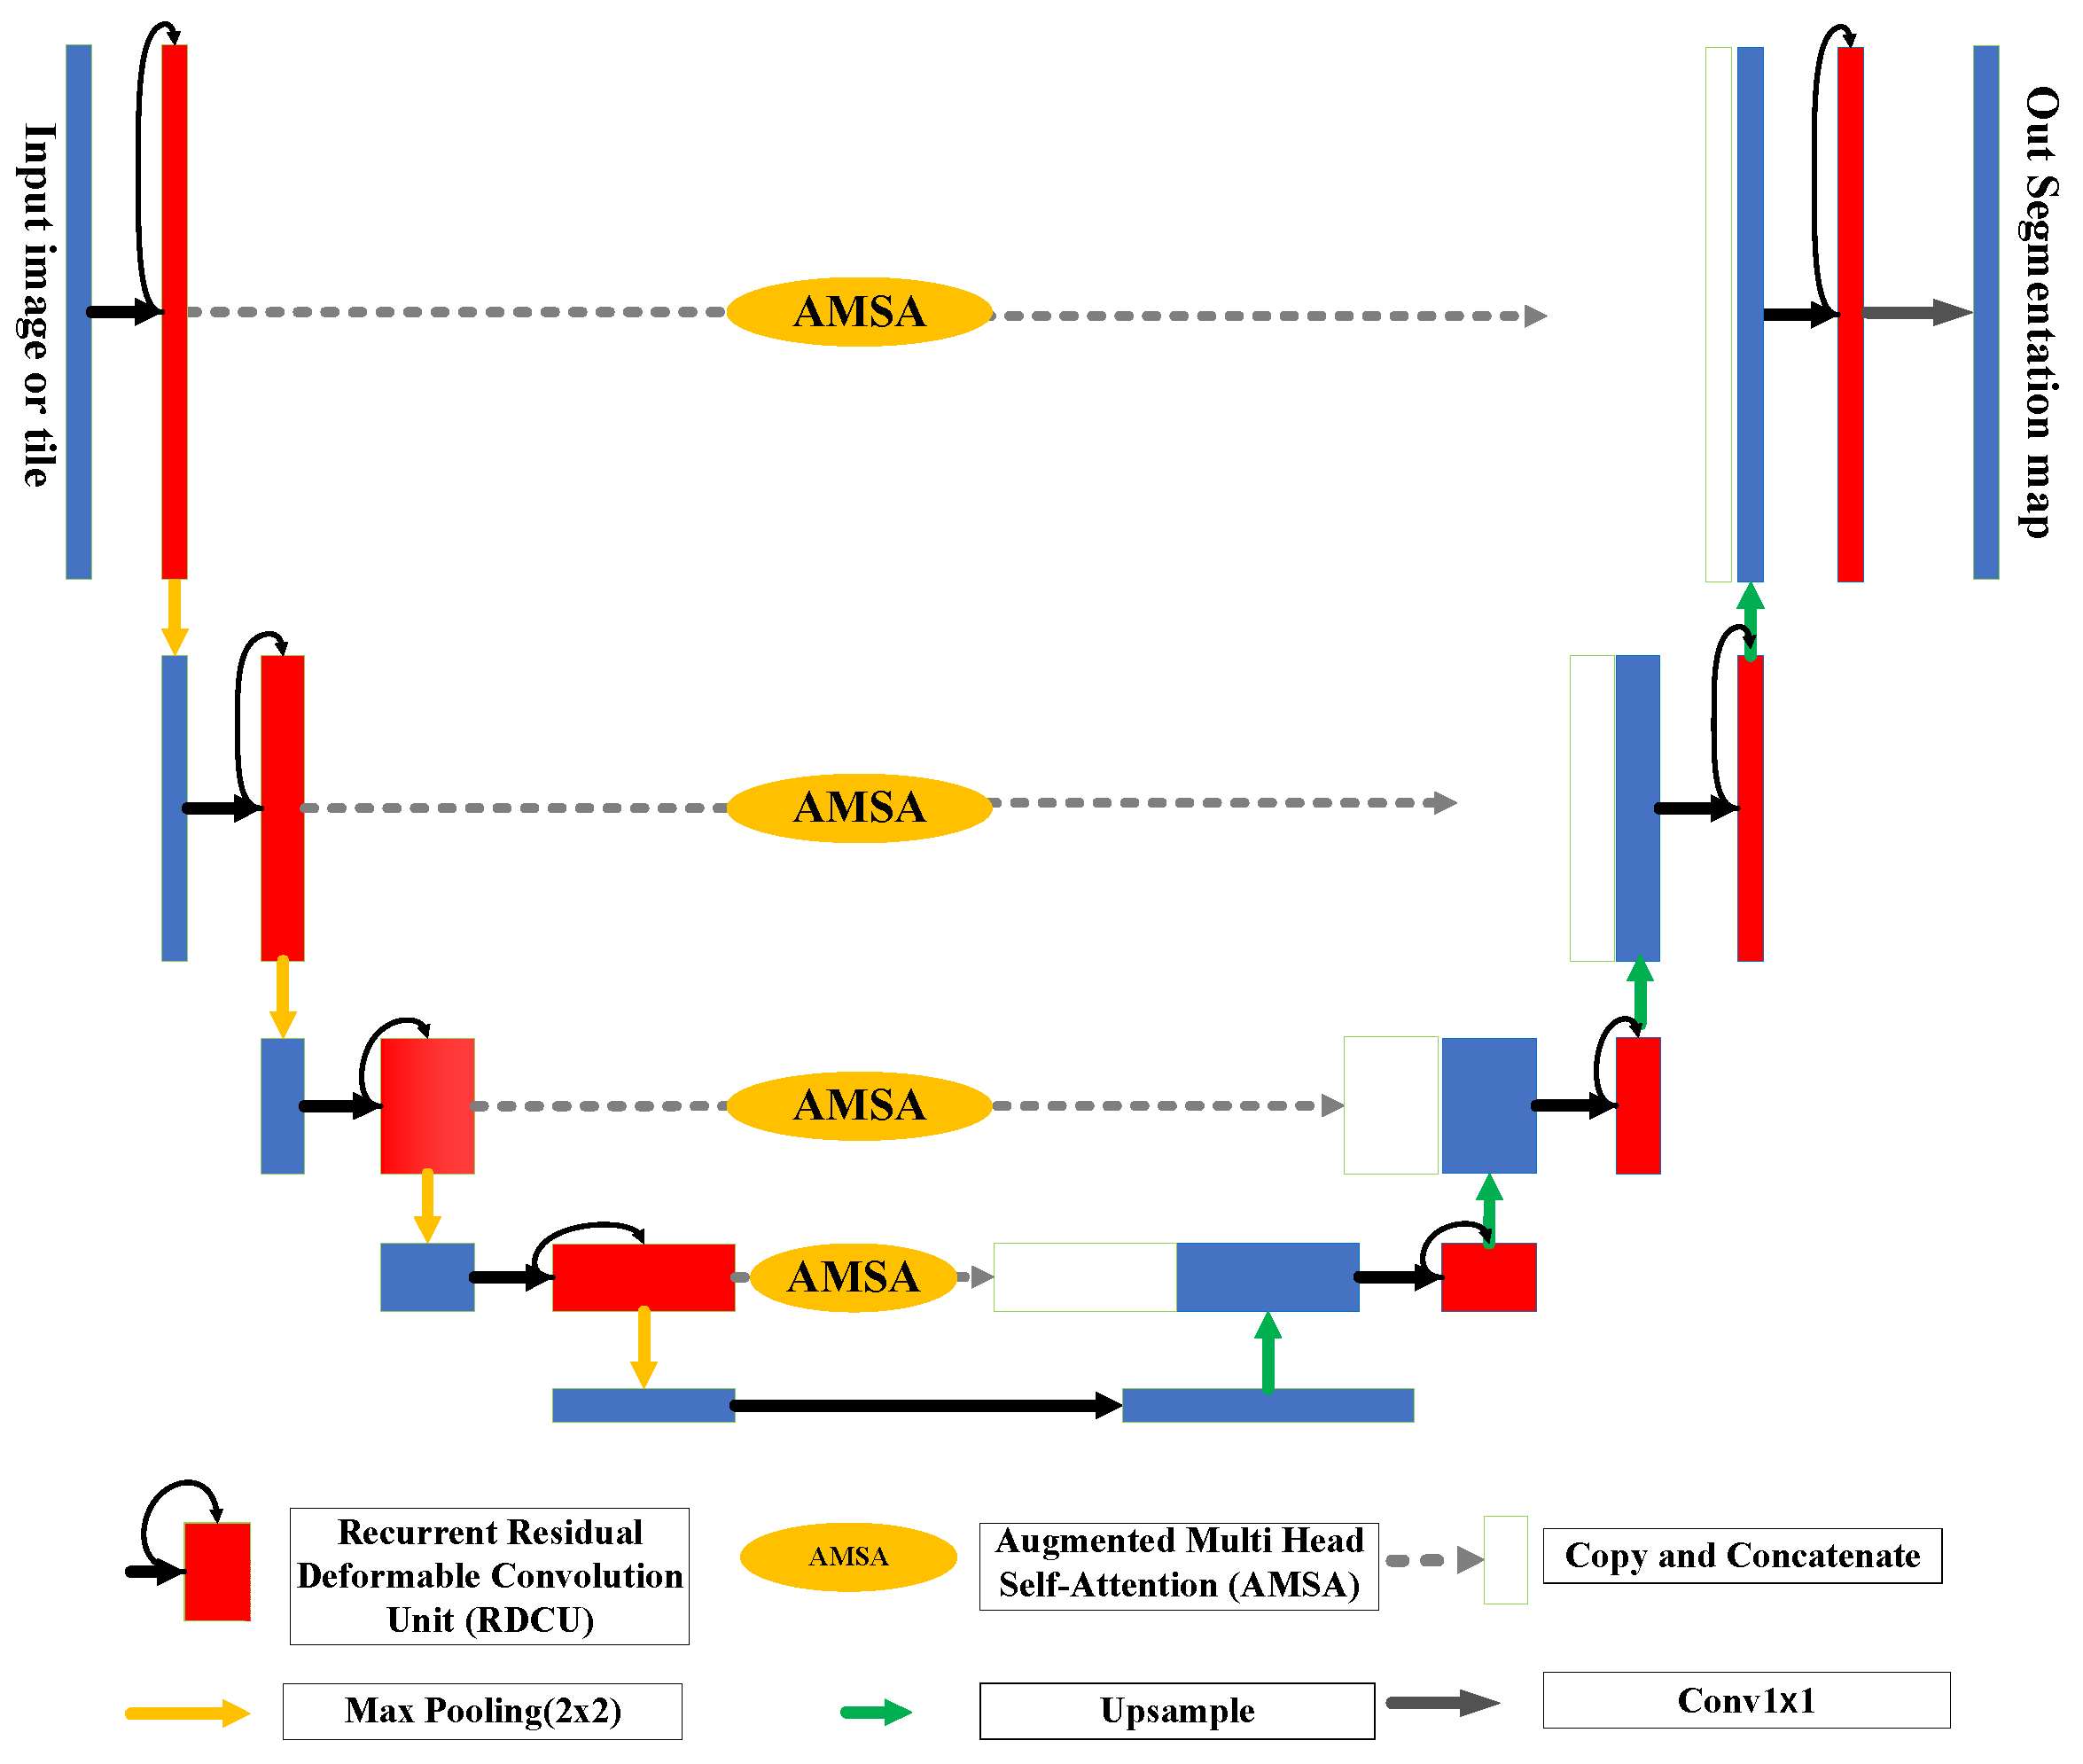
2. Methodology
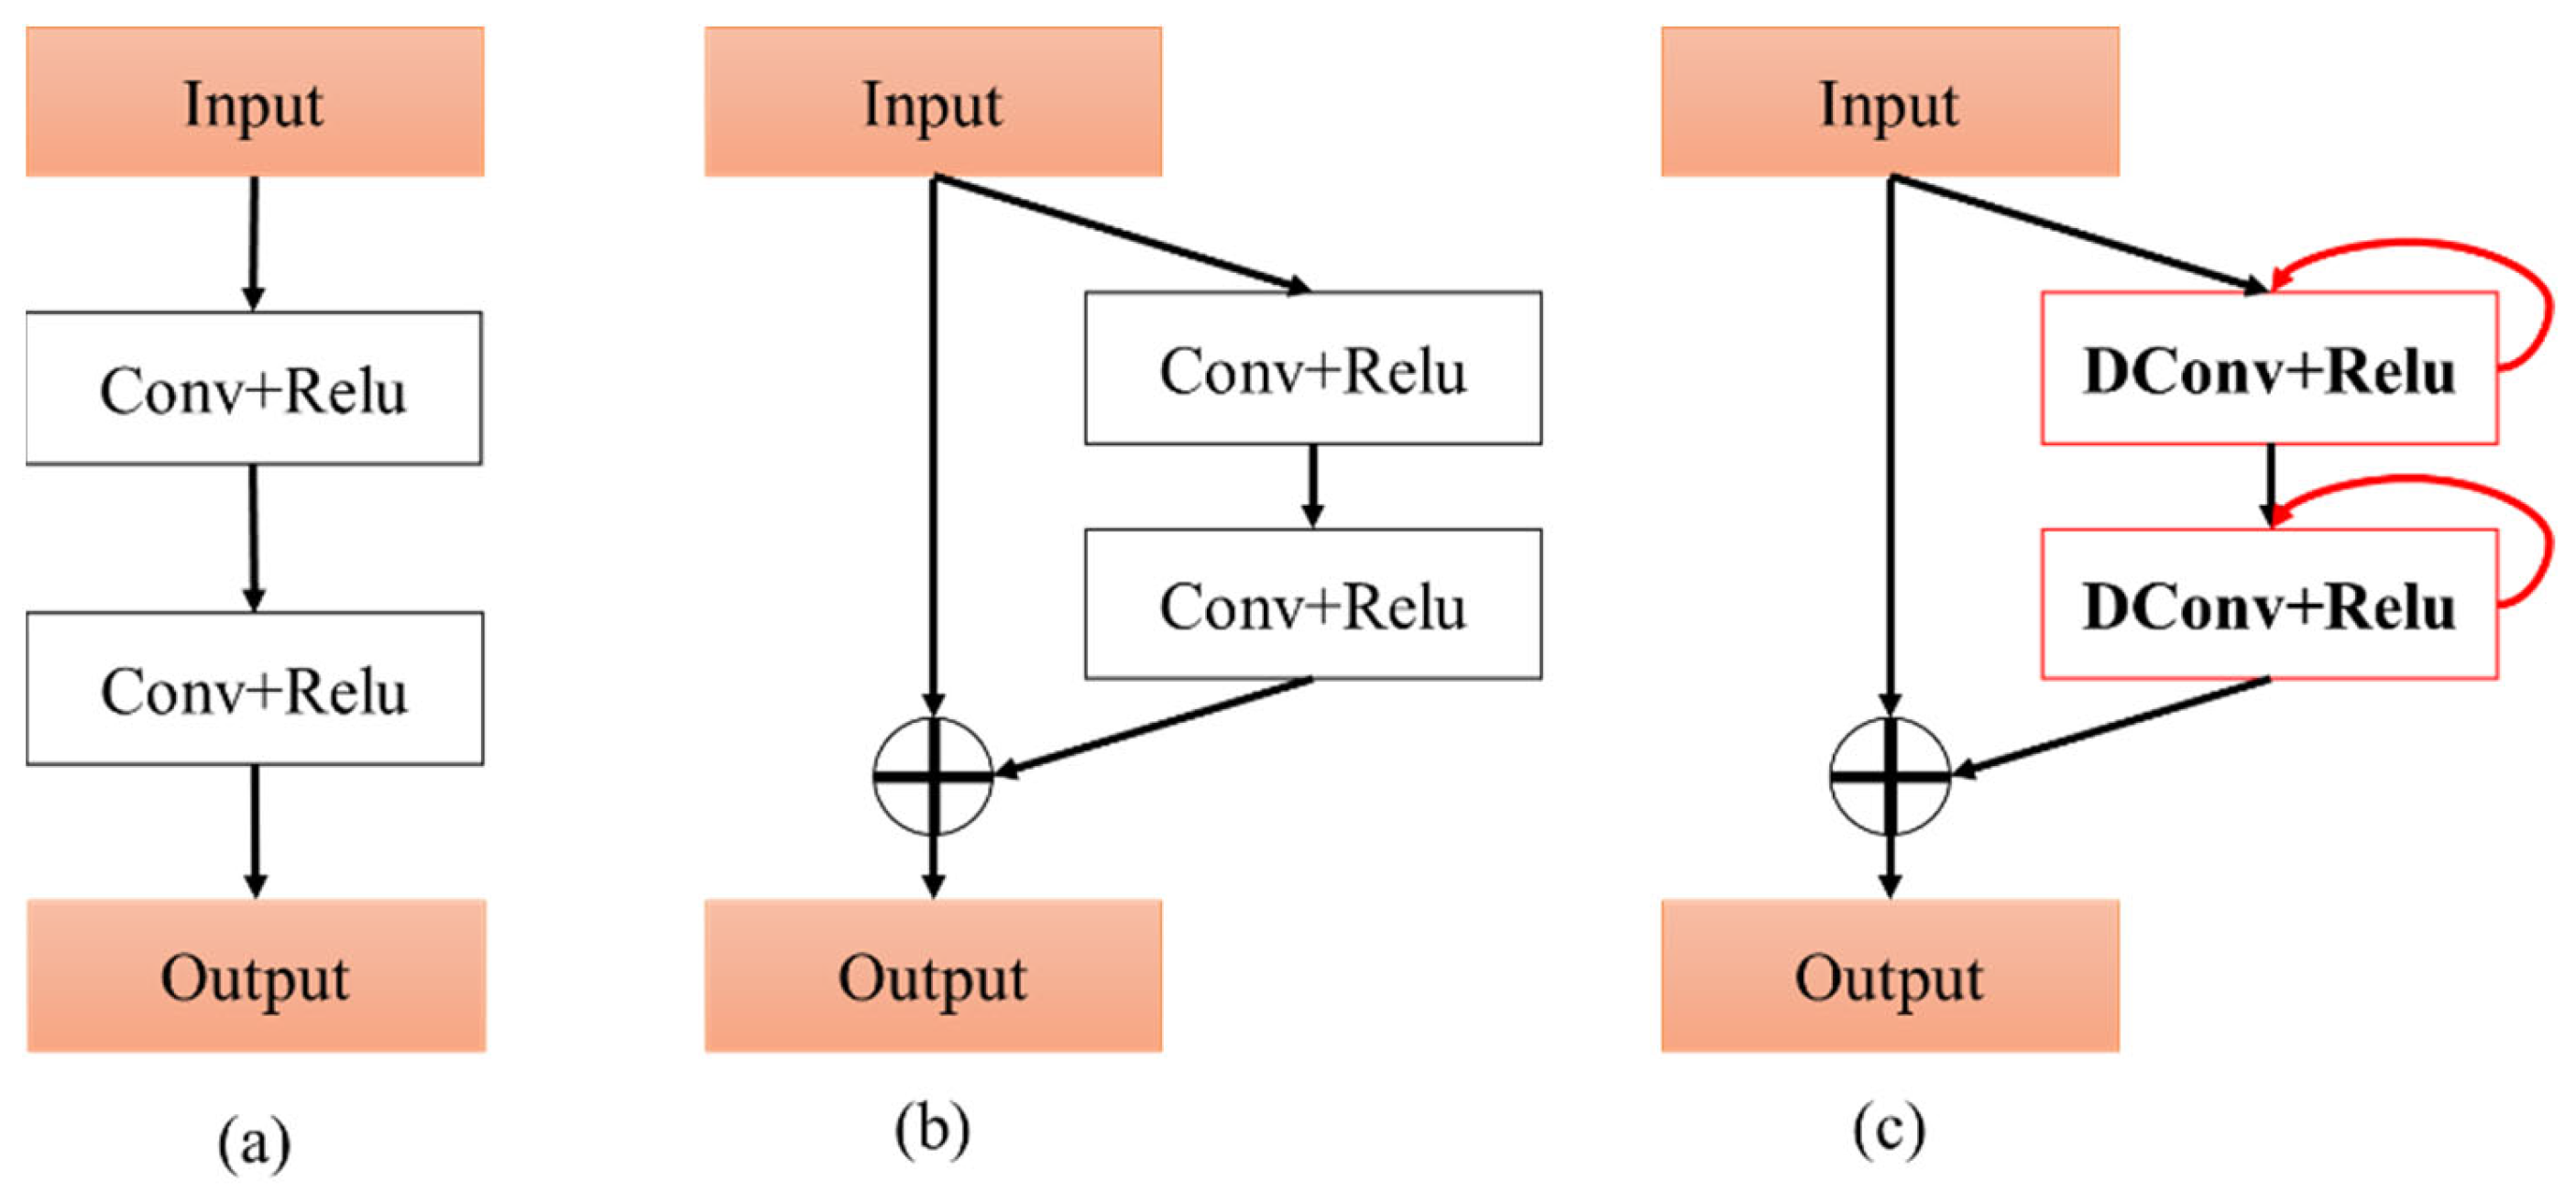
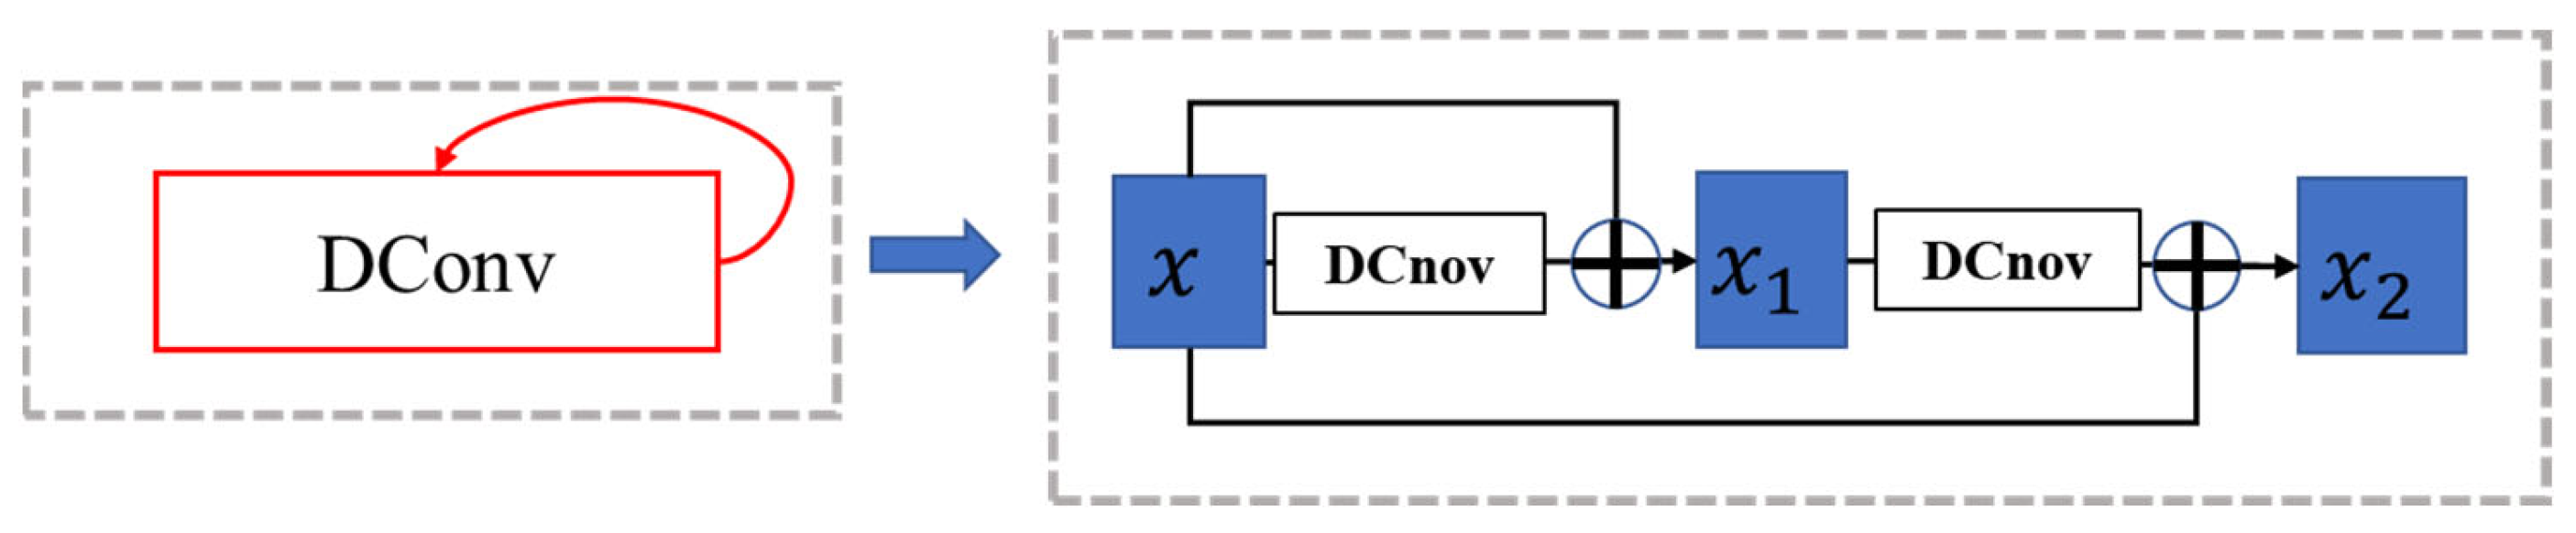
2.1. RADU Module
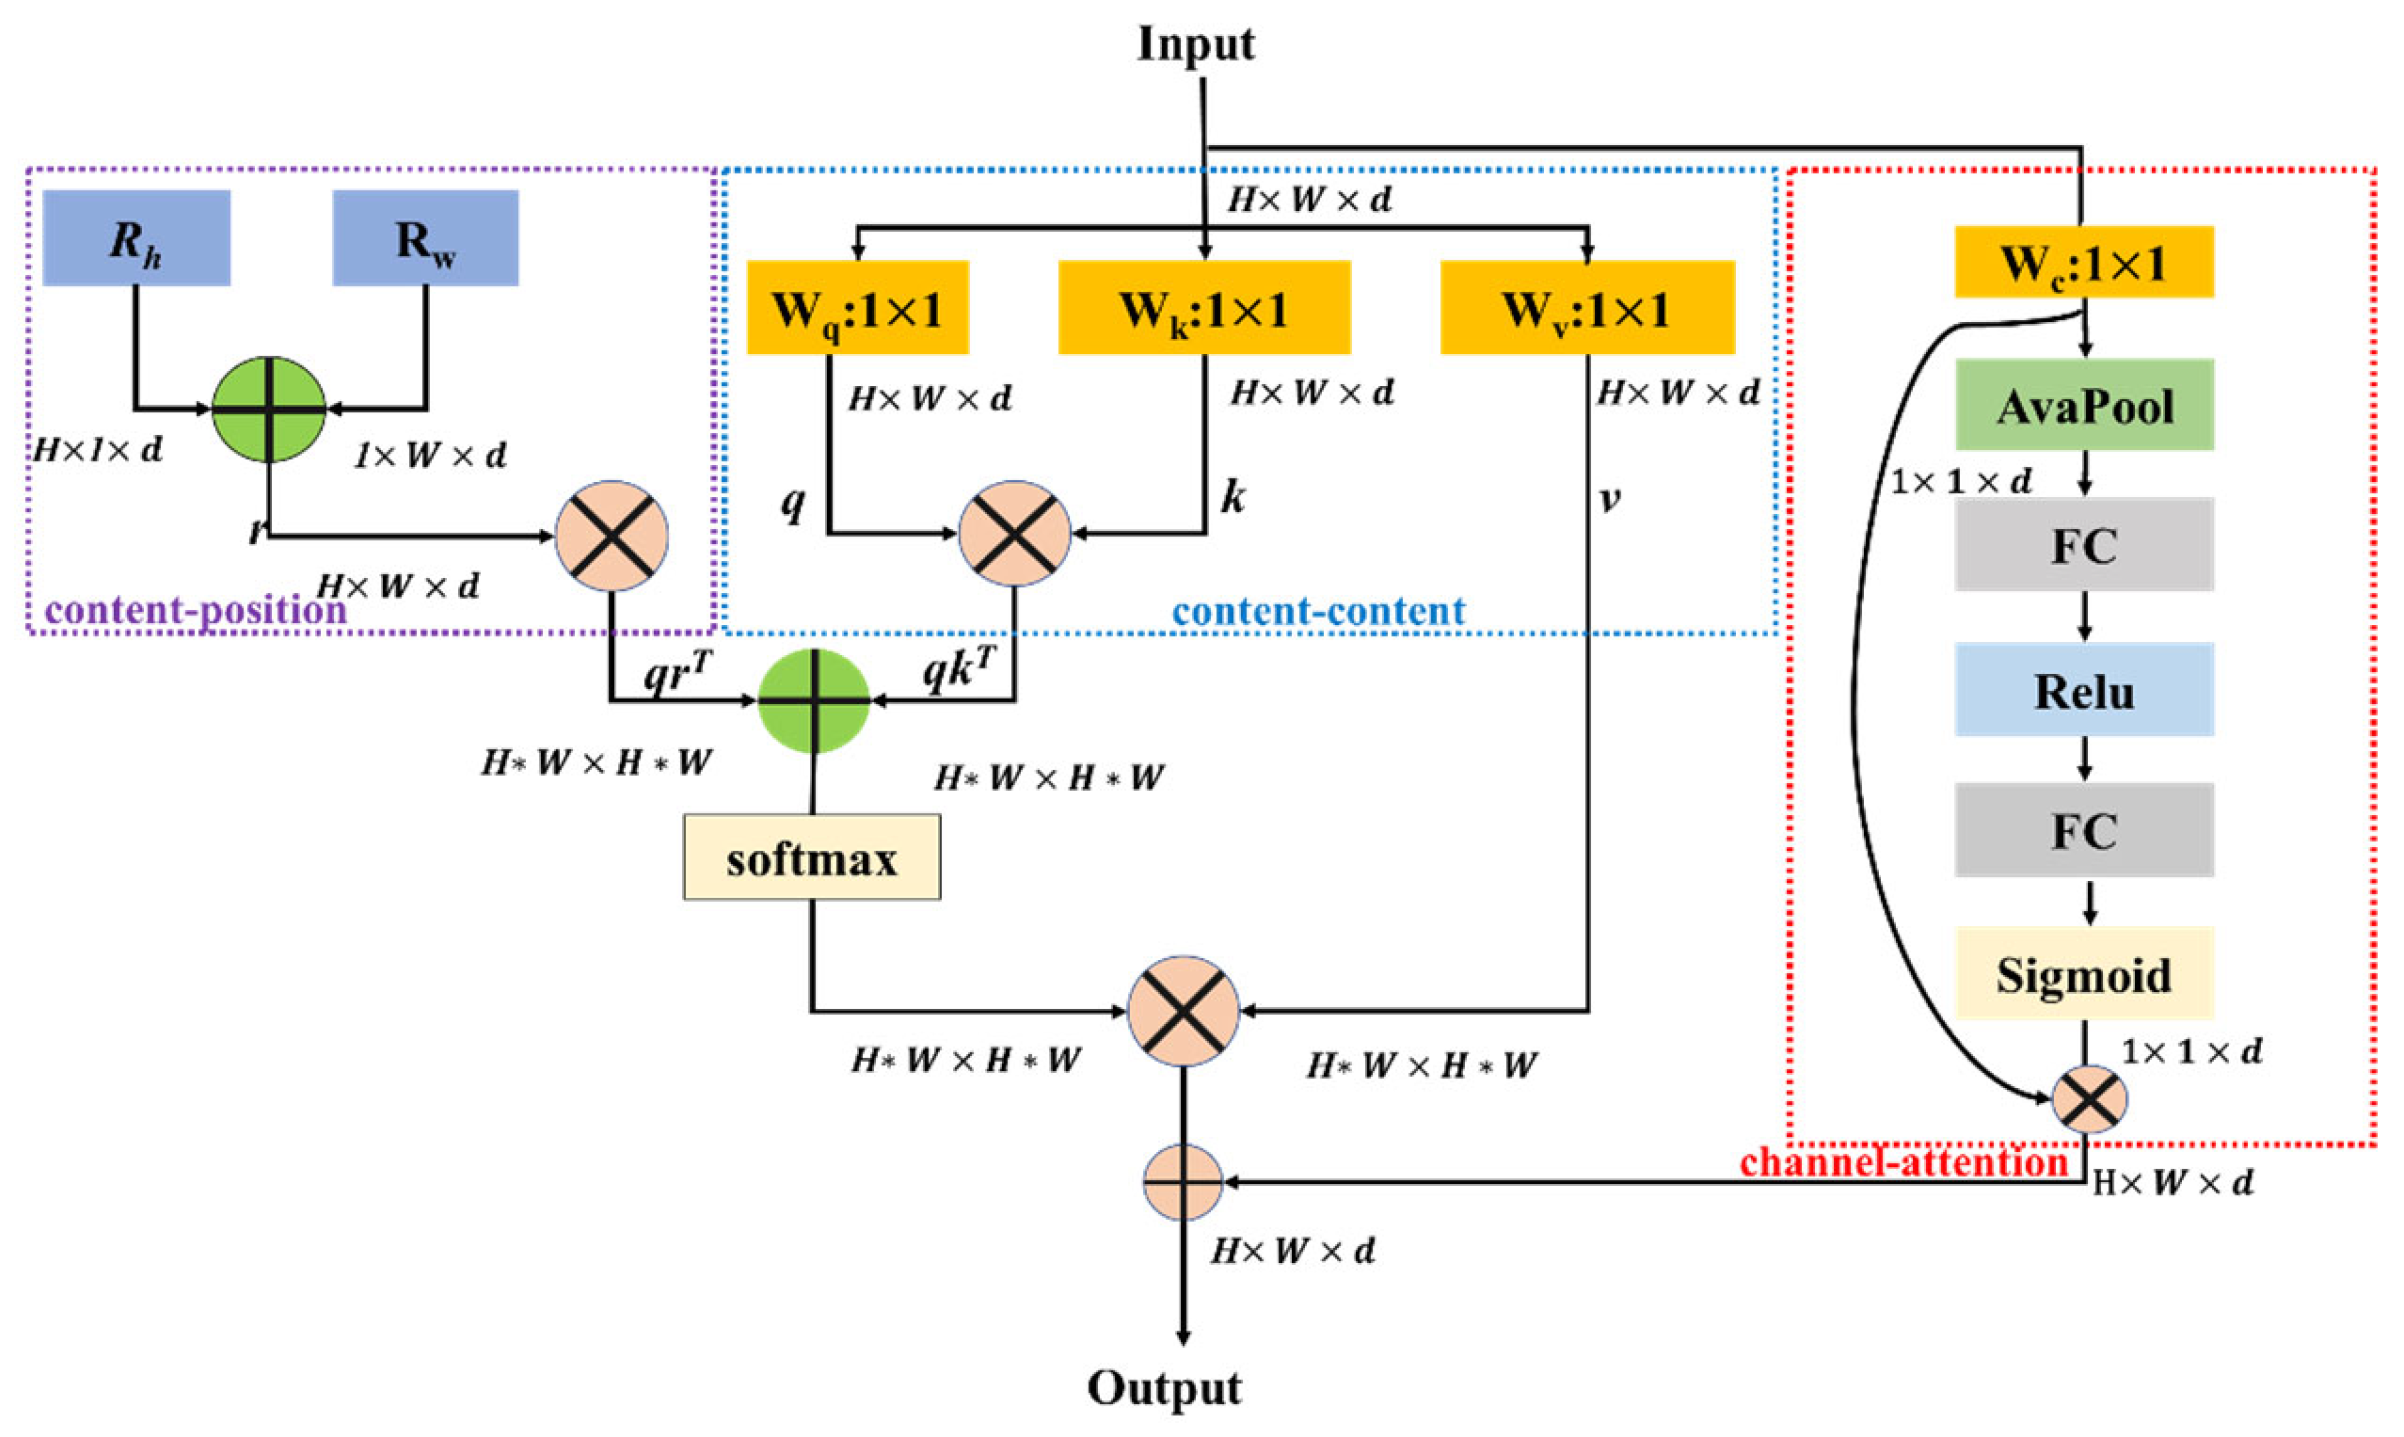
2.2. AMSA Module
3. Experiments and Results
3.1. Dataset Details
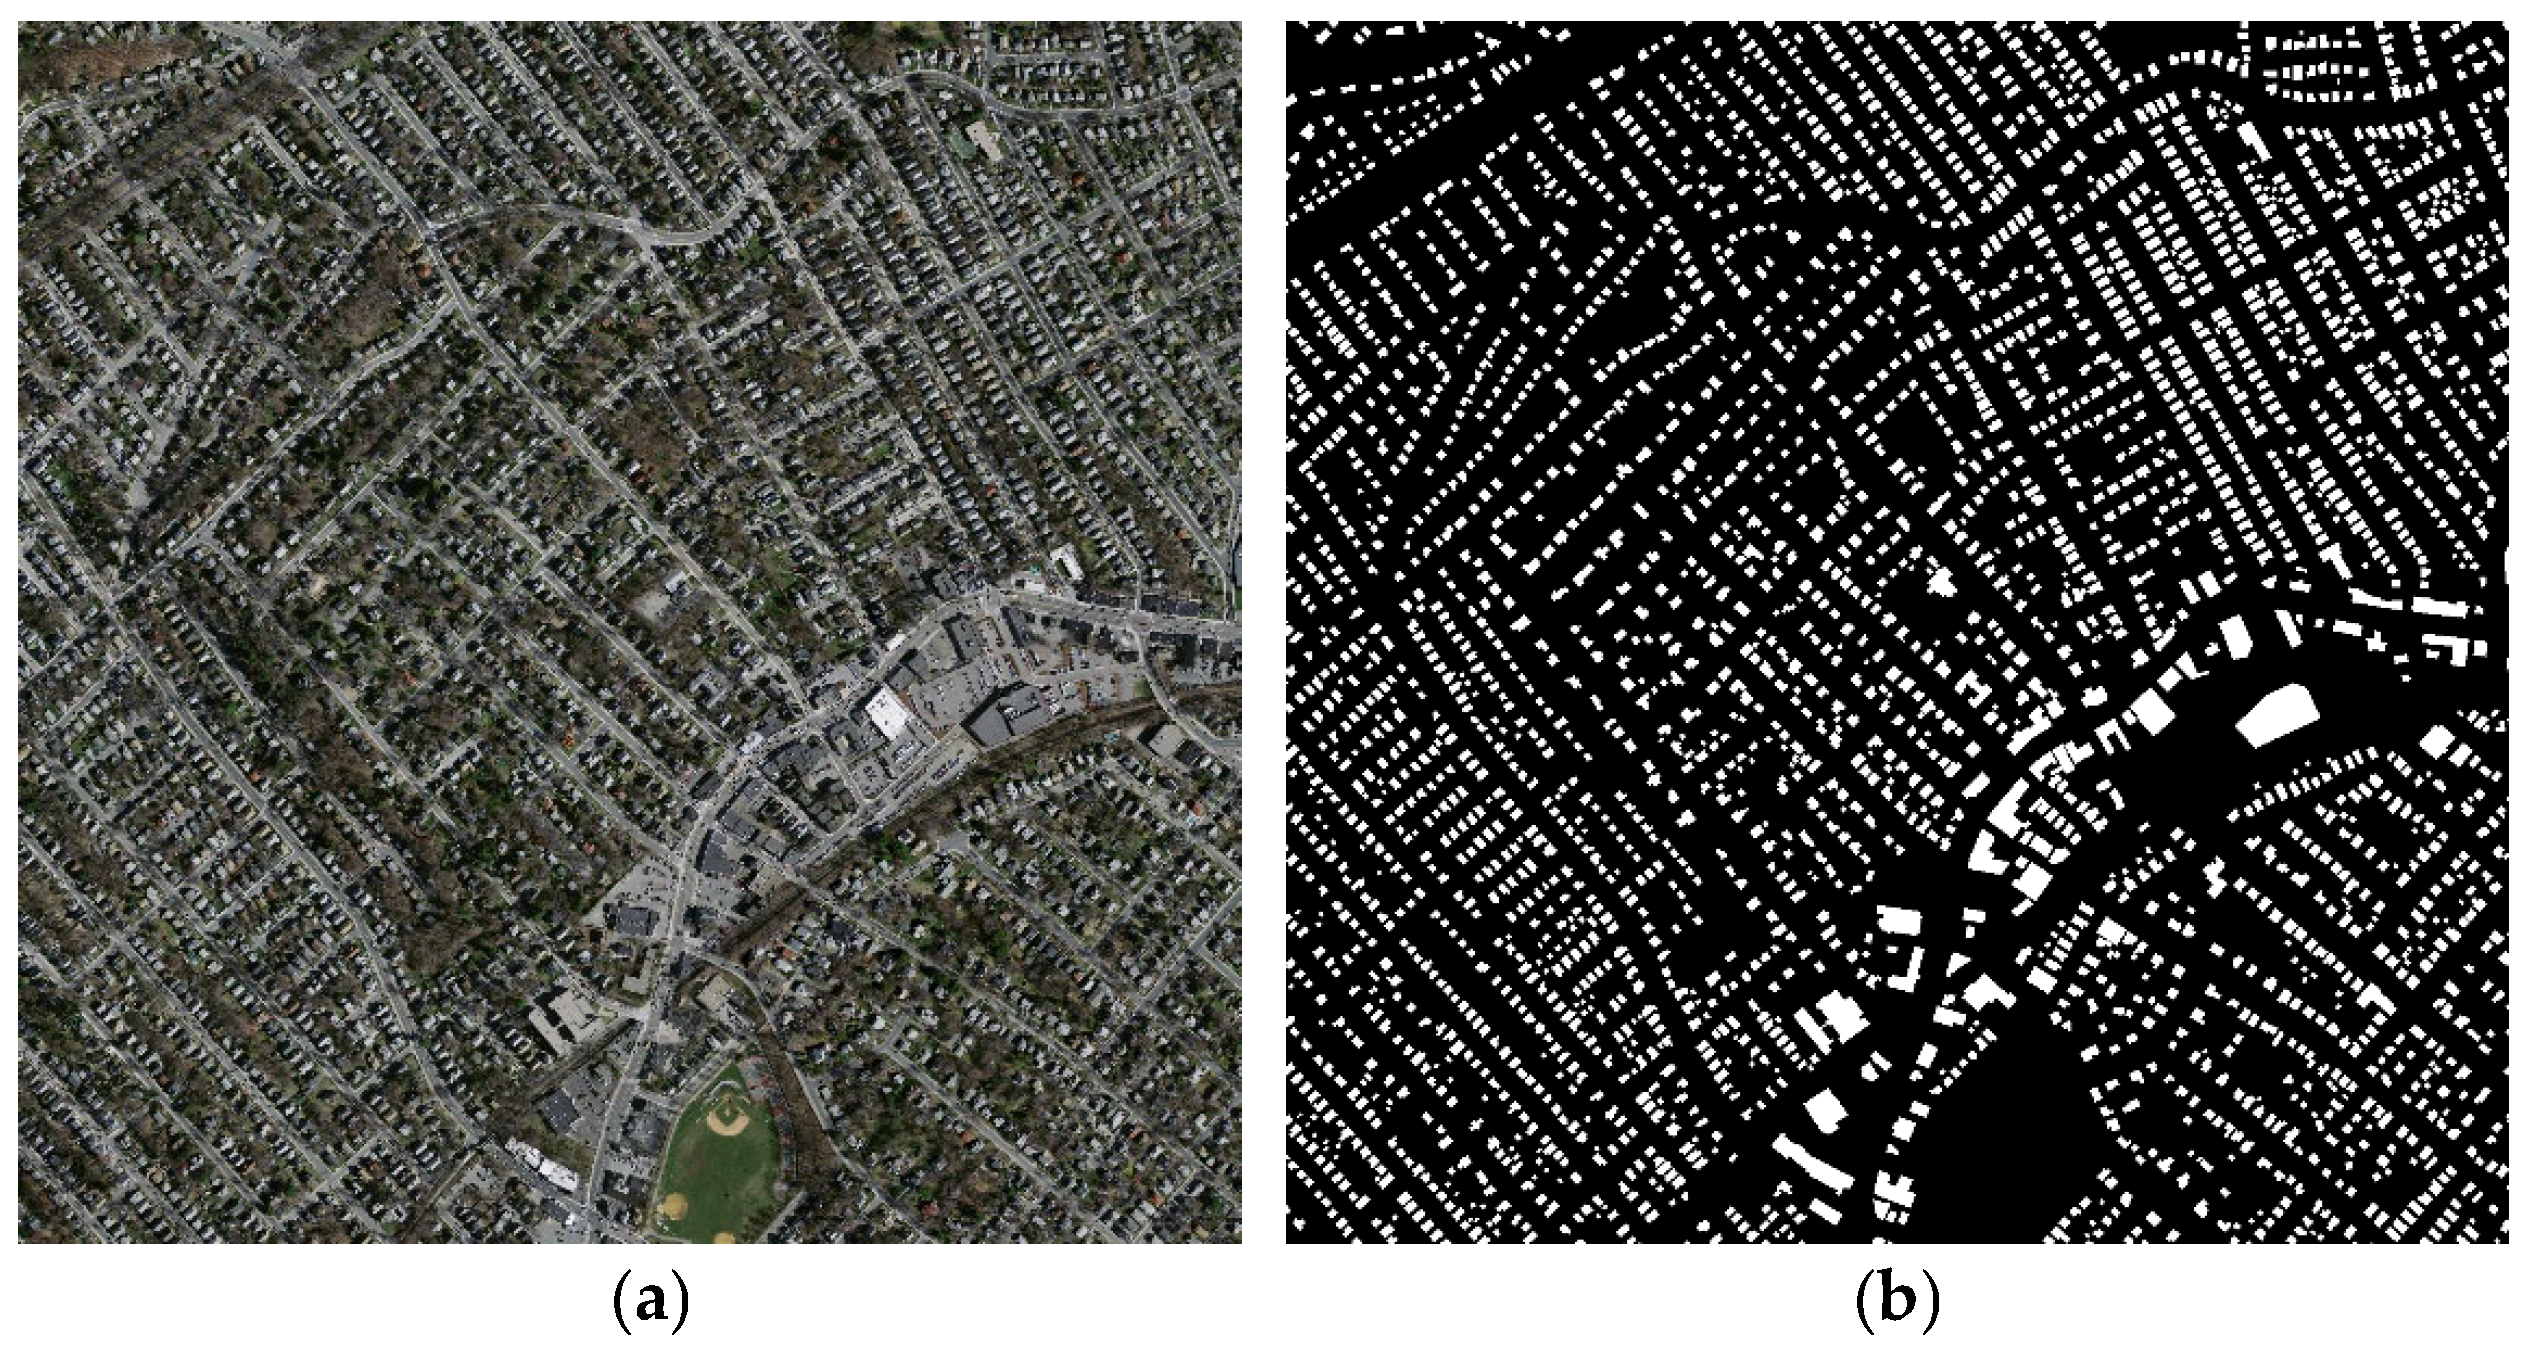
3.1.1. Massachusetts Dataset
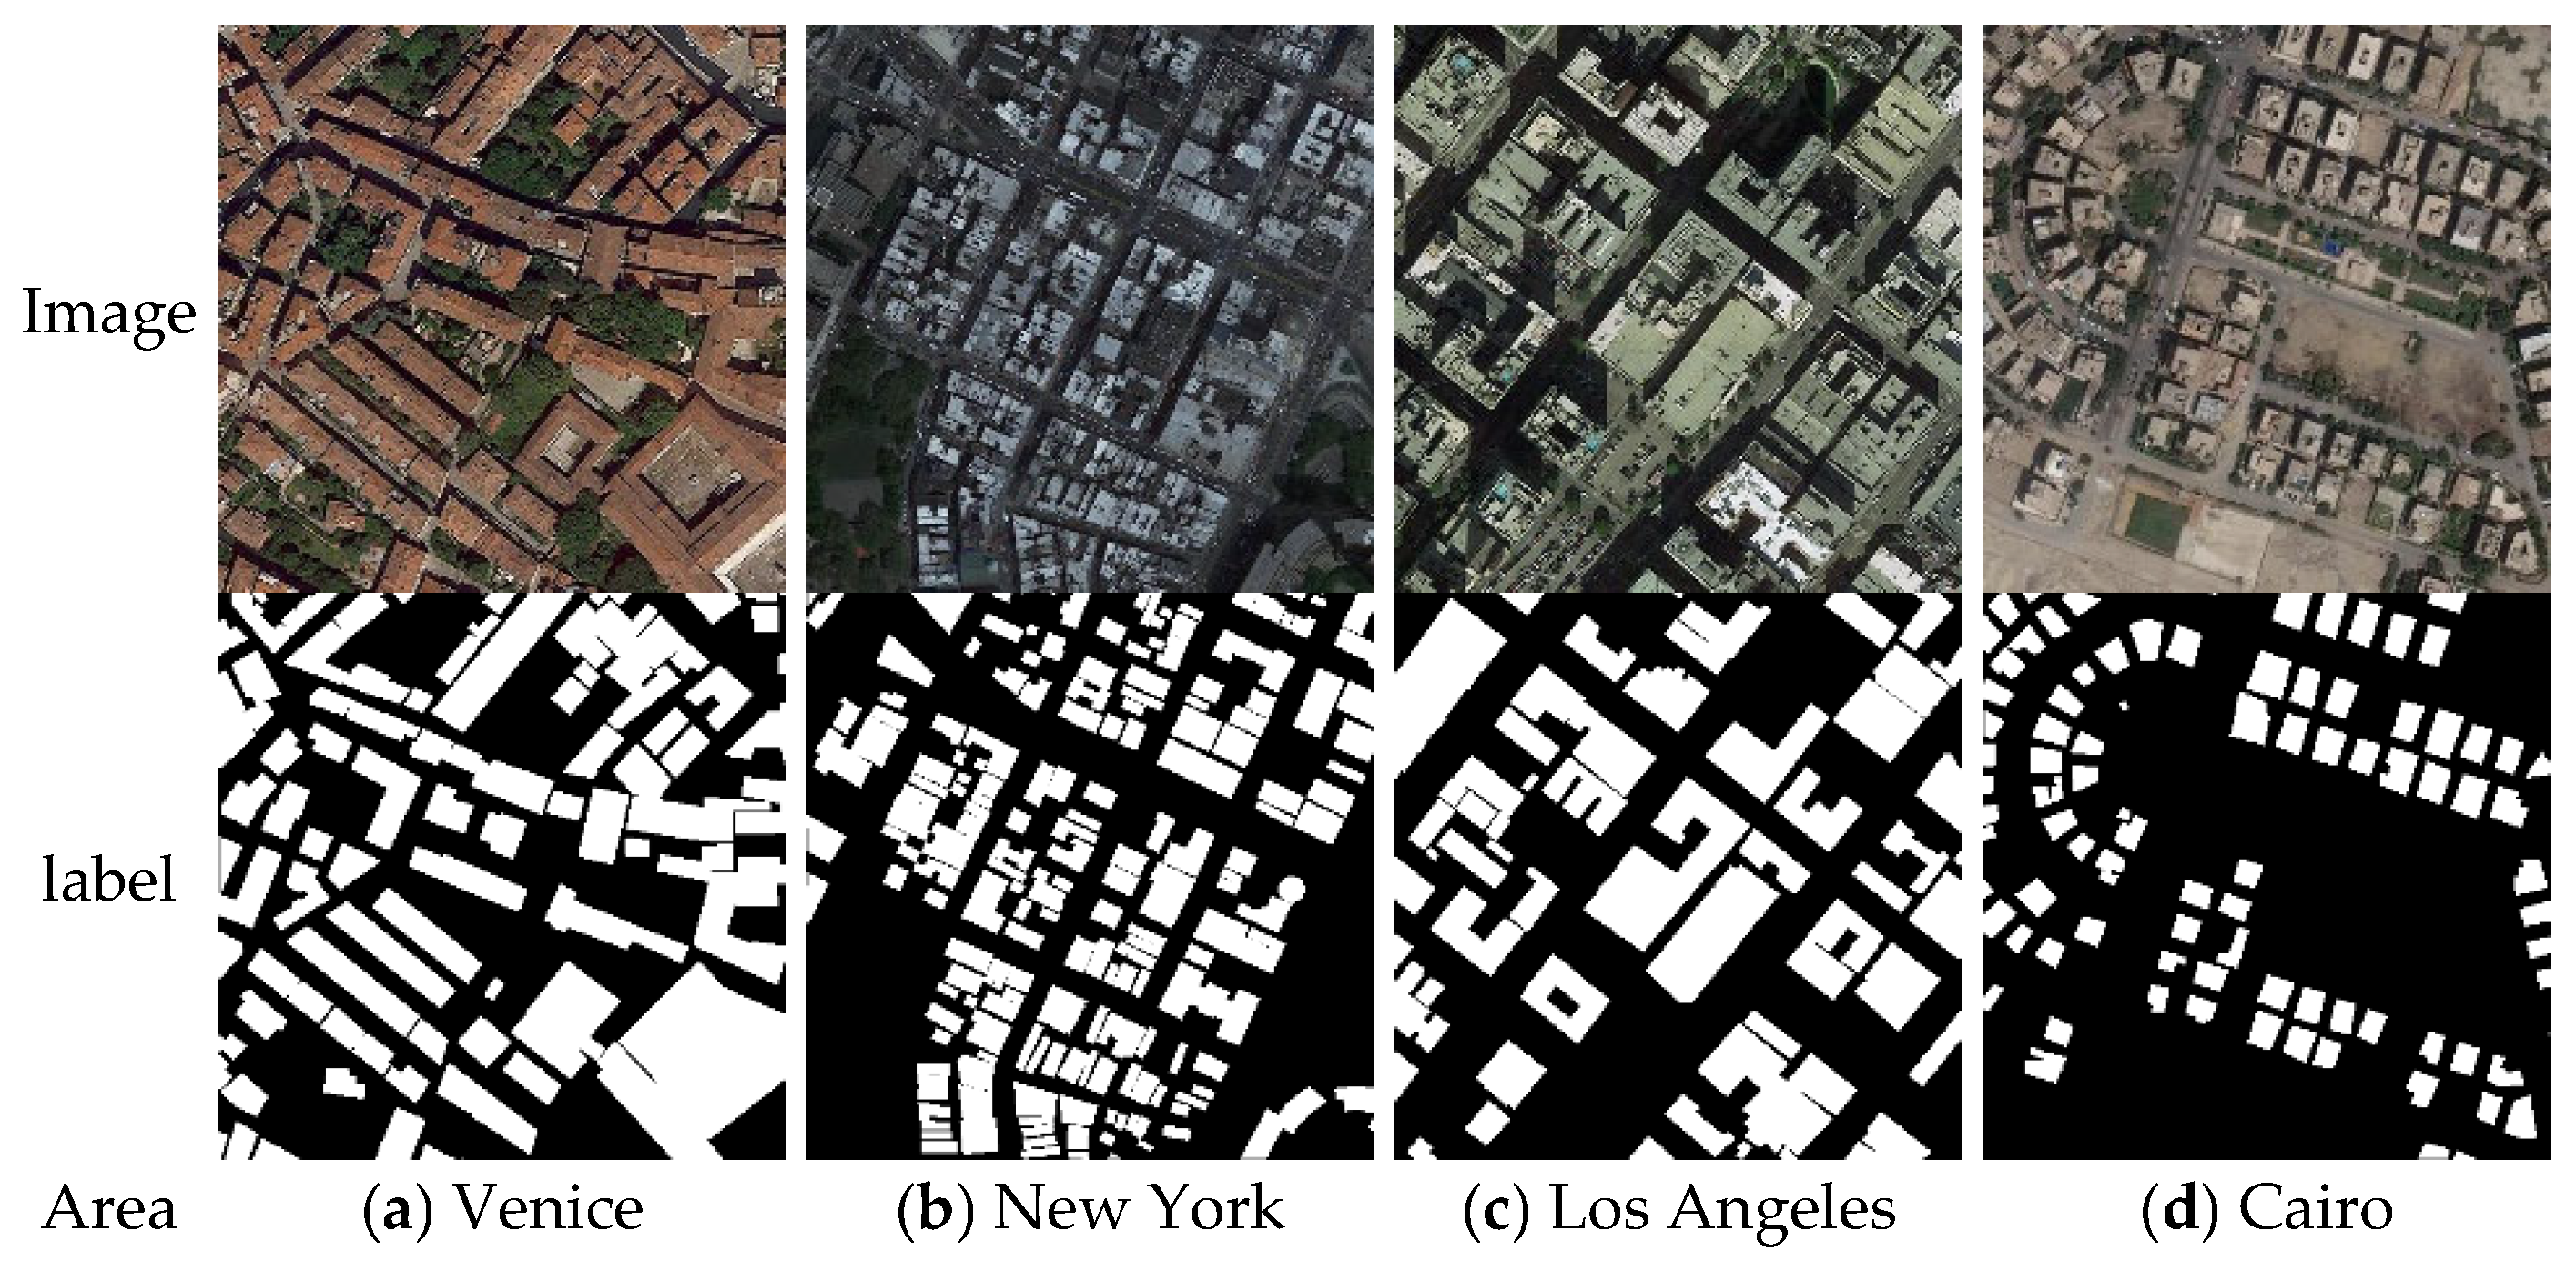
3.1.2. WHU Satellite Dataset I
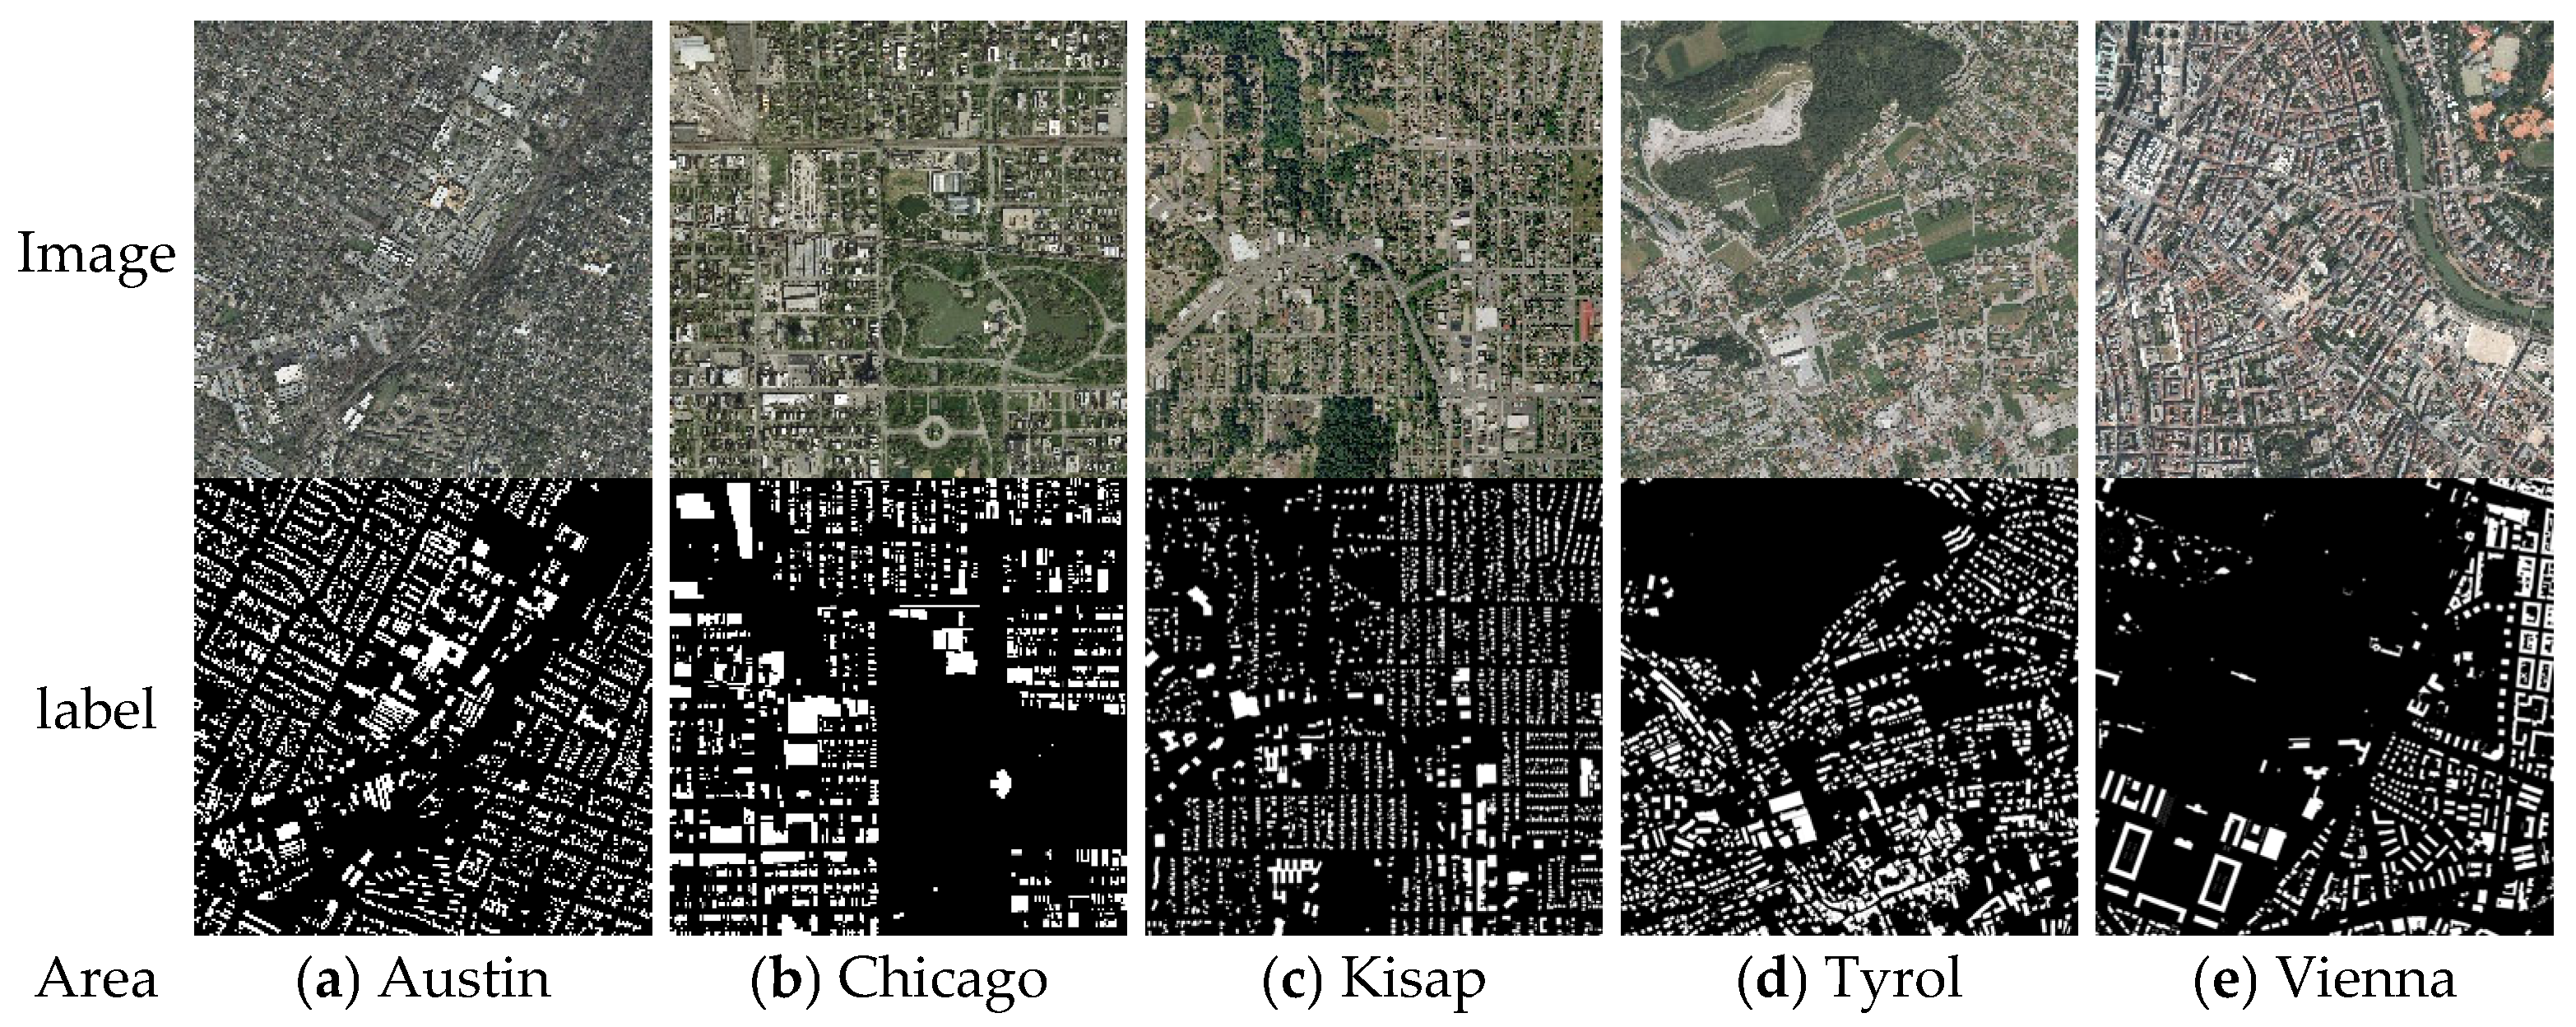
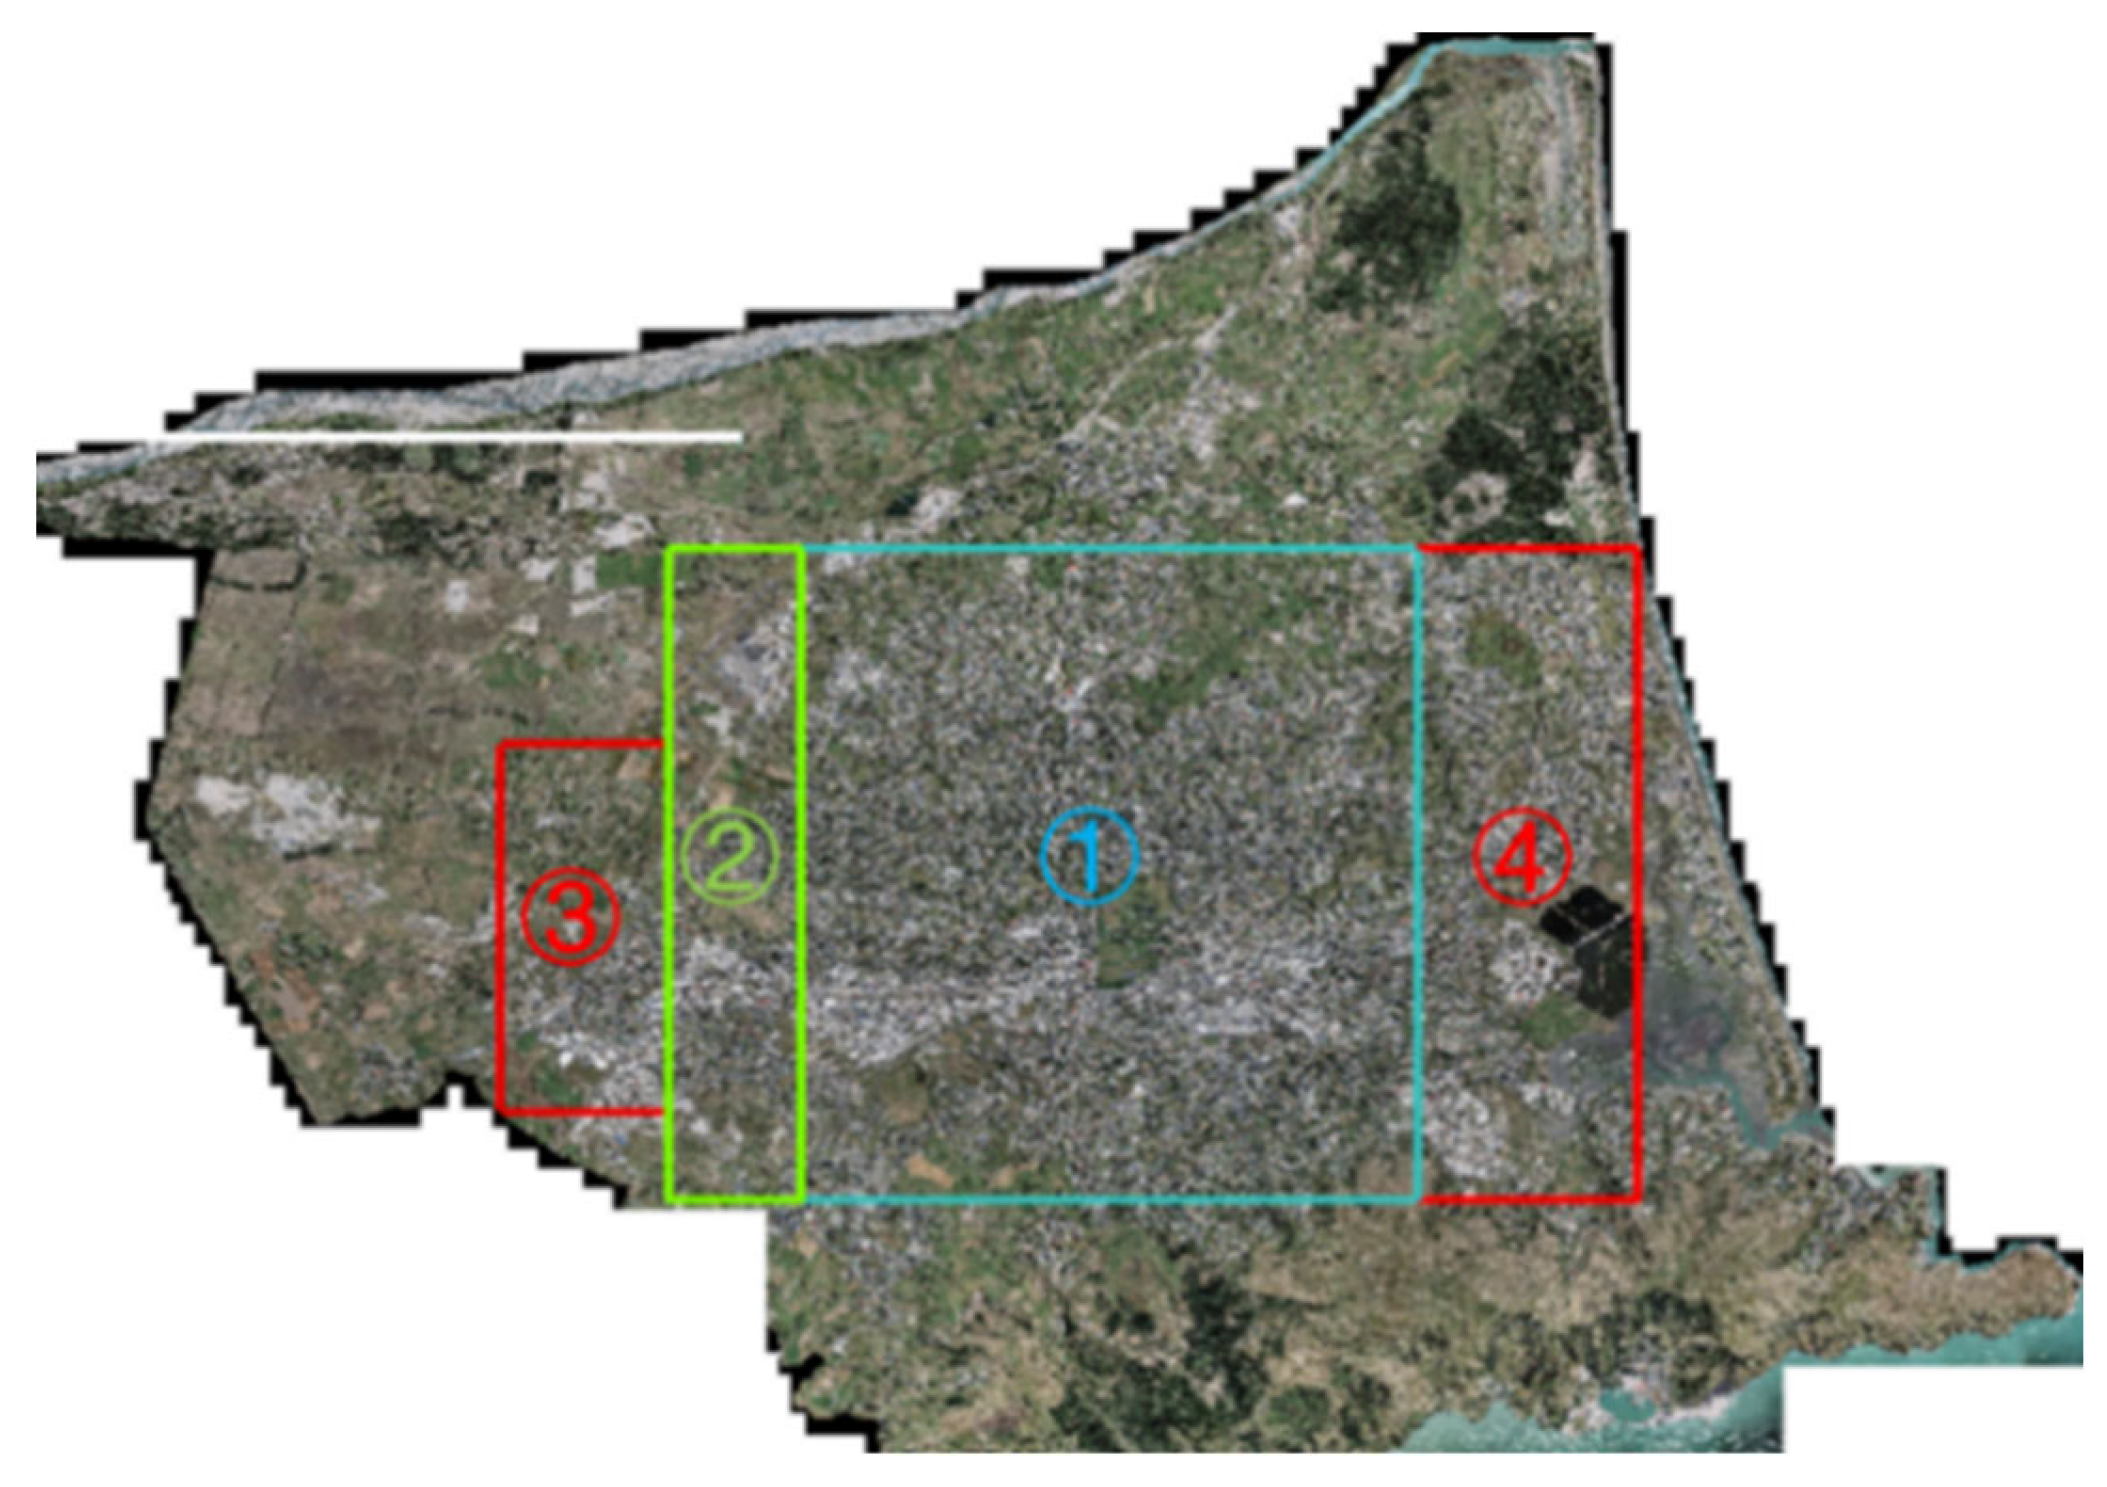
3.1.3. INRIA Dataset
3.2. Experimental Settings
3.3. Comparisons and Analysis
3.3.1. Quantitative Results
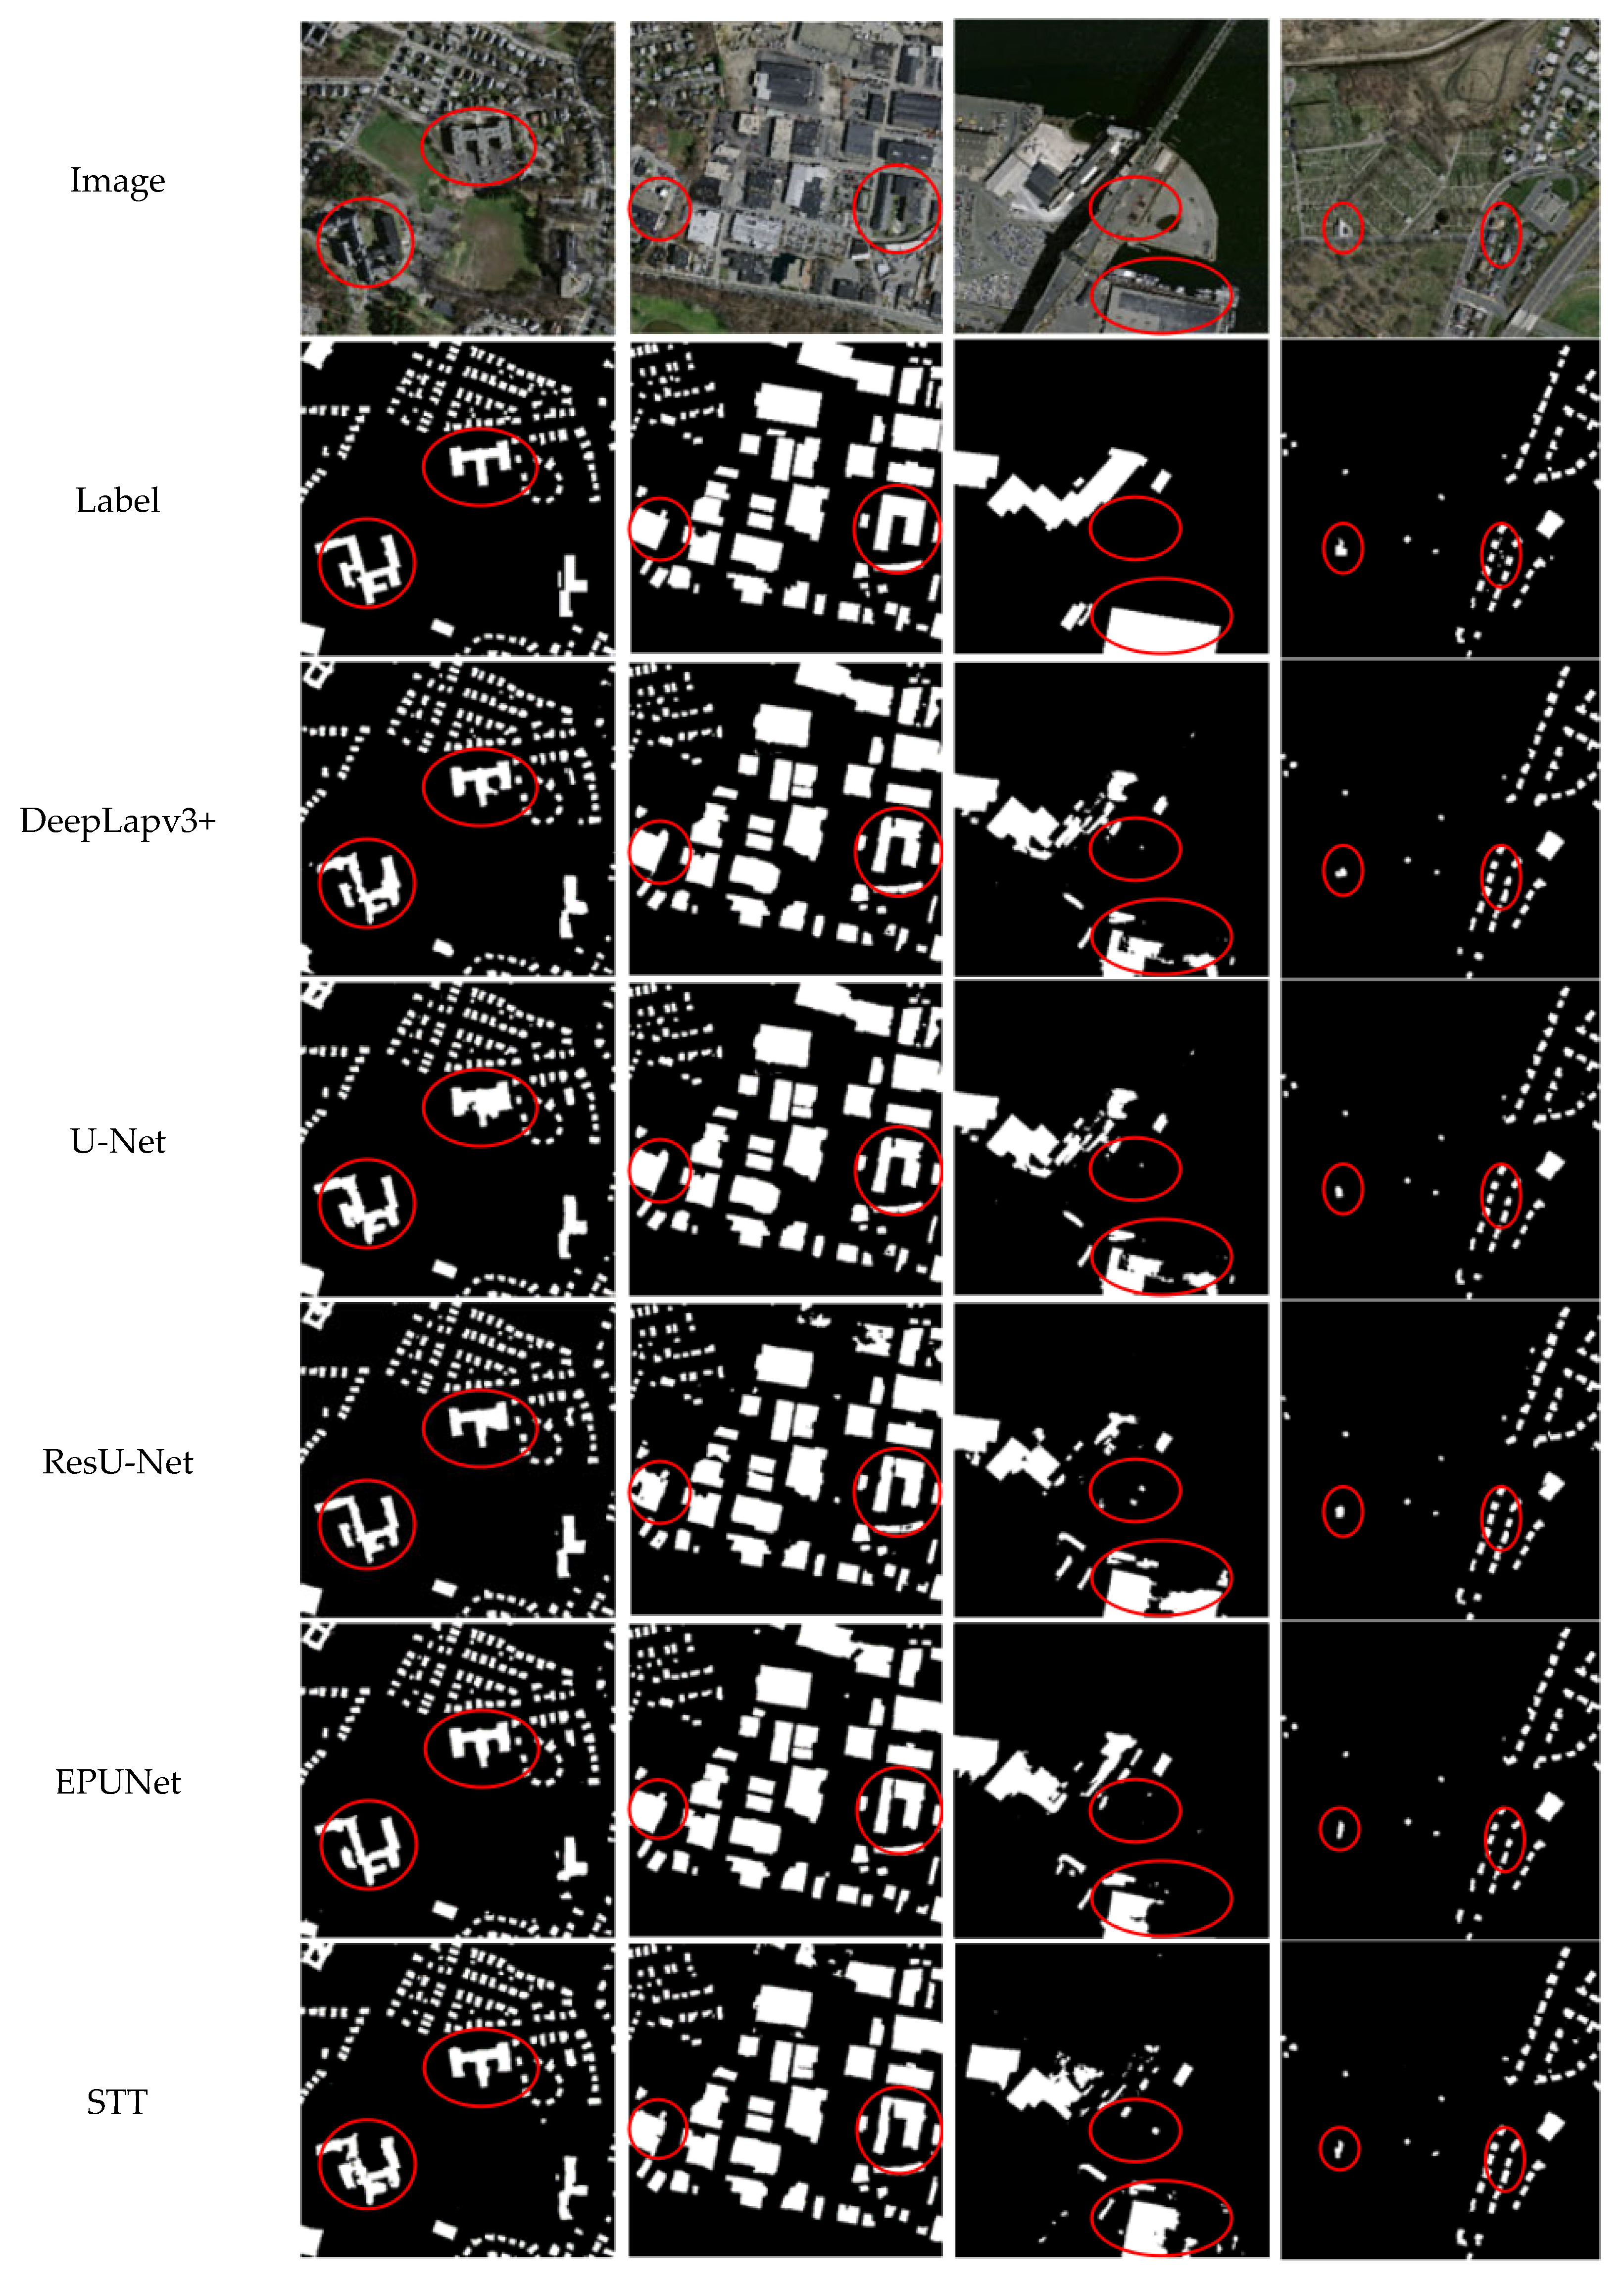
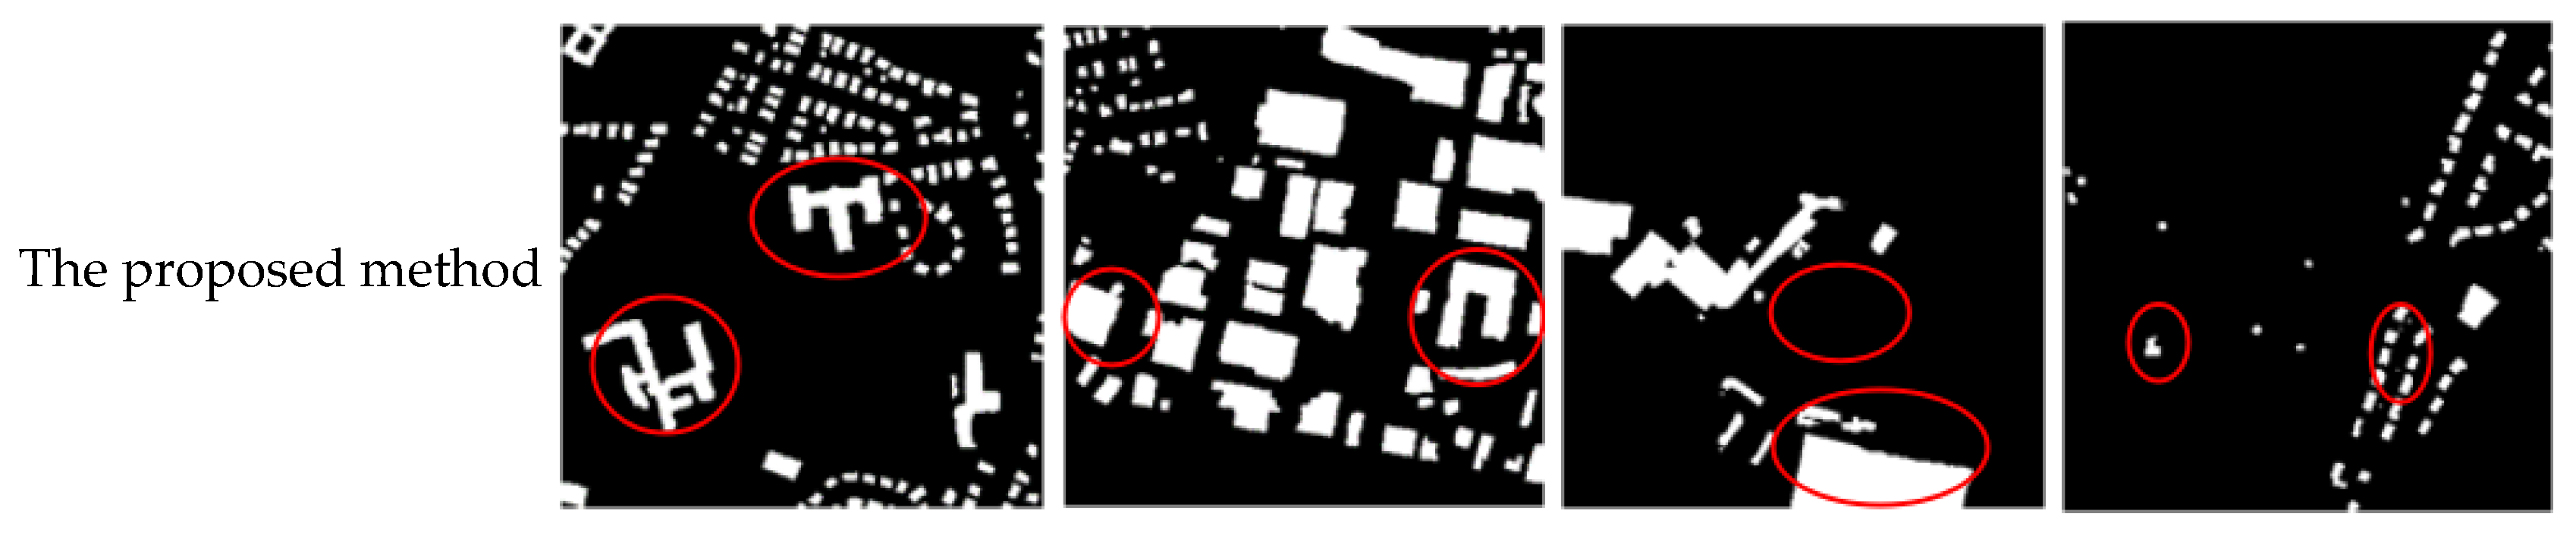
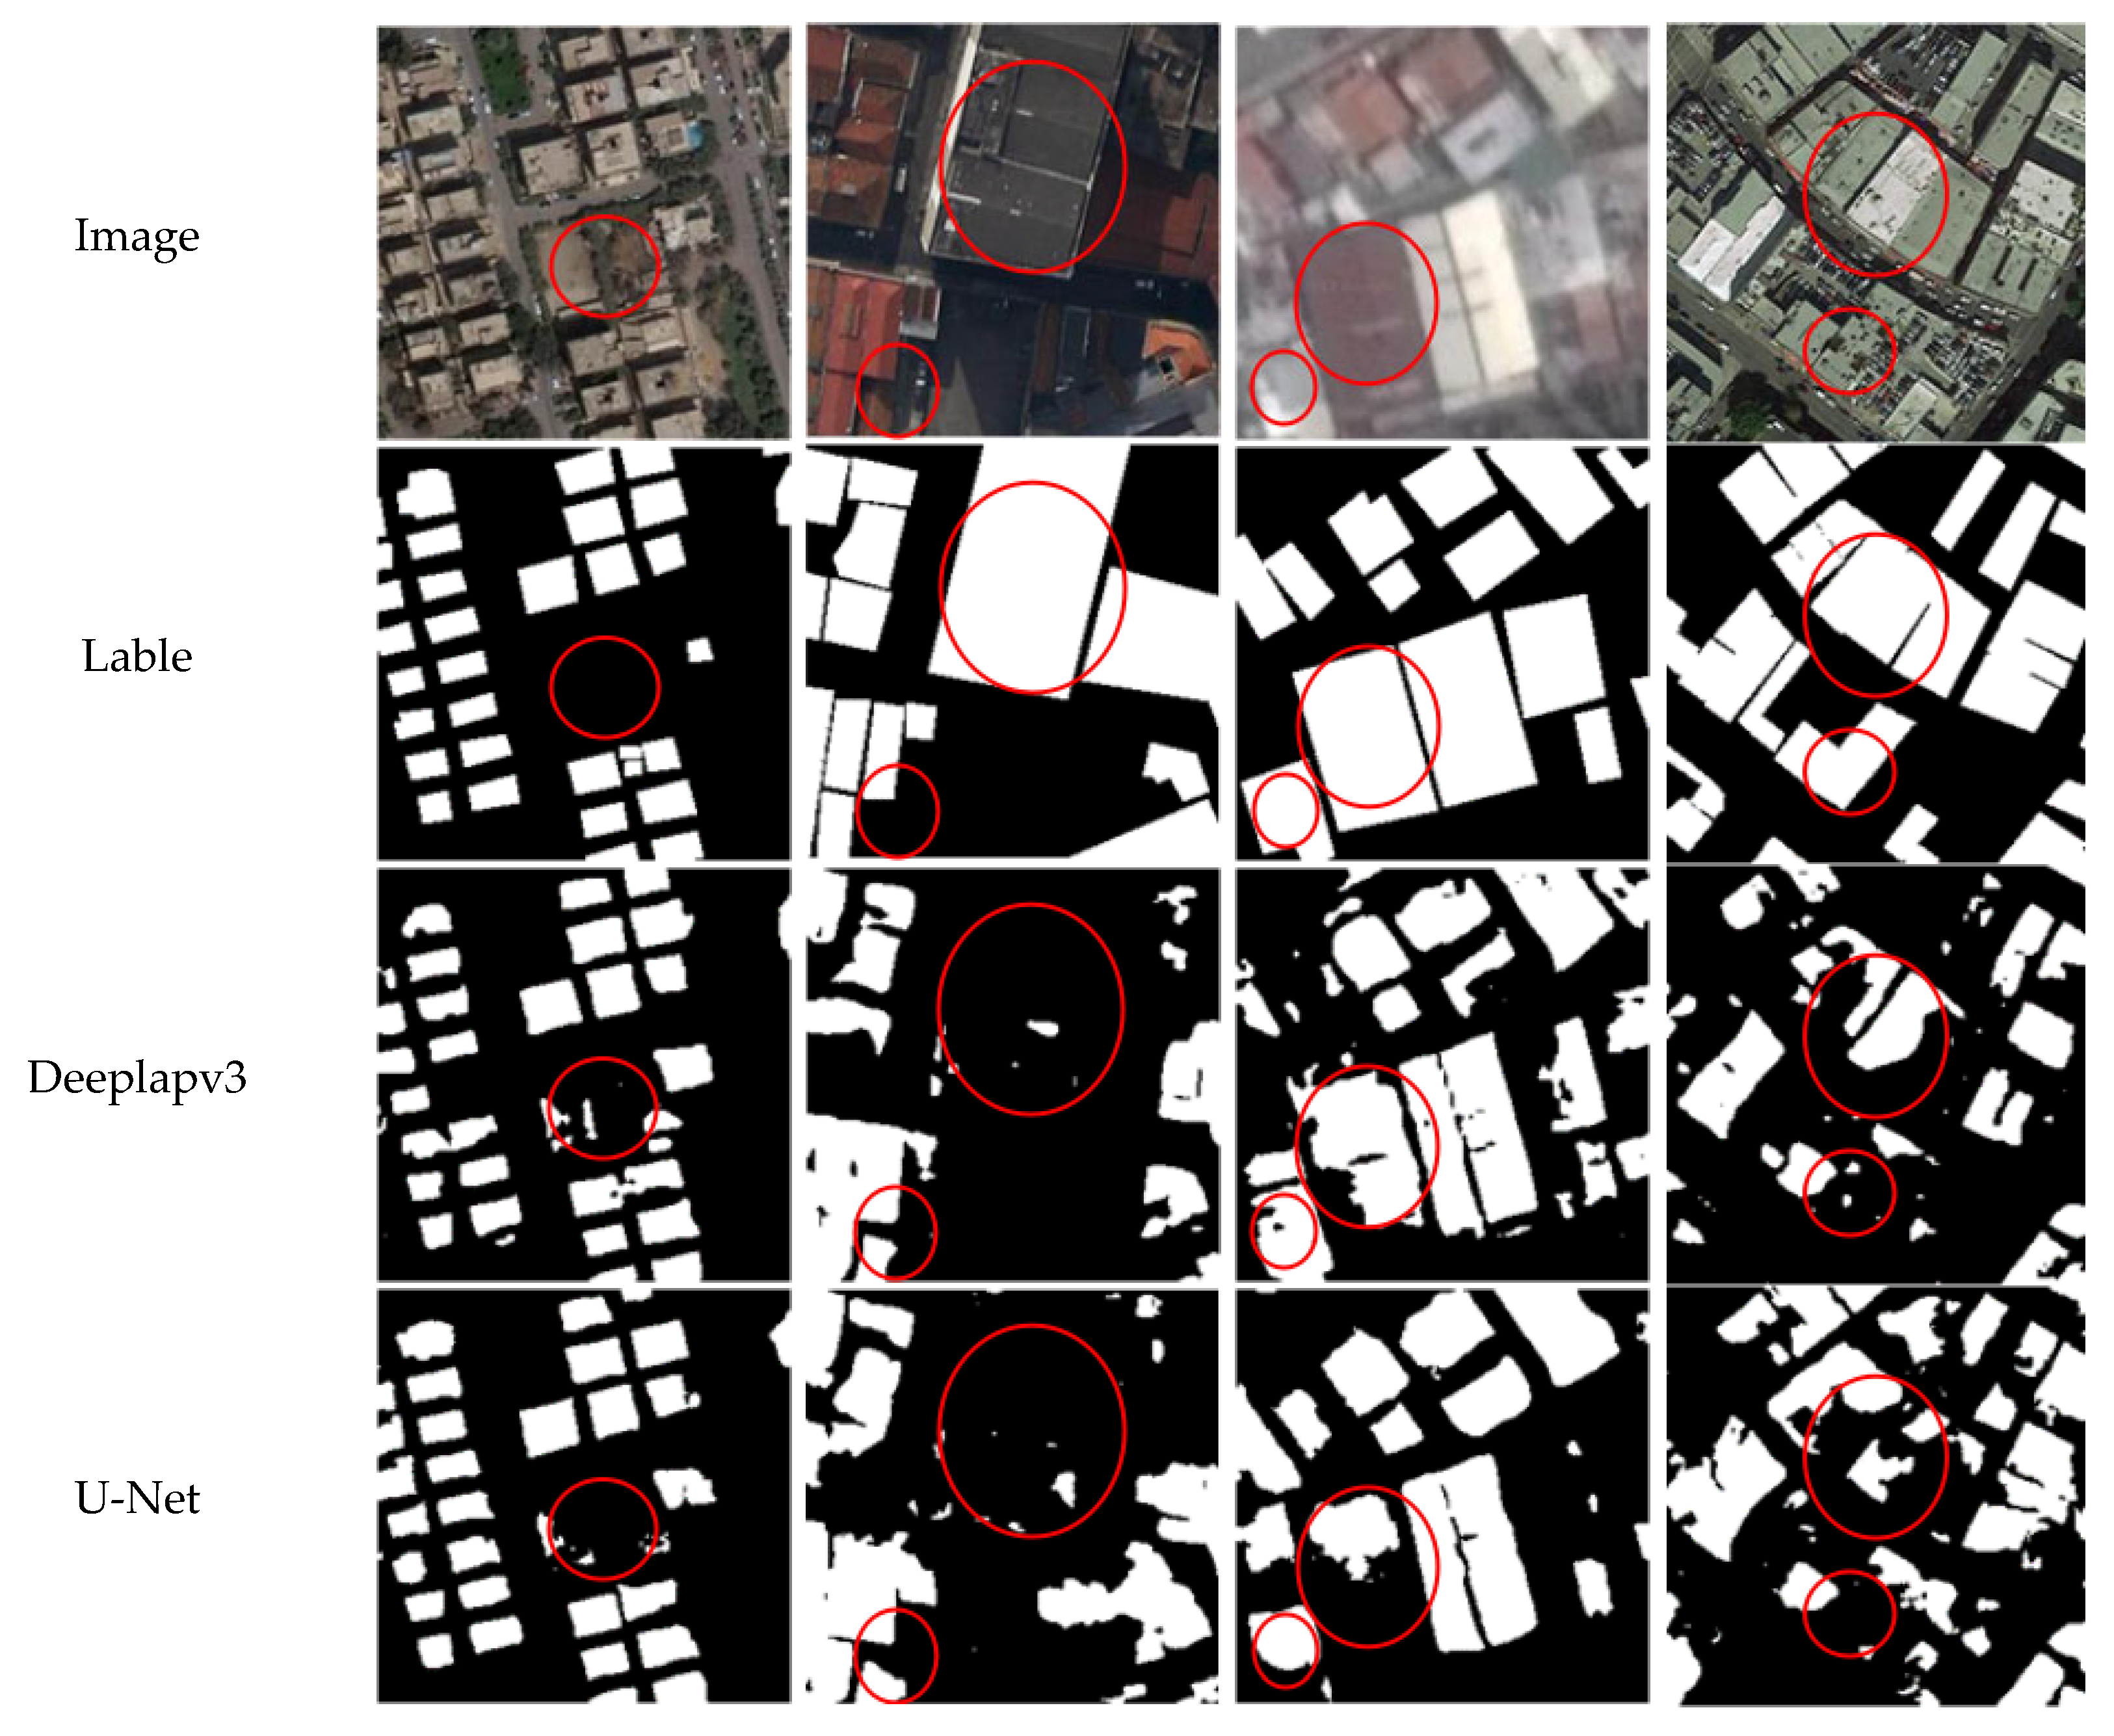
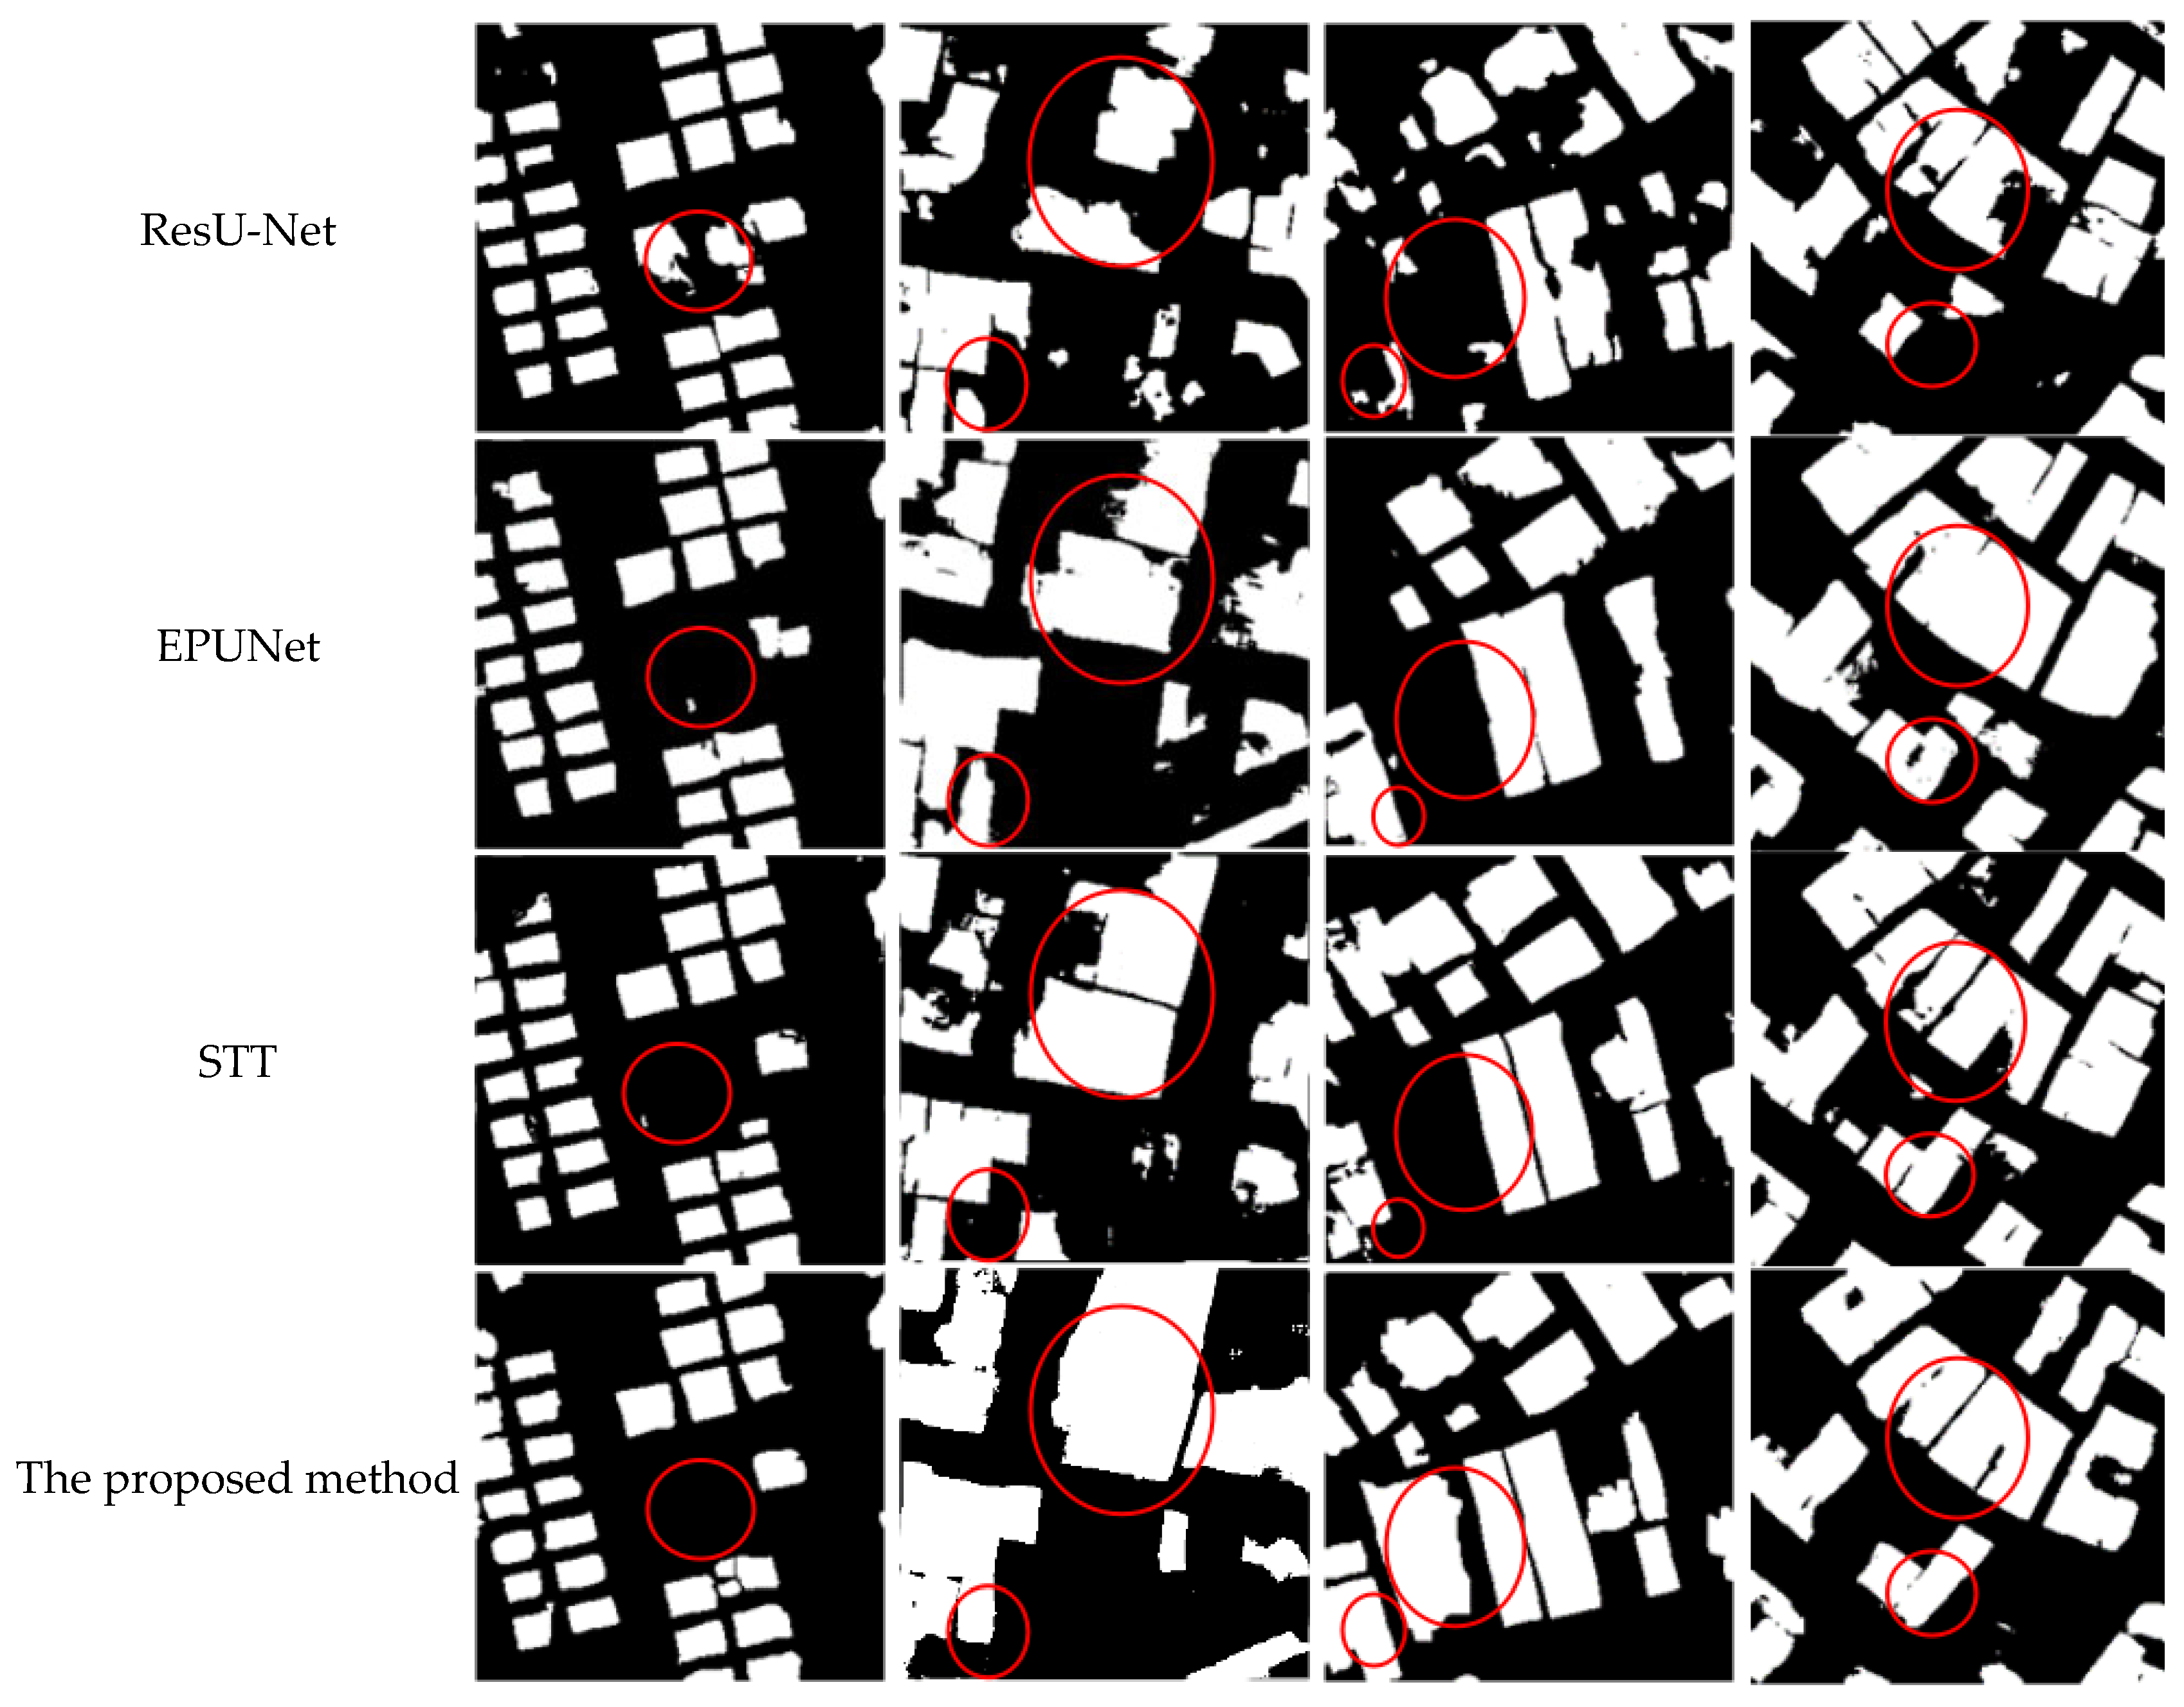
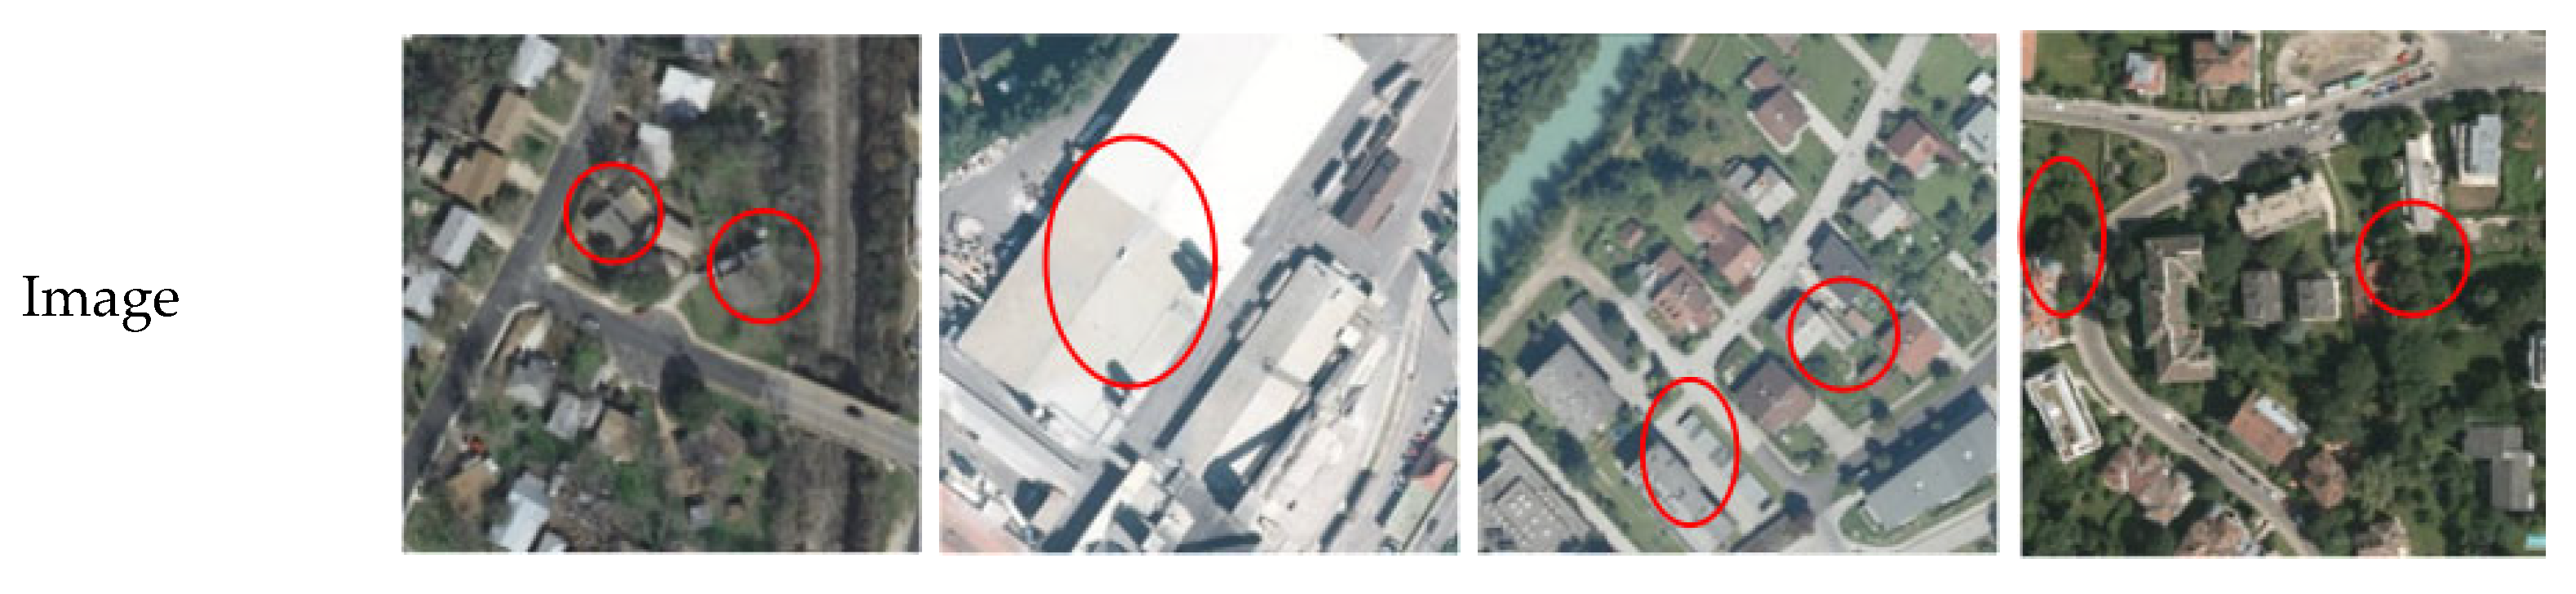
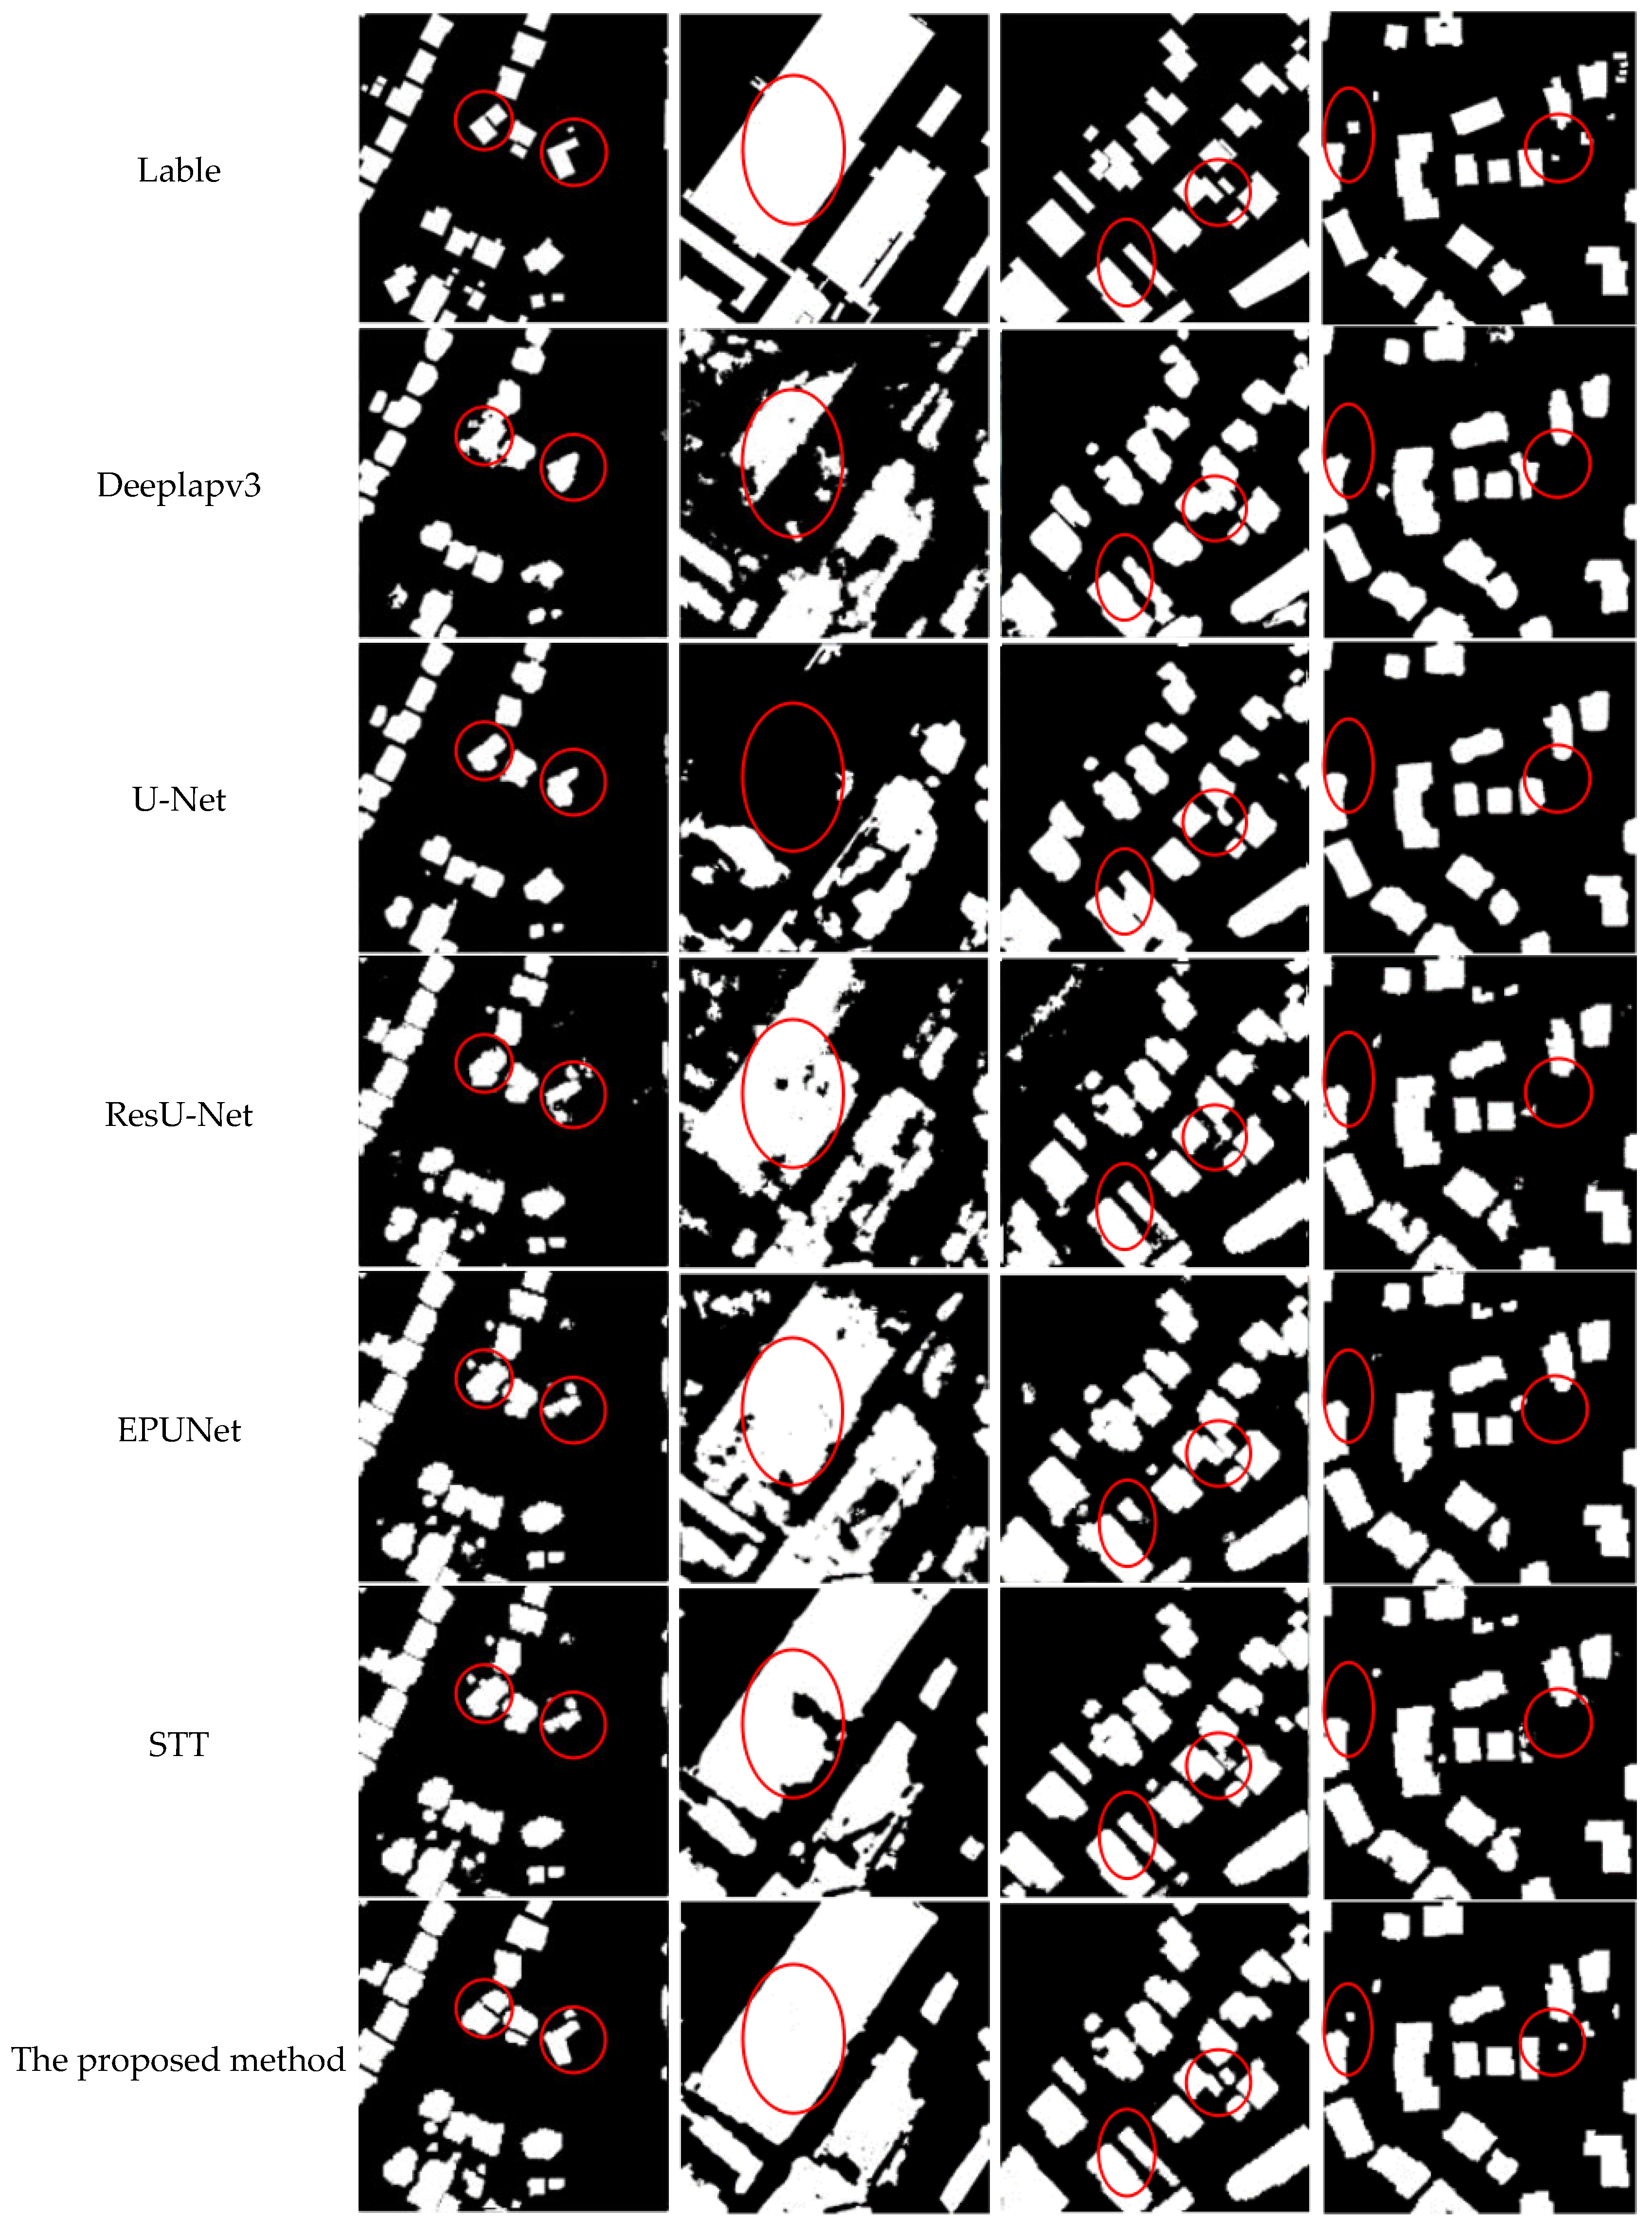
3.3.2. Qualitative Results
3.4. Ablation Study
3.4.1. Dataset Details and Experimental Settings
3.4.2. Quantitative Analysis
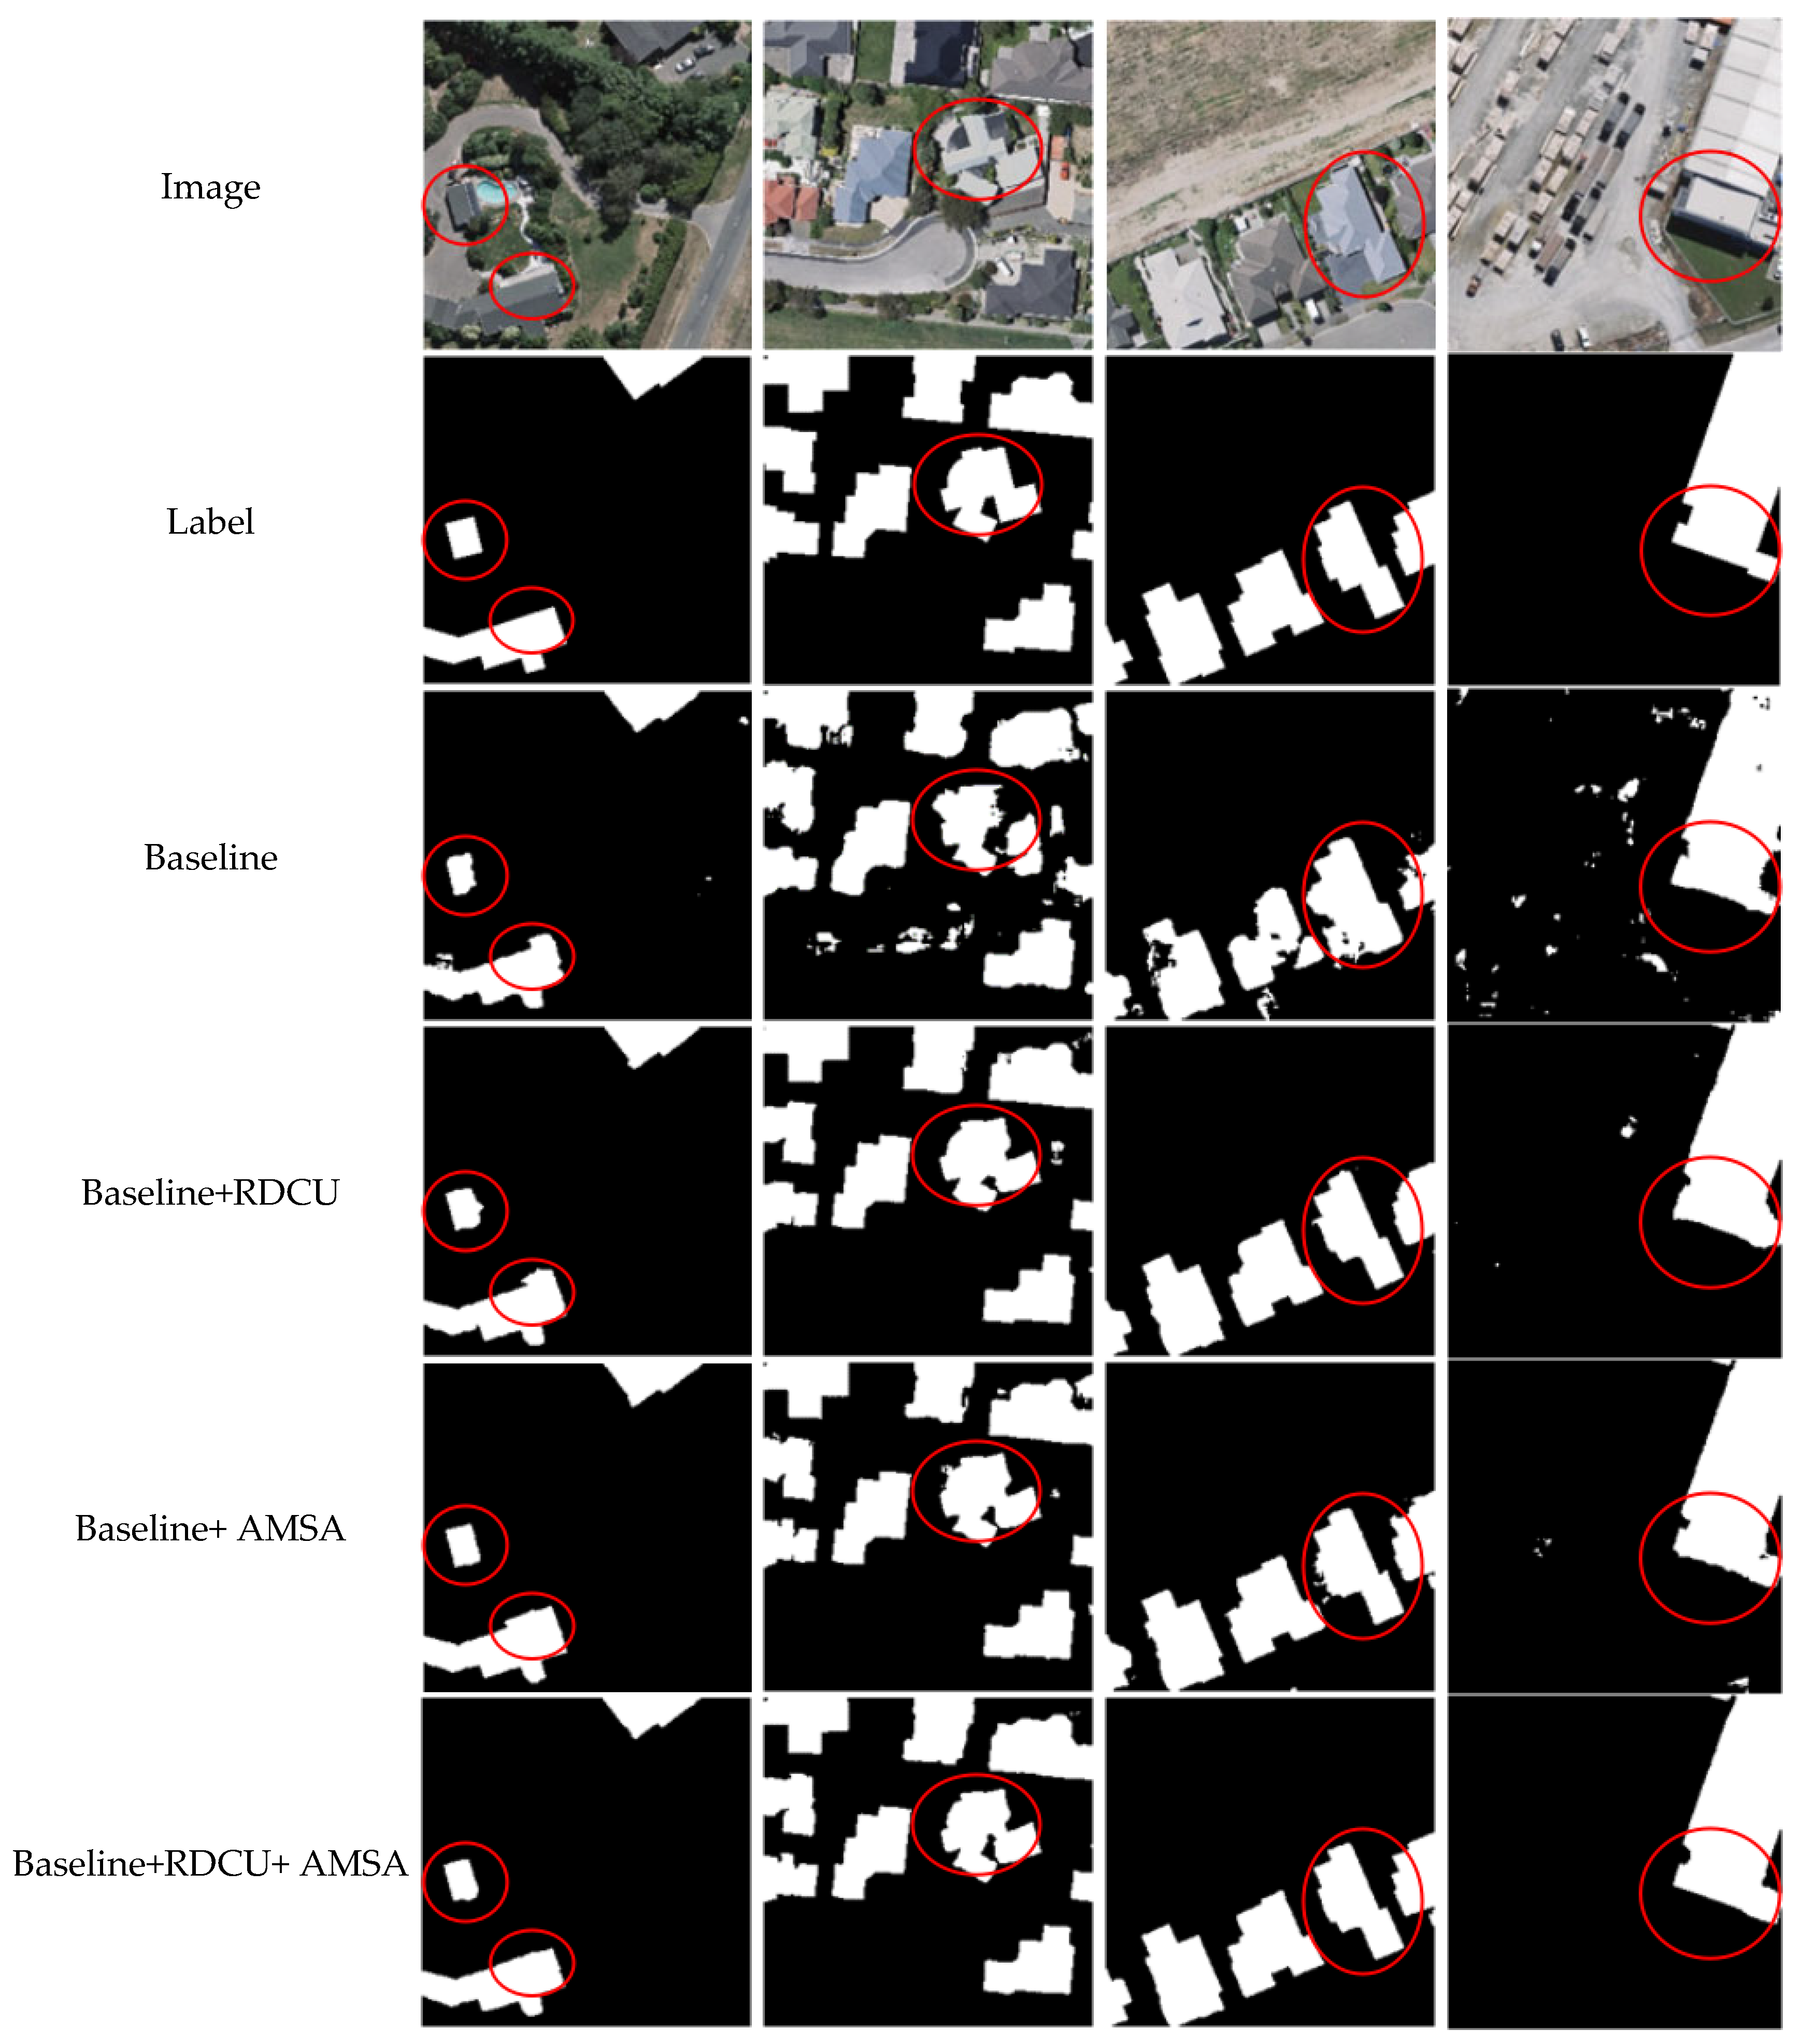
3.4.3. Qualitative Analysis
4. Conclusions
Author Contributions
Funding
Data Availability Statement
Conflicts of Interest
References
- Corbane, C.; Lemoine, G.; Pesaresi, M.; Kemper, T.; Sabo, F.; Ferri, S.; Syrris, V. Enhanced automatic detection of human settlements using Sentinel-1 interferometric coherence. Int. J. Remote Sens. 2018, 39, 842–853. [Google Scholar] [CrossRef]
- Zhou, R.-G.; Yu, H.; Cheng, Y.; Li, F.-X. Quantum image edge extraction based on improved Prewitt operator. Quantum Inf. Process. 2019, 18, 261. [Google Scholar] [CrossRef]
- Kavzoglu, T.; Tonbul, H. A comparative study of segmentation quality for multi-resolution segmentation and watershed transform. In Proceedings of the 2017 8th International Conference on Recent Advances in Space Technologies (RAST), Istanbul, Turkey, 19–22 June 2017; pp. 113–117. [Google Scholar]
- Yu, H.; Zhang, Y.; Cheng, G.; Ge, X. Rural residential building extraction from laser scanning data and aerophotograph based on quadtree segmentation. In Proceedings of the 2011 International Conference on Remote Sensing, Environment and Transportation Engineering, Nanjing, China, 24–26 June 2011; pp. 8476–8479. [Google Scholar]
- Futagami, T.; Hayasaka, N. Automatic extraction of building regions by using color clustering. In Proceedings of the 2019 58th Annual Conference of the Society of Instrument and Control Engineers of Japan (SICE), Hiroshima, Japan, 10–13 September 2019; pp. 415–419. [Google Scholar]
- Jiang, B.; An, X.; Xu, S.; Chen, Z. Intelligent Image Semantic Segmentation: A Review through Deep Learning Techniques for Remote Sensing Image Analysis. J. Indian Soc. Remote Sens. 2022. [Google Scholar] [CrossRef]
- Tejeswari, B.; Sharma, S.K.; Kumar, M.; Gupta, K. Building footprint extraction from space-borne imagery using deep neural networks. Int. Arch. Photogramm. Remote Sens. Spat. Inf. Sci. 2022, XLIII-B2-2022, 641–647. [Google Scholar] [CrossRef]
- Xu, Y.; Wu, L.; Xie, Z.; Chen, Z. Building Extraction in Very High Resolution Remote Sensing Imagery Using Deep Learning and Guided Filters. Remote Sens. 2018, 10, 144. [Google Scholar] [CrossRef]
- Li, W.; Sun, K.; Zhao, H.; Li, W.; Wei, J.; Gao, S. Extracting buildings from high-resolution remote sensing images by deep ConvNets equipped with structural-cue-guided feature alignment. Int. J. Appl. Earth Obs. Geoinf. 2022, 113, 102970. [Google Scholar] [CrossRef]
- Long, J.; Shelhamer, E.; Darrell, T. Fully convolutional networks for semantic segmentation. In Proceedings of the IEEE Conference on Computer Vision and Pattern Recognition 2015, Boston, MA, USA, 7–12 June 2015; pp. 3431–3440. [Google Scholar]
- Sariṫurk, B.; Bayram, B.; Duran, Z.; Seker, D.Z. Feature extraction from satellite images using segnet and fully convolutional networks (FCN). Int. J. Eng. Geosci. 2020, 5, 138–143. [Google Scholar] [CrossRef]
- He, C.; Li, S.; Xiong, D.; Fang, P.; Liao, M. Remote sensing image semantic segmentation based on edge information guidance. Remote Sens. 2020, 12, 1501. [Google Scholar] [CrossRef]
- Maggiori, E.; Tarabalka, Y.; Charpiat, G.; Alliez, P. Convolutional neural networks for large-scale remote-sensing image classification. IEEE Trans. Geosci. Remote Sens. 2016, 55, 645–657. [Google Scholar] [CrossRef]
- Badrinarayanan, V.; Kendall, A.; Cipolla, R. Segnet: A deep convolutional encoder-decoder architecture for image segmentation. IEEE Trans. Pattern Anal. Mach. Intell. 2017, 39, 2481–2495. [Google Scholar] [CrossRef]
- Ronneberger, O.; Fischer, P.; Brox, T. U-net: Convolutional networks for biomedical image segmentation. In Proceedings of the Medical Image Computing and Computer-Assisted Intervention–MICCAI 2015: 18th International Conference, Munich, Germany, 5–9 October 2015; Proceedings, Part III 18. Springer: Berlin/Heidelberg, Germany, 2015; pp. 234–241. [Google Scholar]
- Chen, L.-C.; Papandreou, G.; Kokkinos, I.; Murphy, K.; Yuille, A.L. DeepLab: Semantic Image Segmentation with Deep Convolutional Nets, Atrous Convolution, and Fully Connected CRFs. IEEE Trans. Pattern Anal. Mach. Intell. 2017, 40, 834–848. [Google Scholar] [CrossRef]
- Chen, L.-C.; Papandreou, G.; Schroff, F.; Adam, H. Rethinking atrous convolution for semantic image segmentation. arXiv 2017, arXiv:170605587. [Google Scholar]
- Yurtkulu, S.C.; Şahin, Y.H.; Unal, G. Semantic segmentation with extended DeepLabv3 architecture. In Proceedings of the 2019 27th Signal Processing and Communications Applications Conference (SIU), Sivas, Turkey, 24–26 April 2019; pp. 1–4. [Google Scholar]
- He, K.; Zhang, X.; Ren, S.; Sun, J. Spatial pyramid pooling in deep convolutional networks for visual recognition. IEEE Trans. Pattern Anal. Mach. Intell. 2015, 37, 1904–1916. [Google Scholar] [CrossRef]
- Wang, Z.; Xu, N.; Wang, B.; Liu, Y.; Zhang, S. Urban building extraction from high-resolution remote sensing imagery based on multi-scale recurrent conditional generative adversarial network. GISci. Remote Sens. 2022, 59, 861–884. [Google Scholar] [CrossRef]
- Dixit, M.; Chaurasia, K.; Mishra, V.K. Dilated-ResUnet: A novel deep learning architecture for building extraction from medium resolution multi-spectral satellite imagery. Expert Syst. Appl. 2021, 184, 115530. [Google Scholar] [CrossRef]
- Chen, M.; Wu, J.; Liu, L.; Zhao, W.; Tian, F.; Shen, Q.; Zhao, B.; Du, R. DR-Net: An improved network for building extraction from high resolution remote sensing image. Remote Sens. 2021, 13, 294. [Google Scholar] [CrossRef]
- Huang, G.; Liu, Z.; Van Der Maaten, L.; Weinberger, K.Q. Densely connected convolutional networks. In Proceedings of the IEEE Conference on Computer Vision and Pattern Recognition 2017, Honolulu, HI, USA, 21–26 July 2017; pp. 4700–4708. [Google Scholar]
- He, K.; Zhang, X.; Ren, S.; Sun, J. Deep residual learning for image recognition. In Proceedings of the IEEE Conference on Computer Vision and Pattern Recognition 2016, Las Vegas, NV, USA, 27–30 June 2016; pp. 770–778. [Google Scholar]
- You, D.; Wang, S.; Wang, F.; Zhou, Y.; Wang, Z.; Wang, J.; Xiong, Y. EfficientUNet+: A Building Extraction Method for Emergency Shelters Based on Deep Learning. Remote Sens. 2022, 14, 2207. [Google Scholar] [CrossRef]
- Roy, A.G.; Navab, N.; Wachinger, C. Concurrent spatial and channel ‘squeeze & excitation’in fully convolutional networks. In Proceedings of the Medical Image Computing and Computer Assisted Intervention–MICCAI 2018: 21st International Conference, Granada, Spain, 16–20 September 2018; Proceedings, Part I. Springer: Berlin/Heidelberg, Germany, 2018; pp. 421–429. [Google Scholar]
- Guo, H.; Shi, Q.; Marinoni, A.; Du, B.; Zhang, L. Deep building footprint update network: A semi-supervised method for updating existing building footprint from bi-temporal remote sensing images. Remote Sens. Environ. 2021, 264, 112589. [Google Scholar] [CrossRef]
- Ji, S.; Wei, S.; Lu, M. Fully convolutional networks for multisource building extraction from an open aerial and satellite imagery data set. IEEE Trans. Geosci. Remote Sens. 2018, 57, 574–586. [Google Scholar] [CrossRef]
- Lin, T.-Y.; Dollár, P.; Girshick, R.; He, K.; Hariharan, B.; Belongie, S. Feature pyramid networks for object detection. In Proceedings of the IEEE Conference on Computer Vision and Pattern Recognition 2017, Honolulu, HI, USA, 21–26 July 2017; pp. 2117–2125. [Google Scholar]
- Shi, Y.; Li, Q.; Zhu, X.X. Building segmentation through a gated graph convolutional neural network with deep structured feature embedding. ISPRS J. Photogramm. Remote Sens. 2020, 159, 184–197. [Google Scholar] [CrossRef] [PubMed]
- Kipf, T.N.; Welling, M. Semi-supervised classification with graph convolutional networks. arXiv 2016, arXiv:160902907. [Google Scholar]
- Song, H.O.; Xiang, Y.; Jegelka, S.; Savarese, S. Deep Metric Learning via Lifted Structured Feature Embedding. arXiv 2015, arXiv:1511.06452. [Google Scholar]
- Chen, K.; Zou, Z.; Shi, Z. Building extraction from remote sensing images with sparse token transformers. Remote Sens. 2021, 13, 4441. [Google Scholar] [CrossRef]
- Zhu, Q.; Liao, C.; Hu, H.; Mei, X.; Li, H. MAP-Net: Multiple attending path neural network for building footprint extraction from remote sensed imagery. IEEE Trans. Geosci. Remote Sens. 2020, 59, 6169–6181. [Google Scholar] [CrossRef]
- Zhang, Z.; Liu, Q.; Wang, Y. Road Extraction by Deep Residual U-Net. IEEE Geosci. Remote Sens. Lett. 2018, 15, 749–753. [Google Scholar] [CrossRef]
- Vaswani, A.; Shazeer, N.; Parmar, N.; Uszkoreit, J.; Jones, L.; Gomez, A.N.; Kaiser, L.; Polosukhin, I. Attention Is All You Need. arXiv 2023, arXiv:1706.03762v5. [Google Scholar]
- Mnih, V. Machine Learning for Aerial Image Labeling; University of Toronto (Canada): Toronto, ON, Canada, 2013; ISBN 0-494-96184-8. [Google Scholar]
- Maggiori, E.; Tarabalka, Y.; Charpiat, G.; Alliez, P. Can semantic labeling methods generalize to any city? the inria aerial image labeling benchmark. In Proceedings of the 2017 IEEE International Geoscience and Remote Sensing Symposium (IGARSS), Fort Worth, TX, USA, 23–28 July 2017; pp. 3226–3229. [Google Scholar]


| Name | Configuration | Versions |
|---|---|---|
| OS | Windows 10 | N/A |
| GPU | NVIDIA Quadro RTX | Quadro RTX 4000 |
| VRAM | 8 G | N/A |
| RAM | 64 G | N/A |
| Programming Language | Python | 3.5 |
| Deep Learning Framework | PyTorch | 3.6 |
| LIBS | NumPy, PIL, torch, sklearn, opencv, tqdm, torch, torchvision, tensorboardX | N/A |
| IDE | PyCharm | PyCharm2019 |
| Method | IOU | PA | mPA | Recall |
|---|---|---|---|---|
| DeepLapv3+ | 85.03% | 88.12% | 86.24% | 83.12% |
| U-Net | 84.93% | 87.22% | 85.04% | 85.33% |
| ResU-Net | 86.95% | 89.14% | 88.47% | 86.65% |
| EPUNet | 88.72% | 91.07% | 89.96% | 87.73% |
| STT | 88.95% | 92.01% | 90.32% | 88.49% |
| The proposed method | 89.99% | 93.62% | 91.59% | 89.22% |
| Method | IOU | PA | mPA | Recall |
|---|---|---|---|---|
| DeepLapv3+ | 83.03% | 89.23% | 87.24% | 88.12% |
| U-Net | 81.53% | 89.54% | 87.08% | 87.89% |
| ResU-Net | 83.95% | 90.71% | 88.47% | 89.65% |
| EPUNet | 85.21% | 91.33% | 89.76% | 90.06% |
| STT | 88.95% | 92.01% | 90.32% | 88.49% |
| The proposed method | 86.47% | 92.45% | 91.82% | 91.62% |
| Method | IOU | PA | mPA | Recall |
|---|---|---|---|---|
| DeepLapv3+ | 74.27% | 83.39% | 80.26% | 78.39% |
| U-Net | 73.58% | 83.03% | 79.32% | 77.48% |
| ResU-Net | 77.03% | 85.12% | 81.68% | 80.95% |
| EPUNet | 78.92% | 86.37% | 83.54% | 82.03% |
| STT | 79.31% | 88.32% | 85.19% | 84.35% |
| The proposed method | 80.47% | 90.15% | 86.26% | 85.42% |
| Method | IOU | PA | Recall |
|---|---|---|---|
| Baseline | 87.03% | 89.83% | 85.12% |
| Baseline + RDCU | 89.53% | 91.81% | 86.89% |
| Baseline + AMSA | 89.95% | 92.11% | 87.95% |
| Baseline + RDCU + AMSA | 90.31% | 92.45% | 88.42% |
Disclaimer/Publisher’s Note: The statements, opinions and data contained in all publications are solely those of the individual author(s) and contributor(s) and not of MDPI and/or the editor(s). MDPI and/or the editor(s) disclaim responsibility for any injury to people or property resulting from any ideas, methods, instructions or products referred to in the content. |
© 2023 by the authors. Licensee MDPI, Basel, Switzerland. This article is an open access article distributed under the terms and conditions of the Creative Commons Attribution (CC BY) license (https://creativecommons.org/licenses/by/4.0/).
Share and Cite
Yu, W.; Liu, B.; Liu, H.; Gou, G. Recurrent Residual Deformable Conv Unit and Multi-Head with Channel Self-Attention Based on U-Net for Building Extraction from Remote Sensing Images. Remote Sens. 2023, 15, 5048. https://doi.org/10.3390/rs15205048
Yu W, Liu B, Liu H, Gou G. Recurrent Residual Deformable Conv Unit and Multi-Head with Channel Self-Attention Based on U-Net for Building Extraction from Remote Sensing Images. Remote Sensing. 2023; 15(20):5048. https://doi.org/10.3390/rs15205048
Chicago/Turabian StyleYu, Wenling, Bo Liu, Hua Liu, and Guohua Gou. 2023. "Recurrent Residual Deformable Conv Unit and Multi-Head with Channel Self-Attention Based on U-Net for Building Extraction from Remote Sensing Images" Remote Sensing 15, no. 20: 5048. https://doi.org/10.3390/rs15205048