Article

Scatterer-Level Time-Frequency-Frequency Rate Representation for Micro-Motion Identification

1
College of Electronic Science and Technology, National University of Defense Technology, Changsha 410073, China
2
College of Computer Science and Technology, National University of Defense Technology, Changsha 410073, China
*
Author to whom correspondence should be addressed.
Remote Sens. 2023, 15(20), 4917; https://doi.org/10.3390/rs15204917
Submission received: 19 August 2023 / Revised: 6 October 2023 / Accepted: 9 October 2023 / Published: 11 October 2023

Abstract

:
Radar micro-motion signatures help to judge the target’s motion state and threat level, which plays a vital role in space situational awareness. Most of the existing micro-motion feature extraction methods derived from time-frequency (TF) representation cannot simultaneously satisfy the requirements of high resolution and multiple component representation, which has limitations on processing intersected multi-component micro-motion signals. Meanwhile, as the micro-motion features extracted from the TF spectrograms only focus on the global characteristics of the targets and ignore the physical properties of micro-motion components, it leads to poor performance in micro-motion discrimination. To address these challenges, we empirically observed a decrease in the probability of intersection between the components within the time-frequency-frequency rate (TFFR) space, where components appeared as separated and non-intersecting spatial trajectories. This observation facilitates the extraction and association of multiple components. Given the differences in modulation laws among various micro-motions in the TFFR space, we introduced a novel micro-motion identification method based on scatterer-level TFFR representation. Our experimental evaluations of different targets and micro-motion types demonstrate the efficacy and robustness of this proposed method. This method not only underscores the separability of signal components but also expands the scope of micro-motion discrimination within the TFFR domain.

Graphical Abstract

1. Introduction

In addition to the bulk motion, the target or its local structures are vibrating or rotating, known as micro-motion. The radar target undergoing micro-motion dynamics introduces a time-varying frequency modulation on the received echoes, called the micro-Doppler effect [1]. The micro-Doppler signatures reflect the target’s unique dynamic and structural characteristics and have received extensive attention in target detection and identification [2].
Most existing micro-motion feature extraction methods depend on micro-Doppler models. Chen et al. [1] first developed the micro-Doppler modulation model of four micro-motions. The simulated point scatterer model is used to derive and validate the corresponding mathematical formulas of the modulations. In [3], a micro-Doppler model based on the micro-motion matrix was built for ballistic targets with complex micro-motions. Due to the limitations of the specified target shapes above, a micro-Doppler model built on inertial parameters and attitude kinematics was proposed in [4], which was close to real scenarios. He et al. [5] further established a micro-Doppler model combined with inertial parameters and a target radar cross section (RCS), which has the potential to reflect the target’s inherent relationships between physical properties and micro-motion states. In addition, micro-Doppler modulations combining radar backscattering have been analyzed for non-rigid body target motion (e.g., human motion) as well [6,7].
Due to the scattering properties of radar targets, echoes of micro-motion targets, which contain multiple crossed components (i.e., scattering centers), are multi-component non-stationary signals. Time-frequency (TF) transforms have been widely used for micro-motion signature analysis, which can provide a joint TF representation. Short-time Fourier transform (STFT) and Wigner–Ville distribution (WVD) are typical TF analysis methods. The former is a linear transform without cross-terms but has a poor time and frequency resolution, according to the Heisenberg inaccuracy principle [8]. The latter can achieve a high TF concentration but suffers from the cross-terms for multi-component signals due to the bilinear transform. Thus, some variants of WVD have been developed to suppress cross-term interference [9,10]. It should be pointed out that the micro-Doppler rate (i.e., frequency rate) is also considered an essential characterization for analyzing micro-motion signals. Accordingly, time-frequency rate (TFR) representation has been proposed to capture micro-motion signatures [11,12]. A high-resolution TFR representation was presented by introducing a frequency rate window to suppress the cross-terms of multi-component signals [13]. Moreover, aiming at the interference of overlapped multiple components on the two-dimensional (i.e., TF and TFR) plane, the time-frequency-frequency rate (TFFR) representation was further developed to reduce the probability of intersection for signal components in the TFFR space, which can simultaneously provide IF and IFR information [14]. To achieve a highly concentrated TFFR representation, frequency-chirp rate reassignment and three-dimensional extracting transform were introduced in [15,16], respectively.
After years of development, numerous micro-motion identification methods based on micro-Doppler features have been proposed [2]. Lei et al. [17] presented a micro-dynamic target classification method. According to the time-varying characteristics of the micro-Doppler, three typical micro-motion classes were identified by computing invariant moments from the segmented TF representation. Similarly, a three-dimensional feature vector obtained from the micro-Doppler spectrogram (MDS) discriminates ground-moving targets [18]. Further, feature vectors extracted from a cadence velocity diagram (CVD) and high-resolution range profile (HRRP) frame in combination with micro-Doppler modulations can also achieve a satisfactory performance for ballistic target classification [19,20]. Compared to the manual-based micro-Doppler feature extraction above, deep convolutional neural networks (DCNN) can automatically capture the micro-Doppler signatures from constructed training sets [21]. Wang et al. [22] presented a deep learning-based model combined with denoising CNN and MDS datasets for inertia parameter identification. To further improve the stability and robustness of micro-motion discrimination, some fusion recognition methods, which extract both narrowband and wideband features through DCNN, have been proposed, such as decision-level fusion [23] and feature-level fusion methods [24].
It is seen that most of the above methods perform micro-motion identification by directly extracting micro-Doppler features from the TF spectrograms. As the micro-Doppler signatures are mainly concentrated in a limited area of the TF distribution and the rest is only involved with noise and interference, it unavoidably leads to redundant features and computational burdens. On the other side, even though the DCNN can automatically extract micro-Doppler signatures without utilizing domain knowledge, it lacks the physical interpretability for the obtained features, which makes it challenging to apply to various cases. Therefore, aiming at the limitations of only focusing on the overall characteristics of the targets above (e.g., two-dimensional images), it is essential to consider the scatterer-level signatures for micro-motion identification. To obtain the scatterer-level representation, it is required to extract the micro-Doppler of targets from components corresponding to the individual scattering centers, which can provide fine state descriptions for the targets.
This article establishes a general micro-motion model and reveals the micro-motion dynamics-induced modulation laws in the TFFR domain. To achieve micro-motion identification, we initially constructed sequence templates based on the derived TFFR modulation laws. Subsequently, we employed short-time sparse representation to extract signal components in the TFFR space. Finally, the micro-motion form is identified by comparing the association errors.
Utilizing the proposed micro-motion identification method, we can effectively acquire a fine-state description of the targets at the scatterer level. This reflects the intrinsic physical properties of micro-motions, resulting in improved discrimination performance and generalization ability across different targets. The primary contributions of this paper are summarized as follows:
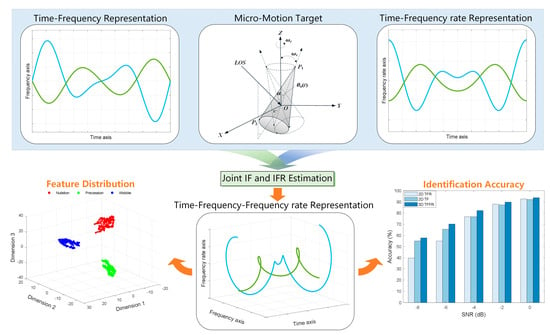
  • We explore the modulation laws induced by typical micro-motion dynamics, wherein the spatial trajectories of scatterers undergoing precession, wobble, and nutation are represented as the elliptical helix curve, epicycloidal helix curve, and generalized epicycloidal helix curve in the TFFR space. These representations effectively capture the intrinsic physical patterns associated with various micro-motion dynamics.
  • This article systematically investigates the separability of the components within the TFFR space for the first time. Our findings reveal that the probability of intersection among the different components decreases in the TFFR domain. Consequently, these components manifest as separated and non-overlapping spatial trajectories, enhancing the ease of component extraction and association.
  • We propose a novel identification method based on scatterer-level TFFR representation that can effectively discriminate micro-motion types for different targets with access to the intrinsic physical characteristics of micro-motions. Comprehensive experiments demonstrate the efficacy and robustness of our proposal.
The rest of this paper is organized as follows. Section 2 briefly reviews the related work. In Section 3, the radar signal model and TFFR modulations induced by micro-motions are derived in detail. Section 4 evaluates the TFFR modulation properties of micro-motion signals. The scheme of micro-motion identification by TFFR modulation is proposed in Section 5. The experimental results of two types of targets are given and analyzed in Section 6. Finally, Section 7 concludes and discusses the future work.

2. Related Work

In this section, we briefly overview the scatterer-level feature extraction methods for micro-motion identification. They can be divided into two categories, i.e., the separation-based methods and the representation-based methods.

2.1. Separation-Based Methods

Separation-based methods extract scatterer-level signatures by decomposing the signal into statistically uncorrelated components of micro-motion targets. The micro-Doppler of the scattering centers is then estimated based on the extraction of each component. There are many representative methods, such as empirical mode decomposition (EMD) [25], variational mode decomposition (VMD) [26], Hilbert–Huang transform (HHT) [27], and intrinsic chirp component decomposition (ICCD) [28]. However, most of these methods do not consider the scattering properties of radar targets and require signal components to meet a particular case, resulting in a significant error between the separated component and the actual signal component.

2.2. Representation-Based Methods

To extract the scatterer-level micro-Doppler features from intersected components, they can be transformed into multiple ridge curve detection (i.e., instantaneous frequency (IF) estimation) after obtaining the representation of the micro-motion signals [29]. The improved Viterbi algorithm (VA) obtains the IF of mono-component signals in the TF domain through dynamic programming and the path penalty function, which acquires reasonable estimates even under heavy noise [30]. However, it suffers from high computational complexity due to the search for candidate paths and cannot correctly associate the ridge curves for overlapped components at the intersection points. Given this, ridge path regrouping (RPRG) was proposed to extract intersected multi-component signals in the TF plot. Compared with the VA, the RPRG is efficient and can achieve accurate trajectory association by regrouping the detected ridge curves according to their slopes at the crossed points [31]. Nevertheless, limited by the time and frequency resolution, the detected ridges have frequency ambiguity in overlapping regions, seriously affecting subsequent ridge curve regrouping and bringing a significant error for IF estimation. In [32], the time-frequency enhancement method estimated the target’s IF based on the TF direction dictionary and directional filters, which could suppress the interference and enhance the target signal. This approach causes a computational burden owing to constructing an overcomplete dictionary and is sensitive to noise. In addition, the instantaneous frequency rate (IFR) can also be estimated on the basis of TFR representation [33,34,35]. However, as different components overlap on the TF and TFR plane, it gives rise to incorrect ridge curve association based on two-dimensional representation.
Accordingly, combining the advantages of the aforementioned three-dimensional representation, where the components appear as separated in the TFFR space, a signal extraction scheme based on chirplet transform was proposed for multi-component signals with fast-varying and crossing IFs [36]. Our previous work [37] achieved the joint IF and IFR estimation of the signal components in the TFFR space by the greedy algorithm and spectral clustering. Similarly, a dynamic range-Doppler trajectory was extracted from a three-dimensional representation of time, range, and Doppler to realize continuous human motion identification [38]. It is noted that a higher dimensional space can obtain finer descriptions for targets, which motivated the authors to explore the new modulation laws in the TFFR space for micro-motion identification.

3. TFFR Modulations Induced by Micro-Motion Dynamics

3.1. Radar Signal Model

When the target’s size is much larger than the radar operating wavelength, i.e., RCS falls within the optical region, the radar echoes from the target can be analyzed utilizing the point scatterer model. Assume that there are P dominant scatterers on the target. The baseband signal of the returned radar echo after translation compensation can be expressed as
s ( t ) = p = 1 P σ p ( t ) exp j 2 π f c 2 R p ( t ) c ,
where  f c  is the carrier frequency and c is the speed of light.  R p ( t )  and  σ p ( t )  are the range induced by micro-motion dynamics and scattering intensity of the pth point scatterer, respectively.
The micro-Doppler (i.e., IF) of the pth scatterer is defined by the first derivative of the instantaneous phase (IP) of the radar echoes [1], written as
f p ( t ) = 2 λ d R p ( t ) d t ,
where  λ = c / f c  is the radar wavelength.
The micro-Doppler rate (i.e., IFR) of the pth scatterer can be calculated by taking the derivative of the micro-Doppler concerning time, given as
Ω p ( t ) = 2 λ d 2 R p ( t ) d t 2 .

3.2. TFFR Modulation Model

The ballistic target is an extensively studied radar target exhibiting micro-motion. Affected by the undesired lateral force, the ballistic target undergoes different micro-motion forms. The cone-shaped target with micro-motions can be employed to model the ballistic target [39]. The geometry of the radar and space cone-shaped target is shown in Figure 1. Without the loss of generality, we take the precession target as an example. According to Figure 1a, a cone-shaped target with precession contains spinning around its spinning axis (i.e., symmetry axis) and coning around its coning axis (i.e., precession axis). Considering the target mass center O as the coordinate origin, the radar reference coordinate system  ( X , Y , Z )  is established, where the Z axis is the target coning axis, the Y axis is coplanar with the target spinning axis at the initial moment, and the X axis is determined by the right-hand screw rule. The target local coordinate system  ( x , y , z )  shares the same coordinate origin O with  ( X , Y , Z ) , where the target spinning axis is defined as the z axis. The angle between the radar line-of-sight (LOS) and coning axis (i.e., elevation angle) is  α , and the azimuth angle is  ν . Accordingly, the unit vector of the radar LOS in the reference coordinate system can be expressed as
n = [ sin α cos ν , sin α sin ν , cos α ] T .
The motion types and parameters, such as precession and coning angle, determine the modulation effect of micro-motion. According to the analysis above and the radar signal model, the TFFR modulations of three typical micro-motions (i.e., precession, wobble, and nutation) are discussed as follows. We use the same coordinate system to analyze three micro-motion forms.

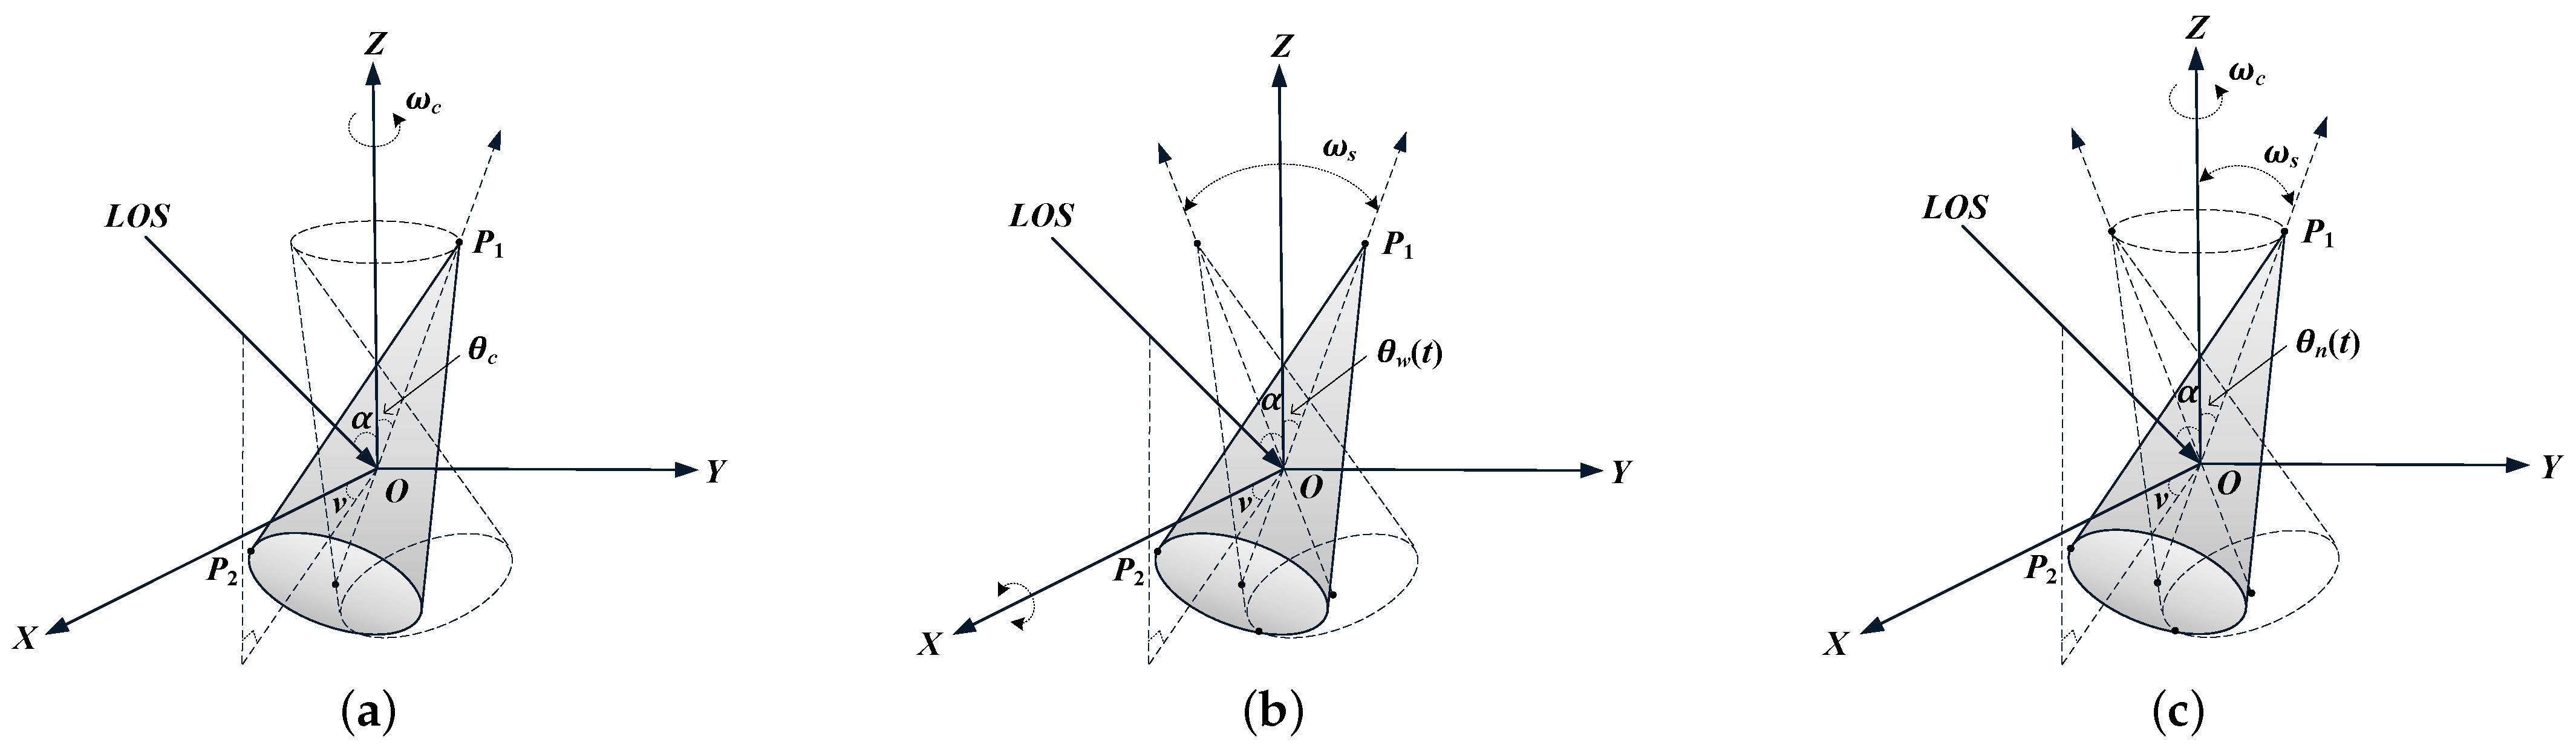
3.2.1. Precession-Induced TFFR Modulation

For a precession target, suppose that the coning frequency is  ω c , the coning angle is  θ c , and its symmetry axis at the initial moment is on the  Y O Z  plane. Assume that the target is a smooth, rigid body. Therefore, the effect of the spinning motion on electromagnetic scattering can be neglected due to its rotation symmetry [40]. Considering an arbitrary scattering center p on the cone-shaped target, whose coordinate is  r p = [ x p , y p , z p ] T , following the similar derivation in [1], the radial distance of scattering center p in the radar LOS direction at time t can be expressed as
R p , p r e ( t ) = R c ( t ) · R i n i t · r p T · n = cos α y p sin θ c + z p cos θ c + cos ω c t sin α x p cos ν + y p cos θ c + z p sin θ c sin ν + sin ω c t sin α x p sin ν y p cos θ c + z p sin θ c cos ν ,
where  R c ( t )  and  R i n i t  are the coning rotation matrix and initial rotation matrix, respectively, which can be calculated by Rodrigues’s formula [41,42] in Appendix A.
According to the properties of trigonometric functions, the instantaneous slant range of the scattering center p can be further simplified as
R p , p r e ( t ) = r p , p r e + A p , p r e sin ω c t + φ p , p r e ,
where  r p , p r e A p , p r e , and  φ p , p r e  are regarded as the initial range, micro-motion amplitude, and initial phase, respectively. They are constant, which can be denoted by
r p , p r e = cos α y p sin θ c + z p cos θ c A p , p r e = sin α x p 2 + y p cos θ c + z p sin θ c 2 φ p , p r e = tan 1 x p cos ν + y p cos θ c + z p sin θ c sin ν x p sin ν y p cos θ c + z p sin θ c cos ν .
Therefore, for the scattering center p, the IF and IFR induced by precession can be deduced by the first and second derivatives of  R p , p r e ( t )  to time t:
f p , p r e ( t ) = 2 ω c A p , p r e λ cos ω c t + φ p , p r e ,
Ω p , p r e ( t ) = 2 ω c 2 A p , p r e λ sin ω c t + φ p , p r e .
It can be observed from (8) and (9) that the IF and IFR sequences of scattering center p in precession are both sinusoidal functions, and its TFFR spatial trajectory is an elliptical helix curve. The frequency-frequency rate (FFR) plane projection is an ellipse, given as
f p , p r e 2 ( t ) λ 2 2 ω c A p , p r e 2 + Ω p , p r e 2 ( t ) λ 2 2 ω c 2 A p , p r e 2 = 1 .

3.2.2. Wobble-Induced TFFR Modulation

To derive the TFFR modulation laws from a wobble cone-shaped target, we assume that the plane of the wobble is  Y O Z . When the wobble amplitude is  θ s , the wobble frequency is  ω s , and the wobble initial phase is  ψ s ; the wobble angle at time t is defined as
θ w ( t ) = θ s cos ω s t + ψ s .
Similar to the derivation above, the radial distance between the pth point scatterer and radar becomes
R p , w o b ( t ) = R s ( t ) · r p T · n = x p sin α cos ν + sin θ w ( t ) y p cos α + z p sin α sin ν + cos θ w ( t ) z p cos α + y p sin α sin ν ,
where  R s ( t )  is the wobble motion-dependent rotation matrix [3], given in Appendix A.
Without the loss of generality, the composition function term of (12) can be simplified by the Bessel function of the first kind [1]. However, considering that the wobble amplitude of the cone-shaped target is relatively small in the actual scene [3], the first-order Taylor expansions can approximate it. The first-order Taylor expansions concerning time t are defined as follows:
sin θ w ( t ) θ s cos ω s t + ψ s
cos θ w ( t ) 1 1 2 ! θ s 2 cos 2 ω s t + ψ s .
Substituting (13) and (14) into (12), the radial distance from the pth scattering center to the radar can be simplified as a linear combination of trigonometric functions:
R p , w o b ( t ) = r p , w o b + A s 1 sin θ s ( t ) + A s 2 cos θ s ( t ) = r p , w o b + A s 1 θ s cos ω s t + ψ s + A s 2 A s 2 θ s 2 4 A s 2 θ s 2 4 cos 2 ω s t + 2 ψ s ,
where  A s 1 = y p cos α + z p sin α sin ν A s 2 = z p cos α + y p sin α sin ν .
Thus, for the scattering center p of the cone-shaped target, the wobble-induced IF and IFR are expressed as
f p , w o b ( t ) = 2 ω s A s 1 θ s λ sin ω s t + ψ s ω s A s 2 θ s 2 λ sin 2 ω s t + 2 ψ s ,
Ω p , w o b ( t ) = 2 ω s 2 A s 1 θ s λ cos ω s t + ψ s 2 ω s 2 A s 2 θ s 2 λ cos 2 ω s t + 2 ψ s .
From Equations (16) and (17), it is seen that the IF and IFR sequences of scattering center p are the summation of trigonometric functions with frequency  ω s  and  2 ω s . Moreover, different from the precession of a cone-shaped target, its TFFR spatial trajectory is an epicycloidal helix curve, and the FFR plane projection is an epicycloid.

3.2.3. Nutation-Induced TFFR Modulation

The target’s precession and the coning axis wobble make up the target’s nutation. Consistent with the aforementioned parameter and condition settings for precession and wobble, the nutation angle at time t is given as
θ n ( t ) = θ c + θ s cos ω s t + ψ s .
Then, the radial distance between the scattering center p and the radar is written as
R p , n u t ( t ) = R c ( t ) · R i n i t ( t ; θ ) · r p T · n = cos α y p sin θ n ( t ) + z p cos θ n ( t ) + cos ω c t sin α x p cos ν + y p cos θ n ( t ) + z p sin θ n ( t ) sin ν + sin ω c t sin α x p sin ν y p cos θ n ( t ) + z p sin θ n ( t ) cos ν ,
where  R c ( t )  and  R i n i t ( t ; θ )  represent the time-varying coning rotation matrix and initial rotation matrix, respectively, which is calculated by Rodrigues’s formula in Appendix A.
In the same way, since the coning angle and wobble amplitude are usually not too large in real scenarios, the Bessel function can be replaced with the first-order Taylor expansion to simplify the above expression, which is denoted by
sin θ n ( t ) θ c + θ s cos ω s t + ψ s ,
cos θ n ( t ) 1 1 2 ! θ c + θ s cos ω s t + ψ s 2 .
Further applying (20) and (21) to (19), the radial distance between the scattering center p and the radar can be rewritten as
R p , n u t ( t ) = θ c y p cos α + 4 2 θ c 2 θ s 2 4 z p cos α + B n 1 + B n 2 cos ω c t + φ n 1 + B n 3 cos ω s t + ψ s + B n 4 cos 2 ω s t + 2 ψ s + B n 5 + B n 6 cos ω c + ω s t + ψ s + φ n 2 + B n 5 + B n 6 cos ω c ω s t ψ s + φ n 2 + B n 7 + B n 8 cos ω c + 2 ω s t + 2 ψ s + φ n 3 + B n 7 + B n 8 cos ω c 2 ω s t 2 ψ s + φ n 3 ,
where  A n i ( i [ 1 , 6 ] ) B n j ( j [ 1 , 8 ] )  and  φ n k ( k [ 1 , 3 ] )  are simplified coefficients of the radial distance, and their specific forms are listed in Appendix B.
Thus, for the nutation cone-shaped target, the modulation laws of scattering center p can be derived from the first and second derivatives of  R p , n u t ( t ) , which are expressed as
f p , n u t ( t ) = 2 λ ω c B n 1 2 + B n 2 2 sin ω c t + φ n 1 + ω s B n 3 sin ω s t + ψ s + 2 ω s B n 4 sin 2 ω s t + 2 ψ s + ω c + ω s B n 5 2 + B n 6 2 sin ω c + ω s t + ψ s + φ n 2 + ω c ω s B n 5 2 + B n 6 2 sin ω c ω s t ψ s + φ n 2 + ω c + 2 ω s B n 7 2 + B n 8 2 sin ω c + 2 ω s t + 2 ψ s + φ n 3 + ω c 2 ω s B n 7 2 + B n 8 2 sin ω c 2 ω s t 2 ψ s + φ n 3 ,
Ω p , n u t ( t ) = 2 λ ω c 2 B n 1 2 + B n 2 2 cos ω c t + φ n 1 + ω s 2 B n 3 cos ω s t + ψ s + 4 ω s 2 B n 4 cos 2 ω s t + 2 ψ s + ω c + ω s 2 B n 5 2 + B n 6 2 cos ω c + ω s t + ψ s + φ 2 + ω c ω s 2 B n 5 2 + B n 6 2 cos ω c ω s t ψ s + φ n 2 + ω c + 2 ω s 2 B n 7 2 + B n 8 2 cos ω c + 2 ω s t + 2 ψ s + φ n 3 + ω c 2 ω s 2 B n 7 2 + B n 8 2 cos ω c 2 ω s t 2 ψ s + φ n 3 .
Compared to the precession and wobble, Equations (23) and (24) indicate that nutation causes a more complicated modulation law. It can be noted that the IF and IFR sequences of the scattering center p are weighted summations of high-order trigonometric functions with frequency  ω c ω s 2 ω s ω c ± ω s , and  ω c ± 2 ω s . Furthermore, its TFFR spatial trajectory can be regarded as a generalized epicycloidal helix curve, and the FFR plane projection is a generalized form of the aforementioned epicycloid.

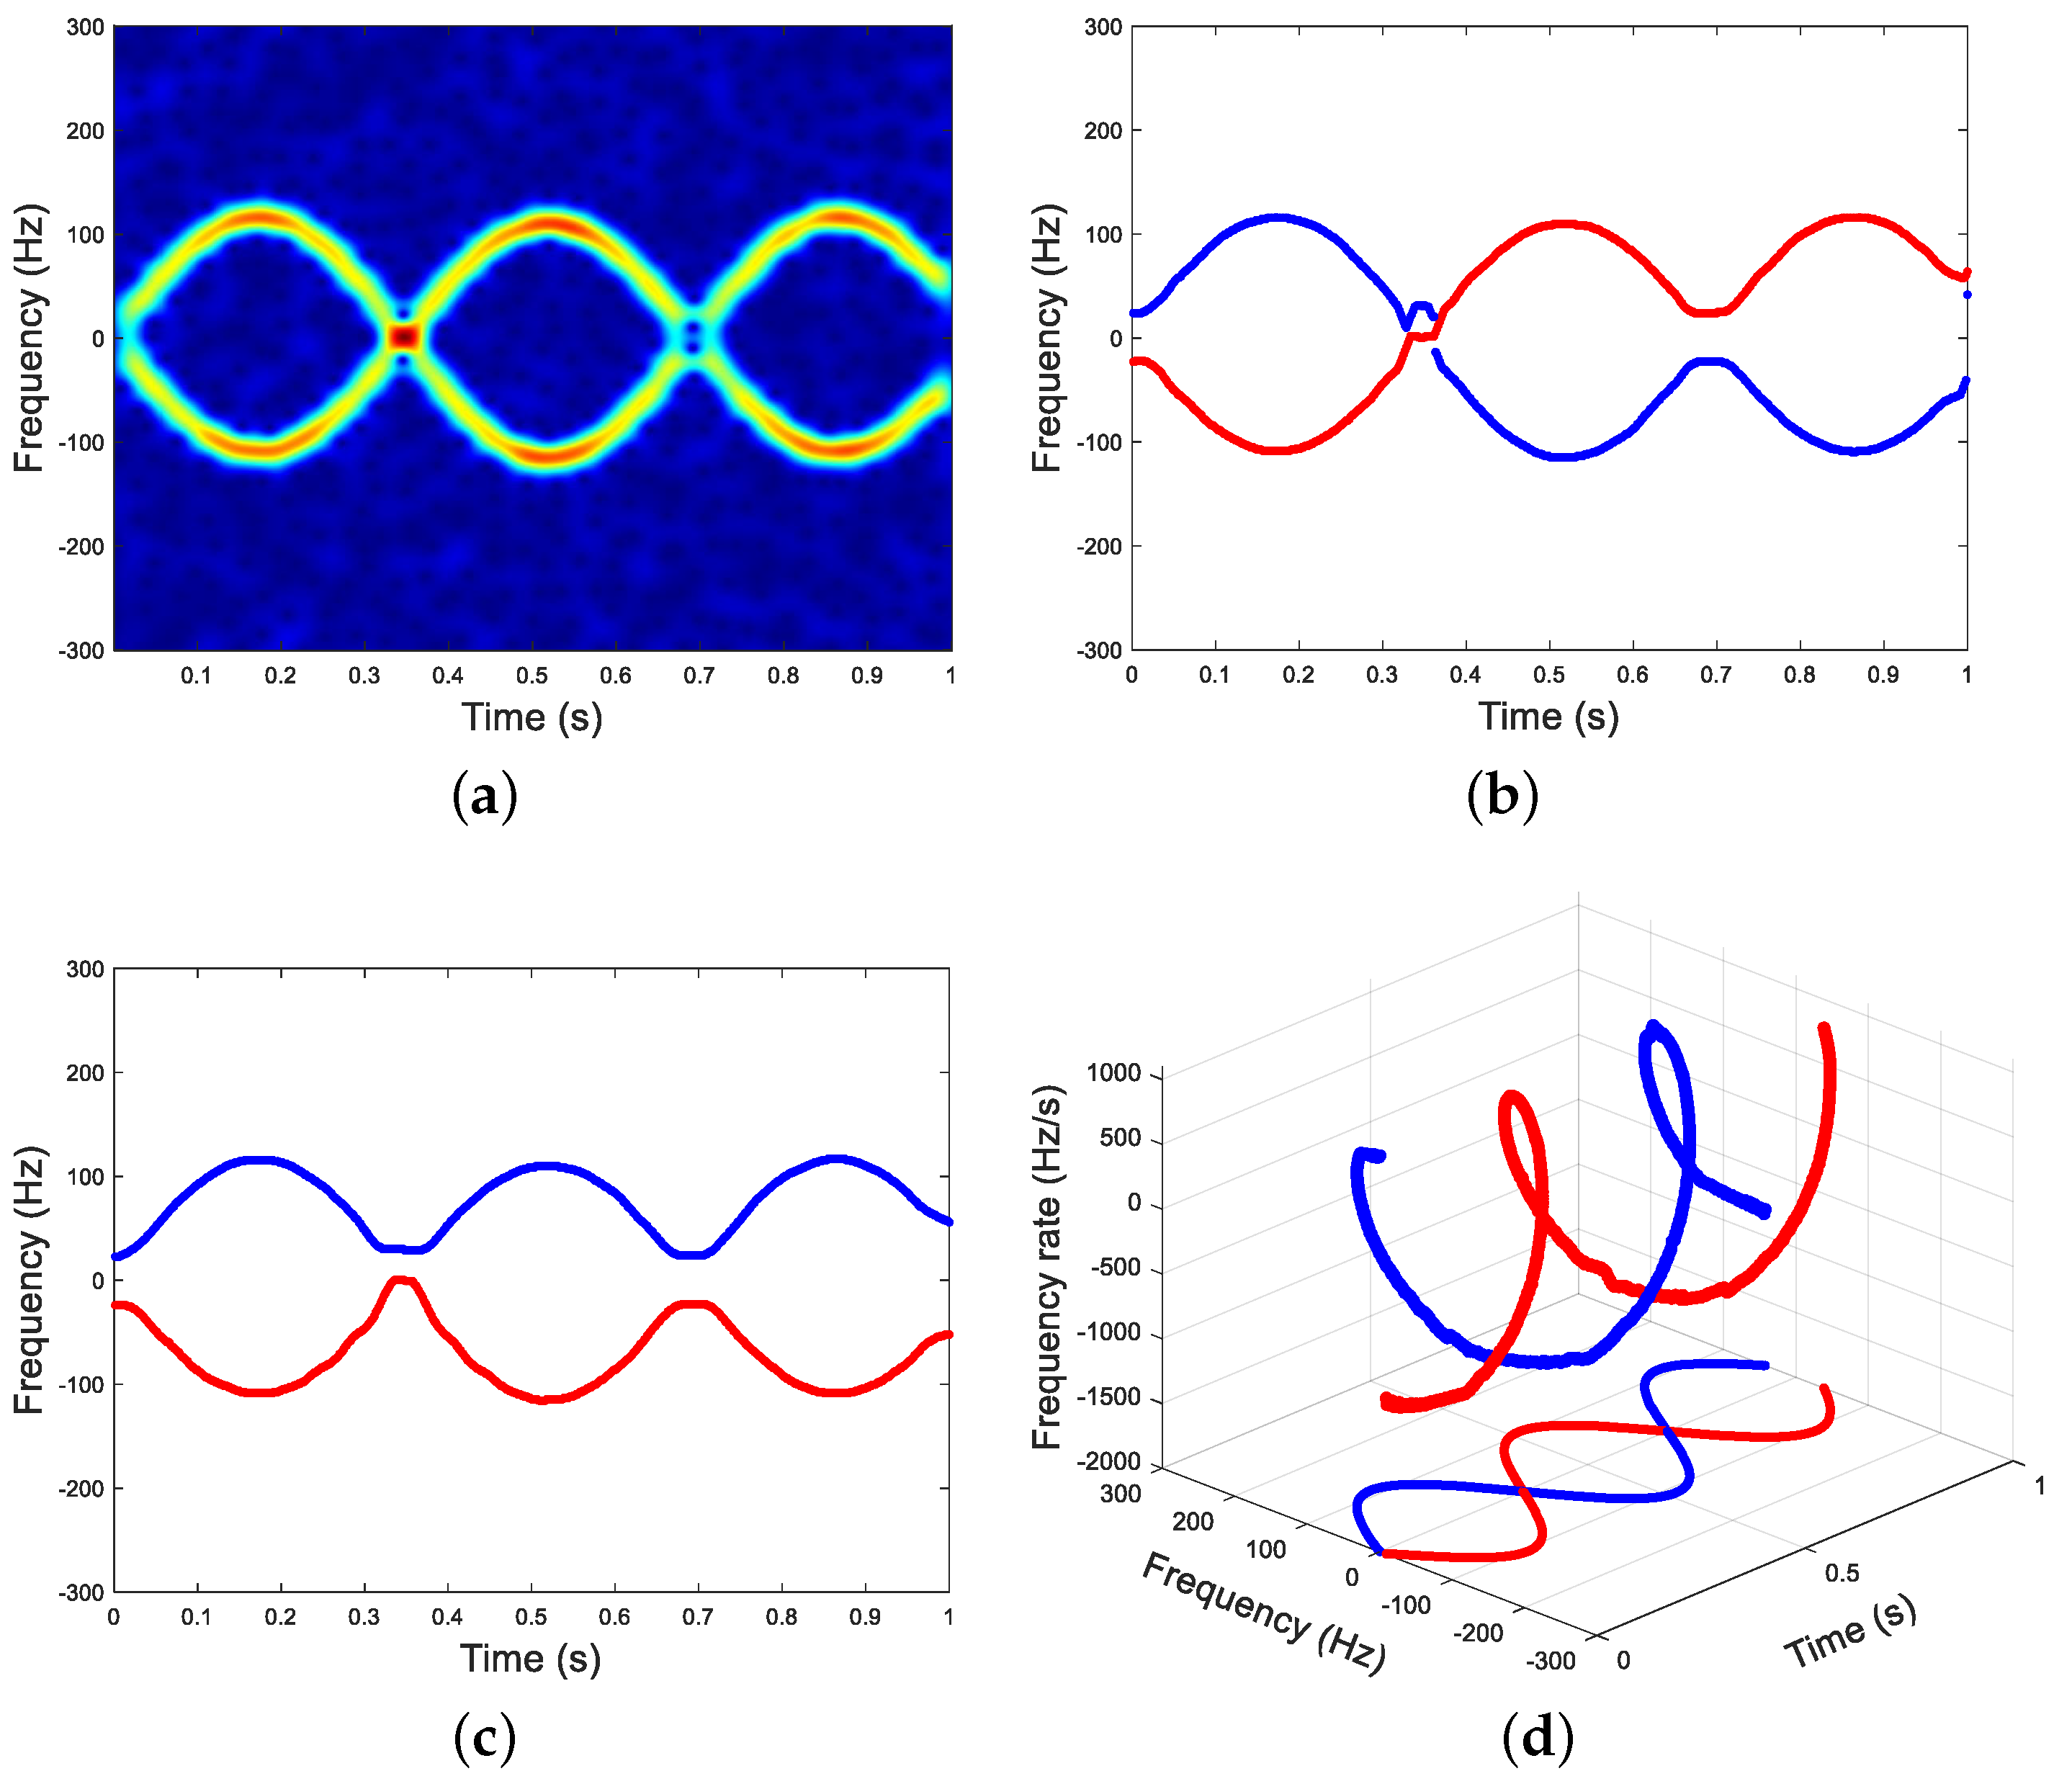
3.3. Simulation Verification for TFFR Modulation

In this subsection, TFFR modulation laws of typical micro-motion forms are presented. Based on the derived modulation formulas from Section 3.2, a cone-shaped target given in Figure 1 is employed for the simulation. The identical target structure parameters are used for different micro-motion forms. Without the loss of generality, there are two dominant scatterers whose positions are  P 1 ( 0 , 0 , 1.6 ) m  and  P 2 ( 0 , 0.2 , 0.4 ) m . Each point scatterer has the same scattering intensity. In addition, we assume that the radar operates at  10 GHz  and the sampling frequency is  f s = 600 Hz . At the initial time, the angle between the radar LOS and the positive direction of the Z axis is  α = 30 , and the azimuth angle in the reference coordinate system is  ν = 270 . The observation interval is  T = 2 s . Aiming at three typical micro-motion forms, the motion parameters are given as follows: for the precession, the coning frequency  ω c  and coning angle  θ c  are  2 π rad / s  and  15 ; for the wobble, the wobble frequency is  ω s = 2 π rad / s , and the wobble amplitude  θ s  and initial phase  ψ s  are  20  and  0 rad ; for the nutation, the coning frequency  ω c  and wobble frequency  ω s  are set to be  2 π rad / s  and  π rad / s , and the coning angle  θ c  and wobble amplitude  θ s  are  15  and  10 , respectively.

3.3.1. TFFR Modulation Laws

In Figure 2, we compare the modulation characteristics of typical micro-motion forms. The first to third columns represent the three forms of micro-motions: precession, wobble, and nutation. The first to fifth rows demonstrate the frequency spectra, TF, TFR, FFR, and TFFR representations of the cone-shaped target in these micro-motions.
The first row shows the spectra of three types of micro-motion signals. Though the amplitude and phase distributions are represented in the observation interval, it lacks time location, which cannot provide information about the time-varying frequency contents. The second and third rows give the results with the TF and TFR representations. It is seen that a joint TF or TFR estimation can provide localized time-dependent frequency or frequency rate information. However, the ridge curves of different scatterers may cross with each other at some instants on the two-dimensional plane, which leads to a heavy burden for subsequent curve extraction and association. Moreover, due to the difference between the IF and IFR sequences for different micro-motion types, it is worth mentioning that there exist distinctive FFR plane projections for various micro-motions in the fourth row (e.g., ellipse and epicycloid). Further, in combination with the aforementioned analysis, the TFFR representation is demonstrated in the last row. It can be seen that the spatial trajectory of the point scatterer represents one type of micro-motion form, where the elliptical helix curve, epicycloidal helix curve, and generalized epicycloidal helix curve correspond to precession, wobble, and nutation, respectively, which can be used for subsequent micro-motion identification. In addition, owing to the joint estimation of the IF and IFR, different scatterers’ trajectories (i.e., signal components) become almost disjoint spiral curves in the three-dimensional TFFR space. Thus, these components can be more easily distinguished, further simplifying the feature extraction of each signal component.

3.3.2. Approximation Error Analysis

To verify the correctness of the derived formulas in Section 3.2, the modulation models are compared with the time-frequency analysis obtained by STFT with a 65-length hamming window in different micro-motion forms. Furthermore, we calculated the root mean square error (RMSE) between the approximated results by the first-order Taylor expansions and theoretical values to quantify the effectiveness of the derived equations under different angles. The RMSE is defined as
RMSE = 1 N P p = 1 P n = 1 N f ˜ p ( n ) f p ( n ) 2 ,
where n is the discrete time,  f p ( n )  is the theoretical value, and  f ˜ p ( n )  is the approximated value.
Figure 3 presents the IFs of two point-scatterers and the results of time-frequency analysis, where the red and blue dotted lines represent the trajectories of scattering center  P 1  and  P 2 , respectively. It is not difficult to find that the approximated results agree with the simulated instances, thus validating the deduced modulation laws induced by micro-motion dynamics.
Figure 4 shows the RMSE with different coning angles varying from 5  to 20  and wobble amplitude changing from 0  to 25 . It is clear that the RMSE is much lower at a slight angle, e.g., the coning angle and wobble amplitude are less than 15 , which represents a finer fitting and verifies the correctness of the deduced mathematical formulas. Therefore, considering that the wobble and nutation angles are usually small in practical applications, the derived models can effectively approximate the actual TFFR modulation laws.

4. TFFR Modulation Properties of Micro-Motion Signals

Because of the time-varying and multi-component characteristics of micro-motion signals, it is required to estimate the micro-Doppler for each scattering center to realize the finer scatterer-level feature extraction. According to Section 2, two-dimensional (e.g., TF and TFR) representations are used in most micro-Doppler signature extractions, such as curve detection on the TF plane. Nevertheless, on the one hand, there is a trade-off between the time and frequency resolutions due to the constraints of the uncertainty principle. On the other hand, considering that signal components cross on the plane, it is easy to cause association errors at the intersection points.

4.1. Spatial Separability of TFFR Modulation

In light of this, the TFFR representation, as derived in Section 3.2, can effectively address the issues above. In the TFFR space, the intersection of two components is equivalent to its tangency in the TF plot, imposing stricter conditions for intersections. Consequently, the probability of components intersecting in the TFFR space decreases, and the components exhibit separated and non-overlapping spatial trajectories for the majority of the time.
As an illustrative example, we utilized a precession cone-shaped target with the identical variable settings described earlier. According to the equivalent scattering center model, the TFFR spatial trajectories of the cone-shaped target can be analyzed on the modulation laws of different scattering centers. A TFFR sequence of the scattering center (i.e., a signal component) corresponds to a spatial trajectory:  c p = t , f p ( t ) , Ω p ( t ) t = 0 T .
Considering two random scattering centers A and B on a precession cone-shaped target with identical micro-motion parameters but different coordinates, their spatial trajectories can be expressed as
c a , p r e = t , f a , p r e ( t ) , Ω a , p r e ( t ) t = 0 T c b , p r e = t , f b , p r e ( t ) , Ω b , p r e ( t ) t = 0 T .
If the trajectories of scattering centers A and B overlap in the TFFR space at instant  t 0 , denoted by  t 0 , f a , p r e t 0 , Ω a , p r e t 0 = t 0 , f b , p r e t 0 , Ω b , p r e t 0 , according to (8) and (9), the IF and IFR sequences of them satisfy the following:
2 ω c A a , p r e λ cos ω c t 0 + φ a , p r e = 2 ω c A b , p r e λ cos ω c t 0 + φ b , p r e 2 ω c 2 A a , p r e λ sin ω c t 0 + φ a , p r e = 2 ω c 2 A b , p r e λ sin ω c t 0 + φ b , p r e ,
where  A i , p r e  and  φ i , p r e ( i = a , b )  refer to the amplitude and phase of scattering centers A and B.
To analyze the spatial separability of the trajectories, combining (27) with the properties of trigonometric functions, the following condition is obtained:
A a , p r e = A b , p r e .
Equation (28) indicates that the two scattering centers have the same amplitude. According to the aforementioned point scatterer model, it can be further inferred that they have identical coordinates for the actual scattering center distributions, i.e.,  ( x a , y a , z a ) = ( x b , y b , z b ) , which is contrary to the definition of scattering centers A and B. In addition, as the expressions of wobble and nutation are relatively complicated, it is difficult to give an analytical form for the proof of spatial separability, so we use numerical simulation to demonstrate it later.
Therefore, it is seen that different trajectories of scattering centers are almost disjoint in the three-dimensional TFFR space. Joint IF and IFR characterization provide finer scatterer-level descriptions for modulations induced by micro-motion dynamics, which can reduce the complexity of component extraction and improve the representation ability of multiple components. In addition, similar to the separability of multi-component signals defined in the TF plot [43], we can obtain the spatial separability conditions in combination with the resultant distance between components in the TFFR space, denoted by  f p ( t ) f q ( t ) 2 + Ω p ( t ) Ω q ( t ) 2 4 Δ 2 , p q , 1 p , q P  for some  Δ > 0 .
Further, Monte Carlo simulation experiments (1000 realizations) are carried out to evaluate the characteristics of the TFFR modulations. The simulations are designed as follows. For each experiment, the spatial locations of two point scatterers are randomly generated. Then, scatterers’ IF and IFR sequences are produced by exploiting the corresponding parameters. Based on the simulated scenarios of space targets [3,4], the detailed micro-motion parameter and radar parameter settings are given in Table 1 and Table 2, where the range of values obey the uniform distribution. Moreover, owing to the difference between the units of IF and IFR, we apply a standardized Euclidean distance metric to calculate the trajectory distance between two random scattering centers in the TFFR space. The standardized Euclidean distance of two sets of observations  ( X , Y C L × N )  can be written as  d 2 ( X , Y ) = l = 1 L X l · Y l · / s l 2 , where  s l 2 = 1 N 1 n = 1 N X l , n Y l , n / μ l 2  is the sample variance of the lth dimension,  μ l = 1 N n = 1 N X l , n  is the sample mean, and N is the sample number. Finally, the minimum trajectory distance of two point-scatterers is compared with a threshold to judge whether the spatial trajectories cross in the TFFR space, where  d ^ m , i ( n ) = arg min n d m X i , Y i  denotes the minimum spatial distance between two random scatterers in the m motion of the ith experiment  ( m { p r e , w o b , n u t } ) . The threshold is set to be 0.001, considering the influence of quantization errors.
Figure 5 shows the relative relationships between the minimum distance and threshold for different micro-motion forms, where the red and blue solid lines represent the decision threshold and minimum spatial trajectory distance in the experiment, respectively. After 1000 Monte Carlo simulation experiments, it is clear that the minimum spatial trajectory distance between two scatterers exceeds the threshold in different micro-motions, with two exceptions in the wobble motion, as shown in Figure 5b (i.e., green stars). Thus, it is further inferred that the trajectories of varying scattering centers are much less likely to overlap in the three-dimensional TFFR space.
Furthermore, Figure 6 demonstrates one of the two exceptions shown in Figure 5b, where the minimum distance falls below the threshold during wobble motion. In Figure 6a, we observe that the IF sequences of two scattering centers (represented by red and blue solid lines) exhibit similar slopes at the intersection points (marked as green stars), with their ridges potentially tangent in the TF plot. Simultaneously, the IFR sequences overlap at these green stars, causing the intersection in the TFFR space (as seen in Figure 6b,c). Nonetheless, even with these exceptions, the overall probability of trajectory intersections in the three-dimensional TFFR space (2 out of 1000) remains lower than that in a two-dimensional TF plot.

4.2. Signature Separability of TFFR Modulation

To further explore the signature separability of micro-motion signals in the TFFR space, the TFFR representation is compared with the present TF representation. We take two dominant scatterers ( P 1  and  P 2 ) of a cone-shaped target as an example, which is the same model introduced before, and the micro-motion parameters and radar parameters are consistent with Table 1 and Table 2. Monte Carlo computer simulations are adopted to generate different IF and IFR sequences for three kinds of micro-motions. We regard the resulting IF and IFR sequences (i.e., spatial trajectories) as high-dimensional features of the target motion. Considering that the t-SNE algorithm is a classical non-linear dimensionality reduction technique for exploring high-dimensional data, it can capture the manifold structure of complex space [44]. Thus, we use the t-SNE algorithm to visualize the distribution of dimensionality-reduced features. Additionally, it is worth noting that t-SNE cannot preserve the global structures. Thus, the PCA algorithm is first applied to reduce the dimensionality (e.g., 50) of high-dimensional data [45].
After 200 Monte Carlo experiments, the visualization results with low-dimensional embedding are presented in Figure 7. From Figure 7a, it is noted that only TF representation (i.e., IF sequences) would generate overlapping feature distributions among different classes and large intra-class distances for dimensionality-reduced features. In contrast, the result in Figure 7b shows that joint TFFR representation (i.e., IF and IFR sequences) can significantly reduce the intra-class distance while maintaining the separability of inter-class features. It is seen that the addition of the frequency rate information makes the features among different classes more distinguishing, indicating that micro-motion signal components have more distinctive characteristics in the TFFR space than on the TF plane. Therefore, it can provide an essential basis for subsequent micro-motion discrimination.

5. Micro-Motion Identification by TFFR Modulation

On the basis of analyzing the modulation properties of micro-motion signals, it can be inferred that the TFFR estimation obtained from the radar echoes contains the complete information of the scattering centers, which reflects the distinctive characteristics of different micro-motion forms. Therefore, according to the global properties of the extracted TFFR spatial trajectories, the type of micro-motion can be further discriminated, where the trajectories of scattering centers in precession, wobble, and nutation consist of the elliptical helix curves, epicycloidal helix curves, and generalized epicycloidal helix curves in the TFFR space, respectively.
Figure 8 shows the TFFR modulation-based micro-motion identification flowchart. The TFFR sequence templates of the point scatterers based on motion parameters and search grid evaluation are first constructed, which contain different micro-motion forms. Then, sparse representation is employed for simulated noisy radar echoes to extract the TFFR spatial trajectories of the scattering centers. Finally, we calculate the association errors between the extracted spatial trajectories and constructed sequence templates to achieve micro-motion identification. The detailed processes are as follows.

5.1. TFFR Sequence Templates Construction

Aiming at motion identification, the IF and IFR sequence templates of the scattering centers are first constructed. The main process includes the following steps:
(1)
Set different micro-motion forms and ranges of motion parameters based on the modulation models in Section 3 as follows:
ϑ = ϑ m , i ϑ m , i , min ϑ m , i ϑ m , i , max ,
where  m { p r e , w o b , n u t } , i.e., m includes precession, wobble, and nutation.  i 1 , I m , and  I m  denotes the number of motion parameters for each type of micro-motion form.  ϑ m , i , min  and  ϑ m , i , max  are the parameter ranges.
(2)
Generate a possible range of search intervals  Δ ϑ = Δ ϑ m , i  for each motion parameter, and the micro-motion parameter space consists of motion parameter ranges and search intervals, given as
Ψ = ϑ , Δ ϑ .
Therefore, the micro-motion parameter space for the ith parameter under m motion can be expressed as
Ψ m , i = ϑ m , i , min : Δ ϑ m , i , eva : ϑ m , i , max ,
where  Δ ϑ m , i , eva  is the search interval selected from the subsequent search grid evaluation.
(3)
According to (31), the micro-motion parameter space can be rewritten as
Ψ = ϑ m k m { p r e , w o b , n u t } , k 1 , K m ,
where  K m  represents the total sample number in m motion.
Further, construct the TFFR sequence templates of the micro-motion scattering centers based on (32) as follows:
C s e t = f p ( t ; ϑ m k ) , Ω p ( t ; ϑ m k ) ϑ m k Ψ p = 1 P ,
where  f p ( t ; ϑ m k )  and  Ω p ( t ; ϑ m k )  denote the IF and IFR sequences of the pth point scatterer in m motion. For a more intuitive display, the TFFR sequence templates of each kind of micro-motion are given as
C p r e = f p t ; ϑ p r e k , Ω p t ; ϑ p r e k ϑ p r e k = ω c , k , θ c , k , α k , t [ 0 , T ] , k 1 , K p r e p = 1 P C w o b = f p t ; ϑ w o b k , Ω p t ; ϑ w o b k ϑ w o b k = ω s , k , θ s , k , α k , t [ 0 , T ] , k 1 , K w o b p = 1 P C n u t = f p t ; ϑ n u t k , Ω p t ; ϑ n u t k ϑ n u t k = ω c , k , ω s , k , θ c , k , θ s , k , α k , t [ 0 , T ] , k 1 , K n u t p = 1 P .
However, when the target parameters do not match the parameter space, e.g., the search interval is too large, it leads to a drop in identification accuracy. Conversely, if the search interval is too small, it results in a significant computational burden. Therefore, for the trade-off between the dimensionality of parameter space, we use numerical simulations to evaluate the search interval in each dimension [46]. The major steps of search grid evaluation are given as follows:
(1)
For different micro-motions, randomly generate K sequences of the IF and IFR within the preset motion parameter ranges as follows:
C t e s t = f p t ; ϑ m k , Ω p t ; ϑ m k p = 1 P .
(2)
Determine the optimal search interval  Δ ϑ m , i , eva  for each parameter by calculating the identification accuracy between  C t e s t  and  C s e t . According to (50), the identification accuracy can be denoted by
η a c c = k = 1 K m ^ ( k ) / K .
(3)
The search intervals are chosen when the corresponding micro-motions can be correctly discriminated. The optimal intervals satisfy:
Δ ϑ = arg max Δ ϑ η a c c .

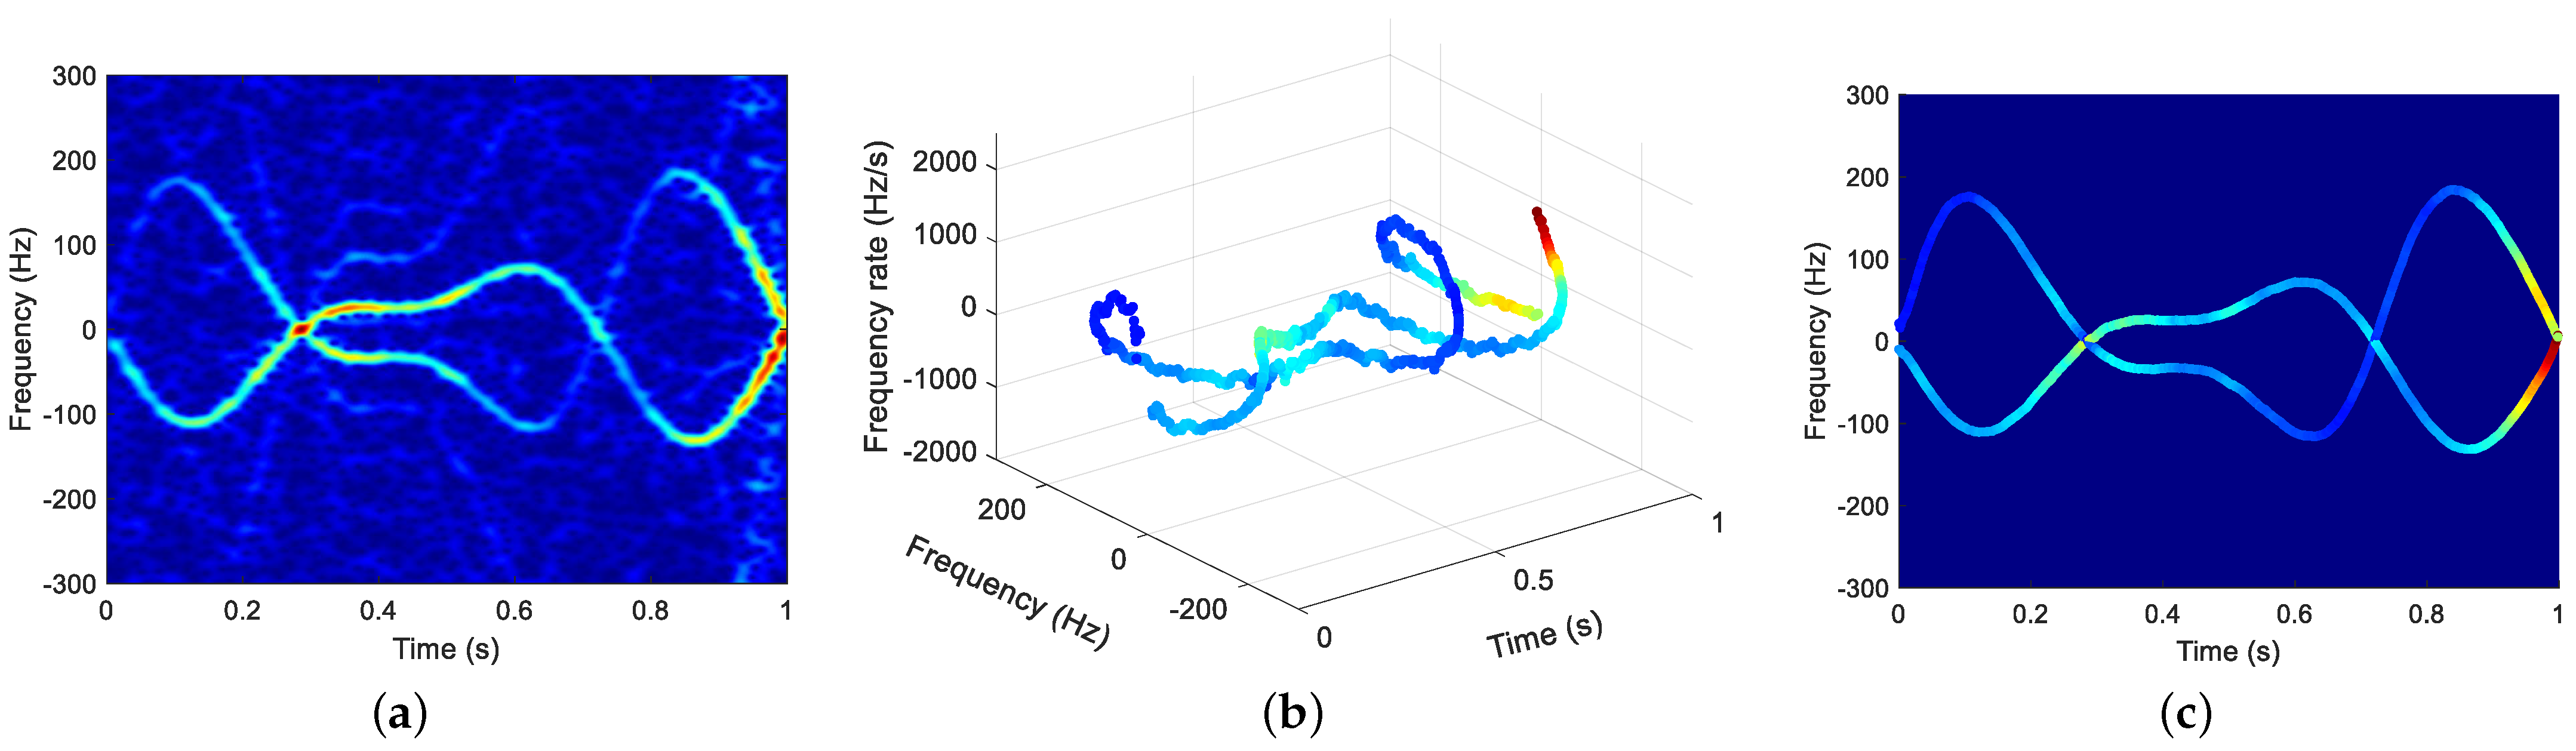
5.2. TFFR Spatial Trajectory Extraction

Considering that STFT is a classic TF representation method, it breaks the signal into local time segments and calculates each time segment by Fourier transform. The mathematical formula of STFT for radar echo is given as
ρ s ( t , f ) = s ( τ ) h ( τ t ) exp ( j 2 π f τ ) d τ ,
where  h ( t )  is a symmetric window function. The local time segment of  s ( t )  is denoted by  p s ( τ ; t ) = s ( τ ) h ( τ t ) .
Due to the limited performance of STFT for signals with a fast-varying frequency, the short-time sparse representation (STSR) proposes to analyze the non-stationary signals. Compared to the complex sinusoidal basis vector of the Fourier transform, STSR approximates the signal segment as multiple chirp basis vectors. The chirp basis vector is defined as
s p ( τ ) = exp j 2 π f ¯ p τ + 1 2 Ω ¯ p τ 2 ,
where  L w 1 2 τ L w 1 2 L w  is the window length of  h ( t ) f ¯ p  and  Ω ¯ p  denote the chirp basis vector’s center frequency and chirp rate for the pth point scatterer.
Different from the approximation that the signal patch is regarded as a stationary sinusoidal signal, STSR decomposes the signal in each time segment into a linear combination of different chirp signals. Thus,  p s ( τ ; t )  can be rewritten as
p s ( τ ; t ) = p = 1 P σ ¯ p s p ( τ ) + ε ( τ ) ,
where  σ ¯ p  is the complex amplitude of the pth scatterer and  ε ( τ )  is the estimated error.
As the number of micro-motion signal components P is much smaller than the window length  L w , the sparse representation is satisfied for the signal patch. Further, the expression of STSR can be modeled from (40) as
y = Φ x + n ,
where  y C L w  is the local patch of the signal,  Φ C L w × N w ( L w N w )  is a collection of basis vectors (i.e., overcomplete dictionary) and each column represents a basis vector,  x C N w  is the coefficient vector, and  n C L w  is the additive white Gaussian noise (AWGN).
Based on the signal model in (41), it is seen that STSR is an underdetermined problem, which has infinite solutions. To acquire the sparest solution, the optimization problem based on  l 0 -norm minimization can be constructed as
x = arg min x x 0 s . t . y Φ x 2 < δ ,
where  δ  denotes the small noise threshold.
However, the above optimization problem is NP-hard, and we need to relax the constraints to bypass this problem. Considering its approximated convex norm, we can further solve it utilizing non-linear processing techniques [47]. Combined with our previous work in [37], a modified orthogonal matching pursuit (OMP) algorithm is used to solve the STSR problem. Thus, by performing the modified OMP on each signal segment, we can obtain the joint IF and IFR estimation of the signal:
Θ = a ^ p ( t ) , f ^ p ( t ) , Ω ^ p ( t ) p = 1 P t = 0 T ,
where  a ^ p ( t ) f ^ p ( t ) , and  Ω ^ p ( t )  refer to the estimated complex amplitude, center frequency, and chirp rate of the pth scattering center at instant t.
It is worth noting that the modified OMP can suppress the sidelobes and cross-terms by repeatedly updating residual signals. Further, making use of the separability of multiple components in the TFFR space, a local K-means clustering algorithm is developed to achieve robust trajectory association of the scattering centers, and the clustering result is given as
Λ = a ^ p ( t ) , f ^ p ( t ) , Ω ^ p ( t ) , y ^ p ( t ) p = 1 P t = 0 T ,
where  y ^ p ( t )  represents the clustering label of the pth scattering center. Therefore, the TFFR spatial trajectories of different point scatterers are effectively extracted with enhanced resolutions.

5.3. Minimum Association Error Calculation

Based on the previous two subsections, the micro-motion forms can be identified by calculating the association errors between the extracted spatial trajectories and constructed TFFR sequence templates. Assume that  Λ ( c l s , ϑ ^ )  is the extracted trajectories (i.e., the clustering results),  c l s  represents the micro-motion type,  ϑ ^  denotes the motion parameters, and  C s e t = C m m { p r e , w o b , n u t }  corresponds to the constructed sequence templates. The mathematical model of micro-motion identification can be given as
identity ( c l s ) = m ^ = arg max m E Λ ( c l s , ϑ ^ ) , C m ,
where  E ( · )  denotes the association error function, describing the correlation between the extracted trajectories and the constructed templates. Micro-motion identification aims to acquire the class with the maximum correlation (i.e., the minimum association error) with the extracted trajectories.
According to the analysis above, the extracted TFFR spatial trajectories of the scattering centers at each instant t can be modeled as
f ^ p ( t ) = f p ( t ) + ε 1 ( t ) ,
Ω ^ p ( t ) = Ω p ( t ) + ε 2 ( t ) ,
where  f p ( t )  and  Ω p ( t )  are the theoretical values of the extracted IF and IFR trajectories, respectively.  ε 1 ( t )  and  ε 2 ( t )  are the estimated errors of the IF and IFR trajectories, which are supposed to be independent, and AWGN with variances  σ 1  and  σ 2 .
Further, the association error can be calculated for each kind of micro-motion, that is, between the extracted trajectories and constructed sequence templates. Considering that the errors are involved with estimated IF and IFR trajectories simultaneously, a sequential error weighting method is proposed to calculate the association error, expressed as
ξ p ( m , k p ) = a 1 t = 0 T f ^ p ( t ) f ( t ; ϑ m k p ) + a 2 t = 0 T Ω ^ p ( t ) Ω ( t ; ϑ m k p ) ,
where  ξ p ( m , k p )  is the pth scattering center’s association error with the  k p th sample in m motion.  a 1  and  a 2  refer to the weight factors for the association errors of the IF and IFR trajectories.
According to (48), we can obtain the minimum association errors with different micro-motions, and the corresponding parameter indexes in m motion are denoted by
k ^ = k ^ p p = 1 P = arg min k p p = 1 P ξ p m , k p .
The global minimum association error can be further calculated by comparing the minimum association errors among each micro-motion form. Therefore, the discriminated micro-motion form can be written as
m ^ = arg min m p = 1 P ξ p m , k ^ p ,
where  m ^  denotes the discriminated type. The global minimum association error and associated motion parameters are rewritten as  ξ ( m ^ , k ^ )  and  ϑ m ^ k ^ .

6. Verification and Analysis for Micro-Motion Identification

This section presents experimental results based on micro-motion signals to demonstrate the effectiveness of scatterer-level TFFR representation for micro-motion identification. These signals consist of simulated radar echoes from space cone-shaped and cone-cylinder targets, as well as synthesized dynamic radar echoes from space cone-shaped targets generated based on electromagnetic calculation data. The TFFR representation is compared with the traditional two-dimensional TF representation, where VA [30] and RPRG [31] methods are used to extract IF components, and STSR is employed to extract the IF and IFR components of micro-motion signals jointly.

6.1. Results of Simulated Space Cone-Shaped Target

Similar to the target model of the previous two sections, a space cone-shaped target is established to generate radar echoes for different micro-motion forms. According to Section 5.1, a TFFR sequence template of micro-motion scattering centers is first constructed. Suppose that the radar carrier frequency is  f c = 10 GHz , the sampling frequency is  f s = 600 Hz , the observation time is  T = 1 s , and the azimuth angle in  ( X , Y , Z )  is  ν = 270 . According to the search grid evaluation, the optimal search intervals of the micro-motion parameters are determined by numerical simulations. Table 3 gives the parameter ranges and search intervals. The dimensionality of the parameter space is 8330 for each point scatterer, where precession, wobble, and nutation contain 1573, 1573, and 5184 parameter samples, respectively. Then, combined with Table 3, 500 radar echoes are randomly generated in the corresponding parameter range under each kind of micro-motion for component extraction and identification verification.
Figure 9 compares the results of the precession components extraction with different representation methods. In Figure 9a, the STFT with a 65-length Gaussian window is applied for micro-motion signal processing. In addition, the white Gaussian noise is added to radar echoes with SNR = 15 dB. The SNR is defined as  SNR = 10 log 10 n = 0 N 1 | s ( n ) | 2 N σ e 2 , where  n = 0 , 1 , , N 1  denotes the discrete time and  σ e 2  represents the variance of noise. The extraction results of the IF components with VA and RPRG methods are given in Figure 9b and Figure 9c, respectively. Considering both algorithms perform ridge curve detection (i.e., IF estimation) in the TF domain, we regard them as two-dimensional representation methods. Due to the limitations of time-frequency resolution, e.g., frequency aliasing, it is seen that the IF components estimated by VA and RPRG suffer from poor estimation performance and trajectory association at the intersection points. Figure 9d shows the results of joint IF and IFR estimation by STSR, which considers it a three-dimensional representation method. It can be noted that STSR acquires finer estimation results by converting crossed curves on the TF plane into non-intersected trajectories in the TFFR space. Additionally, it is seen from the TF projection of the TFFR space that due to the introduction of the frequency rate dimension, the IF component estimation is also greatly improved compared with the results by the VA and RPRG methods, which presents the superior performance of TFFR representation.
To quantitatively compare the performance of different representation methods, Table 4 gives the identification accuracy for various micro-motion forms with SNR = 0 dB. Due to the better performance for extracting ridge curves at the intersections, the TFFR representation obtained by STSR can achieve a higher identification accuracy for different micro-motion types in most cases, which finally acquires the highest average identification accuracy. In addition, compared to the traditional two-dimensional representation methods, e.g., VA and RPRG, consistent with the above discussion, due to the improvement of spatial trajectory extraction and association, it also provides a higher accuracy by exploiting the results of the IF estimation obtained by STSR, i.e., a two-dimensional TF projection of the TFFR space.
Further, we compare the identification accuracy with the aforementioned representation methods under different SNR conditions, in which SNR varies from −5 dB to 20 dB with an interval of 5 dB. As shown in Figure 10, the red and blue lines denote the discrimination accuracy obtained by traditional two-dimensional TF ridge extraction methods, i.e., VA and RPRG, and the black and green lines represent the acquired accuracy based on the three-dimensional TFFR representation, i.e., STSR, and its corresponding TF projection. It is seen that among the different representation methods, 3D TFFR-STSR obtains the highest identification accuracy under all the given SNR conditions, which further validates its robustness to noise. Even more remarkably, when the SNR is higher than 5 dB, the average identification accuracy acquired by TFFR modulation reaches over 97%.
In addition, it should be pointed out that the recognition accuracy between 2D TF-STSR and 3D TFFR-STSR is close in high SNR conditions. To further explore the performance of TFFR representation, combined with the above results, we analyze the two-dimensional (i.e., TF and TFR) representations obtained by the projection of the TFFR space and three-dimensional TFFR representation in relatively low SNR conditions, where SNR varies from −8 dB to 0 dB with an interval of 2 dB.
Figure 11 demonstrates one of the identification results in precession motion with SNR = 0 dB, in which the solid green line represents the theoretical value, the black dotted line is the estimated value of the IF or IFR trajectories obtained by STSR, and the solid red line is the associated value from the constructed sequence templates based on the criteria in (49) and (50). As shown in Figure 11, despite association errors between the associated value and estimated value, the associated value is similar to the theoretical value, indicating that it can still achieve a correct identification in the TFFR space.
Figure 12 shows the identification accuracy versus SNR for the TF, TFR, and TFFR representations. It is seen that the TFFR representation achieves a higher identification accuracy than the TF and TFR representations in low SNR conditions as well. Taking SNR = −4 dB as an example, we can find that the discrimination accuracy of the TFFR representation is 5.53% and 5.47% than that of the TF and TFR representations, and it further validates the superior performance for TFFR modulations.

6.2. Results of Electromagnetic Calculated Space Cone-Shaped Target

Given the practical challenges of obtaining measured data for space cone-shaped targets and the high hardware requirements for darkroom measurements, we employed electromagnetic calculation software (CADFEKO) to capture the dynamic radar echoes of micro-motion targets. This approach is characterized by its efficiency in terms of time and resources. We initially constructed the 3D geometric model of a space cone-shaped target using CADFEKO, as depicted in Figure 13a. As the space cone-shaped target exhibits rotational symmetry, we set the elevation angle to 0  and varied the azimuth angle from 0  to 180  with an interval of 0.2  to obtain the electromagnetic scattering data for all possible attitudes. Figure 13b shows the RCS characteristics of the above target, with the radar operating at 10 GHz and employing the physical optics (PO) method.
The dynamic radar echo of the target is influenced by the micro-motion dynamics discussed in Section 3.2 and the radar parameters. We combined the radar LOS with the target motion model to calculate the target attitude angle  β ( t ) , denoting the angle between the radar LOS and the target’s symmetry axis. Subsequently, we can extract the corresponding electromagnetic calculation data from Figure 13b to generate the dynamic radar echoes of a space cone-shaped target. To assess the identification performance of the proposed method, we maintained the parameter settings outlined in Section 6.1. We randomly generated 200 sets of echoes for each micro-motion form within the parameter range specified in Table 3.
Figure 14a presents the STFT of one of the generated dynamic radar echoes, where the target is under mutation, and the SNR is set at 10 dB. Compared to the STFT result in Figure 9a, it reveals differences in the intensity of the target’s scattering centers obtained from the electromagnetic calculation data. These differences result in certain weak components being submerged at specific moments, posing challenges for m-D ridge extraction in the TF plot. However, the STSR offers a solution by jointly estimating IF and IFR. This enables STSR to obtain a separated representation (i.e., non-crossed spatial trajectories) with time-varying amplitudes in the three-dimensional TFFR space, as shown in Figure 14b. In addition, the concentrated TF projection achieved by STSR in Figure 14c also illustrates the effective performance of the TFFR representation.
Furthermore, we provide a quantitative analysis of the proposed method in micro-motion identification using electromagnetic calculation data. To assess the generalization ability, we employed the sequence templates constructed from the simulated space cone-shaped target in Section 6.1 to identify the target’s micro-motion forms. The dynamic radar echoes generated from electromagnetic calculation data are solely utilized as a test set.
Influenced by the time-varying amplitudes of scattering centers, the results presented in Table 5 indicate that the RPRG method struggles to accurately extract ridges, leading to challenges in correctly correlating these ridges. This limitation results in a lower discrimination performance. Considering factors such as noise and intersections in the TF domain for multi-component signals, the STSR excels by enabling more concentrated ridge extraction in a separated TFFR space. Consequently, it enhances discrimination accuracy. It is worth noting that STSR achieves the highest identification accuracy across various SNR conditions, affirming the generalization ability and robustness of this proposed method.

6.3. Results of Simulated Space Cone-Cylinder Target

In this subsection, we compare the discrimination accuracy of other types of targets in micro-motions with different representation methods. A space cone-cylinder target is depicted in Figure 15. To simulate real-scene radar echo data, we assume that there are three scattering centers on the target with positions  P 1 ( 0 , 0 , 1.6 ) m P 2 ( 0 , 0.2 , 0.4 ) m , and  P 3 ( 0 , 0.2 , 0.6 ) m  in  ( x , y , z ) , and their corresponding RCS are  σ 1 = 1 σ 2 = 0.6 , and  σ 3 = 0.4 , respectively. The parameters of the radar system and observation condition remain consistent with those described in Section 6.1. Based on the parameter ranges in Table 3, we randomly simulated 200 sets of radar echoes for each form of micro-motion (i.e., precession, wobble, and nutation) to verify the identification accuracy in the three-dimensional TFFR space.
Figure 16a illustrates the STFT of the radar echo, from which we can see that three signal components of the space cone-cylinder target under wobble overlap in the TF plot. The results of the ridge extraction by VA and RPRG for these three components are shown in Figure 16b and Figure 16c, respectively. It is seen that both methods can improve the ridge curve extraction accuracy to some extent by minimizing the path penalty function and utilizing the frequency variations. However, association errors still occur at the intersections due to the frequency ambiguity of the TF representation. Figure 16d demonstrates the estimation results of the wobble components based on STSR. Benefiting from the joint estimation of the frequency and frequency rate, three signal components exhibit separated and non-crossing spatial trajectories based on the three-dimensional TFFR representation, consistent with the aforementioned theoretical derivation in Section 3.2.
In this example, we showcase the identification accuracy of the proposed method for space cone-cylinder targets under different micro-motions. Table 6 presents the quantitative discrimination results for various micro-motion types using different representation methods under SNR = 10 dB. Compared to VA and RPRG, we can find that STSR achieves higher discrimination accuracy for most micro-motion forms due to improved separability in the TFFR space and reduced association errors at intersections. It is worth noting that the TF projection of the TFFR representation also yields improved performance, thanks to the enhanced m-D frequency estimation accuracy provided by the three-dimensional TFFR representation. This demonstrates the effectiveness of our proposed method, particularly for complex structural targets.

6.4. Summary

In this subsection, we evaluated the proposed micro-motion identification method through comprehensive experiments. These experiments encompassed two types of targets, three forms of micro-motions, and three test sets. The results highlight the separability of signal components within the three-dimensional TFFR space. Compared to the overlapped components in the TF domain, these components manifest as non-intersecting spatial trajectories with time-varying amplitudes, facilitating the extraction and association of m-D ridges. In comparison to traditional two-dimensional representations, the quantitative results demonstrate the considerable efficacy and generalization ability of the TFFR representation in scatterer-level micro-motion discrimination. Moreover, the identification accuracy achieved by the STSR method shows robustness against various noise conditions. This demonstrates the potential of this proposed method in effectively discriminating micro-motion forms for various types and shapes of targets.

7. Conclusions and Discussion

This paper proposed a novel scatterer-level TFFR representation for micro-motion discrimination, considering that traditional two-dimensional representation has limitations on representation accuracy and the resolution of multiple components. In addition, the micro-Doppler signatures extracted from the TF images are redundant and lack interpretability and universality due to the restrictions of merely considering the overall properties of the targets. In this paper, we built a general modulation model operating in the TFFR domain for radar targets, enlarging the micro-motion identification methods class. Compared to the TF and TFR representation, the micro-motion signal components exhibited special spatial and signature separability based on scatterer-level TFFR representation. The probability of intersection for different spatial trajectories was decreased, which appeared separated and non-crossed in the three-dimensional TFFR space. Combined with the TFFR modulation properties, short-time sparse representation was adopted to extract the spatial trajectories with improved resolutions, and micro-motion identification was then achieved by calculating the global minimum association error. The experimental results indicate that this proposed method can achieve accurate and robust discrimination across various SNR conditions and exhibit good generalization ability for different targets, outperforming traditional two-dimensional representations.
In this study, we noticed that introducing the frequency rate enhances the performance of micro-motion form identification but at the cost of increased computing time. To address this issue, our upcoming research will integrate advanced convex optimization methods to reduce the algorithm’s computational complexity, enabling its application in real-world systems. Moreover, in real-world situations, due to electromagnetic interference and atmosphere turbulence, the radar echoes of space targets are incomplete, with missing samples and phase errors, which lead to poor micro-motion signatures. Therefore, our subsequent research will utilize the compressed sensing theory to acquire a more concentrated TFFR representation.

Author Contributions

Conceptualization, H.Z. and W.Z.; methodology, H.Z.; software, H.Z.; validation, H.Z., W.Z. and W.Y.; formal analysis, H.Z. and W.Z.; investigation, S.Y.; resources, Y.L.; data curation, W.Z.; writing—original draft preparation, H.Z.; writing—review and editing, W.Z. and W.Y.; visualization, H.Z.; supervision, S.Y.; project administration, Y.L.; funding acquisition, W.Z. and Y.L. All authors have read and agreed to the published version of the manuscript.

Funding

This work was supported in part by the National Natural Science Foundation of China under Grant 61901487, Grant 61871384 and Grant 61921001, in part by the Natural Science Foundation of Hunan Province under Grant 2021JJ40699 and Grant 2021JJ20056, and in part by the China Postdoctoral Science Foundation under Grant 2021TQ0084.

Data Availability Statement

Not applicable.

Conflicts of Interest

The authors declare no conflict of interest.

Appendix A

To calculate the radial distance between the radar and scattering center for various micro-motion forms, we provide the corresponding rotation matrix. According to Rodrigues’s rotation formula [41,42], we can derive the coning and initial rotation matrix for precession:
R c ( t ) = I + e ^ c sin ω c t + e ^ c 2 1 cos ω c t = cos ω c t sin ω c t 0 sin ω c t cos ω c t 0 0 0 1 ,
R i n i t = I + e ^ n sin θ c + e ^ n 2 1 cos θ c = 1 0 0 0 cos θ c sin θ c 0 sin θ c cos θ c ,
where  e ^ c  and  e ^ c  denote the skew-symmetric matrix determined by the unit direction vector of the precession axis and initial rotation axis, denoted by
e ^ c = 0 1 0 1 0 0 0 0 0 ,
e ^ n = 0 0 0 0 0 1 0 1 0 .
Similarly, we can obtain the related rotation matrix for the wobble and nutation motions:
R s ( t ) = I + e ^ s sin θ w ( t ) + e ^ s 2 1 cos θ w ( t ) = 1 0 0 0 cos θ w ( t ) sin θ w ( t ) 0 sin θ w ( t ) cos θ w ( t ) ,
R i n i t ( t ; θ ) = I + e ^ n sin θ n ( t ) + e ^ n 2 1 cos θ n ( t ) = 1 0 0 0 cos θ n ( t ) sin θ n ( t ) 0 sin θ n ( t ) cos θ n ( t ) ,
where  e ^ s  represents the skew-symmetric matrix formed by the unit vector of the wobble axis [3,6], expressed as
e ^ s = 0 0 0 0 0 1 0 1 0 .

Appendix B

The simplified coefficients of the radial distance from the scattering center p to the radar in nutation are as follows:
A n 1 = x p sin α sin ν A n 2 = x p sin α cos ν A n 3 = y p sin α sin ν A n 4 = y p sin α cos ν A n 5 = z p sin α sin ν A n 6 = z p sin α cos ν B n 1 = A n 2 + A n 5 θ c + A n 3 4 2 θ c 2 θ s 2 4 B n 2 = A n 1 + A n 6 θ c + A n 4 4 2 θ c 2 θ s 2 4 B n 3 = θ s y p cos α + θ c θ s z p cos α B n 4 = θ s 2 z p cos α 4 B n 5 = A n 5 θ s 2 θ c θ s A n 3 2 B n 6 = A n 6 θ s 2 θ c θ s A n 4 2 B n 7 = θ s 2 A n 3 8 B n 8 = θ s 2 A n 4 8 φ n 1 = tan 1 B n 2 B n 1 φ n 2 = tan 1 B n 6 B n 5 φ n 3 = tan 1 B n 8 B n 7 .

References

  1. Chen, V.C.; Li, F.; Ho, S.S.; Wechsler, H. Micro-Doppler effect in radar: Phenomenon, model, and simulation study. IEEE Trans. Aerosp. Electron. Syst. 2006, 42, 2–21. [Google Scholar] [CrossRef]
  2. Hanif, A.; Muaz, M.; Hasan, A.; Adeel, M. Micro-Doppler based target recognition with radars: A review. IEEE Sens. J. 2022, 22, 2948–2961. [Google Scholar] [CrossRef]
  3. Gao, H.; Xie, L.; Wen, S.; Kuang, Y. Micro-Doppler signature extraction from ballistic target with micro-motions. IEEE Trans. Aerosp. Electron. Syst. 2010, 46, 1969–1982. [Google Scholar] [CrossRef]
  4. Lei, P.; Wang, J.; Sun, J. Analysis of radar micro-Doppler signatures from rigid targets in space based on inertial parameters. IET Radar Sonar Navig. 2011, 5, 93–102. [Google Scholar] [CrossRef]
  5. He, F.; Xiao, Z. Micro-motion modelling and analysis of extended ballistic targets based on inertial parameters. Electron. Lett. 2013, 49, 129–130. [Google Scholar] [CrossRef]
  6. Thayaparan, T.; Abrol, S.; Riseborough, E.; Stankovic, L.; Lamothe, D.; Duff, G. Analysis of radar micro-Doppler signatures from experimental helicopter and human data. IET Radar Sonar Navig. 2007, 1, 289–299. [Google Scholar] [CrossRef]
  7. Chen, V.C. Detection and analysis of human motion by radar. In Proceedings of the 2008 IEEE Radar Conference, Rome, Italy, 26–30 May 2008; pp. 1–4. [Google Scholar]
  8. Cohen, L. Time-Frequency Analysis; Prentice Hall: Hoboken, NJ, USA, 1995; Volume 778. [Google Scholar]
  9. Djurović, I.; Stanković, L.J. XWD-algorithm for the instantaneous frequency estimation revisited: Statistical analysis. Signal Process. 2014, 94, 642–649. [Google Scholar] [CrossRef]
  10. Wang, Y.; Wu, X.; Li, W.; Li, Z.; Zhang, Y.; Zhou, J. Analysis of micro-Doppler signatures of vibration targets using EMD and SPWVD. Neurocomputing 2016, 171, 48–56. [Google Scholar] [CrossRef]
  11. O’shea, P. A new technique for instantaneous frequency rate estimation. IEEE Signal Process. Lett. 2002, 9, 251–252. [Google Scholar] [CrossRef]
  12. O’shea, P. A fast algorithm for estimating the parameters of a quadratic FM signal. IEEE Trans. Signal Process. 2004, 52, 385–393. [Google Scholar] [CrossRef]
  13. Zuo, L.; Li, M.; Liu, Z.; Ma, L. A high-resolution time-frequency rate representation and the cross-term suppression. IEEE Trans. Signal Process. 2016, 64, 2463–2474. [Google Scholar] [CrossRef]
  14. Abeysekera, S.S. Time-frequency and time-frequency-rate representations using the cross quadratic spectrum. In Proceedings of the IEEE 2013 Tencon-Spring, Sydney, Australia, 17–19 April 2013; pp. 500–504. [Google Scholar]
  15. Zhu, X.; Yang, H.; Zhang, Z.; Gao, J.; Liu, N. Frequency-chirprate reassignment. Digit. Signal Process. 2020, 104, 102783. [Google Scholar] [CrossRef]
  16. Zhu, X.; Zhang, Z.; Gao, J. Three-dimension extracting transform. Signal Process. 2021, 179, 107830. [Google Scholar] [CrossRef]
  17. Lei, P.; Wang, J.; Guo, P.; Cai, D. Automatic classification of radar targets with micro-motions using entropy segmentation and time-frequency features. AEU-Int. J. Electron. Commun. 2011, 65, 806–813. [Google Scholar] [CrossRef]
  18. Du, L.; Li, L.; Wang, B.; Xiao, J. Micro-Doppler feature extraction based on time-frequency spectrogram for ground moving targets classification with low-resolution radar. IEEE Sens. J. 2016, 16, 3756–3763. [Google Scholar] [CrossRef]
  19. Persico, A.R.; Clemente, C.; Gaglione, D.; Ilioudis, C.V.; Cao, J.; Pallotta, L.; De Maio, A.; Proudler, I.; Soraghan, J.J. On model, algorithms, and experiment for micro-Doppler-based recognition of ballistic targets. IEEE Trans. Aerosp. Electron. Syst. 2017, 53, 1088–1108. [Google Scholar] [CrossRef]
  20. Persico, A.R.; Ilioudis, C.V.; Clemente, C.; Soraghan, J.J. Novel classification algorithm for ballistic target based on HRRP frame. IEEE Trans. Aerosp. Electron. Syst. 2019, 55, 3168–3189. [Google Scholar] [CrossRef]
  21. Kim, Y.; Moon, T. Human Detection and Activity Classification Based on Micro-Doppler Signatures Using Deep Convolutional Neural Networks. IEEE Geosci. Remote Sens. Lett. 2016, 13, 8–12. [Google Scholar] [CrossRef]
  22. Wang, S.; Li, M.; Yang, T.; Ai, X.; Liu, J.; Andriulli, F.P.; Ding, D. Cone-Shaped Space Target Inertia Characteristics Identification by Deep Learning with Compressed Dataset. IEEE Trans. Antennas Propag. 2022, 70, 5217–5226. [Google Scholar] [CrossRef]
  23. Tian, X.; Bai, X.; Xue, R.; Qin, R.; Zhou, F. Fusion recognition of space targets with micromotion. IEEE Trans. Aerosp. Electron. Syst. 2022, 58, 3116–3125. [Google Scholar] [CrossRef]
  24. Yang, L.; Zhang, W.; Jiang, W. Recognition of Ballistic Targets by Fusing Micro-Motion Features with Networks. Remote Sens. 2022, 14, 5678. [Google Scholar] [CrossRef]
  25. Zhao, Y.; Su, Y. The extraction of micro-Doppler signal with EMD algorithm for radar-based small UAVs’ detection. IEEE Trans. Instrum. Meas. 2019, 69, 929–940. [Google Scholar] [CrossRef]
  26. Dragomiretskiy, K.; Zosso, D. Variational Mode Decomposition. IEEE Trans. Signal Process. 2014, 62, 531–544. [Google Scholar] [CrossRef]
  27. Zhao, S.; Niu, J.; Li, X.; Qiao, C. Improved HHT and its application in narrowband radar imaging for precession cone-shaped targets. J. Syst. Eng. Electron. 2014, 25, 977–986. [Google Scholar] [CrossRef]
  28. Chen, S.; Peng, Z.; Yang, Y.; Dong, X.; Zhang, W. Intrinsic chirp component decomposition by using Fourier series representation. Signal Process. 2017, 137, 319–327. [Google Scholar] [CrossRef]
  29. Stanković, L.; Djurović, I.; Stanković, S.; Simeunović, M.; Djukanović, S.; Daković, M. Instantaneous frequency in time–frequency analysis: Enhanced concepts and performance of estimation algorithms. Digit. Signal Process. 2014, 35, 1–13. [Google Scholar] [CrossRef]
  30. Li, P.; Zhang, Q.H. IF estimation of overlapped multicomponent signals based on viterbi algorithm. Circuits Syst. Signal Process. 2020, 39, 3105–3124. [Google Scholar] [CrossRef]
  31. Chen, S.; Dong, X.; Xing, G.; Peng, Z.; Zhang, W.; Meng, G. Separation of overlapped non-stationary signals by ridge path regrouping and intrinsic chirp component decomposition. IEEE Sens. J. 2017, 17, 5994–6005. [Google Scholar] [CrossRef]
  32. Peng, Y.; Ding, Y.; Zhang, J.; Jin, B.; Chen, Y. Target Trajectory Estimation Algorithm Based on Time-Frequency Enhancement. IEEE Trans. Instrum. Meas. 2022, 72, 1–7. [Google Scholar] [CrossRef]
  33. Li, P.; Wang, D.C.; Chen, J.L. Parameter estimation for micro-Doppler signals based on cubic phase function. Signal Image Video Process. 2013, 7, 1239–1249. [Google Scholar] [CrossRef]
  34. Serbes, A.; Aldimashki, O. A fast and accurate chirp rate estimation algorithm based on the fractional Fourier transform. In Proceedings of the 2017 25th European Signal Processing Conference (EUSIPCO), Kos, Greece, 28 August–2 September 2017; pp. 1105–1109. [Google Scholar]
  35. Li, D.; Zhan, M.; Zhang, X.; Fang, Z.; Liu, H. ISAR imaging of nonuniformly rotating target based on the multicomponent CPS model under low SNR environment. IEEE Trans. Aerosp. Electron. Syst. 2017, 53, 1119–1135. [Google Scholar] [CrossRef]
  36. Li, L.; Han, N.; Jiang, Q.; Chui, C.K. A chirplet transform-based mode retrieval method for multicomponent signals with crossover instantaneous frequencies. Digit. Signal Process. 2022, 120, 103262. [Google Scholar] [CrossRef]
  37. Zhang, W.; Fu, Y.; Li, Y. Sparse time-frequency-frequency-rate representation for multicomponent nonstationary signal analysis. In Proceedings of the 2018 26th European Signal Processing Conference (EUSIPCO), Rome, Italy, 3–7 September 2018; pp. 717–721. [Google Scholar]
  38. Ding, C.; Hong, H.; Zou, Y.; Chu, H.; Zhu, X.; Fioranelli, F.; Le Kernec, J.; Li, C. Continuous human motion recognition with a dynamic range-Doppler trajectory method based on FMCW radar. IEEE Trans. Geosci. Remote Sens. 2019, 57, 6821–6831. [Google Scholar] [CrossRef]
  39. Liu, L.; McLernon, D.; Ghogho, M.; Hu, W.; Huang, J. Ballistic missile detection via micro-Doppler frequency estimation from radar return. Digit. Signal Process. 2012, 22, 87–95. [Google Scholar] [CrossRef]
  40. Ma, L.; Liu, J.; Wang, T.; Li, Y.; Wang, X. The micro-Doppler character of sliding-type scattering center on rotationally symmetric target. Sci. China Ser. F Inf. Sci. 2010, 53, 1–18. [Google Scholar]
  41. Murray, R.M.; Li, Z.; Sastry, S.S. A mathematical Introduction to Robotic Manipulation; CRC Press: Boca Raton, FL, USA, 2017. [Google Scholar]
  42. Bai, X.; Bao, Z. High-Resolution 3D Imaging of Precession Cone-Shaped Targets. IEEE Trans. Antennas Propag. 2014, 62, 4209–4219. [Google Scholar] [CrossRef]
  43. Meignen, S.; Pham, D.H.; McLaughlin, S. On demodulation, ridge detection, and synchrosqueezing for multicomponent signals. IEEE Trans. Signal Process. 2017, 65, 2093–2103. [Google Scholar] [CrossRef]
  44. Van der Maaten, L.; Hinton, G. Visualizing data using t-SNE. J. Mach. Learn. Res. 2008, 9, 11. [Google Scholar]
  45. Shi, X.; Zhou, F.; Tao, M.; Zhang, Z. Human movements separation based on principle component analysis. IEEE Sens. J. 2015, 16, 2017–2027. [Google Scholar] [CrossRef]
  46. Zhang, W.; Fu, Y. GLRT detection of micromotion targets for the multichannel SAR-GMTI system. IEEE Geosci. Remote Sens. Lett. 2018, 16, 60–64. [Google Scholar] [CrossRef]
  47. Kumar, M.; Kelly, P.K. Non-Linear Signal Processing methods for UAV detections from a Multi-function X-band Radar. Drones 2023, 7, 251. [Google Scholar] [CrossRef]
Figure 1. Geometry of the space cone-shaped target with micro-motions. (a) Precession. (b) Wobble. (c) Nutation.
Remotesensing 15 04917 g001
Figure 2. Modulation laws for typical micro-motion forms.
Remotesensing 15 04917 g002
Figure 3. Approximated and simulated micro-Doppler signatures induced by micro-motion dynamics. (a) Precession. (b) Wobble. (c) Nutation.
Remotesensing 15 04917 g003
Figure 4. Variation of the RMSE with  θ c  and  θ s .
Remotesensing 15 04917 g004
Figure 5. Minimum trajectory distance of scatterers for typical micro-motion forms. (a) Precession. (b) Wobble. (c) Nutation.
Remotesensing 15 04917 g005
Figure 6. Example of two overlapped components in wobble motion. (a) TF representation. (b) TFR representation. (c) TFFR representation.
Remotesensing 15 04917 g006
Figure 7. Feature distribution for different representation methods. (a) TF representation. (b) TFFR representation.
Remotesensing 15 04917 g007
Figure 8. Flowchart of TFFR modulation-based micro-motion identification.
Remotesensing 15 04917 g008
Figure 9. Simulated radar echo and component extraction results of space cone-shaped target. (a) STFT of the noisy signal (SNR = 15 dB). (b) Result by VA. (c) Result by RPRG. (d) Result by STSR.
Remotesensing 15 04917 g009
Figure 10. Identification accuracy of different representations versus SNR.
Remotesensing 15 04917 g010
Figure 11. Identification results with SNR = 0 dB. (a) IF trajectory identification. (b) IFR trajectory identification.
Remotesensing 15 04917 g011
Figure 12. Identification accuracy for TF, TFR, and TFFR representations.
Remotesensing 15 04917 g012
Figure 13. Geometric model and static RCS characteristics of space cone-shaped target. (a) 3D geometric model. (b) RCS versus azimuth scanning angle.
Remotesensing 15 04917 g013
Figure 14. Synthesized radar echo and component extraction results of space cone-shaped target. (a) STFT of the radar echo (SNR = 10 dB). (b) TFFR representation by STSR. (c) TF projection by STSR.
Remotesensing 15 04917 g014
Figure 15. Geometry of the radar and space cone-cylinder target with micro-motions.
Remotesensing 15 04917 g015
Figure 16. Simulated radar echo and component extraction results of space cone–cylinder target. (a) STFT of the radar echo (SNR = 10 dB). (b) Result by VA. (c) Result by RPRG. (d) Result by STSR.
Remotesensing 15 04917 g016
Table 1. Micro-motion parameter settings.
FormConing Fre.
(Hz)
Coning Ang.
(°)
Wobble Fre.
(Hz)
Wobble Ang.
(°)
Precession1.0–1.510–15
Wobble1.0–1.510–15
Nutation1.0–1.510–151.0–1.56–9
Table 2. Radar parameter settings.
ParameterValueParameterValue
Carrier frequency10 GHzx-coordinate(−1, 1) m
Sampling frequency1024 Hzy-coordinate(−1, 1) m
Observation time1 sz-coordinate(−1, 1) m
Azimuth angle270°Elevation angle(20, 45)°
Table 3. Parameters of sequence templates in different micro-motions.
FormPrecessionWobbleNutation
Coning fre. (Hz)1.0:0.05:1.5-1.0:0.1:1.5
Wobble fre. (Hz)-1.0:0.05:1.51.0:0.1:1.5
Coning ang. (°)10:0.5:15-10:1:15
Wobble ang. (°)-10:0.5:156:1:9
Elevation ang. (°)20:2:4520:2:4520:5:45
Table 4. Experimental results with different representation methods. The best results are highlighted in bold.
MethodsAccuracyAverage
PrecessionWobbleNutationAccuracy
VA (TF)50.6082.4099.0077.33
RPRG (TF)69.4080.8098.6082.93
STSR (TF)92.8089.2093.6091.87
STSR (TFFR)94.0091.2096.0093.73
Table 5. Experimental results of space cone–shaped target for different representation methods. The best results are highlighted in bold.
SNR (dB)Average Accuracy
VA (TF)RPRG (TF)STSR (TF)STSR (TFFR)
1083.0080.1792.6794.17
581.1777.0089.5092.17
380.6771.5083.5086.00
Table 6. Experimental results of space cone–cylinder target for different representation methods. The best results are highlighted in bold.
MethodsAccuracyAverage
PrecessionWobbleNutationAccuracy
VA (TF)83.0066.0096.0081.67
RPRG (TF)78.0074.5097.5083.33
STSR (TF)85.0086.0095.0088.67
STSR (TFFR)86.0095.0097.0092.67
Disclaimer/Publisher’s Note: The statements, opinions and data contained in all publications are solely those of the individual author(s) and contributor(s) and not of MDPI and/or the editor(s). MDPI and/or the editor(s) disclaim responsibility for any injury to people or property resulting from any ideas, methods, instructions or products referred to in the content.

