Article

Inversion of the Lunar Subsurface Rock Abundance Using CE-2 Microwave Brightness Temperature Data

1
State Key Laboratory of Lunar and Planetary Science, Macau University of Science and Technology, Macau 999078, China
2
School of Geospatial Engineering and Science, Sun Yat-Sen University, Zhuhai 519082, China
3
Key Laboratory of Natural Resources Monitoring in Tropical and Subtropical Area of South China, Ministry of Natural Resources, Zhuhai 519082, China
4
School of Information and Communication, National University of Defense Technology, Wuhan 430000, China
5
Hubei Key Laboratory for High Efficiency Utilization of Solar Energy and Operation Control of Energy Storage System, Hubei University of Technology, Wuhan 430068, China
*
Author to whom correspondence should be addressed.
Remote Sens. 2023, 15(20), 4895; https://doi.org/10.3390/rs15204895
Submission received: 21 July 2023 / Revised: 22 August 2023 / Accepted: 29 September 2023 / Published: 10 October 2023
(This article belongs to the Special Issue Future of Lunar Exploration)

Abstract

:
The rock strongly affects the surface and subsurface temperature due to its different thermophysical properties compared to the lunar regolith. The brightness temperature (TB) data observed by Chang’E-1 (CE-1) and Chang’E-2 (CE-2) microwave radiometers (MRM) give us a chance to retrieve the lunar subsurface rock abundance (RA). In this paper, a thermal conductivity model with an undetermined parameter β of the mixture has been employed to estimate the physical temperature profile of the mixed layer (rock and regolith). Parameter β and the physical temperature profile of the mixed layer are constrained by the Diviner Channel 7 observations. Then, the subsurface RA on the 16 large (Diameter > 20 km) Copernican-age craters of the Moon is extracted from the average nighttime TB of the CE-2 37 GHz channel based on our previous rocky TB model. Two conclusions can be derived from the results: (1) the subsurface RA values are usually greater than the surface RA values retrieved from Diviner observations of the studied craters; (2) the spatial distribution of subsurface RA extracted from CE-2 MRM data is not necessarily consistent with the surface RA detected by Diviner data. For example, there are similar RA spatial distributions on both the surface and subsurface in Giordano Bruno, Necho, and Aristarchus craters. However, the distribution of subsurface RA is obviously different from that of surface RA for Copernicus, Ohm, Sharonov, and Tycho craters.

1. Introduction

Rocks are one of the predominant microrelief forms of the lunar surface. Understanding the distribution of rock is significant for the following reasons: (1) The rocks on the lunar surface are potential hazards to the lander or rover [1,2]. Therefore, the knowledge of the distribution of rock abundance (RA) on the lunar surface can help us to determine a suitable landing site in the future. (2) The relationship between rocks and craters’ impact melt and ejecta and crater morphology implies that the distribution of the rocks on the lunar surface may include the potential formation and evolution information of the lunar crust layer [3,4,5]. (3) The correlation between RA on the lunar surface and crater model ages provides a new method for dating young lunar craters [6,7]. (4) The rocks on the lunar surface and subsurface can provide a good understanding of the lunar thermal evolution [8,9].
To date, there have been many estimations of lunar rocks using both qualitative and quantitative methods. A lot of data are used to estimate the lunar rocks in a qualitative way, including thermal infrared data [5,8,10,11], optical data [3,4,5,12,13], and radar data [14,15]. Meanwhile, thermal infrared data [8] and optical data [12] can also be used to quantitatively constrain the lunar rocks. As far as we know, the first global map of surface RA, with the meter and larger size, have been made using Diviner infrared thanks to the large thermal emission differences between lunar regolith and rocks. At present, we know little about the subsurface RA of the Moon. The microwave TBs of the global Moon, detected by the CE-1 and CE-2 MRMs at four channels: 3, 7.8, 19.35, and 37 GHz [1], give us a good chance to constrain the subsurface RA due to their longer penetration compared to thermal infrared data. Using the differences in both the dielectric loss and the thermal properties of the lunar rocks and regolith, the subsurface RA could be quantitatively constrained by the microwave TBs [16,17]. Wei et al. [18] recently retrieved the subsurface RA at several craters from the CE-2 TB data by combing 7.8 GHz and 19.35 GHz channels. In their work, the same mixture model as that of Hu et al. [17] is used to calculate the mixture’s thermal physical properties, including density, thermal conductivity, and heat capacity at all depths.
The rocks are proven to have a significant influence on the lunar TBs [9,16,17,19,20,21]. Our previous rock model, proposed by Hu et al. [17], is employed in this paper, including the rock effects on both the physical temperature and the dielectric loss of the lunar subsurface layers. In addition, a thermal conductivity model with an undetermined parameter β of the mixture was employed to estimate the physical temperature profile of the mixed layer (rock and regolith). The data applied in this paper are the level 2C TB data after pre-calibrations collected from CE-2. Their calibration and a discussion of their accuracy can be found in [22,23,24,25,26,27,28]. Recent recalibration works [26,27] suggest that the pre-calibrated TB data at 37 GHz can well fit both the infrared and TB models and the correction is smaller than other channels.
The inversion algorithm is another factor that affects the inversion results. Meng [29] inverted the thickness of the lunar regolith using the Backpropagation Neural Network method. However, the training data selection is a difficult problem due as there are few samples for network training. The Root Mean Square (RMS) algorithm [8,30] is usually used to solve the retrieved problem. The first map of global surface RA distribution was obtained using this algorithm. Fa et al. [30] also used this algorithm to estimate the thickness of the lunar regolith. Therefore, the RMS method is employed in this work.
In this paper, we first analyzed the effects of the parameter β on the surface temperature and constrained the best fitting value of β using the observed data of the seventh channel of Diviner. Then, we discussed the effect of RA on surface temperature and microwave TB based on this best-fitting value of β . Finally, we extracted the subsurface RA values on the 16 large (Diameter > 20 km) Copernican-age craters of the Moon from the CE-2 37 GHz midnight TB. We also conducted a simple uncertainty analysis.

2. Data Sets

The Diviner experiment is a nadir-pointed, push broom scanning radiometer with two spectral channels for reflected solar radiation, each from 0.35 to 2.8 μm, and seven channels for infrared emission, spanning from 7.55 to 400 μm [31]. It is designed to globally map surface albedo and temperature over the lunar day and year. The rock-free regolith surface temperature was estimated using the algorithm described by Bandfield et al. [8]. The data were collected from 5 July 2009 to 10 October 2016. Data were restricted to local times of from 1930 to 0530, with solar incidence angles greater than 90 degrees, with a spatial resolution of 128 pixels per degree (ppd). The Diviner Lunar Radiometer Experiment Reduced Data Records (RDR) data at a single channel (T7, 25–50 μm) were used to constrain the surface boundary condition and determine the parameter β due to its high signal-to-noise ratio over the full range of equatorial surface temperatures [32].
The Diviner’s measurements were also used to infer surface RA. The global map of surface RA of meter size and larger was drawn by Bandfield et al. [8] with the Diviner measurements. The global surface RA data have a spatial resolution of 128 ppd bin size (~125–250 m/pixel). Most of the average surface RA values within the ± 60 ° latitudes are smaller than 0.01. In some fresh craters, the average surface RA values are greater than 0.01, such as the Giordano Bruno crater, which has an average surface RA of up to 0.1.
The iron (FeO) and titanium (TiO2) contents on the lunar surface affect the microwave TB by changing the dielectric loss tangent of the materials in the mixed layers [33]. They can be obtained from returned samples or remote sensing analysis. They have also been derived from the gamma-ray wavelength range of the lunar prospector data with a spatial resolution of 150 km × 150 km [34]. Recently, Sato et al. [35] derived a new TiO2 map based on the near-global Wide Angle Camera (WAC) aboard the LRO multispectral mosaic. In this work, the used lunar surface global iron (FeO) and titanium (TiO2) contents map (100 m/pixel) were derived by Lucey et al. [36,37,38,39] from Clementine ultraviolet-visible data.
The level 2C MRM data after pre-calibrations, collected from the CE-1 and CE-2, are published in the Lunar and Planetary Data Release System. A detailed description of data accuracy and data calibration can be found in [25,26,27,28,40,41]. The average normalized CE-2’s 37 GHz TBs at midnight (removing the lunar phase effect) is used to constrain the subsurface RA, which has a spatial resolution of 5 pixels per degree (ppd).

3. Models

Here, we treat each location of the Moon as a discrete vertical column of a mixture layer consisting of rock and regolith. The microwave TB of each vertical column strongly depends on its physical temperature profile and dielectric loss characteristics. Physical temperature is significantly affected by thermal inertia at all depths. Thermal inertia is a key quantity that is widely used in planetary science because it is related to the intrinsic physical properties of surface and subsurface materials. In general, the rock has a larger thermal inertia and loss tangent than the lunar soil (regolith and dust). In this work, we use “subsurface RA” to express the average volumetric fraction of rocks or rock-like materials within the column of each location detected by CE-2 MRM data. The subsurface RA can be extracted from CE-2 MRM data by minimizing the differences between simulated microwave TB and the observed TB of CE-2 37 GHz. Here, the scattering effect of the meter size and larger rock fragments could be neglected due to the wavelength (millimeter scale) of the 37 GHz channel being small [16].
The one-dimensional heat conduction model employed to calculate the physical temperature profile is described in this section. The surface energy flux and albedo affected the surface temperature are presented. The mixed models of physical properties are also described. As we do not have precise estimations of the lunar regolith thickness for Copernican-age craters, the maximum penetration depth d 0 of 37 GHz into the mixed layer is about 0.5 m. This can be estimated from the permittivity of the mixed layer with the formula d 0 = λ ε m i x / ε m i x , where λ is the wavelength (m), ε m i x and ε m i x denote the real and imaginary part of the permittivity in the mixed layers, respectively. Therefore, we can simply assume the thickness of the mixed layer is about 1 m, which is deep enough to cover the penetration depth.
The rock TB model proposed by Hu et al. [17] is used to calculate the microwave TB of each column. In order to avoid repetitive descriptions, the multilayer microwave radiation transfer model is not described. Here, we only present the loss tangent models of the lunar regolith and rocks because they are the main model influence on microwave TB calculation.

3.1. Heat Conduction Model

The temperature profile can be obtained using the finite difference method to solve the 1-D time-dependent heat conduction equation [42,43,44,45]:
ρ x , T C x , T T t = x K x , T T x
where x (m) and t (h) stand for depth and time; ρ ( x , T ) , C ( x , T ) , and K ( x , T ) stand for the density ( g · c m 3 ), heat capacity ( W · g 1 · K 1 ), and thermal conductivity ( W · m 1 · K 1 ) of the material, respectively. They are the functions of the lunar physical temperature T ( K ) and vertical variable of depth x (m). The upper boundary condition depends on the energy on the lunar surface, which can be written as:
K s T x x = 0 + Q s = ε σ B T s 4
where K s ( T ) / ( x ) is the heat energy transmitted from the surface to the subsurface, T s , ε = 0.95 , and σ B ( W · m 2 · K 4 ) are the surface temperature, the infrared emissivity of lunar regolith, and the Stefan–Boltzmann constant, Q s = 1 A F is the surface energy flux, which is equal to the solar heating rate, and F   ( W · m 2 ) is the incident solar flux, which can be written as [9,17,44,46,47]
F t = S s u n 4 π · R 2 s i n ϕ s i n δ + c o s ϕ c o s δ cos h
where S s u n = 3.846 × 10 26 W is the solar luminosity [48], ϕ is latitude, δ is the solar declination angle, which is usually set as 0 [49], and the hour angle is h = 2 π t / P , with P as the length of the synodic day. R is the distance between Sun and Moon, which varies over time and has the following form
R = r 1 · cos 2 π t 29.53 × 12 + π + r 2
where r 1 = 3.85 × 10 8 m, r 2 = 1.496 × 10 11 m, they are the distance from the Moon and Sun to Earth, respectively. The dependence between albedo and solar incidence angle θ is given by [9,19,32]
A θ = A 0 + a θ π / 4 3 + b θ π / 2 8
where A 0 = 0.12 is the normal bolometric Bond albedo; coefficients a and b have a Hayne’s value of a = 0.06 and b = 0.25 . At the lower boundary d , the condition can be written as:
T x x = d = Q K d 1
where Q   W · m 2 is the internal lunar heat source; K d and T / x x = d are the thermal conductivity at x = d , which is sufficiently deep below the subsurface, and the temperature gradient, respectively.

3.2. Physical Parameters of the Mixed Layer

The relationship between the density ρ , subsurface R A , and depth x can be written as [17]:
ρ m i x x = ρ d ρ d ρ s e x H   1 R A + R A · ρ r
where ρ m i x represents the mixed density, ( ρ d ρ d ρ s e x H ) is the density of regolith at a depth x m, R A represents the volumetric fraction of rocks at the penetration depth of CE-2 37 GHz, and H = 0.06 (m) is the average H-parameter. ρ s = 1300   k g · m 3 ,   ρ d = 1800   ( k g · m 3 ) , and ρ r = 2940   ( k g · m 3 ) stand for the density of the lunar surface, balance depth, and rocks, respectively, which are obtained from Horai et al. [50]. From their investigation, the heat capacity of rocks can be written as:
C r o c k = α 1 + α 2 T + α 3 T 2 + α 4 T 3
where α 1 = 154.9 ,   α 2 = 4.983 ,   α 3 = 8.207 × 10 3 ,   α 4 = 5.192 × 10 6 , and C r o c k is the average heat capacity of lunar rocks. The depth-dependent heat capacity of the mixed layer has the following forms:
C m i x = c 1 + c 2 T + c 3 T 2 + c 4 T 3 + c 5 T 4 × 1 R A + C r o c k × R A
where C m i x represents the mixed heat capacity of the mixed layer, c 1 + c 2 T + c 3 T 2 + c 4 T 3 + c 5 T 4 is the heat capacity of lunar regolith, and c 1 , c 2 , c 3 , c 4 , and c 5 are equal to −3.6125, 2.7431, 2.3616 × 10 3 , 1.234 × 10 5 , and 8.9093 × 10 9 [9], respectively.
The correlation between the lunar regolith thermal conductivity K r e g , depth, x , and temperature, T can be written as:
K r e g x = K d K d K s e x H + 2.7 K s · ( T x 350 ) 3
where K s = 0.00074 and   K d = 0.0034 are the thermal conductivity of the regolith on the surface and the bottom, respectively [9]. In the work of [17,18], the same linear mixture model as used for density and heat capacity was also used to determine the thermal conductivity of the mixed layer. However, Horai et al. [51] suggested that the mixed thermal conductivity of two-phase materials is nonlinearly mixed. Here, we simplify the mixed layer consisting of two-phase material rock and regolith, and the mixing forms can be expressed as:
K u = K r 1 + 1 R A R A 3 1 / ( 1 r )
K l = K r r + r × R A ( 1 R A ) / 3 + r 1 r
r = K r e g K r
where K u and K l are the theoretical upper and lower bounds, normalized by K r , where K r e g   is the thermal conductivity of regolith, K r = 1.491   ( W · m 1 · K 1 ) is the thermal conductivity of rocks [50]. According to their results, if the two phases are incompletely randomly admixed, the mixed thermal conductivity depends on the degree of random admixing. The mixed thermal conductivity can be expressed as follows:
K m i x = K u × β + K l × 1 β
where β is the mixture weight of rocks in a mixed layer.

3.3. Loss Tangent Model

The loss tangent quantifies the transparency of material to electromagnetic radiation. Low loss tangents indicate very transparent media, while high loss tangents indicate relatively opaque material. Mathematically, the loss tangent is simply a shorthand combination of real, ε , and imaginary, ε , dielectric constants, where t a n δ = ε / ε . The real dielectric constant ( ε ) controls the speed of the electromagnetic waves through the material, while the imaginary dielectric constant ( ε ) dominates energy attenuation.
The loss tangent of materials has been discussed many times [20,33,47,52]. The dielectric loss tangent models of both the mare and highland lunar regolith employed here are derived from Siegler et al. [20]:
t a n δ ¯ m a r e = 10 [ 0.312 ρ 2.65 + T i × ( f 0.0025 0.958 ) ]
t a n δ ¯ h i g h l a n d s = 10 [ 0.312 ρ 3.79 + f 0.069 ]
where the value of w t . % T i O 2 content, T i , is taken from Lucey et al. [39]. According to Siegler, Equation (15)’s fit is only valid at TiO2 values over 2 wt.%; therefore, Equation (16) is used to calculate the loss tangent at the location with a TiO2 smaller than <2 wt.%. To distinguish the regolith and rocks, the real parts of the permittivity for regolith and rocks are ε = 1.871 ρ , ε = 1.919 ρ , respectively. The dielectric loss tangent model of the rock used here is derived from [33]:
t a n δ ¯ r o c k = 10 0.312 ρ 3.26 + 0.038 × T i + F e O
where the value of w t . % F e O content, F e O is also taken from Lucey et al. [39]. According to Hashin et al. [53], the dielectric loss tangent of the mixed layer can be modeled similarly with Equations (11)–(14), where the thermal conductivity is replaced with the corresponding loss tangent.

4. Method

In order to extract the subsurface RA from the CE-2 microwave TB data, the effect of subsurface RA on physical temperature and microwave TB has to be estimated. Before estimating these effects, we have to confirm the most satisfactory mixture weight β . Two regions with a lower and higher surface RA are selected to estimate the best-fitting β value. Then, based on this value, the influence of subsurface RA on physical temperature and microwave TB is estimated. Finally, the subsurface RA can be obtained by minimizing the differences between average simulated TB and the observed TB of CE-2.

4.1. Determination of the Parameter β

To estimate the effect of parameter β on the physical temperature, a vertical uniform RA distribution is assumed at the lunar center ( 0 ° N , 0 ° E ) due to its relatively stable geological background compared to other regions. Here, we suppose a uniform value that is equal to the average surface RA of 0.0027 obtained from Diviner. Figure 1 shows the influence of the parameter β on the modeled surface temperature. We can see that the nighttime surface temperature increases with increasing parameter β , and the surface temperature variation can reach up to 13 K at midnight (local time 0:00) when β increases from 0 to 0.7. To obtain a satisfactory parameter β , the surface temperatures observed by a single channel ( T 7 ,   25 41   μ m ) are selected to constrain due to their high signal-to-noise ratio [32]. We used observations of T 7 at two different regions to determine a general parameter β . The first region is the lunar center ( 0 ± 0.1 ° N , 0 ± 0.1 ° E ), which has a relatively smaller average surface RA value (0.0027). The other region is the CE-3 landing site ( 44.12 ± 0.1 ° N , 340.5 ± 0.1 ° E ), which has a relatively larger surface RA value (0.005).
The RMS method was employed to determine the best-fitting parameter β . We can calculate the RMS of surface temperature between the average observed and the simulated by changing parameter β . Figure 2 compares the nighttime surface temperature between the observed data and the simulated results. We can find that the modeled results matched very well with the observed data. Parameter β is estimated to be small and contain the same number of 6.6 × 10 5 at two different regions. That means that this value could be used to simulate the physical temperature at other regions of the Moon. Furthermore, our simulation shows that the variation in the TB at 37 GHz is far less than 1 K when the β varies from 0 to 0.7. Therefore, we can take the value β = 6.6 × 10 5 to model both the thermal conductivity and loss tangent of the mixed layer in our research.

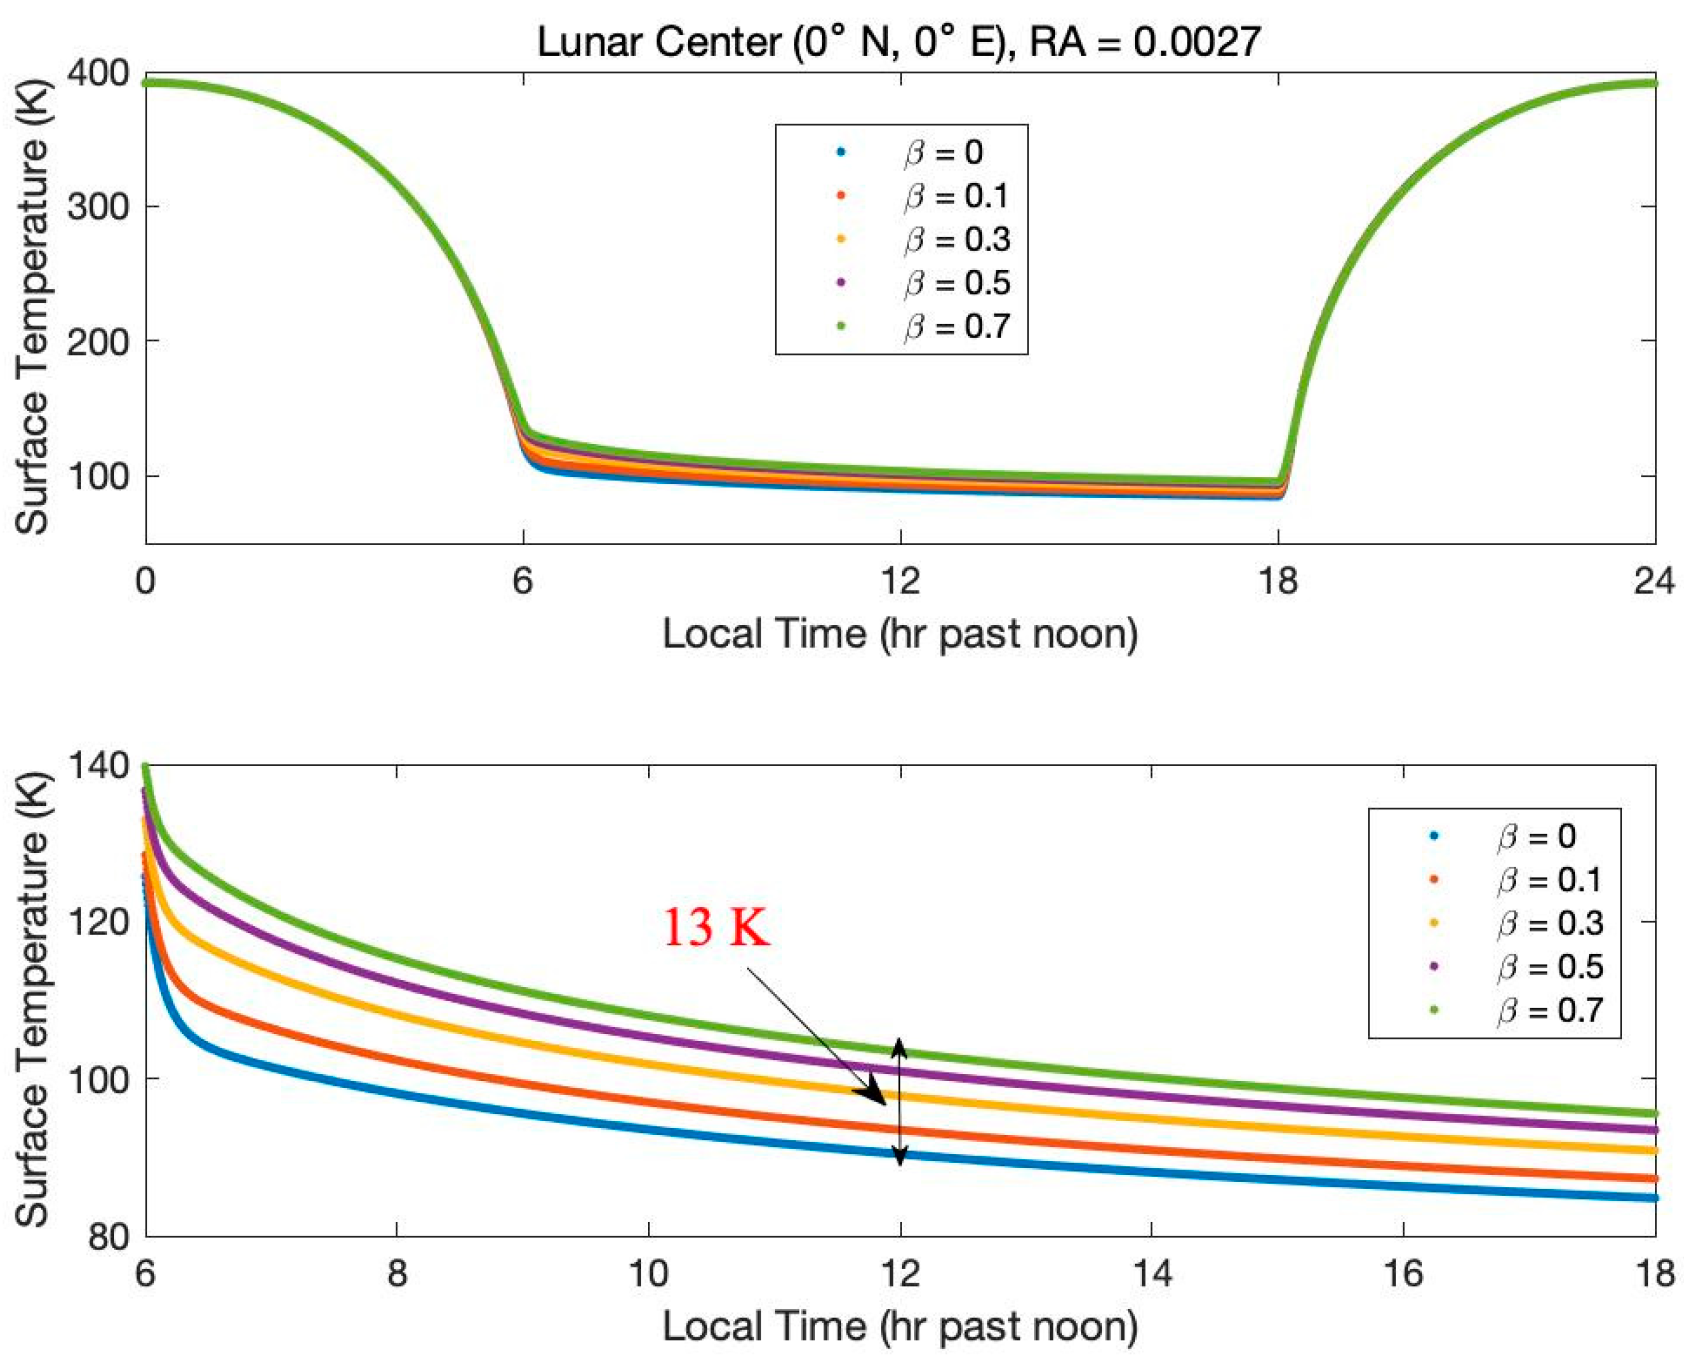
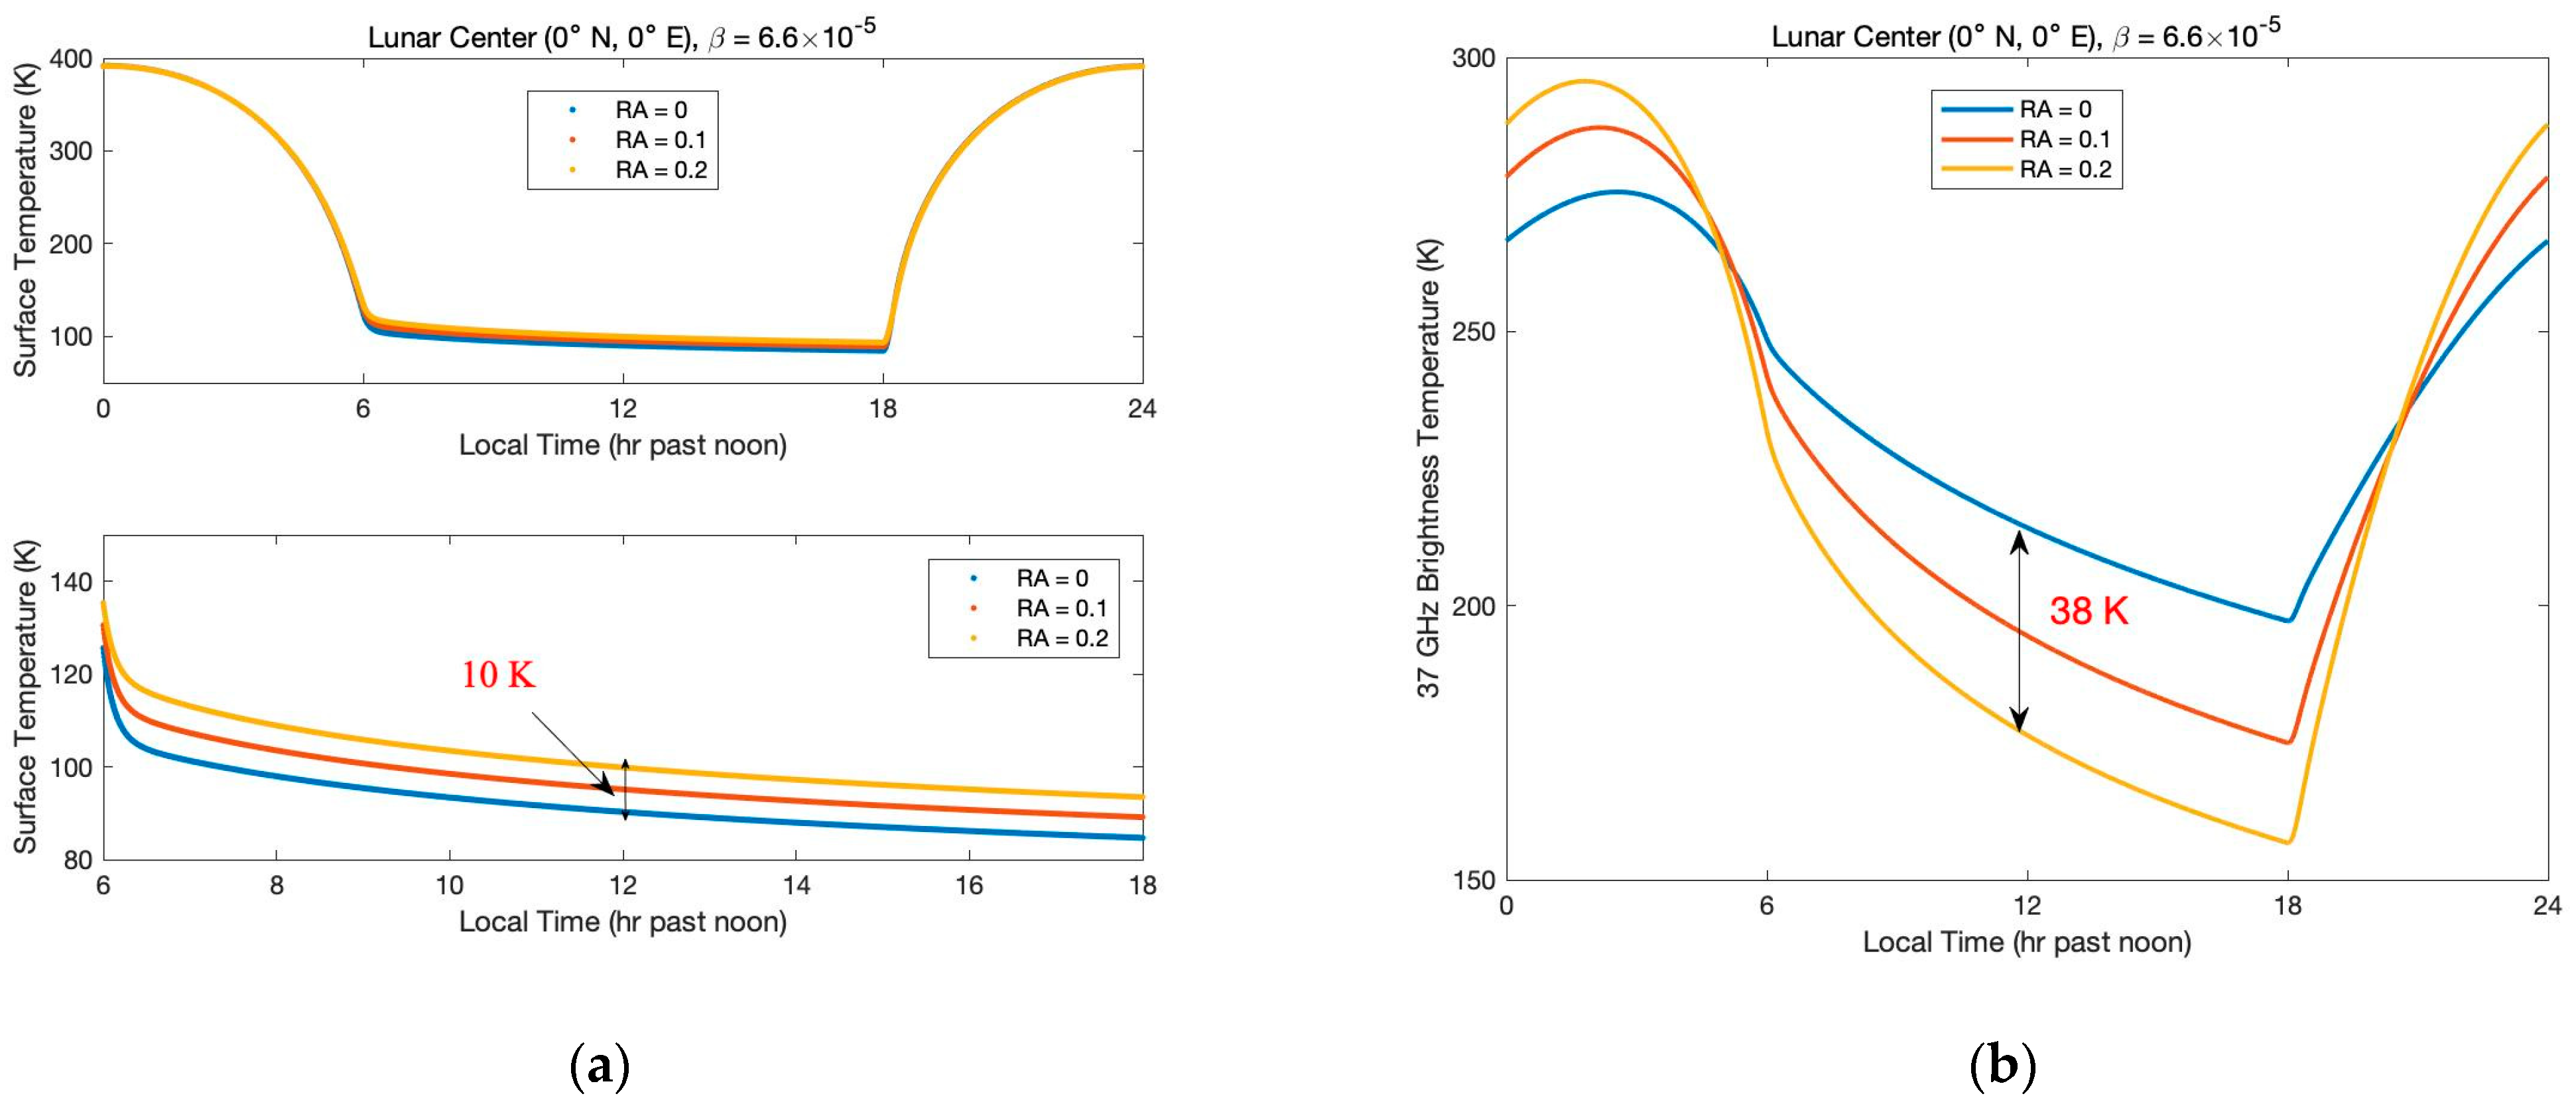
4.2. Effects of Subsurface RA on the Surface Temperature and Microwave TB

Figure 3 shows the effect of the subsurface RA on the surface temperature and 37 GHz microwave TB. Figure 3a shows that the nighttime surface temperature is sensitive to the subsurface rocks, while the daytime temperature is not. In Figure 3a, we can see that the surface temperature increases with increasing subsurface RA, and the variation in nighttime surface temperature can reach up to 10 K at midnight when the subsurface RA increases from 0 to 0.2. However, the subsurface RA has a significant influence on both daytime and nighttime microwave TB. Figure 3b shows the sensitivity of microwave TB at 37 GHz to the subsurface rocks. We can see that the influence of the subsurface rocks on 37 GHz microwave TB changes with time. The nighttime TB value decreases with increasing subsurface RA and the daytime TB value shows the opposite pattern. In addition, the TB variation can reach up to 38 K at midnight when the subsurface RA increases from 0 to 0.2, which is larger than the surface temperature variation of 10 K. This means that the microwave TB is more sensitive to the subsurface rocks compared to the surface temperature.

4.3. Subsurface RA Inversion

Since the influence of the subsurface rocks on TB varies over time, we assume that the midnight effect is equal to the average effect. The microwave TB simulated by the surface RA at the lunar equator ( 0 ° N ,   120 ° E ) shows that the simulated midnight TB value is greater than the average observed TB of CE-2 37 GHz. The TB differences between the simulated and observed CE-2 at midnight can be up to 8 K. From Figure 3b, we can speculate that the RA value detected by CE-2 37 GHz microwave should be greater than that detected by Diviner infrared. Therefore, the average midnight TB observed by CE-2 37 GHz is selected to constrain the best-fit subsurface RA values. The RMS method is employed to estimate the most appropriate subsurface RA, which has the following forms:
Δ T B = 1 N i = 1 N   T B i s R A T B i o 2
where i indicates the i th channel, and N is the total channel number. Here, N = 1 means that only the TB of the 37 GHz channel is chosen for comparison between theoretical T B s and CE-2 observation T B o . The T B o data used here are the average normalized midnight microwave TB of CE-2. By calculating the RMS TB with changing subsurface R A values, the best-fit R A can be obtained until the RMS of Δ T B reaches the minimum. The best-fit subsurface R A value at the lunar equator ( 0 ° N , 120 ° E ) is 0.0676, and the RMS is 3.3 × 10 4 K.

5. Results

The subsurface RA of the 16 large Copernican-aged craters was extracted from the average midnight microwave TBs of the CE-2 37 GHz. Figure 4 presents the locations of all the selected craters. The background mosaic map is the surface RA, retrieved from the Diviner. Table 1 presents the latitude and longitude, diameter, mean surface RA retrieved from Diviner, the inverted average subsurface RA, and the mean RMS values of 16 craters. It can be seen from Table 1 that the maximum average RMS value between simulated and observed TB is 0.027 on the Byrgius A crater, which is small enough compared to the radiometric sensitivity of 0.5 K of CE-2 MRMs. Therefore, we think that the estimated results are reliable. From Table 1, we can also see that the average RA value of the subsurface layer of the crater is greater than the average RA value of the surface at the corresponding location. The Giordano Bruno (GB) crater has a maximum average subsurface RA of 0.2636, and the Sharonov (SH) crater has a minimum average subsurface RA of 0.0274; and the average RMS values at these two craters are 0.001 and 0.008, respectively.
Figure 5 shows the distribution of the subsurface RA of the selected craters. All of the images are the inverse distance weight (IDW) interpolation results produced by ArcMap. The background mosaic images are from the LRO wide-angle camera (WAC). The red color represents the higher subsurface RA, and the green color is the smaller subsurface RA. It can be seen from Figure 5 that the elevated subsurface RA is usually present over the crater’s rims, walls, and floors. In comparison with the distribution of surface RA and subsurface RA between the studied craters, we can see that the abundance distribution of surface rocks is not necessarily the same as that of subsurface rocks. For example, at the Giordano Bruno, Necho, and Aristarchus craters, there are similar RA distributions on both the surface and subsurface. However, there are obviously different distributions of RA at both the surface and subsurface at the Copernicus, Ohm, Sharonov, and Tycho craters. The surface RA at the central peak and the wall corner of Copernicus is larger than that at other places, but the subsurface RA at the south wall is larger than that at other places. The surface RA at the central peak, the north and east wall corner of Ohm is larger than that at other places, but the subsurface RA at the west wall is larger than that at other places. The surface RA at the northeast wall of Sharonov is larger than that at other places, but the subsurface RA at the south and west wall is larger than that at other places; the subsurface RA at the central peak and east wall of Tycho is larger than that at other places, but the subsurface RA at the north wall is larger than that at other places.
According to the analysis of the influence of rocks on the variation trends of surface temperature (Figure 3a) and microwave TB (Figure 3b), theoretically, the surface temperature and microwave TB at night show change conversely with the increase in subsurface RA. This is the reason that the abnormal “hot spots” [54] during a total eclipse on the lunar surface, revealed by infrared scanning images, turned out to be the “cold spots” on the nighttime microwave TB distribution observed by CE-1 and CE-2 MRM [11,55]. Upon inspection of the data distribution of Diviner infrared and CE-2 37 GHz TB of the studied craters, we found that when the “hot spots” in infrared coincide with the “cold spots” in the microwave, and the distribution of RA both on the surface and subsurface is consistent; otherwise, the distribution is inconsistent.
Figure 6 presents the relative distribution of nighttime regolith temperature obtained from the Diviner and nighttime microwave TB of CE-2 37 GHz at the craters where the RA distribution on the surface and subsurface is inconsistent. From Figure 6, we can see that the “hot spots” in the infrared are located at the central peak and wall corner of the Copernicus crater, at the north and east wall corners of the Ohm crater, at the northeast wall corner of the Sharonov crarer, and at the central peak and east wall corners of the Tycho crater. However, the “cold spots” in the microwave are located at the south, southwest, southwest, and north of the Copernicus, Ohm, Sharonov, and Tycho craters, respectively.
The surface RA detected by Diviner is defined by the areal percentage of rock slab in each pixel. According to Wei et al. [18], the sensitivity of the MRM data to the size of the rocks is much smaller than that of the Diviner infrared data. That is, the subsurface RA in our research not only includes the exposed surface rocks at a meter or larger scale detected by Diviner data but also the exposed surface rocks at centimeter scale and buried rocks at a centimeter or larger scale. This indicates that the differences between surface and subsurface RA are mostly caused by the different detection abilities of Diviner and CE MRMs. This conclusion is consistent with that of Ghent et al. [56], that the Diviner RA signature and radar signature are not necessarily consistent. For example, the Diviner RA signature correlates with the radar signature for the Giordano Bruno crater, while it is not correlated with the Copernicus crater.
From Figure 5, we can see that the subsurface RA detected by CE-2 37 GHz MRM data is usually clustered on one side of the impact craters. This distribution trend can also be found in Diviner RA for certain craters, including Giordano Bruno, Necho, and Jackson. In fact, there are two main sources of subsurface rocks detected by CE MRM data in the impact crater: the bedrock that is exposed or buried in situ, and the ejecta deposits sourced from other places. Therefore, this distinct asymmetry spatial distribution of subsurface RA can provide information about rocky ejecta and impact direction [56]. The ejecta reflected by subsurface RA suggest that the impact direction is from the northwest, southwest, and northeast for the Giordano Bruno, Necho, and Jackson craters, respectively. However, the Diviner RA is not consistent with this distribution trend in some craters. For example, the Diviner RA is almost evenly distributed around the floor bounds of Copernicus. In addition, the higher subsurface RA values are located in the south of the crater where the surface RA is relatively smaller. This discrepancy indicates that most of the rocks that lead to a decline in the low microwave TB values in the subsurface are covered by a sufficient depth of insulating regolith to hide them from Diviner’s view [8,56].

6. Discussion

Quantitative maps of subsurface RA at 16 large Copernican-aged craters were generated. Although the RMS between the theoretical and observed TB is small enough, there are still some parameters that affected the inversion results. For example, the measurement uncertainties, CE-2 MRM data, Diviner infrared data, TiO2 and FeO contents, and Apollo sample’s thermal properties, constrain the inversion results. In this section, we will analyze the uncertainties generated by two factors: the H-parameter and the rock’s loss tangent.

6.1. Uncertainty Generated by H-Parameter

The average H-parameter of 0.06 m was used in our simulation, which was obtained from Hayne et al. [9]. According to their research, the H-parameter has a significant influence on the physical temperature. In addition, the H-parameter between nine Copernican-aged impact craters (King, Copernicus, Aristarchus, Jackson, Tycho, Necho, Byrigus A, Moore F, and Giordano Bruno) varies from 0.036 m to 0.063 m, as calculated by H = H 0 t M a 0.1 , with best-fit parameters H 0 = 0.032 m, where the crater age t M a is given in millions of years. Here, we selected the King crater (5 ° N, 120.5 ° E) as a case study to discuss the uncertainty generated by the H-parameter. To highlight the effect of the H-parameter on microwave TB and subsurface RA, we calculated the microwave TB and subsurface RA within H = 0.06 ± 0.024 m.
Figure 7 shows the effect of three different H-parameters on a nighttime microwave TB of 37 GHz, and the inverted subsurface RA varies with an increase in H-parameter. It can be seen from Figure 7 that the midnight microwave TB variation values can reach up to 3 K when the H-parameter varies from 0.036 to 0.084 m, and the nighttime microwave TB increases with increasing H-parameter. In addition, the estimated subsurface RA also increases with increasing H-parameter. Moreover, we can find that when H-parameter varies from 0.036 to 0.084 m, and the inversion subsurface RA has an uncertainty of −0.02/ +0.01.

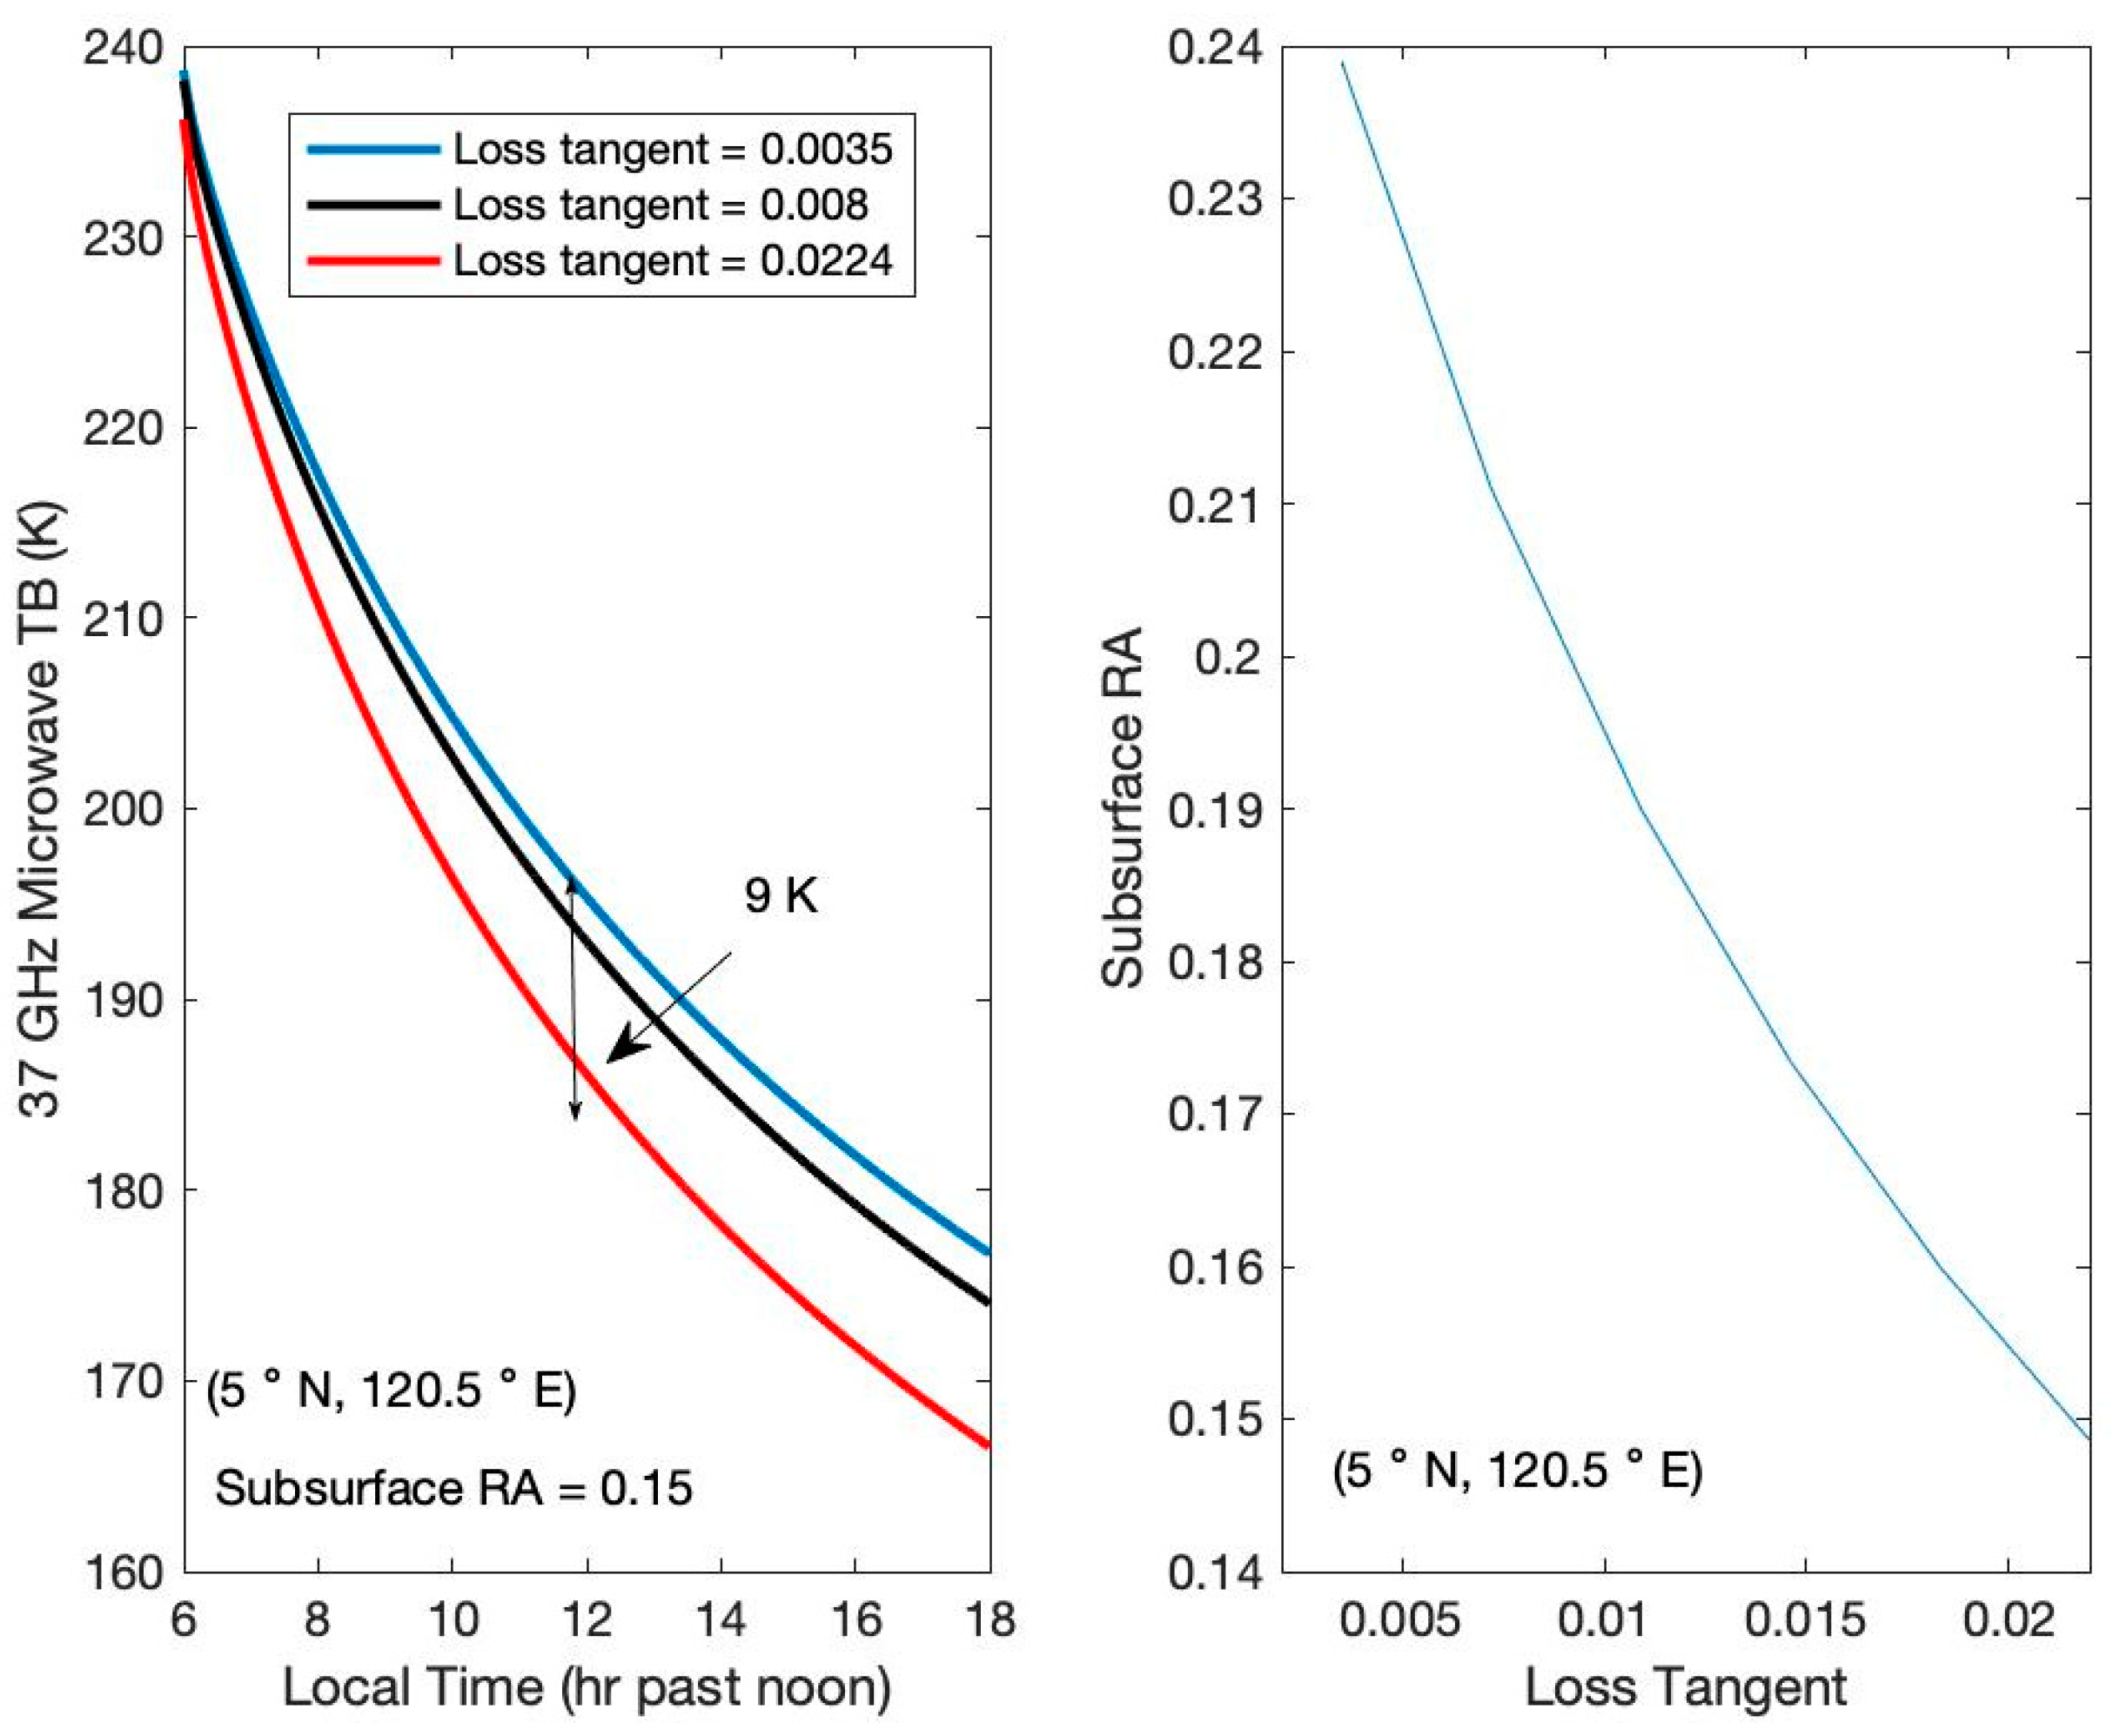
6.2. Uncertainty Generated by Loss Tangent of Rocks

Parameters such as the density, heat capacity, thermal conductivity, and loss tangent of rocks used in our study were obtained from the Apollo samples experiments. However, according to the spectral analysis of the lunar impact basins [57], the plagioclase and orthopyroxene abundance in some regions are different from those at the Apollo landing site regions. Although the relative dielectric permittivity was proven to be a function of density but not of chemistry, the loss tangent is a function of density and chemistry [33]. In addition, in Carrier III et al.’s [33] research, the loss tangent shows three theoretical fits with the data: the equivalent BHS formula, the two-dimensional regression to the power-law formula, and the three-dimensional regression of variance as a function of density and selected values of % ( T i + F e O ). The loss tangent values calculated by the three fittings at the King crater (5 ° N, 120.5 ° E) are about 0.0035, 0.008, and 0.0224, respectively.
Figure 8 shows a comparison of the nighttime microwave TB of 37 GHz at three different loss tangent values and presents the effect of the rock’s loss tangent on inverted subsurface RA. It is worth noting that when we calculate the microwave TB for different rock loss tangents, the subsurface RA is set to 0.15. In Figure 8, the microwave TB variation values can reach up to −9 K at midnight when the rock loss tangent varies from 0.0035 to 0.0224, and the estimated subsurface RA decreases with increasing rock loss tangent. The uncertainty of the inversion subsurface RA generated by the different loss tangents of different rocks is about 0.04/−0.05.

7. Conclusions

Rocks are one of the basic materials that make up the Moon, which usually has more thermal inertia and a greater loss tangent than the lunar regolith. The rock TB model proposed by Hu et al. [17] was used to calculate the microwave TB of each vertical column. In this work, a new mixed model of two-phase thermal conductivity, consisting of rock and regolith, is used to replace the mixed thermal conductivity model of Hu et al. [17]. Then, by calculating the RMS TB with changing subsurface RA values, the best-fit subsurface RA can be obtained until the RMS of TB reaches the minimum. Finally, we inverted the subsurface RA on 16 large Copernican-aged craters of the Moon. The maximum average RMS value of these craters was about 0.027. This demonstrated that our inversion results are reliable.
In a comparison of the inversion subsurface RA values and surface RA values retrieved from Diviner, the results show that the average RA values in the subsurface are usually larger than those on the surface at the corresponding locations. Also, the spatial distribution of subsurface RA is not necessarily the same as that of surface RA. In addition, the subsurface rocks are usually clustered on one side of the impact craters. This distribution trend can also be found in the surface RA for certain craters, including Giordano Bruno, Necho, and Jackson. This distinct asymmetry spatial distribution of subsurface RA can provide information about rocky ejecta and impact direction [56]. However, in some craters, such as Tycho, the rock ejecta direction revealed by subsurface RA differs from that revealed by surface RA. This could indicate the different formation and evolution information of surface rocks and subsurface rocks; an interpretation will be presented in future work.

Author Contributions

Conceptualization, G.H.; methodology, W.Y. and W.Z.; investigation, W.Y., G.H., W.Z. and F.Y.; writing—original draft preparation, W.Y.; writing—review and editing, G.H.; All authors have read and agreed to the published version of the manuscript.

Funding

This work was supported by the National Key Research and Development Program of China, grant number 2022YFF0711400, and was also jointly supported by the National Natural Science Foundation of China (NSFC) program (41901338), and the Science and Technology Development Fund, Macao SAR (0081/2019/A2). This work was supported in part by the National Natural Science Foundation of China (NSFC) Program under Grant 42241138, and by the Science and Technology Development Fund (FDCT) of Macau under Grant 0014/2022/A1.

Institutional Review Board Statement

Not applicable.

Informed Consent Statement

Not applicable.

Data Availability Statement

The data in this study are available the following address: Chang’e-2 MRM data: https://moon.bao.ac.cn/ce5web/searchOrder_pdsData.search (accessed on 21 July 2021); surface rock abundance data: https://ode.rsl.wustl.edu/moon/datasets (accessed on 3 March 2021); rock-free regolith surface temperature data: https://ode.rsl.wustl.edu/moon/datasets (accessed on 31 October 2022); Diviner Lunar Radiometer Experiment Reduced Data Records (RDR) data: https://ode.rsl.wustl.edu/moon/tools?displaypage=lrodiviner (accessed on 11 October 2022).

Acknowledgments

The authors would like to thank the Planetary Data System for providing the LRO’s DLRE IR data, WAC data and TiO2 and FeO contents data. All engineers and scientists who contributed to the successful CE-2 mission are sincerely thanked. We thank Xiaoping Zhang from State Key Laboratory of Lunar and Science, Macau University of Science and Technology, Macau, China and Guangfei Wei from Institute of Deep Sciences, Deep Space Exploration Laboratory, Hefei, China for providing fund support. The authors thank anonymous reviewer for constructive comments and suggestions that improved the quality of the paper. In addition, we thank editors for English editing and layout for my paper. This study was supported by the National Key Research and Development Program of China, grant number 2022YFF0711400, and was also jointly supported by the National Natural Science Foundation of China (NSFC) program (41901338), and the Science and Technology Development Fund, Macao SAR (0081/2019/A2). This work was supported in part by the National Natural Science Foundation of China (NSFC) Program under Grant 42241138, and by the Science and Technology Development Fund (FDCT) of Macau under Grant 0014/2022/A1.

Conflicts of Interest

The authors declare no conflict of interest.

References

  1. Zheng, Y.; Ouyang, Z.; Li, C.; Liu, J.; Zou, Y. China’s Lunar Exploration Program: Present and future. Planet. Space Sci. 2008, 56, 881–886. [Google Scholar] [CrossRef]
  2. De Rosa, D.; Bussey, B.; Cahill, J.T.; Lutz, T.; Crawford, I.A.; Hackwill, T.; van Gasselt, S.; Neukum, G.; Witte, L.; McGovern, A.; et al. Characterisation of potential landing sites for the European Space Agency’s Lunar Lander project. Planet. Space Sci. 2012, 74, 224–246. [Google Scholar] [CrossRef]
  3. Greenhagen, B.T.; Neish, C.D.; Williams, J.-P.; Cahill, J.T.; Ghent, R.R.; Hayne, P.O.; Lawrence, S.J.; Petro, N.E.; Bandfield, J.L. Origin of the anomalously rocky appearance of Tsiolkovskiy crater. Icarus 2016, 273, 237–247. [Google Scholar] [CrossRef]
  4. Li, Y.; Wu, B. Analysis of Rock Abundance on Lunar Surface from Orbital and Descent Images Using Automatic Rock Detection. J. Geophys. Res. Planets 2018, 123, 1061–1088. [Google Scholar] [CrossRef]
  5. Bandfield, J.L.; Cahill, J.T.; Carter, L.M.; Neish, C.D.; Patterson, G.W.; Williams, J.-P.; Paige, D.A. Distal ejecta from lunar impacts: Extensive regions of rocky deposits. Icarus 2017, 283, 282–299. [Google Scholar] [CrossRef]
  6. Basilevsky, A.; Head, J.; Horz, F. Survival times of meter-sized boulders on the surface of the Moon. Planet. Space Sci. 2013, 89, 118–126. [Google Scholar] [CrossRef]
  7. Ghent, R.R.; Hayne, P.O.; Bandfield, J.L.; Campbell, B.A.; Allen, C.C.; Carter, L.M.; Paige, D.A. Constraints on the recent rate of lunar ejecta breakdown and implications for crater ages. Geology 2014, 42, 1059–1062. [Google Scholar] [CrossRef]
  8. Bandfield, J.L.; Ghent, R.R.; Vasavada, A.R.; Paige, D.A.; Lawrence, S.J.; Robinson, M.S. Lunar surface rock abundance and regolith fines temperatures derived from LRO Diviner Radiometer data. J. Geophys. Res. Atmos. 2011, 116, 3866. [Google Scholar] [CrossRef]
  9. Hayne, P.O.; Bandfield, J.L.; Siegler, M.A.; Vasavada, A.R.; Ghent, R.R.; Williams, J.; Greenhagen, B.T.; Aharonson, O.; Elder, C.M.; Lucey, P.G.; et al. Global Regolith Thermophysical Properties of the Moon from the Diviner Lunar Radiometer Experiment. J. Geophys. Res. Planets 2017, 122, 2371–2400. [Google Scholar] [CrossRef]
  10. Elder, C.M.; Hayne, P.O.; Piqueux, S.; Bandfield, J.; Williams, J.P.; Ghent, R.R.; Paige, D.A. The Lunar Rock Size Frequency Distribution from Diviner Infrared Measurements. In AGU Fall Meeting Abstracts; American Geophysical Union: Washington, DC, USA, 2016; p. P24A-04. [Google Scholar]
  11. Gong, X.; Jin, Y.-Q. Diurnal change of MW and IR thermal emissions from lunar craters with relevance to rock abundance. Acta Astronaut. 2013, 86, 237–246. [Google Scholar] [CrossRef]
  12. Di, K.; Xu, B.; Peng, M.; Yue, Z.; Liu, Z.; Wan, W.; Li, L.; Zhou, J. Rock size-frequency distribution analysis at the Chang’E-3 landing site. Planet. Space Sci. 2016, 120, 103–112. [Google Scholar] [CrossRef]
  13. Li, B.; Ling, Z.; Zhang, J.; Chen, J. Rock size-frequency distributions analysis at lunar landing sites based on remote sensing and in-situ imagery. Planet. Space Sci. 2017, 146, 30–39. [Google Scholar] [CrossRef]
  14. Fa, W.; Zhu, M.; Liu, T.; Plescia, J.B. Regolith stratigraphy at the Chang’E-3 landing site as seen by lunar penetrating radar. Geophys. Res. Lett. 2015, 42, 179–187. [Google Scholar] [CrossRef]
  15. Fa, W. Bulk Density of the Lunar Regolith at the Chang’E-3 Landing Site as Estimated from Lunar Penetrating Radar. Earth Space Sci. 2020, 7, e2019EA000801. [Google Scholar] [CrossRef]
  16. Keihm, S.J. Effects of subsurface volume scattering on the lunar microwave brightness temperature spectrum. Icarus 1982, 52, 570–584. [Google Scholar] [CrossRef]
  17. Hu, G.-P.; Chan, K.L.; Zheng, Y.-C.; Xu, A.-A. A Rock Model for the Cold and Hot Spots in the Chang’E Microwave Brightness Temperature Map. IEEE Trans. Geosci. Remote Sens. 2018, 56, 5471–5480. [Google Scholar] [CrossRef]
  18. Wei, G.; Byrne, S.; Li, X.; Hu, G. Lunar Surface and Buried Rock Abundance Retrieved from Chang’E-2 Microwave and Diviner Data. Planet. Sci. J. 2020, 1, 56. [Google Scholar] [CrossRef]
  19. Keihm, S.J. Interpretation of the lunar microwave brightness temperature spectrum: Feasibility of orbital heat flow mapping. Icarus 1984, 60, 568–589. [Google Scholar] [CrossRef]
  20. Siegler, M.A.; Feng, J.; Lucey, P.G.; Ghent, R.R.; Hayne, P.O.; White, M.N. Lunar Titanium and Frequency-Dependent Microwave Loss Tangent as Constrained by the Chang’E-2 MRM and LRO Diviner Lunar Radiometers. J. Geophys. Res. Planets 2020, 125, e2020JE006405. [Google Scholar] [CrossRef]
  21. Feng, J.; Su, Y.; Zou, Y.; Bian, W.; Zheng, Y.; Li, C. Review on physical models of lunar brightness temperature. Chin. J. Geochem. 2010, 29, 204–211. [Google Scholar] [CrossRef]
  22. Zhang, H.; Zhang, X.; Yang, J. The analysis of affections to the cold space calibration source of ChangE-1 payload Microwave Detector. Adv. Space Res. 2008, 42, 350–357. [Google Scholar] [CrossRef]
  23. Wang, Z.; Li, Y.; Zhang, X.; JingShan, J.; Xu, C.; Zhang, D.; Zhang, W. Calibration and brightness temperature algorithm of CE-1 Lunar Microwave Sounder (CELMS). Sci. China Earth Sci. 2010, 53, 1392–1406. [Google Scholar] [CrossRef]
  24. Chan, K.L.; Tsang, K.T.; Kong, B.; Zheng, Y.-C. Lunar regolith thermal behavior revealed by Chang’E-1 microwave brightness temperature data. Earth Planet. Sci. Lett. 2010, 295, 287–291. [Google Scholar] [CrossRef]
  25. Hu, G.-P.; Chan, K.L.; Zheng, Y.-C.; Tsang, K.T.; Xu, A.-A. Comparison and evaluation of the Chang’E microwave radiometer data based on theoretical computation of brightness temperatures at the Apollo 15 and 17 sites. Icarus 2017, 294, 72–80. [Google Scholar] [CrossRef]
  26. Hu, G.P.; Keihm, S.J. Effect of the Lunar Radiation on the Cold Sky Horn Antennas of the Chang’E-1 and -2 Microwave Radiometers. IEEE Geosci. Remote Sens. Lett. 2021, 18, 1781–1785. [Google Scholar] [CrossRef]
  27. Yang, F.; Hu, G.-P.; Chan, K.L.; Tsang, K.-T.; Zheng, Y.-C.; Xu, Y.; Yu, L.H.S. A Recalibration Model Based on the Statistical Regression Analysis Method to Align the Microwave Data of Chang’E-1 and Chang’E-2. IEEE Trans. Geosci. Remote Sens. 2021, 60, 5001211. [Google Scholar] [CrossRef]
  28. Yang, F.; Xu, Y.; Chan, K.L.; Zhang, X.; Hu, G.; Li, Y. Study of Chang’E-2 Microwave Radiometer Data in the Lunar Polar Region. Adv. Astron. 2019, 2019, 3940837. [Google Scholar] [CrossRef]
  29. Meng, Z.; Xu, Y.; Zheng, Y.; Zhu, Y.; Jia, Y.; Chen, S. Inversion of lunar regolith layer thickness with CELMS data using BPNN method. Planet. Space Sci. 2014, 101, 1–11. [Google Scholar] [CrossRef]
  30. Fa, W.; Jin, Y.-Q. A primary analysis of microwave brightness temperature of lunar surface from Chang-E 1 multi-channel radiometer observation and inversion of regolith layer thickness. Icarus 2010, 207, 605–615. [Google Scholar] [CrossRef]
  31. Paige, D.A.; Foote, M.C.; Greenhagen, B.T.; Schofield, J.T.; Calcutt, S.; Vasavada, A.R.; Preston, D.J.; Taylor, F.W.; Allen, C.C.; Snook, K.J.; et al. The Lunar Reconnaissance Orbiter Diviner Lunar Radiometer Experiment. Space Sci. Rev. 2010, 150, 125–160. [Google Scholar] [CrossRef]
  32. Vasavada, A.R.; Bandfield, J.L.; Greenhagen, B.T.; Hayne, P.O.; Siegler, M.A.; Williams, J.-P.; Paige, D.A. Lunar equatorial surface temperatures and regolith properties from the Diviner Lunar Radiometer Experiment. J. Geophys. Res. Atmos. 2012, 117, 2011JE003987. [Google Scholar] [CrossRef]
  33. Carrier, W.D., III; Olhoeft, G.R.; Mendell, W. Physical properties of the lunar surface. In Lunar Sourcebook, a User’s Guide to the Moon; Cambridge University Press: Cambridge, UK, 1991; pp. 475–594. [Google Scholar]
  34. Lawrence, D.J.; Feldman, W.C.; Barraclough, B.L.; Binder, A.B.; Elphic, R.C.; Maurice, S.; Thomsen, D.R. Global Elemental Maps of the Moon: The Lunar Prospector Gamma-Ray Spectrometer. Science 1998, 281, 1484–1489. [Google Scholar] [CrossRef] [PubMed]
  35. Sato, H.; Robinson, M.S.; Lawrence, S.J.; Denevi, B.W.; Hapke, B.; Jolliff, B.L.; Hiesinger, H. Lunar mare TiO2 abundances estimated from UV/Vis reflectance. Icarus 2017, 296, 216–238. [Google Scholar] [CrossRef]
  36. Lucey, P.G.; Taylor, G.J.; Malaret, E. Abundance and Distribution of Iron on the Moon. Science 1995, 268, 1150–1153. [Google Scholar] [CrossRef] [PubMed]
  37. Lucey, P.G.; Blewett, D.T.; Johnson, J.L.; Taylor, G.J.; Hawke, B.R. Lunar titanium content from UV-VIS measurements. Lunar Planet. Sci. 1996, 27, 781. [Google Scholar]
  38. Lucey, P.G.; Blewett, D.T.; Hawke, B.R. Mapping the FeO and TiO2 content of the lunar surface with multispectral imagery. J. Geophys. Res. Earth Surf. 1998, 103, 3679–3699. [Google Scholar] [CrossRef]
  39. Lucey, P.G.; Blewett, D.T.; Jolliff, B.L. Lunar iron and titanium abundance algorithms based on final processing of Clementine ultraviolet-visible images. J. Geophys. Res. Atmos. 2000, 105, 20297–20305. [Google Scholar] [CrossRef]
  40. Hu, G.-P.; Zheng, Y.-C.; Xu, A.-A.; Tang, Z.-S. Qualitative Verification of CE-2’s Microwave Measurement: Relative Calibration Based on Brightness Temperature Model and Data Fusion. IEEE Trans. Geosci. Remote Sens. 2016, 54, 1598–1609. [Google Scholar] [CrossRef]
  41. Feng, J.; Su, Y.; Liu, J.; Zou, Y.; Li, C. Data processing and error analysis for the CE-1 Lunar microwave radiometer. Res. Astron. Astrophys. 2013, 13, 359–372. [Google Scholar] [CrossRef]
  42. Mitchell, D.; Pater, I. Microwave Imaging of Mercury’s Thermal Emission at Wavelengths from 0.3 to 20.5 cm. Icarus 1994, 110, 2–32. [Google Scholar] [CrossRef]
  43. Keihm, S.J.; Langseth, M.G. Lunar microwave brightness temperature observations reevaluated in the light of Apollo program findings. Icarus 1975, 24, 211–230. [Google Scholar] [CrossRef]
  44. Vasavada, A. Near-Surface Temperatures on Mercury and the Moon and the Stability of Polar Ice Deposits. Icarus 1999, 141, 179–193. [Google Scholar] [CrossRef]
  45. Keihm, S.J.; Langseth, M.G., Jr. Surface brightness temperatures at the Apollo 17 heat flow site: Thermal conductivity of the upper 15 cm of regolith. Lunar Planet. Sci. Conf. Proc. 1973, 4, 2503. [Google Scholar]
  46. Keihm, S.J.; Peters, K.; Langseth, M.G.; Chute, J.L., Jr. Apollo 15 measurement of lunar surface brightness temperatures thermal conductivity of the upper 1 1/2 meters of regolith. Earth Planet. Sci. Lett. 1973, 19, 337–351. [Google Scholar] [CrossRef]
  47. Feng, J.; Siegler, M.A.; Hayne, P.O. New Constraints on Thermal and Dielectric Properties of Lunar Regolith from LRO Diviner and CE-2 Microwave Radiometer. J. Geophys. Res. Planets 2020, 125, 2019JE006130. [Google Scholar] [CrossRef]
  48. FroHlich, C.; Lean, J. Solar radiative output and its variability: Evidence and mechanisms. Astron. Astrophys. Rev. 2004, 12, 273–320. [Google Scholar] [CrossRef]
  49. Williams, J.-P.; Paige, D.; Greenhagen, B.; Sefton-Nash, E. The global surface temperatures of the Moon as measured by the Diviner Lunar Radiometer Experiment. Icarus 2017, 283, 300–325. [Google Scholar] [CrossRef]
  50. Horai, K.; Simmons, G. Thermal property measurements on lunar material returned by Apollo 11 and 12 missions. Moon 1972, 4, 447–475. [Google Scholar] [CrossRef]
  51. Horai, K.; Winkler, J., Jr. Thermal diffusivity of two Apollo 11 samples, 10020, 44 and 10065, 23 Effect of petrofabrics on the thermal conductivity of porous lunar rocks under vacuum. In Proceedings of the Lunar and Planetary Science Conference, Houston, TX, USA, 17–21 March 1980; pp. 1777–1788. [Google Scholar]
  52. Gary, B.L.; Keihm, S.J. Interpretation of ground-based microwave measurements of the moon using a detailed regolith properties model. In Proceedings of the Lunar and Planetary Science Conference, Houston, TX, USA, 13–17 March 1978; Volume 3, pp. 2885–2900. [Google Scholar]
  53. Hashin, Z.; Shtrikman, S. A Variational Approach to the Theory of the Effective Magnetic Permeability of Multiphase Materials. J. Appl. Phys. 1962, 33, 3125–3131. [Google Scholar] [CrossRef]
  54. Shorthill, R.W.; Saari, J.M. Nonuniform Cooling of the Eclipsed Moon: A Listing of Thirty Prominent Anomalies. Science 1965, 150, 210–212. [Google Scholar] [CrossRef]
  55. Liu, N.; Jin, Y.-Q. A Radiative Transfer Model for MW Cold and IR Hot Spots of Chang’e and Diviner Observations. IEEE Trans. Geosci. Remote Sens. 2019, 57, 8184–8190. [Google Scholar] [CrossRef]
  56. Ghent, R.; Carter, L.; Bandfield, J.; Udovicic, C.T.; Campbell, B. Lunar crater ejecta: Physical properties revealed by radar and thermal infrared observations. Icarus 2016, 273, 182–195. [Google Scholar] [CrossRef]
  57. Lemelin, M.; Lucey, P.G.; Miljković, K.; Gaddis, L.R.; Hare, T.; Ohtake, M. The compositions of the lunar crust and upper mantle: Spectral analysis of the inner rings of lunar impact basins. Planet. Space Sci. 2019, 165, 230–243. [Google Scholar] [CrossRef]
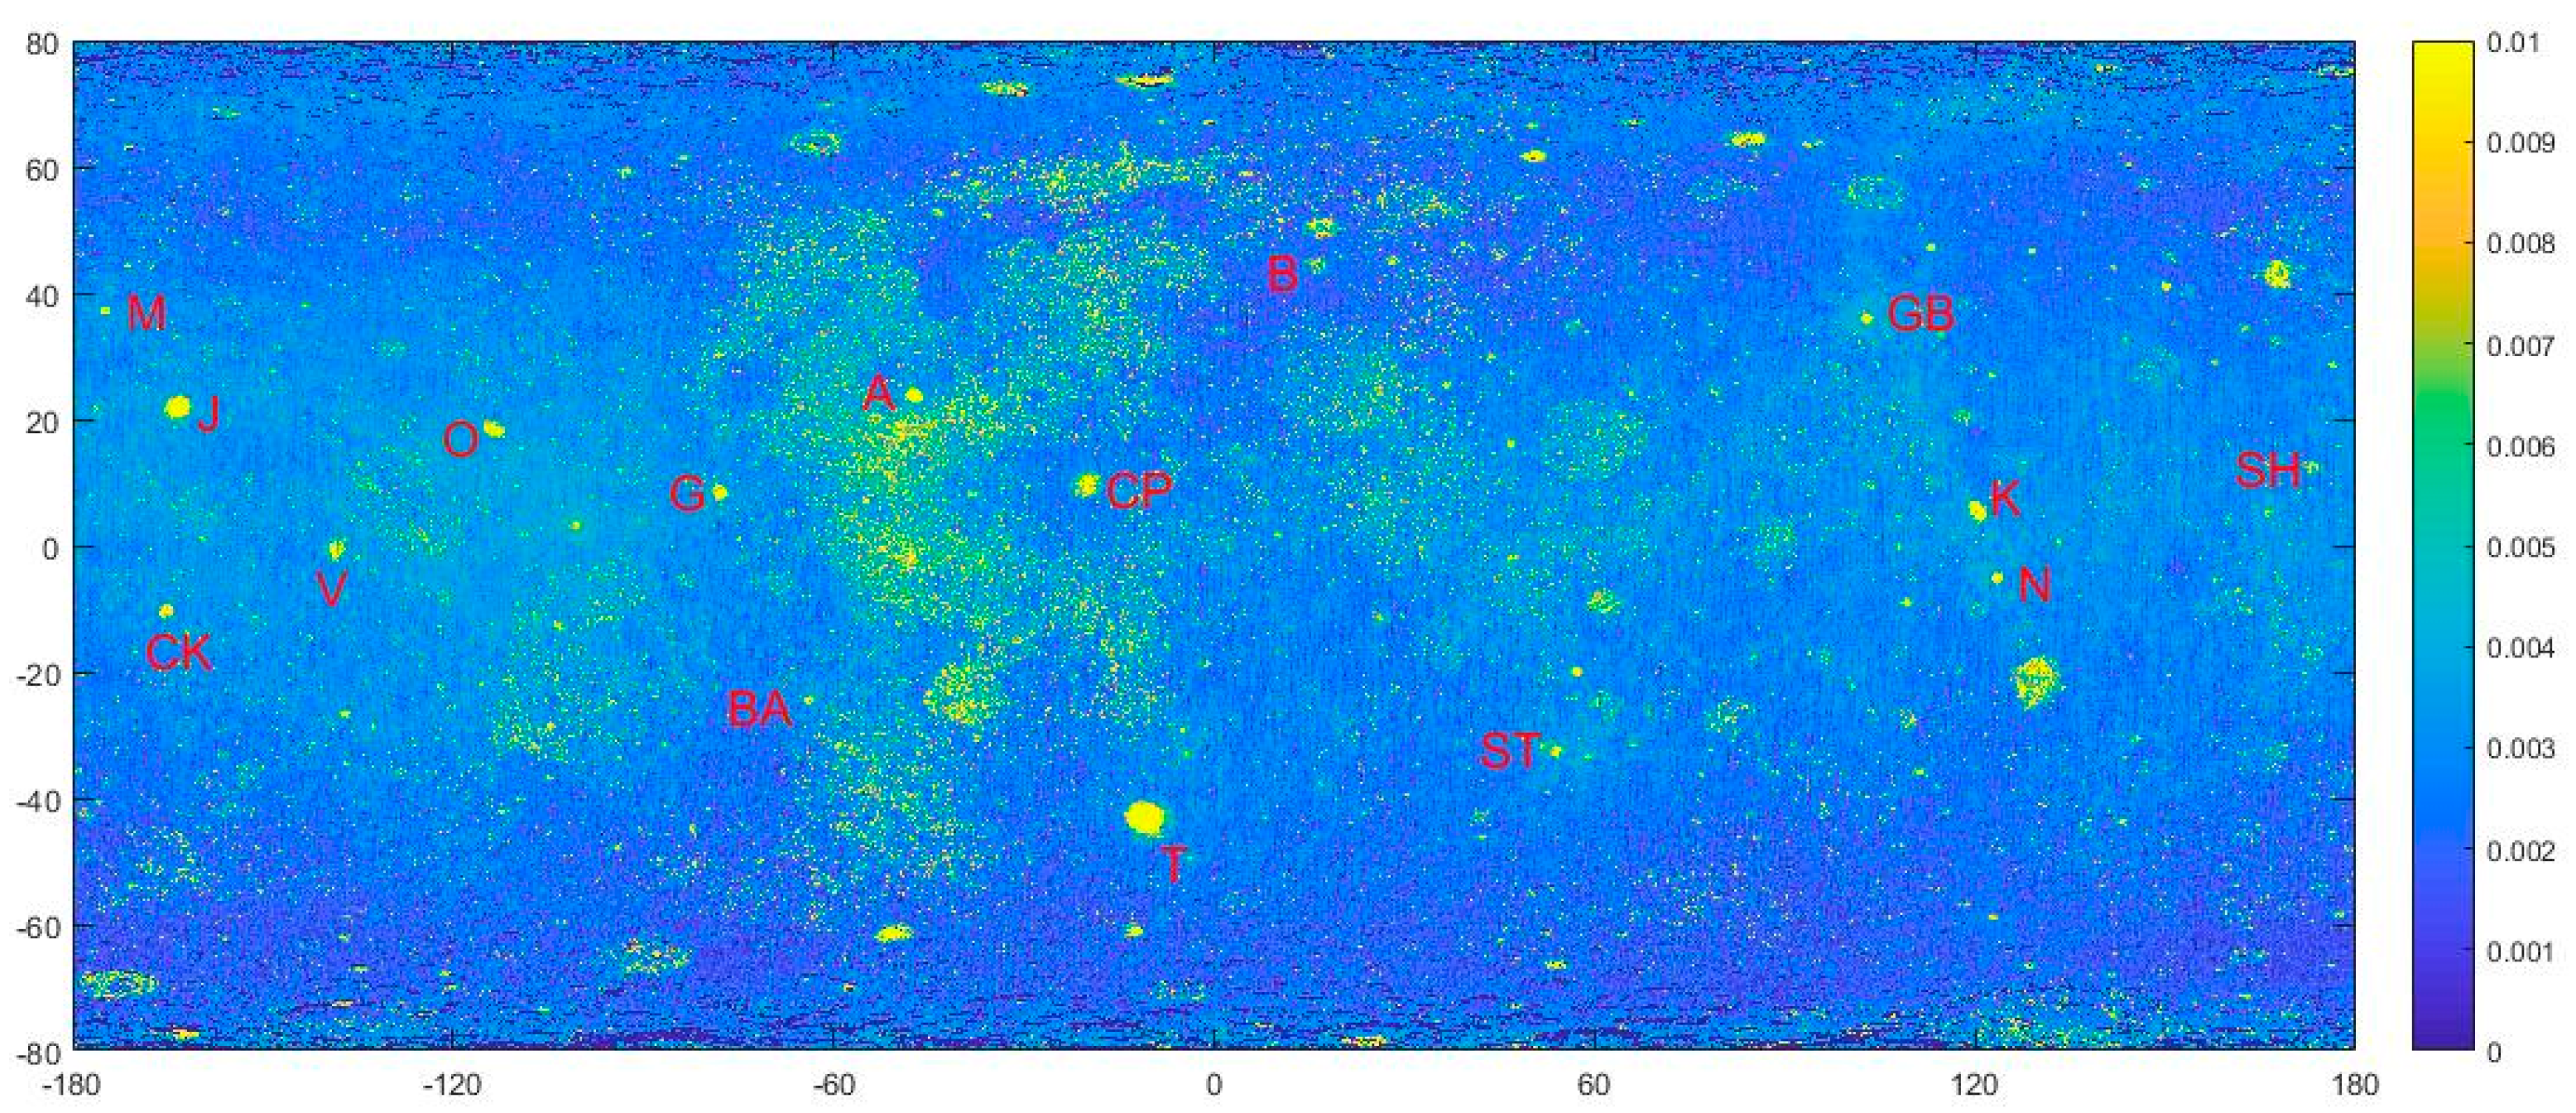
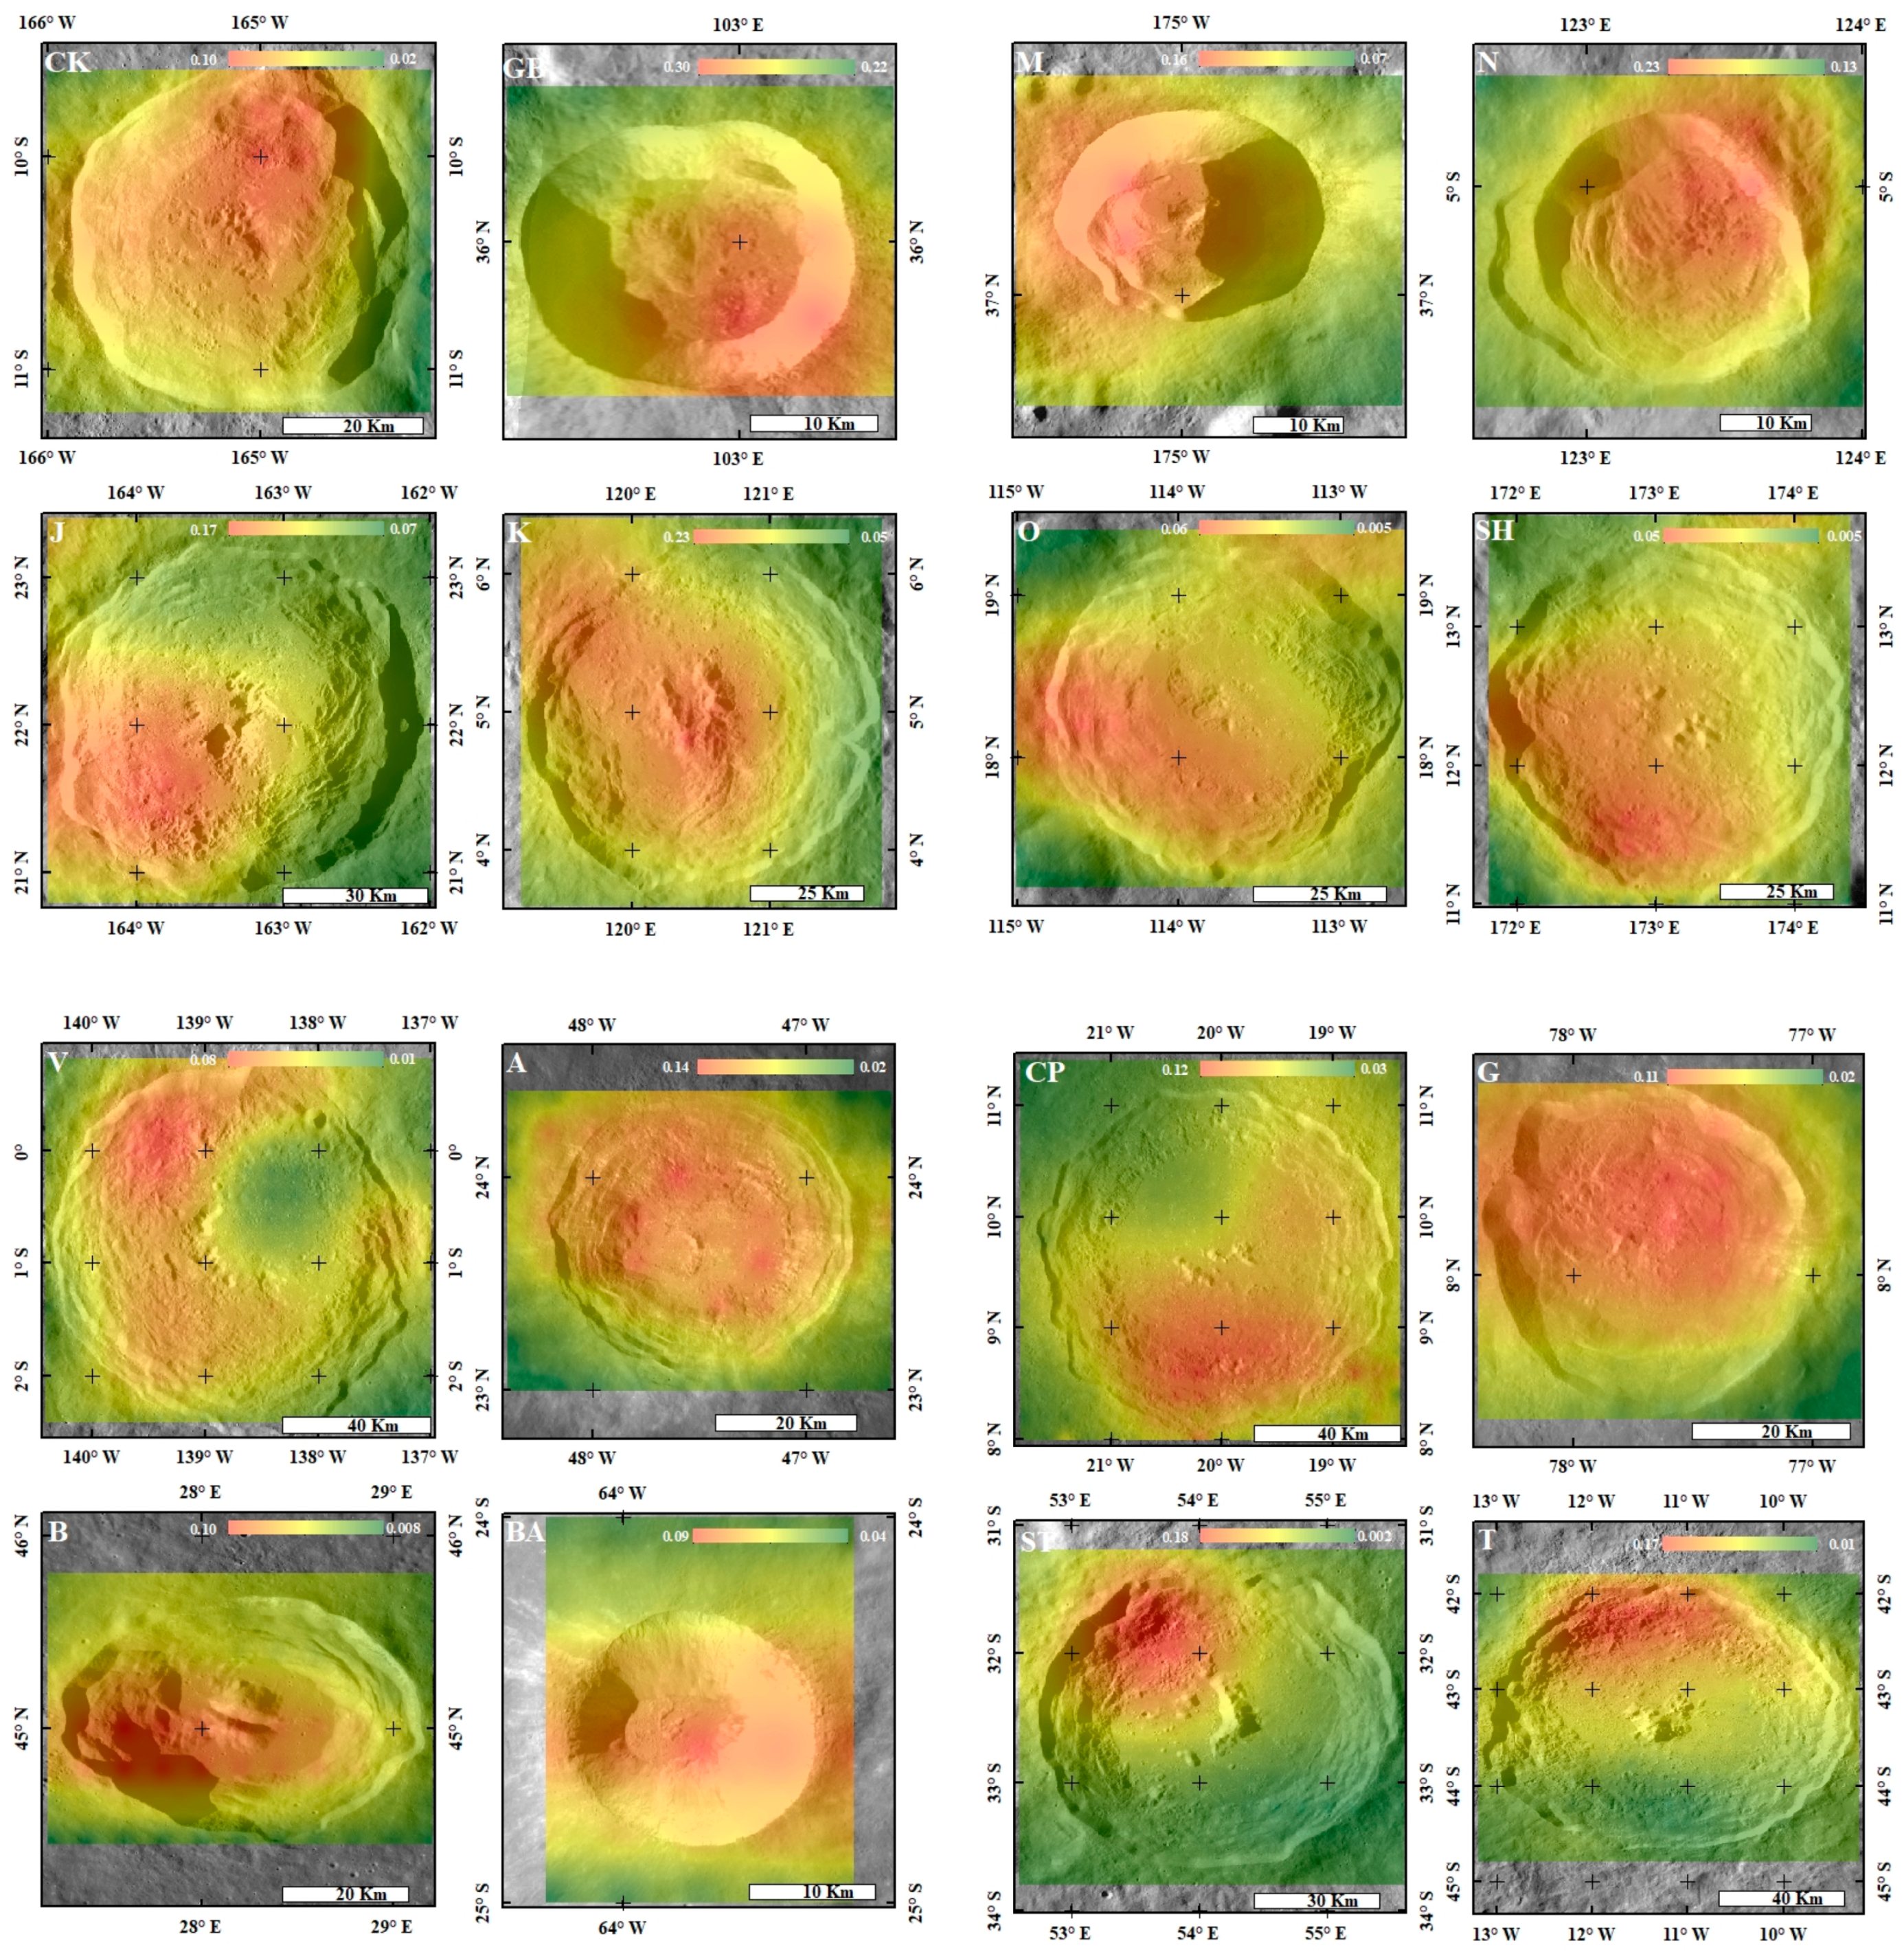
Figure 1. The effect of the parameter β on the surface temperature at the lunar center (0 ° N, 0 ° E), R A = 0.0027 is the average surface RA obtained from Diviner. The top figure shows the diurnal variation in surface temperature with β and the bottom figure shows the nighttime variation in surface temperature with β .
Remotesensing 15 04895 g001
Figure 2. Comparison of the observed surface temperature data and the simulated results at the lunar center region (top) and CE-3 landing site (bottom).
Remotesensing 15 04895 g002
Figure 3. The effect of the subsurface RA on surface temperature and 37 GHz microwave TB. (a) The effect of the subsurface RA on diurnal (top) and nighttime (bottom) surface temperature. (b) The effect of the subsurface RA on 37 GHz microwave TB.
Remotesensing 15 04895 g003
Figure 4. Locations of all the studied craters. The background mosaic map is the surface RA retrieved from Diviner. The markers are abbreviations for the selected craters, whose descriptions are shown in Table 1.
Remotesensing 15 04895 g004
Figure 5. The distribution of the lunar subsurface rocks. All of the images are the IDW interpolation results produced by ArcMap. The background mosaic images are from the LRO wide-angle camera (WAC).
Remotesensing 15 04895 g005
Figure 6. The relative distribution of nighttime regolith temperature obtained from Diviner and nighttime microwave TB of CE-2 37 GH. (a) The relative distribution of nighttime regolith temperature required from Diviner at the Copernicus, Ohm, Sharonov, and Tycho craters. (b) The relative distribution of nighttime microwave TB of CE-2 37 GHz at the Copernicus, Ohm, Sharonov, and Tycho craters. The red color represents higher temperature, and the blue color represents lower temperature.
Remotesensing 15 04895 g006
Figure 7. Effects of H-parameter on nighttime microwave TB (left) and inversion subsurface RA (right).
Remotesensing 15 04895 g007
Figure 8. Effects of rocks’ loss tangent on nighttime microwave TB (left) and inversion subsurface RA (right).
Remotesensing 15 04895 g008
Table 1. The characteristics of the selected craters.
Crater NamesLatitude (°N)Longitude (°E)Diameter (km)Subsurface RA (Mean)Surface RA (Mean)RMS (K)
Aristarchus (A)23.7312.6400.09290.0320.001
Burg (B)4528.2400.05560.00850.003
Byrgius A (BA)−24.5296.3190.06360.03070.027
Copernicus (CP)9.62340930.07470.01130.013
Crookes (CK)−10.4194.9490.06680.0180.002
Giordano Bruno (GB)36102.89220.26360.09590.001
Glushko (G)8.11282.33400.08350.02310.004
Jackson (J)22.05196.68710.11190.02570.005
King (K)4.96120.49760.14230.01510.025
Moore F (M)37.4185240.11920.03270.001
Necho (N)−5.25123.24300.18850.0340.001
Ohm (O)18.4246.5640.03980.01710.001
Sharonov (SH)12.4173.3740.02740.00570.008
Stevinus (ST)−32.554.2750.05320.00670.007
Tycho (T)−43.3348.62850.07570.04890.006
Vavilov (V)−0.8222.1980.04460.00920.012
Disclaimer/Publisher’s Note: The statements, opinions and data contained in all publications are solely those of the individual author(s) and contributor(s) and not of MDPI and/or the editor(s). MDPI and/or the editor(s) disclaim responsibility for any injury to people or property resulting from any ideas, methods, instructions or products referred to in the content.

