Article

Assessment of Restoration Degree and Restoration Potential of Key Ecosystem-Regulating Services in the Three-River Headwaters Region Based on Vegetation Coverage

1
Academy of Agriculture and Forestry Sciences, Qinghai University, Xining 810016, China
2
The Institute of Geographical Sciences and Natural Resources Research, Chinese Academy of Sciences, Beijing 100101, China
*
Author to whom correspondence should be addressed.
Remote Sens. 2023, 15(2), 523; https://doi.org/10.3390/rs15020523
Submission received: 29 October 2022 / Revised: 29 December 2022 / Accepted: 11 January 2023 / Published: 16 January 2023

Abstract

:
The Three-River Headwaters Region (TRHR) is an important part of the ecological security barrier of the Qinghai–Tibet Plateau in China. Twenty years after the implementation of the TRHR ecological protection and construction project, the restoration degree and restoration potential of its major ecosystem services still lack clear quantification. In this paper, taking the core area of the nature reserve as the climax background of the TRHR zonal ecosystem, based on the multiple regression analysis (MLR) and model parameter control method based on the eco-geographical area, ecosystem types, and climate factors; the climax background, restoration degree, and restoration potential of TRHR’s water retention (WR), soil retention (SR), and windbreak and sand fixation (WD) services were quantitatively researched. The main conclusions were as follows: (1) The evaluation method of climax background, restoration degree, and restoration potential based on fractional vegetation cover (FVC) can accurately quantify the regional differences of the restoration degree and restoration potential of TRHR’s key ecosystem-regulating services. The restoration degree and restoration potential of WR and SR services showed a spatial pattern of high in the southeast and low in the northwest, and the restoration degree and restoration potential of WD services showed a spatial pattern of high in the west and low in the east, which was closely related to natural conditions such as precipitation and wind speed. (2) The proportion of restoration potential to climax background for WR, SR, and WD services were 48.38%, 62.15%, and 56.37%, respectively. (3) The implementation of the TRHR ecological project in the future should focus on the vicinity of the 400 mm dry and wet zone dividing line, as well as in the southeastern mountains, hills, and river valleys, to carry out degraded vegetation restoration and soil and water conservation measures to improve ecosystem services. Near-natural restoration measures should be considered in Zhiduo and Geermu in the western part of the TRHR, where wind erosion is high, and the restoration goals of ecological projects should be formulated in combination with local climatic conditions and restoration potential.

Graphical Abstract

1. Introduction

Known as the Chinese Water Tower, the Three-River Headwaters Region (TRHR) is an important part of the ecological security barrier of the Qinghai–Tibet Plateau [1,2]. Since the 1970s, under the combined influence of climate change and human activities, the TRHR ecosystem has undergone extensive and continuous degradation [1,3], directly threatening the stable performance of ecosystem services such as water retention [4]. In the past 20 years, some ecological projects such as returning grazing land to grassland [2,4,5,6] have been taken in the TRHR to restore and improve regional ecosystem services [7]. In the context of ecological civilization construction in China, timely understanding of the restoration degree and restoration potential of local ecosystem-regulating services is significantly helpful for scientifically formulating ecological engineering protection and construction goals, formulating and optimizing ecological protection and restoration measures, and strengthening national ecological security barriers [7,8].
However, with the current research on ecosystem restoration, it is difficult to accurately quantify the regional differences in the restoration degree and restoration potential of ecosystem services; consequently, it cannot effectively support the precise implementation of ecological projects, and reduce the efficiency of capital use. Ecosystem restoration is the restoration of the ecological functions of degraded ecosystems so that they possess the same level of self-sustainability, integrity, and sustainability as natural ecosystems [9,10]. A complete ecosystem should be one that is free from human disturbance or as little as possible [11], and can be used as the climax background to evaluate the entire ecosystem [7,12], such as ecosystems in natural protected areas [7]. Because the natural variability of ecosystems is affected by both biotic and abiotic factors, the natural endowments of different ecosystem types under different environmental conditions are quite different, so the climax background needs to be determined by division and type [7,13].
However, there are still some questions that remain unsolved as follows: (1) Ecological parameters climax background acquisition: Current ecosystem restoration potential research often focuses on easily measurable indicators such as Fractional vegetation cover (FVC), productivity, biomass, and plant diversity [13,14,15]. Constrained by the difficulty in obtaining zonal climax background ecological parameters [13] and the complexity of ecosystem service simulation, there are relatively few studies on ecosystem service restoration potential. (2) The scale expansion uncertainty of climax background ecological parameters is large [15]. For example, some scholars have evaluated the carbon sequestration status and potential of grassland [16], wetland [17], and forest [18] ecosystems in China based on localization experiments, literature, or survey data. The research on carbon sequestration potential is difficult to extend to the regional scale. Zhang et al. [19] used model simulation methods to calculate grassland production potential based on precipitation, air temperature, and evapotranspiration, but this method focused on meteorological elements and ignored zonal climax vegetation differences. Zhao et al. [20] used a similar habitat method on the Loess Plateau to predict the maximum restoration potential of future vegetation coverage in each subregion, but the restoration potential of FVC in each subregion ignores the continuous spatial difference of the water and heat conditions. In addition, most areas of the Loess Plateau have been disturbed by humans, and the FVC obtained by geostatistical methods did not represent the zonal climax background. (3) Parameter selection of ecosystem service restoration potential assessment model: Regional ecosystem service assessments often require large-scale data such as land use/land cover (LULC) and FVC as input parameters [21,22,23]. Depellegrin et al. [23] used LULC data in Lithuania to assess the restoration goals and restoration potentials of regional regulation, supply, and cultural services by using expert rating scale methods, but the result was greatly affected by expert knowledge and subjective factors. According to Tariq’s research on region-specific unit values for land cover supplying ecosystem services, the resulting value of the realized ecosystem services is about 50% of the value of the potential ecosystem services per year for Southern Ontario [24].
So, it is urgent to make new breakthroughs in ecosystem service assessment methods focusing on climax background, restoration degree, and restoration potential, in order to support scientific decision making and effective implementation of future ecological projects. The long-term construction of TRHR nature reserves and national parks has effectively reduced human disturbance to the ecosystem in the core area [25] and protected the authenticity and integrity of its ecosystem, which provides an ideal reference for the study of ecosystem services climax background. FVC is one of the most important indicators to measure the condition of surface vegetation [26,27,28,29], which is more sensitive to the impact of climate change and human activities [30,31,32,33] and can effectively characterize the ecological effect of ecological engineering [34]; it is also closely related to water retention (WR), soil retention (SR), and windbreak and sand fixation (WD) service evaluation models [35,36,37]. We took the core area of the TRHR nature reserve as the climax background of the zonal ecosystem, and used a multiple regression analysis method based on natural factors such as eco-geographical zones, ecosystem types, and climate to realize scale expansion of FVC from the core area of the nature reserve to the TRHR; we then coupled it with the Precipitation Storage Method (PSM), Revised Universal Soil Loss Equation (RUSLE), and Revised Wind Erosion Equation (RWEQ) models to achieve quantitative research on the climax background, restoration degree, and restoration potential of WR, SR, and WD services. It is expected that this research will provide scientific and technological support and decision support for the deployment and rolling implementation of TRHR-related, and even national ecological protection and construction projects, as well as the scientific evaluation of ecological benefits of ecological projects.

2. Materials and Methods
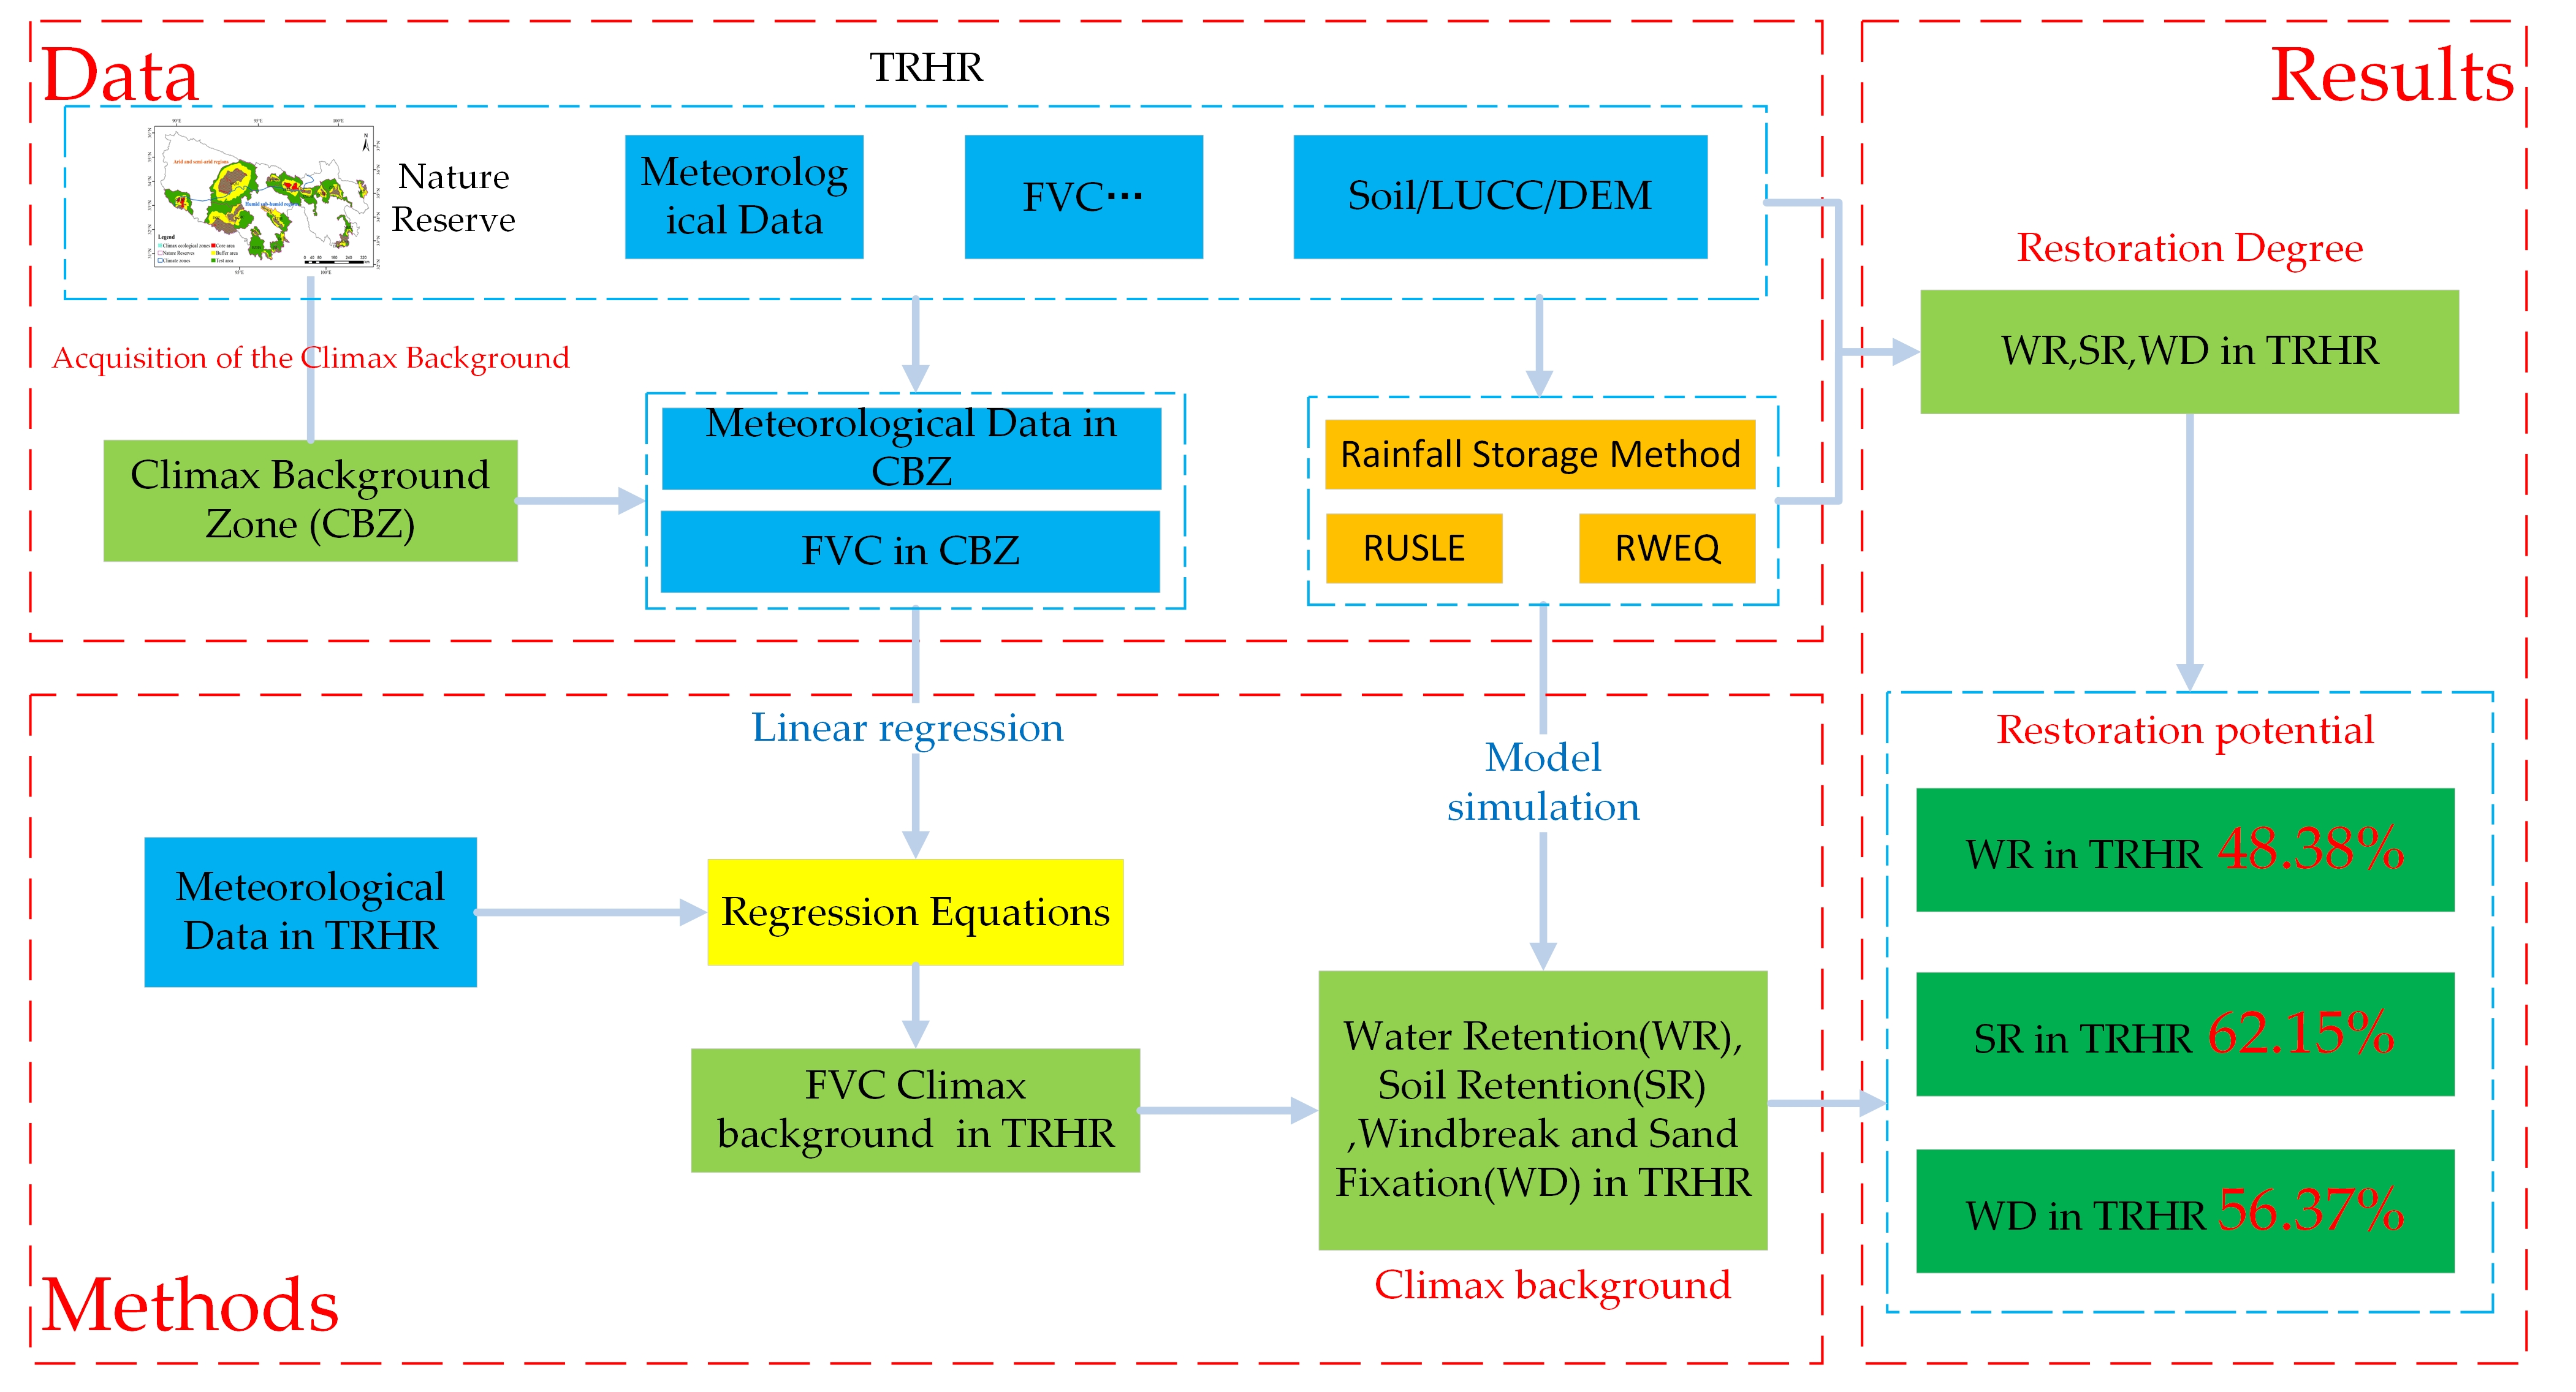
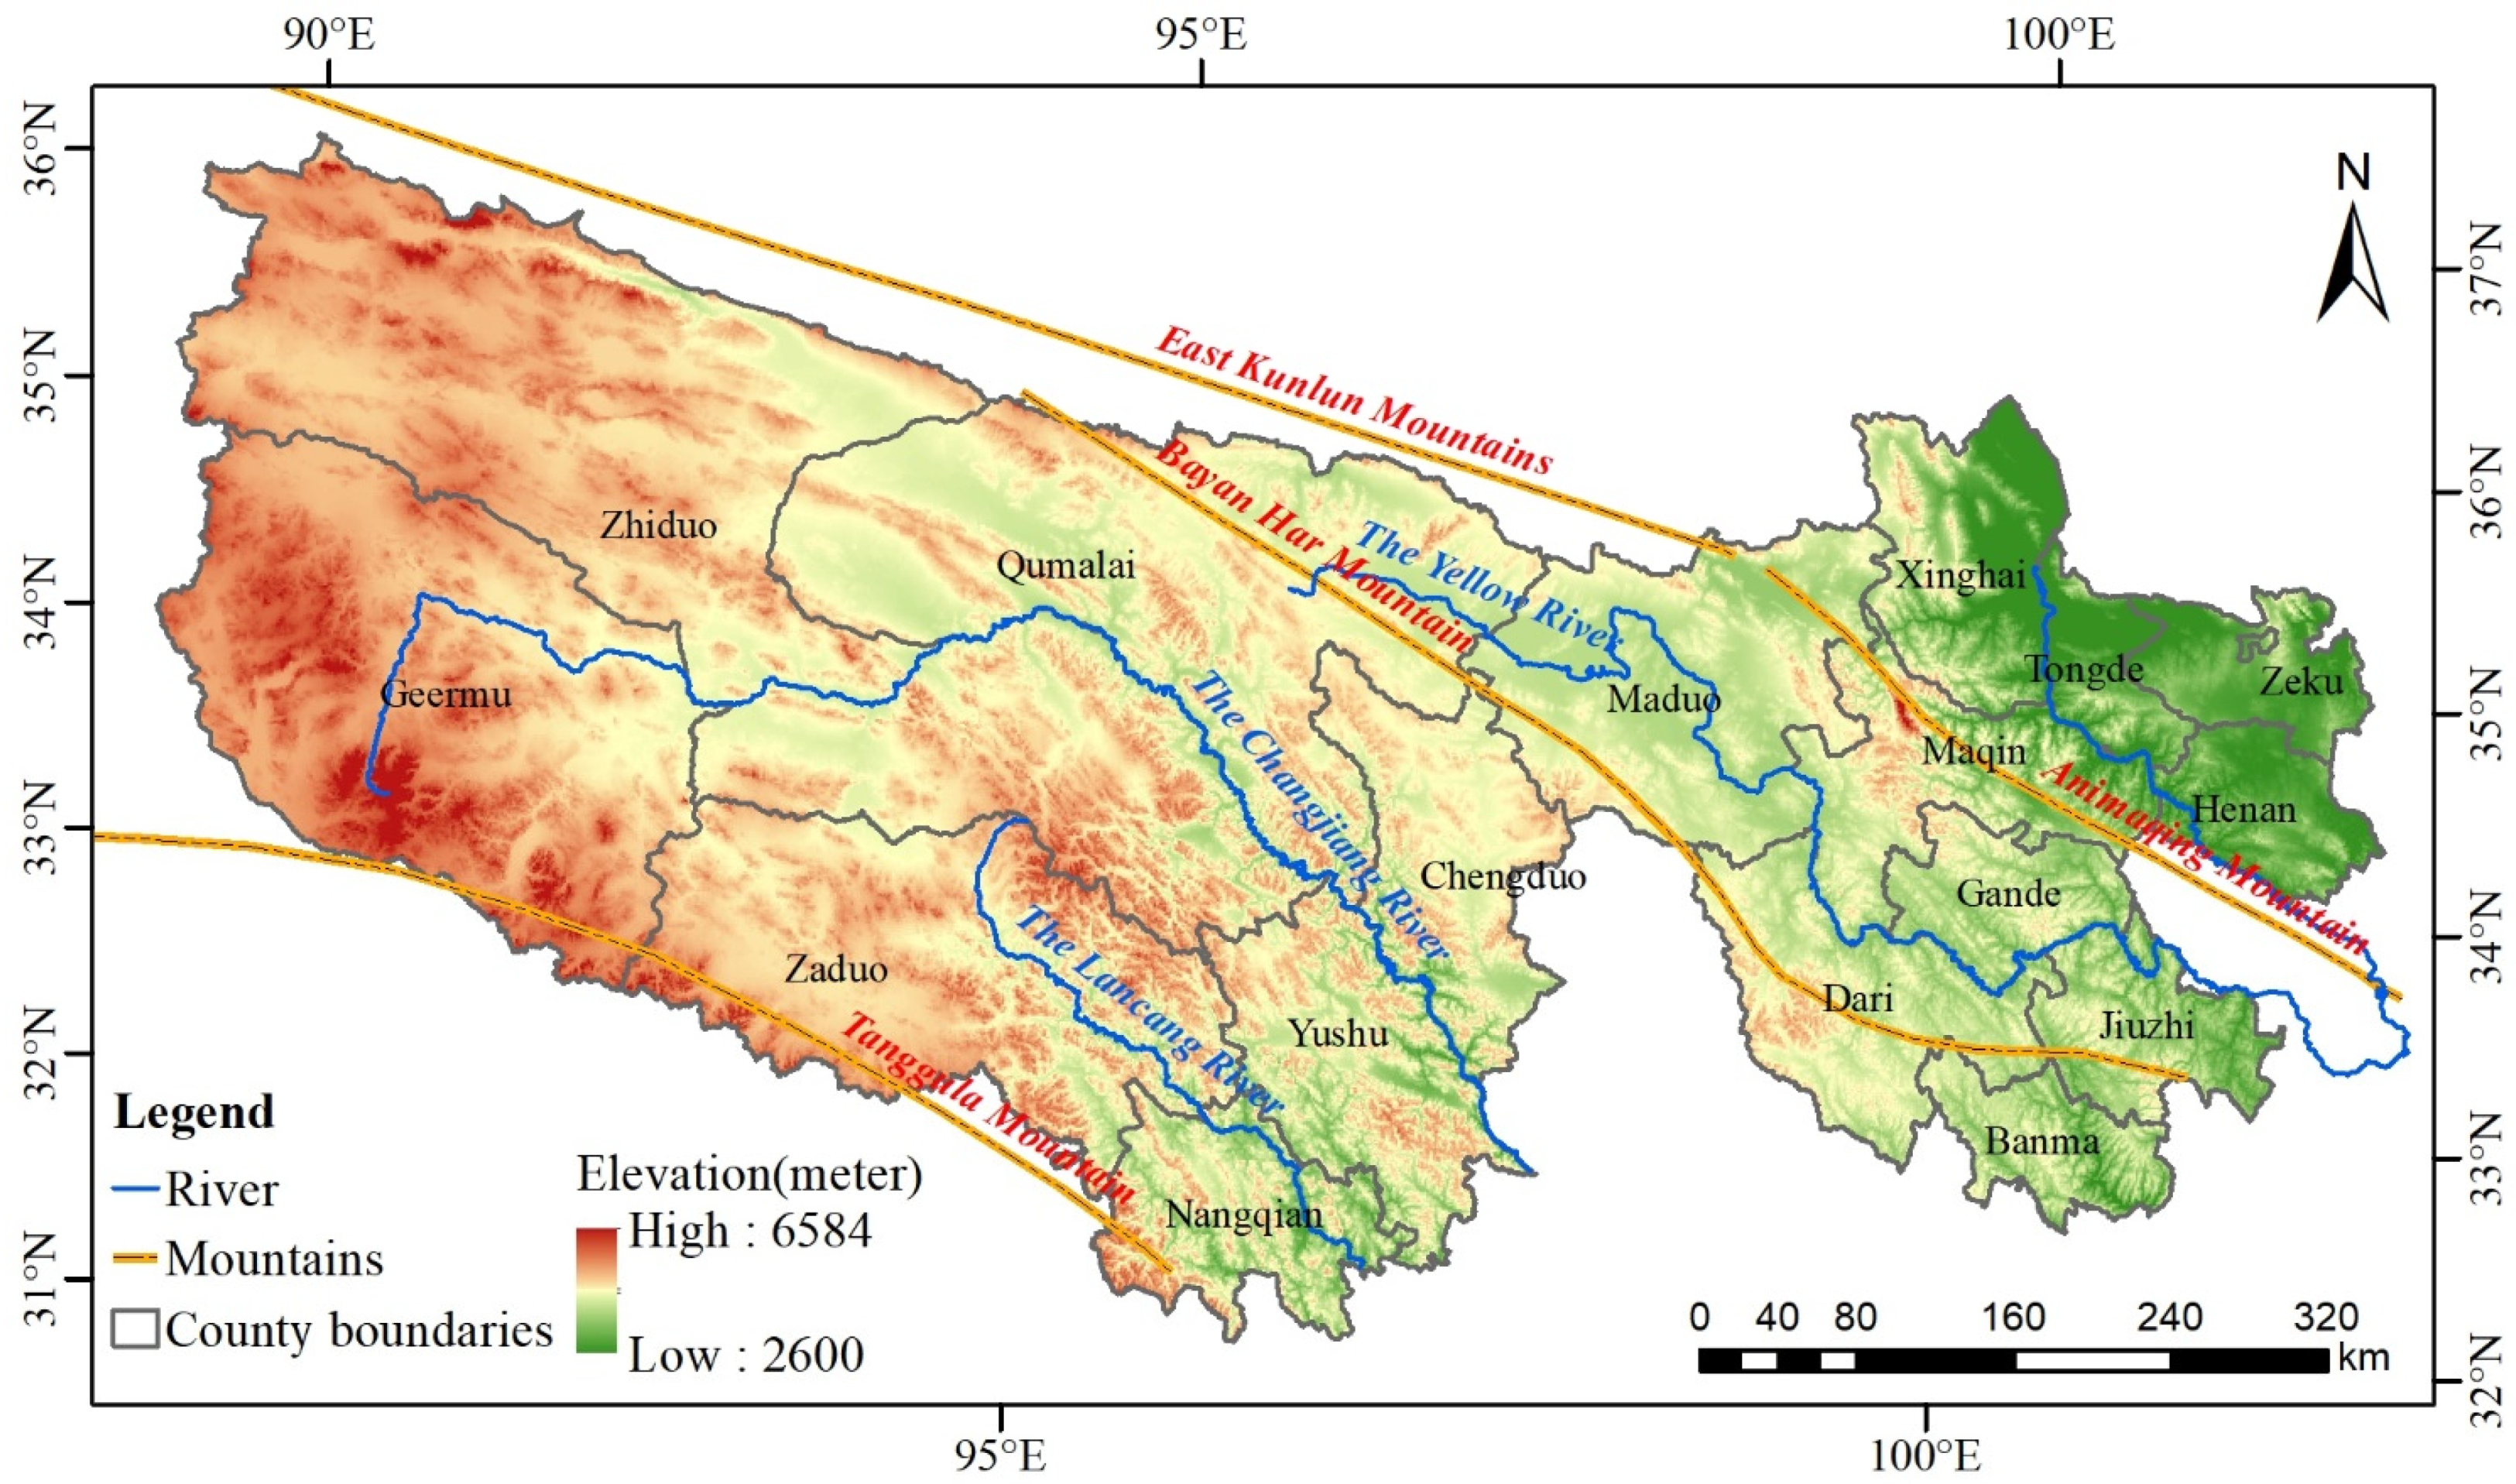
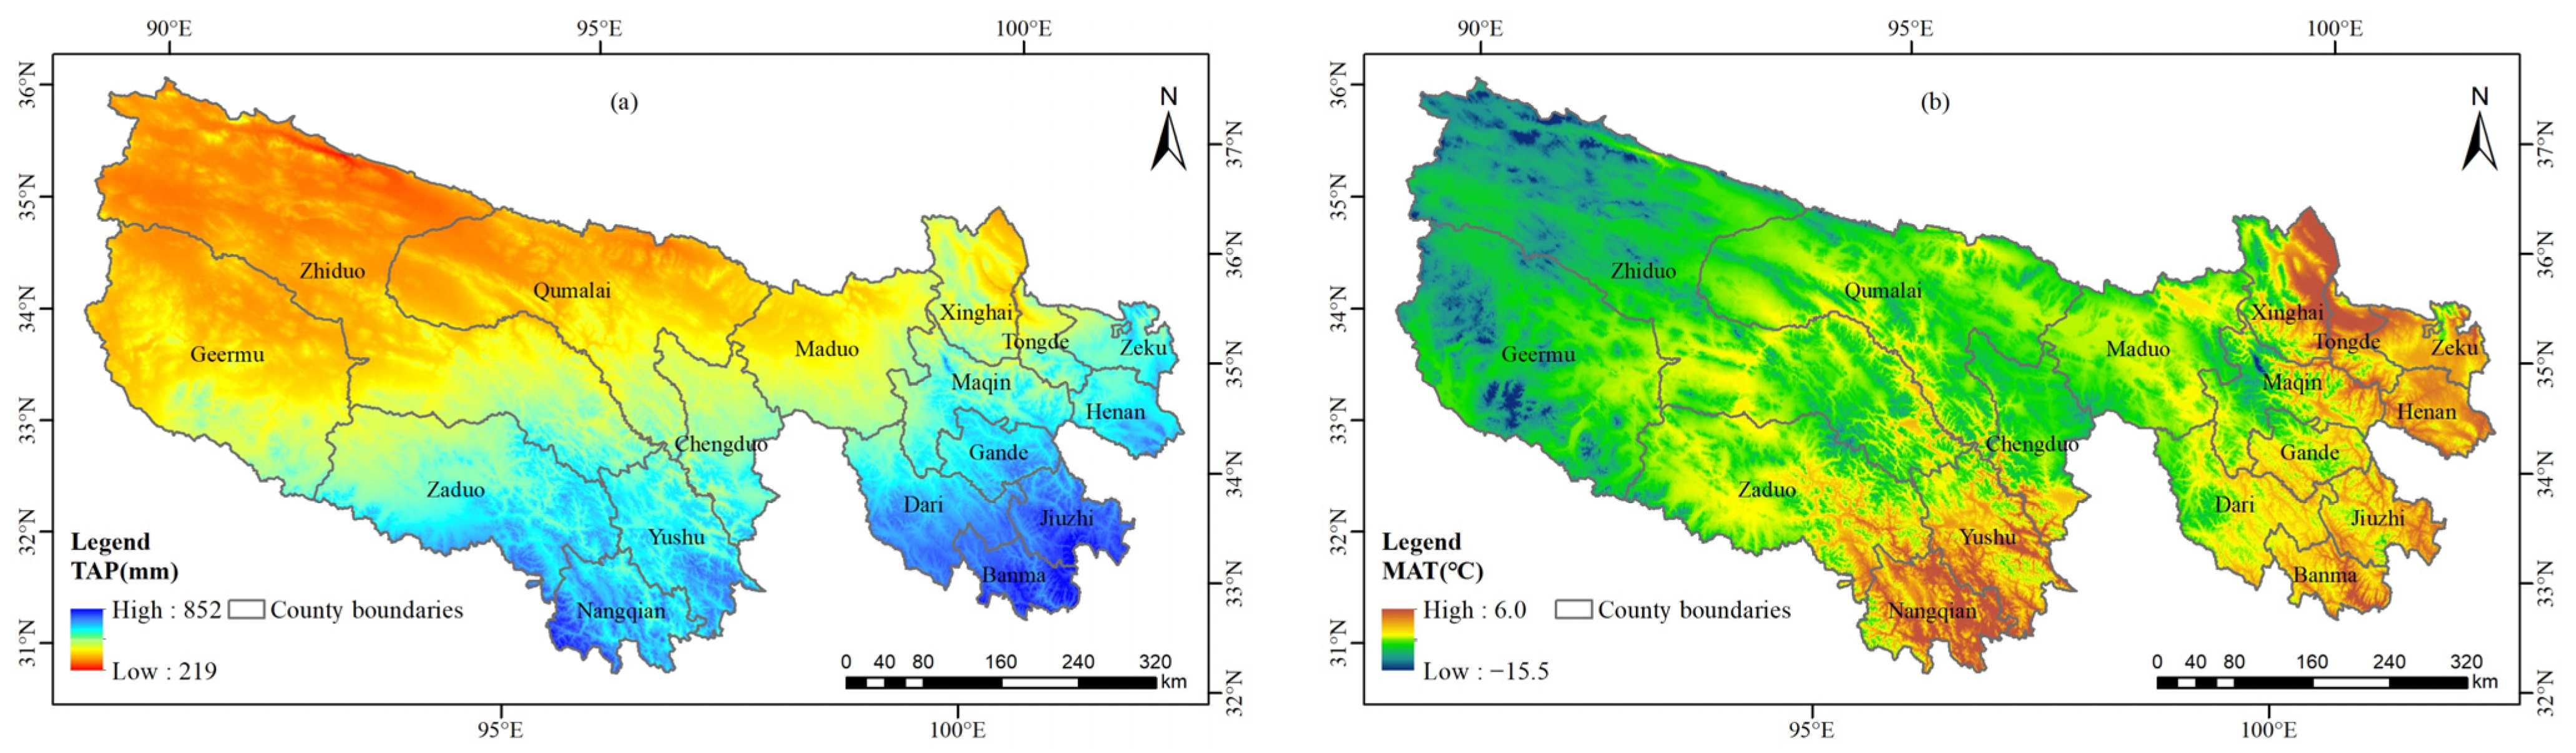
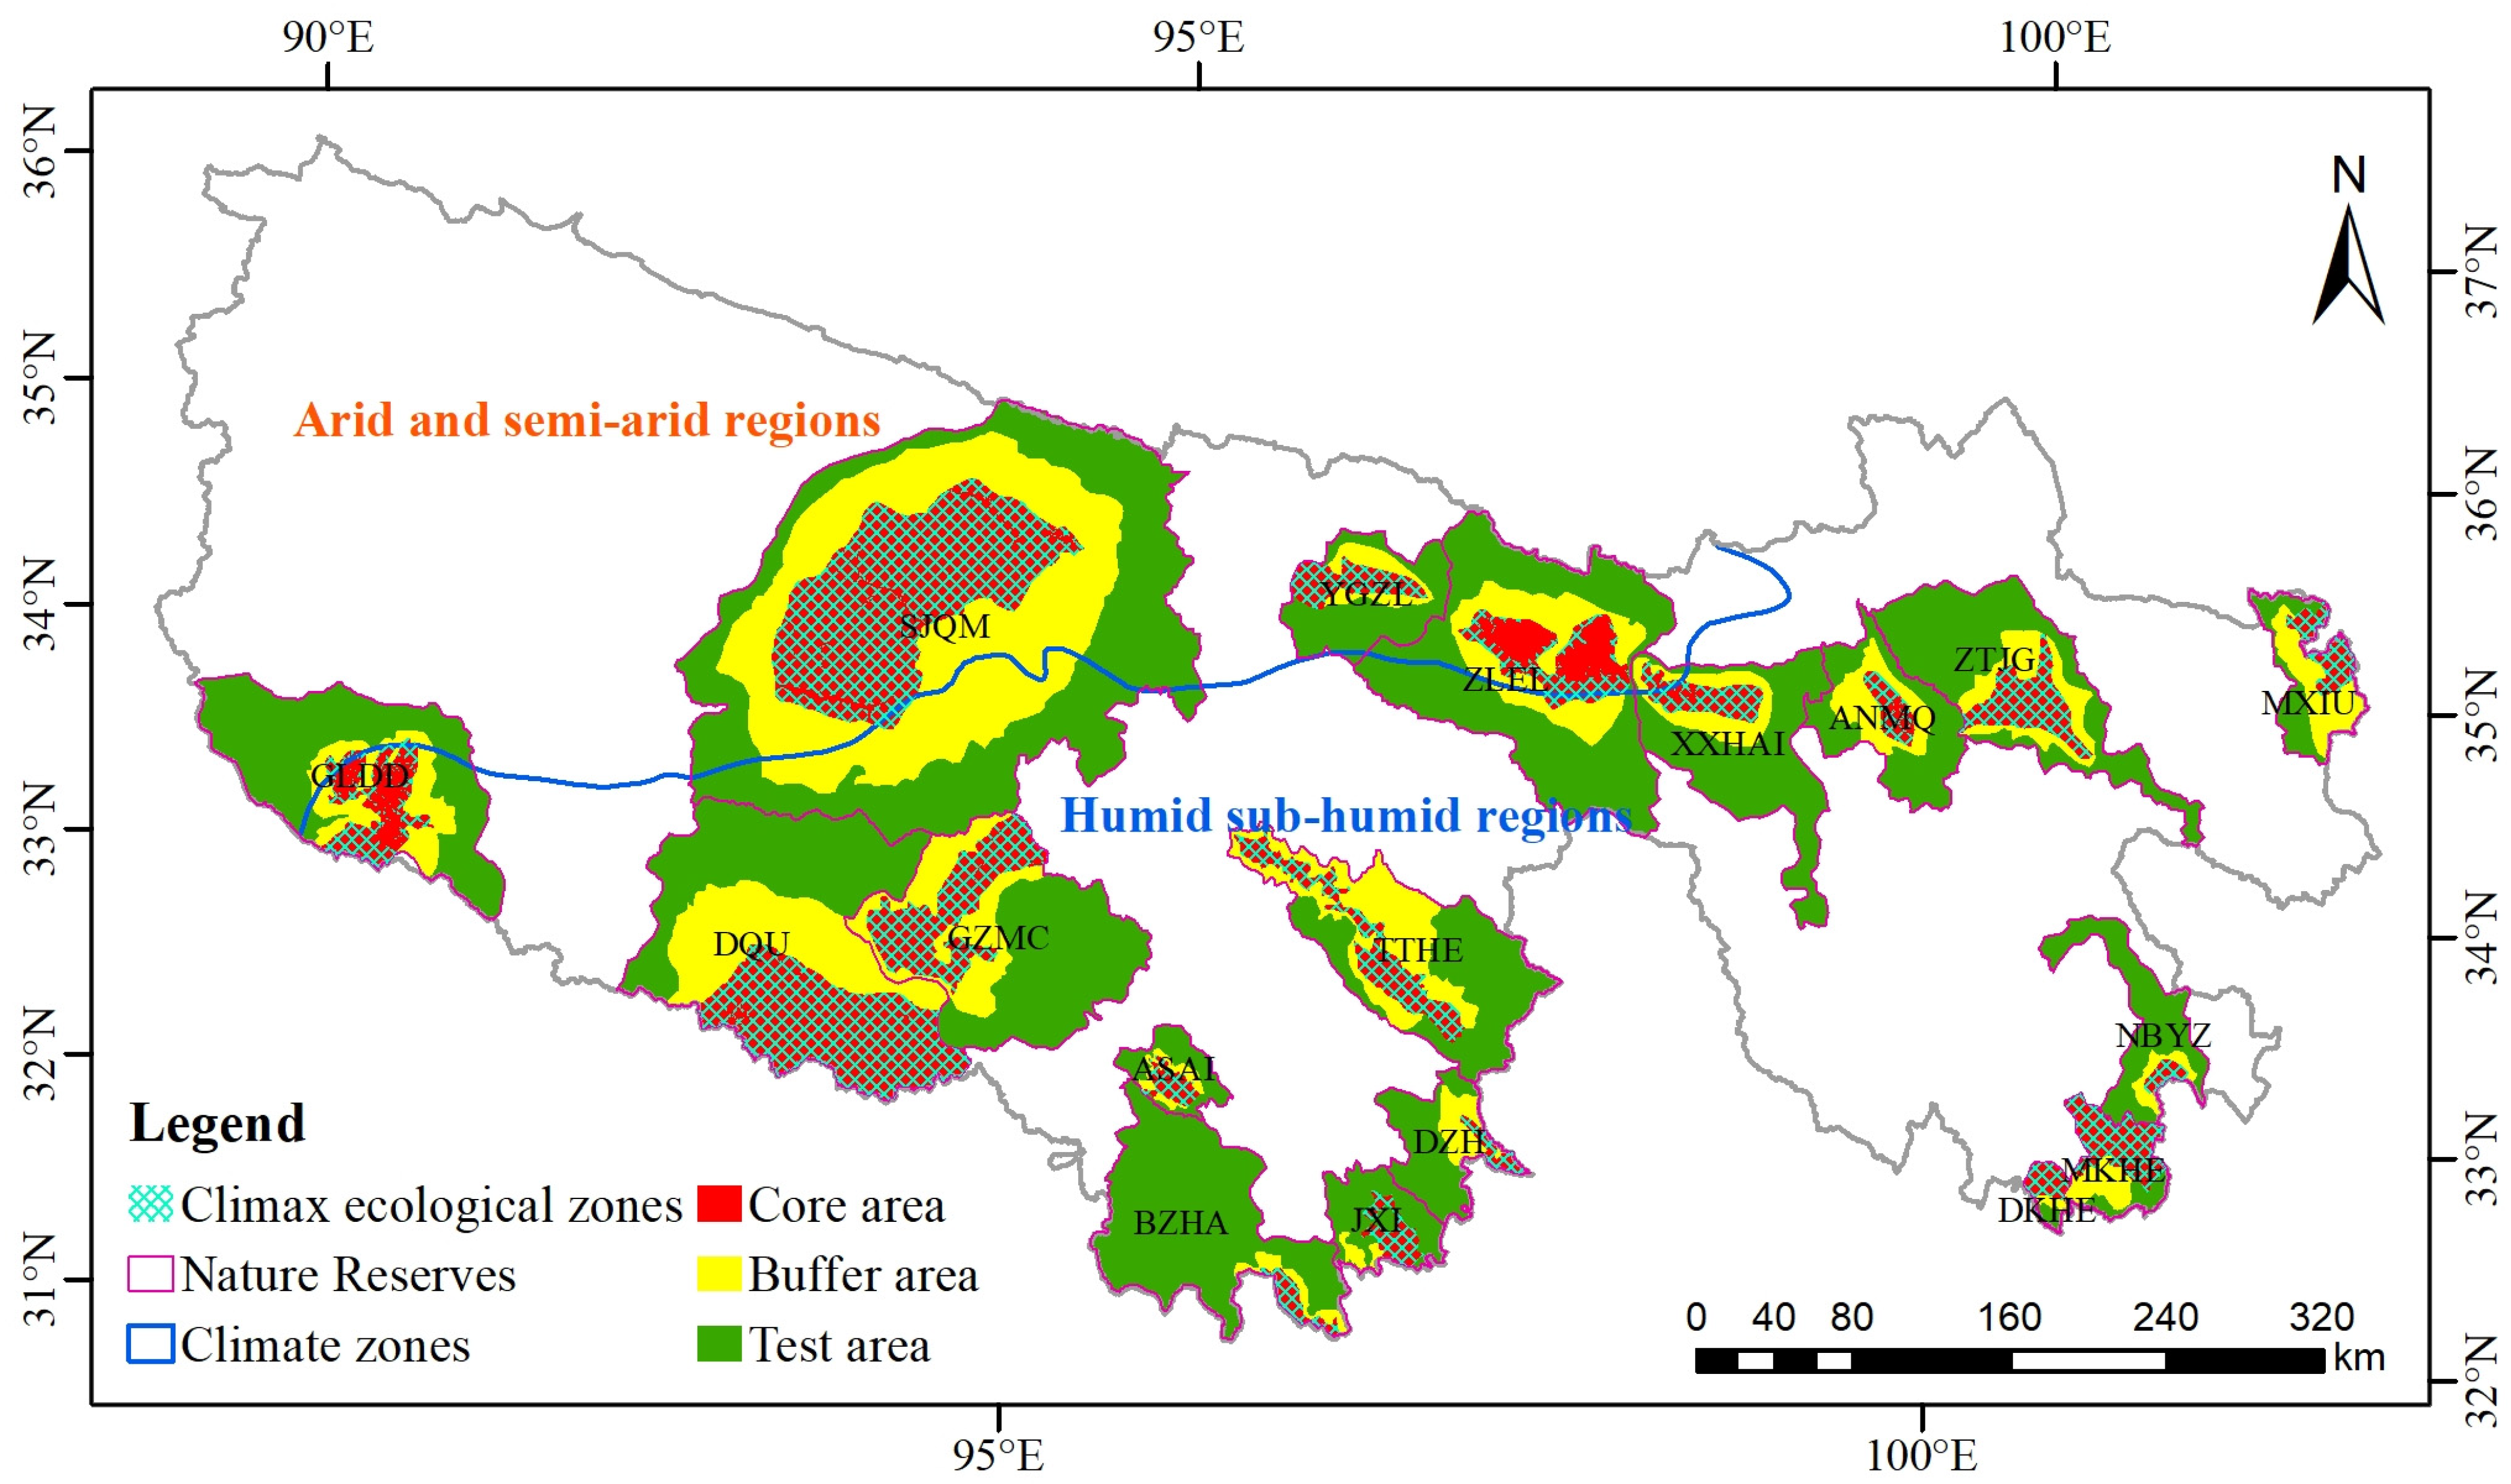
2.1. Study Area

The TRHR is located in the alpine zone on the northeastern edge of the Qinghai–Tibet Plateau, accounting for 14.11% of the total land area of the Qinghai–Tibet Plateau [38]. This area is the source of the first and second-largest rivers in China. The TRHR is dominated by glaciers, ice margins, mountains, highland plains, and hills, with an altitude of 2600–6584 m. The terrain is high in the west and low in the east. The Kunlun Mountains in the east and their branches, Animaqing Mountains, Bayan Har Mountains, and Tanggula Mountains form the main skeleton of the TRHR topography. The climate of TRHR is a typical plateau continental climate, with sufficient light and strong sunshine, annual total radiation of 5500~6800 MJ/m2, cold winter and cool summer, short warm season and long cold season, and annual average temperature of −5.6~−3.8 ℃. The rainfall is relatively low, the rain and heat are in the same period, the dry and wet seasons are distinct, and the annual average precipitation is 262.2~772.8 mm [36]. There are various types of natural vegetation. The vegetation is dominated by shrubs, alpine meadows, alpine grasslands, and alpine vegetation. The grassland ecosystem is the main ecosystem of the TRHR, accounting for about 69.70% of the total area of the region [39]. The TRHR grassland types appear in sequence from southeast to northwest, including alpine meadow, temperate steppe, alpine steppe, and alpine desert, and the productivity decreases in turn [40,41]. The TRHR includes 16 administrative units of counties (cities) including Maduo, as well as Tanggula Mountain Town hosted by Geermu City (Figure 1). The TRHR’s widely distributed glaciers, snow, permafrost, and various types of ecosystems such as alpine swamp wetlands, alpine grasslands, and alpine grasslands provide continuous and stable services such as WR, SR, and WD for the local and surrounding areas. It plays an important role in the stability of the ecological security barrier function of the Qinghai–Tibet Plateau in China.

2.2. Data and Processing

2.2.1. Meteorological Data

The meteorological data came from the China Daily Value Dataset of Surface Climate Data (V3.0) of the China Meteorological Data Network (http://data.cma.cn), which contained the daily value data of elements such as precipitation, air pressure, temperature, wind speed, and sunshine hours of nearly 700 meteorological stations in China. We interpolate to the raster data of China based on these meteorological stations, and obtain the study area raster data according to the TRHR boundary. The Australian National University Spline (ANUSPLIN) method [42,43,44,45] based on the thin slice spline theory was used to spatially interpolate the daily data of temperature and precipitation at the site, and the Kriging interpolation method was used to spatially interpolate the wind speed at the site. Finally, the daily value raster data of 1 km resolution in the study area from 2000 to 2019 was obtained. The total annual precipitation (TAP) (Figure 2a) at a 1 km resolution was obtained by summing the corrected daily precipitation data at a resolution of 1 km. The average annual temperature (MAT) (Figure 2b) with a resolution of 1 km was obtained by averaging the interpolated daily temperature data with a resolution of 1 km.

2.2.2. NDVI and Fraction Vegetation Coverage Data

The NDVI data was derived from the MOD13A2 v006 product (https://ladsweb.modaps.eosdis.nasa.gov) (accessed on 18 September 2020), with a spatial resolution of 1 km and a temporal resolution of 16 days. The maximum value composite method (MVC) was used from 16 days NDVI to the annual NDVI. The Savitzky–Golay (S–G) method of the TIMESAT3.3 software was used to improve the smoothness of the NDVI data.
FVC was calculated from the Normalized Difference Vegetation Index (NDVI) data, with a spatial resolution of 1 km and a temporal resolution of 16 days. The FVC of each pixel was calculated using the bipartite pixel method [26]. For the frequency accumulation table of each NDVI image, the NDVI value corresponding to the frequency of 5% was taken as the NDVI value of pure bare soil, and the NDVI value of the cumulative frequency of 95% was taken as the NDVI value of pure vegetation pixels. At the same time, in order to exclude the influence of outliers on subsequent calculations, the pixels with vegetation coverage less than 0 and greater than 1 were assigned as null values, and finally, the FVC data for 20 years from 2000 to 2019 were obtained.

2.2.3. LUCC Data

Using satellite remote sensing data such as Landsat8 in 2018 and referring to the Chinese land use remote sensing classification system [46,47], the 1:100,000 land use/cover vector data in China in 2018 was obtained through human–computer interaction interpretation. UAV images and field survey data were verified on the spot, and the land use data were revised repeatedly. Finally, the classification accuracy and total accuracy were evaluated through a confusion matrix, and the comprehensive evaluation accuracy reached 93%. Based on the terrestrial ecosystem macrostructure classification system and its transformation relationship with the land use/land cover classification system [48], a 1 km raster percent ecosystem type dataset was generated from the land use data in 2018. Combined with the existing data, a dataset of Chinese ecosystem types in 2000, 2010, and 2018 was built [49].

2.2.4. Nature Reserve Data

The data of nature reserves came from the TRHR Ecosystem Integrated Monitoring and Assessment Dataset [50], which contains 18 nature reserves, namely, Animaqing Reserve (ANMQ), Ansai Reserve (ASAI), Baizha Reserve (BZHA), DangQu Reserve (DQU), Dongzhong Reserve (DZH), DuokeHe Reserve (DKHE), Gladandong Reserve (GLDD), GuozongMucha Reserve (GZMC), Jiangxi Reserve (JXI), MaKeHe Reserve (MKHE), Maixiu Reserve (MXIU), NianbaoYuze Reserve (NBYZ), SuoJiaQumaHe Reserve (SJQM), TongtianHe Reserve (TTHE), Xingxinghai Reserve (XXHAI), YueguZonglie Reserve (YGZL), ZhalingEling Reserve (ZLEL), ZhongtieJungong Reserve (ZTJG) (Figure 3). Each nature reserve is divided into core zone, buffer zone, and test zone. There were three nature reserves in arid and semi-arid areas with precipitation less than 400 mm, and 15 nature reserves in humid and semi-humid areas with precipitation greater than 400 mm.

2.3. Ecosystem Services Accounting Method

2.3.1. Water Retention

WR refers to the magnitude of runoff, flood, and aquifer recharge influenced by changes in ecosystems. We estimated WR using the PSM, which considers the hydrological regulating effect of ecosystems, including forest, grassland, and cropland, compared with bare land. PSM can be expressed as follows [51,52]:
Q = A · J · R  
J =   J 0 · K  
R =   R 0 R g  
where Q is the water retention (m3); A is the area of the ecosystem(hm2); J is the annual runoff rainfall (mm); J0 is the annual average rainfall (mm); K is the ratio of rainfall yielding runoff to total rainfall, which is determined by precipitation and raininess; R is the benefit coefficient of the ecosystem reducing runoff compared with bare land; and R0 and Rg are the runoff yield rates of bare land and the ecosystem, respectively. K, R, R0, and Rg are dimensionless parameters [36,53].
The R0 and Rg of the forest ecosystem are obtained from the published literature and the measured results in published monographs [54]. The Rg of alpine meadows under different vegetation coverage refer to the research results of Li et al. [55] in the source regions of the Yangtze and Yellow Rivers. The Rg of alpine grasslands and temperate grasslands is significantly negatively correlated with grassland vegetation coverage [56]. The calculation formula is as follows:
R g = 0.3187 × f v c + 0.36403   ( R 2 = 0.9337 )  
where fvc is the vegetation coverage (dimensionless); Rg is the rainfall runoff rate of alpine grasslands and temperate grasslands (dimensionless).

2.3.2. Soil Retention

The ecosystem soil retention service represents the difference between the potential soil erosion under bare-soil conditions and the soil erosion that occurs under real vegetation conditions [4,48,57]. The calculation formula is as follows:
S K = S K q S K r
S K q = A q × M
S K r = A r × M
where S K is the ecosystem soil retention (t/a); S K q is the potential soil erosion without vegetation cover (t/a); S K r is the soil erosion under real vegetation conditions (t/a); A q is the potential soil erosion modulus without vegetation conditions (t/hm2/a); A r is the soil erosion modulus under real vegetation conditions (t/hm2/a); M is the area of the study area (hm2). In this study, we used the revised universal soil loss equation (RUSLE) [58,59] to estimate the soil erosion modulus:
A = R × K × L × S × C × P
where A is the soil erosion modulus (t/hm2/a); R is the rainfall erodibility factor (MJ·mm·hm−2·h−1·a−1); K is the soil erodibility factor (t·h·MJ−1·mm−1); LS is the slope length and slope factor; C is the vegetation coverage factor; P is the soil and water retention measure factor; and LS, C, and P are dimensionless parameters. In this study, the method proposed by Cai [60] was used to calculate the C factor:
C = { 1                                         f v c = 0 0.6508 0.3436   l g f v c 0                                       f v c > 78.3 %       0 < f 78.3 %  
where fvc is calculated based on the NDVI; N D V I s o i l is the NDVI value of pure bare soil pixels; and N D V I m a x is the NDVI value of pure vegetation pixels. The calculation method of R, K, L, S, and P factors is consistent with the research method of Sun [36,57].

2.3.3. Windbreak and Sand Fixation

The windbreak and sand fixation magnitudes in an ecosystem represent the difference between the potential wind erosion that would occur under bare-soil conditions and the actual wind erosion that occurs under real vegetation conditions [61]. They are calculated as follows:
F S = F S s F S v
F S s = S L s × M
F S v = S L v × M
where FS is the windbreak and sand fixation amount of the ecosystem(t/a); F S s is the soil wind erosion amount under the bare-soil condition (t/a); F S v is the actual wind erosion amount that occurs under the real vegetation conditions (t/a); S L s is the soil wind erosion modulus under the bare-soil condition (t/hm2/a); S L v is the actual wind erosion amount that occurs under real vegetation conditions (t/hm2/a); and M is the area of the study area (hm2). We used the modified revised wind erosion equation (RWEQ) [62] to estimate the wind erosion modulus as follows:
S L = Q max [ 1 e ( X S ) 2 ] X
Q m a x = 109.8 ( W F × E F × S C F × K × C O G )
s = 150.71 ( W F × E F × S C F × K × C O G ) 0.3711
where SL is the soil wind erosion modulus (kg·m−2); X is the field length (m); Qmax is the maximum sand transport capacity of wind (kg·m−1); S is the length of the key field (m); WF is the meteorological factor (kg·m−1); EF is the soil erodibility factor; SCF is the soil crust factor; K′ is the soil roughness factor; COG is a comprehensive vegetation factor; and EF, SCF, K′, and COG are dimensionless parameters.
COG can effectively reduce the damage of wind erosion, and it is used to determine the influence of growing vegetation, withered vegetation (crops are lodging residues), and vertical residues of crops on soil wind erosion. The product is calculated as follows [61]:
C O G = S L R f × S L R s × S L R c
S L R f = e 0.0438 ( S C )
S L R s = e 0.0344 ( S A 0.6413 )  
S L R c = e 5.614 ( f v c 0.7366 )
where S L R f is the soil loss rate of withered vegetation; SC is the surface coverage of withered vegetation (%); S L R s is the soil loss rate of standing residues; SA is the equivalent area of standing residues; S L R c is the soil loss rate of vegetation coverage; and f v c is the surface vegetation coverage (%). The wind erosion modulus simulation method used in this paper has been well verified in previous research (R2 is 0.85) [53,61].

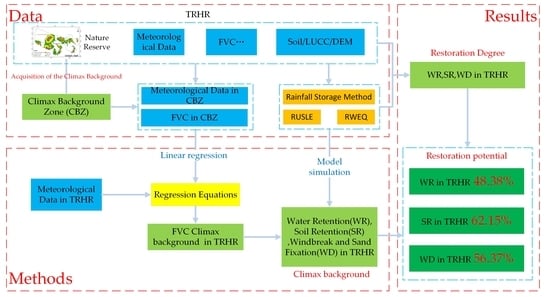
2.4. Ecosystem Service Climax Background Simulation

2.4.1. Acquisition of the Climax Background of Vegetation Coverage in the Climax Ecological Region

The ecosystems in the core area of the nature reserves are less disturbed by human beings, and have been effectively protected after nearly 20 years of ecological protection projects. In this study, the core area of the nature reserve is regarded as the TRHR climax ecological zone (CEZ) after excluding lakes, permanent glaciers, and other water bodies. The vegetation coverage of the CEZ is the vegetation coverage of the zonal climax background. In order to avoid the uncertainty caused by climate fluctuations, we averaged the annual values of FVC in the CEZ from 2017 to 2019 as the vegetation coverage climax background F V C t e z .

2.4.2. TRHR Vegetation Coverage Climax Background Simulation

There are two ways to extend the climax background value of vegetation coverage from CEZ ( F V C t e z ) to the entire TRHR ( F V C t r h r ) [15]: (1) Direct assignment method. (2) Climate factors regression analysis method. The CEZ regression relationships were calculated to the entire TRHR, and the FVC climax background of the entire TRHR ( F V C t r h r ) was calculated. The climatic factor regression analysis was used to calculate the FVC climax background here. In order to increase reasonability and reliability of the multiple regression analysis, we added two factors of eco-geographical zones and ecosystem types for multiple regression. The eco-geographical zones include ‘humid and sub-humid region’ and ‘arid and semi-arid region’. The ecosystem types include forest, grassland, and desert. The calculation formula is as follows [15]:
F V C i j = a + b × M A T i j + c × M T P i j
where F V C i j is the vegetation coverage of the j-th ecosystem in the i-th eco-geographical subregion (%); M A T i j is the average temperature of the j-th ecosystem in the i-th eco-geographical subregion (°C); and M T P i j is the average precipitation (mm) of the j-th ecosystem within the i-th eco-geographical subregion. According to the previous research results [15], we used historical FVC and annual maximum FVC to correct the climax background FVC.

2.4.3. TRHR Ecosystem Services Climax Background Simulation

Based on meteorology, land use/land cover, soil, topography, and vegetation coverage climax background data, the WR, SR, and WD services climax background of TRHR ecosystems were calculated by using the improved PSM, RUSLE, and RWEQ models.
(1) Water retention climax background estimation of TRHR ecosystems. (1) The annual rainfall total J0 is obtained by calculating the average of 2010–2019 precipitation, and the runoff rainfall Jtop is calculated according to the ratio parameter K and J0. (2) The Rg of the alpine meadow is calculated according to the FVCZcb and Li’s [55] research results in the source regions of the Yangtze and Yellow Rivers. The Rg of alpine steppe and temperate steppe were calculated by Zhu’s method [56] according to the climax vegetation coverage FVCZcb. Based on the TRHR land use/land cover data, using the rainfall runoff rate of each ecosystem type minus the rainfall runoff rate of the bare land, the benefit coefficient RZcb of reducing the runoff of each TRHR ecosystem compared with the bare land is obtained. (3) The WR climax background of TRHR service is calculated by PSM with JZcb and RZcb.
(2) Soil retention climax background estimation of TRHR ecosystems. (1) According to the FVC climax background FVCZcb, the coverage and management factor CZcb is obtained by the Cai method. (2) The calculation methods of K, L, S, R, and P remain unchanged. (3) The soil erosion modulus under the TRHR climax background condition was calculated by the RSULE equation with CZcb, K, L, S, R and P. (4) Using the potential soil erosion modulus under the condition of no vegetation cover and subtracting the soil erosion modulus under the climax background condition, the TRHR soil conservation climax background was obtained.
(3) Windbreak and sand fixation climax background estimation of TRHR ecosystems. (1) Calculate the growth vegetation factor and the withered vegetation factor according to the vegetation coverage climax background FVCZcb, so as to obtain the comprehensive vegetation factor COGZcb. (2) The calculation methods of Wf, SW, SD, EF, SCF, and K′ remain unchanged. (3) Substitute the COGZcb, Wf, SW, SD, EF, SCF, and K′ factors into the RWEQ equation to obtain the soil wind erosion modulus under the TRHR climax background condition. (4) Using the potential soil wind erosion modulus without vegetation coverage, and subtracting the soil wind erosion modulus under the climax background condition, the climax background of the TRHR windbreak and sand fixation service is obtained.

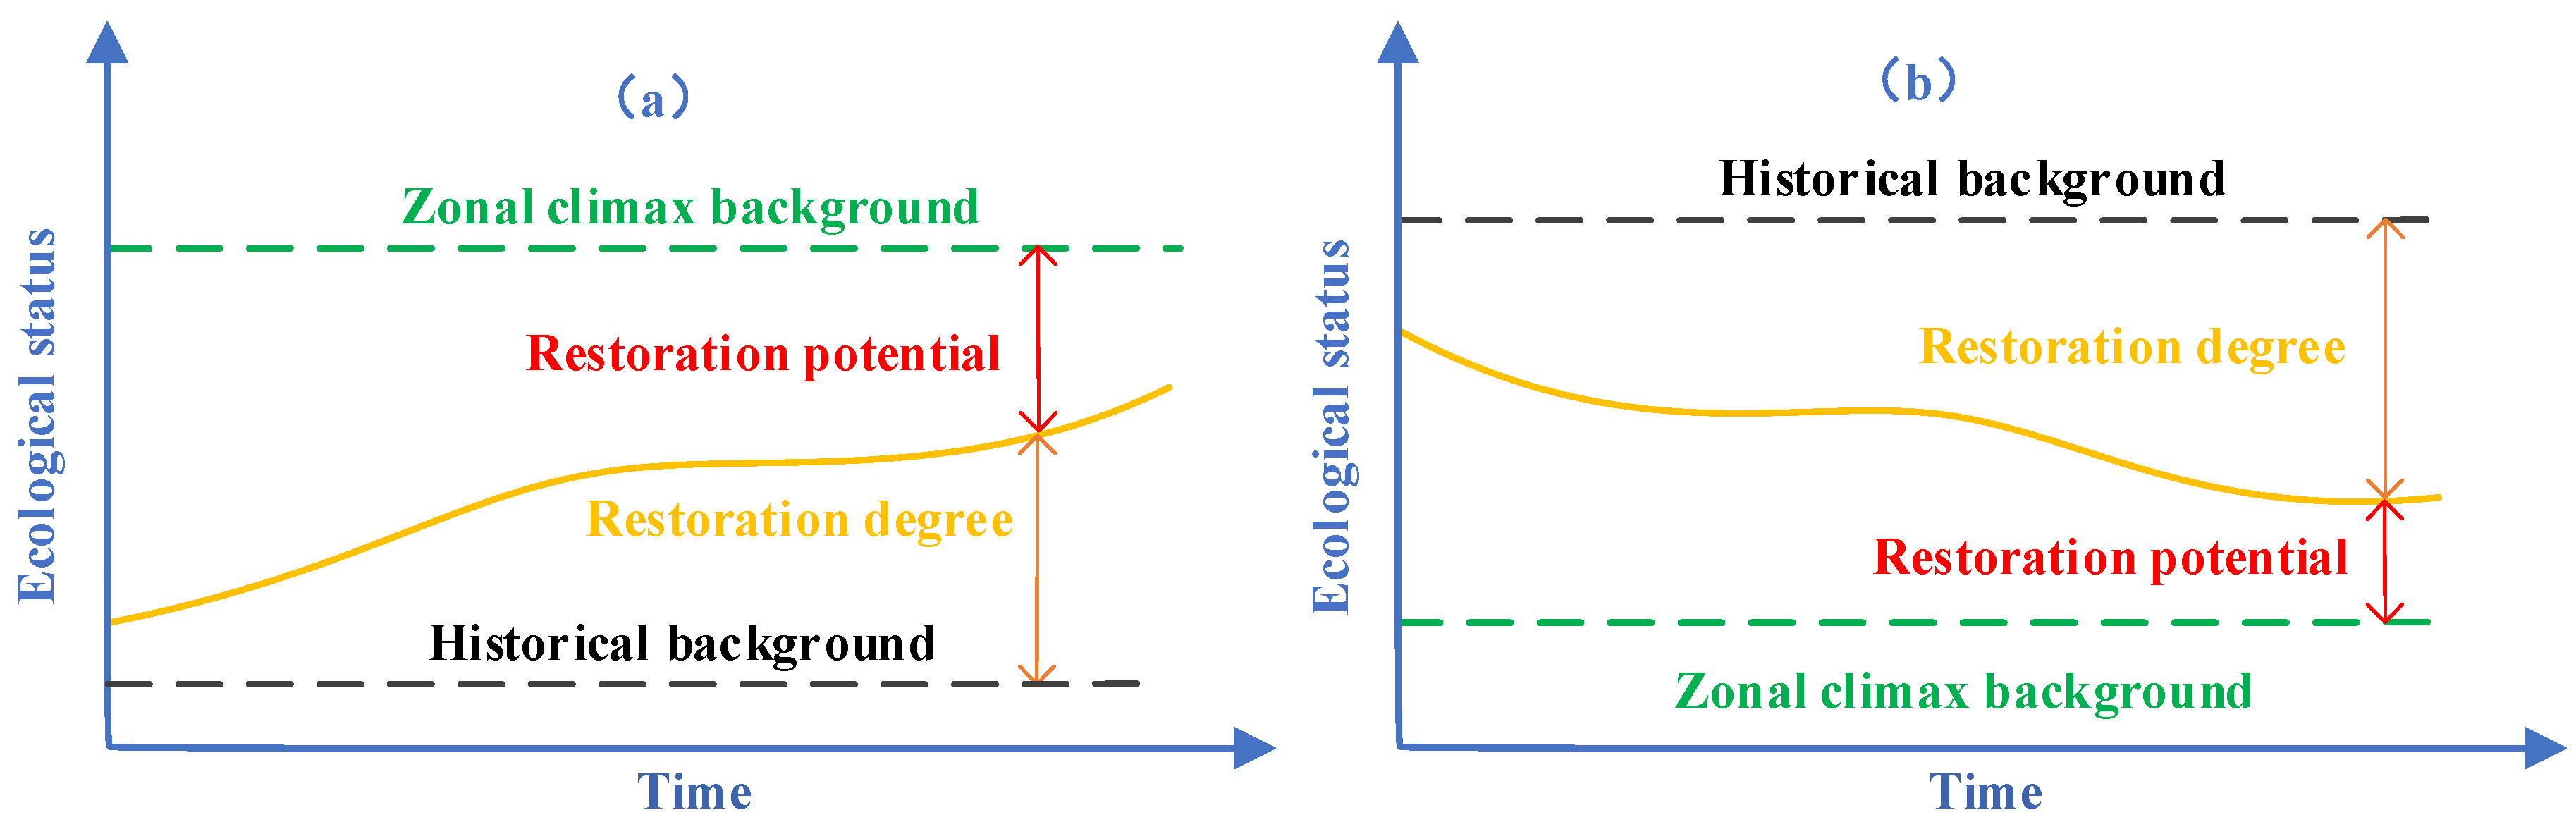
2.5. Calculation of Degree of Restoration and Restoration Potential of Ecosystem Services

Restoration potential is the difference between the restoration degree of ecosystem services and the climax background of ecosystem services in the same zone, and its calculation formula is as follows:
E S d e g = i = 1 n E S i / n
E S p o t = { E S Z c b E S d e g ,     E S Z c b > E S h i b E S d e g E S Z c b ,     E S h i b > E S Z c b
where E S d e g is the restoration degree of ecosystem services, i is the year, and n is the number of years for obtaining the average value of ecosystem services; considering that the ecosystem services in a single year are affected by climate fluctuations, it cannot accurately reflect the restoration degree of the ecosystem services. This paper takes the three-year average value of ecosystem services from 2017 to 2019 as the restoration degree which can reflect ecological engineering effects. E S p o t is the restoration potential of ecosystem services. E S Z c b is the climax background of ecosystem services. E S h i s is the historical background of ecosystem services. In order to prevent ecosystem services from being affected by climate fluctuations, the average value of ecosystem services in the three years before the implementation of the ecological project was used as the historical background. When an ecosystem service is gradually improved with the implementation of ecological engineering, that is, E S Z c b > E S h i b , the restoration potential is E S Z c b E S d e g (Figure 4a). When an ecosystem service gradually decreases due to the influence of natural factors, that is, E S h i b > E S Z c b , the restoration potential is E S d e g E S Z c b (Figure 4b).

3. Results and Analysis

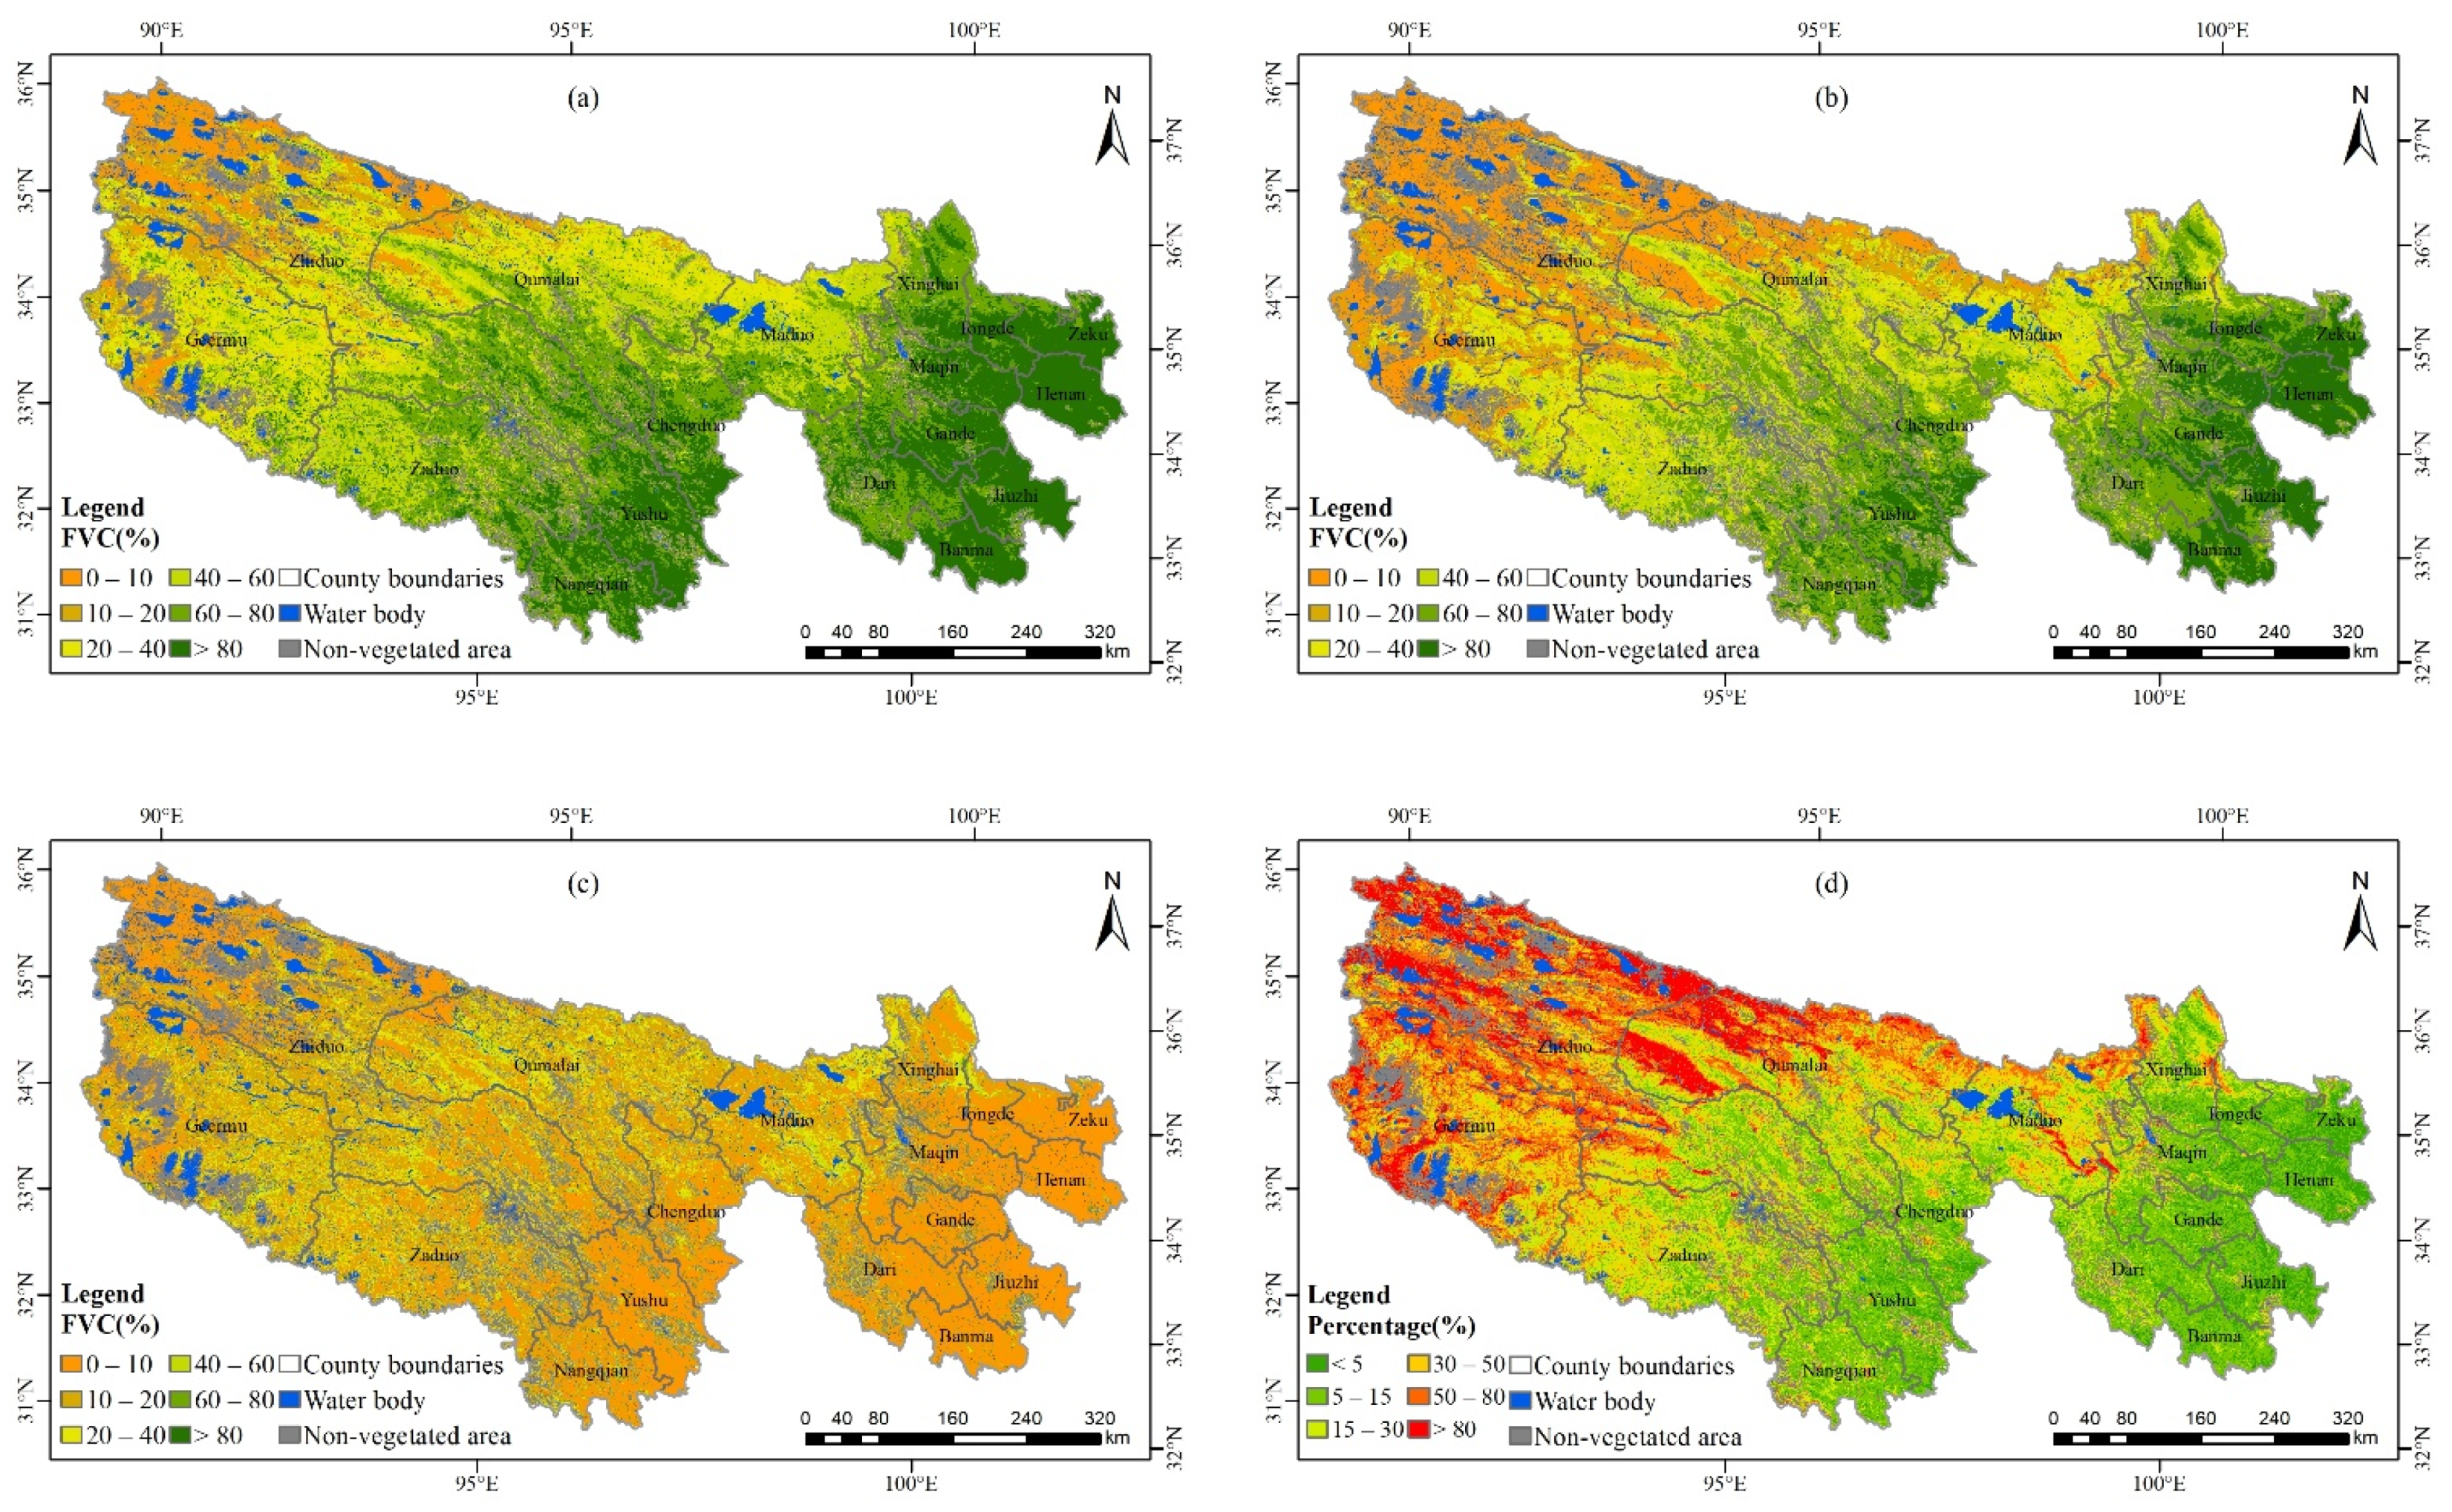
3.1. Climax Background, Restoration Degree, and Restoration Potential of FVC

The obtained binary linear regression equation, R2 value, and significance are shown in the following table (Table 1). Except for the water body and non-vegetation areas, the FVC climax background of TRHR was 59.15%, showing a decreasing trend from southeast to northwest (Figure 5a). Due to the widespread distribution of forest land and high-coverage grasslands in the central and eastern regions, the FVC is relatively high, and the FVC in most areas is more than 60%. Among them, the FVC climax background of Henan, Jiuzhi, Zeku, Gander, Zeku, Yushu, Nangqian, Tongde, and Maqin in the east are all over 80%, and the values are 91.76%, 89.66%, 88.30%, 85.44%, 85.41%, 84.04%, 82.07%, 81.90%, and 80.42%, respectively. The FVC climax background of Qumalai, Zhiduo, and Geermu were below 50% in the northwest region due to the large distribution of bare land and bare rock texture, and the values are 46.45%, 37.96%, and 36.44%, respectively (Table 2).
The FVC restoration degree of TRHR was 45.27% (Figure 5b), and its spatial distribution, which was high in the southeast and low in the northwest, was relatively consistent with the spatial distribution of the climax background. The counties with a restoration degree above 80% were mainly concentrated in Henan, Jiuzhi, and Zema in the east of TRHR, and the values were 86.91%, 83.51% and 81.37%, respectively. The restoration degree of Zaduo, Maduo, Qumalai, Zhiduo, and Geermu in the northwest were all below 50%, and their values were 49.72%, 38.94%, 28.21%, 23.55%, and 17.64%, respectively.
The restoration potential of TRHR FVC represented the gap between its restoration degree and the climax background. The FVC restoration potential of TRHR was 13.88% (Figure 5c), and the FVC restoration potential in each county was less than 20%. Among them, the FVC restoration potential in Geermu, Qumalai, Maduo, and Zaduo counties near the boundary of the 400 mm dry and wet zone were 18.80%, 18.24%, 16.49%, and 15.83%, respectively. This shows that local water and heat conditions could support the restoration of vegetation coverage to a greater extent; while the FVC restoration potential in Jiuzhi, Zeku, and Henan in the east of TRHR were relatively small, the values were 6.16%, 6.03%, and 4.83%, respectively.
From the perspective of the ratio of FVC restoration potential to the FVC climax background (PCBR), the PCBR of TRHR was 33.36% (Figure 5d), of which the PCBR in the northwest was relatively large, with more than 50% in most areas. Meanwhile, the PCBR in the southeast was relatively smaller, generally below 15%. In terms of restoration potential or PCBR, the FVC restoration in the southeast of TRHR was relatively small.

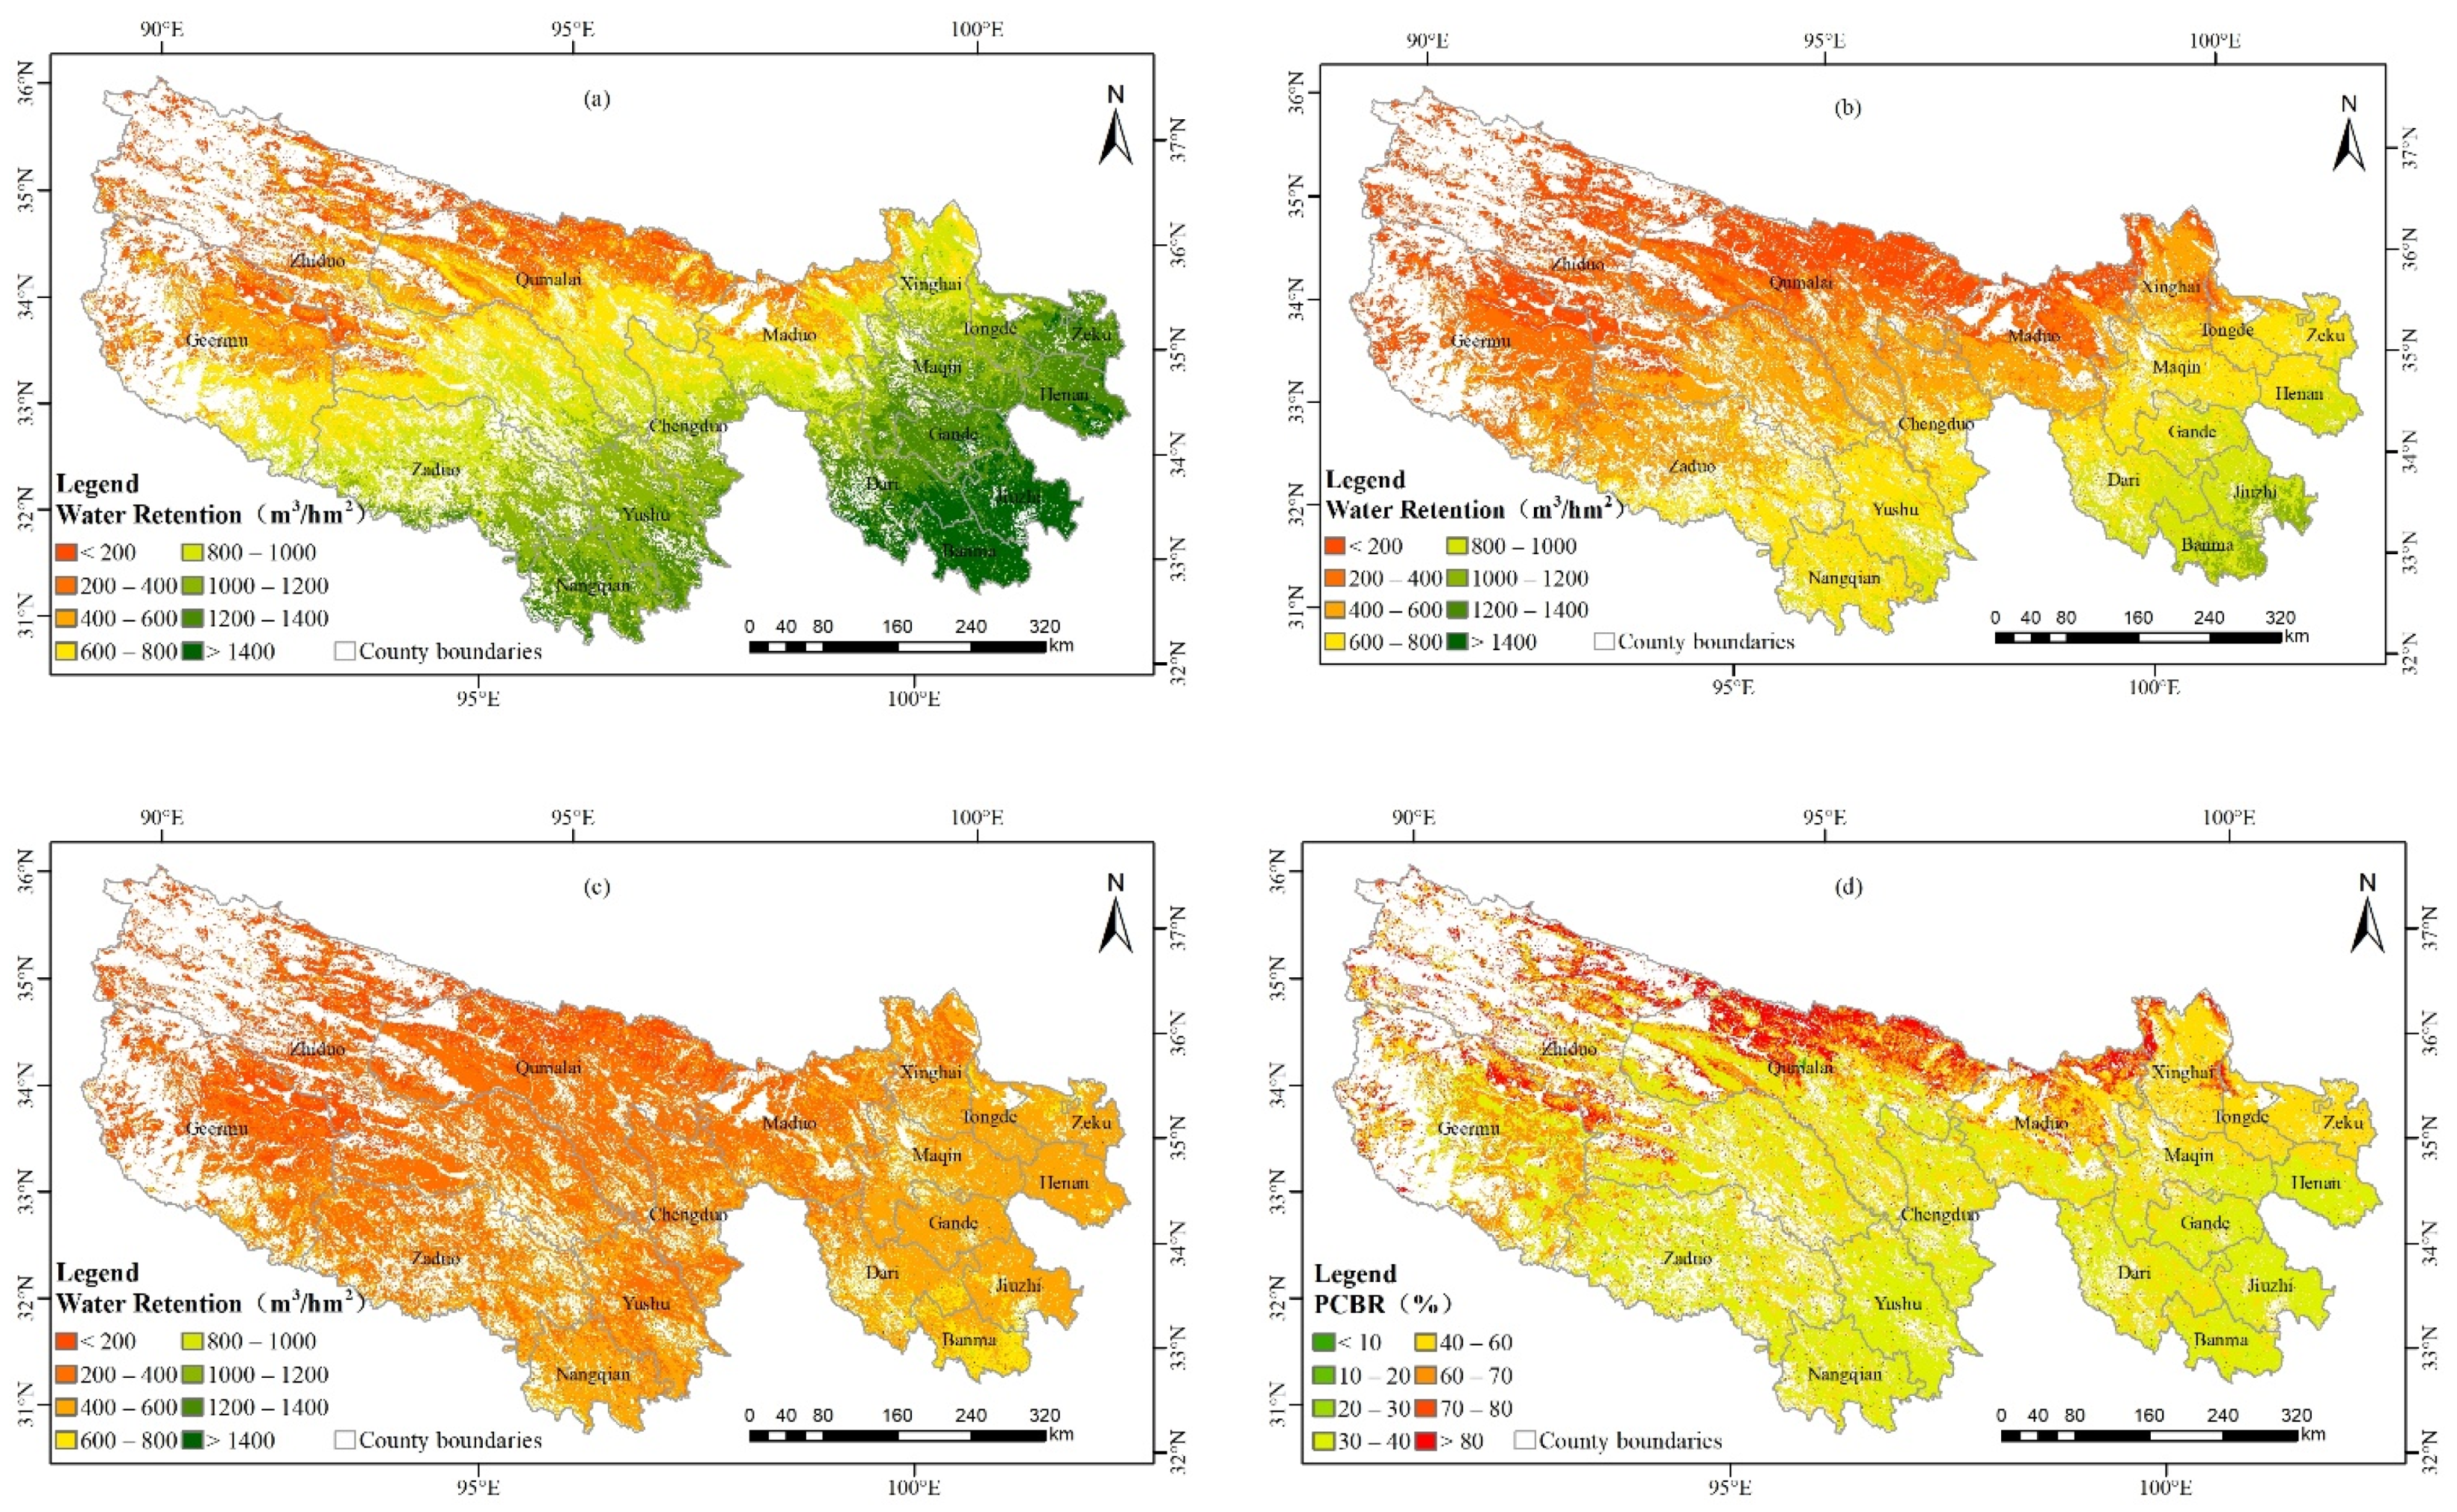
3.2. Climax Background, Restoration Degree, and Restoration Potential of Water Retention Services

Except for water bodies and non-vegetation areas, the WR climax background of the TRHR’s forest and grassland ecosystems was 20.604 billion m3, and the water retention per unit area was 858.71 m3/hm2. From a spatial point of view, the WR climax background of the TRHR’s forest and grassland ecosystems showed a decreasing trend from southeast to northwest (Figure 6a). Due to abundant rainfall and widespread distribution of ecosystem types such as woodlands and alpine meadows in the southeastern region, the water conservation per unit area in most regions was more than 1000 m3/hm2. Among them, the water retention per unit area of Banma, Jiuzhi, Dari, Henan, and Gander were higher, and the values were 1563.57 m3/hm2, 1495.54 m3/hm2, 1311.53 m3/hm2, 1307.49 m3/hm2, and 1292.63 m3/hm2. However, due to the sparse precipitation, the large distribution of bare land and bare rock texture, and the low coverage of forest and grass vegetation, the water retention per unit area in the most northwest region was below 800 m3/hm2. Among them, Zhiduo, Qumalai, and Geermu had lower water retention per unit area, with values of 519.31 m3/hm2, 509.53 m3/hm2 and 502.79 m3/hm2, respectively (Table 3).
The restoration degree of water retention in the TRHR forest and grassland ecosystem was 11.536 billion m3, and the water retention per unit area is 481.08 m3/hm2, which showed a spatial distribution characteristic of high in the southeast and low in the northwest (Figure 6b). This was more consistent with previous research results of the spatial pattern of decreasing water conservation in TRHR from southeast to northwest [4,54,63,64]. The restoration of water retention per unit area in Banma, Jiuzhi, Dari, and Gander were the largest counties of TRHR. In the northwest, in Zaduo, Xinghai, Maduo, Zhiduo, Qumalai, and Geermu, the restoration degree of water retention per unit area were below 500 m3/hm2, and the values were 437.72 m3/hm2, 347.09 m3/hm2, 264.95 m3/hm2, 240.06 m3/hm2, and 235.66 m3/hm2.
The TRHR water retention restoration potential represented the gap between its restoration degree and the climax background. The restoration potential of water retention in the TRHR forest and grassland ecosystem was 9.058 billion m3, and the water retention per unit area was 377.87 m3/hm2 (Figure 6c). The restoration potential of water conservation per unit area in the counties of the TRHR ranged from 254.56 m3/hm2 to 618.04 m3/hm2. Among them, Qumalai, Geermu, and Zhiduo in the northwest of TRHR had lower water retention potential values per unit area, which were 269.55 m3/hm2, 267.18 m3/hm2, and 254.56 m3/hm2, respectively. Banma, Jiuzhi, Zeku, and Henan had relatively large restoration potential of water retention per unit area, with values of 618.04 m3/hm2, 605.45 m3/hm2, 552.36 m3/hm2, and 543.63 m3/hm2, respectively.
From the perspective of the ratio of WR restoration potential to the WR climax background (PCBR), the PCBR of TRHR was 48.38% (Figure 6d), of which the PCBR in the north and northwest of TRHR was relatively large, and most areas were above 70%. Meanwhile, the PCBR in the southern part of TRHR was relatively small, generally below 40%.

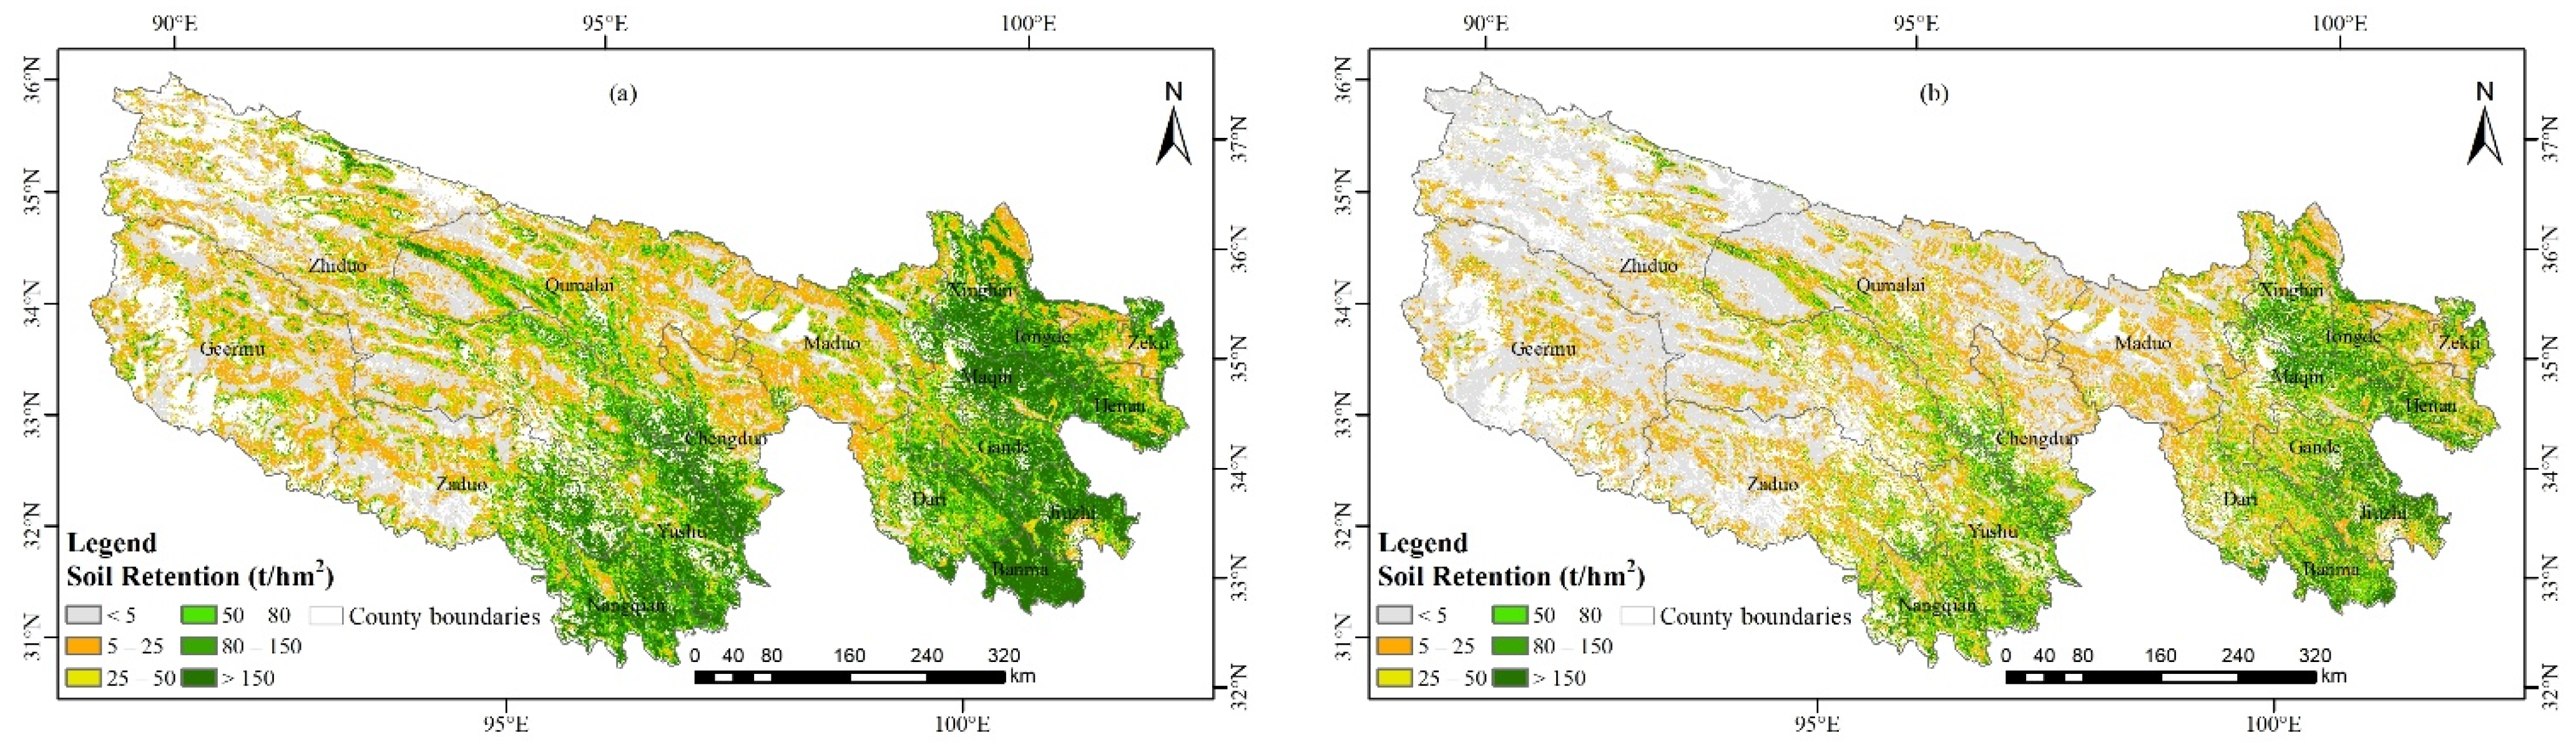
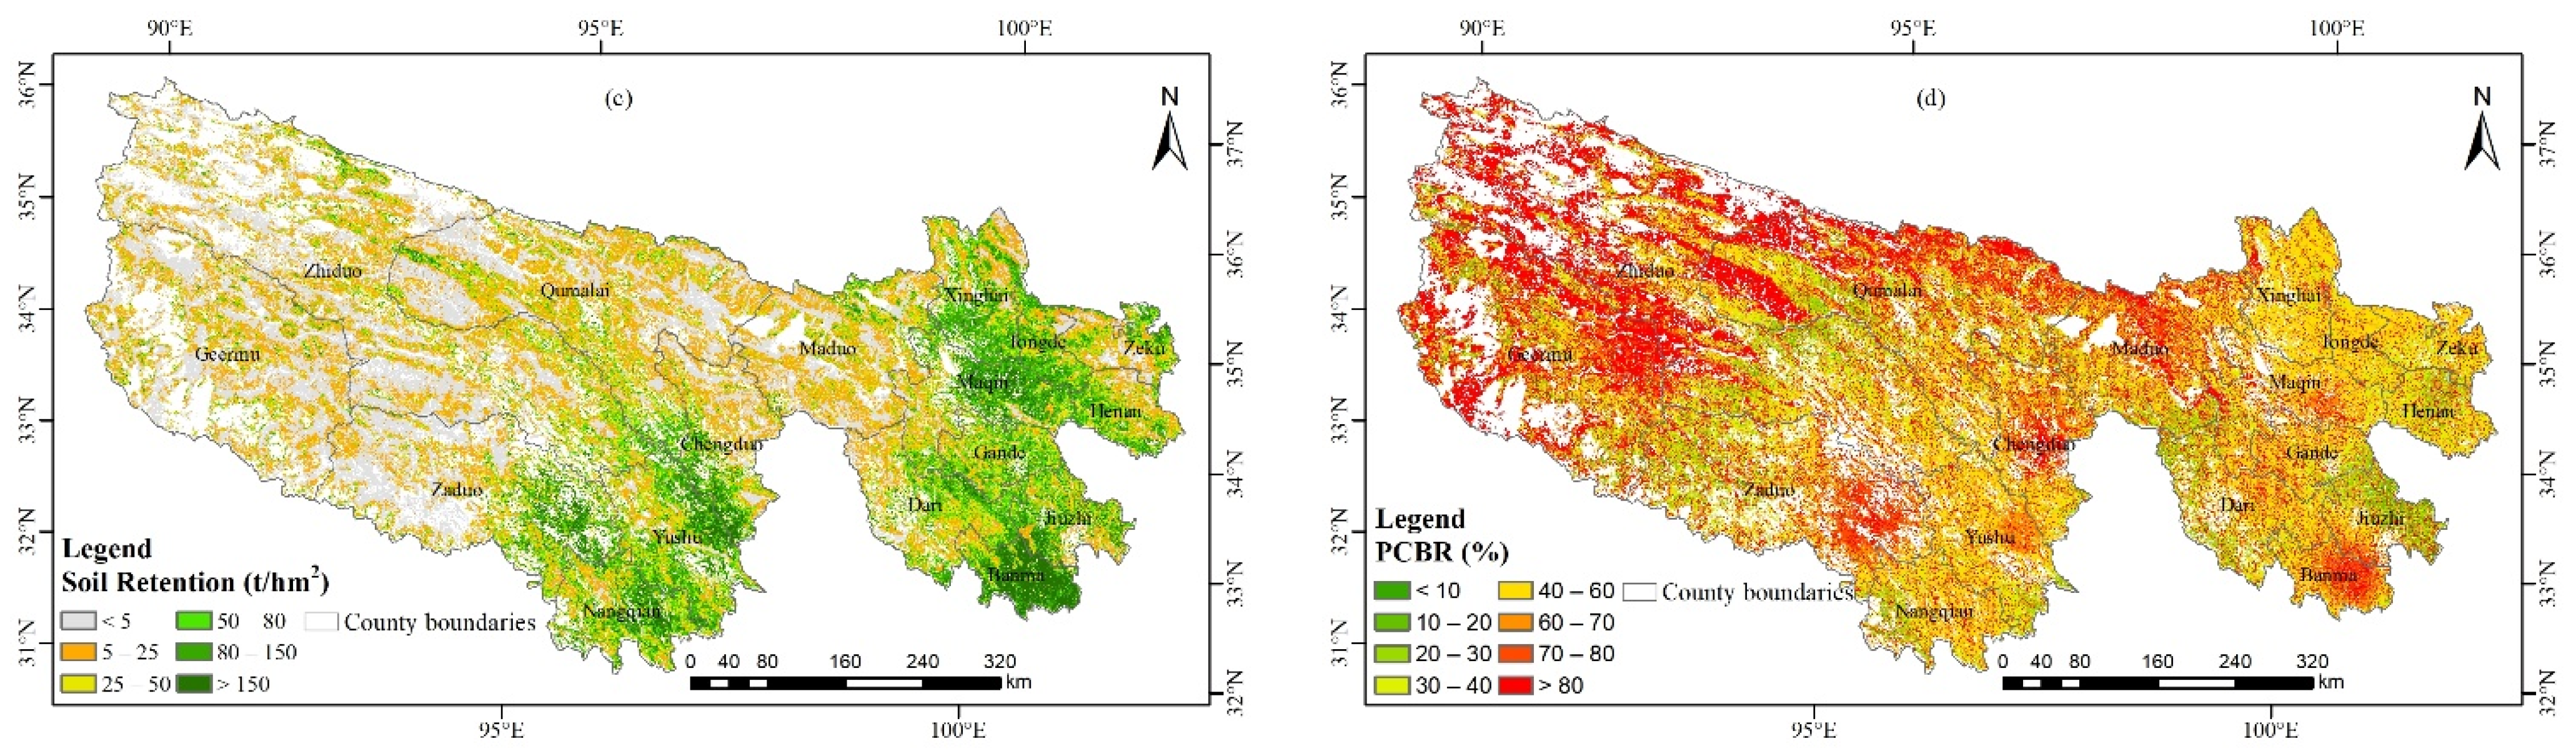
3.3. Climax Background, Restoration Degree, and Restoration Potential of Soil Retention

Except for water bodies and non-vegetated areas, the soil retention climax background of the TRHR ecosystems was 1.989 billion t, and the soil retention per unit area was 68.23 t/hm2. From a spatial point of view, the soil retention capacity of TRHR showed a decreasing trend from southeast to northwest (Figure 7a). The southeastern region was rich in precipitation, and the ecosystem types such as forest and alpine meadow were widely distributed; this could effectively reduce soil erosion, so the soil retention per unit area in most regions was more than 100 t/hm2. Among them, Banma, Jiuzhi, Tongde, Nangqian, Maqin, Yushu, Henan, Xinghai, and Gander had higher soil retention per unit area, with values of 257.26 t/hm2, 169.16 t/hm2, 145.02 t/hm2, 143.96 t/hm2, 136.55 t/hm2, 130.71 t/hm2, 122.76 t/hm2, 122.70 t/hm2, and 118.39 t/hm2. Due to the relatively scarce precipitation, the large distribution of bare land and bare rock texture, and the low coverage of forest and grass vegetation, the soil retention per unit area in most northwestern regions was below 50 t/hm2. Among them, Qumalai, Maduo, Zhiduo, and Geermu had the lowest soil retention per unit area, with values of 35.84 t/hm2, 32.72 t/hm2, 30.22 t/hm2, and 19.92 t/hm2, respectively (Table 4).
The restoration degree of soil retention services in the TRHR ecosystems was 840 million t, and the soil retention per unit area was 29.98 t/hm2, which showed a spatial distribution characteristic of high in the southeast and low in the northwest (Figure 7b). Jiuzhi, Banma, Tongde, Nangqian, and Henan in the east of TRHR had the largest restoration degree of soil retention per unit area, and their restoration degrees were 92.57 t/hm2, 90.53 t/hm2, and 77.08 t/hm2, 69.18 t/hm2, and 68.81 t/hm2, respectively. The restoration degrees of soil retention per unit area were all below 20 t/hm2 in the northwest, in Zaduo, Qumalai, Maduo, Zhiduo, and Geermu, and their values were 17.04 t/hm2, 14.82 t/hm2, 12.09 t/hm2, 11.44 t/hm2, and 6.12 t/hm2, respectively.
The TRHR soil retention restoration potential represented the gap between its restoration degree and the climax background. The restoration potential of soil retention in the TRHR ecosystems was 1.067 billion t, and the water retention per unit area was 38.93 t/hm2 (Figure 7c). The restoration potential of soil retention per unit area in TRHR counties were between 13.54 t/hm2 and 167.84 t/hm2. Among them, the restoration potential of soil retention per unit area in Maduo, Qumalai, Zhiduo and Geermu in the northwest of TRHR was relatively small, 20.85 t/hm2, 20.65 t/hm2, 18.34 t/hm2, and 13.54 t/hm2, respectively, while Zema, Jiuzhi, Maqin, Nangqian, and Yushu in the east of TRHR had relatively large soil retention per unit area, with values of 167.84 t/hm2, 78.89 t/hm2, 78.28 t/hm2, 76.04 t/hm2, and 72.41 t/hm2.
From the perspective of the ratio of SR restoration potential to the SR climax background (PCBR), the PCBR of TRHR was 62.15% (Figure 7d), and the soil retention service PCBR in all counties were above 40.00%. Among them, the PCBR in the northern and northwestern parts of TRHR were relatively large, above 60% in most areas; while the PCBR of Zeku, Jiuzhi, and Henan in the east of TRHR were relatively small, with values of 49.87%, 48.40%, and 47.19%, respectively.

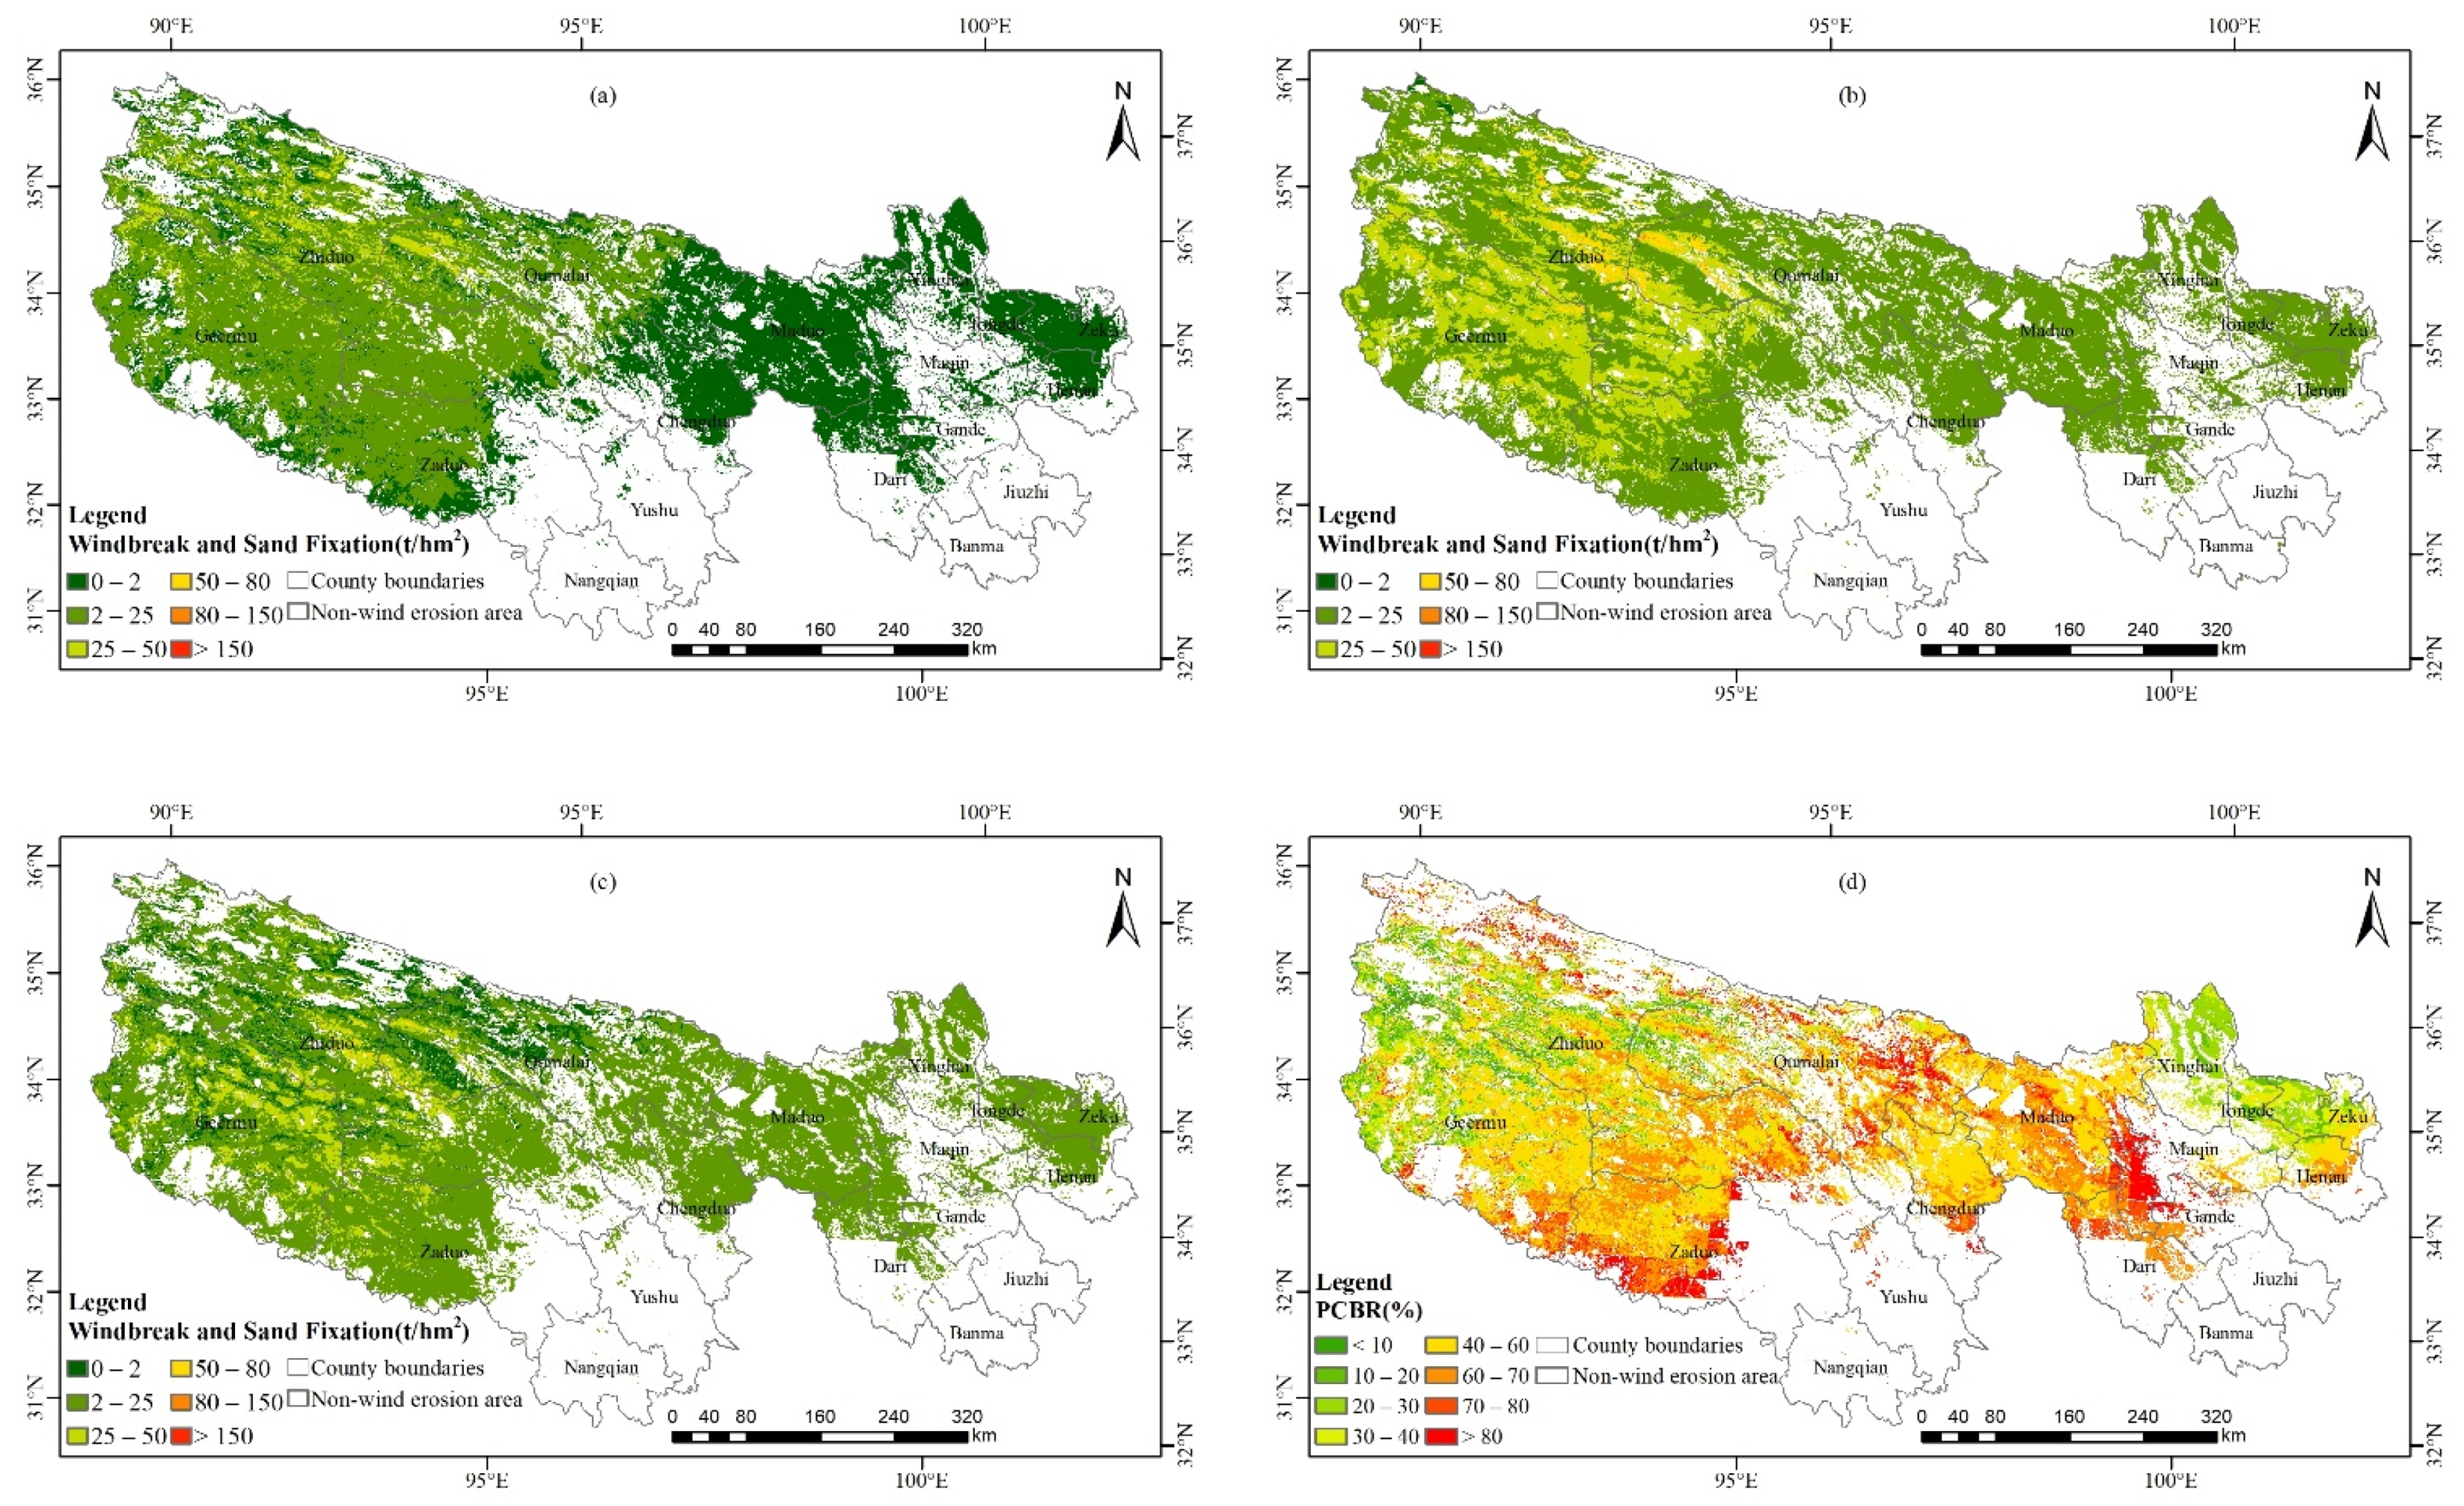
3.4. Climax Background, Restoration Degree, and Restoration Potential of Windbreak and Sand Fixation Service

Except for water bodies and non-vegetation area, the WD climax background of the TRHR ecosystems totaled 131 million t, and WD per unit area was 5.29 t/hm2. From a spatial point of view, the WD in the TRHR ecosystems presented a spatial pattern of high in the west and low in the east (Figure 8a). Zhiduo, Geermu, Qumalai, and Zaduo in the northwest had higher WD per unit area, with values of 10.01 t/hm2, 9.58 t/hm2, 7.11 t/hm2, and 3.60 t/hm2, respectively. In the east, the wind speed was relatively small and the amount of sediment was small, so the amount of WD per unit area in most areas were below 1 t/hm2(Table 5).
The restoration degree of WD service of TRHR ecosystems totaled 345 million t, and the WD per unit area was 13.80 t/hm2, which gradually decreased from west to east in space. Most parts of the western region were windy and sandy, and relatively low vegetation coverage could also effectively reduce the amount of sediment to a certain extent, so the WD per unit area in most areas was more than 10 t/hm2(Figure 8b). Among them, the restoration degree of WD per unit area in Geermu, Zhiduo, Zaduo, and Qumalai counties in the northwest were 23.41 t/hm2, 19.74 t/hm2, 17.17 t/hm2, and 14.15 t/hm2, respectively. Due to less wind and sand, the amount of WD in the eastern region was still small, and the amount of WD per unit area in most areas were below 10 t/hm2. Among them, Yushu, Banma, Henan, Nangqian, and Zeku in the east of TRHR had their restoration degrees of 3.47 t/hm2, 3.33 t/hm2, 3.26 t/hm2, 3.25 t/hm2, and 3.18 t/hm2, respectively.
The WD restoration potential represented the gap between its restoration degree and the climax background. The restoration potential of WD in the TRHR ecosystem was 208 million t in total, and the WD per unit area was 8.65 t/hm2 (Figure 8c). The restoration potential of WD per unit area in the counties of the TRHR ranged from 3.18 t/hm2 to 14.43 t/hm2. Among them, Geermu, Zaduo, Zhiduo, Qumalai, and Xinghai in the northwest of TRHR had a relatively large restoration potential of WD per unit area, with the values of 14.43 t/hm2, 13.65 t/hm2, 10.68 t/hm2, 6.71 t/hm2, and 6.32 t/hm2, respectively. Meanwhile, Yushu, Banma, Zeku, Henan, and Nangqian in the east of TRHR had relatively small WD restoration potentials per unit area, with values of 3.43 t/hm2, 3.29 t/hm2, 3.26 t/hm2, 3.23 t/hm2, and 3.18 t/hm2, respectively.
From the perspective of the ratio of the windbreak and sand fixation service restoration potential to the climax background (PCBR), the TRHR’s PCBR of WD service was 56.37% (Figure 8d). The PCBR of the southeast and the southeast was relatively small, and most areas were below 30%. Among them, the PCBR of Zeku, Xinghai, and Tongde were relatively small, with values of 36.71%, 30.45%, and 29.84%, respectively.

4. Discussion

4.1. Spatial Characteristics of FVC Restoration Degree and Restoration Potential

FVC was closely related to location, topography, landform, climate, and other factors. The TRHR ecological environment system belongs to the alpine and arid zone of the Qinghai–Tibet Plateau in China’s environmental vulnerability division, and belongs to the Qingnan–Qiangtang grassland and desert ecological region of the semi-humid, semi-arid cold plateau ecosystem in the regional ecological division. Alpine and drought constituted the basic climatic characteristics of the region [65]. The altitude of TRHR was low in the east and high in the west. The FVC in the high altitude area was low, and the FVC in the low altitude area was high [28]. Temperature and precipitation were also two important factors affecting the FVC. The water and heat conditions in the southeast of TRHR were relatively good. The high-coverage grasslands were widely distributed, so the FVC was relatively high, and the bare land and bare rock textures were widely distributed in the northwest, so the FVC was relatively low. Therefore, the restoration degree of FVC showed a trend of increasing gradually from west to east.
The restoration potential of FVC represented the gap between the restoration degree and the climax background. From the perspective of spatial distribution, the restoration potential of FVC showed the spatial characteristics of high in the middle of the region and low on both sides: (1) The FVC restoration potential in the southeastern part of Geermu, Qumalai, Maduo, and the southeastern part of Zaduo is 10%–20%, because the above-mentioned areas are near the 400 mm dry-wet zone boundary, and the alpine meadow and alpine steppe vegetation are more sensitive to the coupling benefits of water and heat. Relevant studies have shown that under the three future climate models of high RCP2.6, RCP4.5, and RCP8.5, the temperature and precipitation in the TRHR all show an increasing trend, and the FVC shows an increasing trend [66,67,68]. (2) In the northwest of Geermu, northwest of Zhiduo, and other places, the precipitation in these areas is relatively small, the increase of temperature will inevitably increase the degree of water deficit, and the increase of vegetation coverage will not be used. (3) The water and heat conditions in the southeast of the TRHR are better, the forest and alpine meadow are widely distributed, and the FVC is relatively high. However, the southeastern region of the TRHR still needs to mitigate the disturbance of human activities such as overgrazing, so that the FVC can be further restored with the help of favorable water and heat conditions.

4.2. Spatial Characteristics of Ecosystem Service Restoration Degree and Restoration Potential

4.2.1. Water Retention

From a spatial point of view, the restoration degree of water retention service in the TRHR forest and grassland ecosystem showed a spatial pattern of high in the southeast and low in the northwest, which was more consistent with the spatial distribution pattern of precipitation (Figure 2). The southeastern part of the TRHR was richer in precipitation than the northwestern part, which provided a direct source of precipitation for the effective functioning of vegetation water retention. In Maqin, Zema, Nangqian, Yushu, and other places, there were a certain number of subalpine dark coniferous forests, deciduous broad-leaved forests, and shrub forests. The vegetation canopy could effectively intercept precipitation and conserve water. Grassland was the most important vegetation type in the TRHR, while alpine meadows were most widely distributed in the central and southern parts of TRHR. Alpine meadows were a non-zonal grassland type developed on plateaus and mountains. The soil surface layer was about 3 to 10 cm thick turf, the root system was interwoven like felt, soft, tough, and elastic, and had good water retention ability. At the same time, under the dual action of climate and vegetation, alpine meadow soil, subalpine meadow soil, and small chernozem, chestnut soil, and new accumulation soil were developed. These soil layers were thicker and had relatively higher porosity. The larger the soil porosity, the stronger the water-holding capacity of the soil. The main vegetation types in the northwest of the TRHR were alpine desert and alpine steppe, with low vegetation coverage, including alpine steppe soil, alpine cold desert soil, and other soil types [69].
The restoration potential of water retention services still had a spatial pattern of high in the southeast and low in the northwest. The restoration potential of water retention per unit area of Zema, Jiuzhi, Zeku, and Henan in the east of TRHR were approximately equal to two times the restoration potential of water retention per unit area in Qumalai, Geermu, and Zhiduo in the northwest of TRHR. The PCBR in the north and northwest of the TRHR was relatively large, about twice as large as that in the southeast of the TRHR (Table 3). The restoration potential of water retention is the real gap between the restoration degree and the climax background, which was an absolute quantity. Therefore, the value of the restoration potential of water retention in the eastern part of TRHR was relatively large, but the magnitude of the restoration potential did not mean the difficulty of restoration degree.
In the eastern part of the TRHR where the water retention restoration potential was relatively large, as long as the protection, restoration, and construction measures of the ecosystem were further strengthened, and with the help of excellent water, heat conditions, and the increase of future summer precipitation [66,67], the water retention service could reach or approach the climax of natural vegetation within a certain period of time.
The arid and semi-arid areas in the northwest of the TRHR are subject to harsh natural conditions, and the restoration potential was relatively small. However, the precipitation in some areas will decrease in the future [66]; ecological restoration would be a slow process, requiring a relatively long time for ecological protection and restoration measures to affect the degraded vegetation.

4.2.2. Soil Retention

From a spatial point of view, the restoration degree of soil retention services in the TRHR ecosystem showed a spatial pattern of high in the southeast, low in the northwest, high in the mountains, and low in the flat land. In general, the TRHR soil belongs to the mountain soil flora of the Qingnan Plateau. The plastic film formed by the soil matrix was relatively primitive, and the soil formation time was short. Most of the soils in the area were thin in thickness, coarse in texture, poor in water retention, and low in fertility, and were easily eroded, causing soil erosion [70]. Since the TRHR water erosion intensity showed a decreasing trend from southeast to northwest with precipitation, and the FVC for improving soil retention services also showed a decreasing trend from southeast to northwest, the soil retention restoration degree also showed an overall pattern of high in the southeast, and low in the northwest. On the other hand, soil retention services were closely related to slope and slope length factors. In the mountainous and hilly areas, such as the Animaqing Mountains, with large terrain fluctuations in the southeast of TRHR, as well as in the valleys of the Yangtze River and Lancang River, the subalpine dark coniferous forests, mixed coniferous and broad-leaved forests, deciduous broad-leaved forests, and shrub forests, as well as widely distributed alpine meadows in other regions, could reduce hydraulic erosion and improve soil retention. The terrain of the northern and midwest region was small in undulations, with shallow cuts, many broad and flat beaches, and large areas of swamps and wetlands in between. The water erosion was relatively small and the soil retention service was relatively small, so it appeared a spatial pattern of high mountains and low flats.
The spatial pattern of soil retention restoration potential was consistent with the restoration degree. The restoration potential of soil retention per unit area in Zema, Jiuzhi, Maqin, Nangqian, and Yushu in the east of the TRHR was about 3–4 times higher than that of Maduo, Qumalai, Zhiduo, and Geermu in the northwest of the TRHR. However, in terms of PCBR, the PCBRs in the north and northwest of the TRHR were comparable to those in the southeast of the TRHR. The reason was that the magnitude of the soil retention climax background in the southeast is about three times that of the northwest soil retention climax background (Table 4). In general, there was a 60.15% restoration space for the restoration potential of soil retention service in the TRHR. Compared with climate, topography, and other factors that cannot be changed by humans or cannot be changed in the short term, in the TRHR area, especially the areas having more rainfall and steep mountains with more rainfall in the future [66,67], it was necessary to actively carry out ecological project construction such as returning grazing land to grassland, black soil beach management, and reducing soil loss through measures such as creating soil and water retention forests, artificial grass planting, and changing slopes to ladders.

4.2.3. Windbreak and Sand Fixation

From a spatial point of view, the restoration degree of WD service in the TRHR ecosystem presented a spatial pattern of high in the west and low in the east. Wind speed was the main controlling factor for the change of WD, accounting for 31.62% of the entire TRHR [36]. Relevant studies have shown that in the past 16 years, the strength of the wind field has weakened, especially in the spring when sandy and dusty weather could easily occur. The vegetation restoration of grassland and sandy land was an important reason for the decline of wind erosion in the north [71]. In the west of the TRHR, the wind speed was high and the amount of sand was large, so a certain degree of vegetation restoration can exert a positive effect of windbreak and sand fixation, and the restoration degree was relatively high; while in the east of TRHR, there was more precipitation, and the FVC was high. The smaller the amount of sand, the smaller the amount of windbreak and sand fixation of vegetation, and the lower the restoration degree.
The spatial pattern of the restoration potential of the windbreak and sand fixation service was relatively consistent with the restoration degree. The restoration potential of windbreak and sand fixation per unit area in Geermu, Zaduo, Zhiduo, Qumalai, and Xinghai counties in the northwest of TRHR was about 2–5 times higher than that of Yushu, Banma, Zeku, Henan, and the east of TRHR. However, from the perspective of PCBR, the PCBR in the middle of the TRHR was 2–3 times higher than that in the northwest and southeast (Table 5). In general, the windbreak and sand fixation service was greatly affected by climate change and human activities, especially by changes in the intensity and scope of the wind field. It was necessary to continue to start ecological protection projects, and increase the management of desertified land in the northwest of the TRHR, based on the effects of future warming and humidification and wind field weakening in the TRHR [72,73], as well as improve FVC in the sandy land treatment area and enhance the windbreak and sand fixation capacity of the vegetation in the wind-blown sand area.

4.3. Acquisition and Scale Conversion of FVC Climax Background

The acquisition of the ecological parameters of the zonal climax background is the key to the study of the climax background of ecosystem services. There are two points that need to be improved in future research: (1) The accuracy of the climax background acquisition of FVC should be improved. In this study, the core area of the TRHR nature reserve is selected as the climax ecological area, and long-term enclosed grassland and field observation stations should be supplemented [13]. At the same time, the climax FVC varies with site conditions. It is necessary to use the climax plots in these areas to establish a relationship model between the FVC climax background and the site environmental conditions, and then simulate the FVC climax background of the entire TRHR. Usually, adding the above natural factors to perform multiple regression will get a more accurate fitting equation, but in the case of more natural factor combination conditions, the corresponding number of nature reserves will be less, which will affect the accuracy of the fitting equation. Therefore, choosing these natural factors is a trade-off process. (2) It is not enough to evaluate the climax background, restoration degree, and restoration potential of water retention, soil retention, and windbreak and sand fixation services with coverage as the core parameter. For example, in addition to the influence of vegetation coverage in water retention services, the vertical structure, height, near-surface coverage of vegetation, and soil properties under vegetation are all key factors. Subsequent research needs to have more reasonable models to reflect these parameters.

5. Conclusions

In this paper, taking the core area of the nature reserve as the climax background of the TRHR zonal ecosystem, based on the multiple regression analysis and model parameter control method based on the eco-geographical area, ecosystem types and climate factors; the climax background, restoration degree, and restoration potential of TRHR’s WR, SR, and WD services were quantitatively researched, and the main conclusions were as follows: (1) The evaluation method of climax background, restoration degree, and restoration potential based on FVC can accurately quantify the regional differences of the restoration degree and restoration potential of TRHR’s key ecosystem-regulating services. The restoration degree and restoration potential of WR and SR services showed a spatial pattern of high in the southeast and low in the northwest, and the restoration degree and restoration potential of WD services showed a spatial pattern of high in the west and low in the east, which was closely related to natural conditions such as precipitation and wind speed. (2) The proportion of restoration potential to climax background for WR, SR, and WD services were 48.38%, 62.15%, and 56.37%, respectively. (3) The implementation of the TRHR ecological project in the future should focus on the vicinity of the 400 mm dry and wet zone dividing line, as well as in the southeastern mountains, hills, and river valleys, to carry out degraded vegetation restoration and soil and water conservation measures to improve ecosystem services. Near-natural restoration measures should be considered in Zhiduo and Geermu in the western part of the TRHR, where wind erosion is high, and the restoration goals of ecological projects should be formulated in combination with local climatic conditions and restoration potential. However, the current research still lacks sufficient ground survey data based on LUCC for the acquisition of climax background data. Future work needs to introduce more detailed LUCC categories and fine-time-scale FVC data, and provide more attention to research on the impact of future climate change on restoration models. Although the current research is preliminary, the relevant research results still provide a research method to obtain the restoration potential of ecosystem-regulating services based on climax background extrapolation, and preliminarily quantify the regional differences in the restoration degree and restoration potential of TRHR’s ecosystem-regulating services; thus, it can effectively support the precise implementation of ecological projects.

Author Contributions

All the authors contributed significantly to this study. Conceptualization, Q.S., J.L. and J.F.; methodology, J.L., Q.S., J.F., J.H. and G.L.; writing—original draft preparation, G.L.; writing—review and editing, Q.S., J.F., J.H. and G.L.; data curation, G.L. and H.H.; software, G.L.; visualization, G.L. All authors have read and agreed to the published version of the manuscript.

Funding

This research was funded by the National Natural Science Foundation of China (Grant No.42071289), the Strategic Priority Research Program of the Chinese Academy of Sciences (Grant No.XDA23100203), and Major Special Project-the China High-Resolution Earth Observation System (30-Y30F06-9003-20/22).

Data Availability Statement

The data that support the findings of this study are available from the corresponding author upon reasonable request.

Conflicts of Interest

The authors declare no conflict of interest.

References

  1. Liu, J.Y.; Xu, X.L.; Shao, Q.Q. The Spatial and Temporal Characteristics of Grassland Degradation in the Three- River Headwaters Region in Qinghai Province. Acta Geogr. Sin. 2008, 63, 364–376. (In Chinese) [Google Scholar]
  2. Shao, Q.Q.; Fan, J.W.; Liu, J.Y.; Huang, L.; Cao, W.; Xu, X.L.; Ge, J.S.; Wu, D.; Li, Z.Q.; Gong, G.L. Assessment on the effects of the first-stage ecological conservation and restoration project in Sanjiangyuan region. Acta Geogr. Sin. 2016, 71, 3–20. (In Chinese) [Google Scholar]
  3. Liu, J.Y.; Shao, Q.Q.; Fan, J.W. Ecological construction achievements assessment and its revelation of ecological project in Three Rivers Headwaters Region. Chin. J. Nat. 2013, 35, 40–46. [Google Scholar]
  4. Shao, Q.Q.; Fan, J.W. Ecological Protection and Ecological Benefit Monitoring and Evaluation of Construction Projects in the Three-River Headwaters Region; Science Press: Beijing, China, 2018. (In Chinese) [Google Scholar]
  5. Huang, L.; Cao, W.; Xu, X.L.; Fan, J.W.; Wang, J.B. The Ecological Effects of Ecological Security Barrier Protection and Construction Project in Tibet Plateau. J. Nat. Resour 2018, 33, 398–411. (In Chinese) [Google Scholar]
  6. Liu, F.; Zeng, Y.N. Spatial-temporal change in vegetation Net Primary Productivity and its response to climate and human activities in Qinghai Plateau in the past 16 years. Acta Ecol. Sin. 2019, 39, 1528–1540. (In Chinese) [Google Scholar]
  7. He, H.L.; Ren, X.L.; Zhang, L.; Qin, K.Y.; Feng, L.L.; Lu, Y.; Niu, Z.E.; Zhang, M.Y. Research on ecosystem assessment method based on reference-state-deviation. Acta Ecol. Sin. 2023, 43, 1–12. (In Chinese) [Google Scholar]
  8. Hou, P.; Gao, J.X.; Wan, H.W.; Shi, P.R.; Wang, Y.C.; Sun, C.X. Progress and some scientific issues on effectiveness assessment of terrestrial ecosystem conservation and restoration. Environ. Ecol. 2021, 3, 1–7. (In Chinese) [Google Scholar]
  9. Ren, H.; Peng, S.L.; Lu, H.F. The restoration of degraded ecosystems and restoration ecology. Acta Ecol. Sin. 2004, 24, 1756–1764. [Google Scholar]
  10. FAO; IUCN; SER. Un Decade on Ecosystem Restoration 2021–2030; General Assembly of the United Nations: New York, NY, USA, 2019. [Google Scholar]
  11. Huang, B.R.; Ouyang, Z.Y.; Zheng, H.; Wang, X.K.; Miao, H. Connotation of ecological integrity and its assessment methods. Chin. J. Appl. Ecol. 2006, 17, 2196–2202. (In Chinese) [Google Scholar]
  12. Zhuo, L.; Cao, X.; Chen, J.; Chen, Z.X.; Shi, P.J. Assessment of grassland ecological restoration project in Xilin Gol grassland. Acta Geogr. Sin. 2007, 62, 471–480. (In Chinese) [Google Scholar]
  13. He, N.P.; Xu, L.; He, H.L. The methods of evaluation ecosystem quality: Ideal reference and key parameters. Acta Ecol. Sin. 2020, 40, 1877–1886. (In Chinese) [Google Scholar]
  14. Assumma, V.; Bottero, M.; Monaco, R.; Soares, A.J. An integrated evaluation methodology to measure ecological and economic landscape states for territorial transformation scenarios: An application in Piedmont (Italy). Ecol. Indic. 2019, 105, 156–165. [Google Scholar] [CrossRef]
  15. Liu, G.B.; Shao, Q.Q.; Fan, J.W.; Ning, J.; Rong, K.; Huang, H.B.; Liu, S.C.; Zhang, X.Y.; Niu, L.N.; Liu, J.Y. Change Trend and Restoration Potential of Vegetation Net Primary Productivity in China over the Past 20 Years. Remote Sens. 2022, 14, 1634. [Google Scholar] [CrossRef]
  16. Guo, R.; Wang, X.K.; Lu, F.; Duan, X.N.; Ouyang, Z.Y. Soil carbon sequestration and its potential by grassland ecosystems in China. Acta Ecol. Sin. 2008, 28, 827–862. (In Chinese) [Google Scholar]
  17. Duan, X.N.; Wang, X.K.; Lu, F.; Ouyang, Z.Y. Carbon sequestration and its potential by wetland ecosystems in China. Acta Ecol. Sin. 2008, 28, 463–469. (In Chinese) [Google Scholar]
  18. Liu, Y.C.; Wang, Q.F.; Yu, G.R.; Zhu, X.Y.; Guo, Q.; Yang, H.; Li, S.G. Ecosystems carbon storage and carbon sequestration potential of two main tree species for the Grain for Green Project on China’s hilly Loess Plateau. Acta Ecol. Sin. 2011, 31, 4277–4286. (In Chinese) [Google Scholar]
  19. Zhang, J.; Li, J.P.; Wang, Y.T. Climate change in arid regions of Northwest China and its impact on potential grassland productivity. Ecol. Sin. 2020, 39, 182–192. (In Chinese) [Google Scholar]
  20. Zhao, G.J.; Mu, X.M.; Tian, P.; Gao, P.; Sun, W.Y.; Xu, W.L. Prediction of vegetation variation and vegetation restoration potential in the Loess Plateau. J. Soil Water Conserv. 2021, 35, 205–212. (In Chinese) [Google Scholar]
  21. Bardgett, R.D.; Bullock, J.M.; Lavorel, S. Combatting global grassland degradation. Nat. Rev. Earth Env. 2021, 2, 720–735. [Google Scholar] [CrossRef]
  22. Wang, M.; Cao, W.Z.; Jiang, C.; Yan, Y.Y.; Guan, Q.S. Potential ecosystem service values of mangrove forests in southeastern China using high-resolution satellite data. Estuar. Coast. Shelf Sci. 2018, 209, 30–40. [Google Scholar] [CrossRef]
  23. Depellegrin, D.; Pereira, P.; Misiune, L.; Lucas, E.V. Mapping ecosystem services potential in Lithuania. Int. J. Sustainable Dev. World Ecol. 2016, 23, 441–455. [Google Scholar] [CrossRef]
  24. Aziz, T.; Van, C.P. Comparative valuation of potential and realized ecosystem services in Southern Ontario, Canada. Envir. Sci. Policy 2019, 100, 105–112. [Google Scholar] [CrossRef]
  25. Tan, L.Y.; Guo, G.C.; Li, S.C. The Sanjiangyuan Nature Reserve Is Partially Effective in Mitigating Human Pressures. Land 2021, 11, 43. [Google Scholar] [CrossRef]
  26. Li, M. The Method of Vegetation Fraction Estimation by Remote Sensing. Master’s Thesis, University of Chinese Academy of Sciences, Beijing, China, 2003. (In Chinese). [Google Scholar]
  27. Jia, K.; Yao, Y.J.; Wei, X.Q.; Gao, S.; Jiang, B.; Zhao, X. A review on fractional vegetation cover estimation using remote sensing. Adv. Earth Sci. 2013, 28, 774–782. (In Chinese) [Google Scholar]
  28. Jing, M.X.; Cai, F.; Wang, X.J.; Zhao, X.J.; Su, Y. The vegetation coverage spatial characteristics in the Three-River source region. J. Arid Land Res. Environ. 2020, 34, 141–147. (In Chinese) [Google Scholar]
  29. Jin, K.; Wang, F.; Han, J.Q.; Shi, S.Y.; Ding, W.B. Contribution of climatic and human activities to vegetation NDVI change over China during 1982–2015. Acta Geogr. Sin. 2020, 75, 961–974. (In Chinese) [Google Scholar]
  30. Chen, C.; Park, T.; Wang, X.H.; Piao, S.L.; Xu, B.D.; Chaturved, R.K.; Fuchs, R.F.; Brovkin, V.; Ciais, P.; Fensholt, R.; et al. China and India lead in greening of the world through land-use management. Nat. Sustain. 2019, 2, 122–129. [Google Scholar] [CrossRef]
  31. IPCC. Climate Change and Land: An IPCC Special Report on Climate Change, Desertification, Land Degradation, Sustainable Land Management, Food Security, and Greenhouse Gas Fluxes in Terrestrial Ecosystems; Shukla, P.R., Skea, J., Calvo Buendia, E., Masson-Delmotte, V., Pörtner, H.-O., Roberts, D.C., Zhai, P., Slade, R., Connors, S., van Diemen, R., et al., Eds.; IPCC: Geneva, Switzerland, 2019. [Google Scholar]
  32. Piao, S.; Wang, X.; Park, T.; Chen, C.; Xu, L.; He, Y.; Bjerke, J.W.; Chen, A.P.; Ciais, P.; Tommervik, H.; et al. Characteristics, drivers and feedbacks of global greening. Nat. Rev. Earth Environ. 2019, 1, 14–27. [Google Scholar] [CrossRef] [Green Version]
  33. Luo, Y.; Lu, Y.H.; Fu, B.J.; Zhang, Q.J.; Li, T.; Hu, W.Y.; Comber, A. Half century change of interactions among ecosystem services driven by ecological restoration: Quantification and policy implications at a watershed scale in the Chinese Loess Plateau. Sci. Total Environ. 2019, 651, 2546–2557. [Google Scholar] [CrossRef]
  34. Shao, Q.Q.; Fan, J.W.; Liu, J.Y.; Huang, L.; Cao, W.; Liu, L.L. Target-based Assessment on Effects of First-stage Ecological Conservation and Restoration Project in Three-river Source Region, China and Policy Recommendations. Bull. Chin. Acad. Sci. 2017, 32, 35–44. (In Chinese) [Google Scholar]
  35. Ouyang, Z.Y.; Zheng, H.; Xiao, Y.; Polasky, S.; Liu, J.G.; Xu, W.H.; Wang, Q.; Lu, Z.; Xiao, Y.; Rao, E.M.; et al. Improvements in ecosystem services from investments in natural capital. Science 2016, 352, 1455–1459. [Google Scholar] [CrossRef] [PubMed]
  36. Liu, G.B. Spatio-temporal Changes and Driving Mechanisms of Ecosystem Quality and Services in the Three-River Headwaters Region in the Past 30 Years. Ph.D. Thesis, University of Chinese Academy Sciences, Beijing, China, 2021. (In Chinese). [Google Scholar]
  37. Zhang, Y.S.; Lu, X.; Liu, B.Y.; Wu, D.T.; Fu, G.; Zhao, Y.T.; Sun, P.L. Spatial relationships between ecosystem services and socioecological drivers across a large-scale region: A case study in the Yellow River Basin. Sci. Total Environ. 2021, 766, 142480. [Google Scholar] [CrossRef] [PubMed]
  38. Zhang, Y.L.; Li, B.Y.; Zheng, D. A discussion on the boundary and area of the Tibetan Plateau in China. Geogr. Res. 2002, 21, 1–8. (In Chinese) [Google Scholar]
  39. Shao, Q.; Liu, G.B.; Li, X.D.; Huang, H.B.; Fan, J.W.; Wang, Y.L.; Liu, J.Y.; Guo, X.J. Assessing the Snow Disaster and Disaster Resistance Capability for Spring 2019 in China’s Three-River Headwaters Region. Sustainability 2019, 11, 6423. [Google Scholar] [CrossRef] [Green Version]
  40. Fan, J.W.; Shao, Q.Q.; Wang, J.B.; Chen, Z.Q.; Zhong, H.P. An analysis of temporal-spatial dynamics of grazing pressure on grassland in Three Rivers Headwater Region. Chin. J. Grassl 2011, 33, 64–67. (In Chinese) [Google Scholar]
  41. Wang, K.; Hong, F.Z.; Zong, J.Y. Grassland resources and their sustainable utility in the Three-River Headwaters Region. Acta Agrestia Sin. 2005, 13, 28–31. (In Chinese) [Google Scholar]
  42. Liu, Z.H.; Tim, R.M.; Li, L.T.; Tom, G.V.N.; Yang, Q.K.; Li, R.; Mu, X.M. Interpolation for time series of meteorological variables using ANUSPLIN. Nat.Sci.Ed 2008, 36, 227–234. (In Chinese) [Google Scholar]
  43. Hutchinson, T.X. Anusplin Version 4.4 User Guide; The Australian National University: Canberra, Australia, 2013. [Google Scholar]
  44. Guo, B.; Zhang, J.; Meng, X. Long-term spatio-temporal precipitation variations in China with precipitation surface interpolated by ANUSPLIN. Sci. Rep. 2020, 10, 81. [Google Scholar] [CrossRef] [Green Version]
  45. Hutchinson, M.F. Interpolating mean rainfall using thin plate smoothing splines. Int. J. Geogr. Infor. Systems. 1995, 9, 385–403. [Google Scholar] [CrossRef]
  46. Liu, J.Y.; Kuang, W.H.; Zhang, Z.X.; Xu, X.L.; Qin, Y.W.; Ning, J.; Zhou, W.C.; Zhang, S.W.; Li, R.D.; Yan, C.Z.; et al. Spatiotemporal characteristics, patterns and causes of land use changes in China since the late 1980s. Acta Geogr. Sin. 2014, 69, 3–14. (In Chinese) [Google Scholar] [CrossRef]
  47. Liu, J.Y.; Ning, J.; Kuang, W.H.; Xu, X.L.; Zhang, S.W.; Yan, C.Z.; Li, R.D.; Wu, S.X.; Hu, Y.F.; Du, G.M.; et al. Spatial-temporal patterns and characteristics of land-use change in China during 2010–2015. Acta Geogr. Sin. 2018, 73, 789–802. (In Chinese) [Google Scholar]
  48. Liu, J.Y.; Shao, Q.Q.; Yu, X.B.; Huang, H.Q. Comprehensive Monitoring and Assessment of Terrestrial Ecosystems in China; Science Press: Beijing, China, 2016. (In Chinese) [Google Scholar]
  49. Shao, Q.Q.; Liu, S.C.; Ning, J.; Liu, G.B.; Yang, F.; Zhang, X.Y.; Niu, L.N.; Huang, H.B.; Fan, J.W.; Liu, J.Y. Remote sensing assessment of the ecological benefits provided by national key ecological projects in China over the past 20 years. Acta Geogr. Sin. 2022, 77, 2133–2153. (In Chinese) [Google Scholar]
  50. Shao, Q.Q.; Fan, J.W. Comprehensive Monitoring and Assessment of Ecosystems in the Three Rivers Headwaters Region; Science Press: Beijing, China, 2012. (In Chinese) [Google Scholar]
  51. Zhao, T.Q.; Ouyang, Z.Y.; Jia, L.Q.; Zheng, H. Ecosystem services and their valuation of China grassland. Acta Ecol. Sin. 2004, 24, 1101–1110. (In Chinese) [Google Scholar]
  52. Tang, Y.; Shao, Q.; Liu, J.Y. Did Ecological Restoration Hit Its Mark? Monitoring and Assessing Ecological Changes in the Grain for Green Program Region Using Multi-source Satellite Images. Remote Sens. 2019, 11, 358. [Google Scholar] [CrossRef] [Green Version]
  53. Liu, L.L. Ecosystem Services Values and Their Application in the Cost-Benefit Analysis of Ecological Projects and Balance Sheet Analysis of Ecological Asset in the Three-River Headwaters Region. Ph.D. Thesis, University of Chinese Academy of Sciences, Beijing, China, 2014. (In Chinese). [Google Scholar]
  54. Wu, D. Research on Water Regulation Service of the Main Terrestrial Ecosystems in China. Ph.D. Thesis, University of Chinese Academy of Sciences, Beijing, China, 2014. (In Chinese). [Google Scholar]
  55. Li, Y.S.; Wang, G.X.; Wang, Y.B.; Wang, J.D.; Jia, X.H. Impacts of land cover change on runoff and sediment yields in the headwater areas of the Yangtze River and the Yellow River, China. Adv. Water Sci. 2006, 17, 616–623. (In Chinese) [Google Scholar]
  56. Zhu, L.Q.; Xu, S.M.; Chen, P.Y. Study on the impact of land use/land cover on the soil erosion in mountainous areas. Geogr. Res. 2003, 22, 432–438. (In Chinese) [Google Scholar]
  57. Sun, W.Y. Spatial-Temporal Variation and Driving Mechanism of Soil Erosion in the Loess Plateau in Recent 20 Years. Ph.D. Thesis, University of Chinese Academy of Sciences, Beijing, China, 2013. (In Chinese). [Google Scholar]
  58. Wischmeier, W.H.; Smith, D.D. Predicting Rainfall Erosion Losses: A Guide to Conservation Planning; Department of Agriculture: Washington, DC, USA, 1978. [Google Scholar]
  59. Renard, K.G.; Foster, G.R.; Weeies, G.A. Predicting Rainfall Erosion Losses: A Guide to Conservation Planning with the Revised Universal Soil Loss Equation (USLE); Department of Agriculture: Washington, DC, USA, 1997. [Google Scholar]
  60. Cai, C.F.; Ding, S.W.; Shi, Z.H.; Huang, L.; Zhang, G.Y. Study of applying USLE and geographical information system IDRISI to predict soil erosion in small watershed. J. Soil and Water Conserv. 2000, 14, 19–24. (In Chinese) [Google Scholar]
  61. Gong, G.L. Research on the Spatio-Temporal Changes of Wind Erosion in Northern China and the Influence Factors. Ph.D. Thesis, University of Chinese Academy of Sciences, Beijing, China, 2014. (In Chinese). [Google Scholar]
  62. Fryrear, D.; Saileh, A. Field wind erosion-vertical distribution. Soil Sci. 1993, 155, 294–300. [Google Scholar] [CrossRef]
  63. Wu, D.; Shao, Q.Q.; Liu, J.Y.; Cao, W. Assessment of water regulation services of forest and grassland ecosystems in Three-River Headwaters Region. Bull. Soil and Water Conserv. 2016, 36, 206–210. (In Chinese) [Google Scholar]
  64. Huang, L.; Cao, W.; Wu, D.; Gong, G.L. The temporal and spatial variations of ecological services in the Tibet Plateau. J. Nat. Resour. 2016, 31, 543–555. (In Chinese) [Google Scholar]
  65. Wang, G.X.; Ding, Y.J.; Wang, J.; Liu, S.Y. Land ecological changes and evolutional patterns in the source regions of the Yangtze and Yellow rivers in recent 15 years. Acta Geogr. Sin. 2004, 59, 163–173. (In Chinese) [Google Scholar]
  66. Feng, X.Y.; Huang, B.B.; Li, R.N.; Zheng, H. Response characteristics of ecosystems and soil conservation services to future climate change in the Three-Rivers region, China. Acta Ecol. Sin. 2020, 40, 6351–6361. (In Chinese) [Google Scholar]
  67. Xiang, J.W.; Zhang, L.P.; Deng, Y.; She, D.X.; Zhang, Q. Projection and evaluation of extreme temperature and precipitation in major regions of China by CMIP6 models. Eng. J. Wuhan Univ. 2021, 54, 46–58. (In Chinese) [Google Scholar]
  68. Zheng, X.X.; Li, L.P.; Deng, Y. Projection of summer rainfall in the Yangtze River Basin in the future 30 years under different Shared Socioeconomic Pathways (SSPs). Chin. J. Atmos. Sci. 2022, 43, 72–81. (In Chinese) [Google Scholar]
  69. Wu, D.; Cao, W.; Shao, Q.Q.; Zhao, Z.P. Influences of grassland degradation on soil saturated moisture content in the Three-River Headwaters Region. J. Nanjing For. Univ. 2018, 42, 182–186. (In Chinese) [Google Scholar]
  70. Yi, X.S. Effects of Grassland Degradation on Soil Water Retention in the Three-River Headwaters Region of Qinghai Province. Ph.D. Thesis, University of Chinese Academy of Sciences, Beijing, China, 2012. (In Chinese). [Google Scholar]
  71. Huang, L.; Zhu, P.; Cao, W. The impacts of the Grain for Green Project on the trade-off and synergy relationships among multiple ecosystem services in China. Acta Ecol. Sin. 2021, 41, 1178–1188. (In Chinese) [Google Scholar]
  72. Jiang, Y.; Xu, X.Y.; Liu, H.W. Projection of surface wind by CMIP5 and CMIP3 in China in the 21st century. J. Meteor. Environ. 2018, 34, 56–63. (In Chinese) [Google Scholar]
  73. Zhao, J.Q. Numerical Simulation of Dust Processes in Northern China and Sand Emission Fluxes under Future Climate Change Scenarios. Master’s Thesis, Nanjing University of Information Science and Technology, Nanjing, China, 2021. (In Chinese). [Google Scholar]
Figure 1. Digital Elevation Model: Mountains and Rivers in the TRHR.
Remotesensing 15 00523 g001
Figure 2. The spatial distribution of TRHR’s average precipitation (a) and temperature (b) from 2000 to 2019.
Remotesensing 15 00523 g002
Figure 3. Distribution of TRHR climax ecological zones (not including water bodies in the core area), climate zones, and nature reserves (core area, buffer area, test area).
Remotesensing 15 00523 g003
Figure 4. Schematic diagram of climax background, restoration degree, and restoration potential of ecological indicators in case of service increase (a) and service decrease (b).
Remotesensing 15 00523 g004
Figure 5. Spatial distribution of average annual FVC (a), change trend (b), significant trends (c) and percentage (d) of forest and grass ecosystems in the TRHR from 2000 to 2019.
Remotesensing 15 00523 g005
Figure 6. Spatial distribution of average annual water retention (a), change trend (b), significant trends (c) and percentage (d) of forest and grass ecosystems in the TRHR from 2000 to 2019.
Remotesensing 15 00523 g006
Figure 7. Spatial distribution of average annual soil retention (a), change trend (b), significant (c) and percentage (d) of forest and grass ecosystems in the TRHR from 2000 to 2019.
Remotesensing 15 00523 g007aRemotesensing 15 00523 g007b
Figure 8. Spatial distribution of average annual windbreak and sand fixation (a), change trend (b), significant (c) and percentage (d) of forest and grass ecosystems in the TRHR from 2000 to 2019.
Remotesensing 15 00523 g008
Table 1. The regression equation between FVC and temperature and precipitation in the climax ecological region (CEZ).
ZoneEcosystemFitting EquationR2Significance
Humid and sub-humid regionForest f v c = 0.0004 × p r e + 0.0101 × t e m p + 0.4893 0.165Model (F, p < 0.05)
TAP (t, p < 0.01)
MAT (t, p < 0.01)
grassland f v c = 0.0008 × p r e + 0.0493 × t e m p + 0.1702 0.484Model (F, p < 0.05)
TAP (t, p < 0.01)
MAT (t, p < 0.01)
desert f v c = 0.0017 × p r e + 0.0381 × t e m p 0.4959 0.513Model (F, p < 0.05)
TAP (t, p < 0.01)
MAT (t, p < 0.01)
Arid and semi-arid regiongrassland f v c = 0.0023 × p r e 0.0248 × t e m p 0.6536 0.227Model (F, p < 0.05)
TAP (t, p < 0.01)
MAT (t, p < 0.01)
desert f v c = 0.0018 × p r e 0.0207 × t e m p 0.5445 0.174Model (F, p < 0.05)
TAP (t, p < 0.01)
MAT (t, p < 0.01)
Table 2. Statistical table of climax background, restoration degree, restoration potential, and PCBR of FVC in TRHR’s counties.
County NameClimax Background (%)Restoration Degree (%)Restoration Potential (%)PCBR (%)
Jiuzhi89.6683.516.167.06
Banma88.3081.376.937.93
Maqin80.4269.6710.7414.85
Dari79.6870.559.1311.66
Gande85.4478.007.448.92
Maduo55.4338.9416.4932.03
Tongde81.9071.2610.6513.68
Xinghai71.6757.0414.6222.90
Germu36.4417.6418.8054.64
Yushu84.0475.828.2310.21
Zaduo65.5549.7215.8325.17
Qumalai46.4528.2118.2548.00
Nangqian82.0771.2710.7913.56
Chengduo74.7663.1211.6516.71
Zhiduo37.9623.5514.4253.54
Zeku85.4179.386.037.27
Henan91.7486.914.835.32
Table 3. Statistical table of climax background, restoration degree, restoration potential, and PCBR of WR in TRHR’s counties.
County NameClimax BackgroundRestoration DegreeRestoration PotentialPCBR
100 Million m3m3/hm2100 Million m3m3/hm2100 Million m3m3/hm2%
Jiuzhi10.971495.546.93943.514.05552.3636.90
Banma9.431563.575.71945.863.73618.0439.48
Maqin12.161148.576.96657.795.19490.8442.94
Dari15.141311.539.13790.706.01520.9939.65
Gande8.131292.634.96788.593.17504.2039.00
Maduo13.20721.376.35347.096.85374.4154.28
Tongde4.201076.812.27583.371.92493.5346.50
Xinghai8.49883.914.20437.724.28446.2151.81
Germu12.24502.795.73235.666.50267.1854.94
Yushu14.451142.889.11720.445.34422.6937.03
Zaduo21.90953.8812.84561.558.98392.6541.11
Qumalai17.74509.538.36240.069.38269.5558.38
Nangqian11.551194.577.03727.304.52467.4639.07
Chengduo11.18959.236.67572.364.51387.1140.62
Zhiduo19.85519.3110.12264.959.72254.5655.81
Zeku7.051248.933.99705.493.07543.6243.59
Henan8.171307.494.90783.643.27523.9840.09
Table 4. Statistical table of climax background, restoration degree, restoration potential, and PCBR of SR in TRHR’s counties.
County NameClimax BackgroundRestoration DegreeRestoration PotentialPCBR
100 Million tt/hm2100 Million tt/hm2100 Million tt/hm2%
Jiuzhi1.29169.160.6892.570.5878.8948.40
Banma1.57257.260.5490.531.01167.8464.38
Maqin1.59136.550.6660.380.8678.2858.98
Dari1.1590.950.5344.120.5848.6152.53
Gande0.79118.390.3655.810.4062.9755.76
Maduo0.6932.720.2512.090.4220.8562.11
Tongde0.66145.020.3577.080.3168.3650.18
Xinghai1.34122.700.6663.480.6259.9752.34
Germu0.7219.920.216.120.4613.5471.43
Yushu1.76130.710.7860.850.9272.4156.53
Zaduo1.3951.640.4217.040.8735.7259.81
Qumalai1.4735.840.5914.820.8020.6565.62
Nangqian1.51143.960.6969.180.7576.0453.21
Chengduo0.9271.330.3528.260.5443.7862.73
Zhiduo1.7130.220.6511.440.9518.3469.61
Zeku0.5285.500.2745.350.2541.7549.87
Henan0.79122.760.4368.810.3454.3647.19
Table 5. Statistical table of climax background, restoration degree, restoration potential, and PCBR of WD in TRHR’s counties.
County NameClimax BackgroundRestoration DegreeRestoration PotentialPCBR
10 Thousands tt/hm210 Thousands tt /hm210 Thousands tt/hm2%
Jiuzhi2.480.05164.073.50158.643.4591.34
Banma1.070.04102.463.3397.673.2987.69
Maqin5.050.08254.244.11247.294.0273.46
Dari8.830.08410.723.60396.243.5280.64
Gande4.750.10179.813.67173.383.5780.21
Maduo27.040.13910.934.69867.154.5560.25
Tongde0.190.01105.763.67103.503.6629.84
Xinghai13.560.20420.216.52401.366.3230.45
Germu3831.149.589693.3923.415654.1914.4330.69
Yushu2.010.04192.613.47187.013.4343.28
Zaduo902.353.604348.5117.173409.2413.6588.16
Qumalai2454.447.114695.4414.152174.106.7165.88
Nangqian0.070.00107.133.18104.793.1854.33
Chengduo20.510.21434.524.45406.794.2388.80
Zhiduo5824.0710.0112130.6719.746026.6910.6861.35
Zeku0.130.00174.383.26169.173.2648.55
Henan0.730.01175.403.25171.693.2336.71
Disclaimer/Publisher’s Note: The statements, opinions and data contained in all publications are solely those of the individual author(s) and contributor(s) and not of MDPI and/or the editor(s). MDPI and/or the editor(s) disclaim responsibility for any injury to people or property resulting from any ideas, methods, instructions or products referred to in the content.

