Article

MS4D-Net: Multitask-Based Semi-Supervised Semantic Segmentation Framework with Perturbed Dual Mean Teachers for Building Damage Assessment from High-Resolution Remote Sensing Imagery

1
Department of Geography and Environment, The University of Western Ontario, London, ON N6A 5C2, Canada
2
Institute for Earth and Space Exploration, The University of Western Ontario, London, ON N6A 3K7, Canada
3
School of Geospatial Engineering and Science, Sun Yat-sen University, Zhuhai 519082, China
*
Author to whom correspondence should be addressed.
Remote Sens. 2023, 15(2), 478; https://doi.org/10.3390/rs15020478
Submission received: 14 December 2022 / Revised: 10 January 2023 / Accepted: 11 January 2023 / Published: 13 January 2023
(This article belongs to the Special Issue Optical Remote Sensing Applications in Urban Areas II)

Abstract

:
In the aftermath of a natural hazard, rapid and accurate building damage assessment from remote sensing imagery is crucial for disaster response and rescue operations. Although recent deep learning-based studies have made considerable improvements in assessing building damage, most state-of-the-art works focus on pixel-based, multi-stage approaches, which are more complicated and suffer from partial damage recognition issues at the building-instance level. In the meantime, it is usually time-consuming to acquire sufficient labeled samples for deep learning applications, making a conventional supervised learning pipeline with vast annotation data unsuitable in time-critical disaster cases. In this study, we present an end-to-end building damage assessment framework integrating multitask semantic segmentation with semi-supervised learning to tackle these issues. Specifically, a multitask-based Siamese network followed by object-based post-processing is first constructed to solve the semantic inconsistency problem by refining damage classification results with building extraction results. Moreover, to alleviate labeled data scarcity, a consistency regularization-based semi-supervised semantic segmentation scheme with iteratively perturbed dual mean teachers is specially designed, which can significantly reinforce the network perturbations to improve model performance while maintaining high training efficiency. Furthermore, a confidence weighting strategy is embedded into the semi-supervised pipeline to focus on convincing samples and reduce the influence of noisy pseudo-labels. The comprehensive experiments on three benchmark datasets suggest that the proposed method is competitive and effective in building damage assessment under the circumstance of insufficient labels, which offers a potential artificial intelligence-based solution to respond to the urgent need for timeliness and accuracy in disaster events.

1. Introduction

Natural hazards, such as earthquakes, hurricanes, fires, and tsunamis, can cause serious damage to buildings in urban areas. When a disaster strikes, rapid and accurate building damage assessment (e.g., the location and amount of damage, the ratio of collapsed buildings, and the type of damage for each building) is critical for emergency response and humanitarian assistance [1,2]. Recently, remote sensing technology has become an efficient way to rapidly retrieve ground information at a low cost due to its capability of covering large areas rapidly [3]. Generally, building damage assessment from remote sensing data could be seen as a combination of two sub-tasks: building localization and damage classification [4]. The former segments the buildings at the pixel level, while the latter determines the damage degree of each building instance [5]. As shown in Figure 1d, although building damages can be detected from post-disaster images, building outlines may not be precise due to the lack of prior information from pre-disaster images [6]. Therefore, bi-temporal remote sensing images are more widely employed in practice, despite existing image registration problems, and we also focus on bi-temporal applications for building damage assessment in this study. Moreover, it is worth noting that building damage assessment based on paired images is similar to building change detection, as both tasks need to identify the changed status of buildings. Nevertheless, the former remains much more challenging than the latter since more damage levels (minor, major, and destroyed) and undamaged buildings need to be recognized simultaneously.
Different from the traditional building damage assessment workflow with a large amount of manual work on satellite imagery analysis [7], machine learning approaches can automatically retrieve building damage information, despite the difficulty of satisfying the needs of large-scale and high-precision applications due to heavily relying on handcrafted features [8]. Recently, deep learning (DL) has significantly surpassed conventional machine learning algorithms in various remote sensing applications due to its powerful capability of hierarchical feature representation [9]. Regarding the DL-based approaches using bi-temporal images for building damage assessment, there are two major pipelines: (1) semantic segmentation for building localization followed by patch-based damage classification; (2) semantic segmentation for building localization and damage classification both. The first one is a two-step pipeline, which first segments the building pixels and then performs patch-level damage classification based on previous building segmentation results. For instance, as a baseline of the study [5], a modified U-Net model and a two-branch ResNet-50 model were used for pixel-based building localization and image-level damage classification, respectively. This method can achieve an instance-level assessment result via patch-level classification. However, these two procedures have different objectives and employ different model architectures, such that the model performance is suppressed due to the lack of knowledge shared between tasks. In comparison, the other pipeline applies semantic segmentation for both tasks, which can share knowledge from building localization to damage classification by means of model weight transfer. For instance, a convolutional neural network with cross-directional attention for building damage assessment (BDANet) [6] performed a two-stage training strategy based on semantic segmentation, where a building extraction model was first trained with only pre-disaster data, and then the model weights were shared with the subsequent damage classification model. Although this can address the knowledge-sharing problem to some degree, a partial damage recognition problem can still be found in Figure 1e due to the purely pixel-based segmentation scheme [4]. Furthermore, the two-stage scheme is more complex for model training due to its separate procedures. Hence, it is worthwhile to investigate integrating building localization and damage classification into a unified end-to-end training process while considering the object-level post-processing.
Another challenge of DL-based building damage assessment lies in the lack of annotated data. Generally, supervised learning (SL) has become the mainstream pipeline in a range of DL-based studies for building damage assessment [6], and sufficient labeled data has been treated as a crucial prerequisite in DL algorithms. However, it is costly and time-consuming to create vast, accurate ground truth labels for model training, which is particularly problematic under a time-critical disaster situation [10]. To alleviate the related issues, recent studies have incorporated semi-supervised learning (SSL) with a large amount of unlabeled data to improve the model generalization ability by injecting some forms of prior knowledge [11]. The core idea of SSL is to extract additional training signals from a large set of unlabeled data to obtain a more generalized model beyond the small labeled dataset [12]. Particularly, recent consistency regularization (CR)-based SSL approaches have achieved remarkable performance by enforcing agreement between the predictions from diverse views of unlabeled samples [13]. As illustrated in Figure 2, several prominent CR-based schemes, for example, Π-model [14], mean teacher [15], dual students [16], and cross-consistency training (CCT) [17] have been extensively investigated in a range of semantic segmentation applications of natural images [8,12,13,17,18,19,20] and remote sensing images [21,22,23,24,25,26,27,28,29,30]. Typically, Π-model performs data-level CR between multiple augmented unlabeled samples, while the mean teacher enforces model-level consistency between the original student model and its mean teacher model. However, the perturbations in these approaches might not be strong enough to train powerful models. To further increase the perturbation level, CCT shares the weights of the encoder and conducts training by maintaining consistency between the main decoder and multiple auxiliary decoders with different perturbations. Impressively, the dual student-based approach like cross pseudo supervision (CPS) [8] has demonstrated encouraging performance over most state-of-the-art semi-supervised semantic segmentation approaches by adopting two identical models to supervise each other with cross pseudo-labels. However, a huge computation cost is still required to optimize more parameters in these methods. Meanwhile, to our best knowledge, few studies have explored these state-of-the-art SSL algorithms in the task of building damage assessment, which is still a research area to be exploited.
To perform building damage assessment for disaster response with limited labeled samples, we design an SSL framework by integrating multitask semantic segmentation and perturbed dual mean teachers. Concretely, a multitask model framework is introduced to unify the building localization and damage classification, where object-based post-processing operations are carried out in the model inference stage to further refine the damage results at the building instance level. Moreover, we adopt two iteratively updated mean teachers to reinforce the perturbations in SSL and produce more distinguishing features, thus, improving the model generalization capability under insufficient labels. Due to adopting multiple teachers with single-time backpropagation, the proposed semi-supervised method possesses the advantage of strong perturbation and high training efficiency. Furthermore, a confidence weighting strategy is introduced into the SSL pipeline to reduce the influence of noisy pseudo-labels in consistency learning. Noteworthy, unlike most building damage assessment studies that focus on designing novel model architectures, we are dedicated to developing an efficient assessment pipeline to retrieve building damage information in consideration of timeliness and accuracy. Moreover, from the operational perspective, training a tailored model towards a specific case with limited annotation data may be a practical alternative for quick building damage assessment while ensuring accuracy. The contributions of this work are summarized in four aspects:
(1) We introduce a simple yet effective multitask-based segmentation framework and combine it with object-based post-processing to ensure the semantic consistency between buildings and their instance-level damages, reducing the impact of partial damage recognition.
(2) To alleviate the issue of insufficient labeled samples for building damage assessment in emergency contexts, we present a novel consistency regularization-based semi-supervised semantic segmentation framework based on perturbed dual mean teachers. In comparison to other related state-of-the-art SSL approaches, the proposed framework possesses the advantages: (1) stronger perturbations with iteratively updated dual mean teachers and (2) higher training efficiency with single-time backpropagation.
(3) Instead of using a fixed confidence threshold for pseudo-labeling, a confidence weighting strategy is embedded into the semi-supervised pipeline, which pays attention to the more convinced pseudo-labels and decreases the influence of the noises caused by the pseudo-labeling process.
(4) Extensive experiments on three benchmark datasets demonstrate the effectiveness of the proposed approach under insufficient labeled samples, which helps facilitate the workflow of DL-based building damage assessment in terms of timeliness and accuracy for disaster response. The codes will be made publicly available at (https://github.com/YJ-He/MS4D-Net-Building-Damage-Assessment (accessed on 10 January 2023)).
This study is organized as follows. Section 2 reviews the related work. Section 3 presents the methodology. The experiment setup is set in Section 4, and Section 5 details the experimental results. Section 6 is the discussion part. Finally, some key findings are drawn in Section 7.

2. Related Work

2.1. Building Damage Assessment

Traditionally, the ground field survey is the most accurate method to evaluate building damage, but this method is time-consuming, labor-intensive, and costly [31]. With the development of remote sensing technology, satellite and aerial imagery can provide timely and large-coverage information on the disaster area [1]. Visual interpretation of damage from high-resolution satellite data has been widely employed for some time [32]. Despite being very precise, visual interpretation requires a high level of expertise with low efficiency. To improve the automation level in building damage detection and assessment, researchers have proposed various machine-vision-based methods, depending on manually designed features such as shape, spectrum, and texture [33]. Thereafter, supervised machine learning methods, for example, random forest [34] and support vector machine [35], have been extensively investigated and shown effectiveness in damage detection. However, the arbitrarily selected and designed features may not be enough for accurate damage detection, especially when facing complex scenarios after severe disasters. Thanks to the remarkable performance on feature extraction and representation, DL-based methods have been widely applied to building damage detection based on bi-temporal imagery. For instance, a CNN-based hierarchical building damage assessment workflow [36] was proposed to classify buildings into two categories: undamaged and damaged. Moreover, a two-stage pipeline with a semantic segmentation network named BDANet [6] was designed to perform a building damage assessment, which classified the building pixels into four levels: no damage, minor damage, major damage, and destroyed buildings. Further, to address the semantic inconsistency issue within building instances, an object-based semantic change detection framework (ChangeOS) was designed for building damage assessment, which integrated the building localization and damage classification into a unified framework [4].

2.2. Semi-Supervised Semantic Segmentation

Currently, most DL-based studies are more focused on training models using a large number of labeled samples based on the SL pipeline. However, it remains challenging to create sufficient ground truth data, especially for pixel-level semantic segmentation tasks [21]. Hence, SSL is favored due to its outstanding capability to exploit the discriminative features from massive unlabeled samples. In general, recent SSL approaches are major focused on the design of pseudo-labeling and CR framework [12]. The former usually demonstrates worse accuracy than the latter, as the pseudo-labeling pipeline intentionally discards part of unlabeled data with relatively low confidence during training [13]. In contrast, the CR-based strategy performs better by encouraging the model to produce consistent predictions under the condition of imposing slight perturbations on input data, output predictions, latent features, or networks [8]. Recently, due to the easy implementation and good performance, a growing number of remote sensing applications leverage CR-based SSL schemes, such as Π-model [22,26], mean teacher [25], CCT [24,30], and dual students [21,23,29]. Following the Π-model structure, PiCoCo [22] and SemiSANet [26] were proposed for building extraction and building change detection, respectively, which both perform SSL by enforcing the consistency between the predictions of two augmented images. In the study of [25], the perturbation of the network with the mean teacher was employed to segment high-resolution remote sensing imagery. Additionally, hybrid perturbations of input data, features, and networks adopting CCT demonstrated remarkable performance in land-use/land-cover classification [24] and building extraction [30]. In particular, the perturbation scheme between dual students exhibits impressively promising results in building/road extraction [21,29] and flood mapping [23]. Nevertheless, these prominent frameworks still suffer from weak perturbation levels, heavy training workloads, and low-quality pseudo-labels. To tackle the limitations, we present a novel SSL framework integrating perturbed dual mean teachers and a confidence weighting strategy, which aims to conduct high-efficient training while maintaining better accuracy.

2.3. Semi-Supervised Learning for Building Damage Recognition

Encouraged by the strong generalization ability of SSL in a variety of applications, increasing studies of building damage recognition started to focus on this promising strategy. For example, an autoencoder-based method was used to perform semi-supervised classification of building damage on post-hurricane aerial imagery [31]. In the study of [37], two semi-supervised classification approaches, for example, MixMatch [38] and FixMatch [39], were investigated for building damage recognition after disasters using only a small number of labels. Although these works explored the performance of SSL on damage detection, they only obtained the results of image-level damage classification yet could not locate the buildings. To tackle the limitations, pixel-level semantic segmentation is introduced. For instance, a combination of self-training and pseudo-label refinement strategy was utilized to classify pixel-level building damages in work [10], despite limited accuracy improvement. To our best knowledge, there is still a lack of exploitation in current studies on incorporating the latest CR-based SSL scheme with the task of building damage assessment, and we wish to investigate to fill up this research gap to some extent.

3. Methodology

In this section, we first describe the designed multitask-based model architecture with post-processing in Section 3.1; then, the overall framework combining the semi-supervised semantic segmentation with perturbed dual mean teachers is discussed in Section 3.2.

3.1. Basic Model Architecture with Post-Processing

Most existing studies [5,6] implement building damage assessment with a two-step pipeline, which means building localization and damage classification are carried out separately. It is not concise for the data-driven DL paradigm and suffers from the knowledge gap problem between two different but related tasks. In this study, we introduce an end-to-end Siamese network to perform two tasks simultaneously. Figure 3 demonstrates the suggested model framework, which consists of a Siamese fully convolutional network (FCN) for segmenting the binary building masks and multiclass damage masks in the training stage and an object-based post-processing step for obtaining instance-level damage classification results in the inference stage.

3.1.1. Multitask-Based SIAMESE Network

In this study, we regard the building damage assessment as a semantic segmentation task. However, this task is different from typical semantic segmentation applications due to involving two input images from pre- and post-disaster in training. Therefore, to better extract features from bi-temporal images, we use a two-branch structure, which is composed of two encoders (E1 and E2) and two decoders (D1 and D2). The encoders aim at abstracting features from input images, while the decoders are to restore the spatial dimension and details through deconvolution operation. Concretely, the pre-disaster image is fed into the first branch (E1 and D1) to produce the building mask Y ^ l o c . Meanwhile, the post-disaster image is input to E2 for feature extraction; then, the extracted features are fused with the features obtained from the pre-disaster image via E1 after each pooling stage of the encoder. Finally, the fused multi-scale features with skip connections pass through D2 to achieve the damage classification mask Y ^ d a m . Unlike the model architecture in [4,6] that shares weights between two encoders, we adopt two encoders without weight sharing in the model to capture richer feature representations from different ranges due to existing significantly heterogeneous characteristics between pre- and post-disaster images when there is severe destruction in the image. Moreover, it is worth noting that our suggested model framework is scalable and can be integrated with various FCN-family model structures.

3.1.2. Loss Function

The input bi-temporal image pairs and corresponding ground truth labels are used to train the model by minimizing the building localization loss l o c and damage classification loss d a m . The corresponding loss functions are formulated as follows:
l o c = 1 | D | { X p r e Y l o c } D 1 W × H i = 1 W × H b c e ( f ( X i p r e , θ E 1 , θ D 1 ) , Y i l o c ) = 1 | D | { X p r e Y l o c } D 1 W × H i = 1 W × H b c e ( P i l o c , Y i l o c )
d a m = 1 | D | { X p r e , X p o s t Y d a m } D 1 W × H i = 1 W × H c e ( f ( X i p r e , X i p o s t , θ E 1 , θ E 2 , θ D 2 ) , Y i d a m   ) = 1 | D | { X p r e , X p o s t Y d a m } D 1 W × H i = 1 W × H c e ( P i d a m , Y i d a m )
where D is the training dataset containing pre- and post-disaster image pairs ( X p r e , X p o s t ) and corresponding ground truth labels Y l o c { 0 : background , 1 : building } for localization, Y d a m { 0 : background , 1 : no   damage , 2 : minor , 3 : major , 4 : destroyed } for damage classification; f ( ) denotes the deep neural network; θ E 1 , θ E 2 , θ D 1 , θ D 2 represent the parameters of Encoder 1, 2, and Decoder 1, 2, respectively. P l o c and P d a m indicate the predicted probability maps of building localization and damage classification, respectively; W and H represent the width and height of the input image; b c e and c e denote the standard pixel-wise binary cross-entropy loss and multiclass cross-entropy loss, respectively. Accordingly, the integrated supervised loss of two tasks is represented as:
S = l o c + d a m

3.1.3. Object-Based Post-Processing

The multitask-based Siamese network can produce building localization and damage classification results simultaneously. However, due to the limitation of the pixel-level segmentation scheme, the semantic inconsistency between building localization and damage classification always exists. Furthermore, building localization results are usually much better than building damage classification results due to their simplicity. To keep the object-wise semantic consistency between these two tasks, we introduce an object-based post-processing approach [4]. Specifically, building proposals are first generated based on the binary building localization results through a connected component labeling (CCL) algorithm [40]:
  Y ^ o b j l o c = C C L ( Y ^ l o c )
Next, the damage level for each building object is determined with a weighted voting algorithm by calculating the ratio of each damage degree within an object and voting the majority category, which can reduce the semantic inconsistency through the ensemble of pixel results within the building instances:
Y ^ o b j d a m = O b j e c t V o t i n g ( Y ^ d a m , Y ^ o b j l o c )

3.2. Semi-Supervised Semantic Segmentation Framework

For building damage assessment, given a small set D L = { ( X L 1 , Y L 1 ) , , ( X L N , Y L N ) } of N labeled image pairs and a larger set D U = { X U 1 , , X U Q } of Q unlabeled image pairs (Q >> N), X U i represents the i-th unlabeled image pair ( X U p r e , X U p o s t )   ( i ) ; ( X L j , Y L j ) denote the j-th labeled image pair X L j = ( X L p r e , X L p o s t )   ( j ) and the corresponding ground truth label Y L j = ( Y L l o c , Y L d a m )   ( j ) , respectively. f θ denotes the deep neural network with parameters θ , which maps the input image pairs X to pixel-level buildings Y ^ l o c and their damage levels Y ^ d a m . The SSL is to train a more generalized model over the one with only labeled data from D L by combining a large amount of unlabeled data from D U .

3.2.1. Perturbed Dual Mean Teachers

The aim of the presented SSL framework is to produce strong perturbations while keeping high training efficiency. As shown in Figure 4, the proposed framework consists of one student model f θ s and two mean teacher models f θ t 1 and f θ t 2 , which adopts the identical model structure but with different parameters θ s , θ t 1 , and θ t 2 . In the training process, the student model is trained by minimizing the loss function of supervised learning and consistency learning, while the parameters of two teacher models are iteratively updated with the exponential moving average (EMA) [15] of the student model parameters:
θ t k = α θ t 1 k + ( 1 α ) θ t s
where k { t 1 , t 2 } denotes one of two teacher models; α [ 0 , 1 ] is a smoothing coefficient, which is set to 0.99; θ t k and θ t s represent the parameters of the student and teacher models in training step t , respectively. To ensure the model diversity between two teacher models for stronger perturbations in training, we alternately update one of two teachers at each training iteration.
For supervised learning, labeled image pairs X L are input to the student model, and the ground truth labels Y L impose supervision on their predicted probability maps P L s = ( P L l o c , P L d a m ) , thus, constructing the supervised loss:
  S = 1 | D L | { X L Y L } D 1 W × H i = 1 W × H ( b c e ( P i L l o c , Y i L l o c   ) + c e ( P i L d a m , Y i L d a m   ) )
For unsupervised learning, two unlabeled image pairs X U 1 , X U 2 are input into two teacher models f θ t 1 and f θ t 2 , respectively; then the probability maps P U 1 t 1 , P U 2 t 2 , and pseudo-labels Y U 1 t 1 , Y U 2 t 2 are obtained. As suggested by previous studies [8,19], the perturbation level of consistency learning is critical to the model performance. Therefore, to enhance the perturbation between student and teacher models, CutMix [41] strategy is leveraged such that more attention can be paid to training difficult samples and learning robust representations [6]. Specifically, the mixed probability maps of student models P U M = ( P U M ,   l o c , P U M , d a m ) are generated by cutting part of P U 1 t 1 and pasting to P U 2 t 2 based on a mask M :
P U M = C u t M i x ( M , P U 1 t 1 , P U 2 t 2 ) = M P U 1 t 1 + ( 1 M ) P U 2 t 2
where is the element-wise multiplication; 1 denotes a mask that is filled with ones; M is a binary mask that indicates where to cut out and fill in.
On the basis of P U M , the pseudo-labels Y ^ U M = ( Y ^ U M , l o c , Y ^ U M , d a m ) are calculated using the Argmax function, which is an operation that finds the indices of the maximum value along a specified axis of the multi-dimensional tensor:
Y ^ U M = A r g m a x ( P U M )
At the same time, a mixed image pairs X U M are generated based on unlabeled image pairs X 1 U ,   X 2 U and the same mask M :
X U M = C u t M i x ( M , X U 1 , X U 2 ) = M X U 1 + ( 1 M ) X U 2
Then, X U M is fed into the student model f θ s to obtain the mixed predictions P U s = ( P U s , l o c , P U s , d a m ) . Finally, let the mixed pseudo-label Y ^ U M from teacher models supervise P U s , the consistency loss C o n s is formulated as:
C o n s = 1 | D U | X U 1 , X U 2 D U 1 W × H i = 1 W × H ( b c e ( P i U s , l o c ,   Y ^ i U M , l o c ) + c e ( P i U s , d a m , Y ^ i U M , d a m   ) )
The overall loss integrating supervised and consistency losses can be represented as:
o v e r a l l = S + C o n s

3.2.2. Confidence Weighting

Generally, the performance of CR relies on the quality of pseudo-labels. A few SSL methods [17,19] used a higher threshold to filter out the pixels with a low confidence value. Although this strategy can reduce the influence of noisy pseudo-labels, the strict criteria also result in an inferior learning effect on underperforming categories. In contrast, some studies [8,18] adopted all pseudo-labeled pixels in training, which introduced more noise despite involving more training data. Instead of falling into two extreme situations, we employ a simple yet effective confidence weighting strategy, which dynamically considers the confidence of predictions in training and attaches an adjustment factor to the consistency loss. In this way, more pixels can be involved in consistency learning, and the noise effects from pseudo-labeling will be alleviated at the same time. The weighted consistency loss is formulated as follows:
  C o n s = 1 | D U | X U 1 , X U 2 D U 1 W × H i = 1 W × H ω i ( b c e ( P i U s , l o c ,   Y ^ i U M , l o c ) + c e ( P i U s , d a m , Y ^ i U M , d a m   ) )
  ω i = m a x c { 1 , , C } ( P i U M ( c ) )
where ω i [ 0 ,   1 ] is the confidence of predictions at an i-th pixel from the ensemble of mean teacher models; C denotes the number of categories. This strategy can allocate more contributions to the convincing samples and set the confidence threshold automatically in the training process instead of manual determination.

4. Experiment Setting

This section describes the related datasets, evaluation metrics, and implementation details involved in the experiments.

4.1. Datasets

To assess the proposed approach, we employ the xBD dataset [5] in the experiments, which is an open-source and large-scale satellite dataset for humanitarian assistance and disaster response. It is composed of satellite image pairs of 19 disaster events with a patch size of 1024 × 1024 pixels across over 45,000 km2 around the world. It also contains the building polygons and four damage-level labels (i.e., no damage, minor damage, major damage, destroyed), as shown in Figure 5. To involve more buildings containing four damage levels, we choose three typical disaster events in the later experiments: Joplin Tornado, Moore Tornado, and Hurricane Michael. The image pairs and labels are seamlessly cropped into 512 × 512-pixel tiles without overlapping. After removing some tiles containing blank areas, they are split into training, validation, and testing subsets, as listed in Table 1.

4.2. Evaluation Metrics

Following the previous studies [4,6], we use the F1 score ( F 1 l o c ) for building localization and harmonic mean of category-wise damage classification F1 score ( F 1 d a m ) for building damage classification, which is given as
F 1 l o c = 2 T P 2 T P + F P + F N
F 1 d a m = 4 i = 1 4 1 F 1 C i
where TP, FP, and FN indicate the number of true positive, false positive, and false negative pixels of building segmentation results, respectively; F 1 C i denotes the F1 score of each damage level C i , including no damage, minor damage, major damage, and destroyed. The overall F1 score ( F 1 o v e r a l l ) is formulated by a weighted average of F 1 l o c and F 1 d a m :
F 1 o v e r a l l = 0.3 × F 1 l o c + 0.7 × F 1 d a m

4.3. Implementation Details

We implement experiments on the PyTorch framework with a single NVIDIA GeForce RTX 1080Ti GPU. AdamW optimizer [42] and one-cycle learning rate policy [43] are adopted to optimize the network with an initial learning rate of 0.0001, a momentum of 0.9, and a weight decay of 0.0002. Basic data augmentations such as horizontal and vertical flips are performed for all methods. The batch size is set to two. Regarding CutMix, three rectangles occupying 50% of the image area with a random aspect ratio and position are used to generate the masks. Moreover, we employ the early stopping strategy to avoid overfitting, which guides that training stops when maximum accuracy does not improve for a few epochs. All SL experiments are trained for 100 epochs with 20-epoch early stopping, while SSL experiments are trained for 40 epochs with 15-epoch early stopping. Moreover, we define an “epoch” in SSL experiments as going through the unlabeled data once, whereas the labeled subset is repeated several times to match the number of unlabeled samples within an epoch.

5. Experimental Results

To demonstrate the superiority of the presented approach, we comprehensively compare it with some recent SL and SSL competitors in this section.

5.1. Comparison with SL Competitors

To evaluate the proposed multitask-based Siamese network in Section 3.1, we compare it with two recent Siamese structures: Siamese U-Net [44] and BDANet [6]. Siamese U-Net is one of four models as the first-place solution of the xView2 challenge (https://github.com/DIUx-xView/xView2_first_place (accessed on 10 December 2022)), which adopts U-Net model architecture as the base structure of the Siamese network. On the basis of Siamese U-Net, multi-scale feature fusion and cross-directional attention modules are introduced into BDANet, which enhances the model performance further. It should be noted that these two methods both belong to the two-stage pipeline. For a fair comparison with these two methods, only the results of the second stage are compared since our approach is an end-to-end framework. Moreover, we adopt VGG-16 as the backbone while the other two methods with ResNet-50 as the backbone, which is to keep the number of parameters at a close size.
Table 2 shows the comparison results. MT represents our presented multitask learning framework, and PP denotes the object-based post-processing operation. The proposed multitask framework can achieve better accuracy than Siamese U-Net and BDANet in terms of the F1 score of damage classification on all three datasets, which reveals the effectiveness of the presented method. Furthermore, with object-based post-processing, the results can be further optimized by integrating the building localization results. Additionally, from the qualitative perspective, the presented approach generates more accurate results, as shown in Figure 6. Especially with object-based post-processing, semantic consistency within building instances is guaranteed, which greatly improves visual performance. To sum up, our approach demonstrates considerable improvements over the other two comparison methods. It is beneficial to the rapid disaster response by simplifying the complicated two-stage pipeline to the end-to-end pipeline. In the later SSL experiments, we take the MT framework with post-processing as the base model for further comparison.

5.2. Comparison with SSL Competitors

To verify the effectiveness of the presented SSL framework, we employ several state-of-the-art CR-based methods, i.e., CutMix-Seg [19], PseudoSeg [18], CCT [17], CPS [8], for quantitative and qualitative comparison on three benchmark datasets. All these SSL methods are integrated with the proposed multitask-based Siamese network. To comprehensively compare these SSL methods, we set the labeled data as a ratio of 5%, 10%, and 20% to the total training data, respectively. It should be noted that the labeled data needs to involve the training data with all damage levels to ensure that the training process is stable. SL denotes our proposed MT method based on the SL pipeline as the baseline approach. An FCN with VGG-16 as the backbone is used as the basic model of the proposed framework, and object-based post-processing is applied to all involved methods.
Table 3, Table 4 and Table 5 demonstrate the comparison results on three datasets. It can be seen that all SSL methods can perform better than the SL baseline with partial annotation data. When only using 5% labeled data, our approach is superior to other competitors and gains significant improvements of 11.31%, 5.07%, and 4.70% in overall F1 score than the SL baseline for the Joplin, Moore, and Michael datasets, respectively. With the increasing number of labeled data, the accuracy of all methods is improved, and our method can still achieve the best performance, exhibiting the effectiveness of the presented SSL approach for building damage assessment under insufficient labeled samples. In addition, the accuracy of building damage assessment on three datasets has a large gap, which is influenced by the heterogeneous image quality and different labeling accuracy. Figure 7 displays the visual comparison results of these methods on the benchmark datasets. We can observe that all methods can exhibit better visual results by virtue of object-based post-processing. In addition, the presented method has fewer misclassified pixels, such as false positives and false negatives, which suggests the better model capability of our method over other competitors.

6. Discussion

In this section, we first carry out the ablation study in Section 6.1, which is to prove the effectiveness of designing multiple components. Time analysis is conducted in Section 6.2 to exhibit the advantages of the SSL pipeline in model training. After that, we perform the damage assessment in a real case of the 2011 Tornado Joplin in Section 6.3. Finally, we discuss the potential limitations and prospects of the proposed framework in Section 6.4.

6.1. Ablation Study

To investigate the contribution of multiple improvements of the proposed framework, i.e., MT, SSL, confidence weighting (CW), and object-based post-processing (PP), we conduct ablation experiments with 5% labeled samples based on three datasets, as reported in Table 6. The baseline denotes the method with only a single task, i.e., building damage classification. Some conclusions can be drawn as below: (1) Compared to the Baseline, the MT method produces better damage classification results than the single task baseline on the two datasets. In the meantime, it can obtain building localization results with a one-time training pipeline, which is more efficient than the ones with the multiple-stage training pipeline. (2) By utilizing a large amount of unlabeled data, SSL can greatly increase the overall F1 score whether PP is applied, which is cost-effective without attaching more labels. (3) The combination of CW and SSL can improve the model accuracy, which lies in the fact that more samples from all categories are involved in the consistency training process, and the influence of noisy pseudo-labels is reduced at the same time. (4) PP is a simple but effective strategy to boost the model performance further.
Figure 8 illustrates the visual results accordingly, and we can see that the refined damage classification results are much better than before by ensuring semantic consistency within building instances. On the other hand, it should be noted that the results of building localization can significantly influence the final damage assessment results since the object proposals are generated from them. Luckily, as reported in Table 3, Table 4, Table 5 and Table 6, the performance of building localization is far more accurate than damage classification, which also ensures this strategy is effective.

6.2. Time Analysis

To analyze the time efficiency of the proposed framework, we make a statistic of the training time cost of the SL and SSL pipelines on three datasets in Table 7. It can be found that the SSL pipeline with only 5% labeled samples can achieve even better results than the SL pipeline with 20% labeled data. We can see that the SSL pipeline needs to consume more training time than the SL counterpart since a large amount of unlabeled data is involved in training. Based on the SSL pipeline, an extra 28, 41, and 116 min are required to reach the same accuracy level of the SL pipeline for the Joplin, Moore, and Michael datasets, respectively. However, from the perspective of data labeling, this extra time is far from sufficient to annotate 57, 81, and 195 more image pairs in the task of dense-pixel semantic segmentation. Given that manual work cannot yet be fully replaced by machines so far, we argue that the SSL pipeline is more cost-effective than the SL pipeline in a time-critical event since the solution spent more time on training with machines is better than that spending more time on labeling with lots of manpower in real-world cases.

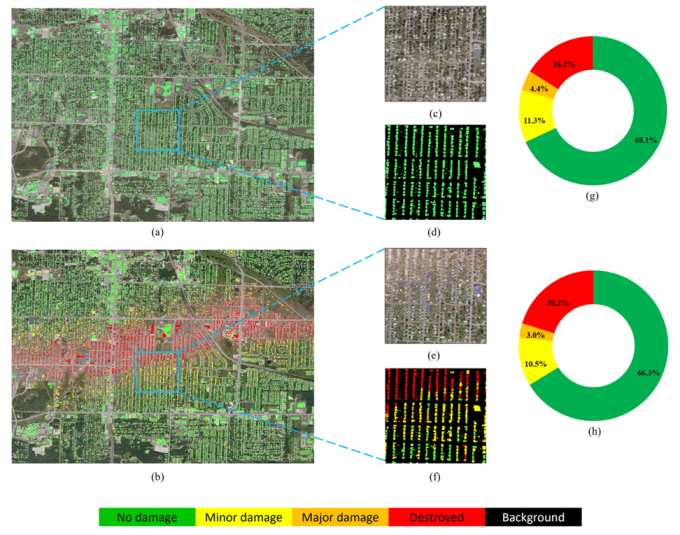
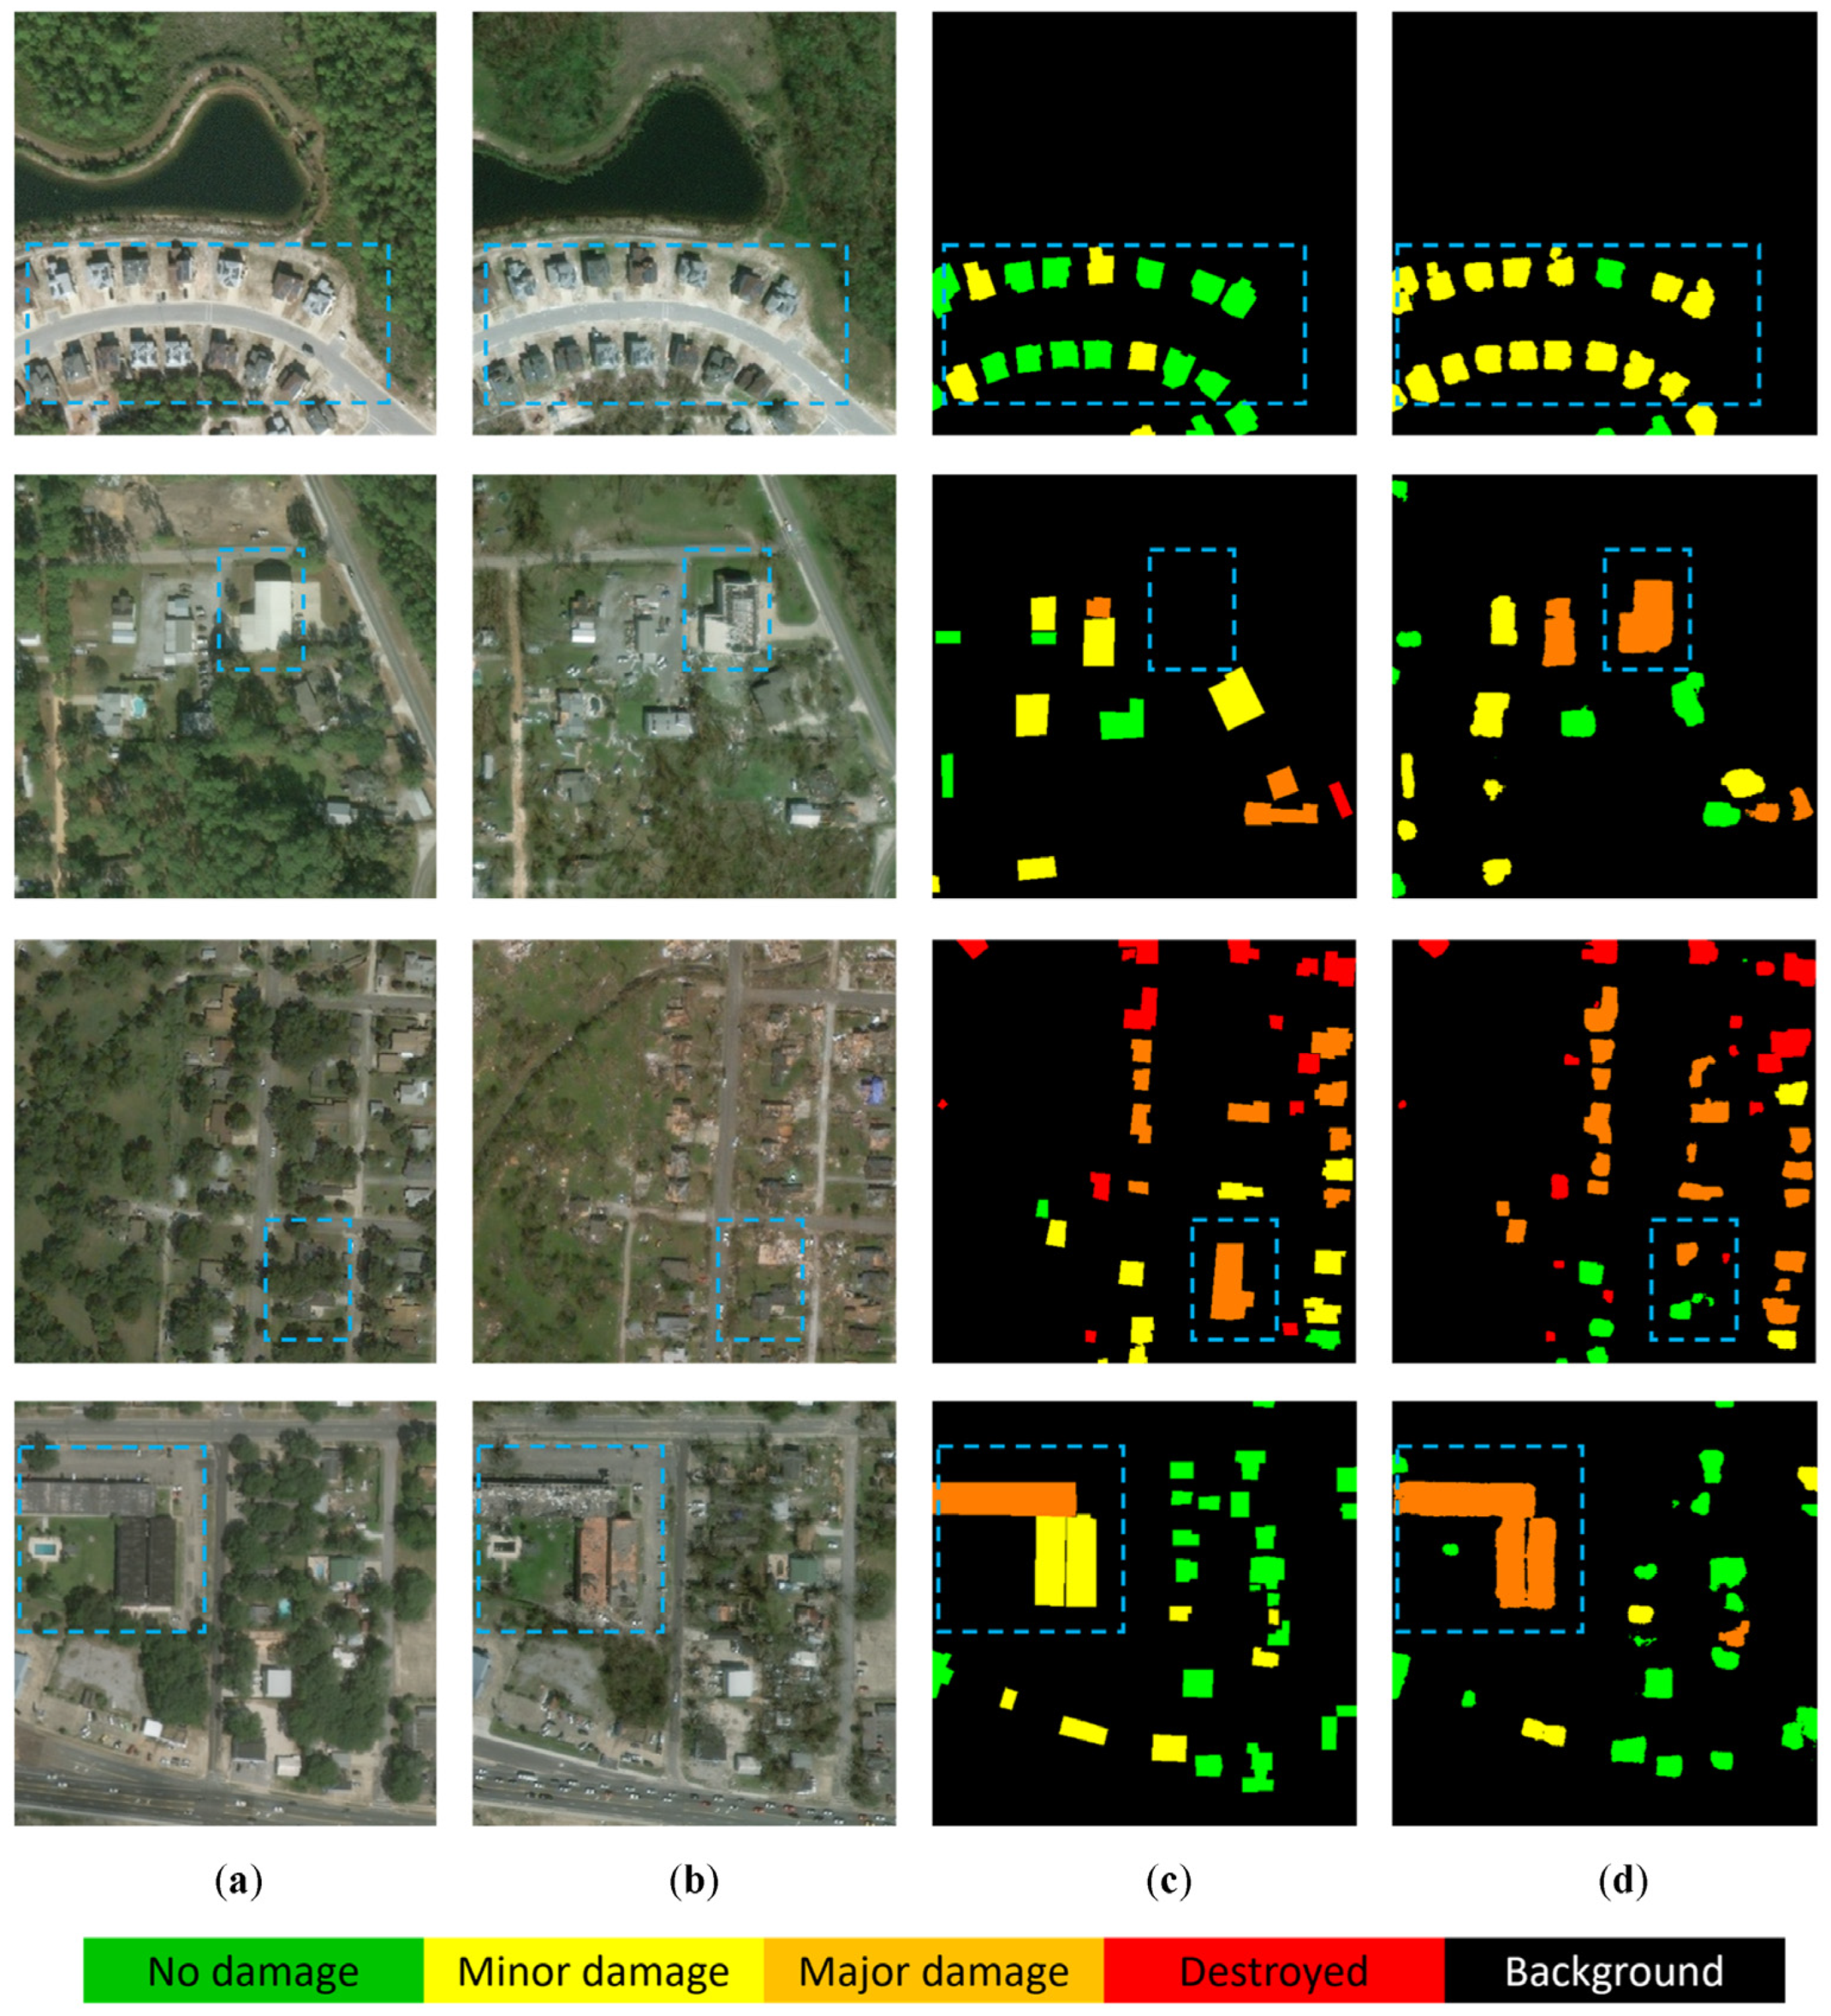
6.3. Damage Assessment of an Example Region

To demonstrate the assessment results from a macro view, we choose a representative region from the Joplin Tornado event, which involves 12,889 buildings in an area of around 19.4 km2. The corresponding bi-temporal satellite images are acquired from Maxar through the Open Data Program (https://www.maxar.com/open-data (accessed on 10 December 2022)), which both have a size of 7398 × 10,487-pixels with a spatial resolution of 0.6 m. Based on the model trained with 5% labeled data, building damage assessment is conducted based on the proposed method. Figure 9a shows the building extraction results across the region. Figure 9c,d exhibit the building detection details of a sub-region. It can be seen that most buildings have been detected, revealing the good performance of our method on building localization tasks. Moreover, as illustrated in Figure 9b, the damages are mainly distributed in the central region along the west-east direction, which is in accordance with the moving path of the tornado. Figure 9e,f detail the damaged state of buildings in a sub-region. The destroyed buildings can be recognized easily, but it remains challenging to distinguish the major and minor damages due to their highly complex characteristics. Furthermore, we make the statistics of the damage status of the whole region in Figure 9g,h for ground truth data and our assessment results, respectively. It shows that our results can provide a similar damage profile compared to ground truth, exhibiting the effectiveness of the proposed method for quick assessment under insufficient labels.

6.4. Limitations and Prospects

Although the presented framework can achieve encouraging results on building damage assessment with relatively few labeled data, some limitations need to be noted. As shown in the first row of Figure 10, multiclass damage assessment is a challenging task due to the ambiguity of intermediate damage degrees, such as minor and major damage, which are extremely difficult even for domain experts. Therefore, how to construct a more robust assessment criterion and define a better building damage assessment scale [7] still needs to be further explored. Furthermore, some unexpected label errors in the dataset (the second row of Figure 10) also cause an inferior learning effect. Hence, it is necessary to improve the labeling accuracy when only using a few annotated samples. Moreover, some building pixels cannot be fully extracted due to the occlusions by trees (the third row of Figure 10) and cannot be separated from each other due to the limited image resolution (the fourth row of Figure 10). It should be noted that high-quality optical images during disasters are critical to the success of building damage assessment. To this end, recent flexible UAV-based images can make contributions [9]. Additionally, registration problems usually exist in the application using bi-temporal data, and the off-nadir phenomenon can cause the wrong extraction results. Hence, ensuring similar imaging conditions may alleviate this issue to some extent. Furthermore, our study is focused on building roof areas, as the damage to the facade or height direction could not be considered only with overhead satellite images. The integration of oblique images for building damage assessment [45] is another potential direction to enhance the model’s capability.

7. Conclusions

In this study, to respond to the urgent need for timeliness and accuracy in building damage assessment, we propose a novel consistency regularization-based semi-supervised framework combining multitask semantic segmentation with perturbed dual mean teachers. In the presented approach, multitask learning model architecture can benefit the object-based post-processing operation, such that instance-level building damages can be generated. Moreover, the leverage of a large amount of unlabeled data through perturbed dual mean teachers can boost assessment accuracy with high training efficiency in the situation of few labeled data. Furthermore, embedding a confidence weighting strategy into the semi-supervised pipeline can involve more convincing samples for consistency constraints while decreasing the impact of noisy pseudo-labels. The performance of the presented framework is evaluated on three disaster datasets and compared with several state-of-the-art SL and SSL approaches. Comprehensive experiment results reveal that the proposed method can yield considerable improvements in building damage assessment even with a small fraction of labeled samples, potentially offering a DL-based solution for timely disaster response and humanitarian assistance in emergencies. In the future, we will exploit more datasets with different disaster scenarios (e.g., earthquakes and tsunamis) and data sources (e.g., aerial and UAV data) to verify the effectiveness of this method. Moreover, we are still dedicating ourselves to improving computing efficiency when facing large amounts of unlabeled samples to satisfy emergency needs in disaster situations.

Author Contributions

Y.H. contributed to the design and the implementation of the methodology, ran experiments, and wrote and revised the paper. J.W. and C.L. contributed to the discussion of the methodology and revised the paper; B.S. and X.Z. contributed to the editing and formal analysis of the paper. All authors have read and agreed to the published version of the manuscript.

Funding

This research was funded by a Natural Science and Engineering Research Council of Canada (NSERC) Discovery Grant (grant number: RGPIN-2022-05051) awarded to Jinfei Wang and an Ontario Graduate Scholarship awarded to Yongjun He.

Data Availability Statement

The datasets used in this study are all openly available.

Acknowledgments

We acknowledge the Geographic Information Technology and Applications (GITA) Lab to provide computational resources for experiments. The authors also would like to thank the groups that offer open-public datasets. In addition, the authors acknowledge the editor and anonymous reviewers for their valuable comments and suggestions, which helped improve this work significantly.

Conflicts of Interest

The authors declare no conflict of interest.

References

  1. Ci, T.; Liu, Z.; Wang, Y. Assessment of the Degree of Building Damage Caused by Disaster Using Convolutional Neural Networks in Combination with Ordinal Regression. Remote Sens. 2019, 11, 2858. [Google Scholar] [CrossRef] [Green Version]
  2. Schweier, C.; Markus, M. Classification of Collapsed Buildings for Fast Damage and Loss Assessment. Bull. Earthq. Eng. 2006, 4, 177–192. [Google Scholar] [CrossRef]
  3. Liao, C.; Wang, J.; Xie, Q.; Baz, A.A.; Huang, X.; Shang, J.; He, Y. Synergistic Use of Multi-Temporal RADARSAT-2 and VENµS Data for Crop Classification Based on 1D Convolutional Neural Network. Remote Sens. 2020, 12, 832. [Google Scholar] [CrossRef] [Green Version]
  4. Zheng, Z.; Zhong, Y.; Wang, J.; Ma, A.; Zhang, L. Building Damage Assessment for Rapid Disaster Response with a Deep Object-Based Semantic Change Detection Framework: From Natural Disasters to Man-Made Disasters. Remote Sens. Environ. 2021, 265, 112636. [Google Scholar] [CrossRef]
  5. Gupta, R.; Goodman, B.; Patel, N.; Hosfelt, R.; Sajeev, S.; Heim, E.; Doshi, J.; Lucas, K.; Choset, H.; Gaston, M. Creating XBD: A Dataset for Assessing Building Damage from Satellite Imagery. In Proceedings of the 2019 IEEE/CVF Conference on Computer Vision and Pattern Recognition Workshops, Long Beach, CA, USA, 16–17 June 2019; pp. 10–17. [Google Scholar]
  6. Shen, Y.; Zhu, S.; Yang, T.; Chen, C.; Pan, D.; Chen, J.; Xiao, L.; Du, Q. BDANet: Multiscale Convolutional Neural Network with Cross-Directional Attention for Building Damage Assessment from Satellite Images. IEEE Trans. Geosci. Remote Sens. 2022, 60, 1–14. [Google Scholar] [CrossRef]
  7. Cotrufo, S.; Sandu, C.; Giulio Tonolo, F.; Boccardo, P. Building Damage Assessment Scale Tailored to Remote Sensing Vertical Imagery. Eur. J. Remote Sens. 2018, 51, 991–1005. [Google Scholar] [CrossRef] [Green Version]
  8. Chen, X.; Yuan, Y.; Zeng, G.; Wang, J. Semi-Supervised Semantic Segmentation with Cross Pseudo Supervision. In Proceedings of the 2021 IEEE/CVF Conference on Computer Vision and Pattern Recognition, Nashville, TN, USA, 20–25 June 2021; pp. 2613–2622. [Google Scholar]
  9. Osco, L.P.; Marcato Junior, J.; Marques Ramos, A.P.; de Castro Jorge, L.A.; Fatholahi, S.N.; de Andrade Silva, J.; Matsubara, E.T.; Pistori, H.; Gonçalves, W.N.; Li, J. A Review on Deep Learning in UAV Remote Sensing. Int. J. Appl. Earth Obs. Geoinf. 2021, 102, 102456. [Google Scholar] [CrossRef]
  10. Oludare, V.; Kezebou, L.; Panetta, K.; Agaian, S. Semi-Supervised Learning for Improved Post-Disaster Damage Assessment from Satellite Imagery. In Proceedings of the Multimodal Image Exploitation and Learning 2021, SPIE Conference Proceedings, Online, 12–16 April 2021; Volume 11734, pp. 172–182. [Google Scholar]
  11. Reddy, Y.C.A.P.; Viswanath, P.; Reddy, B.E. Semi-Supervised Learning: A Brief Review. Int. J. Eng. Technol. 2018, 7, 81–85. [Google Scholar] [CrossRef] [Green Version]
  12. Hu, H.; Wei, F.; Hu, H.; Ye, Q.; Cui, J.; Wang, L. Semi-Supervised Semantic Segmentation via Adaptive Equalization Learning. In Proceedings of the Advances in Neural Information Processing Systems, Online, 6–14 December 2021; Volume 34, pp. 22106–22118. [Google Scholar]
  13. Liu, Y.; Tian, Y.; Chen, Y.; Liu, F.; Belagiannis, V.; Carneiro, G. Perturbed and Strict Mean Teachers for Semi-Supervised Semantic Segmentation. In Proceedings of the 2022 IEEE/CVF Conference on Computer Vision and Pattern Recognition, New Orleans, LA, USA, 19–24 June 2022; pp. 4248–4257. [Google Scholar]
  14. Laine, S.; Aila, T. Temporal Ensembling for Semi-Supervised Learning. In Proceedings of the International Conference on Learning Representations, Toulon, France, 24–26 April 2017. [Google Scholar]
  15. Tarvainen, A.; Valpola, H. Mean Teachers Are Better Role Models: Weight-Averaged Consistency Targets Improve Semi-Supervised Deep Learning Results. In Proceedings of the 31 Annual Conference on Neural Information Processing Systems, Long Beach, CA, USA, 4–9 December 2017. [Google Scholar]
  16. Ke, Z.; Wang, D.; Yan, Q.; Ren, J.; Lau, R. Dual Student: Breaking the Limits of the Teacher in Semi-Supervised Learning. In Proceedings of the 2019 IEEE/CVF International Conference on Computer Vision, Seoul, Korea, 27 October–2 November 2019; pp. 6727–6735. [Google Scholar]
  17. Ouali, Y.; Hudelot, C.; Tami, M. Semi-Supervised Semantic Segmentation With Cross-Consistency Training. In Proceedings of the 2020 IEEE/CVF Conference on Computer Vision and Pattern Recognition, Seattle, WA, USA, 13–19 June 2020; pp. 12671–12681. [Google Scholar]
  18. Zou, Y.; Zhang, Z.; Zhang, H.; Li, C.-L.; Bian, X.; Huang, J.-B.; Pfister, T. PseudoSeg: Designing Pseudo Labels for Semantic Segmentation. In Proceedings of the International Conference on Learning Representations, Online, 3–7 May 2021; pp. 1–18. [Google Scholar]
  19. French, G.; Laine, S.; Aila, T.; Mackiewicz, M.; Finlayson, G. Semi-Supervised Semantic Segmentation Needs Strong, Varied Perturbations. In Proceedings of the 31st British Machine Vision Conference, Online, 7–10 September 2020; pp. 1–21. [Google Scholar]
  20. Ke, Z.; Qiu, D.; Li, K.; Yan, Q.; Lau, R.W.H. Guided Collaborative Training for Pixel-Wise Semi-Supervised Learning. In Proceedings of the 16th IEEE European Conference Computer Vision, Glasgow, UK, 23–28 August 2020; pp. 429–445. [Google Scholar]
  21. He, Y.; Wang, J.; Liao, C.; Shan, B.; Zhou, X. ClassHyPer: ClassMix-Based Hybrid Perturbations for Deep Semi-Supervised Semantic Segmentation of Remote Sensing Imagery. Remote Sens. 2022, 14, 879. [Google Scholar] [CrossRef]
  22. Kang, J.; Wang, Z.; Zhu, R.; Sun, X.; Fernandez-Beltran, R.; Plaza, A. PiCoCo: Pixelwise Contrast and Consistency Learning for Semisupervised Building Footprint Segmentation. IEEE J. Sel. Top. Appl. Earth Obs. Remote Sens. 2021, 14, 10548–10559. [Google Scholar] [CrossRef]
  23. He, Y.; Wang, J.; Zhang, Y.; Liao, C. Enhancement of Urban Floodwater Mapping From Aerial Imagery With Dense Shadows via Semi-Supervised Learning. IEEE J. Sel. Top. Appl. Earth Obs. Remote Sens. 2022, 15, 9086–9101. [Google Scholar] [CrossRef]
  24. Chen, J.; Sun, B.; Wang, L.; Fang, B.; Chang, Y.; Li, Y.; Zhang, J.; Lyu, X.; Chen, G. Semi-Supervised Semantic Segmentation Framework with Pseudo Supervisions for Land-Use/Land-Cover Mapping in Coastal Areas. Int. J. Appl. Earth Obs. Geoinf. 2022, 112, 102881. [Google Scholar] [CrossRef]
  25. Zhang, B.; Zhang, Y.; Li, Y.; Wan, Y.; Guo, H.; Zheng, Z.; Yang, K. Semi-Supervised Deep Learning via Transformation Consistency Regularization for Remote Sensing Image Semantic Segmentation. IEEE J. Sel. Top. Appl. Earth Obs. Remote Sens. 2022, 1–15. [Google Scholar] [CrossRef]
  26. Sun, C.; Wu, J.; Chen, H.; Du, C. SemiSANet: A Semi-Supervised High-Resolution Remote Sensing Image Change Detection Model Using Siamese Networks with Graph Attention. Remote Sens. 2022, 14, 2801. [Google Scholar] [CrossRef]
  27. Guo, H.; Shi, Q.; Marinoni, A.; Du, B.; Zhang, L. Deep Building Footprint Update Network: A Semi-Supervised Method for Updating Existing Building Footprint from Bi-Temporal Remote Sensing Images. Remote Sens. Environ. 2021, 264, 112589. [Google Scholar] [CrossRef]
  28. Peng, D.; Bruzzone, L.; Zhang, Y.; Guan, H.; Ding, H.; Huang, X. SemiCDNet: A Semisupervised Convolutional Neural Network for Change Detection in High Resolution Remote-Sensing Images. IEEE Trans. Geosci. Remote Sens. 2021, 59, 5891–5906. [Google Scholar] [CrossRef]
  29. You, Z.-H.; Wang, J.-X.; Chen, S.-B.; Tang, J.; Luo, B. FMWDCT: Foreground Mixup Into Weighted Dual-Network Cross Training for Semisupervised Remote Sensing Road Extraction. IEEE J. Sel. Top. Appl. Earth Obs. Remote Sens. 2022, 15, 5570–5579. [Google Scholar] [CrossRef]
  30. Li, Q.; Shi, Y.; Zhu, X.X. Semi-Supervised Building Footprint Generation With Feature and Output Consistency Training. IEEE Trans. Geosci. Remote Sens. 2022, 60, 5623217. [Google Scholar] [CrossRef]
  31. Li, Y.; Ye, S.; Bartoli, I. Semisupervised Classification of Hurricane Damage from Postevent Aerial Imagery Using Deep Learning. J. Appl. Remote Sens. 2018, 12, 045008. [Google Scholar] [CrossRef]
  32. Saito, K.; Spence, R.J.S.; Going, C.; Markus, M. Using High-Resolution Satellite Images for Post-Earthquake Building Damage Assessment: A Study Following the 26 January 2001 Gujarat Earthquake. Earthq. Spectra 2004, 20, 145–169. [Google Scholar] [CrossRef]
  33. Dong, L.; Shan, J. A Comprehensive Review of Earthquake-Induced Building Damage Detection with Remote Sensing Techniques. ISPRS J. Photogramm. Remote Sens. 2013, 84, 85–99. [Google Scholar] [CrossRef]
  34. Lucks, L.; Bulatov, D.; Thönnessen, U.; Böge, M. Superpixel-Wise Assessment of Building Damage from Aerial Images. In Proceedings of the 14th International Joint Conference on Computer Vision, Imaging and Computer Graphics Theory and Applications, Prague, Czech Republic, 25–27 February 2019; pp. 211–220. [Google Scholar]
  35. Li, P.; Xu, H.; Liu, S.; Guo, J. Urban Building Damage Detection from Very High Resolution Imagery Using One-Class SVM and Spatial Relations. Int. Geosci. Remote Sens. Symp. (IGARSS) 2009, 5, V-112–V-114. [Google Scholar] [CrossRef]
  36. Qing, Y.; Ming, D.; Wen, Q.; Weng, Q.; Xu, L.; Chen, Y.; Zhang, Y.; Zeng, B. Operational Earthquake-Induced Building Damage Assessment Using CNN-Based Direct Remote Sensing Change Detection on Superpixel Level. Int. J. Appl. Earth Obs. Geoinf. 2022, 112, 102899. [Google Scholar] [CrossRef]
  37. Lee, J.; Xu, J.Z.; Sohn, K.; Lu, W.; Berthelot, D.; Gur, I.; Khaitan, P.; Ke-Wei, H.; Koupparis, K.; Kowatsch, B. Assessing Post-Disaster Damage from Satellite Imagery Using Semi-Supervised Learning Techniques. arXiv 2020, arXiv:2011.14004. [Google Scholar]
  38. Berthelot, D.; Carlini, N.; Goodfellow, I.; Papernot, N.; Oliver, A.; Raffel, C. MixMatch: A Holistic Approach to Semi-Supervised Learning. arXiv 2019, arXiv:1905.02249. [Google Scholar]
  39. Sohn, K.; Berthelot, D.; Li, C.-L.; Zhang, Z.; Carlini, N.; Cubuk, E.D.; Kurakin, A.; Zhang, H.; Raffel, C. FixMatch: Simplifying Semi-Supervised Learning with Consistency and Confidence. In Proceedings of the Advances in Neural Information Processing Systems, Online, 6–12 December 2020; Volume 33, pp. 596–608. [Google Scholar]
  40. Wu, K.; Otoo, E.; Shoshani, A. Optimizing Connected Component Labeling Algorithms. In Proceedings of the Medical Imaging 2005: Image Processing, San Diego, CA, USA, 12–17 February 2005; Volume 5747, pp. 1965–1976. [Google Scholar]
  41. Yun, S.; Han, D.; Chun, S.; Oh, S.J.; Yoo, Y.; Choe, J. CutMix: Regularization Strategy to Train Strong Classifiers with Localizable Features. In Proceedings of the 2019 IEEE/CVF International Conference on Computer Vision, Seoul, Korea, 27 October–2 November 2019; pp. 6022–6031. [Google Scholar]
  42. Loshchilov, I.; Hutter, F. Decoupled Weight Decay Regularization. In Proceedings of the International Conference on Learning Representations, New Orleans, LA, USA, 6–9 May 2019; pp. 1–18. [Google Scholar]
  43. Smith, L.N. Cyclical Learning Rates for Training Neural Networks. In Proceedings of the IEEE Winter Conference on Applications of Computer Vision, Santa Rosa, CA, USA, 24–31 March 2017; pp. 464–472. [Google Scholar]
  44. Dunnhofer, M.; Antico, M.; Sasazawa, F.; Takeda, Y.; Camps, S.; Martinel, N.; Micheloni, C.; Carneiro, G.; Fontanarosa, D. Siam-U-Net: Encoder-Decoder Siamese Network for Knee Cartilage Tracking in Ultrasound Images. Med. Image Anal. 2020, 60, 101631. [Google Scholar] [CrossRef]
  45. Vetrivel, A.; Gerke, M.; Kerle, N.; Nex, F.; Vosselman, G. Disaster Damage Detection through Synergistic Use of Deep Learning and 3D Point Cloud Features Derived from Very High Resolution Oblique Aerial Images, and Multiple-Kernel-Learning. ISPRS J. Photogramm. Remote Sens. 2018, 140, 45–59. [Google Scholar] [CrossRef]
Figure 1. Illustration of building damage assessment results based on semantic segmentation. (a) Pre-disaster image, (b) post-disaster image, (c) ground truth, (d) results based on post-disaster image, (e) results based on bi-temporal images, and (f) results based on bi-temporal images and object-based post-processing.
Remotesensing 15 00478 g001
Figure 2. Illustration of several typical consistency regularization-based SSL frameworks. BP means the backpropagation; EMA is the exponential moving average; Aug indicates data augmentation. (a) Π-model, (b) mean teacher (c) dual students, (d) cross-consistency training, and (e) adopted dual mean teachers.
Remotesensing 15 00478 g002
Figure 3. Illustration of multitask-based Siamese network for building damage assessment. In the training stage, pre- and post-disaster images are used to train the model for building localization and damage classification. In the inference stage, a connected component labeling (CCL) algorithm and an object-wise voting operation are adopted for object-based post-processing to refine the damage classification results.
Remotesensing 15 00478 g003
Figure 4. Illustration of the proposed SSL framework for building damage assessment.
Remotesensing 15 00478 g004
Figure 5. Composition of the xBD dataset. (a) Pre-disaster image, (b) post-disaster image, (c) building mask, and (d) building damage mask.
Remotesensing 15 00478 g005
Figure 6. Visual comparison of different SL methods on three datasets. (a) Pre-disaster image, (b) post-disaster image, (c) ground truth, (d) Siamese U-Net, (e) BDANet, (f) ours (MT), and (g) ours (MT + PP).
Remotesensing 15 00478 g006
Figure 7. Visual comparison of damage assessment results with different SSL methods. (a) Pre-disaster image, (b) post-disaster image, (c) ground truth, (d) SL, (e) CutMix-Seg, (f) PseudoSeg, (g) CCT, (h) CPS, and (i) proposed SSL method.
Remotesensing 15 00478 g007
Figure 8. Visual comparison of object-based post-processing results. (a) Pre-disaster image, (b) post-disaster image, (c) building localization results, (d) damage classification results, and (e) post-processing damage classification results.
Remotesensing 15 00478 g008
Figure 9. Damage assessment for an example region of Joplin Tornado. (a) Building localization results, (b) building damage classification results, (c) sub-region of the pre-disaster image, (d) sub-region of building localization results, (e) sub-region of the post-disaster image, (f) sub-region of building damage classification results, (g) statistics of ground truth data, and (h) statistics of our assessment results.
Remotesensing 15 00478 g009
Figure 10. Some challenging examples for building damage assessment. (a) Pre-disaster image, (b) post-disaster image, (c) ground truth, and (d) assessment results.
Remotesensing 15 00478 g010
Table 1. Overview information of datasets in the study.
DatasetImage PairsSplit Patch Size
(Pixels)
SensorBand
TrainValidationTest
Joplin
Tornado
55436856111512 × 512Pre: QuickBird
Post: WorldView-2
RGB
Moore
Tornado
76750977154512 × 512Pre: WorldView-2
Post: GeoEye-1
RGB
Hurricane
Michael
20651235351414512 × 512Pre: WorldView-2
Post: GeoEye-1
RGB
Table 2. Quantitative comparison of different SL methods on three datasets (%).
Dataset Method F 1 o v e r a l l F 1 l o c F 1 d a m Damage   F 1   per   Class
No Dmg.Minor Dmg.Major Dmg.Destroyed
Joplin
Tornado
Siamese U-Net --62.3580.4656.7235.7176.51
BDANet--64.2982.9259.4338.0376.78
Ours (MT)74.2590.2267.4083.2360.1344.5481.71
Ours (MT + PP)75.5390.2269.2483.0162.4748.5082.98
Moore
Tornado
Siamese U-Net--68.7491.3348.4853.0682.07
BDANet--69.3190.7847.9555.4883.02
Ours (MT)77.4692.4671.0391.4154.6456.2781.79
Ours (MT + PP)80.1192.4674.8291.3762.6359.7685.53
Hurricane
Michael
Siamese U-Net--49.3169.7840.0644.0443.37
BDANet--49.5967.7544.7548.3037.58
Ours (MT)60.0983.8549.9071.0441.7748.4138.39
Ours (MT + PP)61.0983.8551.3470.1346.5048.8139.91
Table 3. Quantitative comparison of different SSL methods on the Joplin dataset (%).
Method 5% (19)10% (38)20% (76)100% (387)
F 1 o v e r a l l F 1 l o c F 1 d a m F 1 o v e r a l l F 1 l o c F 1 d a m F 1 o v e r a l l F 1 l o c F 1 d a m F 1 o v e r a l l F 1 l o c F 1 d a m
SL59.7182.4849.9563.3484.7854.1569.5786.6562.2575.5390.2269.24
CutMix-Seg66.8787.9957.8269.6688.1061.7572.2389.2864.92---
PseudoSeg67.1783.0660.3669.1387.2061.3971.9888.6864.82---
CCT67.8387.3859.4568.9888.2260.7472.6289.6365.33---
CPS68.1787.1060.0570.6288.1463.1172.8489.1665.85---
Ours70.3088.7362.4071.4888.5464.1773.5589.3766.77---
Table 4. Quantitative comparison of different SSL methods on the Moore dataset (%).
Method 5% (27)10% (54)20% (108)100% (536)
F 1 o v e r a l l F 1 l o c F 1 d a m F 1 o v e r a l l F 1 l o c F 1 d a m F 1 o v e r a l l F 1 l o c F 1 d a m F 1 o v e r a l l F 1 l o c F 1 d a m
SL72.3988.7665.3874.3490.3767.4675.8191.5969.0480.1192.4674.82
CutMix-Seg76.1490.4670.0076.9391.2970.7777.8892.1771.76---
PseudoSeg76.8488.8771.6977.2591.0071.3678.4191.7872.67---
CCT74.4391.0167.3376.5991.3270.2877.9292.0171.88---
CPS76.6989.9471.0277.6090.7971.9578.5191.3772.99---
Ours77.4691.5771.4278.9191.7673.4179.8892.2574.58---
Table 5. Quantitative comparison of different SSL methods on the Michael dataset (%).
Method 5% (65)10% (130)20% (260)100% (1300)
F 1 o v e r a l l F 1 l o c F 1 d a m F 1 o v e r a l l F 1 l o c F 1 d a m F 1 o v e r a l l F 1 l o c F 1 d a m F 1 o v e r a l l F 1 l o c F 1 d a m
SL51.8279.8139.8253.9481.3642.1956.1782.9344.7161.0983.8551.34
CutMix-Seg55.3582.2043.8457.0982.0846.3758.1782.9347.56---
PseudoSeg54.0080.8242.5156.4981.5645.7458.3583.3947.62---
CCT54.1882.2942.1455.6181.4744.5257.7883.0246.96---
CPS55.5582.2444.1156.3183.1344.8157.3483.6346.08---
Ours56.5281.9445.6258.0683.4547.1859.4383.8748.96---
Table 6. Ablation experiments for different components of the proposed framework on three datasets (%).
Baseline MT SSL CW PP Joplin TornadoMoore TornadoHurricane Michael
F 1 o v e r a l l F 1 l o c F 1 d a m F 1 o v e r a l l F 1 l o c F 1 d a m F 1 o v e r a l l F 1 l o c F 1 d a m
--46.44--61.50--39.45
57.3982.4846.6470.0488.7662.0151.2779.8139.04
59.7182.4849.9572.3988.7665.3851.8279.8139.82
68.6088.0160.2774.4391.0167.3352.5679.7740.89
70.0088.0162.2777.0391.0171.0355.2379.7744.72
69.0488.6260.6476.0091.5769.3253.9081.9441.88
71.0288.6263.4777.4691.5771.4256.5281.9445.62
Table 7. Comparison of time cost between two training pipelines on three datasets.
DatasetPipelineLabeled Data F 1 o v e r a l l   ( % ) F 1 l o c   ( % ) F 1 d a m   ( % ) Training Time (min)
Joplin TornadoSL20% (76)69.5786.6562.2539
SSL5% (19)70.3088.7362.4067
Moore TornadoSL20% (108)75.8191.5969.0444
SSL5% (27)77.4691.5771.4285
Hurricane MichaelSL20% (260)56.1782.9344.7179
SSL5% (65)56.5281.9445.62195
Disclaimer/Publisher’s Note: The statements, opinions and data contained in all publications are solely those of the individual author(s) and contributor(s) and not of MDPI and/or the editor(s). MDPI and/or the editor(s) disclaim responsibility for any injury to people or property resulting from any ideas, methods, instructions or products referred to in the content.

