
Using Texture Statistics to Identify and Map Different Dune Types within the Rub’ al Khali


Abstract
:1. Introduction
2. Materials & Methods
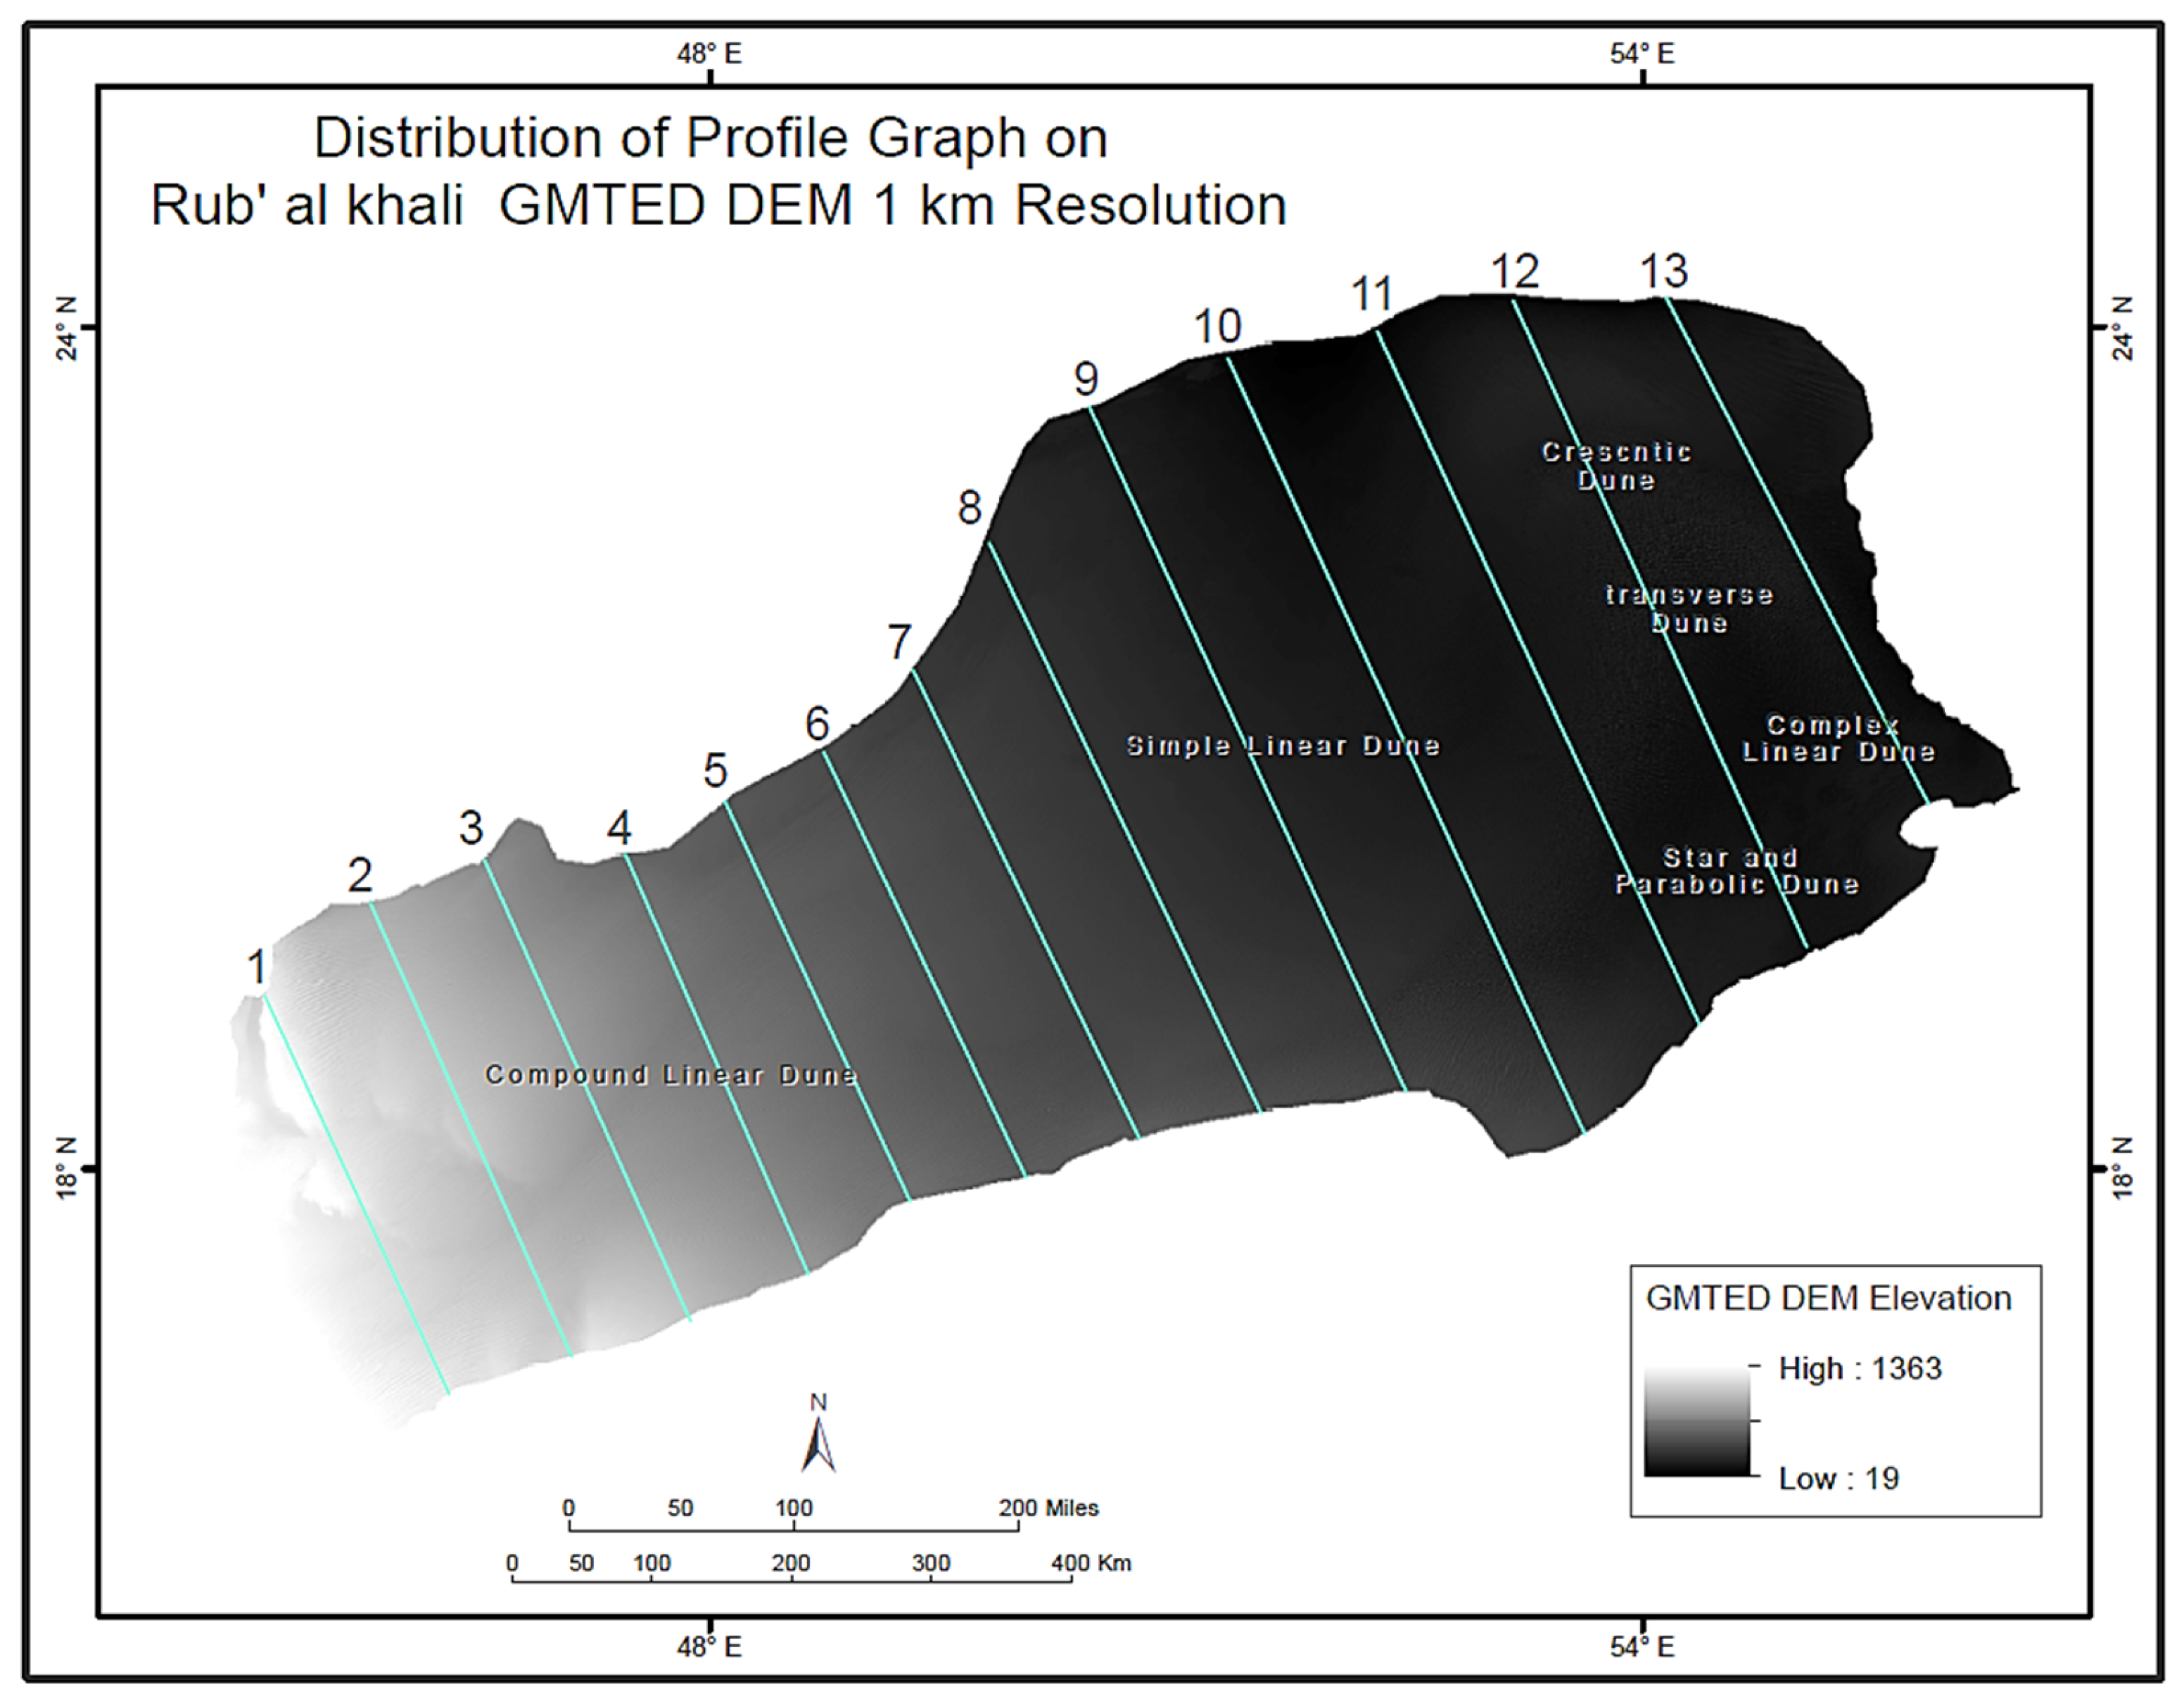
2.1. Study Area
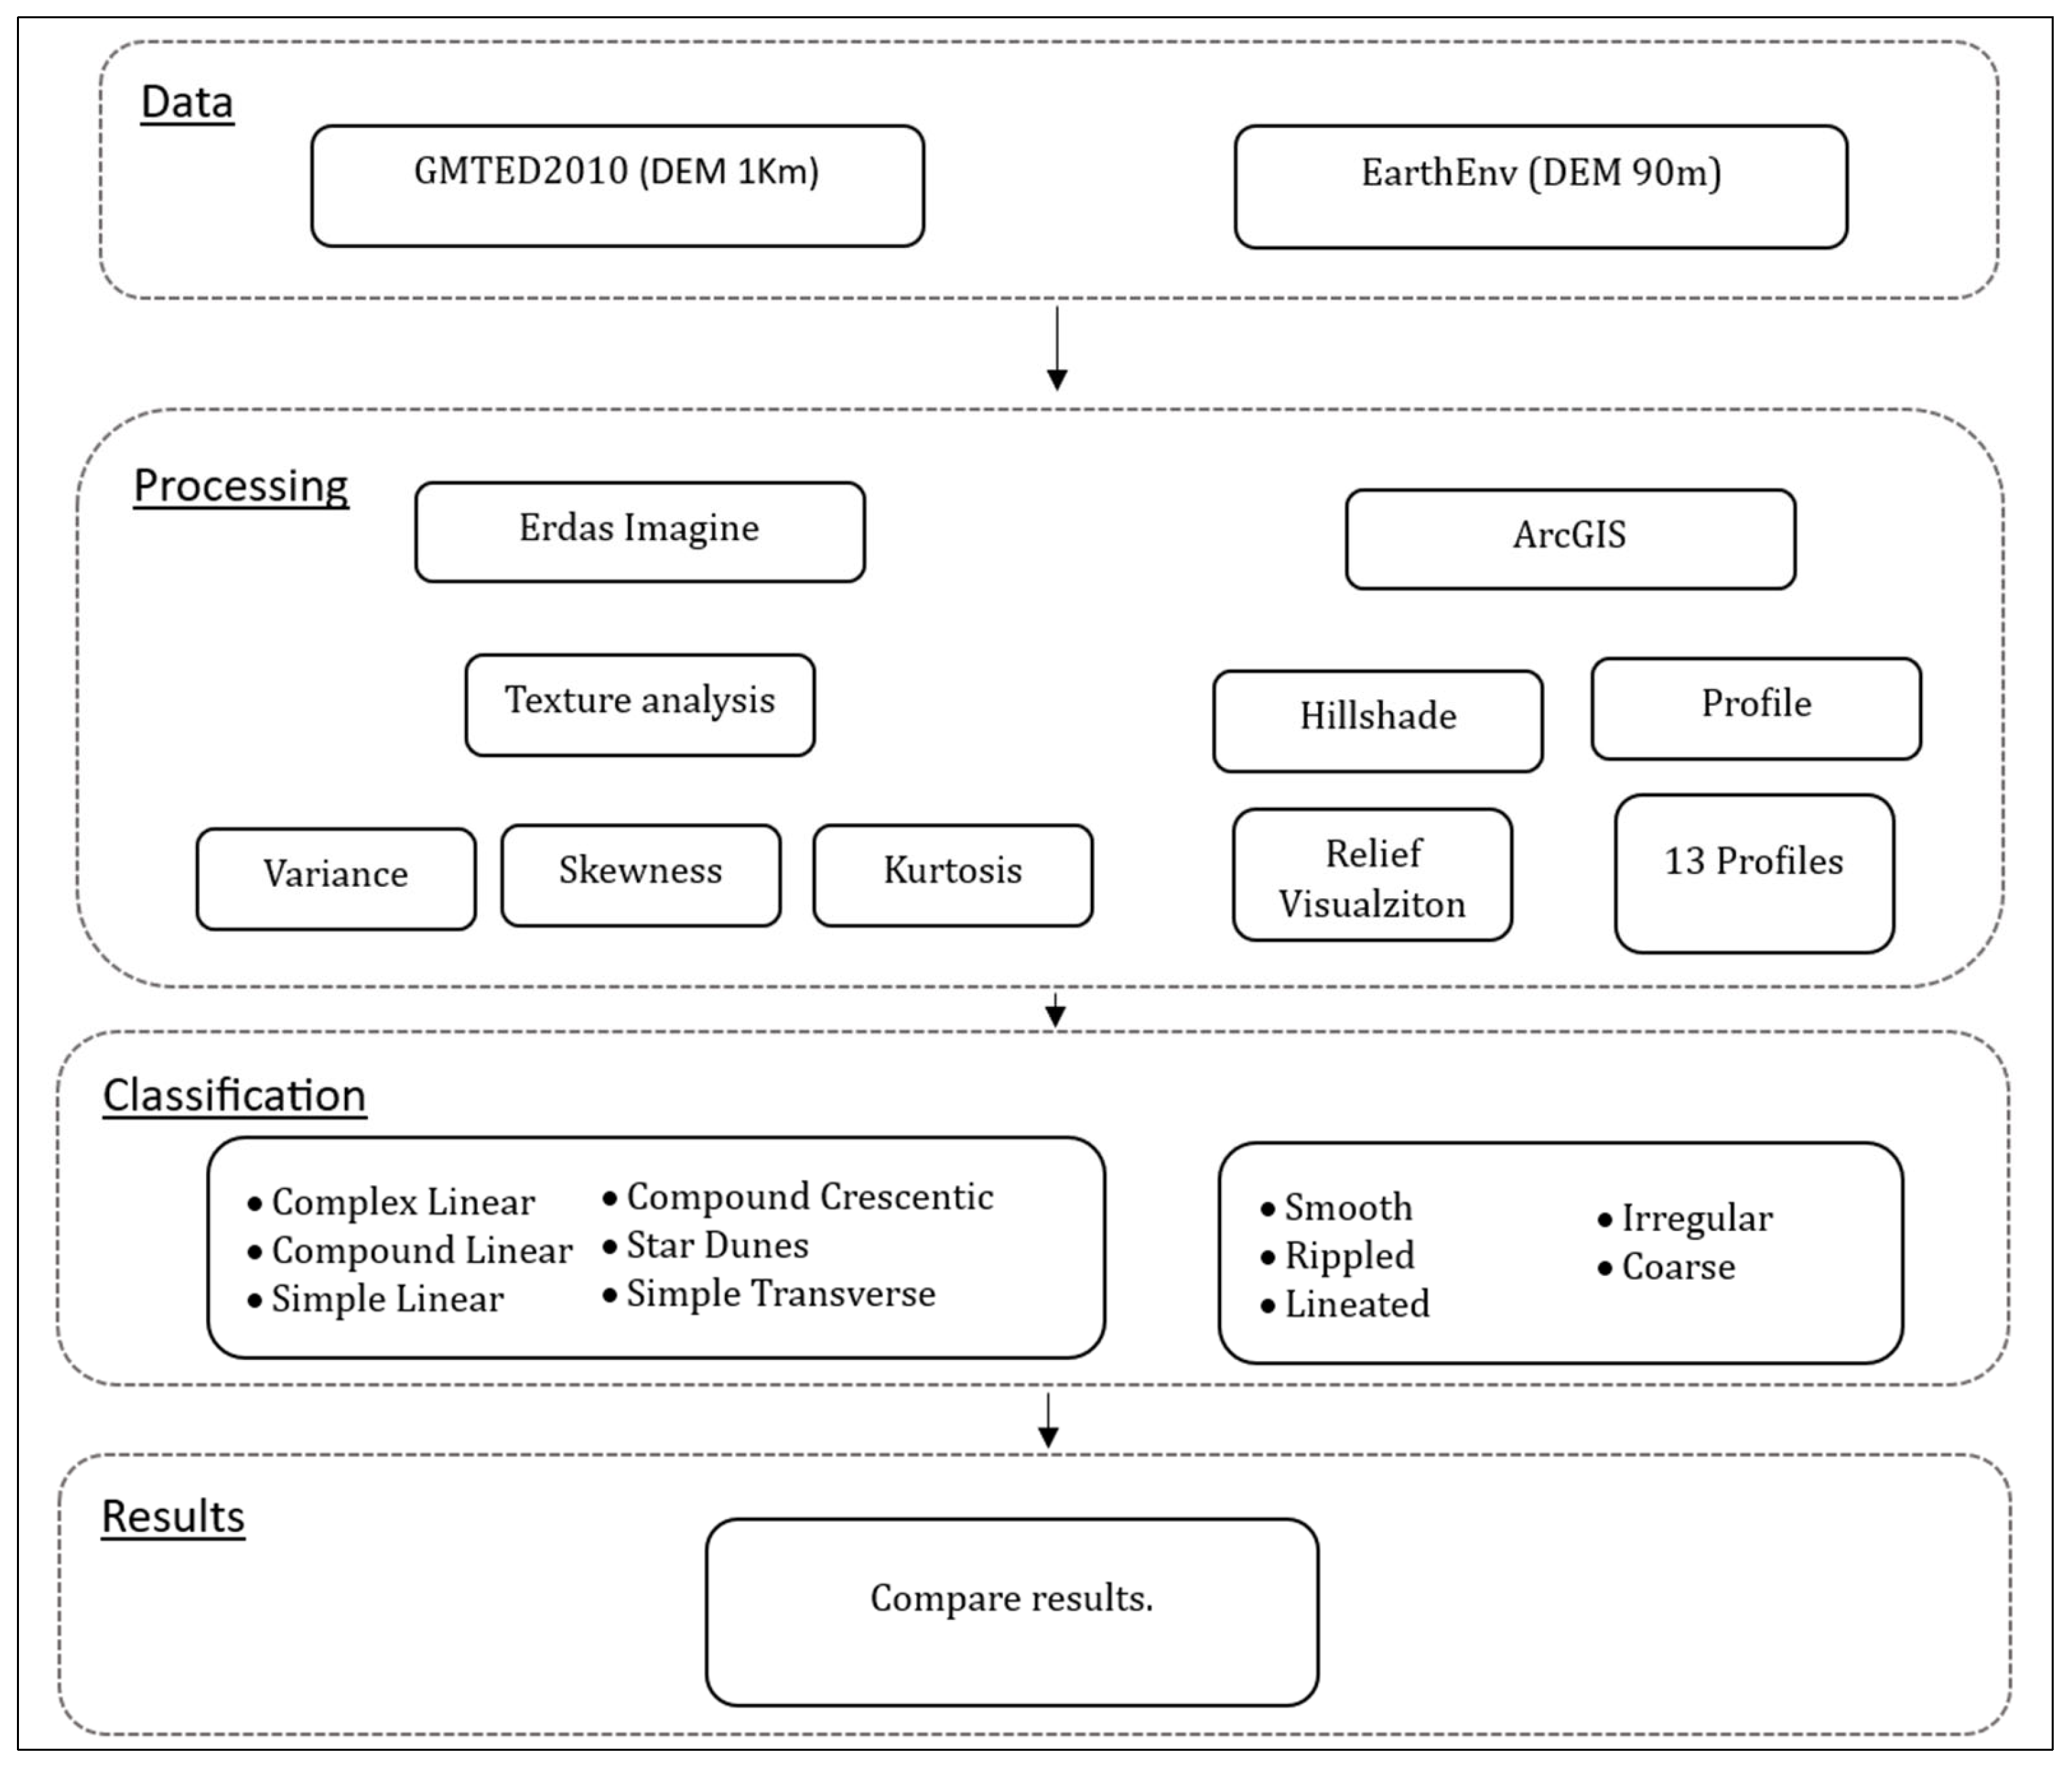
2.2. Data Sources
2.3. Proposed Methods to Distinguish Sand Dune Types
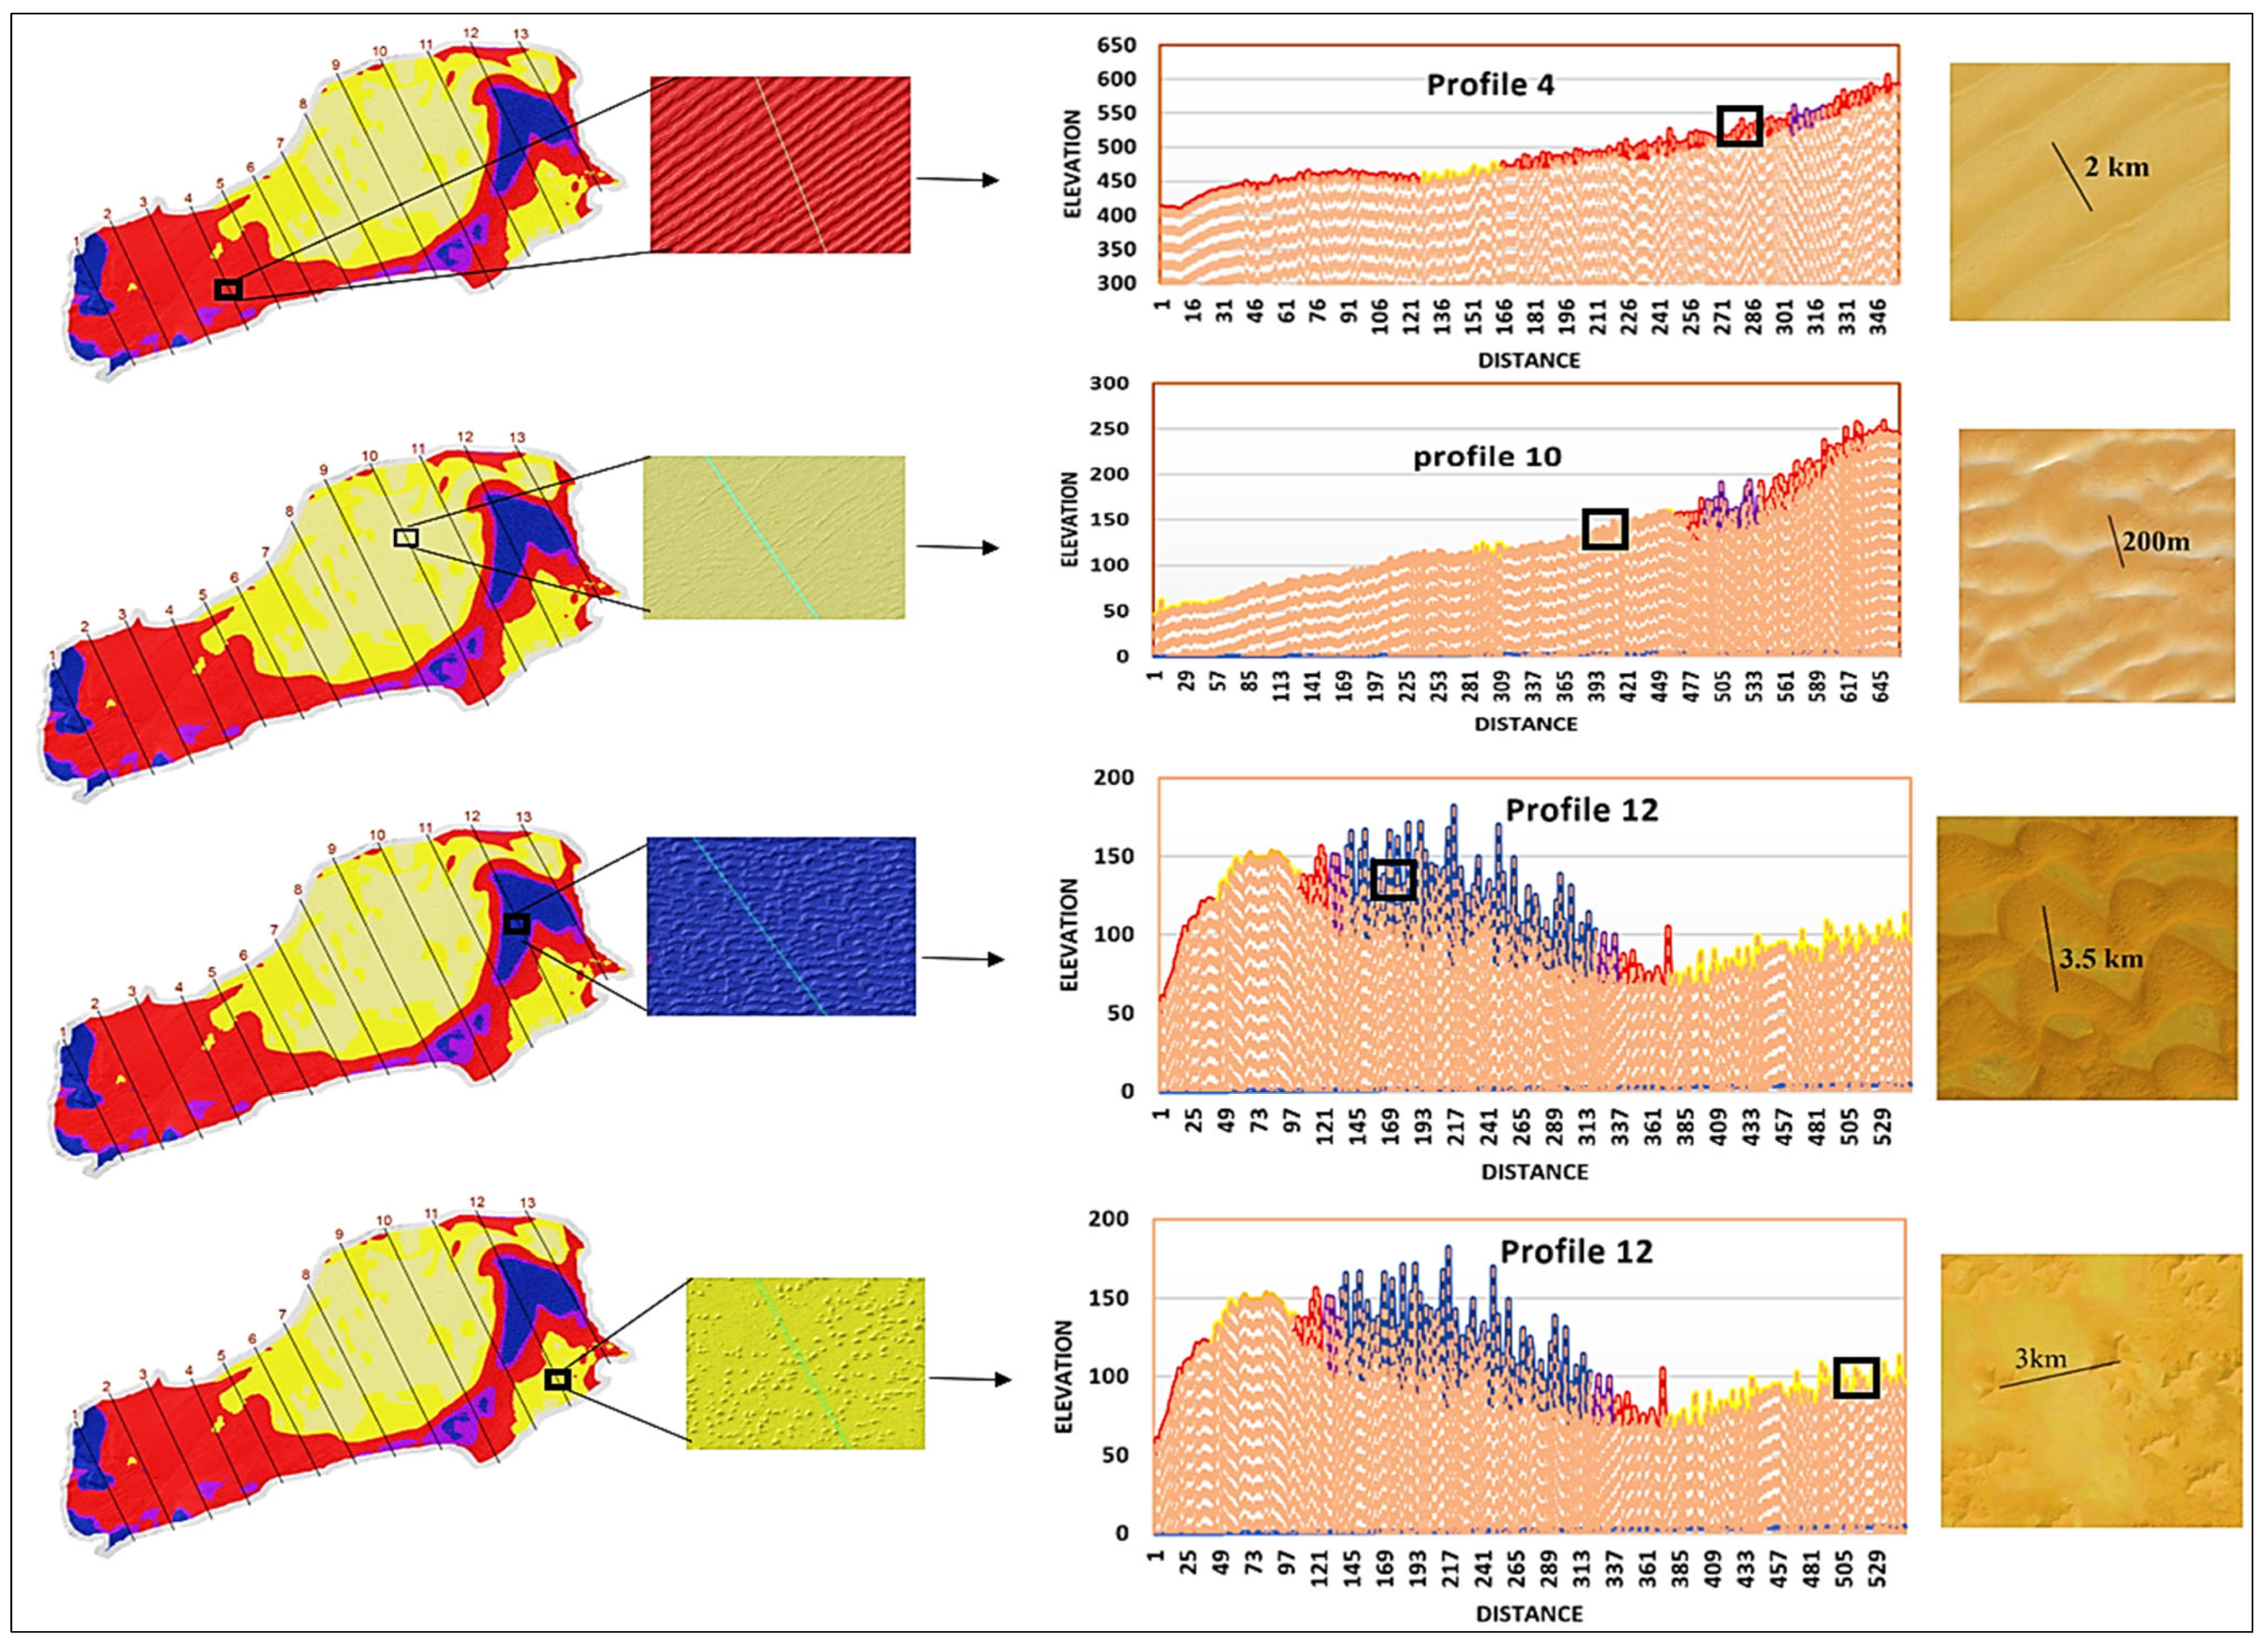
3. Results
4. Discussion
5. Conclusions
Author Contributions
Funding
Acknowledgments
Conflicts of Interest
References
- Edgell, H.S. Arabian Deserts: Nature, Origin and Evolution; Springer Science & Business Media: Berlin, Germany, 2006; ISBN 1-4020-3970-0. [Google Scholar]
- The Saudi Geological Survey. Rub’ al Khali-Great Sand Sea; Saudi Geological Survey: Juddah, Saudi Arabia, 2011.
- Bagnold, R.A. Sand formations in southern Arabia. Geogr. J. 1951, 117, 78–86. [Google Scholar] [CrossRef]
- Holm, D.A. Desert Geomorphology in the Arabian Peninsula: Distinctive land forms provide new clues to the Pleistocene and Recent history of a desert region. Science 1960, 132, 1369–1379. [Google Scholar] [CrossRef]
- Almutlaq, F.; Nahas, F.; Mulligan, K. Calculation of the Rub’al Khali Sand Dune Volume for Estimating Potential Sand Sources. Remote Sens. 2022, 14, 1216. [Google Scholar] [CrossRef]
- Gaur, M.K.; Wadhawan, S.K.; Dhir, R.P. Geomorphological Characteristics of Sand Dunes and Evolution of Aeolian Landscape for Sustainable Future in Western Thar Desert, Rajasthan, India. Sand Dunes North. Hemisph. Distrib. Form. Migr. Manag. 2023, 1, 246. [Google Scholar]
- Zheng, Z.; Du, S.; Taubenböck, H.; Zhang, X. Remote sensing techniques in the investigation of aeolian sand dunes: A review of recent advances. Remote Sens. Environ. 2022, 271, 112913. [Google Scholar] [CrossRef]
- Breed, C.S.; Grow, T. Morphology and distribution of dunes in sand seas observed by remote sensing. Geol. Surv. Prof. Pap. 1979, 1052, 253. [Google Scholar]
- Abdelsamie, E.A.; Abdellatif, M.A.; Hassan, F.O.; El Baroudy, A.A.; Mohamed, E.S.; Kucher, D.E.; Shokr, M.S. Integration of RUSLE Model, Remote Sensing and GIS Techniques for Assessing Soil Erosion Hazards in Arid Zones. Agriculture 2022, 13, 35. [Google Scholar] [CrossRef]
- Kumar, A.; Abdullah, M.M. An overview of origin, morphology and distribution of desert forms, Sabkhas and Playas of the Rub Al Khali Desert of the Southern Arabian Peninsula. Earth Sci. India 2011, 4, 105–135. [Google Scholar]
- Bishop, M.; Shroder, J.F. Geographic Information Science and Mountain Geomorphology; Springer Science & Business Media: Berlin, Germany, 2004. [Google Scholar]
- Andrews, B.; Gares, P.A.; Colby, J.D. Techniques for GIS modeling of coastal dunes. Geomorphology 2002, 48, 289–308. [Google Scholar] [CrossRef]
- Farhadi, H.; Esmaeily, A.; Najafzadeh, M. Flood monitoring by integration of Remote Sensing technique and Multi-Criteria Decision Making method. Comput. Geosci. 2022, 160, 105045. [Google Scholar] [CrossRef]
- Bishop, M.P.; James, L.A.; Shroder, J.F.; Walsh, S.J. Geospatial technologies and digital geomorphological mapping: Concepts, issues and research. Geomorphology 2012, 137, 5–26. [Google Scholar] [CrossRef]
- Bishop, M.A. Nearest neighbor analysis of mega-barchanoid dunes Ar Rub’al Khali sand sea: The application of geographical indices to the understanding of dune field self-organization, maturity and environmental change. Geomorphology 2010, 120, 186–194. [Google Scholar] [CrossRef]
- Al-Masrahy, M.A.; Mountney, N.P. Remote sensing of spatial variability in aeolian dune and interdune morphology in the Rub’Al-Khali, Saudi Arabia. Aeolian Res. 2013, 11, 155–170. [Google Scholar] [CrossRef]
- Yang, T.C. Modifiable areal unit problem. GIS Resour. Doc. 2005, 5, 65. [Google Scholar]
- Scuderi, L.A.; Weissmann, G.S.; Hartley, A.J.; Yang, X.; Lancaster, N. Application of database approaches to the study of Earth’s aeolian environments: Community needs and goals. Aeolian Res. 2017, 27, 79–109. [Google Scholar] [CrossRef]
- Blumberg, D.G. Analysis of large aeolian (wind-blown) bedforms using the Shuttle Radar Topography Mission (SRTM) digital elevation data. Remote Sens. Environ. 2006, 100, 179–189. [Google Scholar] [CrossRef]
- Effat, H.A.; Hegazy, M.N.; Haack, B. Mapping sand dunes risk related to their terrain characteristics using SRTM data and cartographic modeling. J. Land Use Sci. 2011, 6, 231–243. [Google Scholar] [CrossRef]
- White, K.; Bullard, J.; Livingstone, I.; Moran, L. A morphometric comparison of the Namib and southwest Kalahari dunefields using ASTER GDEM data. Aeolian Res. 2015, 19, 87–95. [Google Scholar] [CrossRef]
- Wang, L.; Liu, H. An efficient method for identifying and filling surface depressions in digital elevation models for hydrologic analysis and modelling. Int. J. Geogr. Inf. Sci. 2006, 20, 193–213. [Google Scholar] [CrossRef]
- Robinson, N.; Regetz, J.; Guralnick, R.P. EarthEnv-DEM90: A nearly-global, void-free, multi-scale smoothed, 90 m digital elevation model from fused ASTER and SRTM data. ISPRS J. Photogramm. Remote Sens. 2014, 87, 57–67. [Google Scholar] [CrossRef]
- Haralick, R.M.; Shanmugam, K.; Dinstein, I.H. Textural features for image classification. IEEE Trans. Syst. Man Cybern. 1973, SMC-3, 610–621. [Google Scholar] [CrossRef]
- Jain, R.; Kasturi, R.; Schunck, B.G. Machine Vision; McGraw-Hill: New York, NY, USA, 1995; Volume 5. [Google Scholar]
- Tuceryan, M.; Jain, A.K. Texture analysis. In Handbook of Pattern Recognition and Computer Vision; World Scientific: Singapore, 1993; pp. 235–276. [Google Scholar]
- Materka, A.; Strzelecki, M. Texture Analysis Methods–A Review; COST B11 Report; Technical University of Lodz, Institute of Electronics: Brussels, Belgium, 1998; Volume 10, p. 4968. [Google Scholar]
- Dong, Y.; Fu, S.; Zhang, S.; Hasi, E. Type Distribution, Formation and Evolution of Coastal Aeolian Dunes. In Sand Dunes of the Northern Hemisphere; CRC Press: Boca Raton, FL, USA, 2023; pp. 163–178. [Google Scholar]
- Frye, C. Hillshades for Analysis Maps. Esri. 2008. Available online: https://blogs.esri.com/esri/arcgis/2008/12/09/hillshades-for-analyis-maps/ (accessed on 22 March 2022).
- Goodchild, M.F. Introduction: Special issue on uncertainty in geographic information systems. Fuzzy Sets Syst. 2000, 113, 3–5. [Google Scholar]
- Liu, Y.; Wang, Y.S.; Shen, T. Spatial distribution and formation mechanism of aeolian sand in the middle reaches of the Yarlung Zangbo River. J. Mt. Sci. 2019, 16, 1987–2000. [Google Scholar] [CrossRef]
- Potts, L.V.; Akyilmaz, O.; Braun, A.; Shum, C.K. Multi-resolution dune morphology using Shuttle Radar Topography Mission (SRTM) and dune mobility from fuzzy inference systems using SRTM and altimetric data. Int. J. Remote Sens. 2008, 29, 2879–2901. [Google Scholar] [CrossRef]
- Hendawy, E.; Belal, A.A.; Mohamed, E.S.; Elfadaly, A.; Murgante, B.; Aldosari, A.A.; Lasaponara, R. The prediction and assessment of the impacts of soil sealing on agricultural land in the North Nile Delta (Egypt) using satellite data and GIS modeling. Sustainability 2019, 11, 4662. [Google Scholar] [CrossRef]
- El Nahry, A.H.; Mohamed, E.S. Potentiality of land and water resources in African Sahara: A case study of south Egypt. Environ. Earth Sci. 2011, 63, 1263–1275. [Google Scholar] [CrossRef]


| DEM Name | Original Source | Resolution | Year | Source Link |
|---|---|---|---|---|
| GMTED2010 v2 | Shuttle Radar Topography Mission (primary source) | Multi-resolution, 30, 15, and 7.5 arcseconds | 2011 | https://topotools.cr.usgs.gov/gmted_viewer/viewer.htm, accessed on 22 March 2022 |
| EarthEnv-DEM90 | Derived by fusing ASTER GDEM v2 with SRTM v4.1 | 3 arcseconds (~90 m) | 2014 | http://www.earthenv.org/DEM, accessed on 22 March 2022 |
| Categories | Smooth | Rippled | Lineated | Irregular | Coarse | Total % |
|---|---|---|---|---|---|---|
| Complex Linear Dunes | 0 | 31 | 69 | 0 | 0 | 100 |
| Compound Linear Dunes | 3 | 14 | 66 | 2 | 15 | 100 |
| Simple Linear Dunes | 62 | 30 | 7 | 0 | 1 | 100 |
| Compound Crescentic Dunes | 0 | 1 | 39 | 5 | 55 | 100 |
| Star Dunes | 8 | 49 | 43 | 0 | 0 | 100 |
| Simple Transverse Dunes | 47 | 38 | 16 | 0 | 0 | 100 |
Disclaimer/Publisher’s Note: The statements, opinions and data contained in all publications are solely those of the individual author(s) and contributor(s) and not of MDPI and/or the editor(s). MDPI and/or the editor(s) disclaim responsibility for any injury to people or property resulting from any ideas, methods, instructions or products referred to in the content. |
© 2023 by the authors. Licensee MDPI, Basel, Switzerland. This article is an open access article distributed under the terms and conditions of the Creative Commons Attribution (CC BY) license (https://creativecommons.org/licenses/by/4.0/).
Share and Cite
Almutlaq, F.; Mulligan, K. Using Texture Statistics to Identify and Map Different Dune Types within the Rub’ al Khali. Remote Sens. 2023, 15, 4653. https://doi.org/10.3390/rs15194653
Almutlaq F, Mulligan K. Using Texture Statistics to Identify and Map Different Dune Types within the Rub’ al Khali. Remote Sensing. 2023; 15(19):4653. https://doi.org/10.3390/rs15194653
Chicago/Turabian StyleAlmutlaq, Fahad, and Kevin Mulligan. 2023. "Using Texture Statistics to Identify and Map Different Dune Types within the Rub’ al Khali" Remote Sensing 15, no. 19: 4653. https://doi.org/10.3390/rs15194653