Article

Impacts of Extreme-High-Temperature Events on Vegetation in North China

1
School of Ecology and Nature Conservation, Beijing Forestry University, Beijing 100083, China
2
National Climate Center, China Meteorological Administration, Beijing 100081, China
*
Author to whom correspondence should be addressed.
Remote Sens. 2023, 15(18), 4542; https://doi.org/10.3390/rs15184542
Submission received: 19 July 2023 / Revised: 1 September 2023 / Accepted: 4 September 2023 / Published: 15 September 2023

Abstract

:
Understanding the response of vegetation to temperature extremes is crucial for investigating vegetation growth and guiding ecosystem conservation. North China is a vital hub for China’s economy and food supplies, and its vegetation is highly vulnerable to complex heatwaves. In this study, based on remote sensing data, i.e., the normalized difference vegetation index (NDVI), spatio-temporal variations in vegetation and extreme high temperatures are investigated by using the methods of trend analysis, linear detrending, Pearson correlation and ridge regression. The impacts of extreme-high-temperature events on different vegetation types in North China from 1982 to 2015 are explored on multiple time scales. The results indicate that the NDVI in North China exhibits an overall increasing trend on both annual and monthly scales, with the highest values for forest vegetation and the fastest growth trend for cropland. Meanwhile, extreme-high-temperature events in North China also display an increasing trend. Before detrending, the correlations between the NDVI and certain extreme-high-temperature indices are not significant, while significant negative correlations are observed after detrending. On an annual scale, the NDVI is negatively correlated with extreme temperature indices, except for the number of warm nights, whereas, on a monthly scale, these negative correlations are only found from June to September. Grassland vegetation shows relatively strong correlations with all extreme temperature indices, while forests show nonsignificant correlations with the indices. This study offers new insight into vegetation dynamic variations and their responses to climate in North China.

Graphical Abstract

1. Introduction

Climate is fundamentally related to the probability of certain weather events, and events that, statistically, deviate considerably from the mean state are defined as extreme climate events [1]. Compared with the climatic state, extreme climate events are more anomalous and unpredictable [2]. The Sixth Assessment Report of the Intergovernmental Panel on Climate Change indicates that global temperatures have obviously increased, and the increase in temperatures will continue to impact the natural environment and human society in the future [3]. In the context of global warming, the frequency, intensity and duration of extreme climate events have increased worldwide [4,5,6,7,8].
These extreme climate events have profound impacts on ecological stability, social development, people’s production and livelihoods [6,7,8,9,10]. Frequent extreme heatwave events can cause water scarcity, soil drying, an increase in pests and diseases and a reduction in agricultural and fishery yields [11]. Drought events caused by extreme heatwaves frequently trigger forest pests, forest fires and other disasters, leading to increased mortality rates in trees [12,13]. However, warming within the photosynthetic threshold can increase the rate of photosynthesis [14], while an increase in the number of warm nights can reduce frost damage to animals and plants in temperate regions [15]. Therefore, the impacts of extreme high temperatures can be both positive and negative, and different extreme-high-temperature events have diverse impacts on different regions.
As one of the determining factors of land ecosystem responses to climate change [9], vegetation has been increasingly studied in relation to extreme climate events based on indices such as the leaf area index, normalized difference vegetation index (NDVI) and enhanced vegetation index [16,17]. The remote sensing index, NDVI, can reflect changes in vegetation coverage on the Earth’s surface, which is commonly used to investigate vegetation cover variations and responses to climate change [16,18]. Scholars at home and abroad have conducted corresponding studies on the relationship between extreme temperature conditions and vegetation phenology, as well as the correlation of the NDVI with vegetation coverage, etc. Results have shown that the effects of temperature extremes on vegetation vary with regions, seasons and scales [19,20].
For example, Piao [21] analyzed the leaf unfolding dates of vegetation in Europe and the United States and found that the impact of the increase in daily maximum temperature on the advancement of the leaf unfolding dates was obviously greater than that of the increase in daily mean temperature. In an analysis of the NDVI and extreme climate events in northwestern China, it was found that the increase in temperature extremes can lead to the evaporation of soil moisture, thereby affecting vegetation growth [22]. Wang et al. [23] found that correlations of the NDVI with extreme-high-temperature indices in the coastal area of China vary significantly across the Huang-Huai region, with marked differences between the northern and southern regions. In Guangxi Province, the correlation between strengthened vegetation activity and increased temperature indices is positive on an annual scale, whereas the positive correlation only appears in spring and summer on a seasonal or monthly scale [24]. Understanding the responses of terrestrial vegetation to extreme climate events, such as extreme heat stress at different spatio-temporal scales, is crucial for predicting the responses of global terrestrial ecosystems to future climate changes, particularly in the context of the potential exacerbation of climatic extremes [25,26,27].
North China, a core region of the Chinese economy and of grain production, experiences a variable climate and is particularly sensitive to climate change [28]. In the past, North China has had a warming and drying trend in terms of climate and has experienced several large-scale drought disasters [29,30]. Notably, extreme-high-temperature events in North China have exhibited an obvious increasing trend [31,32]. By the end of the 21st century, it is expected that the North China Plain will be subjected to deadly heatwaves, with the wet-bulb temperature exceeding the threshold for outdoor agricultural labor [29,33]. Against the backdrop of frequent extreme climate events, vegetation coverage in North China shows an overall increasing trend [34]. Therefore, it is of great importance to research the relationship between extreme-high-temperature events and vegetation cover in this region to provide scientific guidance for ecological construction and sustainable development in the future.
The interaction between extreme-high-temperature events and the NDVI has been extensively investigated by domestic and foreign scholars. However, previous studies on North China have focused primarily on a single type of vegetation. Less attention has been paid to horizontal comparisons of vegetation types and the implications of climate extremes for vegetation at multiple temporal scales [35,36,37,38]. Additionally, in previous studies exploring the relationship between vegetation and climate factors in North China, correlation analyses were commonly employed [35,39]. However, this method only reveals the degree of correlation between independent and dependent variables, but not the degree of influence of the independent variables on the dependent variables. Therefore, this study aims to conduct a cross-sectional comparison of different vegetation types by employing correlation and ridge regression (RR) models at multiple time scales. In addition, the historical variation characteristics and spatial differences of extreme-high-temperature events in North China are investigated, and the impacts of extreme-high-temperature events on vegetation cover are explored.
The remainder of this paper is arranged as follows. Section 2 introduces the data and methods used in this study. Section 3 shows the results, including the spatio-temporal variabilities of vegetation dynamics, the spatio-temporal variabilities of extreme-high-temperature indices and the correlations and RRs between the NDVI and extreme-high-temperature indices. A discussion is provided in Section 4. Conclusions are presented in Section 5.

2. Data and Methods

2.1. Study Area and Data

North China is located in the area of 34.59°N–53.33°N, 97.17°E–126.28°E and covers approximately 1.52 × 10⁶ km2 (Figure 1a), encompassing the Inner Mongolia Autonomous Region, Beijing, Hebei Province, Tianjing and Shanxi Province [31]. North China, a core area of China’s economy and agriculture, has a fragile ecological environment. Its climate in summer is hot and relatively humid, occupying about 60% of the annual precipitation. Its winter is cold and dry (Figure 1d). The average annual temperature ranges from 13.7 °C in the southwest to −5.7 °C in the northeast (Figure 1c). Similarly, annual precipitation exhibits a visible decreasing gradient from the southwest to the northeast, ranging between 664.7 mm and 60.3 mm (Figure 1b). The southeastern part of North China belongs to the temperate monsoon zone, while the northwestern part of this area is categorized as a semi-arid zone [13]. In the context of frequent climate extremes, recurrent and consecutive heatwaves have led to uncertainty for agriculture and its sustainability in North China [40].
All datasets used in this study are described in Table 1, including the reliable Global Inventory Modeling and Mapping Studies (GIMMS) NDVI3g version 1.0 dataset, which is derived from the GIMMS of the National Aeronautics and Space Administration. The GIMMS NDVI3g version 1.0 dataset has a spatial resolution of 1/12° × 1/12° and a temporal interval of 15 days. Although the spatial resolution of this dataset is relatively low, this dataset has the longest time series, available for the 34-year period from 1982 to 2015 [41,42,43]. The dataset has been verified to be reliable through comparisons with ground-based validations and other NDVI products. The monthly NDVI values are obtained by using the maximum-value composites method, which minimizes the influences of sun altitude, clouds, water vapor, aerosols and directional surface reflectance [44,45]. Moreover, the pixel values of >0.1 in the raster maps are selected as valid units to explore the vegetation dynamics.
The long-term climate data employed in this study are from a gridded daily observation dataset, CN05.1, which is constructed by an anomaly approach during the interpolation with more station observations (~2400) in China [46,47]. Three variables are used in this study, i.e., daily minimum temperature, daily maximum temperature and daily mean temperature. This dataset is available for the period of 1961–2022, with a spatial resolution of 1/4° × 1/4°. The CN05.1 dataset has been widely used to investigate the effects of climate factors on vegetation growth. The climate data are first subjected to a basic cropping process, and the extreme-high-temperature indices are calculated by using the climate data from 1 January 1982 to 31 December 2015 to correspond to the time length of the NDVI data.
To effectively promote the detection of variations in extreme weather events in various countries around the world, the Expert Team on Climate Change Detection and Indices has defined 27 extreme indices, which are now widely used in extreme climate research around the world [24,35,36,48,49]. In this research, we select six extreme-high-temperature indices, namely the maximum (TXX) and minimum values (TXN) of the daily maximum temperature, the maximum (TNX) and minimum values (TNN) of the daily minimum temperature and the number of warm days (TX90) and warm nights (TN90). The selected indices involve the calculations of extreme values and thresholds, which can quantify the variations in extreme temperature more fully.
Most current studies of vegetation responses to extreme climate events have adopted a direct correlation approach based on raw data [35,36]. However, it is undeniable that a simple correlation analysis directly using raw data confounds the influences of multiple factors (not just extreme temperature) on vegetation [48]. To minimize the effect of these factors on the results, we discuss the response of the daily mean temperature (TM) in this study to compare with the vegetation responses to the extreme temperature indices. Table 2 provides more information on the extreme-high-temperature indices.
Land use and cover data with a spatial resolution of 1 km are downloaded from the Resource and Environment Science and Data Center, China Land Use/Cover Datasets. They are interpreted based on the Landsat TM image of the United States by artificial virtualization [50,51]. The sub-regions of the three vegetation types (farmlands, forests and grasslands) are extracted from land use and land cover data. In this research, the data of the most recent available year (2020) are used (Figure 1e).
All data are cropped by using the Aeronautical Reconnaissance Coverage Geographic Information System 10.7 and are then synthesized by using Python 3.11, and the trilinear interpolation is applied to unify the resolution to 0.25° for the subsequent analysis.

2.2. Methods

Figure 2 provides the flowchart of the approaches used in this study.

2.2.1. Linear Regression

We calculate the regional average value of each variable based on the mean of all pixels distributed in the study area. The linear regression method is used to characterize the temporal trends of the NDVI and extreme-high-temperature indices [36,52]. The slope of the linear regression based on least-squares fitting indicates the annual change rate of the variable, with positive values representing an increasing trend and negative values representing a decreasing trend. The slope is calculated according to Equation (1).
θ slope = n i = 1 n ( i × I i ) i = 1 n i × i = 1 n I i n i = 1 n i 2 ( i = 1 n i ) 2
where θ slope denotes the variation rate of a variable, n the period length (34 years), i the serial number of years and I i the value of the variable in the ith year.
Moreover, the variation trends of the elements are classified into three groups based on the results of the F-test method, i.e., significant decreasing trend (p < 0.05, θ slope < 0), significant increasing trend (p < 0.05, θ slope > 0) and nonsignificant variation trend (p > 0.05).

2.2.2. Pearson Correlation Analysis

Pearson correlation analysis is applied to measure the degree of the correlations between the vegetation dynamics and the extreme-high-temperature indices at both regional average and pixel scales [53].
R x , y = i = 1 n [ ( x i x ¯ ) ( y i y ¯ ) ] i = 1 n ( x i x ¯ ) 2 × i = 1 n ( y i y ¯ ) 2
where R x , y indicates the correlation coefficient, denoting the degree of the correlations between the extreme-high-temperature indices ( x i ) and the NDVI ( y i ) . x ¯ and y ¯ represent corresponding mean values in the period length (34 years).
Moreover, the coefficients between the NDVI and the temperature indices are classified into three groups based on the results of the F-test method, namely significantly negative (p < 0.05, R x , y < 0), significantly positive (p < 0.05, R x , y > 0) and nonsignificant (p > 0.05).
In order to investigate the impacts of extreme-high-temperature events on vegetation, Pearson correlation analyses are conducted between the NDVI and the extreme-high-temperature indices. In our study, the extreme-high-temperature indices and the NDVI are detrended, and Pearson correlation analyses are subsequently performed between the detrended extreme-high-temperature indices and the NDVI.

2.2.3. Linear Detrending

Vegetation growth is strongly influenced by climate, and it can also affect the climate system through a series of bio-physical processes [54,55]. Hence, it is difficult to analyze the changes directly from the original time series, and the raw data need to be detrended.
Detrending decouples interannual variation in vegetation and climate from long-term directional variations [56,57]. Linear detrending is the process of obtaining a new time series from the original time series by removing the corresponding linear trend [58]. This approach avoids the confounding influence of long-term variations, such as the fertilization effects of rising atmospheric CO2 concentration, atmospheric nitrogen deposition [55] and anthropogenic activities [20]. Consequently, the linear detrending method is utilized in this study with the following calculation method.
For a sequence X = { X [ 1 ] ,   X   [ n ] } and its linear trend function g(k), the linear detrending sequence of X is defined as X = { X [ 1 ] ,   ,   X [ n ] } , where X [ k ] = X [ k ] g ( k ) and k = 1 , , n [56].

2.2.4. Ridge Regression

The least-square approach is widely used to describe the impacts of a number of variables on the response variable. However, in the presence of multi-collinearity, the least-square technique may show poor performance as a solution method [59]. The results of numerous studies have indicated significant linear cross-correlations in extreme climatic indices, especially for the correlation between the maximum temperature and the minimum temperature [60].
To avoid the multicollinearity, ridge regression (RR) is used to quantify the relationship between the extreme temperature indices and the NDVI. When there is collinearity, the parameters estimated by RR are more robust than those by the least-square approach [59,61]. Specifically, the RR method solves the matrix inverse problem by adding a nonzero value of k (ridge or shrinkage parameter) to the diagonal elements of X X . Thus, the ridge estimator for the linear coefficients is expressed by Equation (3) [62,63]:
β = ( X X + k I n ) 1 X y    
where I n represents an identity matrix. k denotes the ridge or shrinkage parameter, which determines the strength of the penalty imposed on the regression coefficients. In this study, the parameter k is estimated by using the leave-one-out cross-validation method [64], which employs the entire dataset to calibrate the model, and thus can obtain unbiased regression coefficient estimations.
Firstly, the NDVI and the extreme-high-temperature indices are detrended and standardized. Then, RR is employed to supplement the Pearson correlation analysis to obtain the best fitting regression equation, and the regression coefficient of each extreme-high-temperature index is quantified to assess the degree of its influence on the NDVI.

3. Results

3.1. Spatio-Temporal Variability of Vegetation Dynamics

3.1.1. Temporal Variations in Vegetation Dynamics

Figure 3a reveals the time series of the annual NDVI. The multi-year mean of the annual NDVI over the past 34 years is 0.285. The maximum value is observed in 2015, reaching 0.299. The minimum value is found in 1982, namely 0.276. From 1982–2015, the regional average NDVI increases significantly, with an annual rate of 0.0004 year−1, and the trend exhibits several fluctuations. These observations suggest that the vegetation cover increased in North China from 1982 to 2015. The regional average annual NDVI values for the three vegetation types (cropland, forest and grassland) are also calculated to further investigate the differences in the greenness in different vegetation type areas (Figure 3b). The forest consistently exhibits the highest NDVI values, while the grassland displays the lowest NDVI values throughout the year. The three vegetation types show increasing multi-year trends, similar to that of the entire North China region. Note that the cropland shows the highest growth trend (0.0008 year−1), whereas the grassland demonstrates the lowest growth trend (0.0003 year−1).
Figure 3c computes the correlation between different monthly NDVI values and annual NDVI values from 1982 to 2015, reflecting the intra-annual heterogeneity and the periodic variation between different months of the NDVI. The correlations are positive from January to October but negative in November and December, indicating an increasing trend of vegetation cover from January to October but a decreasing trend in November and December. The strong correlation between April and October (correlation > 0.5, p < 0.01) indicates that the growth of the NDVI is mainly concentrated in these months.
Table 3 further analyzes the NDVI values on a monthly scale. The regional mean NDVI values on a monthly scale in North China range from 0.155 to 0.478, with the highest value appearing in August and the lowest in February (Figure 1d). The cropland, forest and grassland vegetation generally show similar trends to that of North China as a whole, with an increasing trend from March to October and a decreasing trend from November to February. The month with the fastest growth rate for all types is October. For North China as a whole, the highest rate is 0.0016 year−1 in October. The greenness rate of cropland is generally the highest in each month, with the highest value of 0.0026 year−1 in October.

3.1.2. Spatial Variations in Vegetation Dynamics

From 1982 to 2015, the spatial distributions of the annual average NDVI values are quite different in North China (Figure 4a). In general, the mean NDVI demonstrates a gradual increasing trend from the southwest to the northeast. Annual mean NDVI values are high (0.6–0.7) in northeastern and southeastern North China, such as the Beijing–Tianjin–Hebei Plain and Shanxi Province, while annual mean values are low (0–0.1) in western North China, which is covered predominantly by deserts.
The spatial variation in the NDVI has been highly heterogeneous across North China during the past 34 years. As illustrated in Figure 4b, the NDVI increases in most areas (70% region) but decreases in some areas (30% region). Statistical analysis reveals that 47.4% of the study area has experienced significant (p < 0.05) greening and 11.7% has experienced significant (p < 0.05) browning. Spatially, the areas with substantially increasing NDVI values are primarily in the south, where croplands and forests predominate. Conversely, the regions with decreasing NDVI values are primarily located in the central grassland of Inner Mongolia and the forest areas in the northeast of North China.

3.2. Spatio-Temporal Variabilities of Extreme-High-Temperature Indices

3.2.1. Temporal Variations in Extreme-High-Temperature Indices

The regional average temporal variations in the extreme-high-temperature indices are displayed in Figure 5, where the TM shows a significant increasing trend (0.036 year−1, p < 0.01).
From 1982 to 2015, both the TXX and TNX values exhibit significant upward trends, with increasing rates of 0.058 year−1 and 0.056 year−1, respectively, which are much higher than that of TM. Meanwhile, the TNN and TXN values show nonsignificant trends. Additionally, the TX90, TN90 values increase significantly. These findings collectively indicate a significant increase in temperature in North China from 1982 to 2015, accompanied by an increase in the number of high-temperature events.
The multi-year trends for three vegetation regions are shown in Table 4. In the regions with all three vegetation types (cropland, forest, grassland), the TM and all extreme-high-temperature indices show increasing trends, with significant increases in TM, TXN, TNX, TX90 and TN90.
The trends of the extreme-high-temperature indices for each month are shown in Table 5, where TM shows significant increasing trends from March to September. The monthly TXX and TNX values show more obvious increasing trends, with trends in more than half of the months passing the significance test (p < 0.05), while the TXN and TNN values show nonsignificant trends in all months except for June and July. In addition, TX90 and TN90 generally show an increasing trend in the months where values are available. On a monthly scale, the characteristics of the extreme-high-temperature indices are slightly different from those on an annual scale. Among them, in the analyses of the extreme-high-temperature indices, the temperature still shows a general increase; high-temperature events also increase, with certain seasonal differences, such as a decreasing trend in cold January and December.

3.2.2. Spatial Variations in Extreme-High-Temperature Indices

The spatial distributions in Figure 6 indicate that TM in North China has a generally increasing trend throughout the region, while extreme-high-temperature variations are heterogeneous.
TXX, TNX, TX90 and TN90 all show upward trends in the whole region of North China, which are much higher than TM and generally significant (p < 0.05). The area with significantly increasing TN90 values even reaches 93.2%, and the region with significantly increasing TX90 values reaches 91.7%. In contrast, the overall TXN and TNN variations are not significant. The spatio-temporal variations in the TXN and TNN values show similar distributions, with both increases and decreases by area. Areas with increasing trends are mainly in central North China, and those with decreasing trends are in the western and northeastern regions of North China.
In summary, the results of the examination on spatial and temporal scales are similar, revealing a prevailing ascending tendency in extreme-high-temperature indices throughout the whole area.

3.3. Correlations between the NDVI and Extreme-High-Temperature Indices

3.3.1. Temporal Correlations between the NDVI and Extreme-High-Temperature Indices

The correlation analyses in Table 6 show that TM is significantly and positively correlated with the NDVI before and after detrending, with higher significance after detrending (p < 0.01).
Before detrending, TN90 shows a significant positive (p < 0.05) correlation with the NDVI, with a correlation coefficient of 0.506, while the correlations of the other extreme-high-temperature indices are not significant. Specifically, TXX, TNX and TXN are positively correlated with the NDVI, and TX90 and TN90 are also positively correlated with the NDVI. Conversely, TNN is negatively correlated with the NDVI.
After detrending, except for TN90, all extreme-high-temperature indices (TXX, TXN, TNX, TNN, TX90) show negative correlations with the NDVI, among which the correlations for TXX, TNX and TX90 are significant (p < 0.05). It is different from the positive correlations before detrending. TN90 is significantly correlated with the NDVI before detrending, but not significant after detrending. Almost all high-temperature indices are negatively correlated with the NDVI, indicating that vegetation in North China is negatively affected by extreme high temperatures.
The annual correlation distributions for each vegetation type show general comparability in terms of all vegetation types for most indices, although some differences are observed (Table 7). Specifically, in forest areas, the extreme-high-temperature indices are nonsignificantly correlated before and after detrending. It is indicated that extreme high temperatures have less impact on vegetation in the forest areas. The forest areas are less vulnerable to high temperatures than cropland and grassland areas and can better cope with extreme-high-temperature events.
In contrast, the extreme-high-temperature indices in grassland areas are negatively correlated before and after detrending, with correlation coefficients much lower than those of the regional average, indicating that grassland vegetation is sensitive to high temperatures and more affected by high-temperature events. Moreover, it is worth noting that TX90 in grassland regions shows significant negative correlations both before and after detrending, with correlation coefficients much higher than those of the other vegetation types. This result indicates that the increase in the number of hot days has a significant negative impact on grassland vegetation. In cropland areas, the responses of the NDVI to extreme high temperatures are inconsistent, but they are significantly negatively correlated with the detrended TXX. The correlations with the other detrended indices are not strong.
The monthly correlations are calculated in Figure 7. Before detrending, TM is positively correlated with the NDVI in all months except for December and June. The distributions of the extreme-high-temperature indices are similar to those of TM. With respect to January–May, the TXX, TXN, TNN and TNX indices are positively correlated with the NDVI, especially in March, April and May. However, from June to December, the correlations are not significant, and TXX, TXN and TNN show negative correlations. The correlation distributions for TX90 and TN90 are similar, with negative correlations in June, September and October and positive correlations in other months.
After detrending, the distribution characteristics of all high-temperature indices are similar. Similar to the distribution before detrending, the correlations with the NDVI are positive for January–May and October, with a large correlation coefficient in March. However, from June to September, all high-temperature indices are generally negatively correlated with the NDVI, with a large correlation coefficient in June, indicating that high temperatures have a negative impact on plant growth during the growing season in North China. Nevertheless, during other colder months, the increase in temperature can facilitate vegetation growth to a certain extent.

3.3.2. Spatial Correlations between the NDVI and Extreme-High-Temperature Indices

Figure 8 and Figure 9 illustrate the coexistence of positive and negative correlations between the extreme-high-temperature indices and the NDVI across spatial regions, indicating spatial heterogeneity in vegetation responses to extreme-high-temperature events. The results reveal that the majority of the correlations between TM and NDVI in North China are positive before detrending, whereas the majority turn to negative correlations after detrending. The negatively correlated region before detrending is distributed in the central grassland and northeastern forest of North China, while those in the southern Beijing–Tianjin–Hebei Plain show a significant positive correlation. However, after detrending, the regions with negative correlations are distributed in most of the central and western regions.
The negative correlations between the extreme-high-temperature indices and the NDVI are more widespread before and after detrending, but they are not significant. For example, TXX has negative correlations with the NDVI for 9.4% and 27.8% of pixels before and after detrending, respectively, and 11.1% and 28.38% of pixels show negative correlations between TX90 and the NDVI before and after detrending, respectively. The results before and after detrending jointly indicate that extreme high temperatures have caused widespread damage to the vegetation in North China, affecting vegetation growth. However, in comparison, TN90 is positively correlated with the NDVI for 74.4% of pixels before detrending, indicating that warm nights can alleviate frost damage in some areas and promote vegetation growth to some extent.
The regions with negative correlations between the extreme temperature indices and the NDVI are similar to the distributions of TM, mainly in the central grassland area. This is consistent with the results of the regional average correlation analysis mentioned above. It is noteworthy that in the spatial distribution patterns, the correlation coefficients of TXX and TX90 with the NDVI are mostly positive in the northeastern forest area. However, the results are different for other temperature indices.

3.4. Ridge Regressions between the NDVI and Extreme-High-Temperature Indices

The ridge regression fitted model in Table 8 has a high and significant correlation with the original data (p < 0.01), indicating that the results are credible. The regression coefficients of TM in all regions before and after detrending are all positive, which is consistent with the results of the correlation analysis. Only TXX shows a negative regression coefficient with the NDVI in the cropland areas, and the coefficient is not large in North China. However, the coefficients of TXX are up to 0.971 and 0.955 before and after detrending in the forest areas. The regression coefficients of TXN and TNX are negative in almost all areas. The regression coefficients of TNN are basically positive in all areas, but they are negative in the forest areas.
The regression coefficients of TX90 are negative, while those of TN90 are positive for all vegetation types. The absolute values of the regression coefficients are large, especially in the grassland areas, reaching −1.065 (TX90) and 0.787 (TN90). The absolute values of the regression coefficients are also large in North China as a whole and in the forest areas, with values of −0.848 (North China) and −0.806 (forest areas) for TX90, and values of 0.676 (North China) and 0.571 (forest areas) for TN90. This result indicates that an increase in TX90 can cause certain negative effects for all vegetation types, while an increase in TN90 has a positive impact on vegetation.

4. Discussion

4.1. Variations in the NDVI

This study finds that the regional average NDVI in North China gradually increases from 1982 to 2015, at a rate of 0.0004 year−1. Previous studies have investigated the trends in NDVI variations in northern China from 2000 to 2016 and the agro-pastoral transitional zone of northern China from 1986 to 2015 [35,65]. The results all indicated an increasing trend in the NDVI in North China, with a more obvious increase in the east and a less obvious increase in the west. Therefore, the findings in this paper are consistent with previous findings.
The trend chart of the NDVI shows that the NDVI drops after 1990 and 1998, with large fluctuations in the average NDVI in North China before 2000, followed by a gradual increase after 2000. It is speculated that this phenomenon is related to a series of ecological restoration projects implemented in the study area around 2000 [37,66], such as the Grain for Green Program, the Natural Forest Conservation Program and the Sand Control Programs. These projects have achieved influential results, restored damaged ecological environments and largely increased the vegetation coverage in North China [67].
Based on the comparison of the NDVI trends and spatial distribution maps among different vegetation types, it is found that the forest areas have the highest average vegetation cover throughout the year. This result is correlated with the forest area in the northeast Greater Khingan Mountains, which is mainly composed of evergreen coniferous forest and maintains a relatively high coverage level even during non-growing seasons. The NDVI increase rate in North China is slower than the rate at the national scale (0.0006 year−1) [68], but the NDVI growth rate in the cropland areas exceeds the national level. Among the three vegetation types studied in this paper, the farmland type shows the fastest NDVI growth rate (0.0008 year−1), which could be attributed to economic development and population growth in North China [69], leading to more cultivated farmland areas and higher vegetation cover.
The most widely distributed vegetation type in North China is grassland, but its vegetation coverage is consistently low, and the growth rate is also slow (0.0003 year−1). Some grassland areas even show decreasing trends in the NDVI according to the spatial trend maps (Figure 4). Similar studies [36] found that desertification and land expansion are the main causes of significant degradation of the grassland NDVI in Inner Mongolia. The results of this study also show that, among the three vegetation types in North China, grassland is the most vulnerable to extreme-high-temperature factors, which collectively affect the development of grassland ecosystems.
The trend analyses of the NDVI for different months indicate that monthly NDVI variation trends are heterogeneous. Cold months, such as January and December, show decreasing trends in the NDVI (Table 3). This finding of seasonal NDVI variation unevenness has also been frequently observed in previous studies [24,70], suggesting that focusing on variations at different time scales is necessary.

4.2. Variations in Extreme-High-Temperature Events

Trend analysis of the time series shows an increasing trend in all extreme-high-temperature indices from 1982–2015, and the spatial distribution pattern confirms that basically all extreme-high-temperature events exhibit increasing trends across the entire region. These trends have also been detected in Inner Mongolia [36], the Mongolian Plateau [33,39] and Southwest China [71]. In addition, in North China, historical long-term average climate change shows a warming and drying trend in the last 30 years [35,65], and the warming rate is much higher than in the Northern Hemisphere [72]. Moreover, in the next three decades, the temperature in this region is more likely to increase at an even higher rate [29,32].
The amplitudes of increase in TXX and TNX are much greater than that of the average temperature, confirming that, compared with the climatic mean state, extreme climate responds more sensitively to climate change [2]. Moreover, in the three vegetation types, all extreme-high-temperature indices show upward trends, especially in grassland areas, which have experienced stronger impacts from climate change.
Similar to the NDVI, heterogeneity is observed in the time trend analyses of different months. The decreasing trends appear in the cold months of December and January, suggesting a relationship between the NDVI variation and extreme-high-temperature indices. However, the extreme-high-temperature indices exhibit the most obvious increasing trend in July, while the most obvious increasing trend of the NDVI appears in October, indicating a certain lag between these trends. The time lag cross-correlation between the NDVI and extreme-high-temperature indices also indicates that the NDVI responds to the extreme temperature indices unequally, with a lag of mostly 2–3 months (Table S1). These findings underscore the significance of conducting research on a monthly scale.

4.3. Impacts of Extreme-High-Temperature Events on the NDVI

The vegetation–climate interactions are complex and highly heterogeneous [19,73]. Understanding the relationship between vegetation and extreme climate can help further protect and restore terrestrial vegetation systems and respond to climate change [
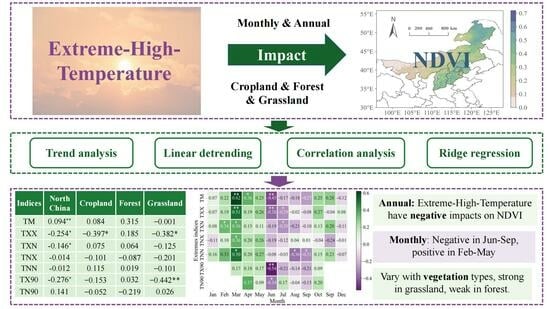
74]. This investigation concludes that from 1982 to 2015, there was a significant negative correlation between the annual NDVI and most of the extreme-high-temperature indices in North China.
Extreme-high-temperature indices that represent the highest (TXX, TNX) and lowest (TXN, TNN) temperatures exhibit differences. Notably, TXX shows a significantly negative correlation with the NDVI, with a correlation coefficient of −0.254. The negative correlations of TXN and TNN with the NDVI are not significant (Table 6). Since photosynthesis in most plants occurs during the daytime and pauses at night, the temperature during the day has a greater impact on carbon fixation and energy capture in plants than the nighttime temperature, thereby exerting a stronger influence on greening [21,75]. TN90 exhibits a positive correlation, while TX90 exhibits a significant negative correlation with the NDVI. This can be attributed to the fact that the increasing TX90 improves the average temperature at night and reduces the risk of frost for specific plant species [43,76].
The finding of negative correlations between the NDVI and most extreme-high-temperature events is consistent with the conclusions of several studies. According to Wei [77], high-temperature extremes have adverse effects on vegetation growth in some arid areas of Central Asia and the Mongolian Plateau, which are mostly covered by sparse vegetation and grasses. Similarly, heatwaves significantly reduce the rate of vegetation growth on the Tibetan Plateau [78]. However, the correlations between the NDVI and extreme-high-temperature events in some regions, such as Guangdong Province [70], the Yangtze River Basin [49] and Southwest China [71], differ from this negative correlation. The vegetation dynamics display strong and positive correlations with the temperature extremes in most months in Guangdong [70], while the NDVI is closely correlated with temperature extremes in the Yangtze River Basin [49], and the sum of the relative contribution proportions of the extreme temperature indices to ecosystem metrics is largest in Southwest China [71]. In these regions, the increase in extreme high temperatures can stimulate vegetation growth.
These results highlight the regional differences in the impacts of extreme high temperatures. A widely accepted viewpoint is that, within a specific temperature range, a temperature increase can intensify soil microbial activity, hasten the rate of photosynthesis in vegetation, extend the growing season, facilitate the accrual of plant organic material and, thus, help ameliorate the NDVI [24,35,79,80]. However, when ambient temperature exceeds the optimal photosynthetic temperature, vegetation growth can be inhibited; i.e., high temperatures can induce evaporation and decrease soil moisture, which can exacerbate soil drought conditions [24,72]. Heatwaves affect vegetation by combining temperature stress and water scarcity. Therefore, sufficient precipitation can mitigate the impacts of extreme high temperatures [14,24,70]. Some regions, such as Guangdong Province and Southwest China, have abundant precipitation that reduces the stress of high temperatures [70,71], whereas many regions in North China are characterized by limited precipitation and are more susceptible to the negative effects of high-temperature stress when temperatures exceed the optimal photosynthetic temperature [19,36,68].
For different vegetation types, the responses of the NDVI to extreme high temperatures are different, and this could be attributed to the differences in the adaptability of vegetation types within North China. This difference in vegetation can be observed from the spatial distributions and temporal analyses. Spatial heterogeneity is noted in the correlations between the NDVI and extreme-high-temperature indices, as well as TM. Positive correlations between extreme high temperatures and the NDVI are observed in the northeastern and southeastern regions of the study area, while significant negative correlations are observed in certain areas in the central region. The central region, mainly composed of temperate grassland [36], with a relatively simple ecosystem structure and limited self-regulation ability, is subject to the negative impacts of rising temperatures. Such impacts include increased evaporation rates, soil water loss and intensified drought, which, in turn, lead to an inhibition of normal plant activity and vegetation growth [11]. In contrast, the northeastern region contains coniferous and broad-leaved forests with abundant water resources [13], where the conservative water use of forests helps mitigate the impacts of extreme heat events. The increase in the maximum temperature in high-latitude forest areas extends the growing season of plants and enhances photosynthesis, resulting in the promotion of vegetation growth [27,81].
Conversely, the southeastern region is characterized by croplands that are affected by farm management, irrigation as well as the use of pesticides and fertilizers [82,83]. Such agricultural practices prevent the growth of cultivated vegetation from being influenced by climatic fluctuations [65,84,85].
Simultaneously, temporal analyses of different vegetation types also show that coefficients for grasslands are always the highest and negative, indicating higher sensitivity to high temperatures. In contrast, the coefficients of forests and croplands are generally lower, implying better adaptability to high temperatures. In the context of a warming climate, arid regions are expected to experience increased aridity due to heightened soil moisture evaporation caused by high-temperature extremes [86]. This phenomenon is expected to limit the physiological activities of vegetation, with semi-arid grassland ecosystems in North China being more sensitive to such changes than forest ecosystems [35].
The analyses conducted on a monthly scale indicate that vegetation responses to extreme high temperatures exhibit significant temporal heterogeneity across different months. Specifically, the NDVI exhibits negative correlations with all high-temperature indices in summer, i.e., June, July, August and September, while positive correlations are noted from February to May. Notably, the negative correlation is highest in June and the positive correlation is highest in March. High temperatures in spring provide optimal growing conditions, while extreme high temperatures in summer may exceed the ideal range, leading to increased evaporation and reduced soil moisture levels. This phenomenon, observed on a monthly scale, highlights that extreme temperatures may restrict vegetation growth during summer months while promoting it from February to May. This may not be discerned on annual and seasonal scales. Therefore, a holistic understanding of how vegetation responds to climate extremes during different growing periods is essential for the effective management of these ecosystems.
In addition, the correlations between the NDVI and certain extreme-high-temperature indices are not significantly positive before detrending, while significant negative correlations are observed after detrending, which confirms the importance of detrending in this study. The extreme-high-temperature series and the NDVI series have a similar long-term increasing linear trend, and a direct correlation reflects the positive correlation between the two trends. After linear detrending, the short-term correlation is negative, indicating opposite variations on an annual scale. The linear detrending decouples the sequence of NDVI and climate factors from the long-term effects of changes, removes the trends in correlation analysis and makes the analysis results more realistic and reliable [56].
This study provides valuable insights into potential prevention measures aimed at safeguarding the North China ecosystem, which can aid government managers in taking effective action to protect local ecosystems and minimize the eco-economic losses caused by climate extremes. Moreover, given the anticipated long-term warming trend and its associated proliferation of heatwaves that adversely influence vegetation [29,32,87], local authorities are advised to proactively implement adaptive mitigation strategies to prevent the potential negative effects of extreme high temperatures during summer months, particularly in June. Furthermore, our findings further underscore the vulnerability of semi-arid and arid grassland ecosystems to extreme high temperatures. In order to mitigate these effects, the timely introduction of high-heat-tolerant and drought-resistant vegetation species is warranted. Additionally, implementing adequate irrigation practices can help alleviate the adverse impacts of high temperatures on agriculture.

4.4. Limitations and Uncertainties

We note that this study is subject to some limitations and uncertainties. Firstly, although it has been proved that the GIMMS NDVI data can accurately capture extreme vegetation states [49,78] and are reliable for investigating the impacts of extreme climate events on vegetation, there are still some limitations and uncertainties that need to be acknowledged [88]. As the GIMMS NDVI data are indirect remote sensing data, errors may arise in the modeled NDVI due to the fragmented terrain and saturation issues. In particular, high-density vegetation areas may experience the NDVI saturation when the vegetation cover surpasses a certain threshold [89]. Although the maximum value composite method has been utilized to reduce the influence, the uncertainty associated with remote sensing datasets may still affect the results of this study [43,90]. Moreover, the interpolation method also brings uncertainties to the analysis results. Secondly, linear detrending can only remove the linear trend, but cannot deal with the interdecadal fluctuations and nonlinear relationship. In addition, detrending may introduce errors, noise or outliers that can lead to inaccurate fits, and detrending can also lead to loss of some of the signal.
Thirdly, two primary drivers may influence the vegetation growth, namely climate-related factors [55,91], which provide necessary conditions for vegetation growth, and the disturbances caused by human activities, including land use changes, agricultural irrigation, forest development and restoration projects [69,92,93,94]. As the primary objective of this study is to systematically assess the impact characteristics of extreme high temperatures on vegetation in North China, this study does not discuss other climate-related factors and human influences [95]. Hence, in future research, it would be prudent to consider the impacts of other variables on vegetation greenness and to explore the primary driving forces of vegetation dynamics in different climate conditions.
Lastly, the interactions between temperature and vegetation are complex, and this study does not strictly consider the feedback of vegetation to high-temperature extremes. More information is required to understand vegetation–climate interactions in the future. In addition, due to the lags in the adjustment of soil moisture content and biological processes [74,96], vegetation properties take time to respond to environmental change [97]. Therefore, the impact of temperature on vegetation often exhibits a time lag. This study focuses on the synchronous responses of vegetation to climate, without considering subsequent reactions after extreme events. In the future, it is necessary for researchers to comprehensively consider these factors and conduct more detailed analyses.

5. Conclusions

By using the NDVI to capture vegetation activities, this study analyzes the variation characteristics of vegetation and extreme high temperatures from 1982 to 2015 in North China. The trend analysis, linear detrending and correlation analysis are performed, and a ridge regression model is constructed to investigate the impacts of extreme-high-temperature events on vegetation in North China. Multiple vegetation types (forest, grassland and farmland) and multiple time scales (annual and monthly) are considered. The main conclusions are as follows:
(1)
The NDVI in North China shows an overall fluctuating upward trend (0.0004 year−1, p < 0.01). The forest type has the highest NDVI values, and the farmland type has the fastest NDVI increasing trend (0.0008 year−1, p < 0.01) from 1982–2015. On a monthly scale, the fastest greening trends appear in October. Extreme-high-temperature indices in North China show increasing trends on both annual and monthly scales, except for the TXN and TNN. However, these indices exhibit a coexistence of increase and decrease spatially.
(2)
Before detrending, the regionally averaged annual NDVI is positively correlated only with TN90, whereas, after detrending, correlations between the regional average NDVI and all the extreme-high-temperature indices except for TN90 are all significantly negative. On a monthly scale, before detrending, only TNX shows a positive correlation in the months of June to September. After detrending, all indices exhibit negative correlations. Grassland has more significant negative correlations with all high-temperature indices, while forests display nonsignificant positive correlations with the indices. The impacts of temperature extremes on vegetation vary with vegetation types and time scales.
This research highlights the necessity of a multi-time and multi-vegetation scale analysis. The detailed analysis can help better understand the response mechanism of vegetation dynamics to extreme high temperatures and improve the investigation of vegetation–climate interactions.

Supplementary Materials

The following supporting information can be downloaded at: https://www.mdpi.com/article/10.3390/rs15184542/s1, Table S1: Correlation coefficients between the regional mean NDVI and the extreme high temperature indices for different time lags in the North China during 1982–2015.

Author Contributions

Conceptualization, C.J.; Methodology, Q.Y.; Software, Q.Y.; Investigation, Q.Y.; Resources, T.D.; Data curation, Q.Y.; Writing—original draft, Q.Y.; Writing—review & editing, C.J. and T.D.; Visualization, Q.Y.; Supervision, C.J.; Project administration, C.J.; Funding acquisition, C.J. and T.D. All authors have read and agreed to the published version of the manuscript.

Funding

This research was funded by the National Natural Science Foundation of China (Grant No. 42175170, 42175078 and 42175048) and the Training Program of Innovation and Entrepreneurship for Undergraduates (S202210022159).

Data Availability Statement

All the data are available in the public domain at the links provided in the text.

Conflicts of Interest

The authors declare no conflict of interest.

References

  1. Zhai, P.; Liu, J. Extreme weather/climate events and disaster prevention and mitigation under global warming background. Strateg. Study CAE 2012, 14, 55–63. [Google Scholar]
  2. Masson-Delmotte, V.; Zhai, P.; Pirani, A.; Connors, S.L.; Péan, C.; Berger, S.; Caud, N.; Chen, Y.; Goldfarb, L.; Gomis, M. Climate Change 2021: The Physical Science Basis. Contribution of Working Group I to the Sixth Assessment Report of the Intergovernmental Panel on Climate Change. 2021. Available online: https://www.ipcc.ch/report/ar6/wg1/ (accessed on 1 June 2022).
  3. IPCC. Managing the Risks of Extreme Events and Disasters to Advance Climate Change Adaptation: A Special Report of Working Groups I and II of the Intergovernmental Panel on Climate Change; Cambridge University Press: New York, NY, USA; Cambridge, UK, 2012. [Google Scholar]
  4. Hu, Y.; Dong, W.; He, Y. Progress of the Study of Extreme Weather and Climate Events at the Beginning of the Twenty First Century. Adv. Earth Sci. 2007, 22, 153–164. [Google Scholar]
  5. Gampe, D.; Zscheischler, J.; Reichstein, M.; Sullivan, M.O.; Smith, W.K.; Sitch, S.; Buermann, W. Increasing impact of warm droughts on northern ecosystem productivity over recent decades. Nat. Clim. Chang. 2021, 11, 772–779. [Google Scholar] [CrossRef]
  6. Frank, D.; Reichstein, M.; Bahn, M.; Thonicke, K.; Frank, D.; Mahecha, M.D.; Smith, P.; van der Velde, M.; Vicca, S.; Babst, F.; et al. Effects of climate extremes on the terrestrial carbon cycle: Concepts, processes and potential future impacts. Glob. Chang. Biol. 2015, 21, 2861–2880. [Google Scholar] [CrossRef] [PubMed]
  7. Reichstein, M.; Bahn, M.; Ciais, P.; Frank, D.; Mahecha, M.D.; Seneviratne, S.I.; Zscheischler, J.; Beer, C.; Buchmann, N.; Frank, D.C.; et al. Climate extremes and the carbon cycle. Nature 2013, 500, 287–295. [Google Scholar] [CrossRef]
  8. Yuan, M.; Zhu, Q.; Zhang, J.; Liu, J.; Chen, H.; Peng, C.; Li, P.; Li, M.; Wang, M.; Zhao, P. Global response of terrestrial gross primary productivity to climate extremes. Sci. Total Environ. 2021, 750, 142337. [Google Scholar] [CrossRef]
  9. Piao, S.; Zhang, X.; Chen, A.; Qiang, L.; Lian, X.; Wang, X.; Peng, S.; Wu, X. The impacts of climate extremes on the terrestrial carbon cycle: A review. Sci. China Earth Sci. 2019, 49, 1321–1334. [Google Scholar] [CrossRef]
  10. van Daalen, K.R.; Kallesøe, S.S.; Davey, F.; Dada, S.; Jung, L.; Singh, L.; Issa, R.; Emilian, C.A.; Kuhn, I.; Keygnaert, I.; et al. Extreme events and gender-based violence: A mixed-methods systematic review. Lancet Planet. Health 2022, 6, e504–e523. [Google Scholar] [CrossRef]
  11. Zhu, X.; Zhang, S.; Liu, T.; Liu, Y. Impacts of Heat and Drought on Gross Primary Productivity in China. Remote Sens. 2021, 13, 378. [Google Scholar] [CrossRef]
  12. Petra, P.; Walter, O. Radial growth response of coniferous forest trees in an inner Alpine environment to heat-wave in 2003. For. Ecol. Manag. 2007, 242, 688–699. [Google Scholar]
  13. Li, X.; Liu, M.; Hajek, O.L.; Yin, G. Different Temporal Stability and Responses to Droughts between Needleleaf Forests and Broadleaf Forests in North China during 2001–2018. Forests 2021, 12, 1331. [Google Scholar] [CrossRef]
  14. Chang, J.; Liu, Q.; Wang, S.; Huang, C. Vegetation Dynamics and Their Influencing Factors in China from 1998 to 2019. Remote Sens. 2022, 14, 3390. [Google Scholar] [CrossRef]
  15. He, H.; Zhang, B.; Hou, Q.; Li, S.; Ma, B.; Ma, S. Variation Characteristic of NDVI and Its Response to Climate Change in Northern China From 1982 to 2015. J. Ecol. R. Environ. 2020, 36, 70–80. [Google Scholar]
  16. Li, S.; Xu, L.; Jing, Y.; Yin, H.; Li, X.; Guan, X. High-quality vegetation index product generation: A review of NDVI time series reconstruction techniques. Int. J. Appl. Earth Obs. 2021, 105, 102640. [Google Scholar] [CrossRef]
  17. Mathieu, D.; Roberto, O.C.; Katarina, Č.; Sergio, A.E.; Jan, G.P.W.C.; Peter, P.; Jožica, G.; Zalika, Č.; Maks, M.; Martin, D.L.; et al. Spatio-temporal assessment of beech growth in relation to climate extremes in Slovenia—An integrated approach using remote sensing and tree-ring data. Agric. For. Meteorol. 2020, 287, 107925. [Google Scholar]
  18. Zhu, Z.; Bi, J.; Pan, Y.; Ganguly, S.; Anav, A.; Xu, L.; Samanta, A.; Piao, S.; Nemani, R.; Myneni, R. Global Data Sets of Vegetation Leaf Area Index (LAI)3g and Fraction of Photosynthetically Active Radiation (FPAR)3g Derived from Global Inventory Modeling and Mapping Studies (GIMMS) Normalized Difference Vegetation Index (NDVI3g) for the Period 1981 to 2011. Remote Sens. 2013, 5, 927–948. [Google Scholar]
  19. Li, S.; Wei, F.; Wang, Z.; Shen, J.; Liang, Z.; Wang, H.; Li, S. Spatial Heterogeneity and Complexity of the Impact of Extreme Climate on Vegetation in China. Sustainability 2021, 13, 5748. [Google Scholar] [CrossRef]
  20. Lin, Z.; Aiguo, D.; Bo, D. Changes in global vegetation activity and its driving factors during 1982–2013. Agric. For. Meteorol. 2018, 249, 198–209. [Google Scholar]
  21. Piao, S.; Tan, J.; Chen, A.; Fu, Y.H.; Ciais, P.; Liu, Q.; Janssens, I.A.; Vicca, S.; Zeng, Z.; Jeong, S.; et al. Leaf onset in the northern hemisphere triggered by daytime temperature. Nat. Commun. 2015, 6, 6911. [Google Scholar] [CrossRef]
  22. Wang, S.; Liu, Q.; Huang, C. Vegetation Change and Its Response to Climate Extremes in the Arid Region of Northwest China. Remote Sens. 2021, 13, 1230. [Google Scholar] [CrossRef]
  23. Wang, X.; Hou, X. Variation of Normalized Difference Vegetation Index and its response to extreme climate in coastal China during 1982–2014. Geogr. Res. 2019, 38, 807–821. [Google Scholar]
  24. Wang, L.; Hu, F.; Miao, Y.; Zhang, C.; Zhang, L.; Luo, M. Changes in Vegetation Dynamics and Relations with Extreme Climate on Multiple Time Scales in Guangxi, China. Remote Sens. 2022, 14, 2013. [Google Scholar] [CrossRef]
  25. Christian, B.; Markus, R.; Enrico, T.; Philippe, C.; Martin, J.; Nuno, C.; Christian, R.; Arain, M.A.; Dennis, B.; Gordon, B.B.; et al. Terrestrial Gross Carbon Dioxide Uptake: Global Distribution and Covariation with Climate. Science 2010, 329, 834–838. [Google Scholar]
  26. Wang, M.; Wang, S.; Wang, J.; Yan, H.; Mickler, R.A.; Shi, H.; He, H.; Huang, M.; Zhou, L. Detection of Positive Gross Primary Production Extremes in Terrestrial Ecosystems of China During 1982–2015 and Analysis of Climate Contribution. J. Geophys. Res. Biogeosci. 2018, 123, 2807–2823. [Google Scholar] [CrossRef]
  27. Adriaan, J.T.; Sonia, I.S.; Reto, S.; Markus, R.; Eddy, M.; Philippe, C.; Sebastiaan, L.; Bart, V.D.H.; Christof, A.; Christian, B.; et al. Contrasting response of European forest and grassland energy exchange to heatwaves. Nat. Geosci. 2010, 3, 722–727. [Google Scholar]
  28. Li, J.; Lei, H. Impacts of climate change on winter wheat and summer maize dual-cropping system in the North China Plain. Environ. Res. Commun. 2022, 4, 75014. [Google Scholar] [CrossRef]
  29. Kang, S.; Eltahir, E.A.B. North China Plain threatened by deadly heatwaves due to climate change and irrigation. Nat. Commun. 2018, 9, 2894. [Google Scholar] [CrossRef]
  30. He, D.; Meng, Q.; Yang, C.; Wu, J.; Hu, Q. Spatial and temporal distribution of extreme drought in North China Area. Technol. Wind 2021, 25, 121–123. [Google Scholar]
  31. Ji, W.; Da-kai, J.; Ying-juan, Z. Analysis on Spatial and Temporal Variation of Extreme Climate Events in North China. Chin. J. Agrometeorol. 2012, 33, 166–173. [Google Scholar]
  32. Wang, H.; Wang, L.; Yan, G.; Bai, H.; Zhao, Y.; Ju, M.; Xu, X.; Yan, J.; Xiao, D.; Chen, L. Assessment and Prediction of Extreme Temperature Indices in the North China Plain by CMIP6 Climate Model. Appl. Sci. 2022, 12, 7201. [Google Scholar] [CrossRef]
  33. Ren, J.; Tong, S.; Ying, H.; Mei, L.; Bao, Y. Historical and Future Changes in Extreme Climate Events and Their Effects on Vegetation on the Mongolian Plateau. Remote Sens. 2022, 14, 4642. [Google Scholar] [CrossRef]
  34. Duo, A.; Zhao, W.; Gong, Z.; Zhang, M.; Fan, Y. Temporal analysis of climate change and its relationship with vegetation cover on the north China plain from 1981 to 2013. Acta Ecol. Sin. 2017, 37, 576–592. [Google Scholar]
  35. Jiang, H.; Xu, X. Impact of extreme climates on vegetation from multiple scales and perspectives in the Agro-pastural Transitional Zone of Northern China in the past three decades. J. Clean. Prod. 2022, 372, 133459. [Google Scholar] [CrossRef]
  36. Chen, K.; Ge, G.; Bao, G.; Bai, L.; Tong, S.; Bao, Y.; Chao, L. Impact of Extreme Climate on the NDVI of Different Steppe Areas in Inner Mongolia, China. Remote Sens. 2022, 14, 1530. [Google Scholar] [CrossRef]
  37. You, G.; Liu, B.; Zou, C.; Li, H.; McKenzie, S.; He, Y.; Gao, J.; Jia, X.; Altaf Arain, M.; Wang, S.; et al. Sensitivity of vegetation dynamics to climate variability in a forest-steppe transition ecozone, north-eastern Inner Mongolia, China. Ecol. Indic. 2021, 120, 106833. [Google Scholar] [CrossRef]
  38. Wei, Z.; Zhongmin, H.; Qun, G.; Genan, W.; Ruru, C.; Shenggong, L. Contributions of Climatic Factors to Interannual Variability of the Vegetation Index in Northern China Grasslands. J. Clim. 2020, 33, 175–183. [Google Scholar]
  39. Li, C.; Wang, J.; Hu, R.; Yin, S.; Bao, Y.; Ayal, D.Y. Relationship between vegetation change and extreme climate indices on the Inner Mongolia Plateau, China, from 1982 to 2013. Ecol. Indic. 2018, 89, 101–109. [Google Scholar] [CrossRef]
  40. Sun, Y.; Yang, Y.; Zhang, L.; Wang, Z. The relative roles of climate variations and human activities in vegetation change in North China. Phys. Chem. Earth 2015, 87–88, 67–78. [Google Scholar] [CrossRef]
  41. Yang, L.; Feng, Q.; Adamowski, J.F.; Alizadeh, M.R.; Yin, Z.; Wen, X.; Zhu, M. The role of climate change and vegetation greening on the variation of terrestrial evapotranspiration in northwest China’s Qilian Mountains. Sci. Total Environ. 2020, 759, 143532. [Google Scholar] [CrossRef]
  42. Barichivich, J.; Briffa, K.R.; Myneni, R.B.; Osborn, T.J.; Melvin, T.M.; Ciais, P.; Piao, S.; Tucker, C. Large-scale variations in the vegetation growing season and annual cycle of atmospheric CO2 at high northern latitudes from 1950 to 2011. Glob. Chang. Biol. 2013, 19, 3167–3183. [Google Scholar] [CrossRef]
  43. He, L.; Guo, J.; Yang, W.; Jiang, Q.; Chen, L.; Tang, K. Multifaceted responses of vegetation to average and extreme climate change over global drylands. Sci. Total Environ. 2022, 858, 159942. [Google Scholar] [CrossRef] [PubMed]
  44. Brent, N.H. Characteristics of maximum-value composite images from temporal AVHRR data. Int. J. Remote Sens. 1986, 7, 1417–1434. [Google Scholar]
  45. Long, X.; Li, J.; Liu, Q. Review on VI Compositing Algorithrm. Remote Sens. Technol. Appl. 2013, 28, 969–977. [Google Scholar]
  46. Wu, J.; Gao, X. A gridded daily observation dataset over China region and comparison with the other datasets. Chin. J. Geophys. 2013, 56, 1102–1111. [Google Scholar]
  47. Jia, W.; Xuejie, G.; Filippo, G.; Deliang, C. Changes of effective temperature and cold/hot days in late decades over China based on a high resolution gridded observation dataset. Int. J. Climatol. 2017, 37, 788–800. [Google Scholar]
  48. Ni, M.; Zhang, X.; Jiang, C.; Wang, H. Responses of vegetation to extreme climate events in southwestern China. Chin. J. Plant Ecol. 2021, 45, 626–640. [Google Scholar] [CrossRef]
  49. Cui, L.; Wang, L.; Qu, S.; Singh, R.P.; Lai, Z.; Yao, R. Spatiotemporal extremes of temperature and precipitation during 1960–2015 in the Yangtze River Basin (China) and impacts on vegetation dynamics. Theor. Appl. Climatol. 2019, 136, 675–692. [Google Scholar] [CrossRef]
  50. Kuang, W.; Zhang, S.; Du, G.; Yan, C.; Wu, S.; Li, R.; Lu, D.; Pan, T.; Ning, J.; Guo, C.; et al. Remotely sensed mapping and analysis of spatio-tempora patterns of land use change across China in 2015–2020. Acta Geogr. Sin. 2022, 77, 1056–1071. [Google Scholar]
  51. Liu, J.; Kuang, W.; Zhang, Z.; Xu, X.; Qin, Y.; Ning, J.; Zhou, W.; Zhang, S.; Li, R.; Yan, C.; et al. Spatiotemporal characteristics, patterns, and causes of land-use changes in China since the late 1980s. J. Geogr. Sci. 2014, 24, 195–210. [Google Scholar] [CrossRef]
  52. Liu, Y.; Zhang, Z.; Tong, L.; Khalifa, M.; Wang, Q.; Gang, C.; Wang, Z.; Li, J.; Sun, Z. Assessing the effects of climate variation and human activities on grassland degradation and restoration across the globe. Ecol. Indic. 2019, 106, 105504. [Google Scholar] [CrossRef]
  53. Li, C.; Zhou, M.; Wang, Y.; Zhu, T.; Sun, H.; Yin, H.; Cao, H.; Han, H. Inter-annual variation of vegetation net primary productivity and the contribution of spatial-temporal and climate factors in arid Northwest China: A case study of Hexi Corridor. Chin. J. Ecol. 2020, 39, 3265–3275. [Google Scholar]
  54. Xu, L.; Myneni, R.; Chapin, F.S., III; Callaghan, T.V.; Pinzon, J.E.; Tucker, C.J.; Zhu, Z.; Bi, J.; Ciais, P.; Tømmervik, H.; et al. Temperature and vegetation seasonality diminishment over northern lands. Nat. Clim. Chang. 2013, 3, 581–586. [Google Scholar] [CrossRef]
  55. Piao, S.; Yin, G.; Tan, J.; Cheng, L.; Huang, M.; Li, Y.; Liu, R.; Mao, J.; Myneni, R.B.; Peng, S.; et al. Detection and attribution of vegetation greening trend in China over the last 30 years. Glob. Chang. Biol. 2015, 21, 1601–1609. [Google Scholar] [CrossRef] [PubMed]
  56. Gil, M.; Moon, Y.; Kim, B. Linear Detrending Subsequence Matching in Time-Series Databases. IEICE Trans. Inf. Syst. 2011, E94-D, 917–920. [Google Scholar] [CrossRef]
  57. Lu, J.; Carbone, G.J.; Gao, P. Detrending crop yield data for spatial visualization of drought impacts in the United States, 1895–2014. Agric. For. Meteorol. 2017, 237–238, 196–208. [Google Scholar] [CrossRef]
  58. Iler, A.M.; Inouye, D.W.; Schmidt, N.M.; Høye, T.T. Detrending phenological time series improves climate-phenology analyses and reveals evidence of plasticity. Ecology 2017, 98, 647–655. [Google Scholar] [CrossRef]
  59. Rajan, M.P. An Efficient Ridge Regression Algorithm with Parameter Estimation for Data Analysis in Machine Learning. SN Comput. Sci. 2022, 3, 171. [Google Scholar] [CrossRef]
  60. Zhu, G.; Wang, X.; Xiao, J.; Zhang, K.; Wang, Y.; He, H.; Li, W.; Chen, H. Daytime and nighttime warming has no opposite effects on vegetation phenology and productivity in the northern hemisphere. Sci. Total Environ. 2022, 822, 153386. [Google Scholar] [CrossRef]
  61. Walker, E.; Birch, J.B. Influence Measures in Ridge Regression. Technometrics 1988, 30, 221–227. [Google Scholar] [CrossRef]
  62. Jeong, D.; St-Hilaire, A.; Ouarda, T.; Gachon, P. Comparison of transfer functions in statistical downscaling models for daily temperature and precipitation over Canada. Stoch. Environ. Res. Risk Assess. 2012, 26, 633–653. [Google Scholar] [CrossRef]
  63. Arthur, E.H.; Robert, W.K. Ridge Regression: Biased Estimation for Nonorthogonal Problems. Technometrics 2012, 12, 55–67. [Google Scholar]
  64. Varma, S.; Simon, R. Bias in error estimation when using cross-validation for model selection. BMC Bioinform. 2006, 7, 91. [Google Scholar] [CrossRef] [PubMed]
  65. Ma, M.; Wang, Q.; Liu, R.; Zhao, Y.; Zhang, D. Effects of climate change and human activities on vegetation coverage change in northern China considering extreme climate and time-lag and -accumulation effects. Sci. Total Environ. 2022, 860, 160527. [Google Scholar] [CrossRef] [PubMed]
  66. Aldieri, L.; Carlucci, F.; Paolo Vinci, C.; Yigitcanlar, T. Environmental innovation, knowledge spillovers and policy implications: A systematic review of the economic effects literature. J. Clean. Prod. 2019, 239, 118051. [Google Scholar] [CrossRef]
  67. Zhang, Y.; Wang, Q.; Wang, Z.; Yang, Y.; Li, J. Impact of human activities and climate change on the grassland dynamics under different regime policies in the Mongolian Plateau. Sci. Total Environ. 2020, 698, 134304. [Google Scholar] [CrossRef]
  68. Liu, Y.; Lei, H. Responses of Natural Vegetation Dynamics to Climate Drivers in China from 1982 to 2011. Remote Sens. 2015, 7, 10243–10268. [Google Scholar] [CrossRef]
  69. Cao, W.; Wu, D.; Huang, L.; Pan, M.; Huhe, T. Determinizing the contributions of human activities and climate change on greening in the Beijing–Tianjin–Hebei Region, China. Sci. Rep.-UK 2021, 11, 21201. [Google Scholar] [CrossRef]
  70. Wang, L.; Hu, F.; Zhang, C.; Miao, Y.; Chen, H.; Zhong, K.; Luo, M. Response of Vegetation to Different Climate Extremes on a Monthly Scale in Guangdong, China. Remote Sens. 2022, 14, 5369. [Google Scholar] [CrossRef]
  71. Shao, H.; Zhang, Y.; Gu, F.; Shi, C.; Miao, N.; Liu, S. Impacts of climate extremes on ecosystem metrics in southwest China. Sci. Total Environ. 2021, 776, 145979. [Google Scholar] [CrossRef]
  72. Peng, S.; Piao, S.; Ciais, P.; Myneni, R.B.; Chen, A.; Chevallier, F.; Dolman, A.J.; Janssens, I.A.; Peñuelas, J.; Zhang, G.; et al. Asymmetric effects of daytime and night-time warming on Northern Hemisphere vegetation. Nature 2013, 501, 88–92. [Google Scholar] [CrossRef]
  73. Hua, W.; Chen, H.; Zhou, L.; Xie, Z.; Qin, M.; Li, X.; Ma, H.; Huang, Q.; Sun, S. Observational Quantification of Climatic and Human Influences on Vegetation Greening in China. Remote Sens. 2017, 9, 425. [Google Scholar] [CrossRef]
  74. Mulder, C.P.H.; Iles, D.T.; Rockwell, R.F. Increased variance in temperature and lag effects alter phenological responses to rapid warming in a subarctic plant community. Glob. Chang. Biol. 2017, 23, 801–814. [Google Scholar] [CrossRef] [PubMed]
  75. Piao, S.; Liu, Q.; Chen, A.; Janssens, I.A.; Fu, Y.; Dai, J.; Liu, L.; Lian, X.; Shen, M.; Zhu, X. Plant phenology and global climate change: Current progresses and challenges. Glob. Chang. Biol. 2019, 25, 1922–1940. [Google Scholar] [CrossRef] [PubMed]
  76. Kim, Y.; Kimball, J.S.; Zhang, K.; McDonald, K.C. Satellite detection of increasing Northern Hemisphere non-frozen seasons from 1979 to 2008: Implications for regional vegetation growth. Remote Sens. Environ. 2012, 121, 472–487. [Google Scholar] [CrossRef]
  77. Wei, Y.; Yu, M.; Wei, J.; Zhou, B. Impacts of Extreme Climates on Vegetation at Middle-to-High Latitudes in Asia. Remote Sens. 2023, 15, 1251. [Google Scholar] [CrossRef]
  78. Dong, C.; Wang, X.; Ran, Y.; Nawaz, Z. Heatwaves Significantly Slow the Vegetation Growth Rate on the Tibetan Plateau. Remote Sens. 2022, 14, 2402. [Google Scholar] [CrossRef]
  79. Keyser, A.R.; Kimball, J.S.; Nemani, R.R.; Running, S.W. Simulating the effects of climate change on the carbon balance of North American high-latitude forests. Glob. Chang. Biol. 2000, 6, 185–195. [Google Scholar] [CrossRef]
  80. Xuan, W.; Rao, L. Spatiotemporal dynamics of net primary productivity and its influencing factors in the middle reaches of the Yellow River from 2000 to 2020. Front. Plant Sci. 2023, 14, 1043807. [Google Scholar] [CrossRef]
  81. Guo, Z.; Lou, W.; Sun, C.; He, B. Trend Changes of the Vegetation Activity in Northeastern East Asia and the Connections with Extreme Climate Indices. Remote Sens. 2022, 14, 3151. [Google Scholar] [CrossRef]
  82. Li, X.; Yang, Y.; Poon, J.; Liu, Y.; Liu, H. Anti-drought measures and their effectiveness: A study of farmers’ actions and government support in China. Ecol. Indic. 2018, 87, 285–295. [Google Scholar] [CrossRef]
  83. Fan, X.; Zhu, D.; Sun, X.; Wang, J.; Wang, M.; Wang, S.; Watson, A.E. Impacts of Extreme Temperature and Precipitation on Crops during the Growing Season in South Asia. Remote Sens. 2022, 14, 6093. [Google Scholar] [CrossRef]
  84. Chen, C.; Park, T.; Wang, X.; Piao, S.; Xu, B.; Chaturvedi, R.K.; Fuchs, R.; Brovkin, V.; Ciais, P.; Fensholt, R.; et al. China and India lead in greening of the world through land-use management. Nat. Sustain. 2019, 2, 122–129. [Google Scholar] [CrossRef] [PubMed]
  85. Song, X.; Hansen, M.C.; Stehman, S.V.; Potapov, P.V.; Tyukavina, A.; Vermote, E.F.; Townshend, J.R. Global land change from 1982 to 2016. Nature 2018, 560, 639–643. [Google Scholar] [CrossRef] [PubMed]
  86. Luo, N.; Mao, D.; Wen, B.; Liu, X. Climate Change Affected Vegetation Dynamics in the Northern Xinjiang of China: Evaluation by SPEI and NDVI. Land 2020, 9, 90. [Google Scholar] [CrossRef]
  87. Chen, H.; He, W.; Sun, J.; Chen, L. Increases of extreme heat-humidity days endanger future populations living in China. Environ. Res. Lett. 2022, 17, 64013. [Google Scholar] [CrossRef]
  88. Yves, J.; José, A.S. Comparison of cloud-reconstruction methods for time series of composite NDVI data. Remote Sens. Environ. 2009, 114, 618–625. [Google Scholar]
  89. Steven, T.B.; Julie, C.Z.; Donald, R.Y. Application of hyperspectral vegetation indices to detect variations in high leaf area index temperate shrub thicket canopies. Remote Sens. Environ. 2010, 115, 514–523. [Google Scholar]
  90. Liu, Y.; Li, L.; Chen, X.; Zhang, R.; Yang, J. Temporal-spatial variations and influencing factors of vegetation cover in Xinjiang from 1982 to 2013 based on GIMMS-NDVI3g. Glob. Planet. Chang. 2018, 169, 145–155. [Google Scholar] [CrossRef]
  91. Peteet, D. Sensitivity and rapidity of vegetational response to abrupt climate change. Proc. Natl. Acad. Sci. USA 2000, 97, 1359–1361. [Google Scholar] [CrossRef]
  92. Cai, D.; Ge, Q.; Wang, X.; Liu, B.; Goudie, A.S.; Hu, S. Contributions of ecological programs to vegetation restoration in arid and semiarid China. Environ. Res. Lett. 2020, 15, 114046. [Google Scholar] [CrossRef]
  93. Yao, N.; Huang, C.; Yang, J.; Konijnendijk, V.D.B.C.; Ma, L.; Jia, Z. Combined Effects of Impervious Surface Change and Large-Scale Afforestation on the Surface Urban Heat Island Intensity of Beijing, China Based on Remote Sensing Analysis. Remote Sens. 2020, 12, 3906. [Google Scholar] [CrossRef]
  94. Tang, Y.; Shao, Q.; Liu, J.; Zhang, H.; Yang, F.; Cao, W.; Wu, D.; Gong, G. Did Ecological Restoration Hit Its Mark? Monitoring and Assessing Ecological Changes in the Grain for Green Program Region Using Multi-source Satellite Images. Remote Sens. 2019, 11, 358. [Google Scholar] [CrossRef]
  95. Qu, S.; Wang, L.; Lin, A.; Yu, D.; Yuan, M.; Li, C. Distinguishing the impacts of climate change and anthropogenic factors on vegetation dynamics in the Yangtze River Basin, China. Ecol. Indic. 2020, 108, 105724. [Google Scholar] [CrossRef]
  96. Piao, S.; Mohammat, A.; Fang, J.; Cai, Q.; Feng, J. NDVI-based increase in growth of temperate grasslands and its responses to climate changes in China. Glob. Environ. Chang. 2006, 16, 340–348. [Google Scholar] [CrossRef]
  97. Papagiannopoulou, C.; Miralles, D.G.; Dorigo, W.A.; Verhoest, N.E.C.; Depoorter, M.; Waegeman, W. Vegetation anomalies caused by antecedent precipitation in most of the world. Environ. Res. Lett. 2017, 12, 074016. [Google Scholar] [CrossRef]
Figure 1. Geographic characteristics of North China: (a) location and elevation; (b) annual precipitation; (c) mean temperature; (d) monthly mean normalized difference vegetation index (NDVI), temperature and precipitation; (e) main land cover types in 2020.
Remotesensing 15 04542 g001
Figure 2. The framework for analyzing the impacts of extreme-high-temperature events on vegetation in North China.
Remotesensing 15 04542 g002
Figure 3. (a) Inter-annual variations in the regional average NDVI, (b) inter-annual variations in the regional average NDVI for different vegetation types, and (c) correlations between the monthly NDVI and the annual NDVI in North China from 1982 to 2015. “**” denotes that the value passes the significance test at a significance level of 0.01 (p < 0.01).
Remotesensing 15 04542 g003
Figure 4. (a) Spatial pattern of the annual mean NDVI and (b) spatial pattern of variations in the NDVI in North China from 1982 to 2015. Dots indicate that the values pass the significance test at a significance level of 0.05 (p < 0.05).
Remotesensing 15 04542 g004
Figure 5. Inter-annual variations in the regional average extreme-high-temperature indices of (a) TM, (b) TXX, (c) TXN, (d) TNN, (e) TNX, (f) TX90 and (g) TN90 in North China from 1982 to 2015.
Remotesensing 15 04542 g005
Figure 6. Variations in the spatial patterns of the extreme-high-temperature indices of (a) TM, (b) TXX, (c) TXN, (d) TNN, (e) TNX, (f) TX90 and (g) TN90 in North China from 1982 to 2015. Dots indicate that the values pass the significance test at a significance level of 0.05 (p < 0.05).
Remotesensing 15 04542 g006
Figure 7. Correlations between the NDVI and extreme-high-temperature indices on a monthly scale (a) before and (b) after data detrending in North China from 1982 to 2015. “*” denotes that the value passes the significance test at a significance level of 0.05 (p < 0.05), and “**” denotes that the value passes the significance test at a significance level of 0.01 (p < 0.01).
Remotesensing 15 04542 g007
Figure 8. Spatial patterns of the correlations between the NDVI and extreme-high-temperature indices before data detrending in North China from 1982 to 2015: (a) TM, (b) TXX, (c) TXN, (d) TNN, (e) TNX, (f) TX90 and (g) TN90. Dots indicate that the values pass the significance test at a significance level of 0.05 (p < 0.05).
Remotesensing 15 04542 g008
Figure 9. Spatial patterns of the correlations between the NDVI and the extreme-high-temperature indices after data detrending in North China from 1982 to 2015: (a) TM, (b) TXX, (c) TXN, (d) TNN, (e) TNX, (f) TX90 and (g) TN90. Dots indicate that the values pass the significance test at a significance level of 0.05 (p < 0.05).
Remotesensing 15 04542 g009
Table 1. Datasets used in this study.
DatasetsSourceSpatial Resolution
CN05.1Chinese Academy of Sciences, Climate Change Research Center (https://ccrc.iap.ac.cn/, accessed on 11 April 2022)1/4°
Global Inventory Modeling and Mapping Studies NDVI3gNational Aeronautics and Space Administration (https://www.nasa.gov/nex, accessed on 11 March 2022) 1/12°
China Land Use/CoverResource and Environment Science and Data Center (https://www.resdc.cn/, accessed on 25 October 2022)1 km
Table 2. Definitions of extreme climate indices used in this study.
NameIndexDefinition
Mean TmeanTM (°C)Mean value of daily mean temperature
Max TmaxTXX (°C)Maximum value of daily maximum temperature
Min TmaxTXN (°C)Minimum value of daily maximum temperature
Max TminTNX (°C)Maximum value of daily minimum temperature
Min TminTNN (°C)Minimum value of daily minimum temperature
Warm daysTX90 (d)Number of days with a daily maximum temperature of >90th percentile
Warm nightsTN90 (d)Number of days with a daily minimum temperature of >90th percentile
Table 3. Monthly variation trends in the regional average NDVI for different vegetation types in North China from 1982 to 2015.
MonthNorth ChinaCroplandForestGrassland
January−0.0004 **−0.0003−0.0010 **−0.0005 **
February−0.0001−0.0001−0.0006 *0.0000
March0.00000.0003−0.00040.0000
April0.0008 **0.0013 **0.0013 **0.0005 **
May0.0011 **0.0011 **0.0019 **0.0012 **
June0.00040.00050.00040.0005
July0.0006 *0.0012 **0.00020.0006
August0.0006 **0.0013 **0.00010.0006
September0.0009 **0.0018 **0.0011 *0.0005
October0.0016 **0.0026 **0.0025 **0.0012 **
November0.00000.00020.0001−0.0001
December−0.0006 **−0.0001−0.0013 **−0.0007 **
Note: “*” denotes that the value passes the significance test at a significance level of 0.05 (p < 0.05), and “**” denotes that the value passes the significance test at a significance level of 0.01 (p < 0.01).
Table 4. Inter-annual trends in regional average extreme-high-temperature indices for different vegetation types in North China from 1982 to 2015.
IndexCroplandForestGrassland
TM0.0344 **0.0301 **0.0377 **
TXX0.0469 *0.0709 **0.0605 *
TXN0.00960.00160.0004
TNX0.0498 **0.0457 **0.0592 **
TNN0.03690.02090.0094
TX900.4840 **0.6131 **0.6204 **
TN900.5655 **0.4837 **0.6089 **
Note: “*” denotes that the value passes the significance test at a significance level of 0.05 (p < 0.05), and “**” denotes that the value passes the significance test at a significance level of 0.01 (p < 0.01).
Table 5. Monthly trends in regional average extreme-high-temperature indices in North China from 1982 to 2015.
IndexJanuaryFebruaryMarchAprilMayJuneJulyAugustSeptemberOctoberNovemberDecember
TM0.01610.0480.0668 *0.04120.0330 *0.0459 **0.0513 **0.0374 **0.0422 **0.0320.0267−0.003
TXX0.01010.0988 *0.1272 **0.0846 *0.02240.0565 *0.0618 *0.0453 *0.0564 *0.01430.0226−0.0582
TXN−0.00050.0301−0.0036−0.00770.0440.01080.0476 **0.03380.0110.04880.0122−0.0008
TNX0.01760.06280.1111 **0.0760 **0.0507 **0.0643 **0.0565 **0.0468 **0.02990.03310.0717 **0.012
TNN0.01810.04810.00650.01970.0519 *0.0627 **0.0591 **0.0070.04070.04930.02630.012
TX900000.0093 *0.01780.1404 *0.2107 **0.1651 **0.0302−0.000500
TN9000000.0126 *0.1897 **0.2871 **0.1221 *0.005000
Note: “*” denotes that the value passes the significance test at a significance level of 0.05 (p < 0.05), and “**” denotes that the value passes the significance test at a significance level of 0.01 (p < 0.01).
Table 6. Correlations between the regional average NDVI and extreme-high-temperature indices in North China from 1982–2015 before and after the data detrending.
IndicesCorrelation Coefficients (Before Detrending)Correlation Coefficients
(After Detrending)
TM0.434 *0.094 **
TXX0.104−0.254 *
TXN0.257−0.146 *
TNX0.038−0.014
TNN−0.023−0.012
TX900.185−0.276 *
TN900.506 **0.141
Note: “*” denotes that the value passes the significance test at a significance level of 0.05 (p < 0.05), and “**” denotes that the value passes the significance test at a significance level of 0.01 (p < 0.01).
Table 7. Correlations between the regional average NDVI and extreme-high-temperature indices in North China from 1982–2015 before and after data detrending for different vegetation types.
IndicesCroplandForestGrassland
Before DetrendingAfter DetrendingBefore DetrendingAfter DetrendingBefore DetrendingAfter Detrending
TM0.474 **0.0840.468 **0.3150.242−0.001
TXX0.052−0.397 *0.367 *0.185−0.121−0.382 *
TXN0.0880.0750.0610.064−0.112−0.125
TNX0.384−0.1010.156−0.0870.083−0.201
TNN0.2290.1150.0670.019−0.068−0.101
TX90−0.498 **−0.153−0.0440.032−0.508 **−0.442 **
TN90−0.095−0.052−0.210−0.219−0.0100.026
Note: “*” denotes that the value passes the significance test at a significance level of 0.05 (p < 0.05), and “**” denotes that the value passes the significance test at a significance level of 0.01 (p < 0.01).
Table 8. Simulated impacts of extreme-high-temperature indices on the regional average NDVI in the ridge regression model in North China from 1982–2015 for different vegetation types.
IndicesNorth ChinaCroplandForestGrassland
Before DetrendingAfter DetrendingBefore DetrendingAfter DetrendingBefore DetrendingAfter DetrendingBefore DetrendingAfter Detrending
Intercept−1.49 × 10⁻¹⁵−3.88 × 10⁻¹⁹−1.78 × 10−152.40 × 10−177.13 × 10⁻¹⁷−6.83 × 10⁻¹⁷−7.84 × 10⁻¹⁵−3.36 × 10⁻¹⁸
Correlation0.755 **0.622 **0.690 **0.485 **0.761 **0.695 **0.766 **0.746 **
TM0.3940.1850.330.0710.3820.340.2980.177
TXX0.2260.195−0.238−0.1770.9710.9550.0740.115
TXN−0.185−0.097−0.15−0.0010.5480.639−0.317−0.322
TNX−0.082−0.110.2670.017−0.381−0.370.002−0.022
TNN0.1170.0610.2190.042−0.549−0.6350.1460.135
TX90−0.983−0.848−0.224−0.119−0.845−0.806−1.12−1.065
TN901.0070.6760.3350.0750.7080.5711.0720.787
Note: “**” denotes that the value passes the significance test at a significance level of 0.01 (p < 0.01).
Disclaimer/Publisher’s Note: The statements, opinions and data contained in all publications are solely those of the individual author(s) and contributor(s) and not of MDPI and/or the editor(s). MDPI and/or the editor(s) disclaim responsibility for any injury to people or property resulting from any ideas, methods, instructions or products referred to in the content.

