

Spatiotemporal Information Mining for Emergency Response of Urban Flood Based on Social Media and Remote Sensing Data
 , and
, and 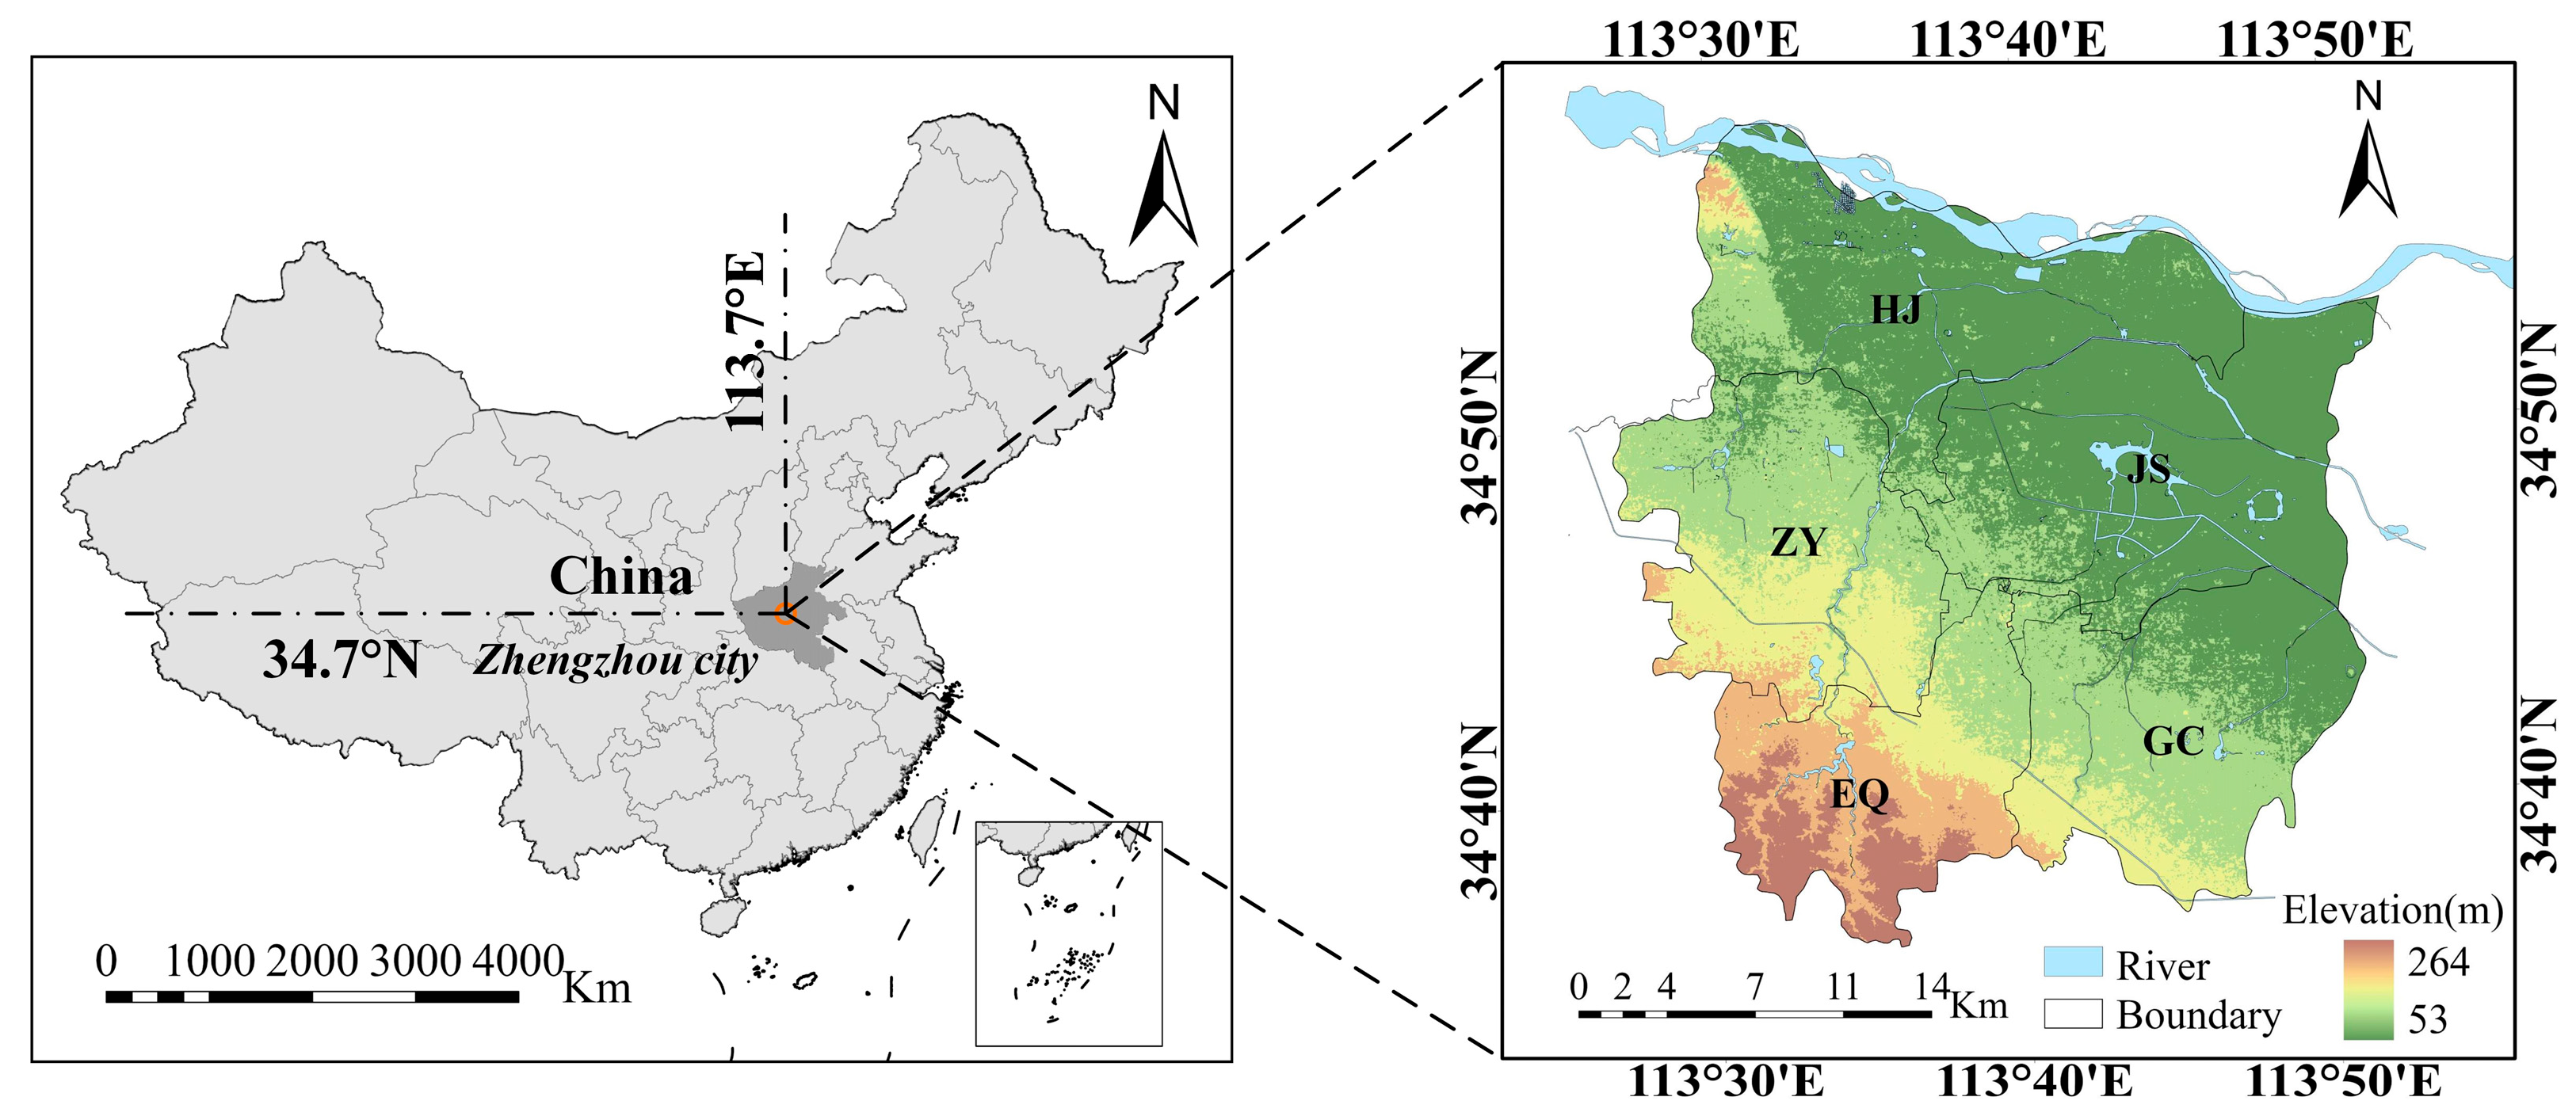
Abstract
:1. Introduction
2. Materials and Methods
2.1. Study Area
2.2. Data Sources and Preprocessing
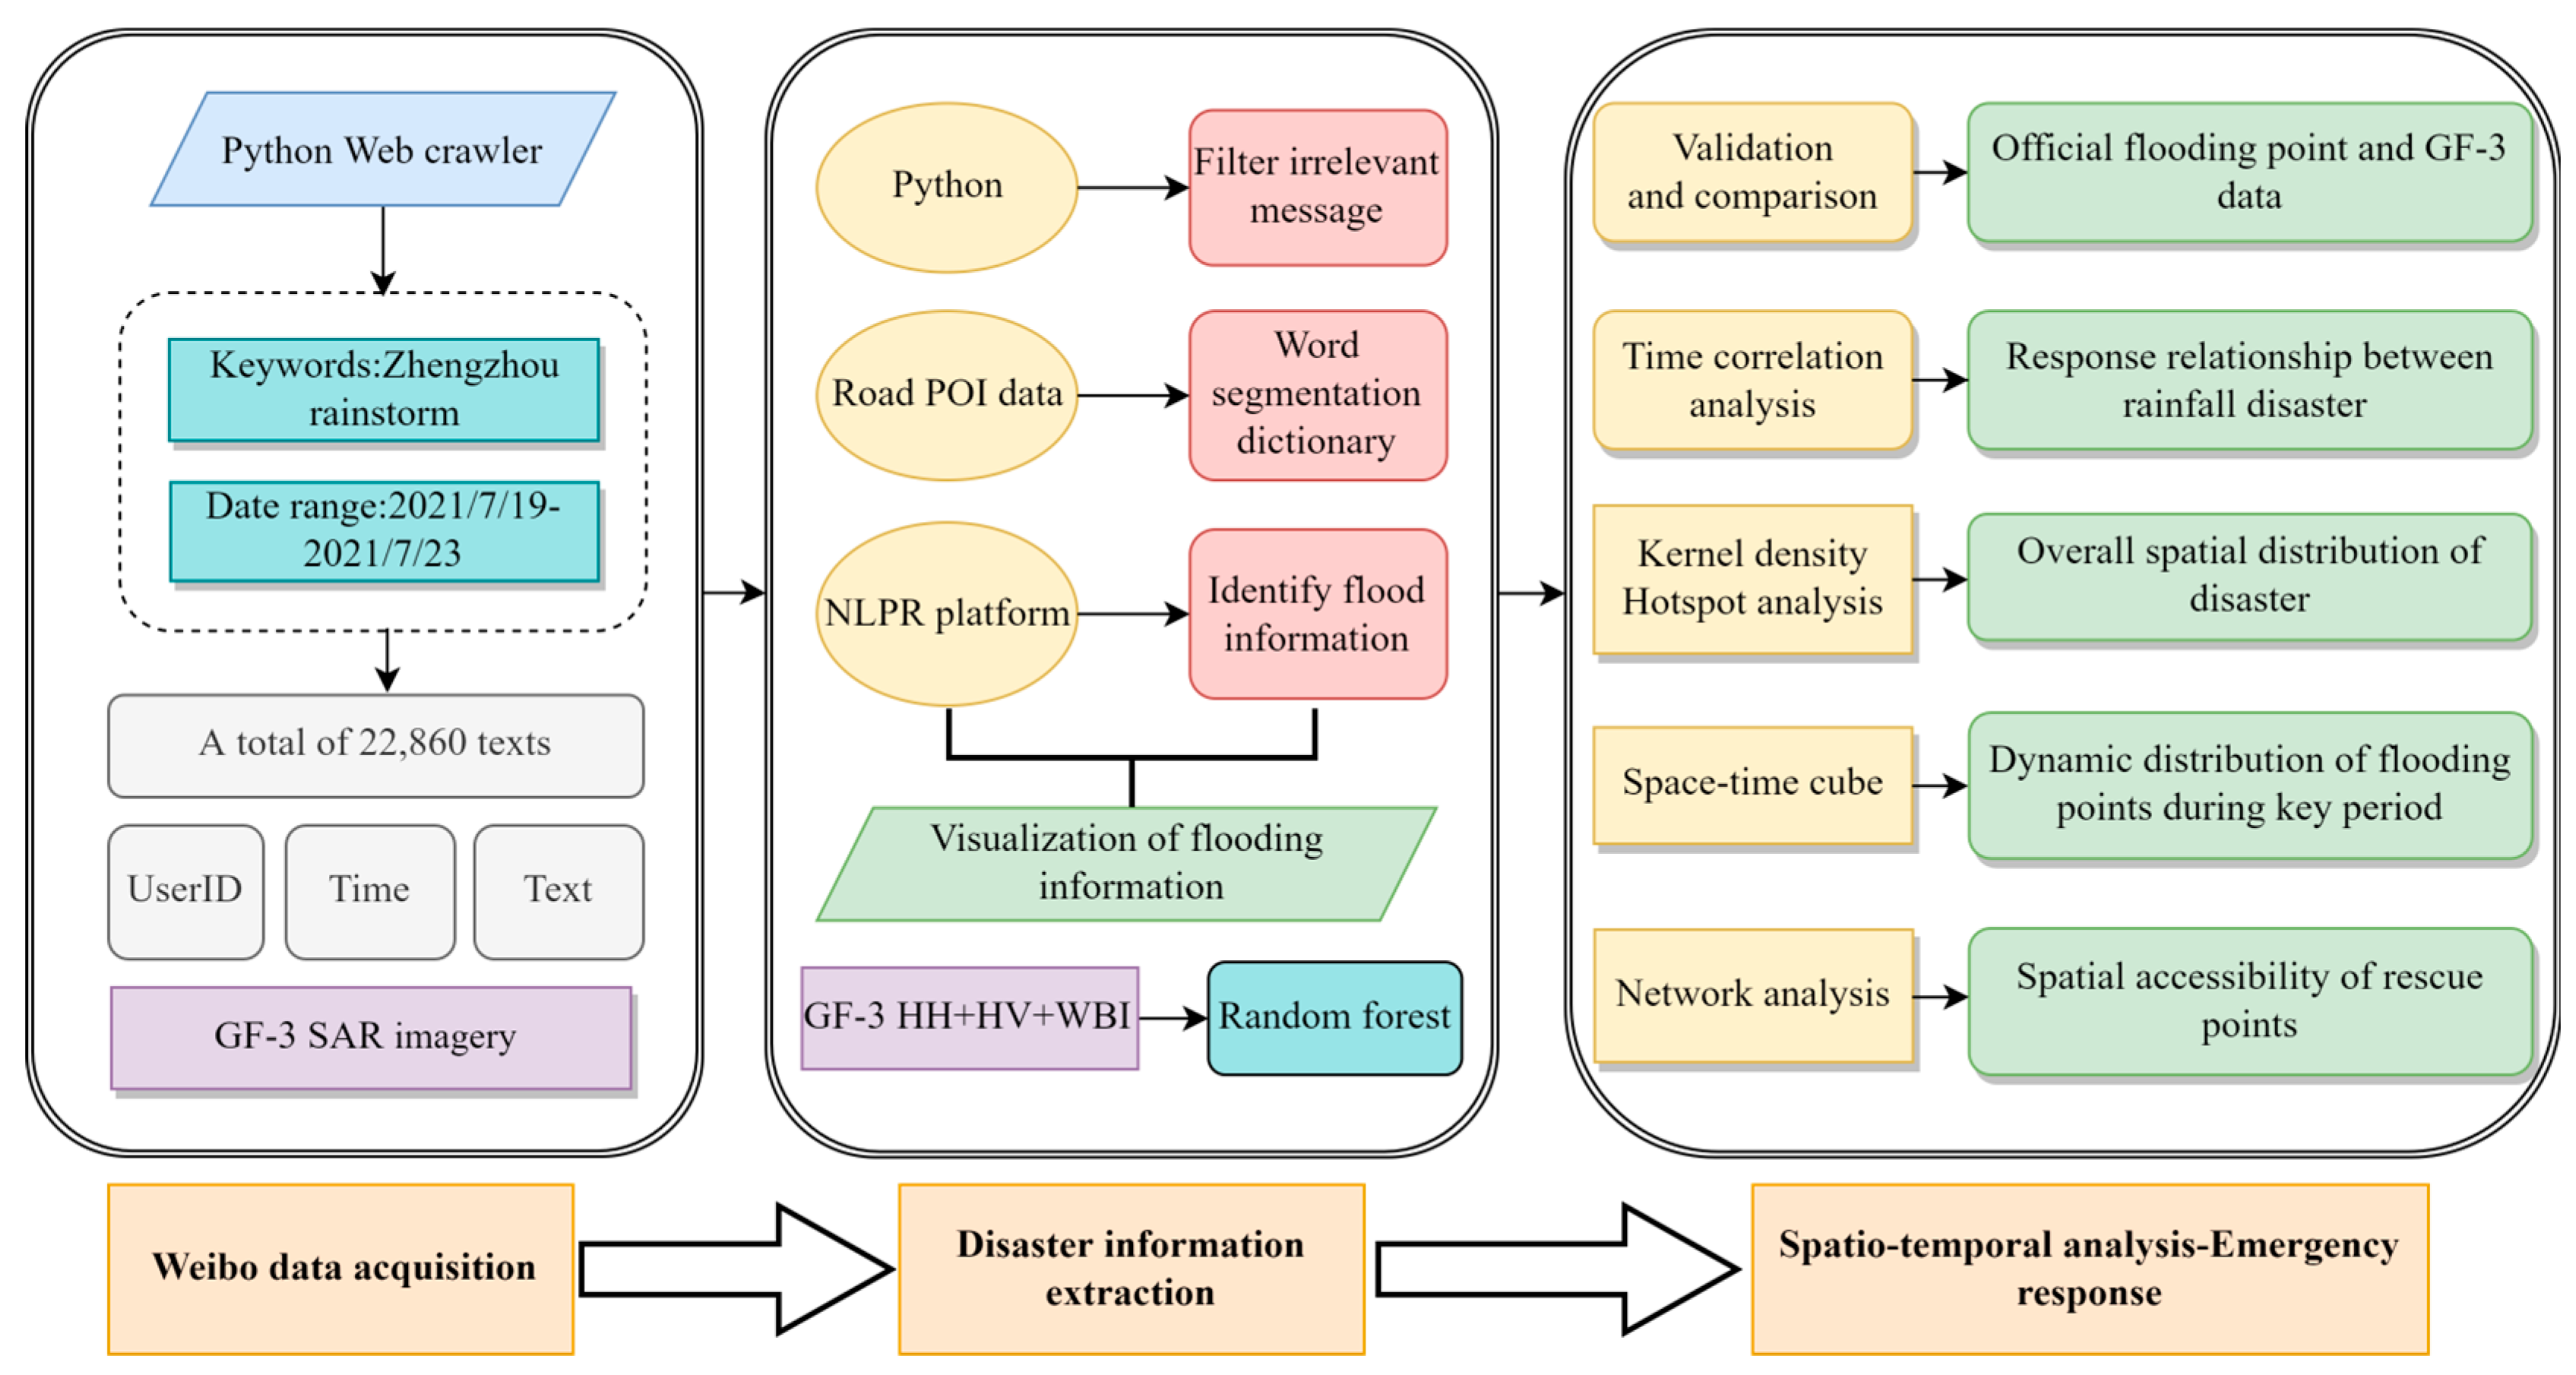
2.3. Methodology
2.3.1. Rapid Extraction for Flood Disaster Information
2.3.2. Spatiotemporal Analysis
Kernel Density and Spatial Autocorrelation
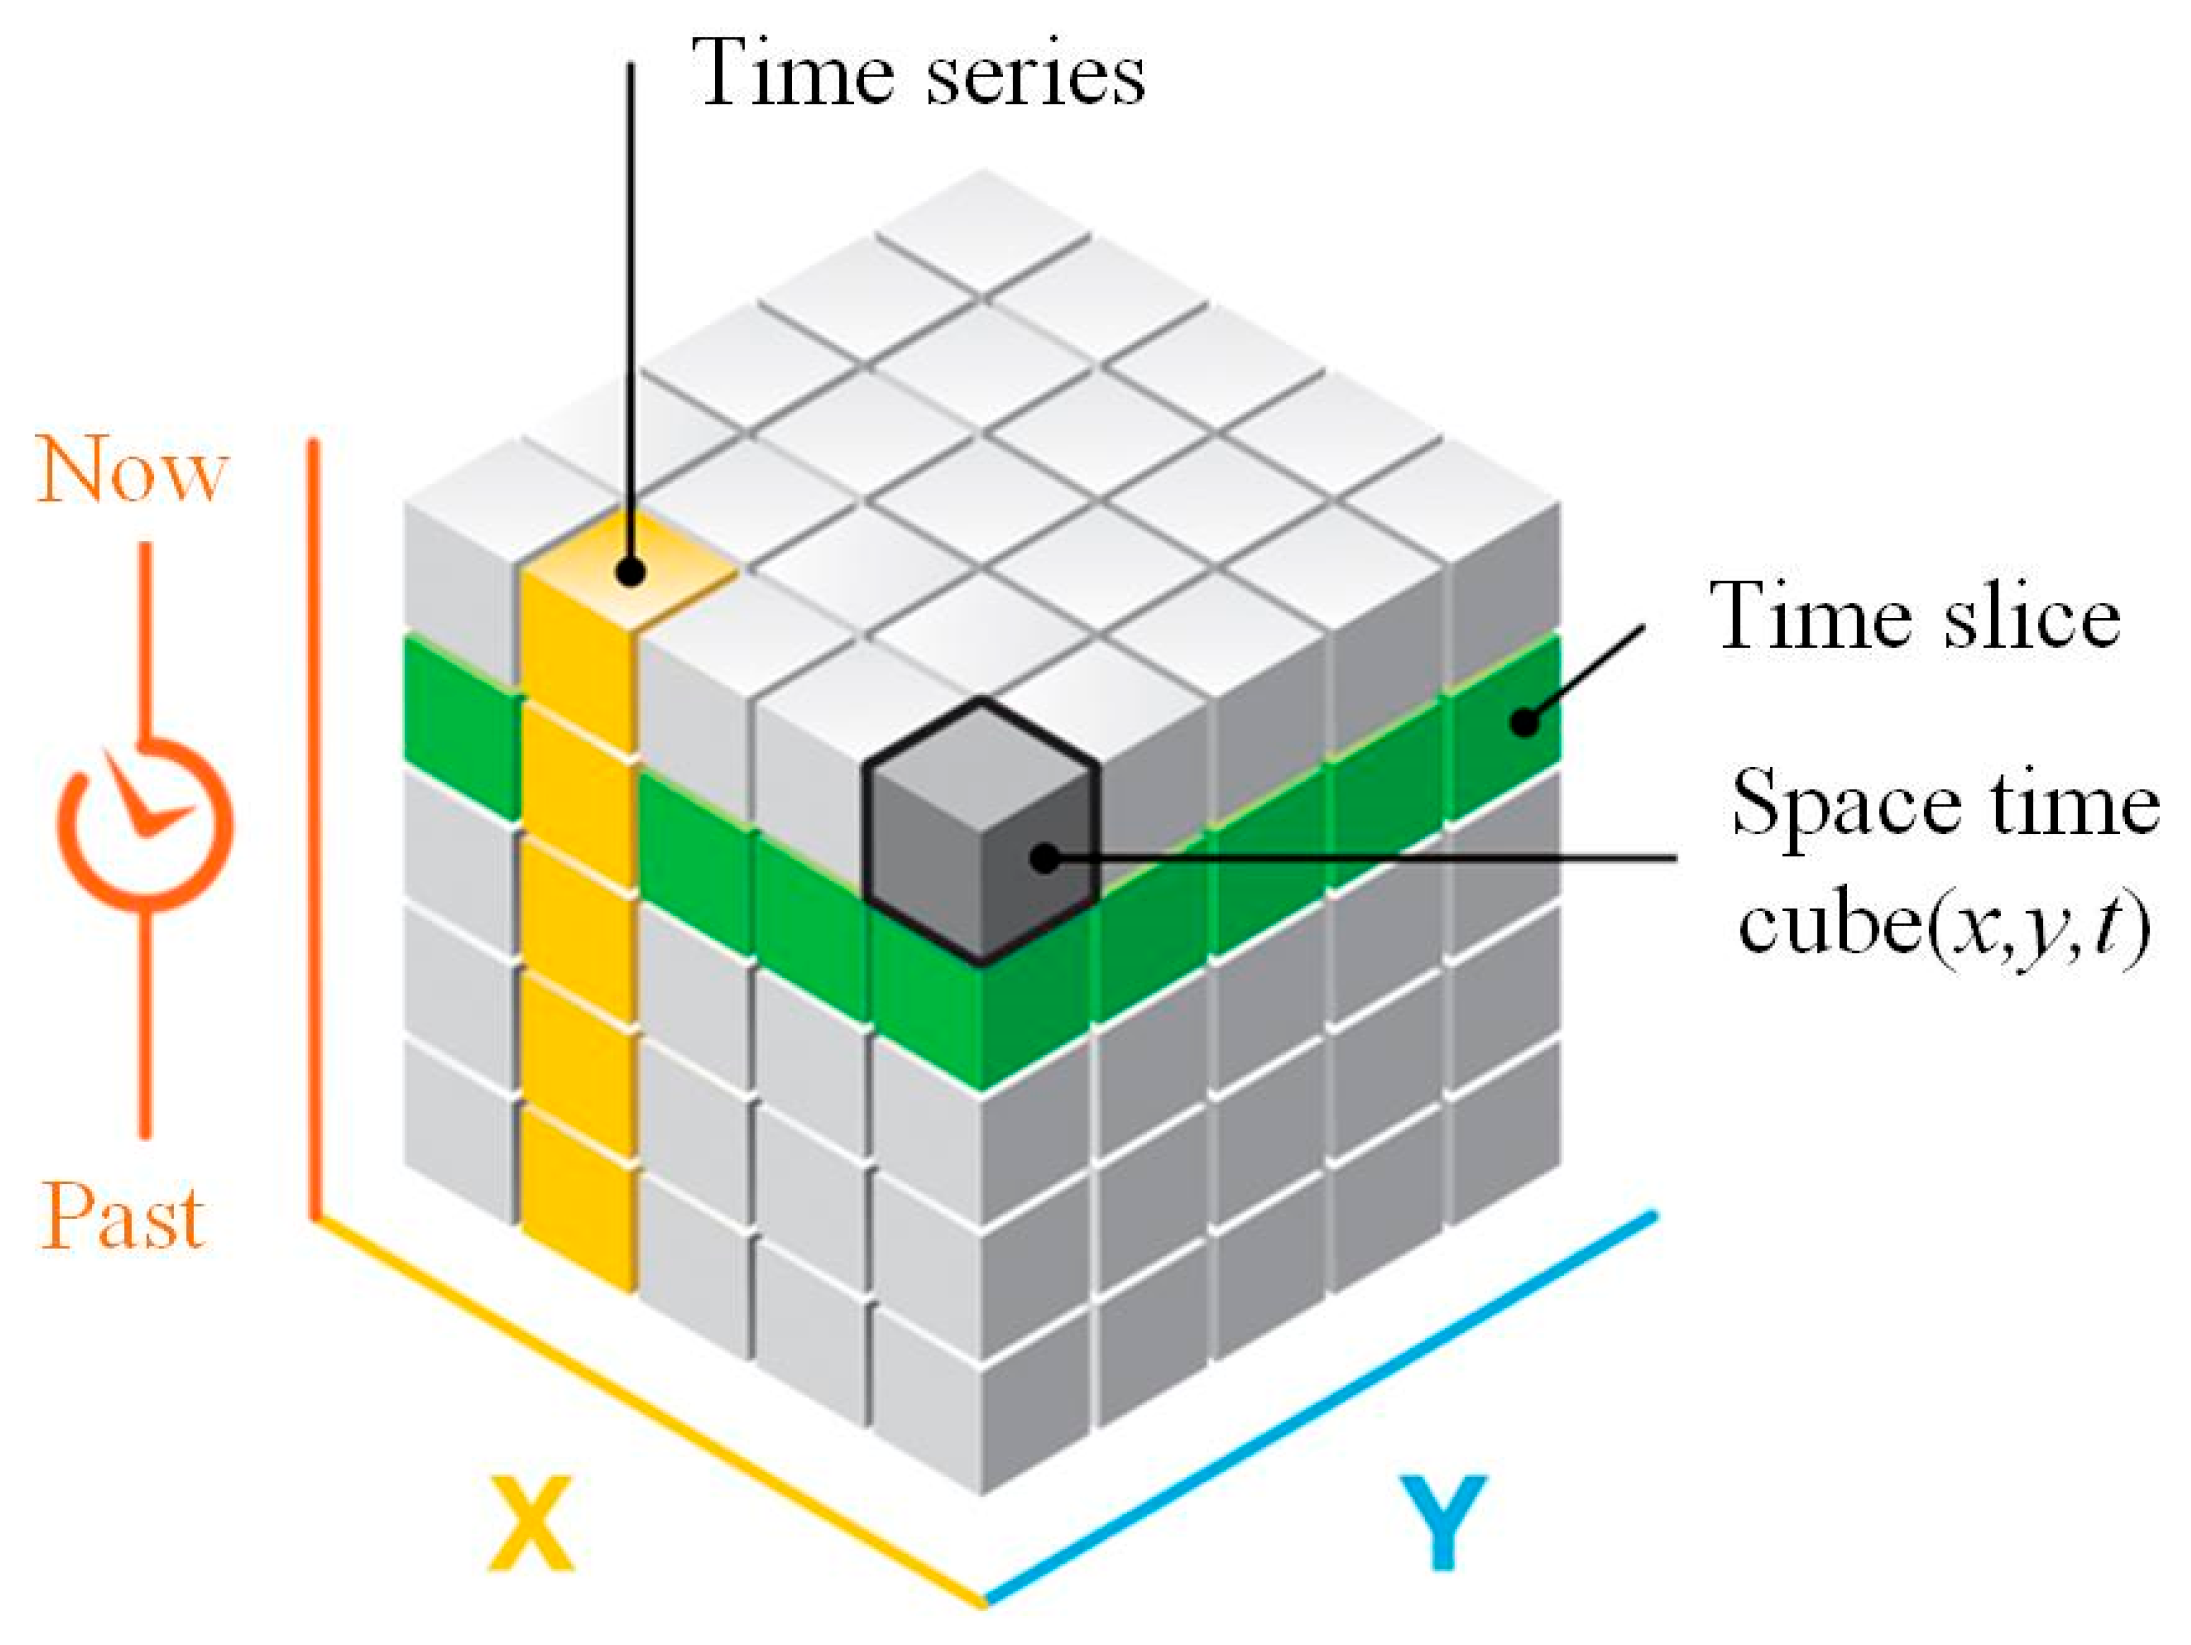
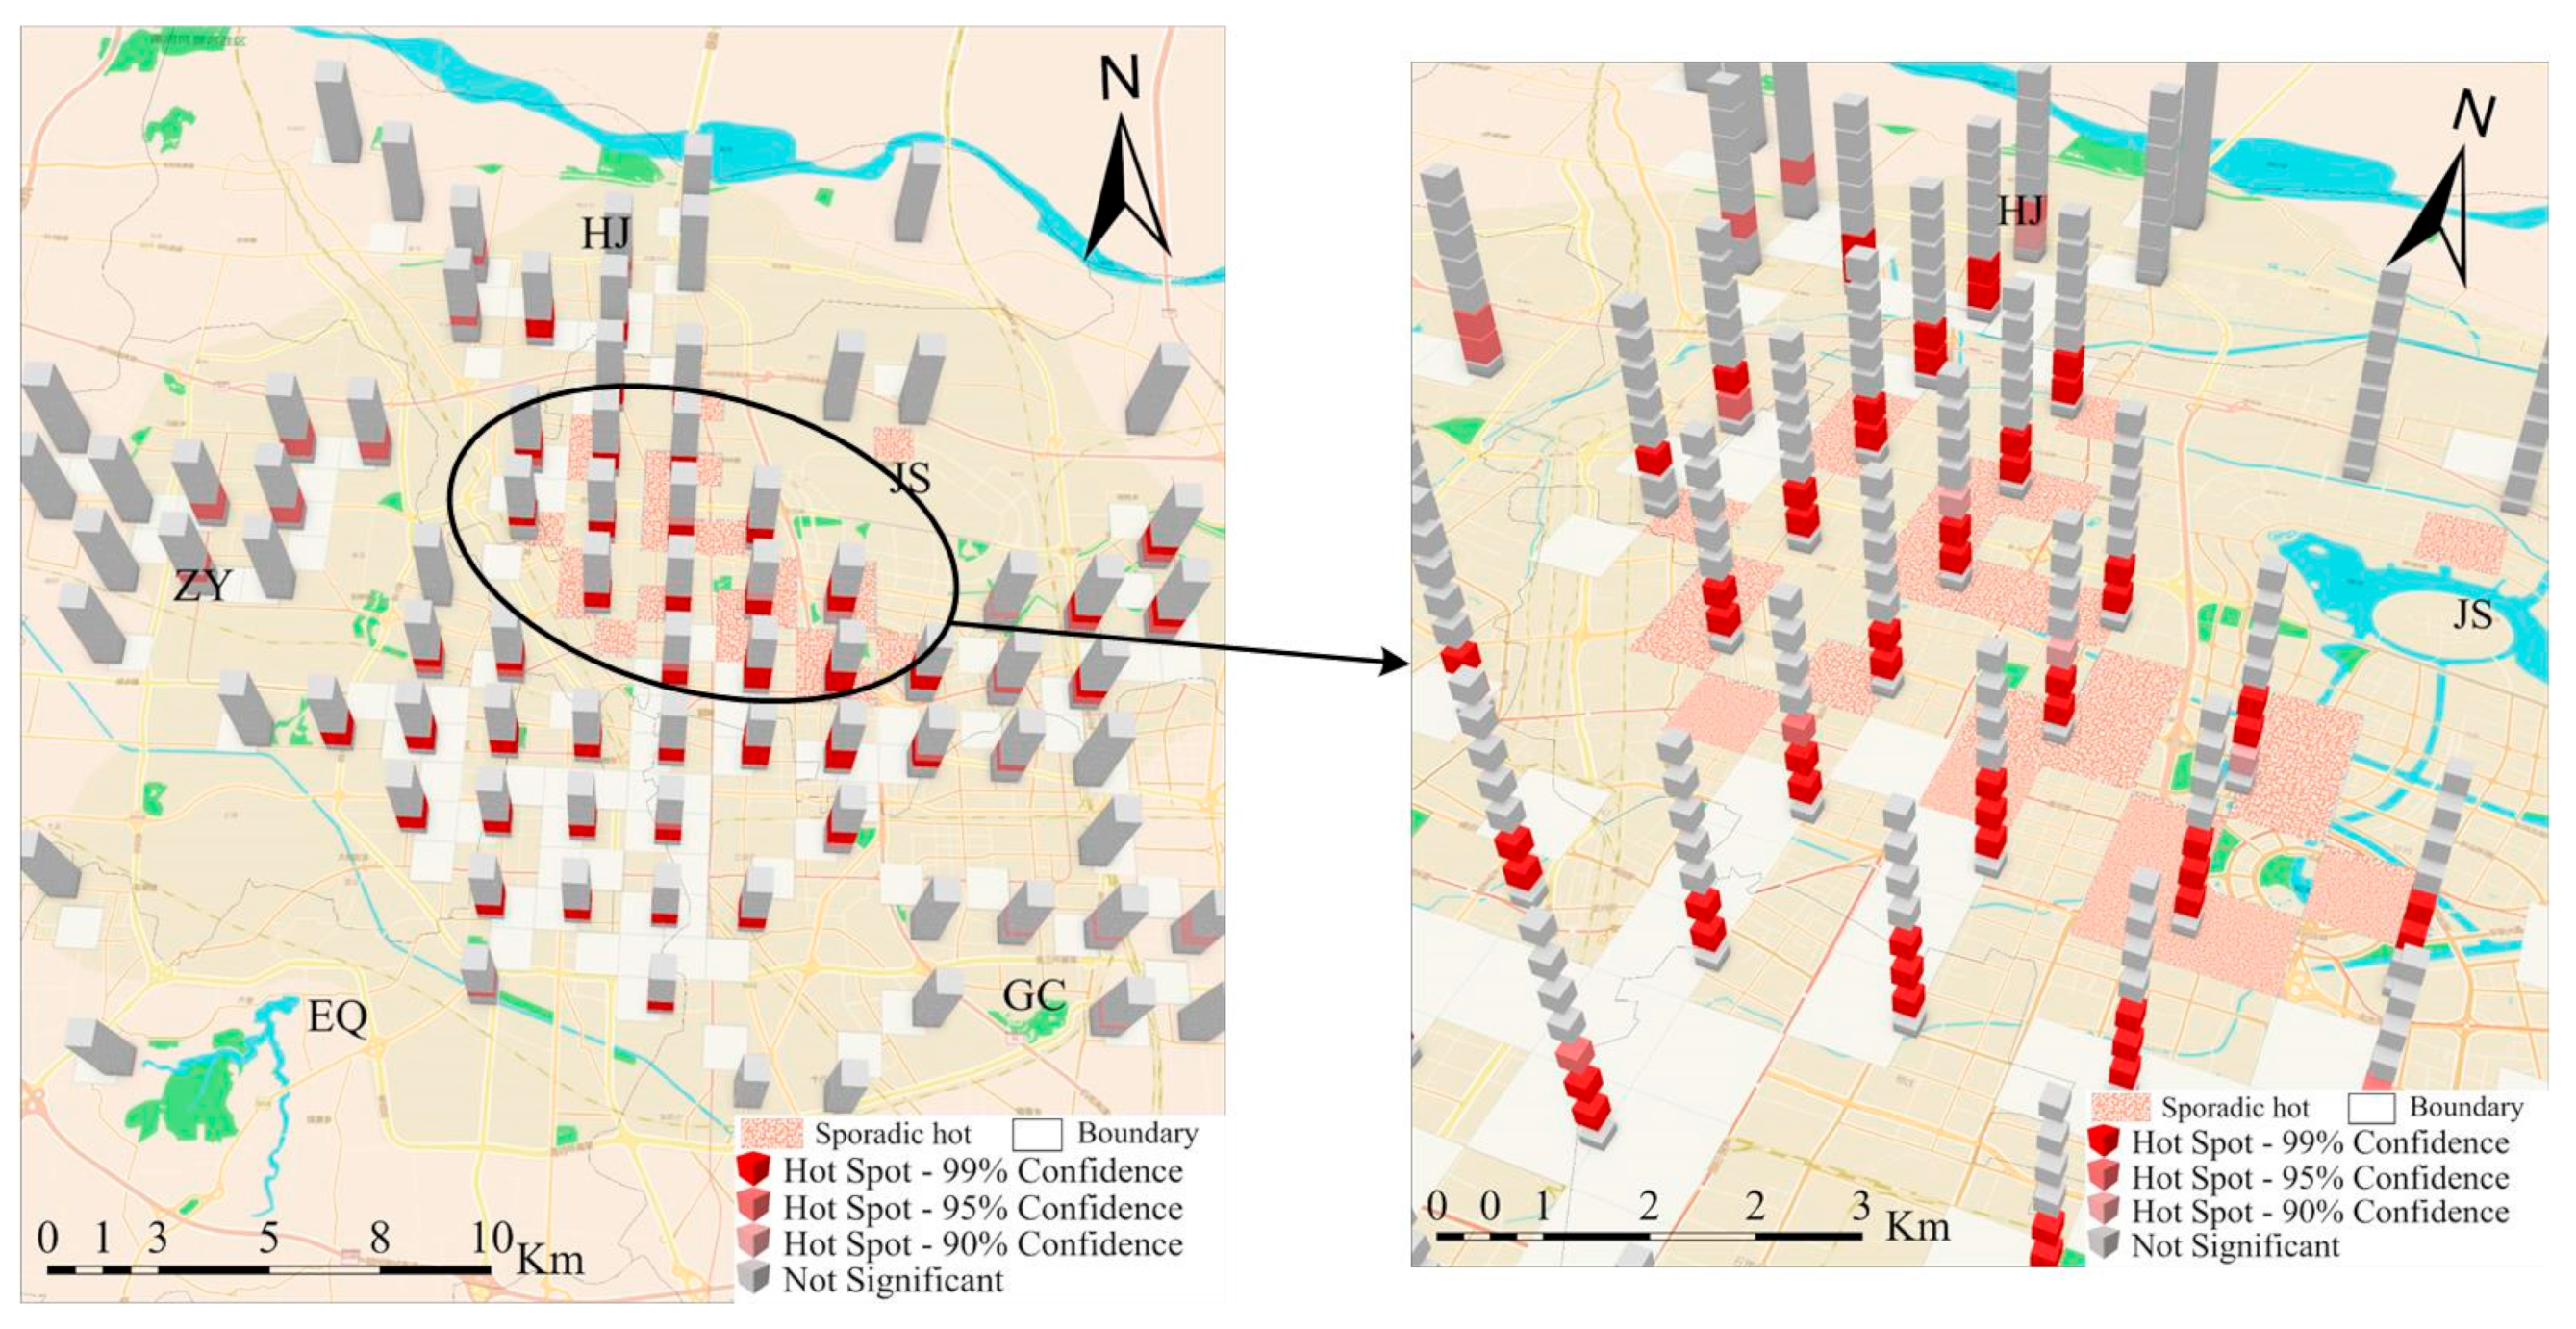
Space–Time Cube and Emerging Hot Spot Analysis
Spatial Accessibility
2.3.3. Random Forest Classification
3. Results
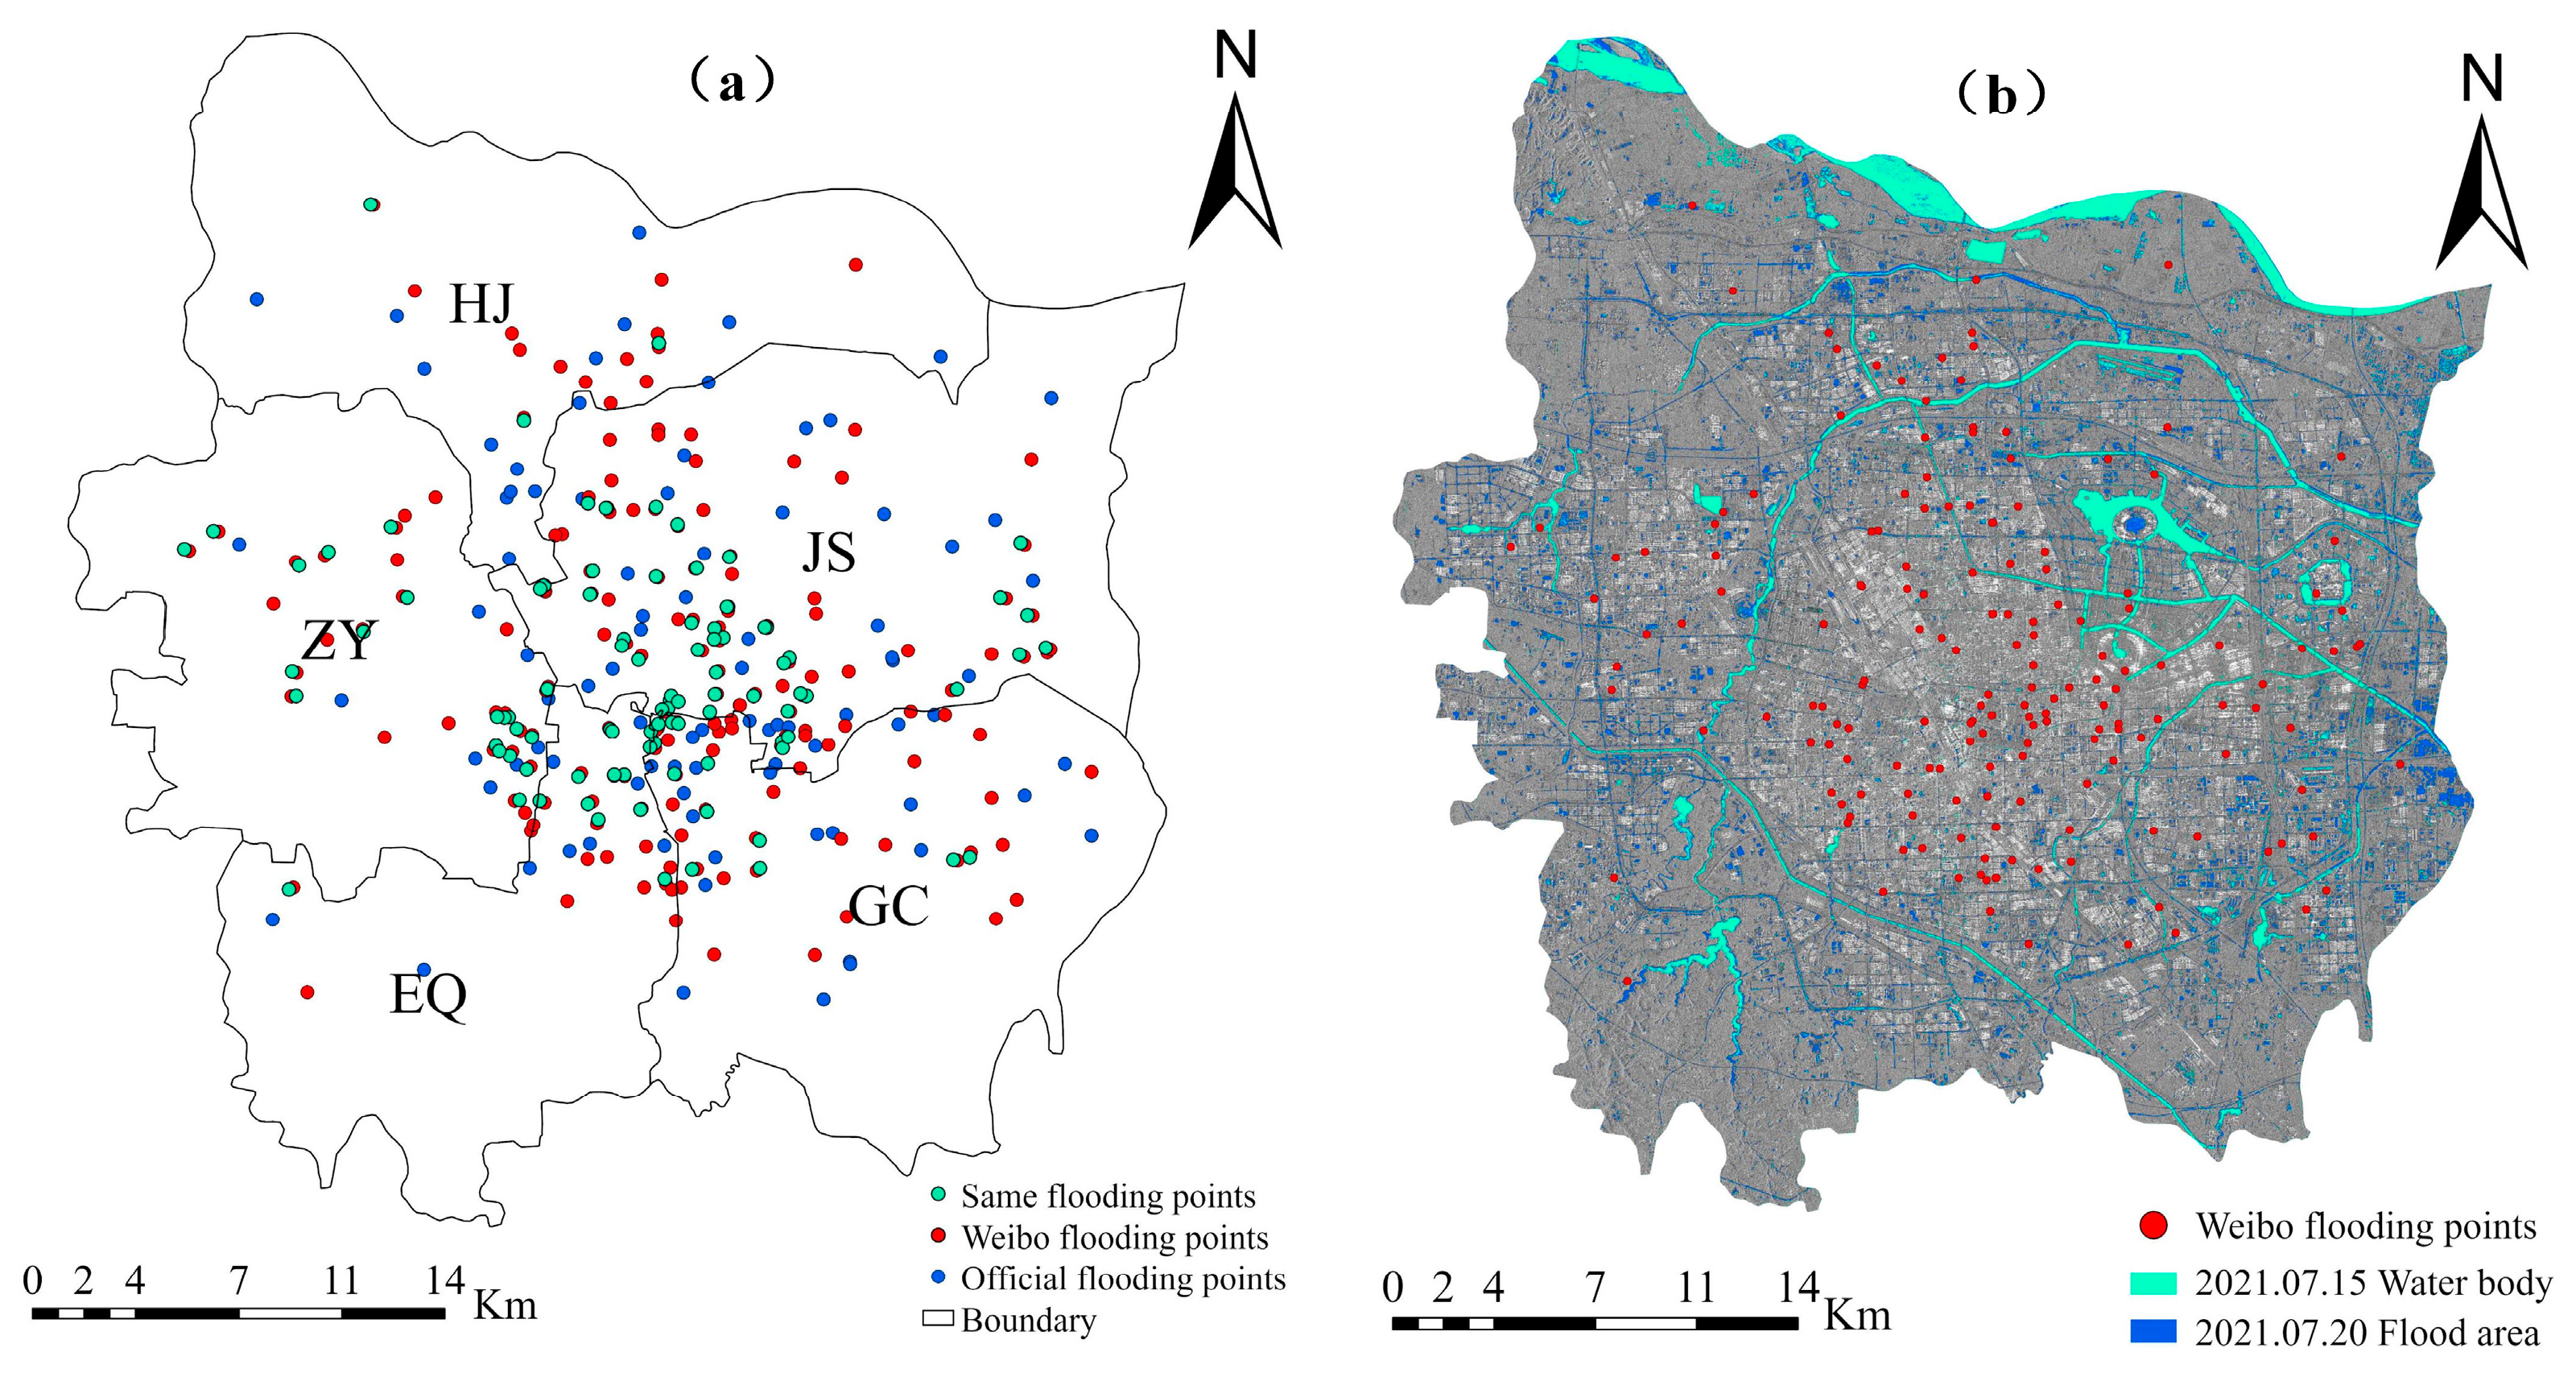
3.1. Validation and Comparison of Flooding Point Extraction
3.2. Response Relationship between Rainfall and Floods
3.3. Spatial Distribution of Flood Disaster Information
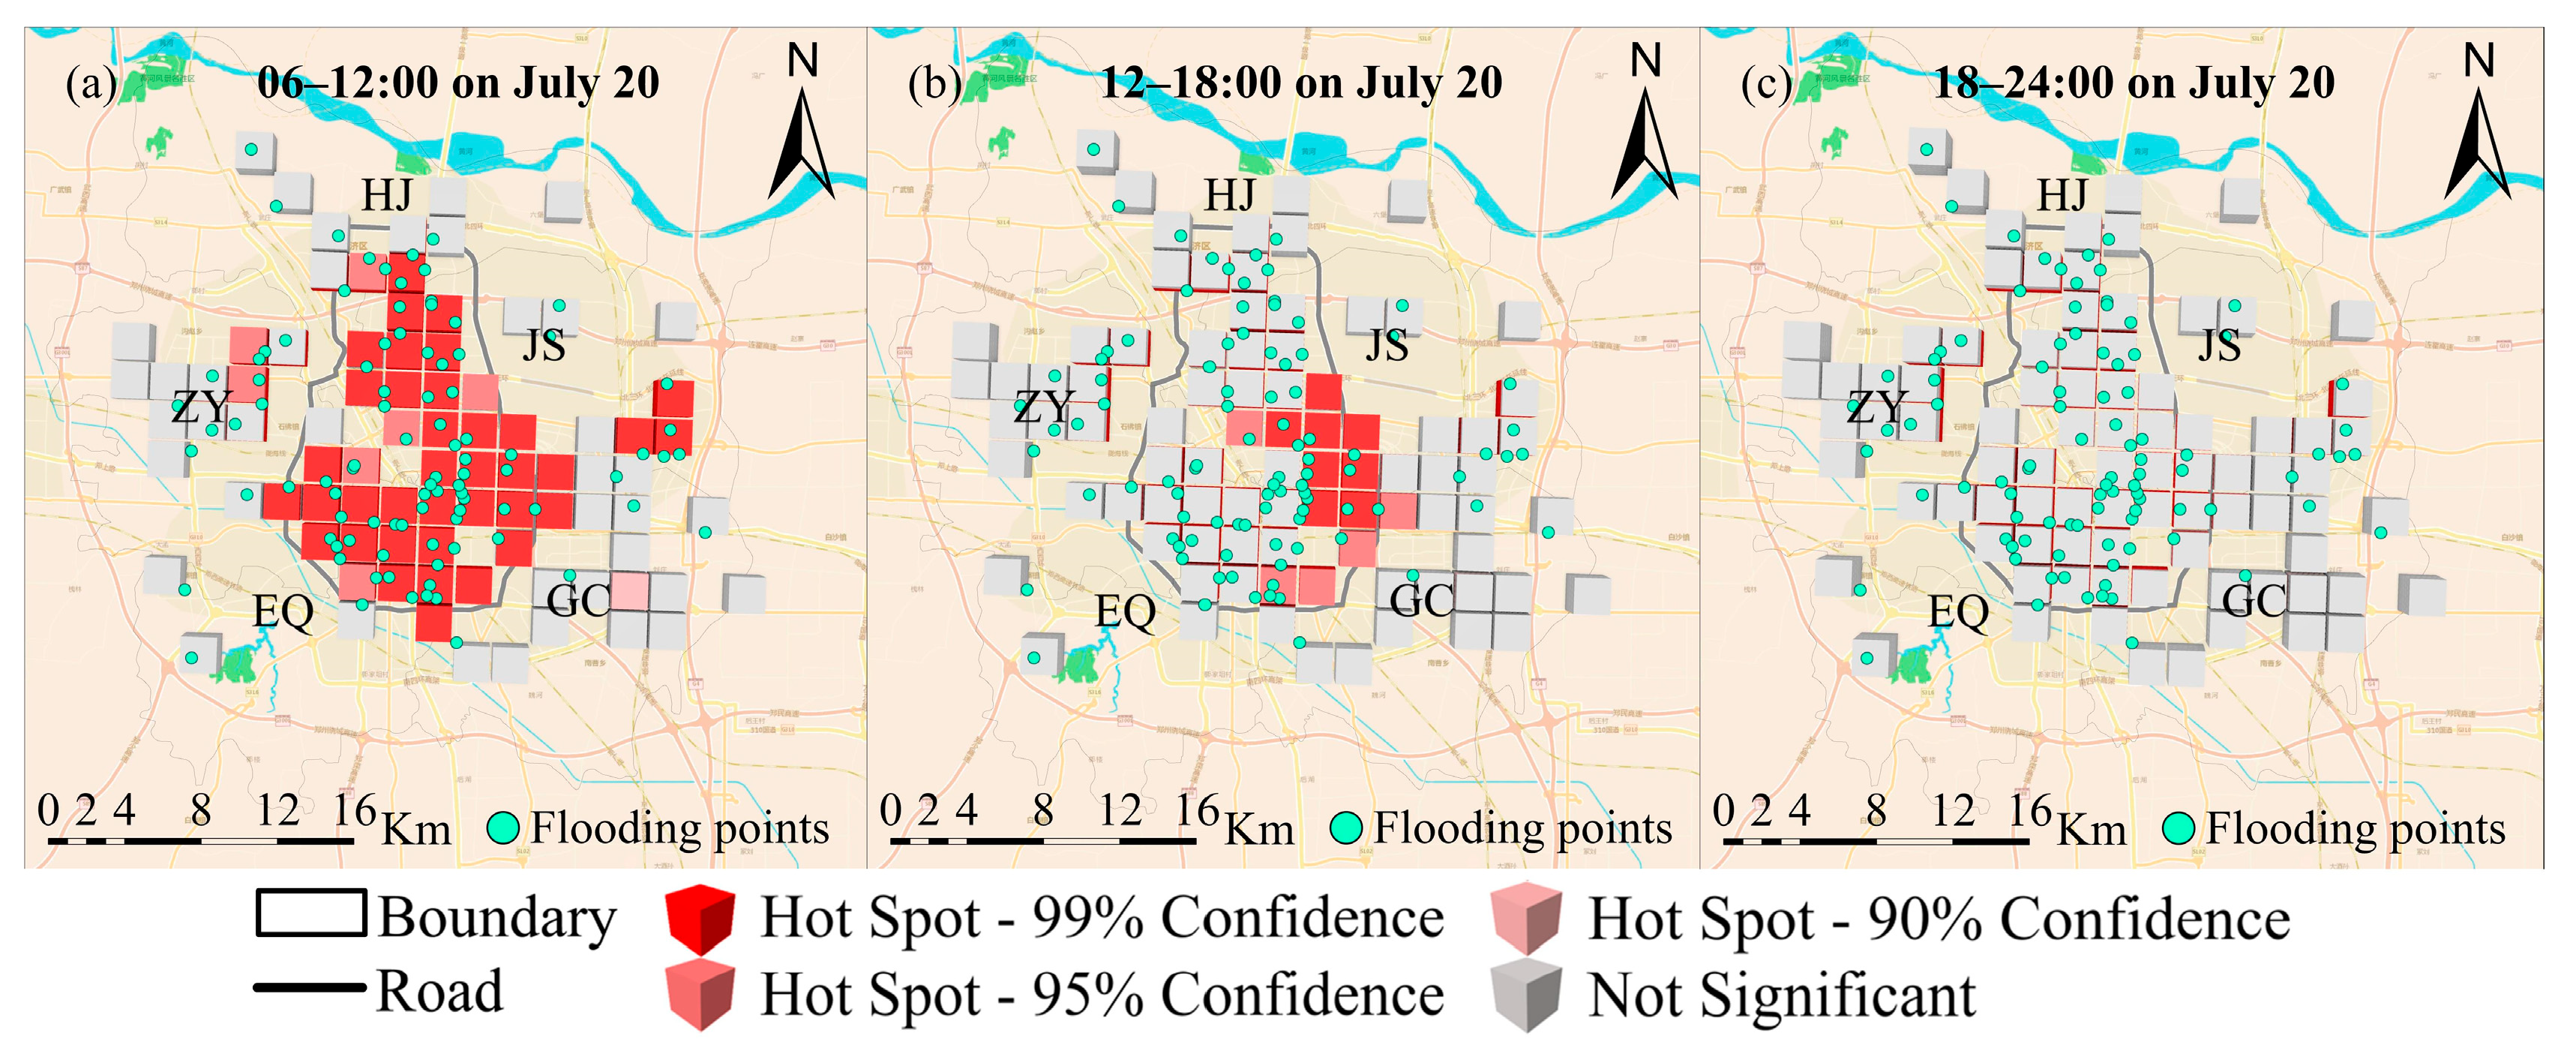
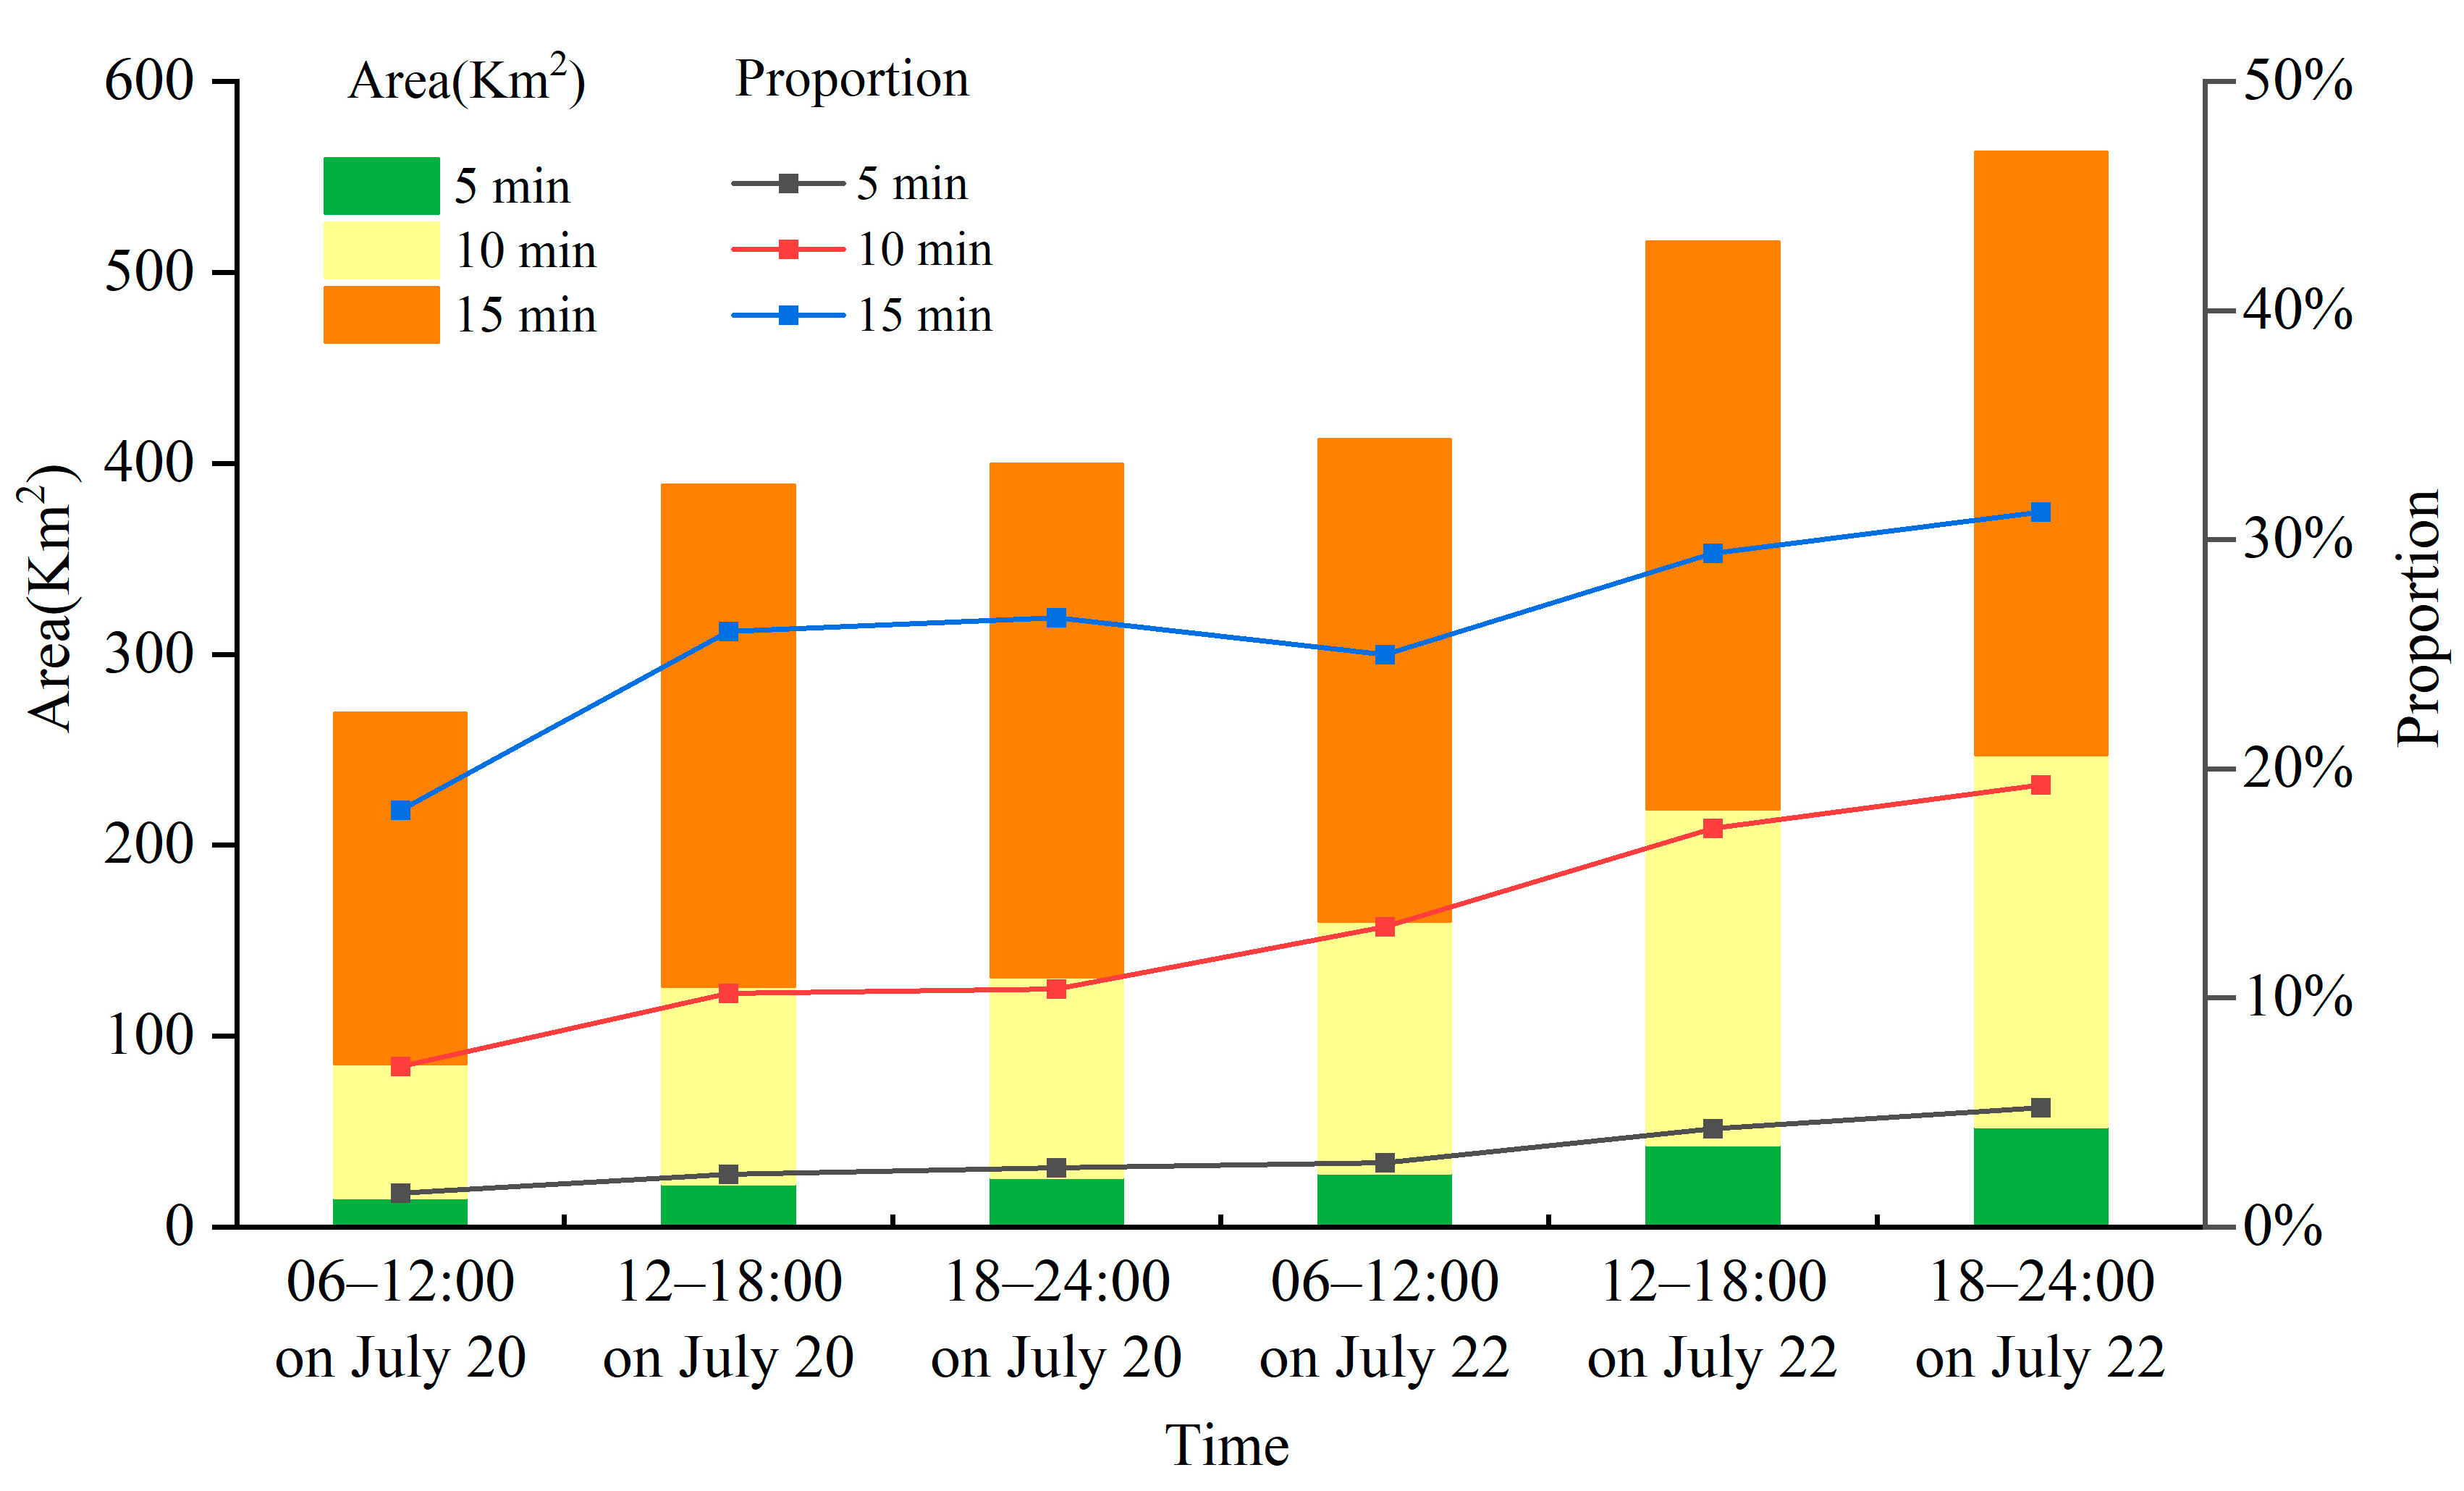
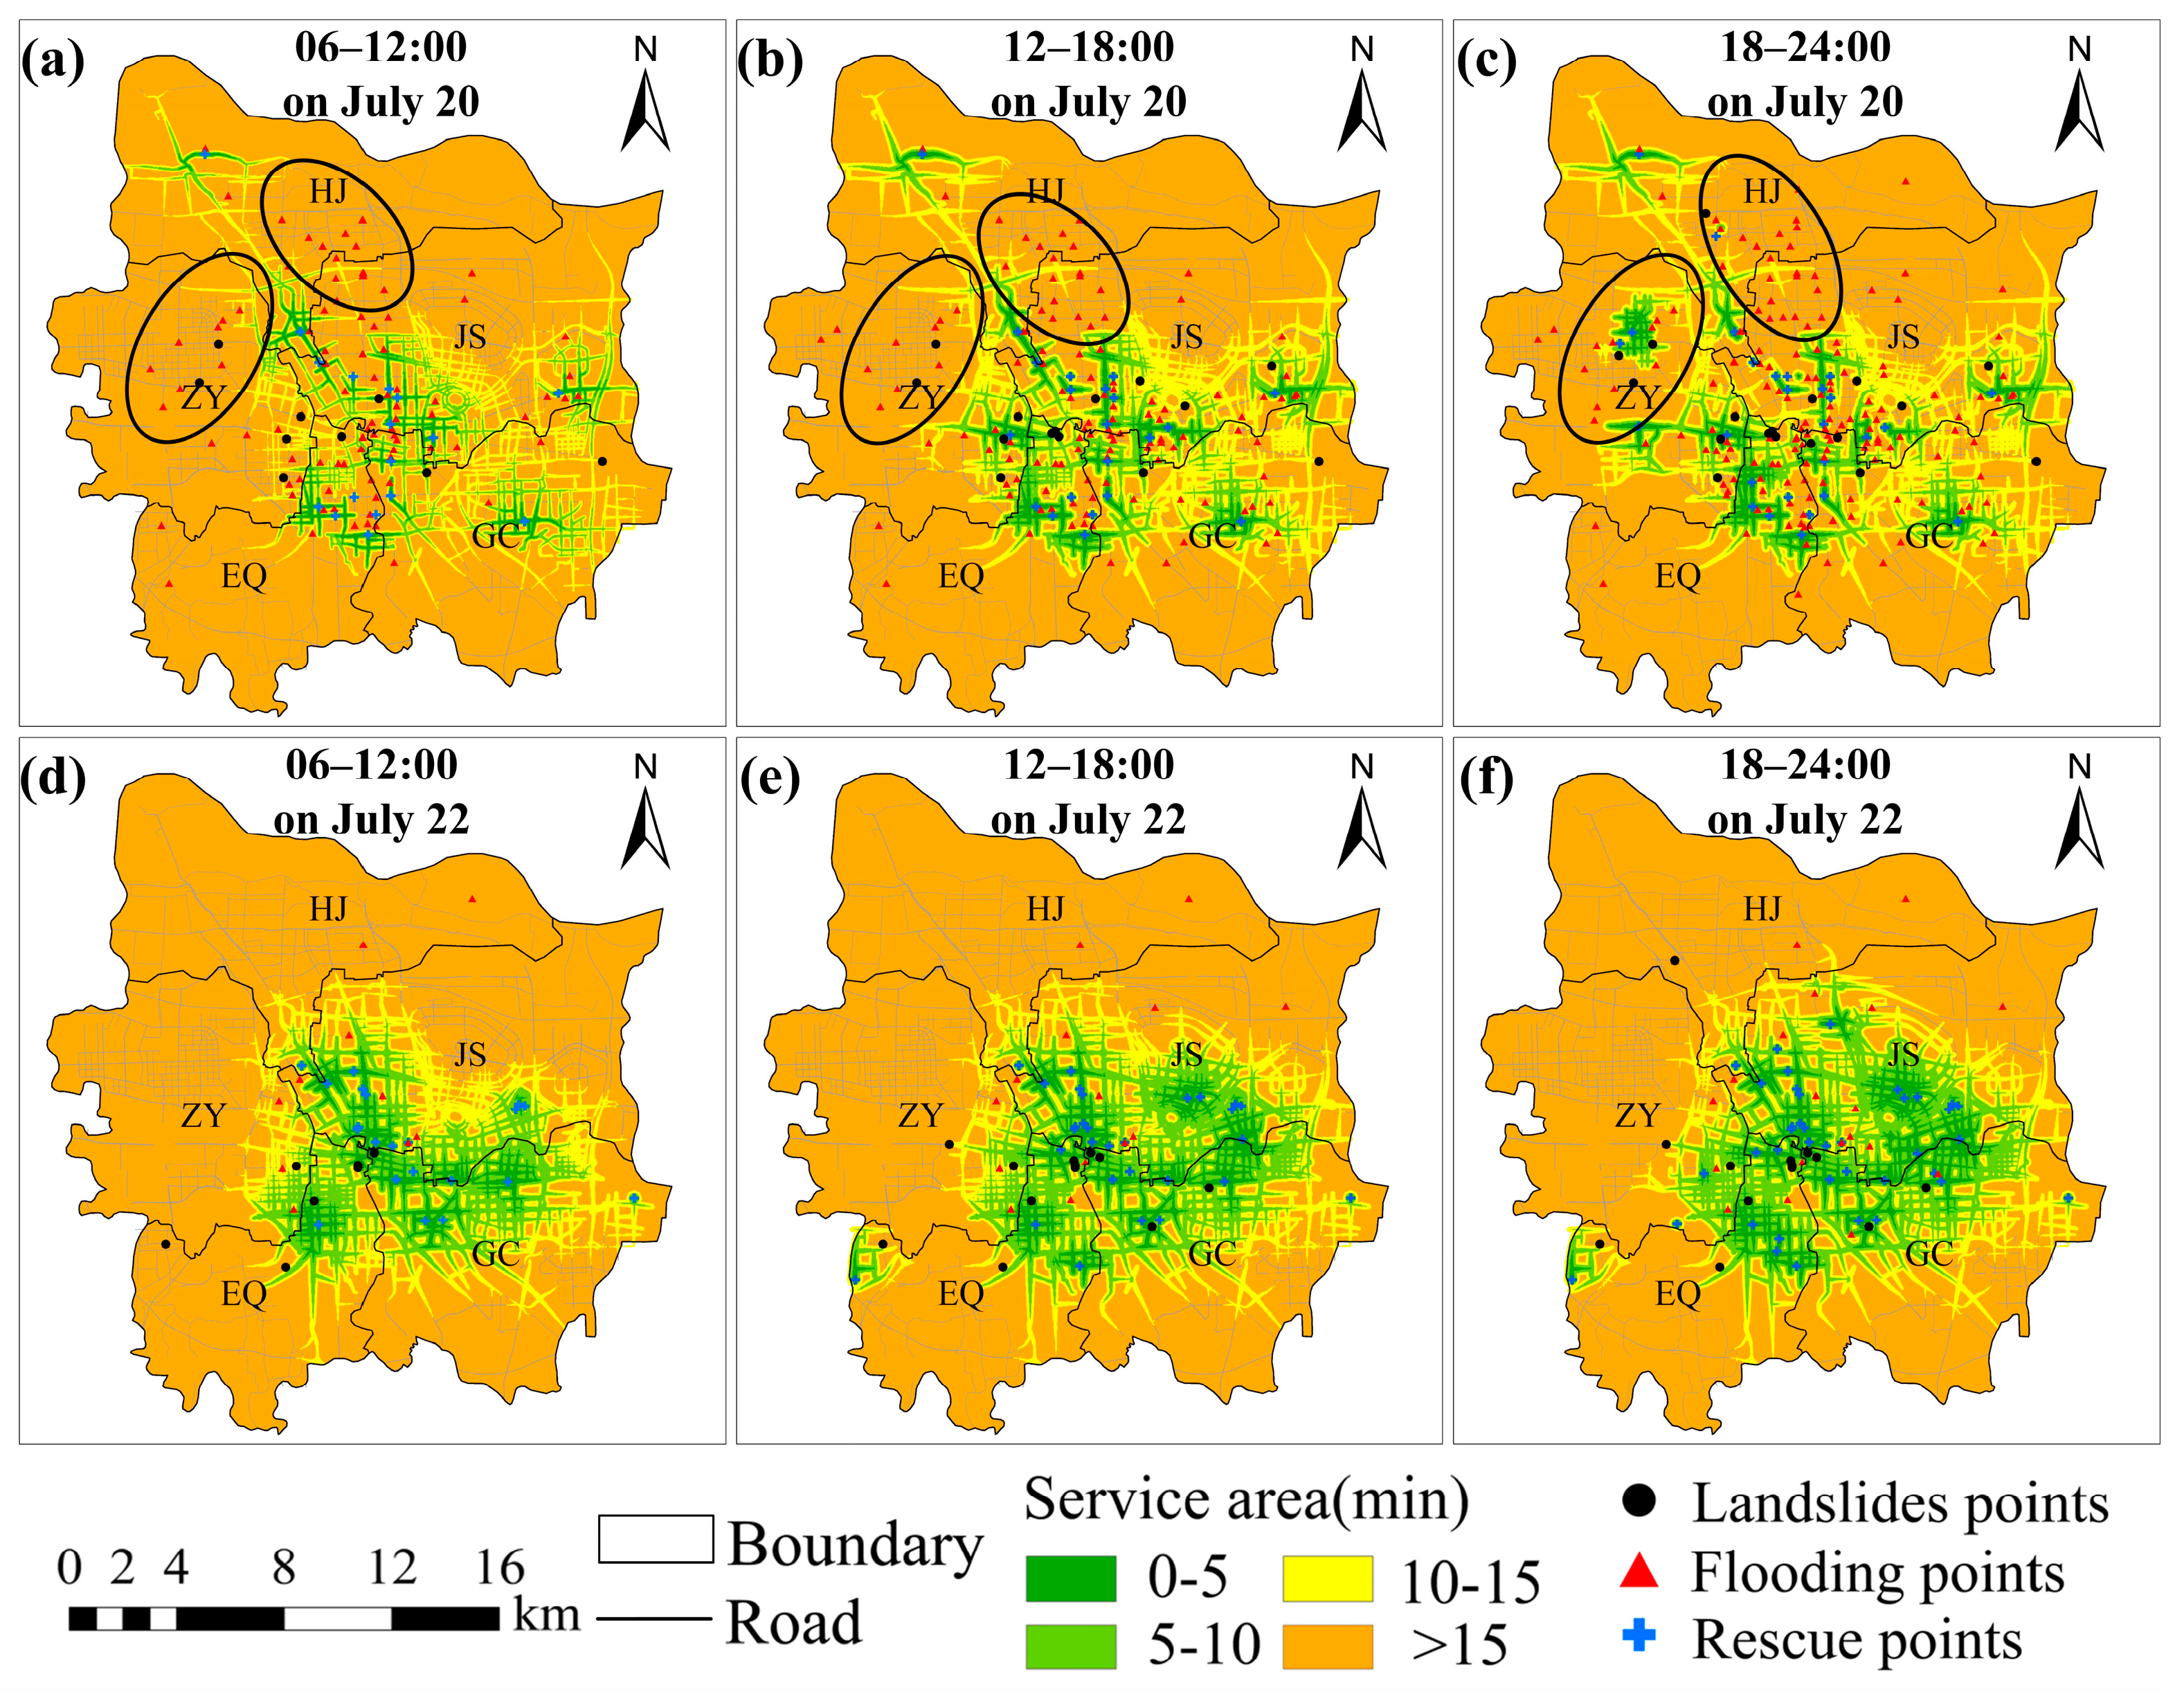
3.4. Temporal and Spatial Dynamic Distribution of Flood Points
4. Discussion
4.1. Comparison of Flood Point Extraction Based on Social Media and SAR Data
4.2. The Potential Application of the Time–Response Relationship between Disaster and Rainfall in Early Warning
4.3. Comparison of Spatiotemporal Distribution of Flood Disasters
4.4. The Application of Space Accessibility in Emergency Response
5. Conclusions
- (1)
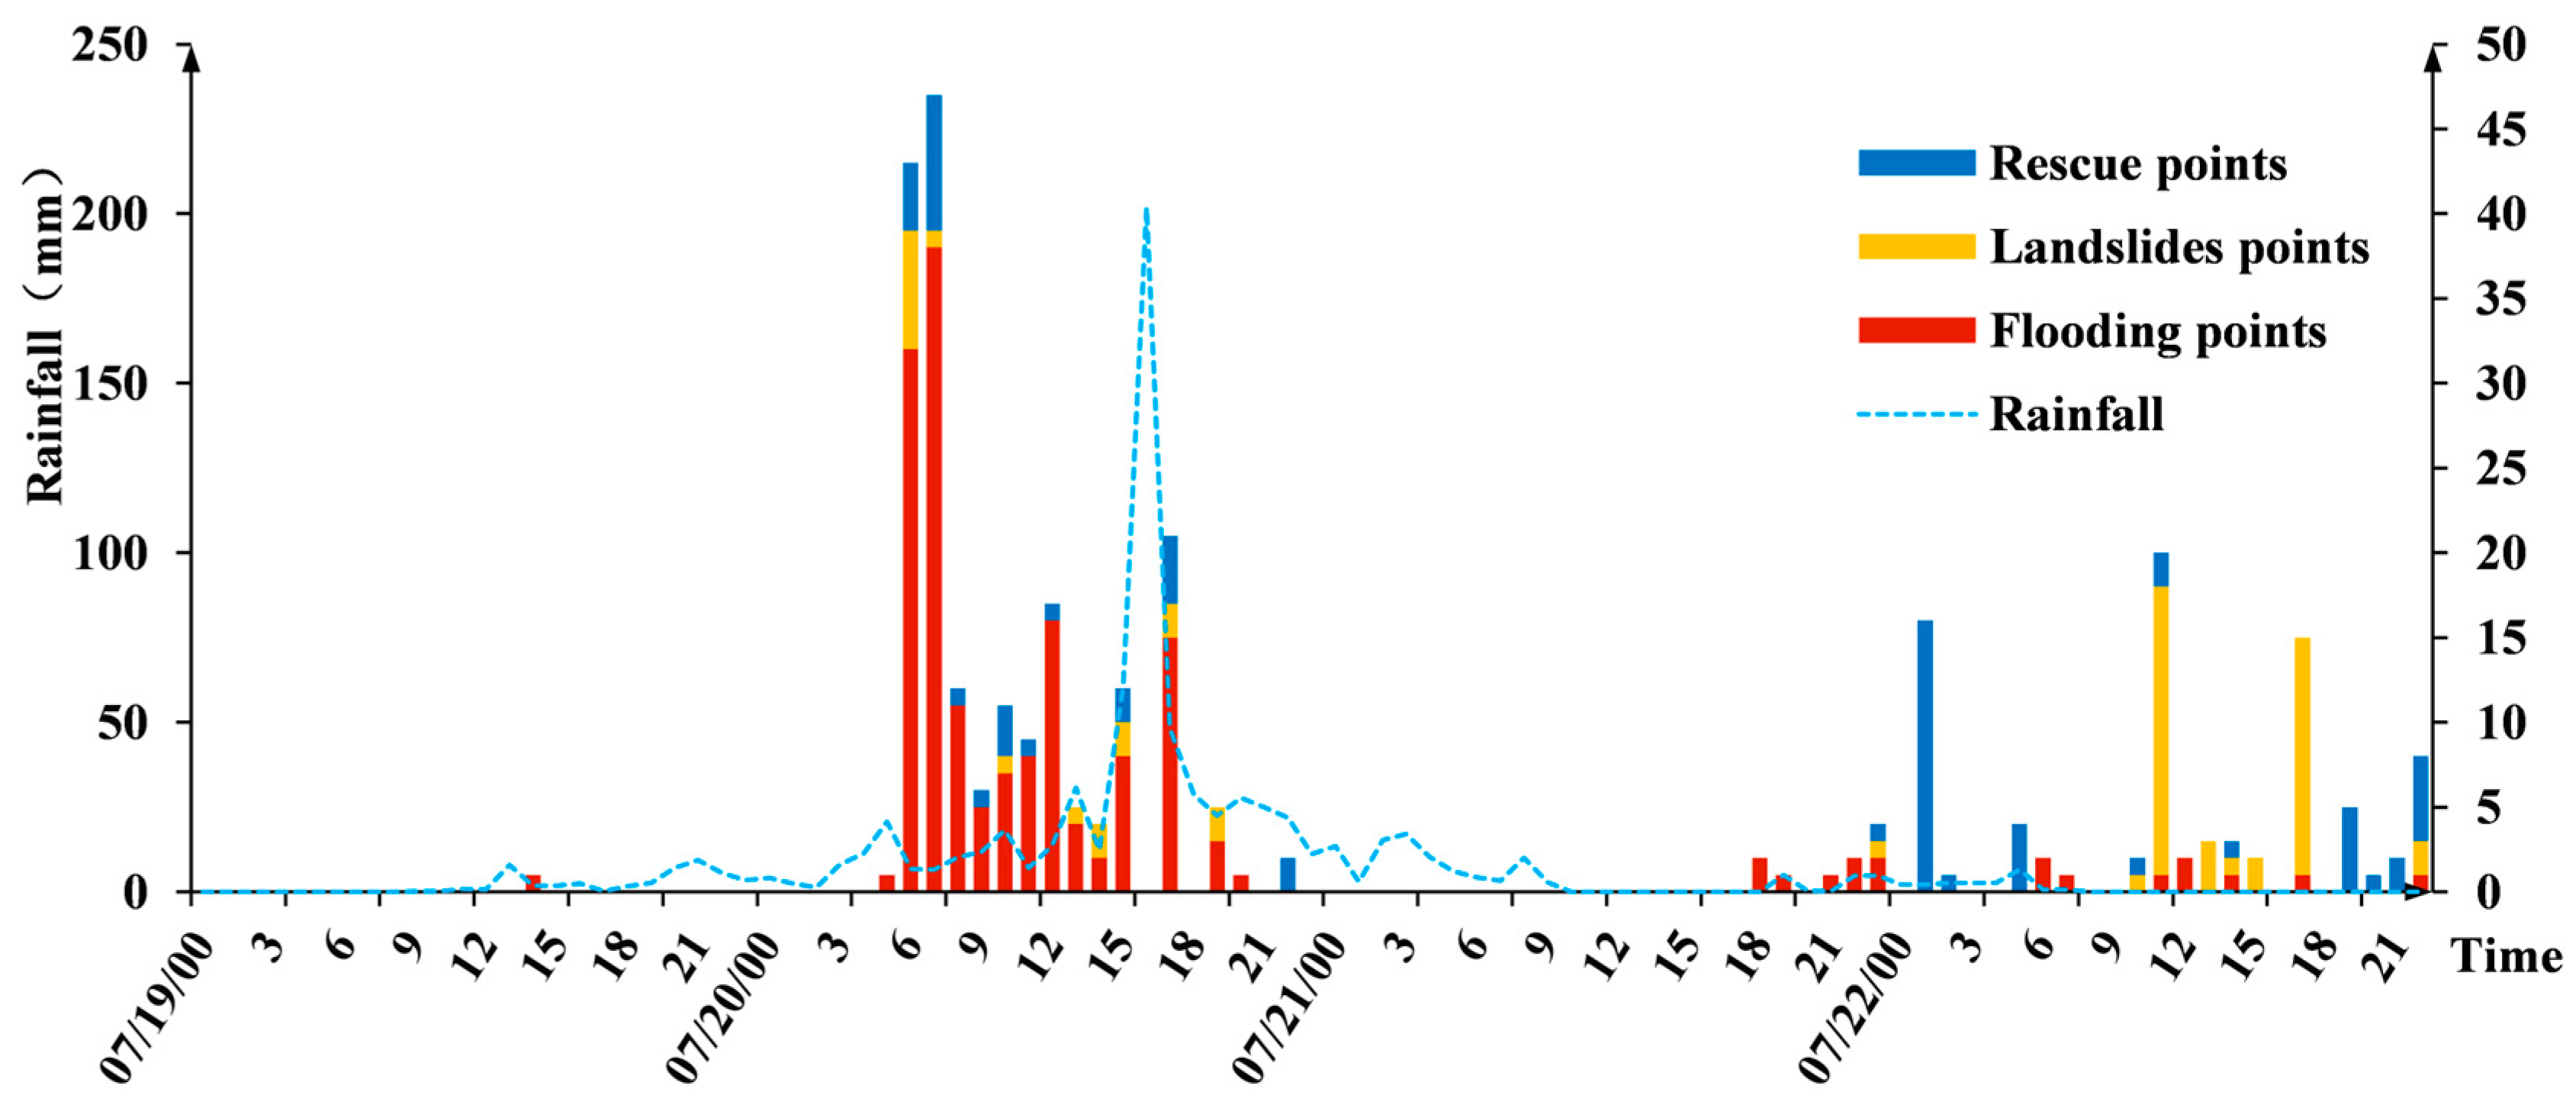
- Temporally, the study revealed that disaster information did not increase proportionally with the amount of rainfall during the rainfall process. Instead, there was often a lag period of 2–3 h between the peak rainfall period and the small peak of new flooding points. Landslides and rescue points tended to be concentrated in the late stage of rainfall;
- (2)
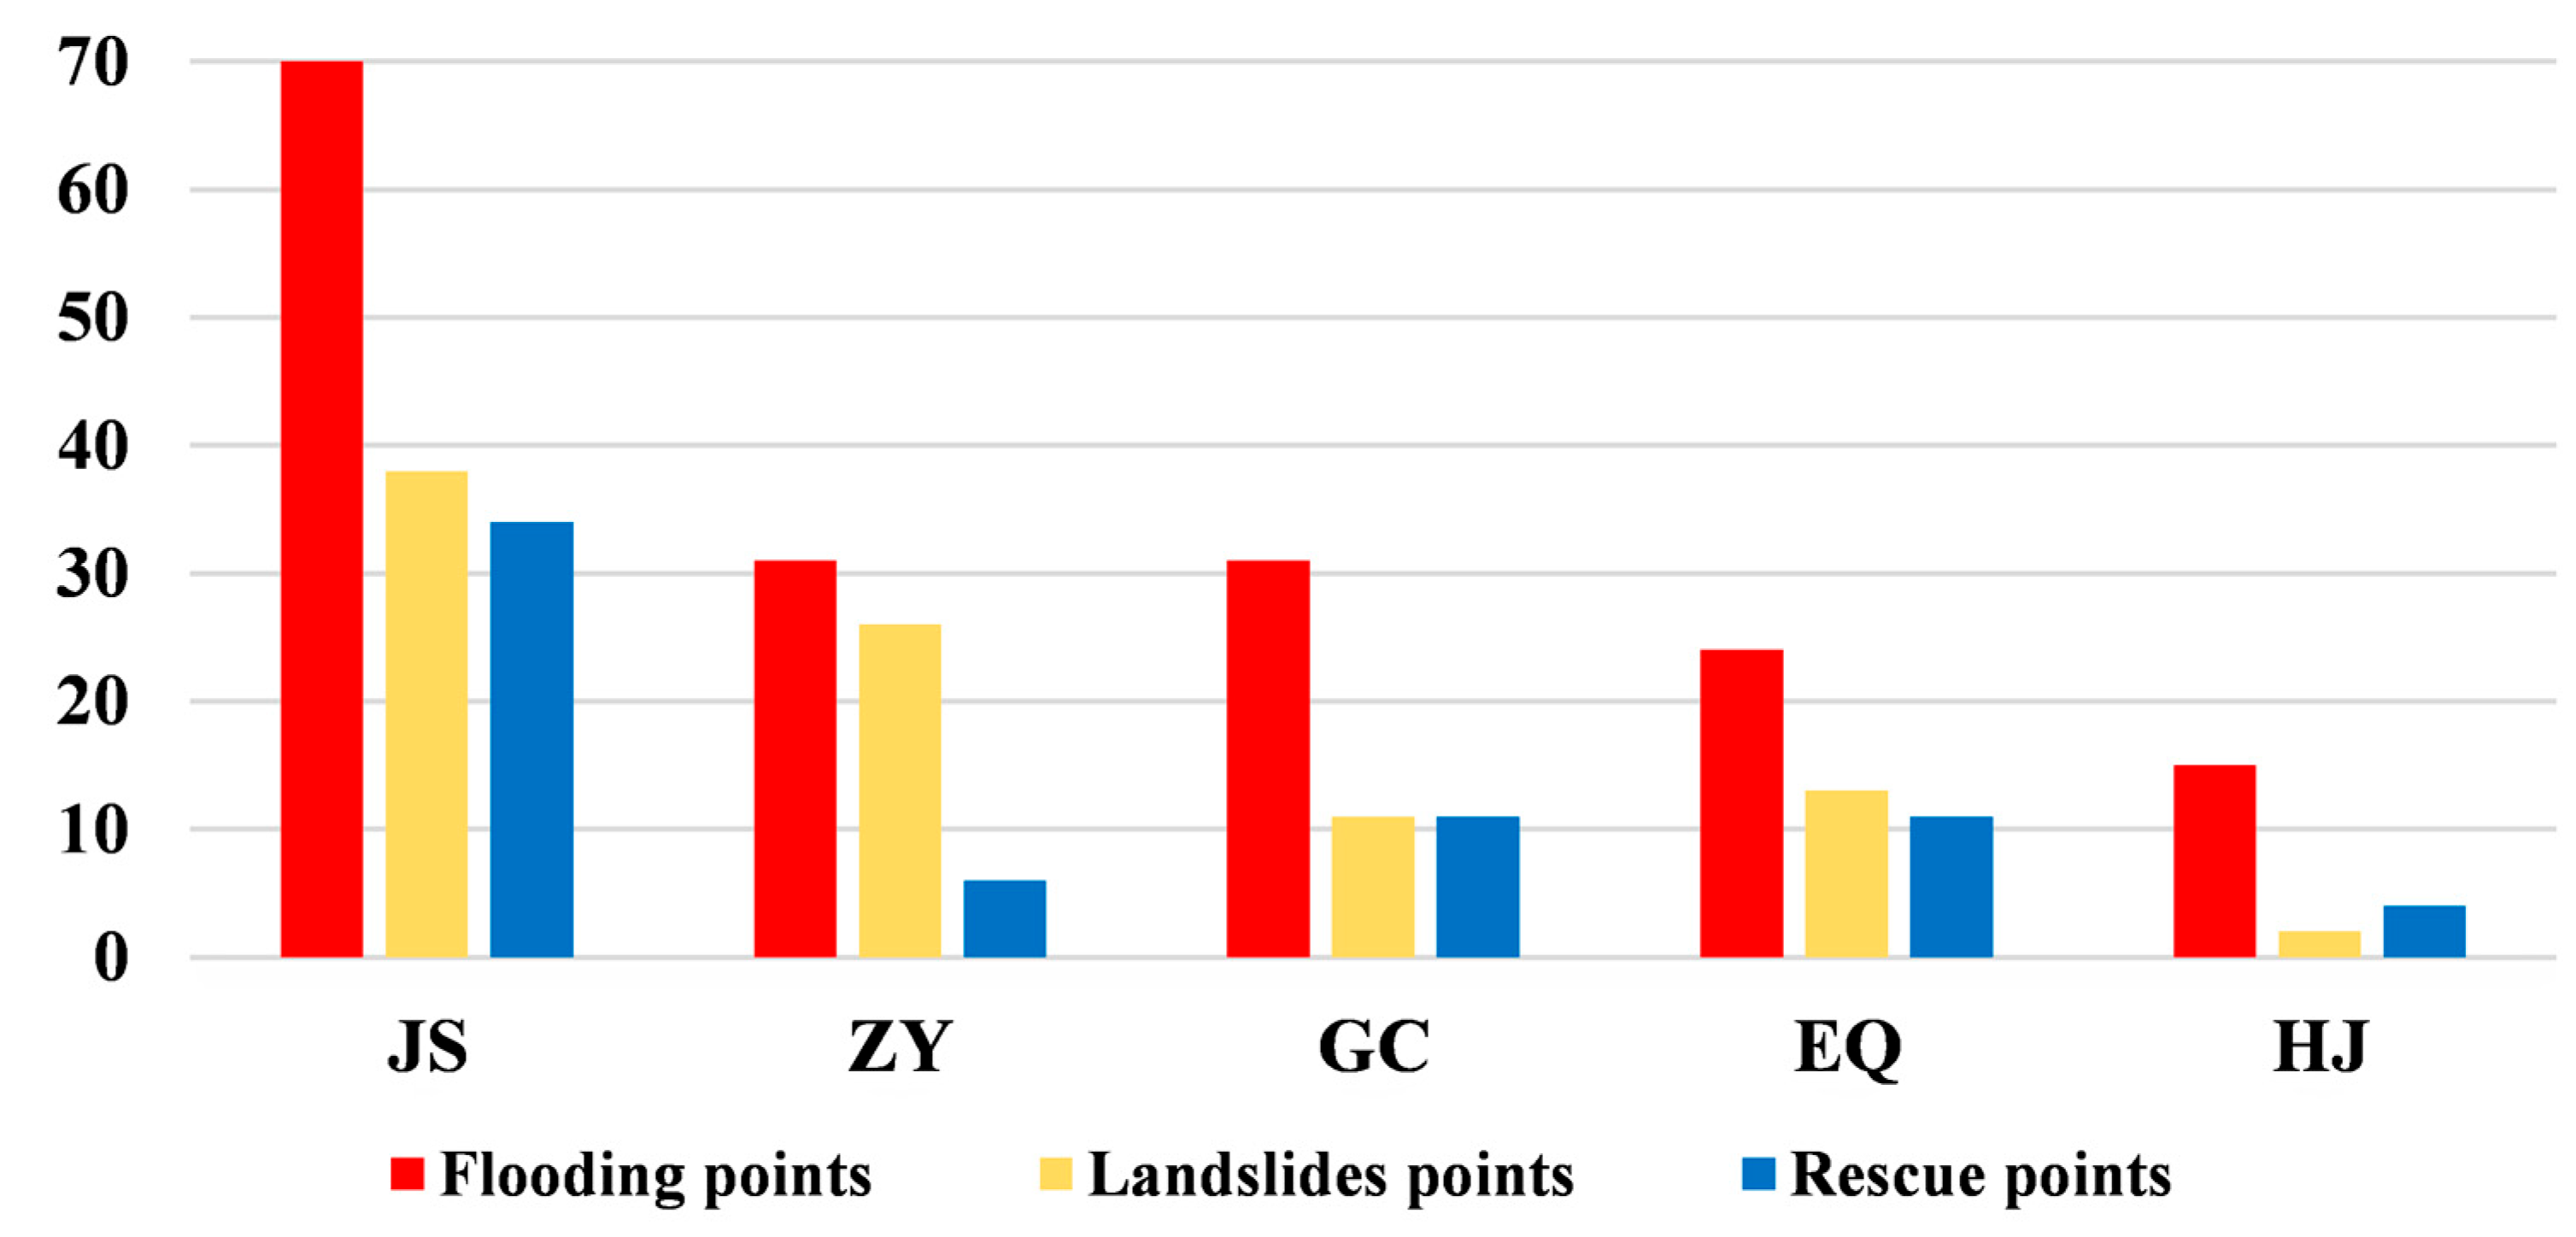
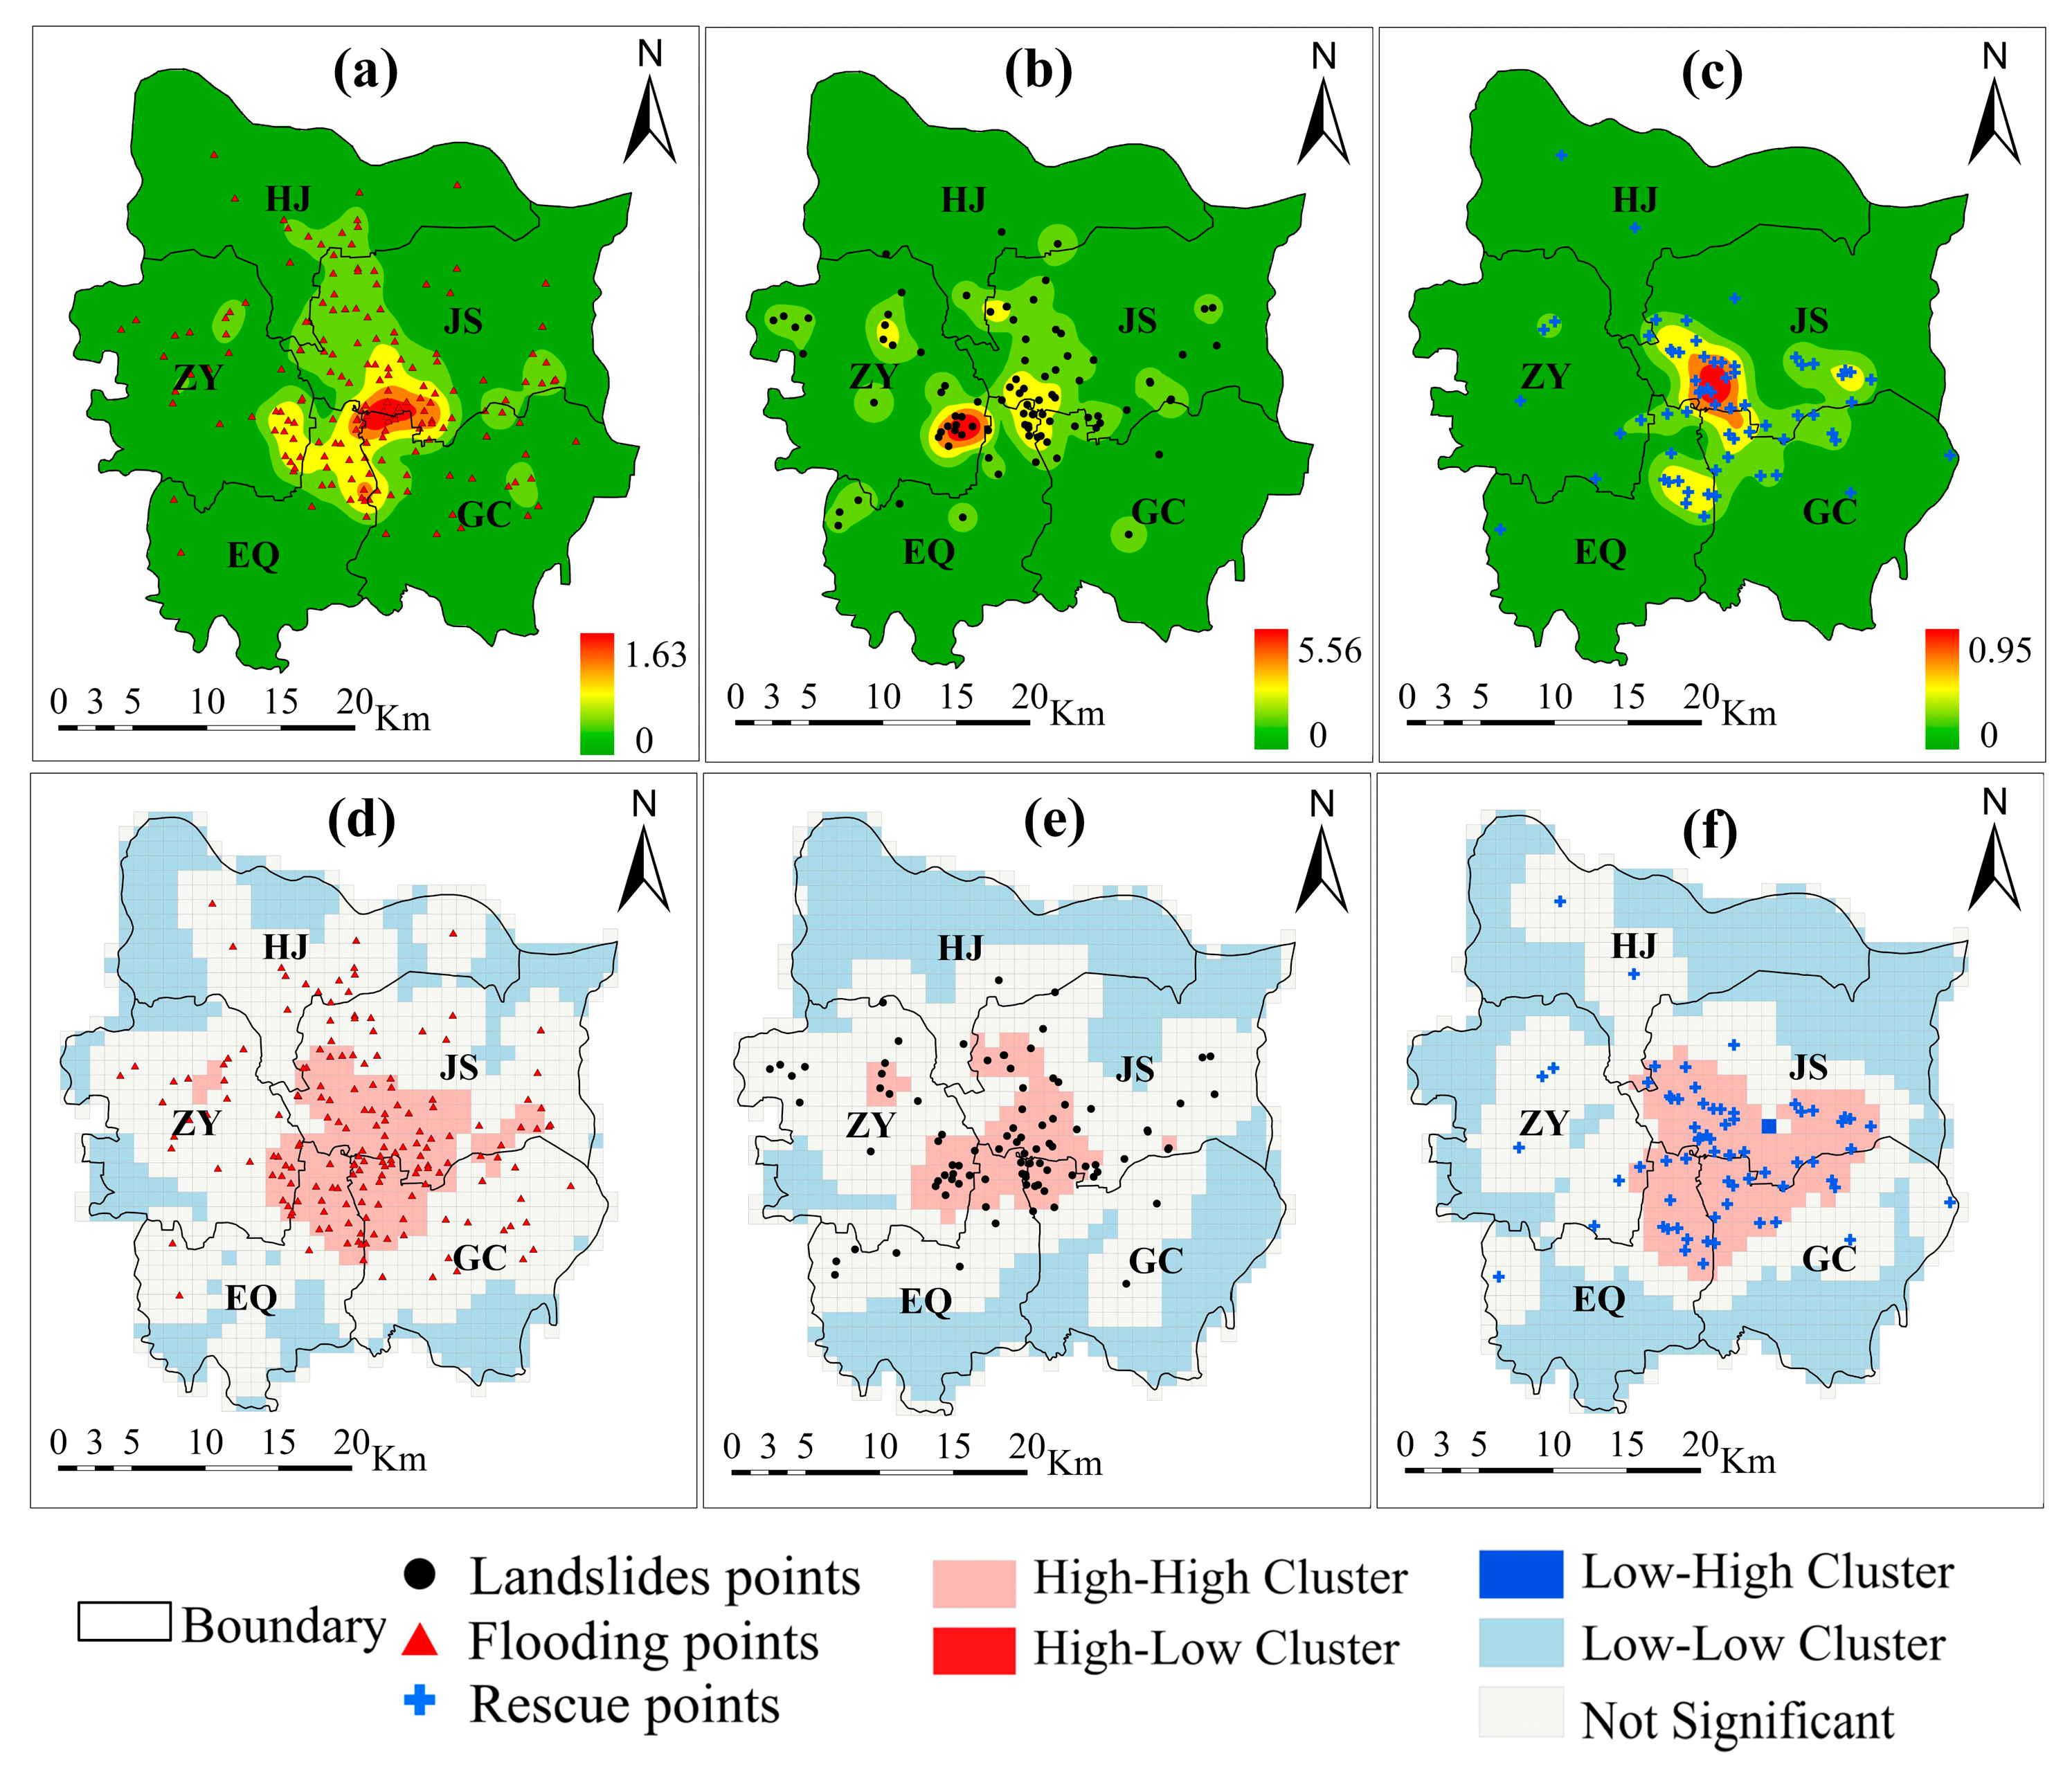
- Spatially, the research identified specific regions that exhibited higher susceptibility to flooding, landslides, and rescue points. These regions included the central region, characterized by low drainage standards and high-density urban areas, as well as the eastern region with low-lying terrain. This study also revealed the spatial and temporal dynamics of flood points, which shifted from the central region to the eastern region and eventually returned to the central region;
- (3)
- This study examined the spatial accessibility of rescue resources in real flood scenarios and found that their service coverage varied throughout the day during and after the disaster;
- (4)
- Social media data had advantages in extracting flood points in high-density urban areas, while SAR had advantages in monitoring floods in low-density urban areas at the city’s edges and large water bodies. The two could complement each other, to a certain extent.
Author Contributions
Funding
Data Availability Statement
Conflicts of Interest
References
- Deng, H.; Pepin, N.C.; Chen, Y.; Guo, B.; Zhang, S.; Zhang, Y.; Chen, X.; Gao, L.; Meibing, L.; Ying, C. Dynamics of Diurnal Precipitation Differences and Their Spatial Variations in China. J. Appl. Meteorol. Climatol. 2022, 61, 1015–1027. [Google Scholar] [CrossRef]
- Wang, Y.; Li, C.; Liu, M.; Cui, Q.; Wang, H.; Lv, J.; Li, B.; Xiong, Z.; Hu, Y. Spatial characteristics and driving factors of urban flooding in Chinese megacities. J. Hydrol. 2022, 613, 128464. [Google Scholar] [CrossRef]
- Wang, S.; Luo, P.; Xu, C.; Zhu, W.; Cao, Z.; Ly, S. Reconstruction of Historical Land Use and Urban Flood Simulation in Xi’an, Shannxi, China. Remote Sens. 2022, 14, 6067. [Google Scholar] [CrossRef]
- Khajehei, S.; Ahmadalipour, A.; Shao, W.; Moradkhani, H. A Place-based Assessment of Flash Flood Hazard and Vulnerability in the Contiguous United States. Sci. Rep. 2020, 10, 448. [Google Scholar] [CrossRef] [PubMed]
- Duan, W.; Zou, S.; Christidis, N.; Schaller, N.; Chen, Y.; Sahu, N.; Li, Z.; Fang, G.; Zhou, B. Changes in temporal inequality of precipitation extremes over China due to anthropogenic forcings. npj Clim. Atmos. Sci. 2022, 5, 33. [Google Scholar] [CrossRef]
- Cao, Z.; Zhu, W.; Luo, P.; Wang, S.; Tang, Z.; Zhang, Y.; Guo, B. Spatially Non-Stationary Relationships between Changing Environment and Water Yield Services in Watersheds of China’s Climate Transition Zones. Remote Sens. 2022, 14, 5078. [Google Scholar] [CrossRef]
- Liu, J.; Shao, W.; Xiang, C.; Mei, C.; Li, Z. Uncertainties of urban flood modeling: Influence of parameters for different underlying surfaces. Environ. Res. 2020, 182, 108929. [Google Scholar] [CrossRef]
- Luo, P.; Zheng, Y.; Wang, Y.; Zhang, S.; Yu, W.; Zhu, X.; Huo, A.; Wang, Z.; He, B.; Nover, D. Comparative Assessment of Sponge City Constructing in Public Awareness, Xi’an, China. Sustainability 2022, 14, 11653. [Google Scholar] [CrossRef]
- Dong, S.; Yu, T.; Farahmand, H.; Mostafavi, A. Probabilistic modeling of cascading failure risk in interdependent channel and road networks in urban flooding. Sustain. Cities Soc. 2020, 62, 102398. [Google Scholar] [CrossRef]
- Sohn, W.; Kim, J.-H.; Li, M.-H.; Brown, R. The influence of climate on the effectiveness of low impact development: A systematic review. J. Environ. Manag. 2019, 236, 365–379. [Google Scholar] [CrossRef]
- Hossain, B. Role of organizations in preparedness and emergency response to flood disaster in Bangladesh. Geoenviron. Disasters 2020, 7, 33. [Google Scholar] [CrossRef]
- Lumbroso, D.; Davison, M. Use of an agent-based model and Monte Carlo analysis to estimate the effectiveness of emergency management interventions to reduce loss of life during extreme floods. J. Flood Risk Manag. 2018, 11, S419–S433. [Google Scholar] [CrossRef]
- Ahmadalipour, A.; Moradkhani, H. A data-driven analysis of flash flood hazard, fatalities, and damages over the CONUS during 1996–2017. J. Hydrol. 2019, 578, 124106. [Google Scholar] [CrossRef]
- Luo, P.; Luo, M.; Li, F.; Qi, X.; Huo, A.; Wang, Z.; He, B.; Takara, K.; Nover, D.; Wang, Y. Urban flood numerical simulation: Research, methods and future perspectives. Environ. Model. Softw. 2022, 156, 105478. [Google Scholar] [CrossRef]
- Lin, L.; Wei, X.; Luo, P.; Wang, S.; Kong, D.; Yang, J. Ecological Security Patterns at Different Spatial Scales on the Loess Plateau. Remote Sens. 2023, 15, 1011. [Google Scholar] [CrossRef]
- Wang, X.; Luo, P.; Zheng, Y.; Duan, W.; Wang, S.; Zhu, W.; Zhang, Y.; Nover, D. Drought Disasters in China from 1991 to 2018: Analysis of Spatiotemporal Trends and Characteristics. Remote Sens. 2023, 15, 1708. [Google Scholar] [CrossRef]
- Fang, J.; Hu, J.; Shi, X.; Zhao, L. Assessing disaster impacts and response using social media data in China: A case study of 2016 Wuhan rainstorm. Int. J. Disaster Risk Reduct. 2019, 34, 275–282. [Google Scholar] [CrossRef]
- Zhu, W.; Cao, Z.; Luo, P.; Tang, Z.; Zhang, Y.; Hu, M.; He, B. Urban Flood-Related Remote Sensing: Research Trends, Gaps and Opportunities. Remote Sens. 2022, 14, 5505. [Google Scholar] [CrossRef]
- Schumann, G.J.P.; Moller, D.K. Microwave remote sensing of flood inundation. Phys. Chem. Earth Parts A/B/C 2015, 83–84, 84–95. [Google Scholar] [CrossRef]
- Songchon, C.; Wright, G.; Beevers, L. Quality assessment of crowdsourced social media data for urban flood management. Comput. Environ. Urban Syst. 2021, 90, 101690. [Google Scholar] [CrossRef]
- Lin, A.; Wu, H.; Liang, G.; Cardenas-Tristan, A.; Wu, X.; Zhao, C.; Li, D. A big data-driven dynamic estimation model of relief supplies demand in urban flood disaster. Int. J. Disaster Risk Reduct. 2020, 49, 101682. [Google Scholar] [CrossRef]
- Nkwunonwo, U.C.; Whitworth, M.; Baily, B. A review of the current status of flood modelling for urban flood risk management in the developing countries. Sci. Afr. 2020, 7, e00269. [Google Scholar] [CrossRef]
- De Albuquerque, J.P.; Herfort, B.; Brenning, A.; Zipf, A. A geographic approach for combining social media and authoritative data towards identifying useful information for disaster management. Int. J. Geogr. Inf. Sci. 2015, 29, 667–689. [Google Scholar] [CrossRef]
- Le Coz, J.; Patalano, A.; Collins, D.; Guillén, N.F.; García, C.M.; Smart, G.M.; Bind, J.; Chiaverini, A.; Le Boursicaud, R.; Dramais, G.; et al. Crowdsourced data for flood hydrology: Feedback from recent citizen science projects in Argentina, France and New Zealand. J. Hydrol. 2016, 541, 766–777. [Google Scholar] [CrossRef]
- Tan, L.; Schultz, D.M. Damage classification and recovery analysis of the Chongqing, China, floods of August 2020 based on social-media data. J. Clean. Prod. 2021, 313, 127882. [Google Scholar] [CrossRef]
- Wu, K.; Wu, J.; Ding, W.; Tang, R. Extracting disaster information based on Sina Weibo in China: A case study of the 2019 Typhoon Lekima. Int. J. Disaster Risk Reduct. 2021, 60, 102304. [Google Scholar] [CrossRef]
- Guo, B.; Wu, H.; Pei, L.; Zhu, X.; Zhang, D.; Wang, Y.; Luo, P. Study on the spatiotemporal dynamic of ground-level ozone concentrations on multiple scales across China during the blue sky protection campaign. Environ. Int. 2022, 170, 107606. [Google Scholar] [CrossRef]
- Fohringer, J.; Dransch, D.; Kreibich, H.; Schröter, K. Social media as an information source for rapid flood inundation mapping. Nat. Hazards Earth Syst. Sci. 2015, 15, 2725–2738. [Google Scholar] [CrossRef]
- Rosser, J.F.; Leibovici, D.G.; Jackson, M.J. Rapid flood inundation mapping using social media, remote sensing and topographic data. Nat. Hazards 2017, 87, 103–120. [Google Scholar] [CrossRef]
- Smith, L.; Liang, Q.; James, P.; Lin, W. Assessing the utility of social media as a data source for flood risk management using a real-time modelling framework. J. Flood Risk Manag. 2017, 10, 370–380. [Google Scholar] [CrossRef]
- Li, Z.; Wang, C.; Emrich, C.T.; Guo, D. A novel approach to leveraging social media for rapid flood mapping: A case study of the 2015 South Carolina floods. Cartogr. Geogr. Inf. Sci. 2018, 45, 97–110. [Google Scholar] [CrossRef]
- Zhang, Y.; Chen, Z.; Zheng, X.; Chen, N.; Wang, Y. Extracting the location of flooding events in urban systems and analyzing the semantic risk using social sensing data. J. Hydrol. 2021, 603, 127053. [Google Scholar] [CrossRef]
- Feng, Y.; Sester, M. Extraction of Pluvial Flood Relevant Volunteered Geographic Information (VGI) by Deep Learning from User Generated Texts and Photos. ISPRS Int. J. Geo-Inf. 2018, 7, 39. [Google Scholar] [CrossRef]
- Kankanamge, N.; Yigitcanlar, T.; Goonetilleke, A.; Kamruzzaman, M. Determining disaster severity through social media analysis: Testing the methodology with South East Queensland Flood tweets. Int. J. Disaster Risk Reduct. 2020, 42, 101360. [Google Scholar] [CrossRef]
- Cheng, X.; Han, G.; Zhao, Y.; Li, L. Evaluating Social Media Response to Urban Flood Disaster: Case Study on an East Asian City (Wuhan, China). Sustainability 2019, 11, 5330. [Google Scholar] [CrossRef]
- Wang, B.; Loo, B.P.Y.; Zhen, F.; Xi, G. Urban resilience from the lens of social media data: Responses to urban flooding in Nanjing, China. Cities 2020, 106, 102884. [Google Scholar] [CrossRef]
- Liu, F.; Liu, X.; Xu, T.; Yang, G.; Zhao, Y. Driving Factors and Risk Assessment of Rainstorm Waterlogging in Urban Agglomeration Areas: A Case Study of the Guangdong-Hong Kong-Macao Greater Bay Area, China. Water 2021, 13, 770. [Google Scholar] [CrossRef]
- Wang, Z.; Luo, P.; Zha, X.; Xu, C.; Kang, S.; Zhou, M.; Nover, D.; Wang, Y. Overview assessment of risk evaluation and treatment technologies for heavy metal pollution of water and soil. J. Clean. Prod. 2022, 379, 134043. [Google Scholar] [CrossRef]
- Gudes, O.; Varhol, R.; Sun, Q.; Meuleners, L. Investigating articulated heavy-vehicle crashes in Western Australia using a spatial approach. Accid. Anal. Prev. 2017, 106, 243–253. [Google Scholar] [CrossRef]
- Yoon, J.; Lee, S. Spatio-temporal patterns in pedestrian crashes and their determining factors: Application of a space-time cube analysis model. Accid. Anal. Prev. 2021, 161, 106291. [Google Scholar] [CrossRef]
- Zhao, Y.; Ge, L.; Liu, J.; Liu, H.; Yu, L.; Wang, N.; Zhou, Y.; Ding, X. Analyzing hemorrhagic fever with renal syndrome in Hubei Province, China: A space–time cube-based approach. J. Int. Med. Res. 2019, 47, 3371–3388. [Google Scholar] [CrossRef] [PubMed]
- Li, M.; Kwan, M.-P.; Yin, J.; Yu, D.; Wang, J. The potential effect of a 100-year pluvial flood event on metro accessibility and ridership: A case study of central Shanghai, China. Appl. Geogr. 2018, 100, 21–29. [Google Scholar] [CrossRef]
- Yin, J.; Jing, Y.; Yu, D.; Ye, M.; Yang, Y.; Liao, B. A Vulnerability Assessment of Urban Emergency in Schools of Shanghai. Sustainability 2019, 11, 349. [Google Scholar] [CrossRef]
- Yin, J.; Yu, D.; Lin, N.; Wilby, R.L. Evaluating the cascading impacts of sea level rise and coastal flooding on emergency response spatial accessibility in Lower Manhattan, New York City. J. Hydrol. 2017, 555, 648–658. [Google Scholar] [CrossRef]
- Masuya, A.; Dewan, A.; Corner, R.J. Population evacuation: Evaluating spatial distribution of flood shelters and vulnerable residential units in Dhaka with geographic information systems. Nat. Hazards 2015, 78, 1859–1882. [Google Scholar] [CrossRef]
- Shi, Y.; Wen, J.; Xi, J.; Xu, H.; Shan, X.; Yao, Q. A Study on Spatial Accessibility of the Urban Tourism Attraction Emergency Response under the Flood Disaster Scenario. Complexity 2020, 2020, 9031751. [Google Scholar] [CrossRef]
- Shi, Y.; Yao, Q.; Wen, J.; Xi, J.; Li, H.; Wang, Q. A spatial accessibility assessment of urban tourist attractions emergency response in Shanghai. Int. J. Disaster Risk Reduct. 2022, 74, 102919. [Google Scholar] [CrossRef]
- Yao, K.; Yang, S.; Tang, J. Rapid assessment of seismic intensity based on Sina Weibo—A case study of the changning earthquake in Sichuan Province, China. Int. J. Disaster Risk Reduct. 2021, 58, 102217. [Google Scholar] [CrossRef]
- Wu, Z.; Zhang, Y.; Chen, Q.; Wang, H. Attitude of Chinese public towards municipal solid waste sorting policy: A text mining study. Sci. Total Environ. 2021, 756, 142674. [Google Scholar] [CrossRef]
- Hou, G.; Chen, L. Regional commercial center identification based on POI big data in China. Arab. J. Geosci. 2021, 14, 1360. [Google Scholar] [CrossRef]
- Zhang, L.; Xia, J. Flood Detection Using Multiple Chinese Satellite Datasets during 2020 China Summer Floods. Remote Sens. 2022, 14, 51. [Google Scholar] [CrossRef]
- Dawei, W.; Hamzah, M.; Weng, N.G. Web crawler design, implementation and data analysis about Sina Weibo. In Proceedings of the 2019 3rd International Conference on Electronic Information Technology and Computer Engineering (EITCE), Xiamen, China, 18–20 October 2019; pp. 143–148. [Google Scholar] [CrossRef]
- Gao, F.; Li, S.; Tan, Z.; Liao, S. Visualizing the Spatiotemporal Characteristics of Dockless Bike Sharing Usage in Shenzhen, China. J. Geovis. Spat. Anal. 2022, 6, 12. [Google Scholar] [CrossRef]
- Huang, W.; DeVries, B.; Huang, C.; Lang, M.W.; Jones, J.W.; Creed, I.F.; Carroll, M.L. Automated Extraction of Surface Water Extent from Sentinel-1 Data. Remote Sens. 2018, 10, 797. [Google Scholar] [CrossRef]
- Jia, S.; Xue, D.; Li, C.; Zheng, J.; Li, W. Study on new method for water area information extraction based on Sentinel—1 data. Yangtze River 2019, 50, 213–217. [Google Scholar]
- Tian, P.; Liu, Y.; Li, J.; Pu, R.; Cao, L.; Zhang, H.; Ai, S.; Yang, Y. Mapping Coastal Aquaculture Ponds of China Using Sentinel SAR Images in 2020 and Google Earth Engine. Remote Sens. 2022, 14, 5372. [Google Scholar] [CrossRef]
- Huang, Q.; Cervone, G.; Zhang, G. A cloud-enabled automatic disaster analysis system of multi-sourced data streams: An example synthesizing social media, remote sensing and Wikipedia data. Comput. Environ. Urban Syst. 2017, 66, 23–37. [Google Scholar] [CrossRef]
- Yang, T.; Xie, J.; Li, G.; Zhang, L.; Mou, N.; Wang, H.; Zhang, X.; Wang, X. Extracting Disaster-Related Location Information through Social Media to Assist Remote Sensing for Disaster Analysis: The Case of the Flood Disaster in the Yangtze River Basin in China in 2020. Remote Sens. 2022, 14, 1199. [Google Scholar] [CrossRef]
- Zhang, Q.; Wu, Z.; Zhang, H.; Dalla Fontana, G.; Tarolli, P. Identifying dominant factors of waterlogging events in metropolitan coastal cities: The case study of Guangzhou, China. J. Environ. Manag. 2020, 271, 110951. [Google Scholar] [CrossRef]
- Kim, J.; Hastak, M. Social network analysis: Characteristics of online social networks after a disaster. Int. J. Inf. Manag. 2018, 38, 86–96. [Google Scholar] [CrossRef]
- Karunarathne, A.Y.; Lee, G. The geographies of the dynamic evolution of social networks for the flood disaster response and recovery. Appl. Geogr. 2020, 125, 102274. [Google Scholar] [CrossRef]


Disclaimer/Publisher’s Note: The statements, opinions and data contained in all publications are solely those of the individual author(s) and contributor(s) and not of MDPI and/or the editor(s). MDPI and/or the editor(s) disclaim responsibility for any injury to people or property resulting from any ideas, methods, instructions or products referred to in the content. |
© 2023 by the authors. Licensee MDPI, Basel, Switzerland. This article is an open access article distributed under the terms and conditions of the Creative Commons Attribution (CC BY) license (https://creativecommons.org/licenses/by/4.0/).
Share and Cite
Zhang, H.; Jia, H.; Liu, W.; Wang, J.; Xu, D.; Li, S.; Liu, X. Spatiotemporal Information Mining for Emergency Response of Urban Flood Based on Social Media and Remote Sensing Data. Remote Sens. 2023, 15, 4301. https://doi.org/10.3390/rs15174301
Zhang H, Jia H, Liu W, Wang J, Xu D, Li S, Liu X. Spatiotemporal Information Mining for Emergency Response of Urban Flood Based on Social Media and Remote Sensing Data. Remote Sensing. 2023; 15(17):4301. https://doi.org/10.3390/rs15174301
Chicago/Turabian StyleZhang, Hui, Hao Jia, Wenkai Liu, Junhao Wang, Dehe Xu, Shiming Li, and Xianlin Liu. 2023. "Spatiotemporal Information Mining for Emergency Response of Urban Flood Based on Social Media and Remote Sensing Data" Remote Sensing 15, no. 17: 4301. https://doi.org/10.3390/rs15174301