
Improving the Accuracy of Random Forest Classifier for Identifying Burned Areas in the Tangier-Tetouan-Al Hoceima Region Using Google Earth Engine

 , , ,
, , ,
Abstract
:1. Introduction
2. Materials and Methods
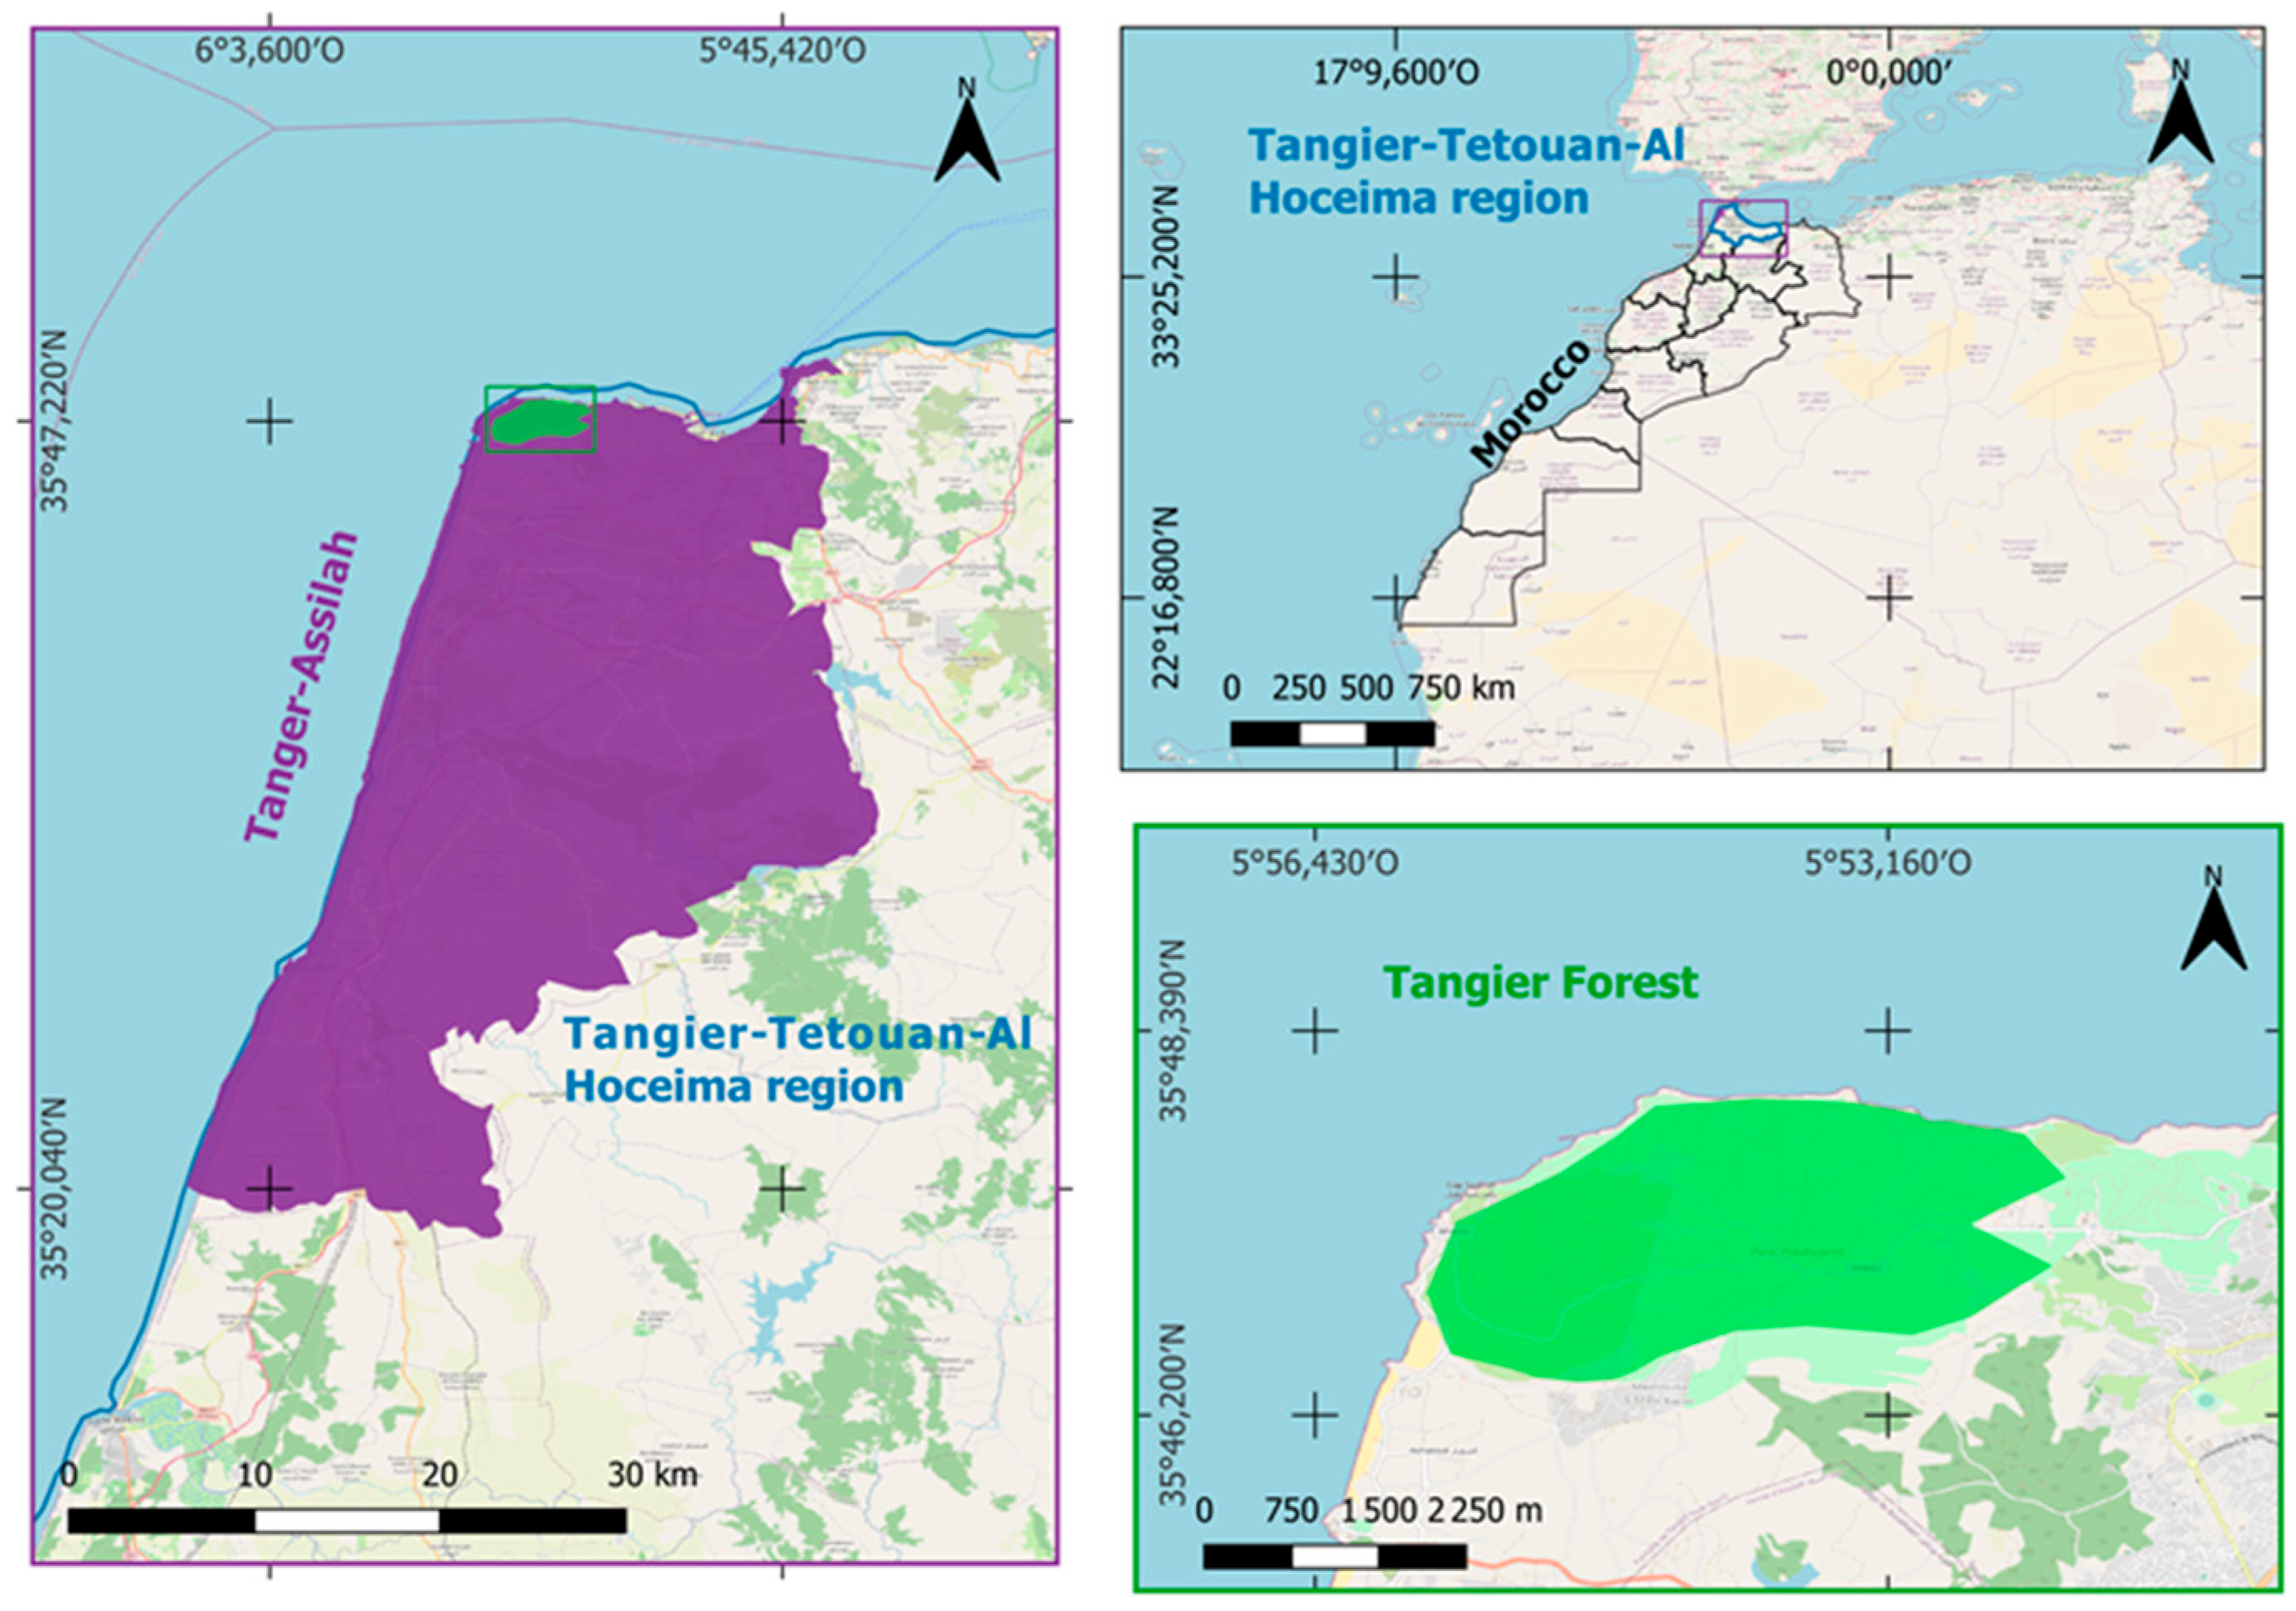
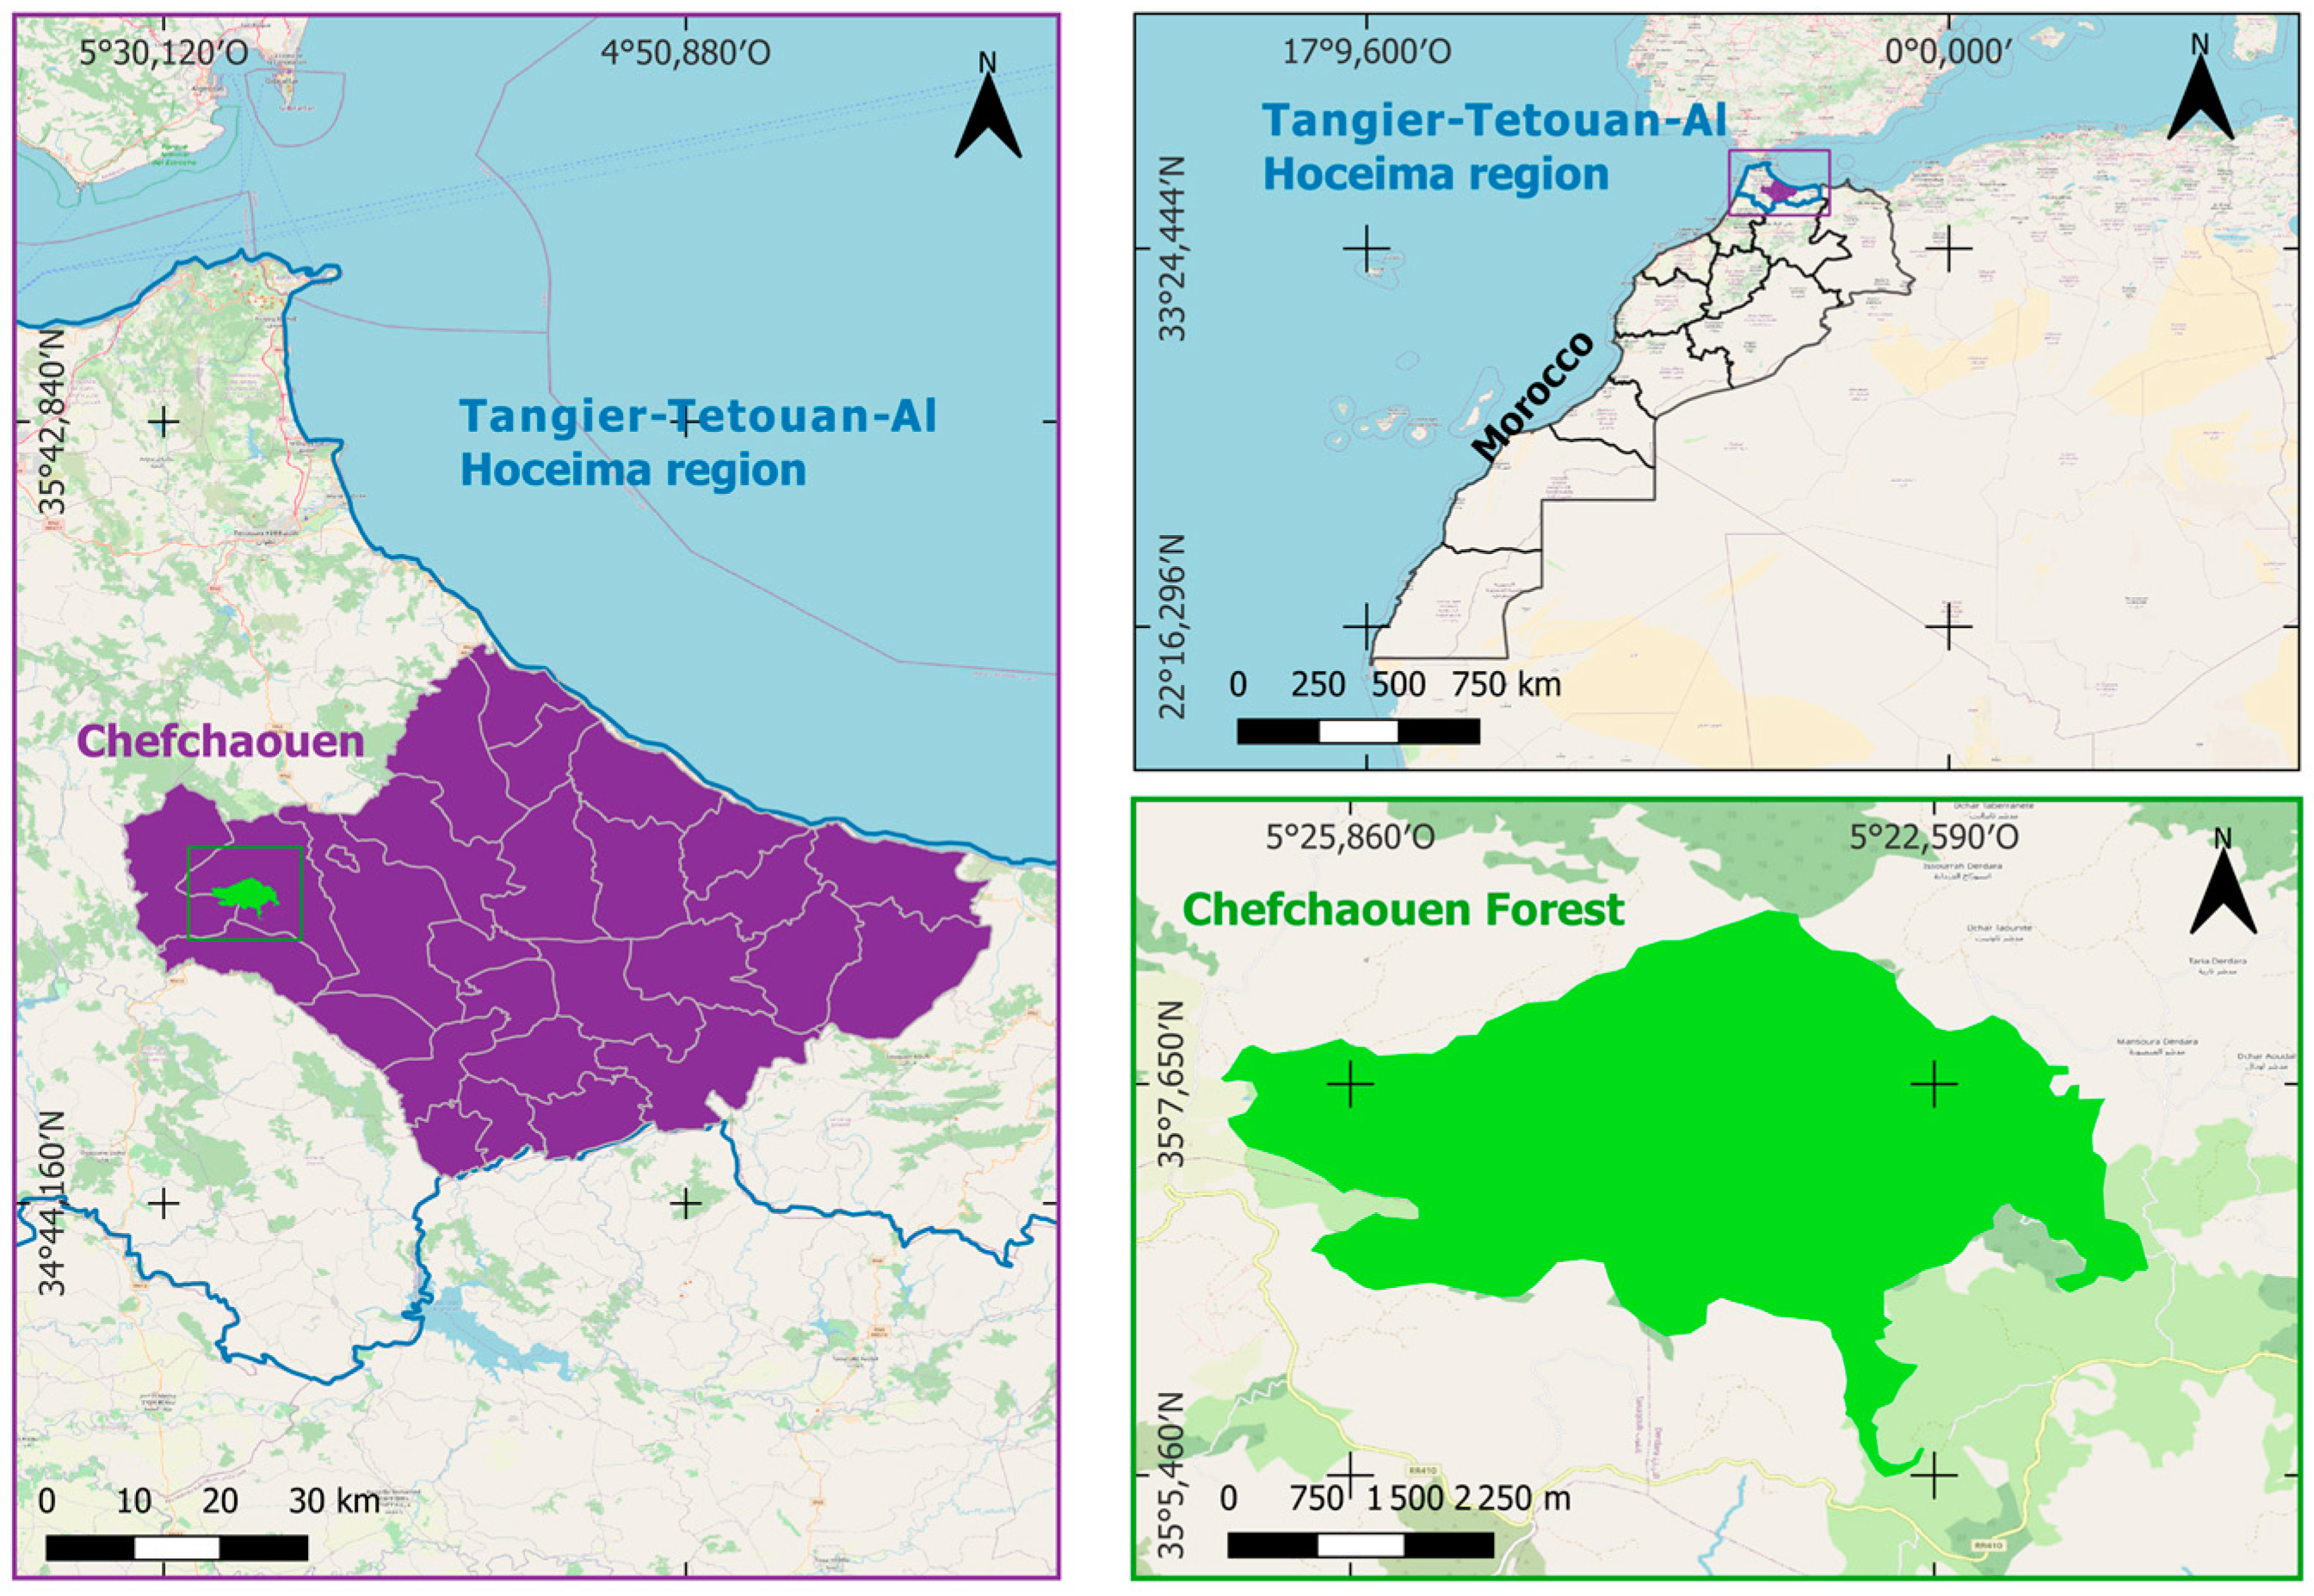
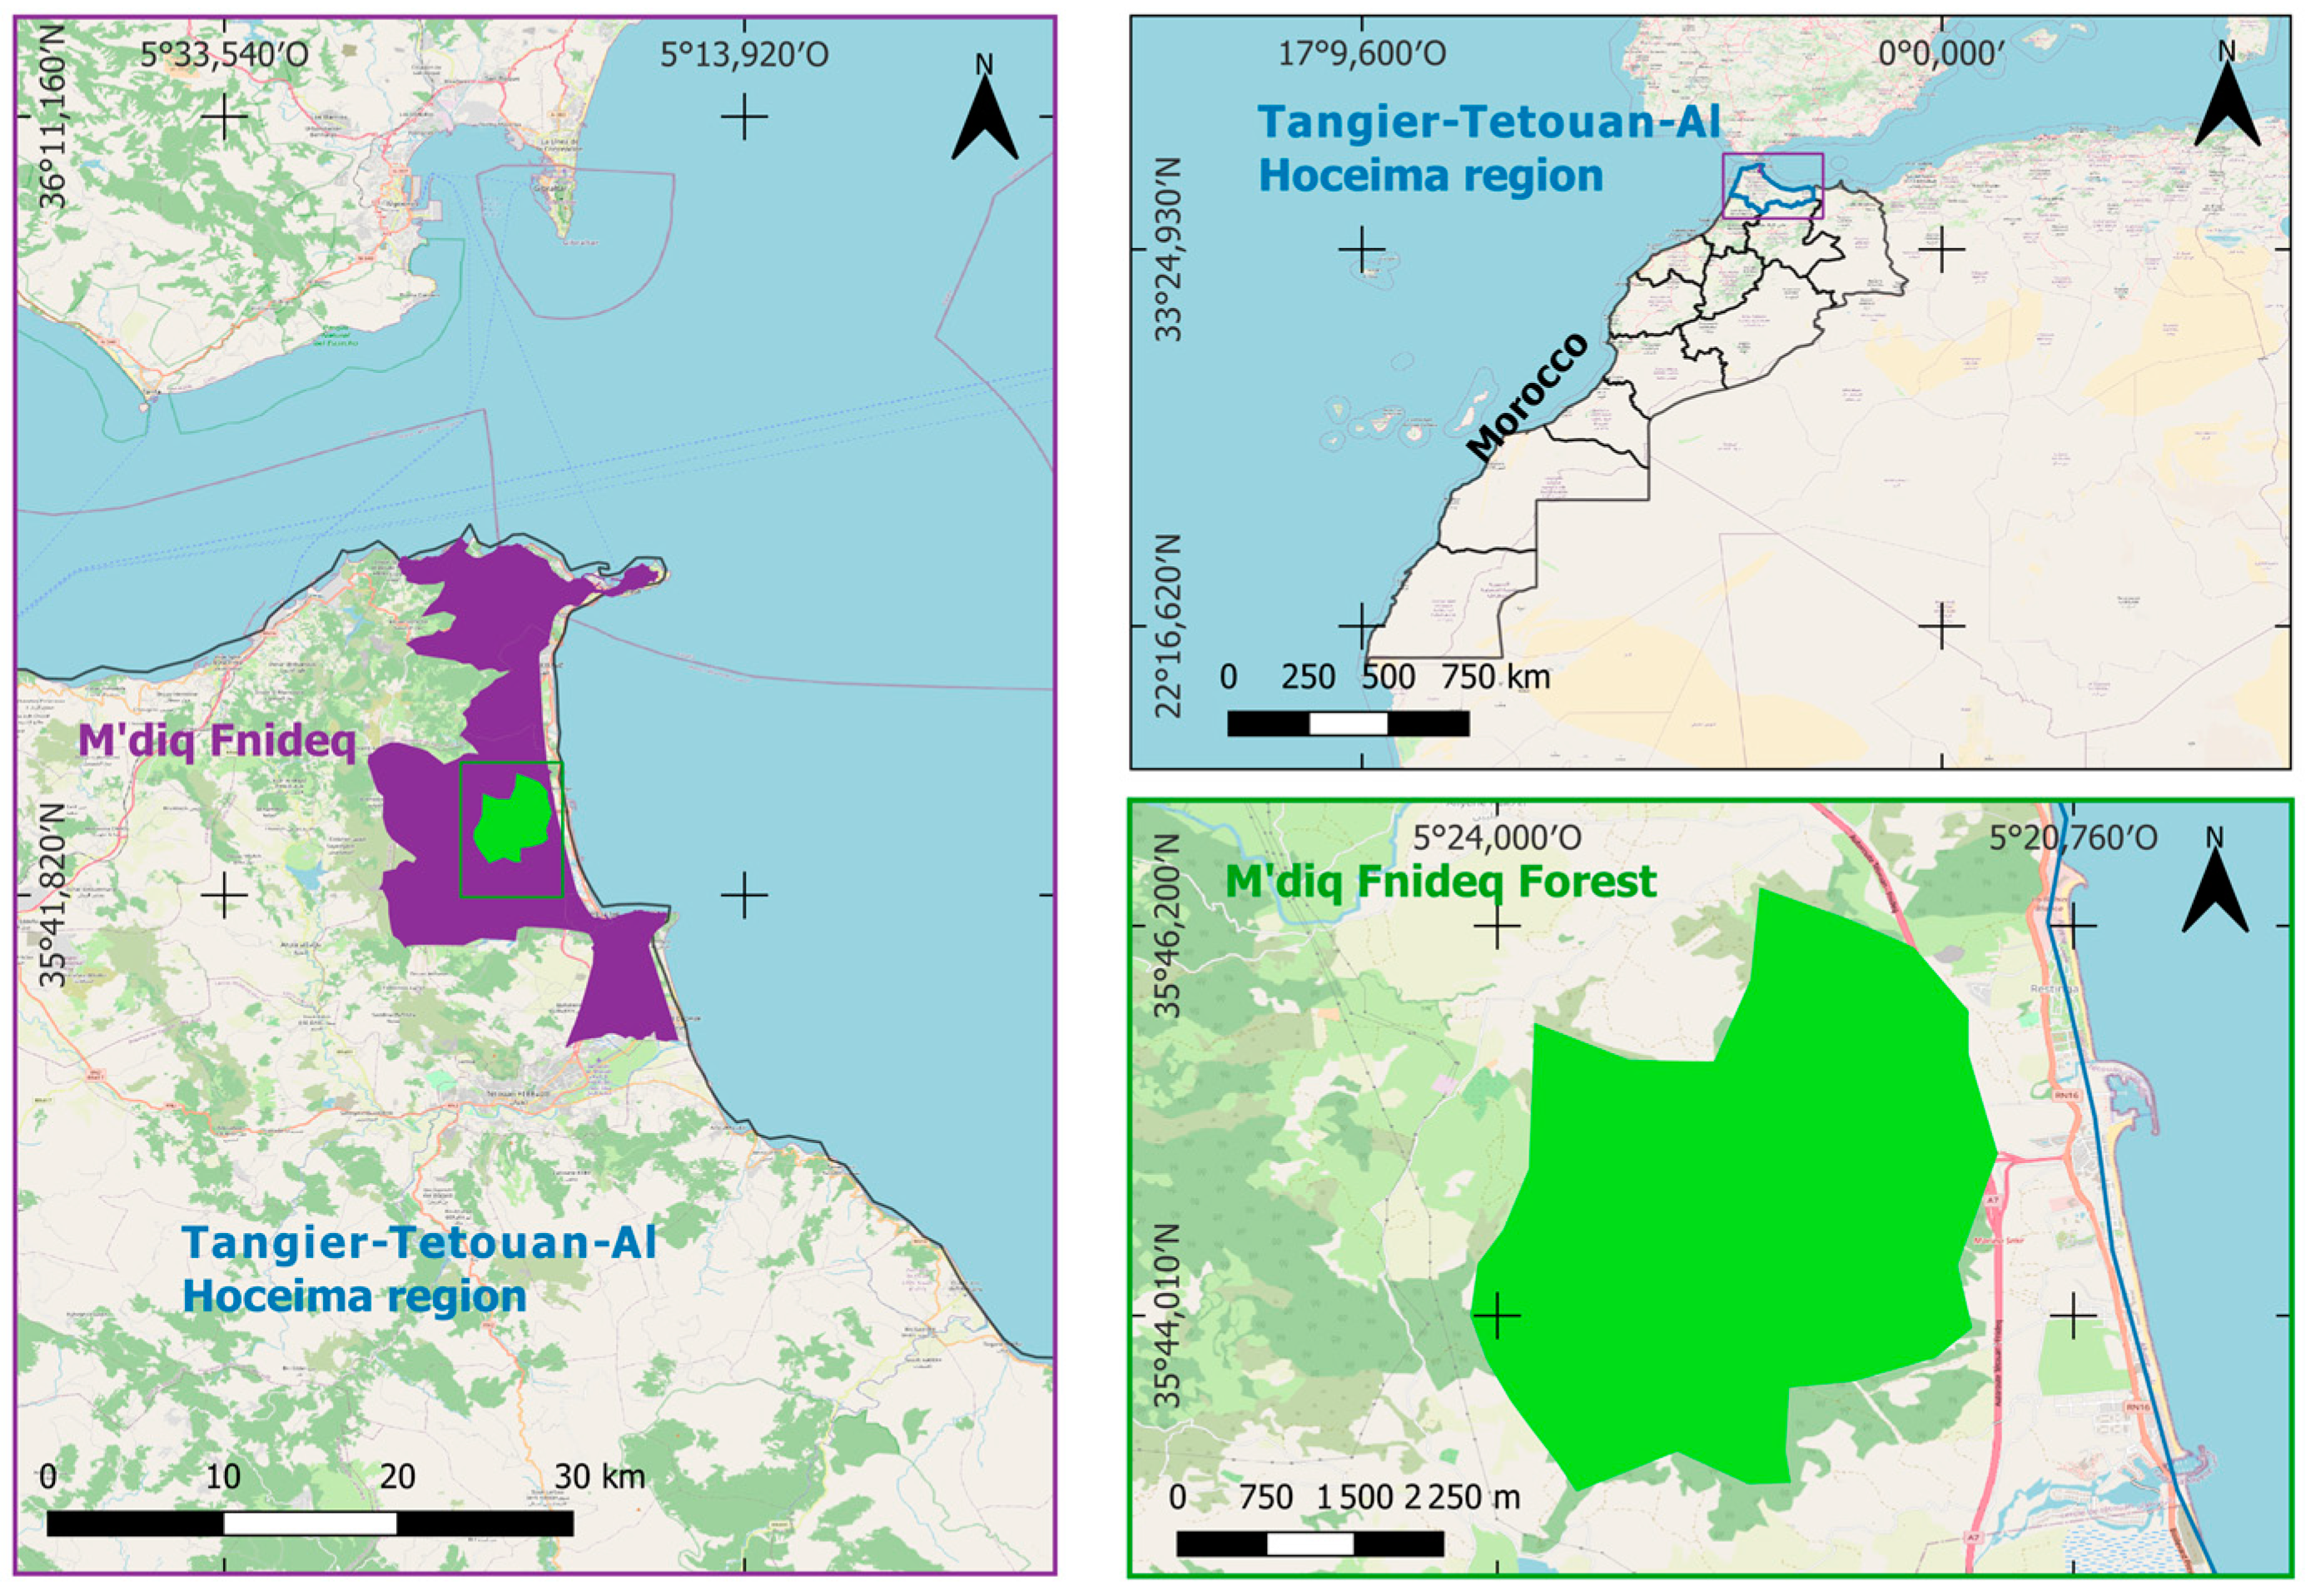
2.1. Study Areas
2.2. Data and Processing Tools
2.2.1. Harmonized Sentinel-2
2.2.2. Google Earth Engine (GEE) Platform
2.2.3. Random Forest Classifier
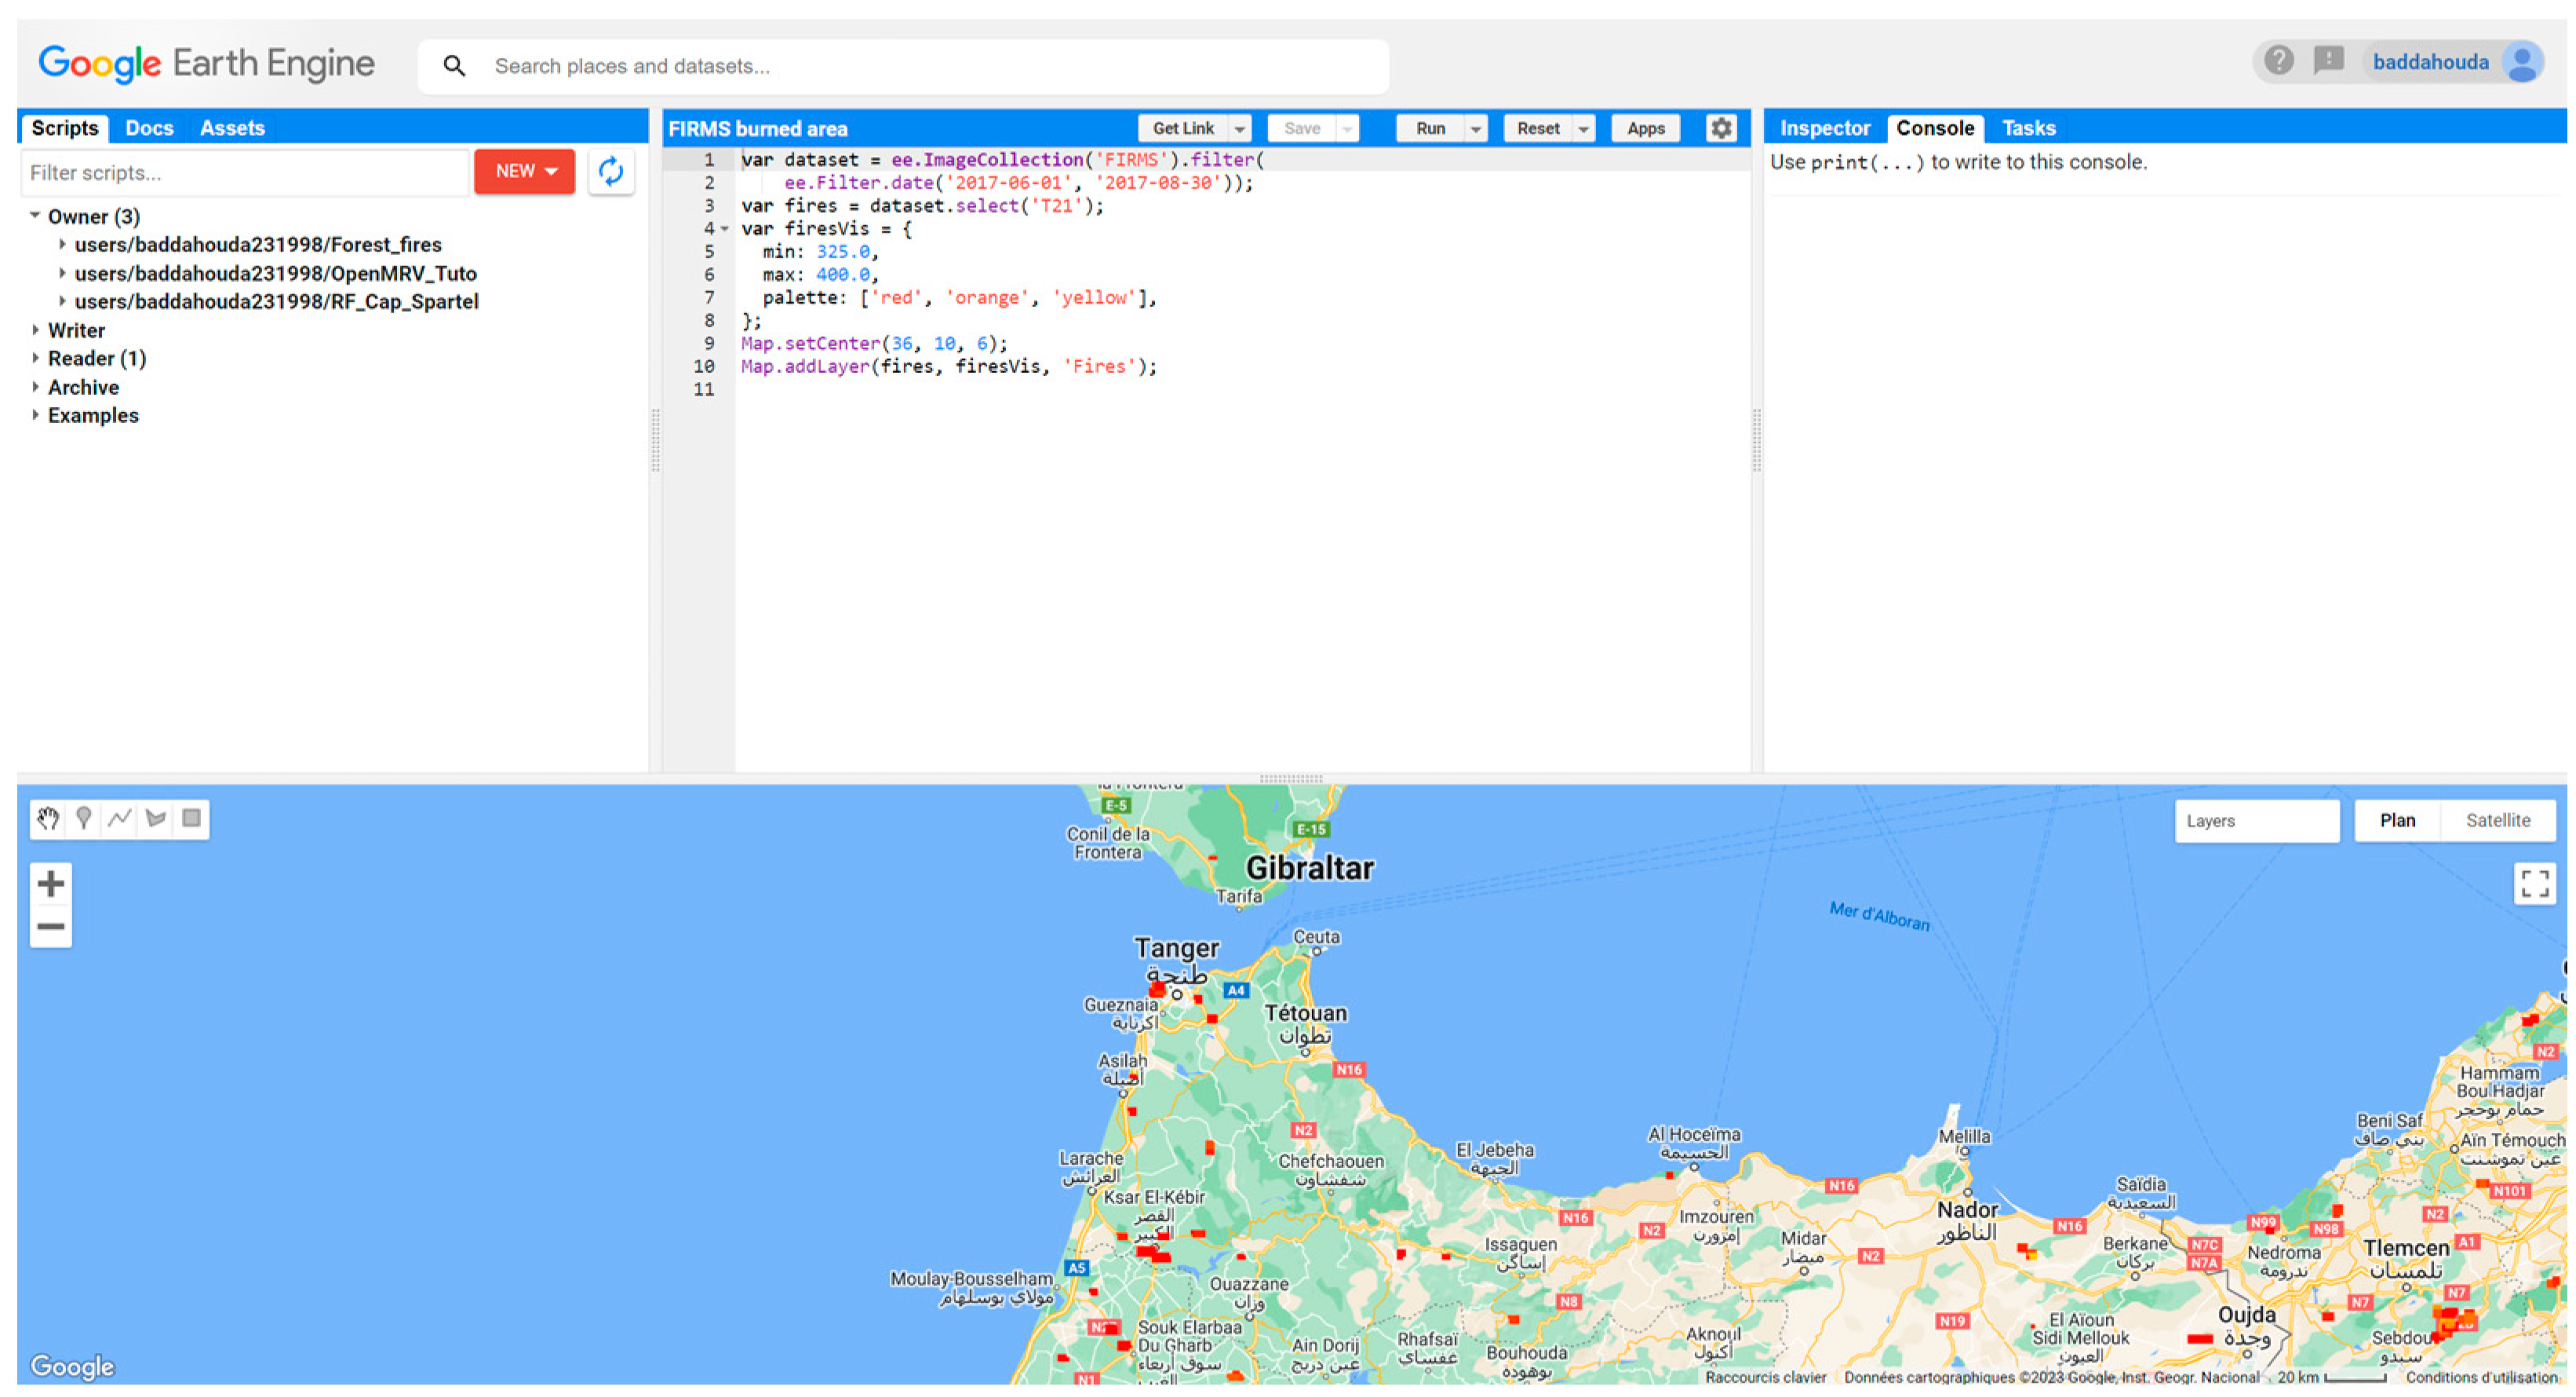
2.2.4. Fire Information for Resource Management System (FIRMS)
2.2.5. Global Land Analysis and Discovery (GLAD)
2.3. Data Processing
2.3.1. Spectral Indices
- Normalized burn ratio (NBR): The NBR is an index used to measure the severity of a fire based on the reflectance of the NIR and SWIR bands. For S2, we calculate it using the wavelengths of bands B8 and B12 [45]. A high NBR value generally indicates good vegetation, while a low NBR value indicates empty land and recently burned sites, as burned areas have high reflectance in the SWIR band and low reflectance in the NIR band [46,47]. It is calculated using Equation (1):dNBR is the differenced normalized burn ratio. It is calculated to estimate the severity of the fire [46], by subtracting the post-fire NBR image from the pre-fire NBR image, as follows:Burned areas have positive dNBR values, while unburned areas have negative or near zero values [48].
- Normalized difference vegetation index (NDVI): The NDVI index is the best known and most widely used vegetation index to quantify green vegetation in the near-infrared wavelength region and chlorophyll absorption in the red wavelength region [49]. The NDVI always varies between −1 and +1. Negative values usually indicate the presence of water, while values close to +1 indicate dense green leaves [50]. NDVI uses the NIR and red bands, with healthy vegetation reflecting more in the NIR but absorbing more in the red [50].dNDVI represents the subtraction of the Post-fire NDVI from the Pre-fire NDVI and it is calculated as follows:
- Soil adjusted vegetation index (SAVI): SAVI is similar to NDVI but with the addition of a “soil brightness correction factor” [51].where L is the soil adjustment factor of SAVI. The SAVI index ranges from −1.5 to 1.5 (Table 2) and was developed as a modification of the NDVI to correct for the effect of soil brightness when vegetation canopy is low [52]. Recent studies have revealed that the soil adjustment factor employed in the SAVI formula can occasionally take on negative values, particularly in instances of dense vegetation that exhibits resistance to saturation effects. In light of this observation, it is important to recognize that extreme conditions involving a negative soil adjustment factor can lead to alterations in the conventional SAVI index ranges. Similarly, like dNDVI, dSAVI is calculated by subtracting the post-fire SAVI from the pre-fire SAVI using the following equation:
- Burn Area Index (BAI): By analyzing the spectral distance between each pixel and a reference spectral point, this index is able to highlight the charcoal signal present in the red and near-infrared bands of post-fire images. This approach is effective because recently burned areas tend to exhibit distinct spectral characteristics [53,54,55]:We also calculated the difference between the Pre-fire BAI and the Post-fire BAI following the Equation (8):
2.3.2. Processing Steps
- The Confusion matrix: Presents a cross-tabulation of the class labels assigned by the classification of the map data against the reference data [66].
- Overall Accuracy: Determines the proportion of the total reference sites that were mapped correctly. This is usually presented as a percentage [67].
- Kappa coefficient: Compares the performance of the classification conducted to a random assignment of values [67].
- Consumer’s Accuracy: Indicates how often the class shown on the map will actually occur in the field [67].
3. Results and Discussion
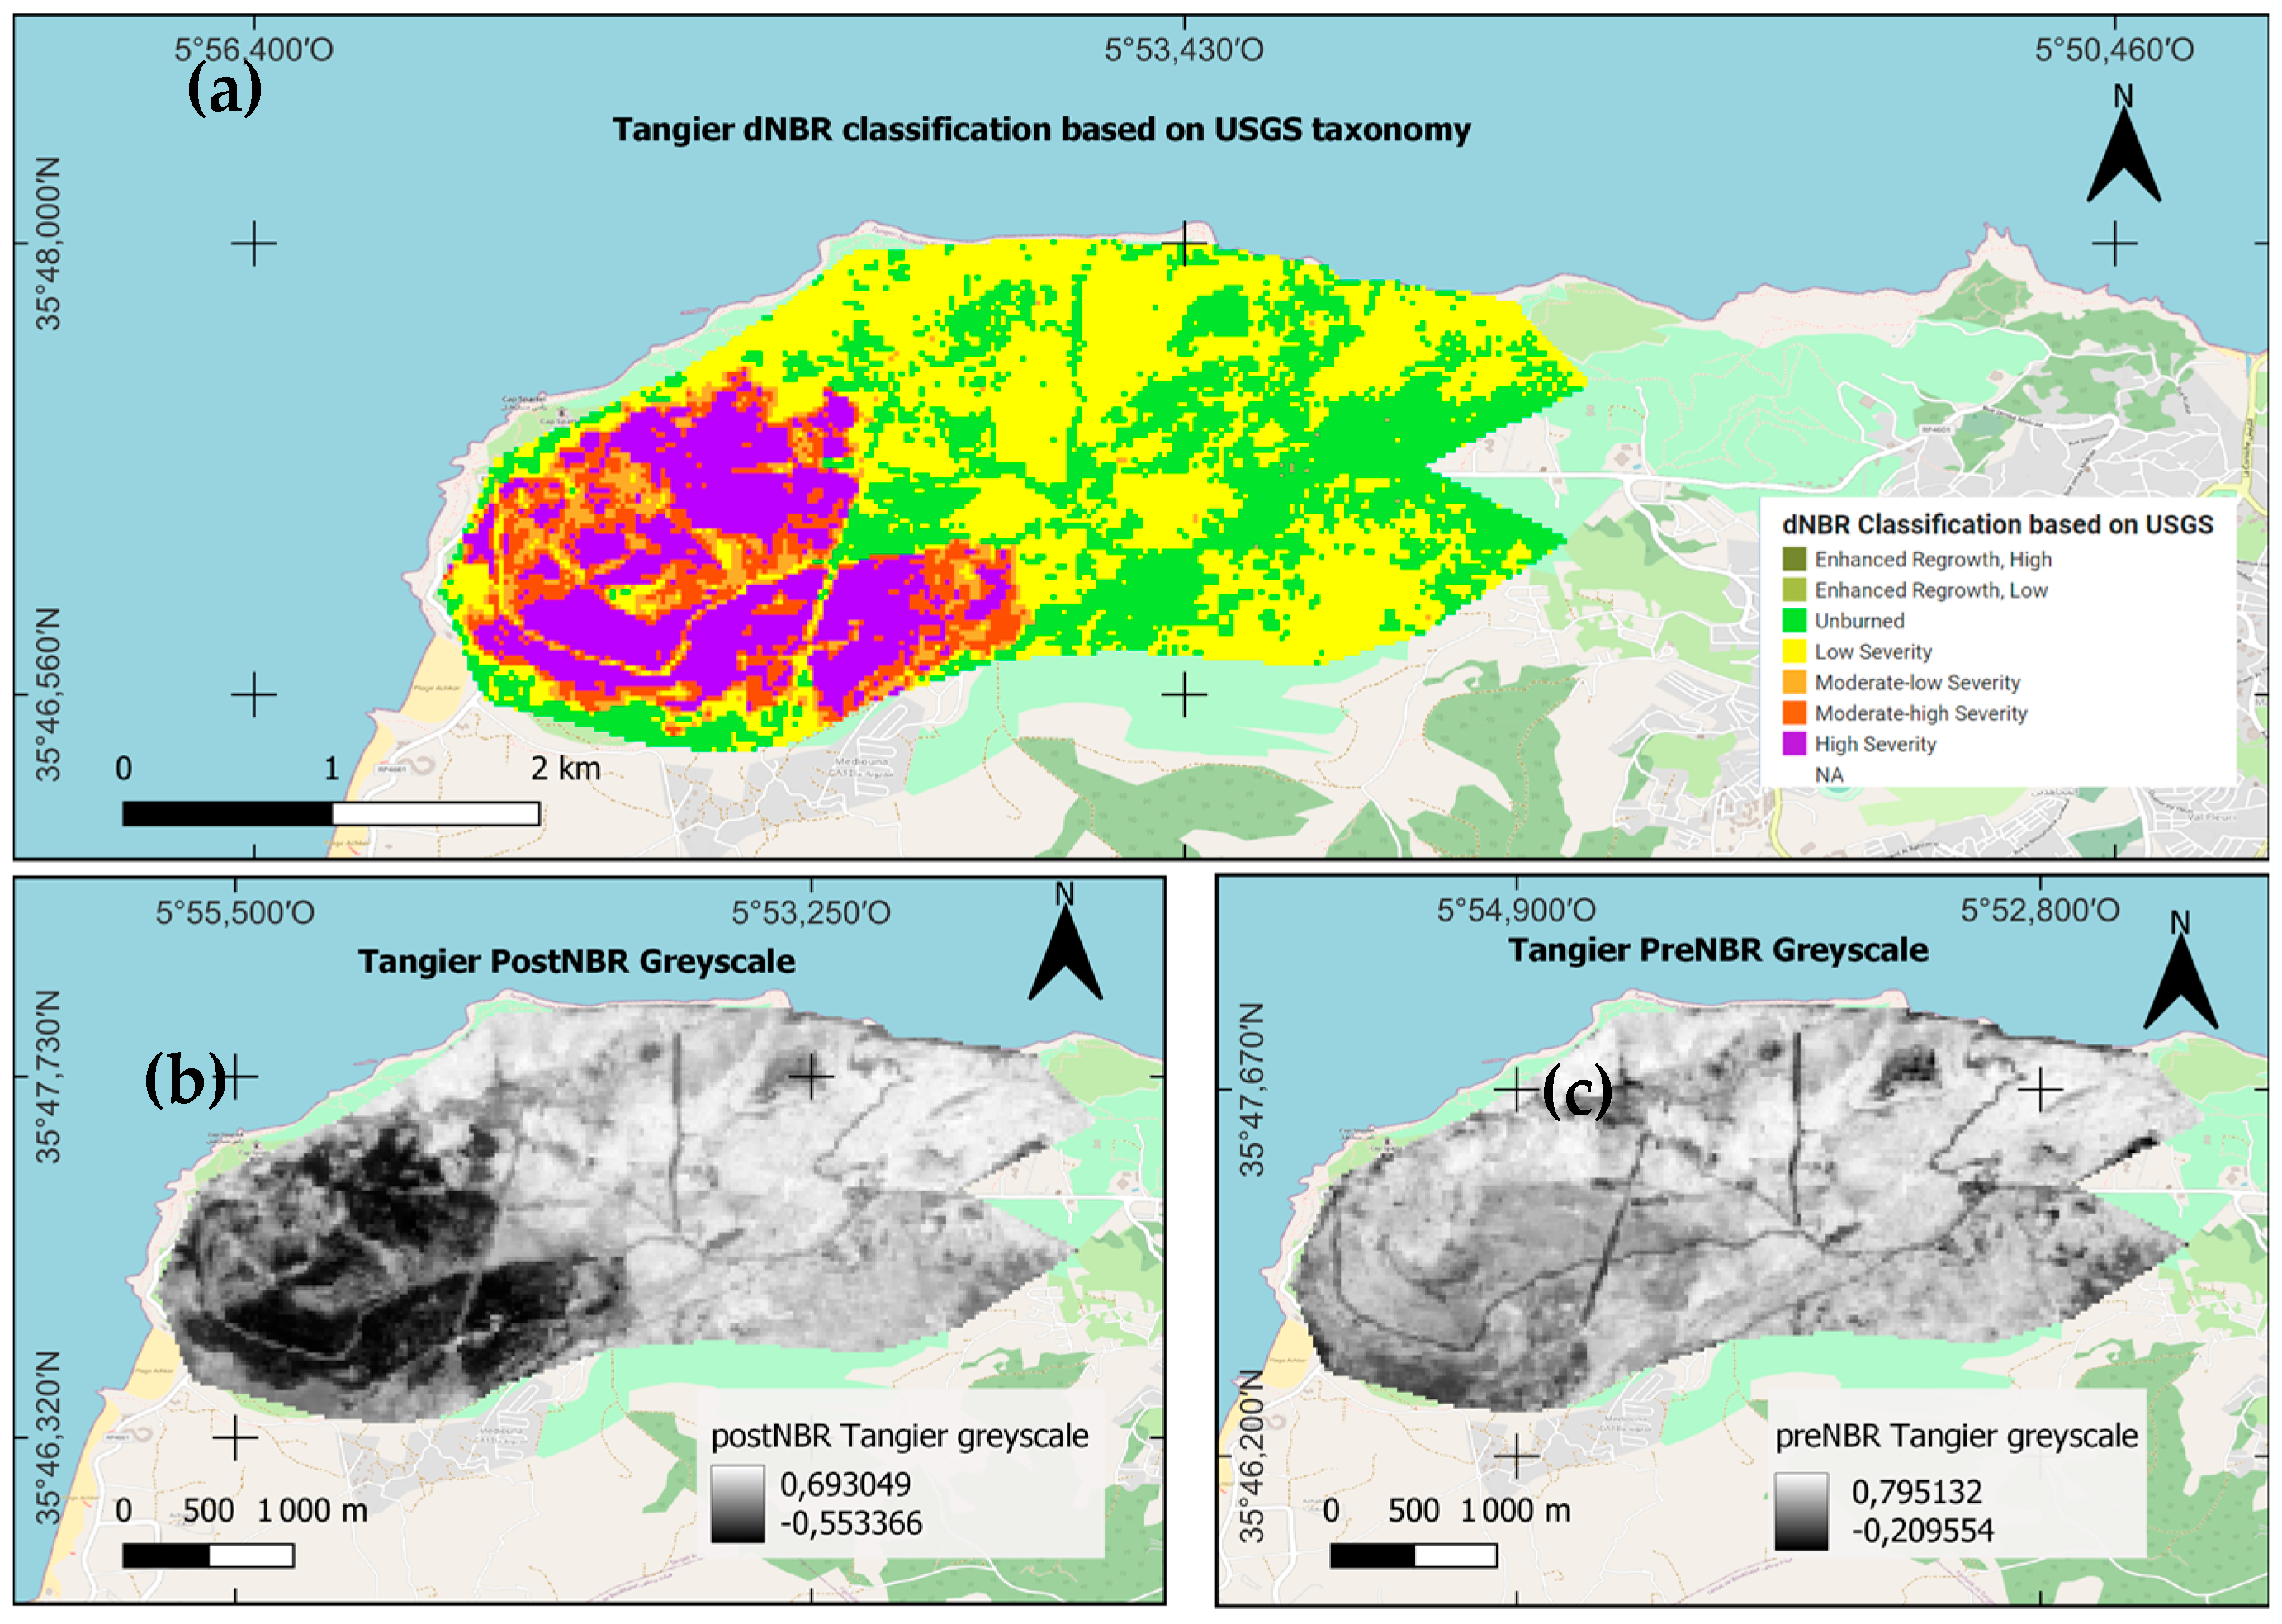
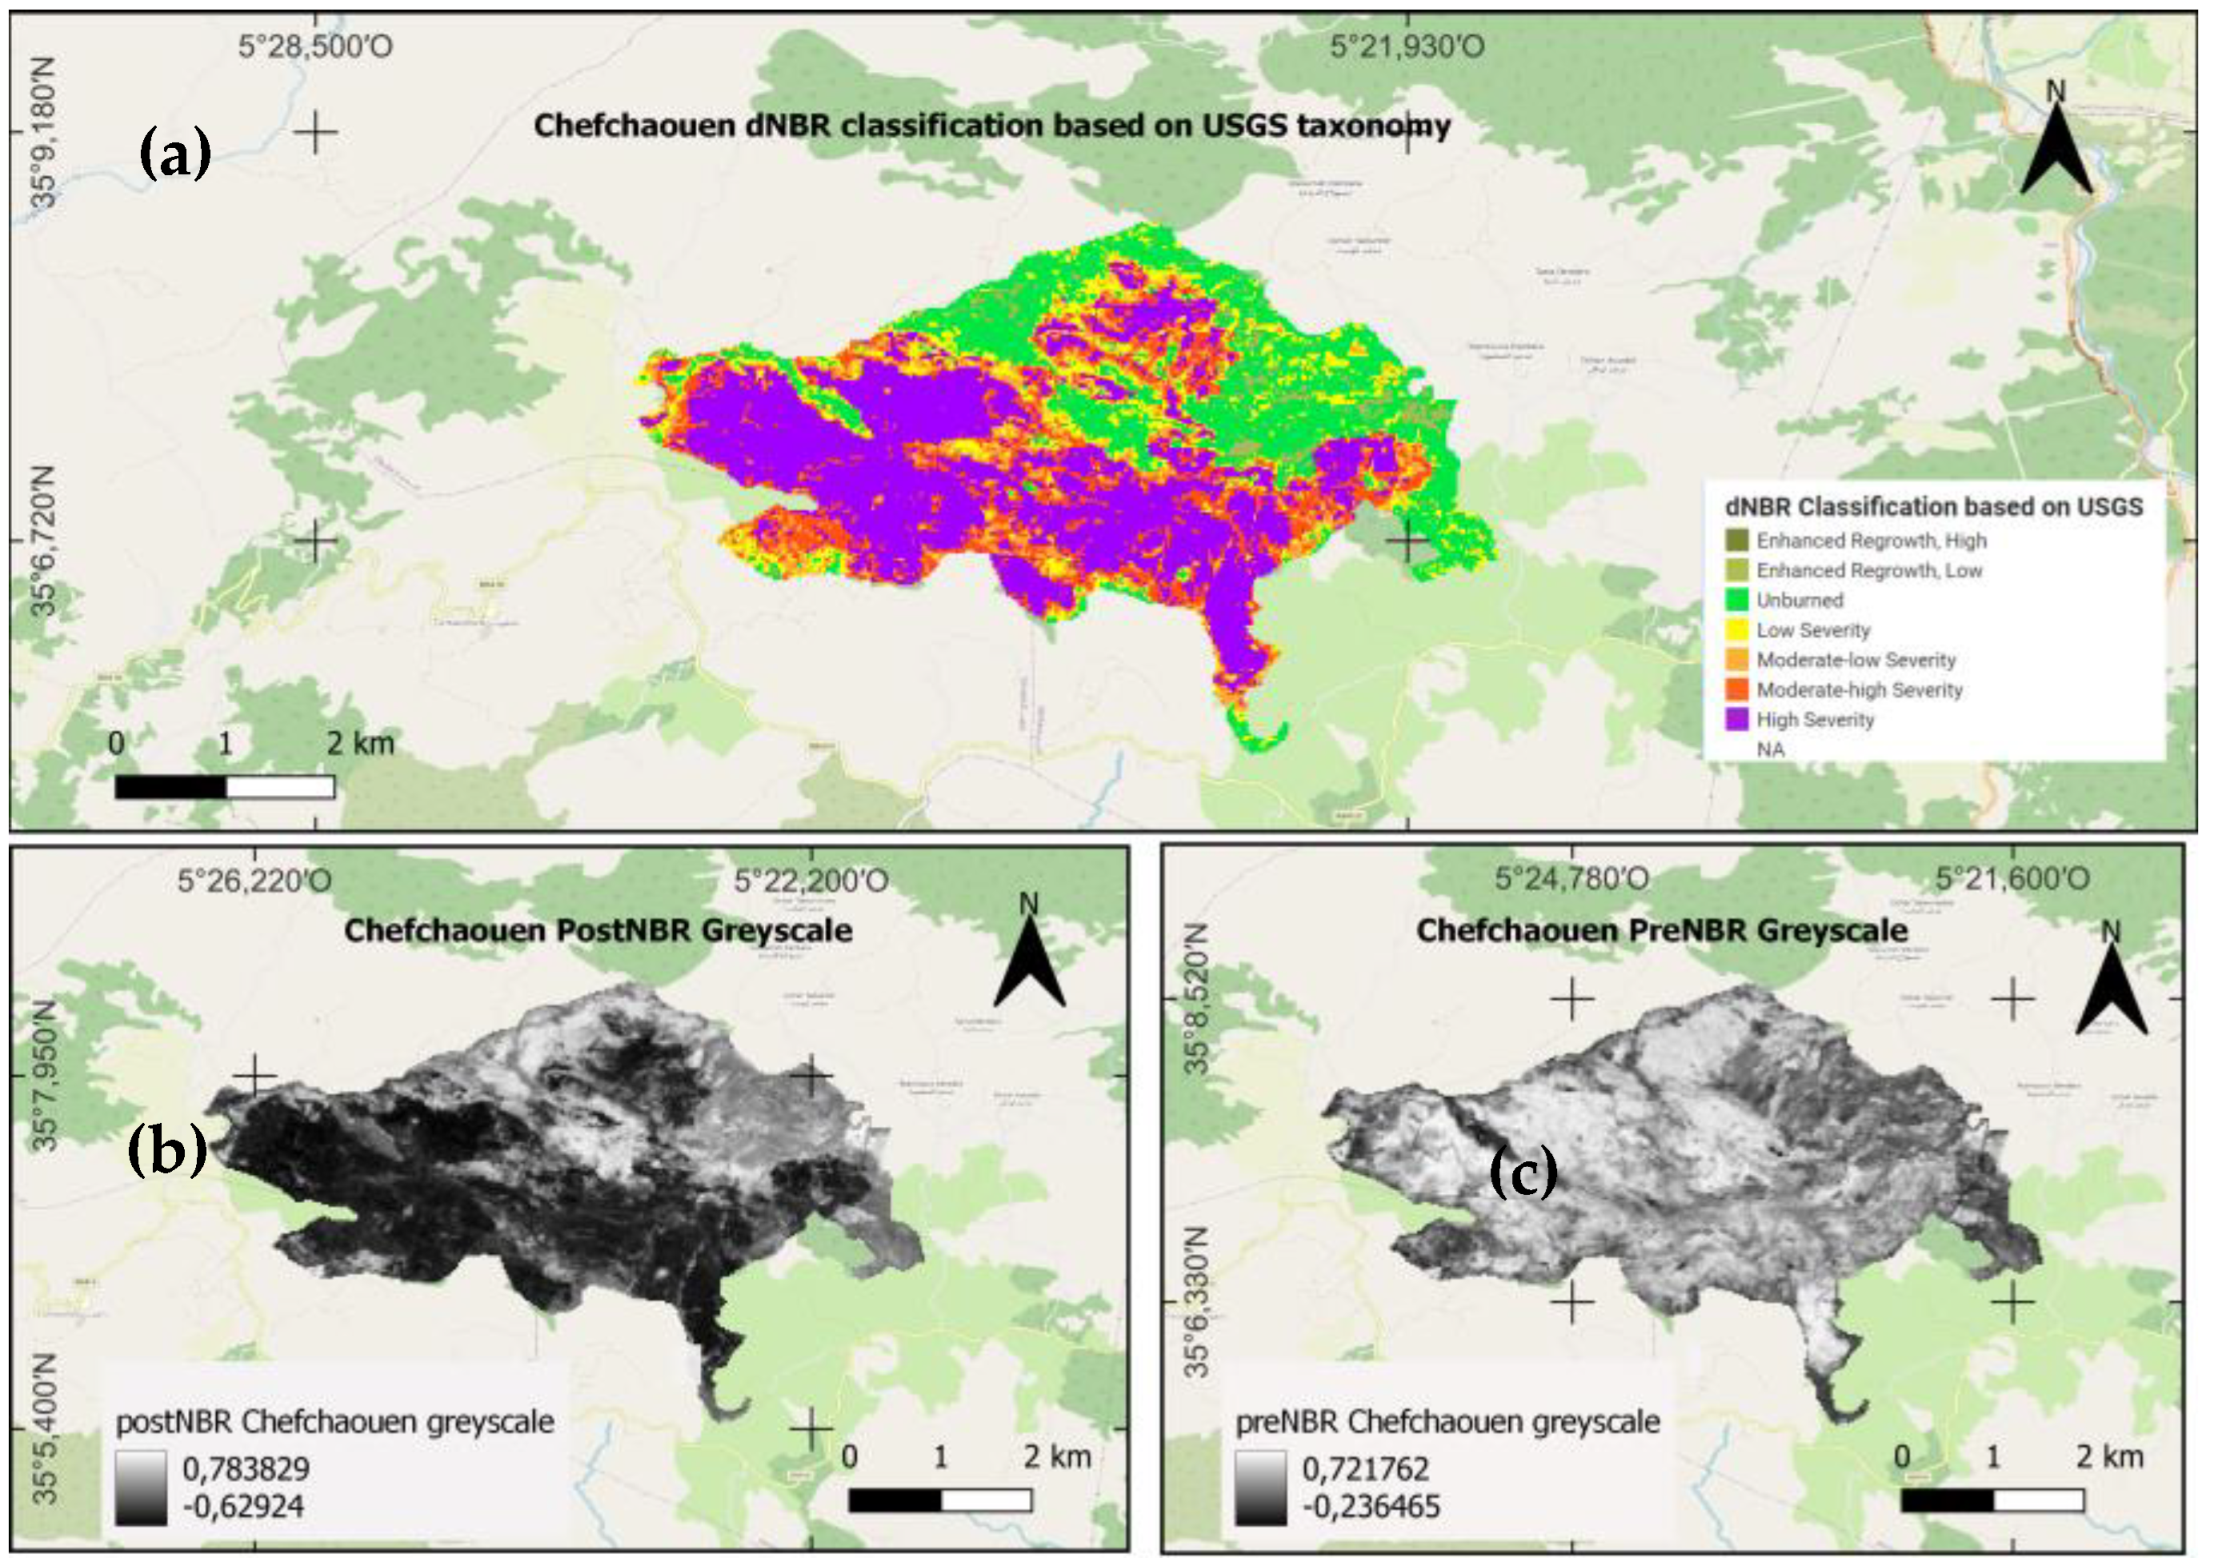
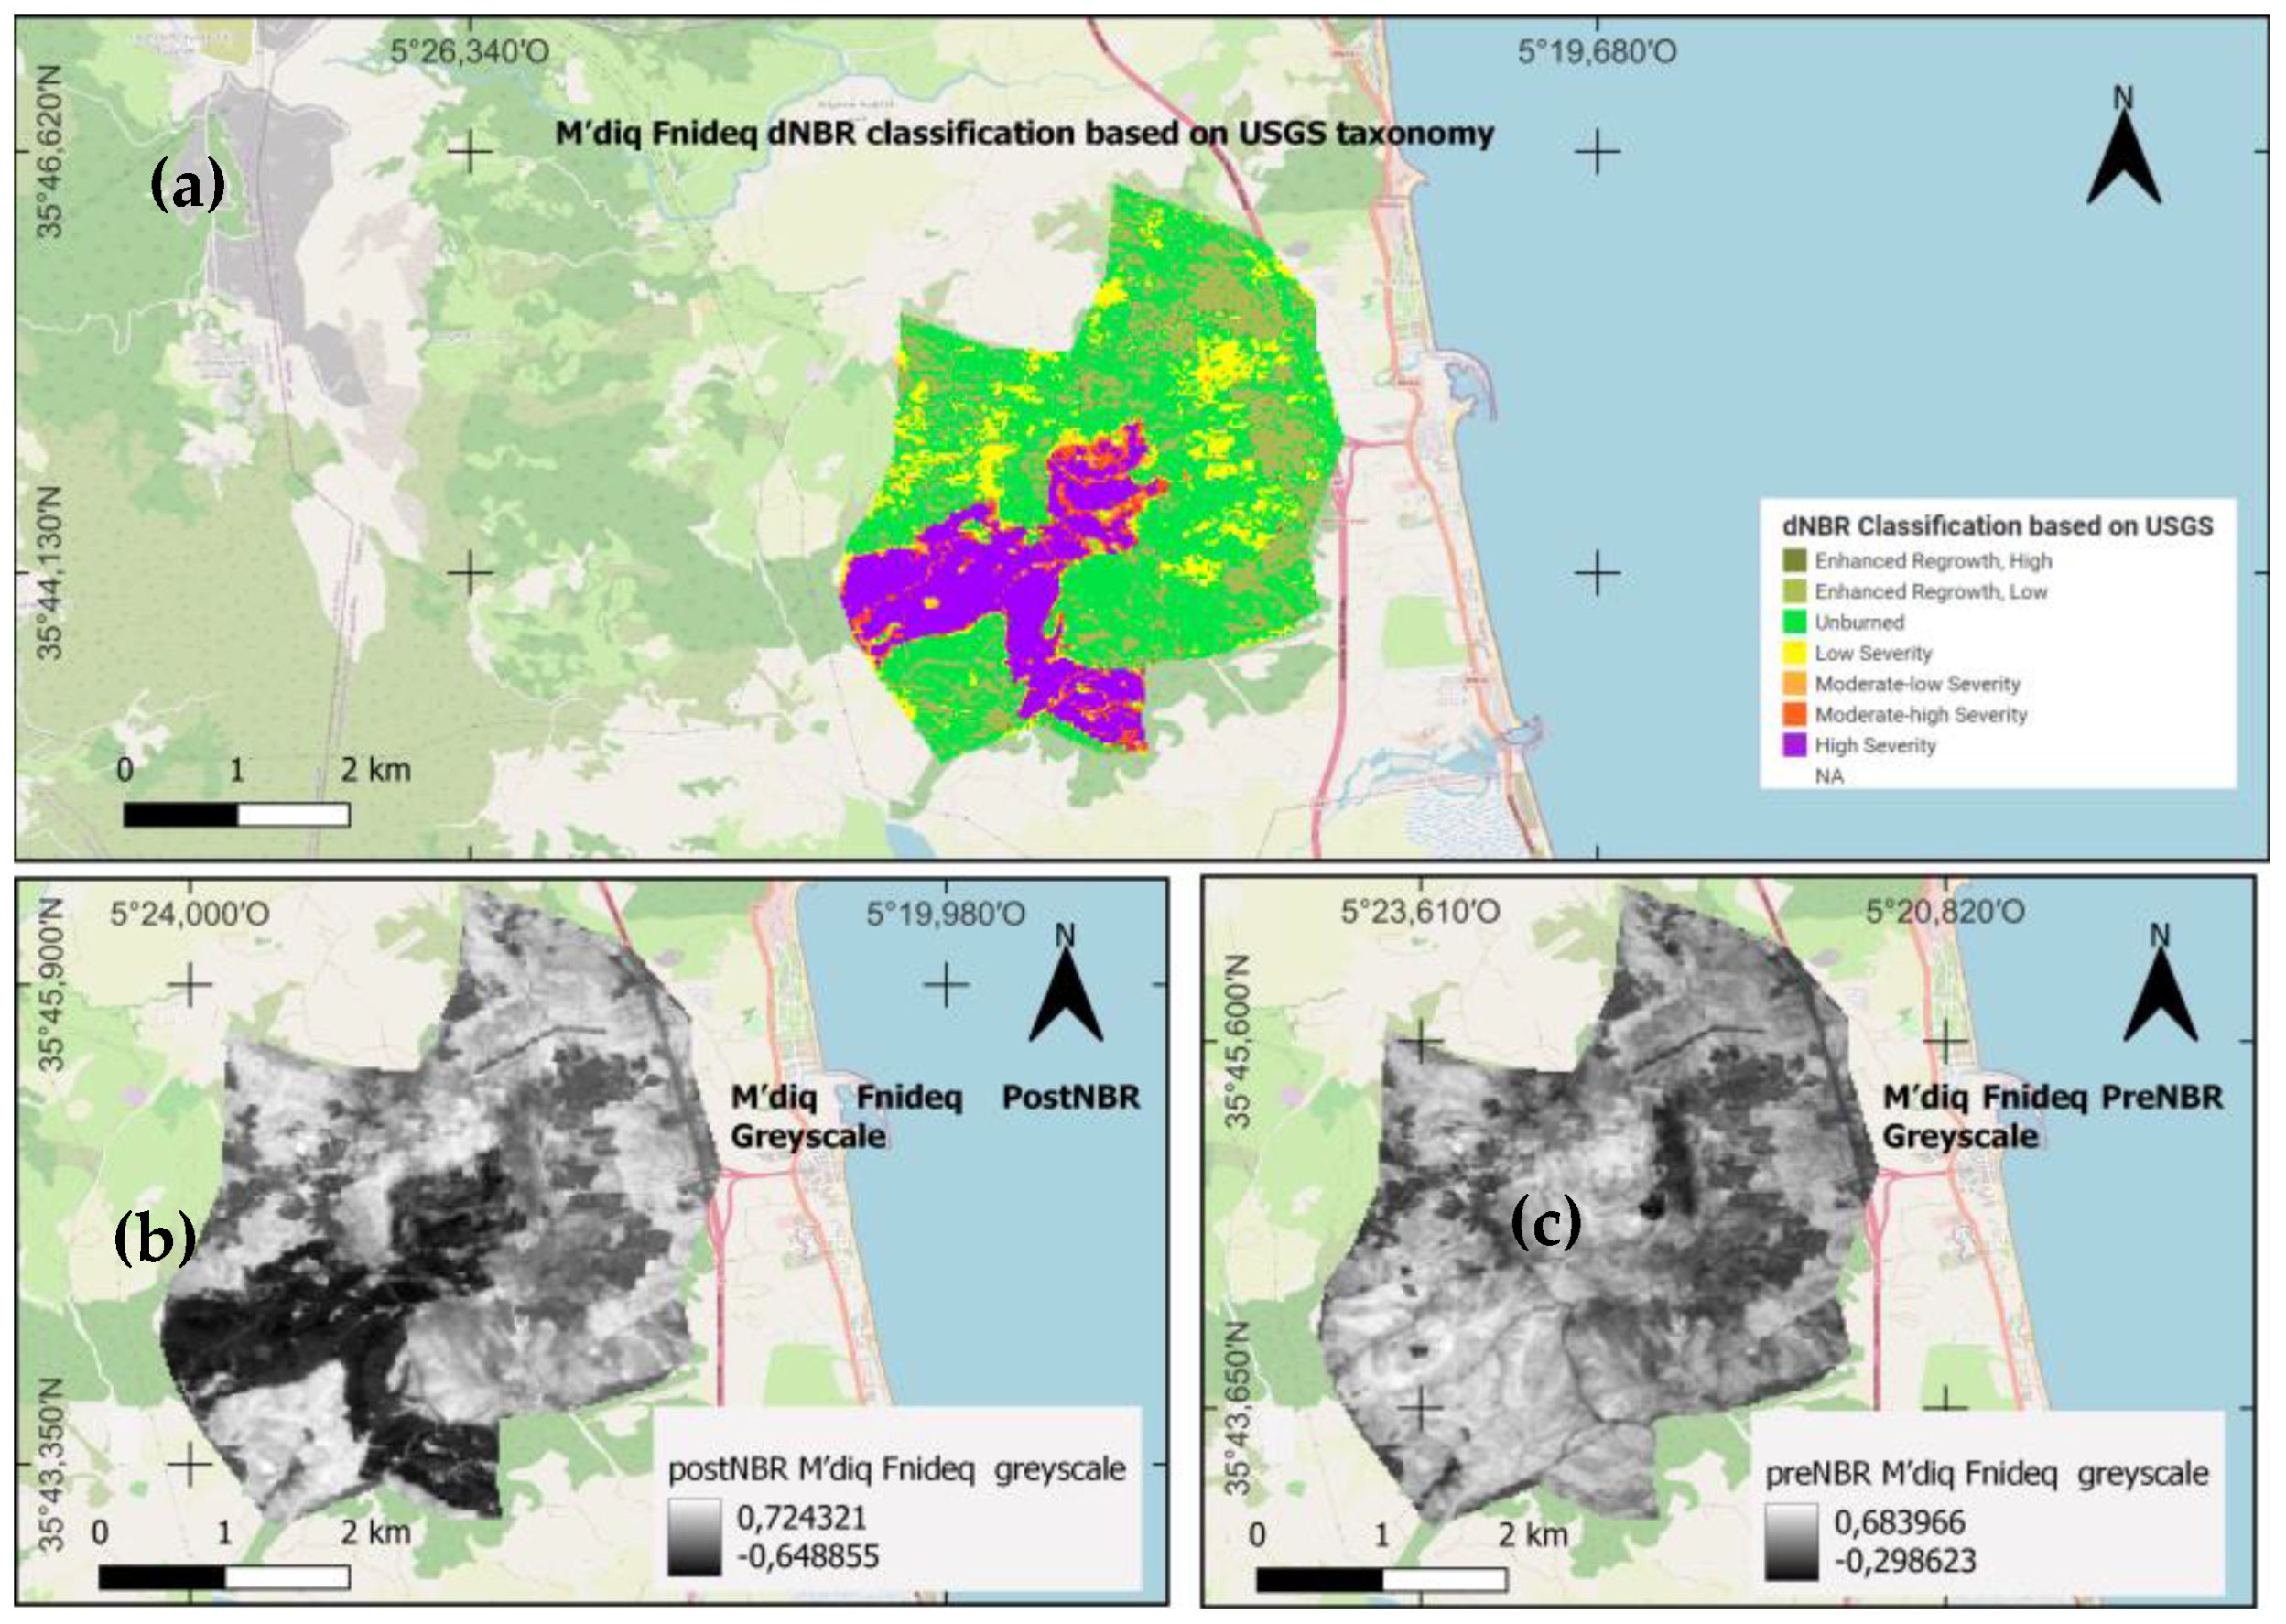
3.1. NBR and dNBR Processing
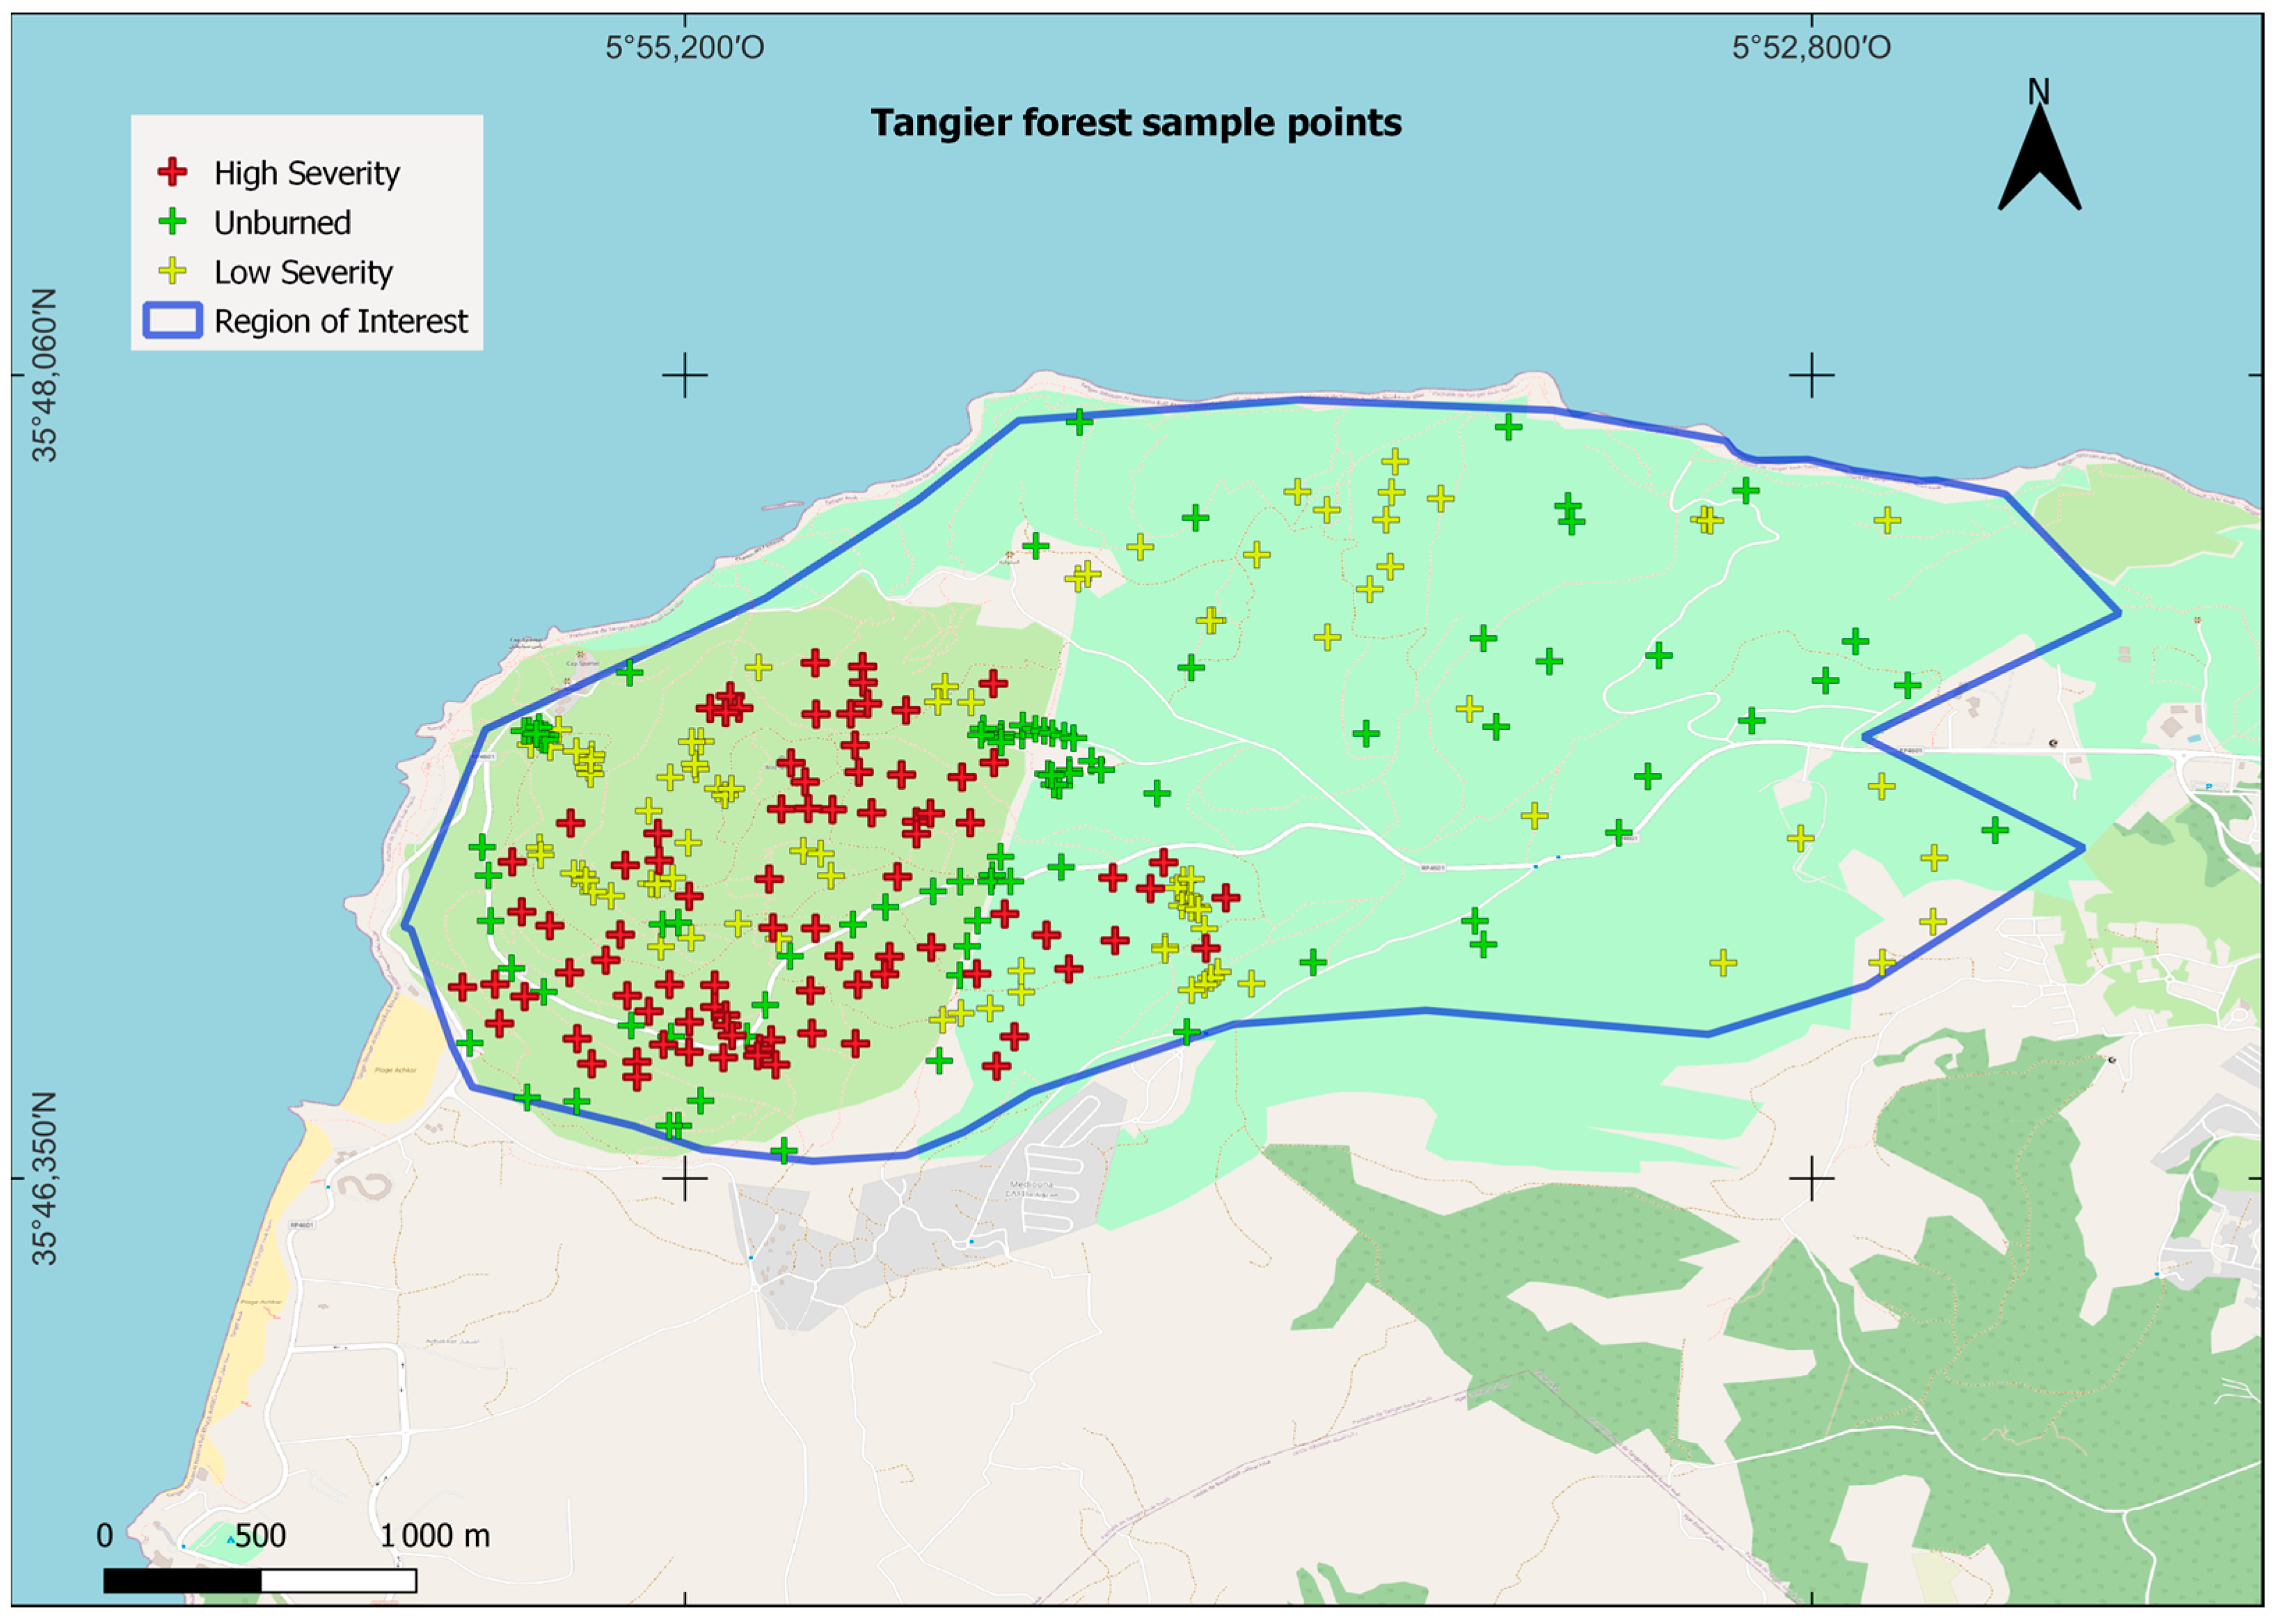
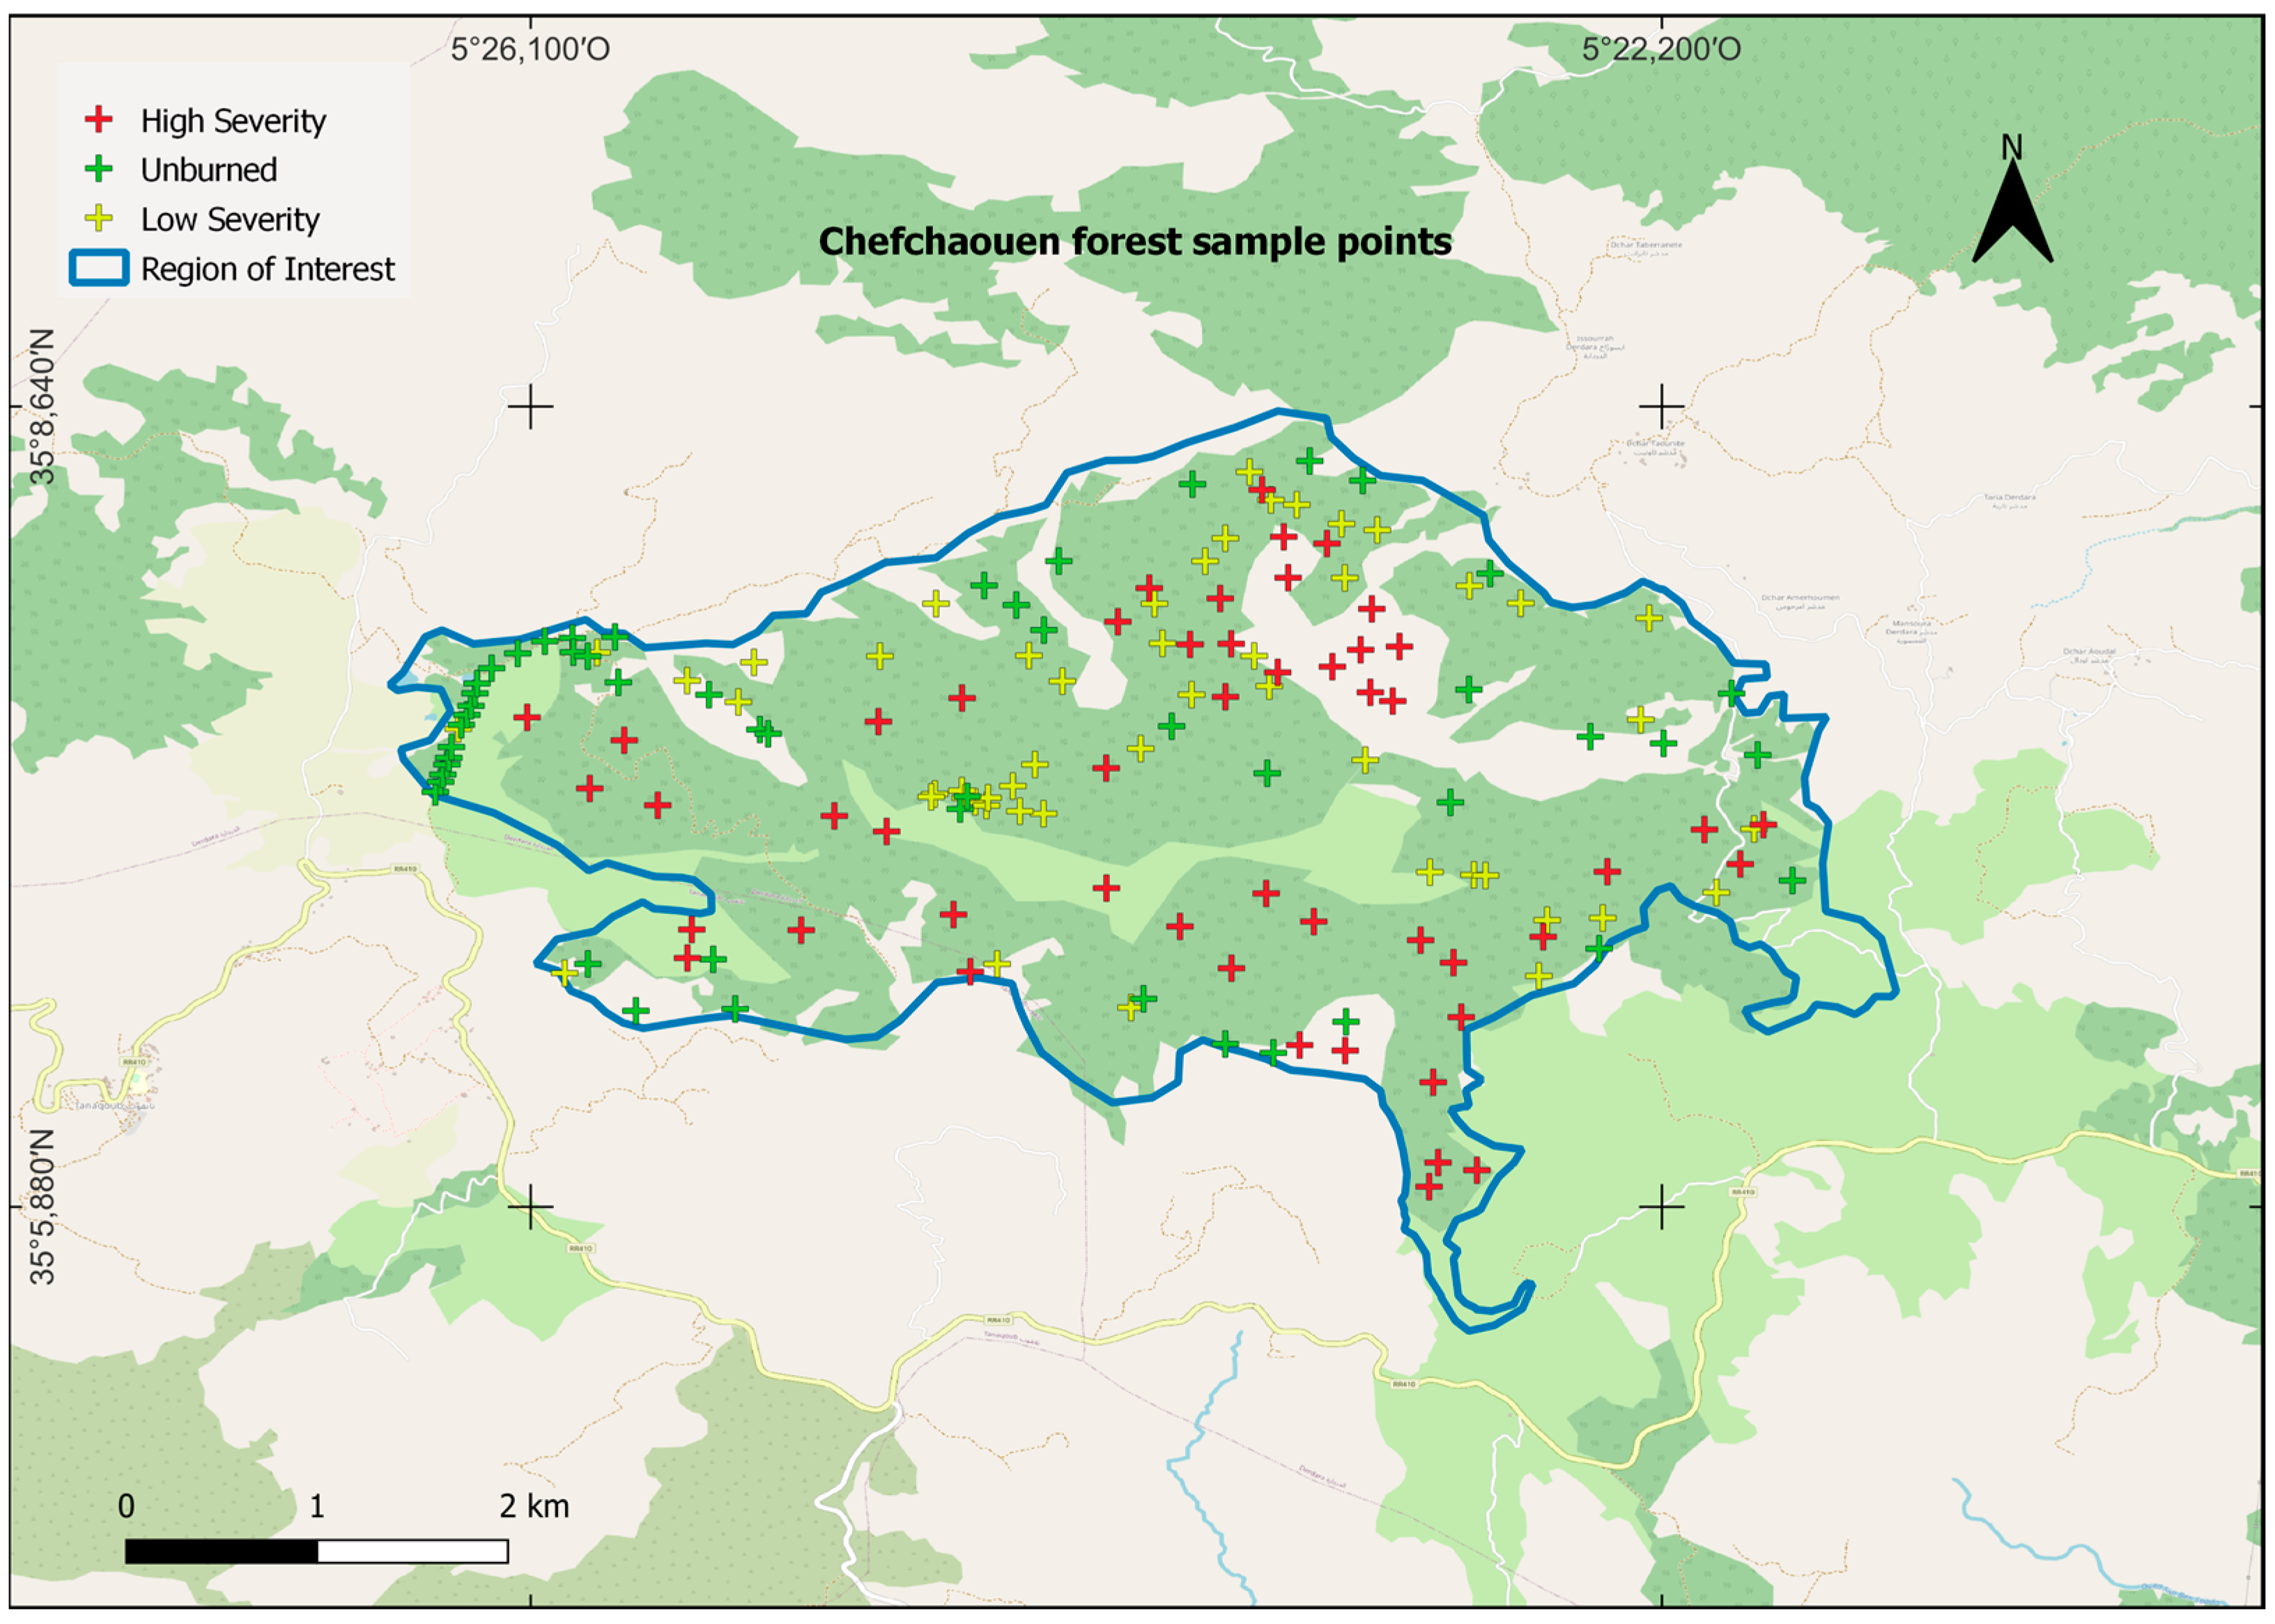
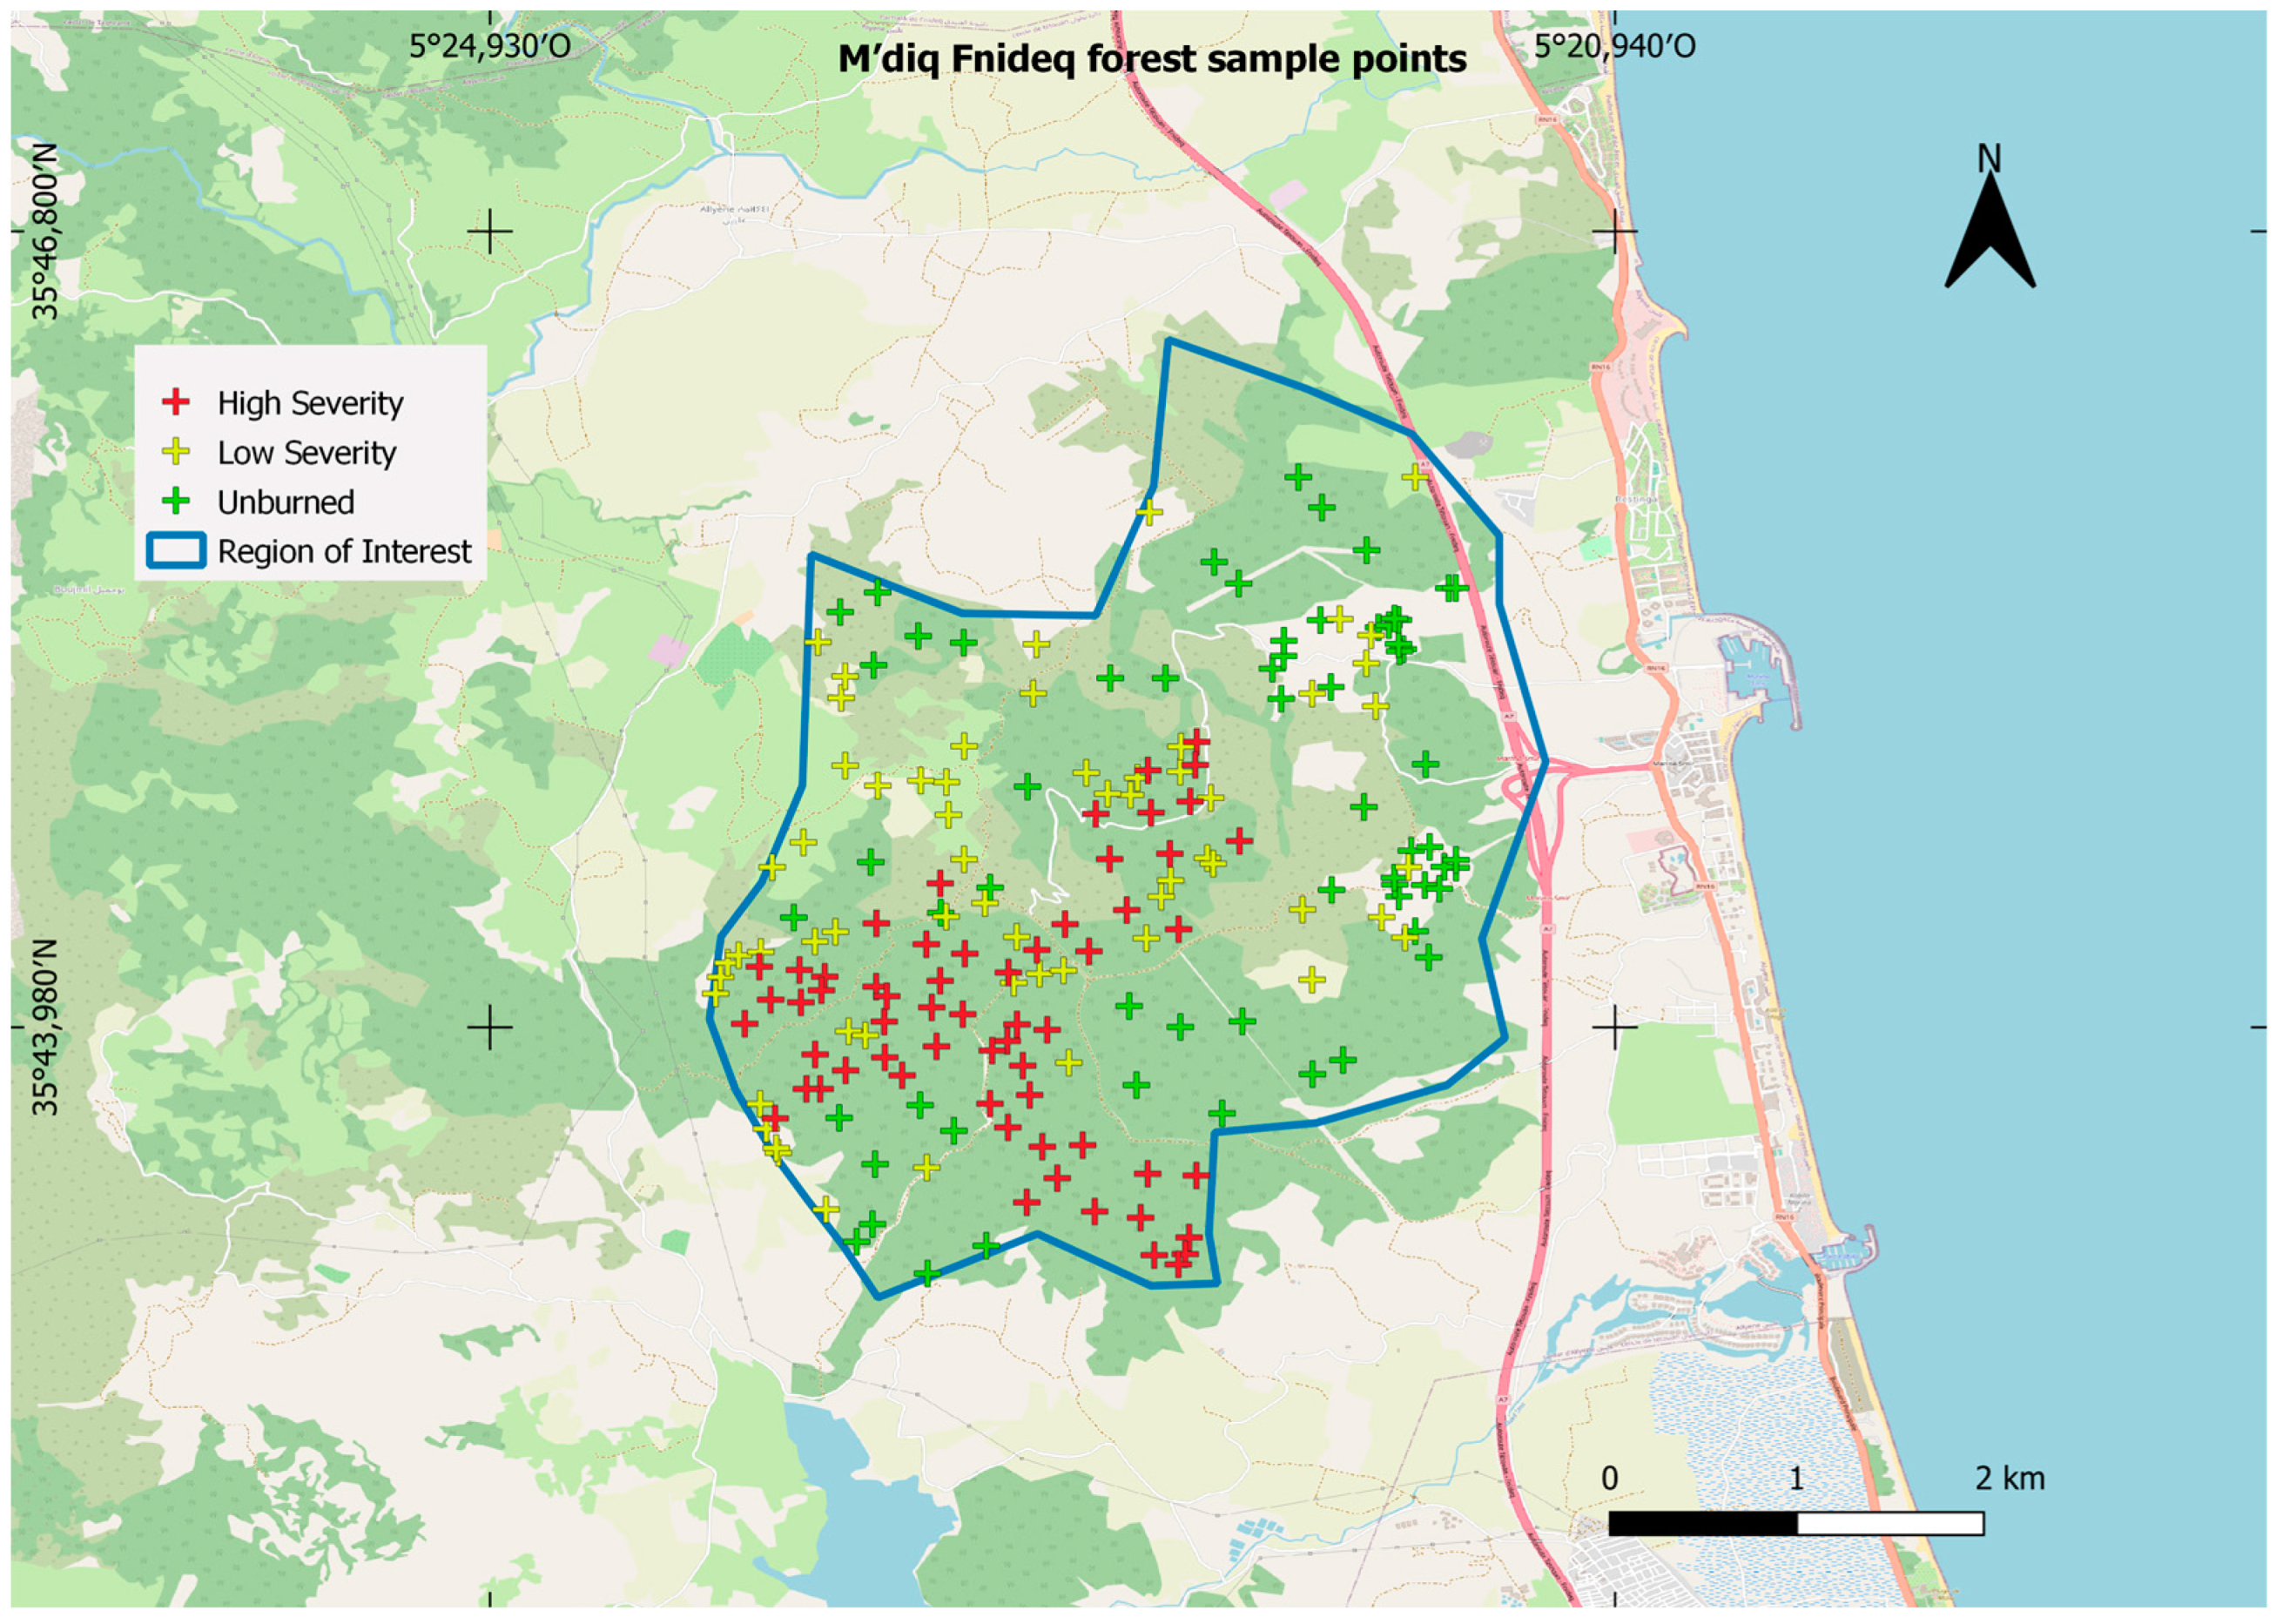
3.2. Sample Point Determination
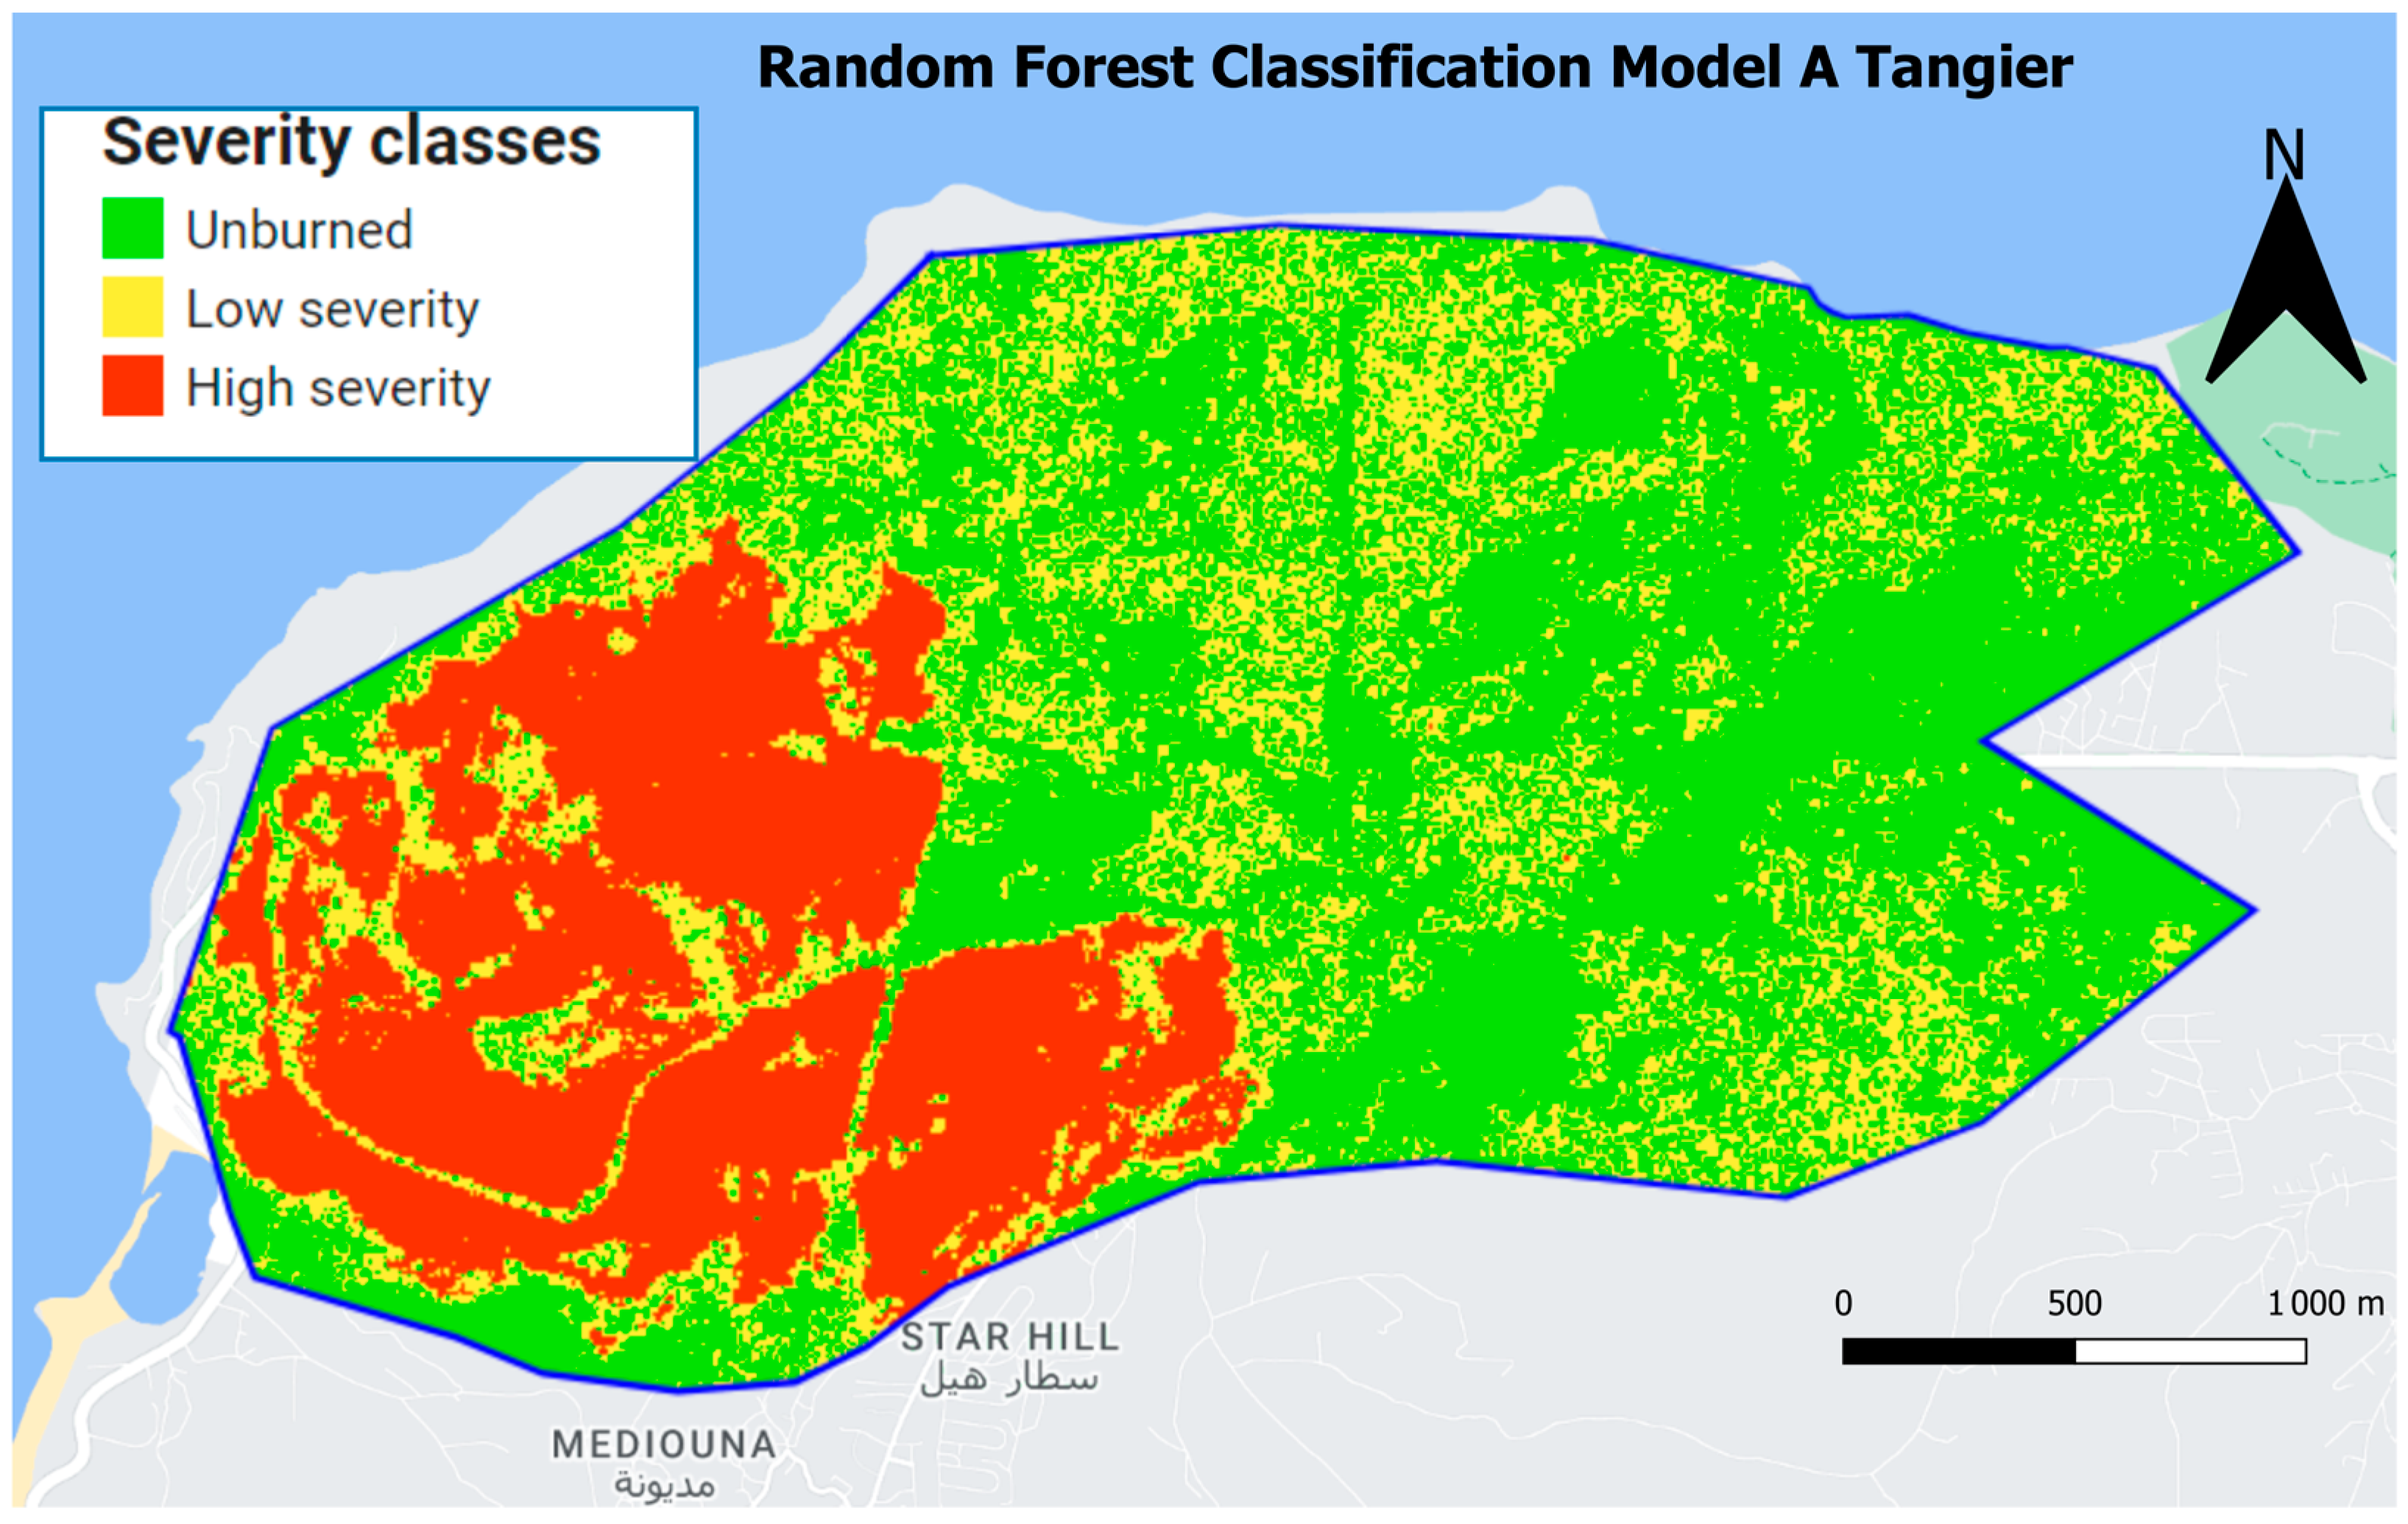
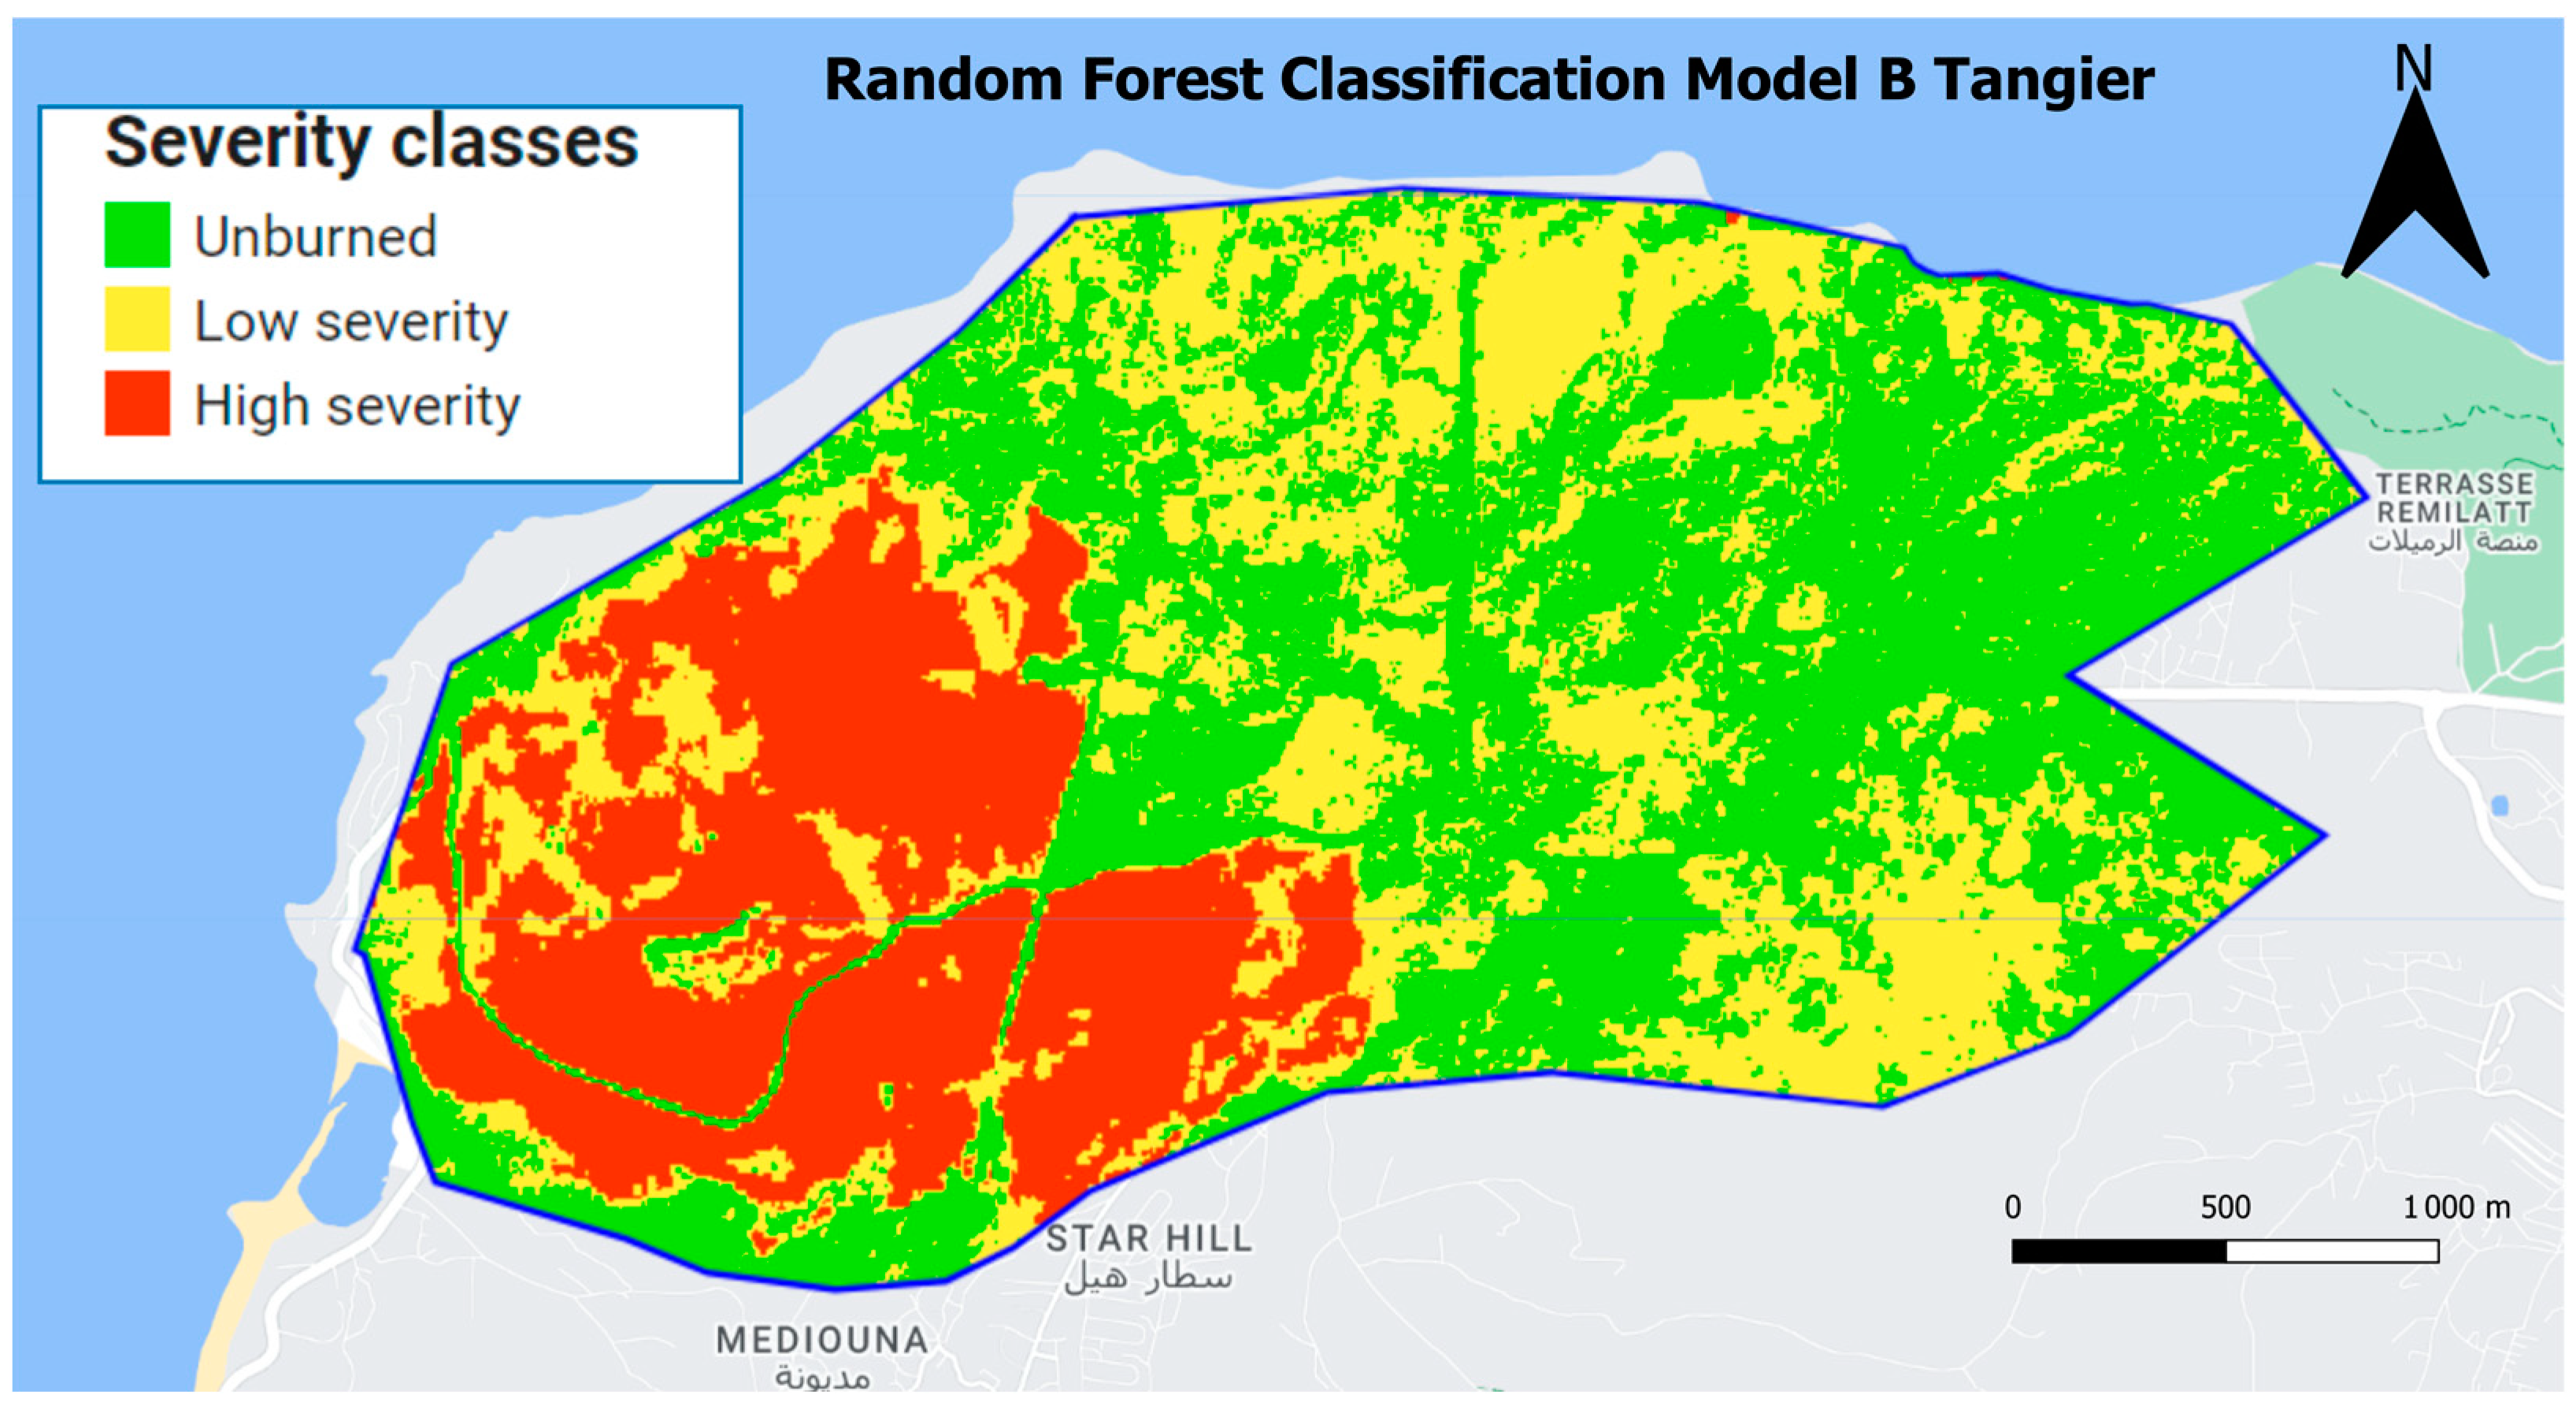
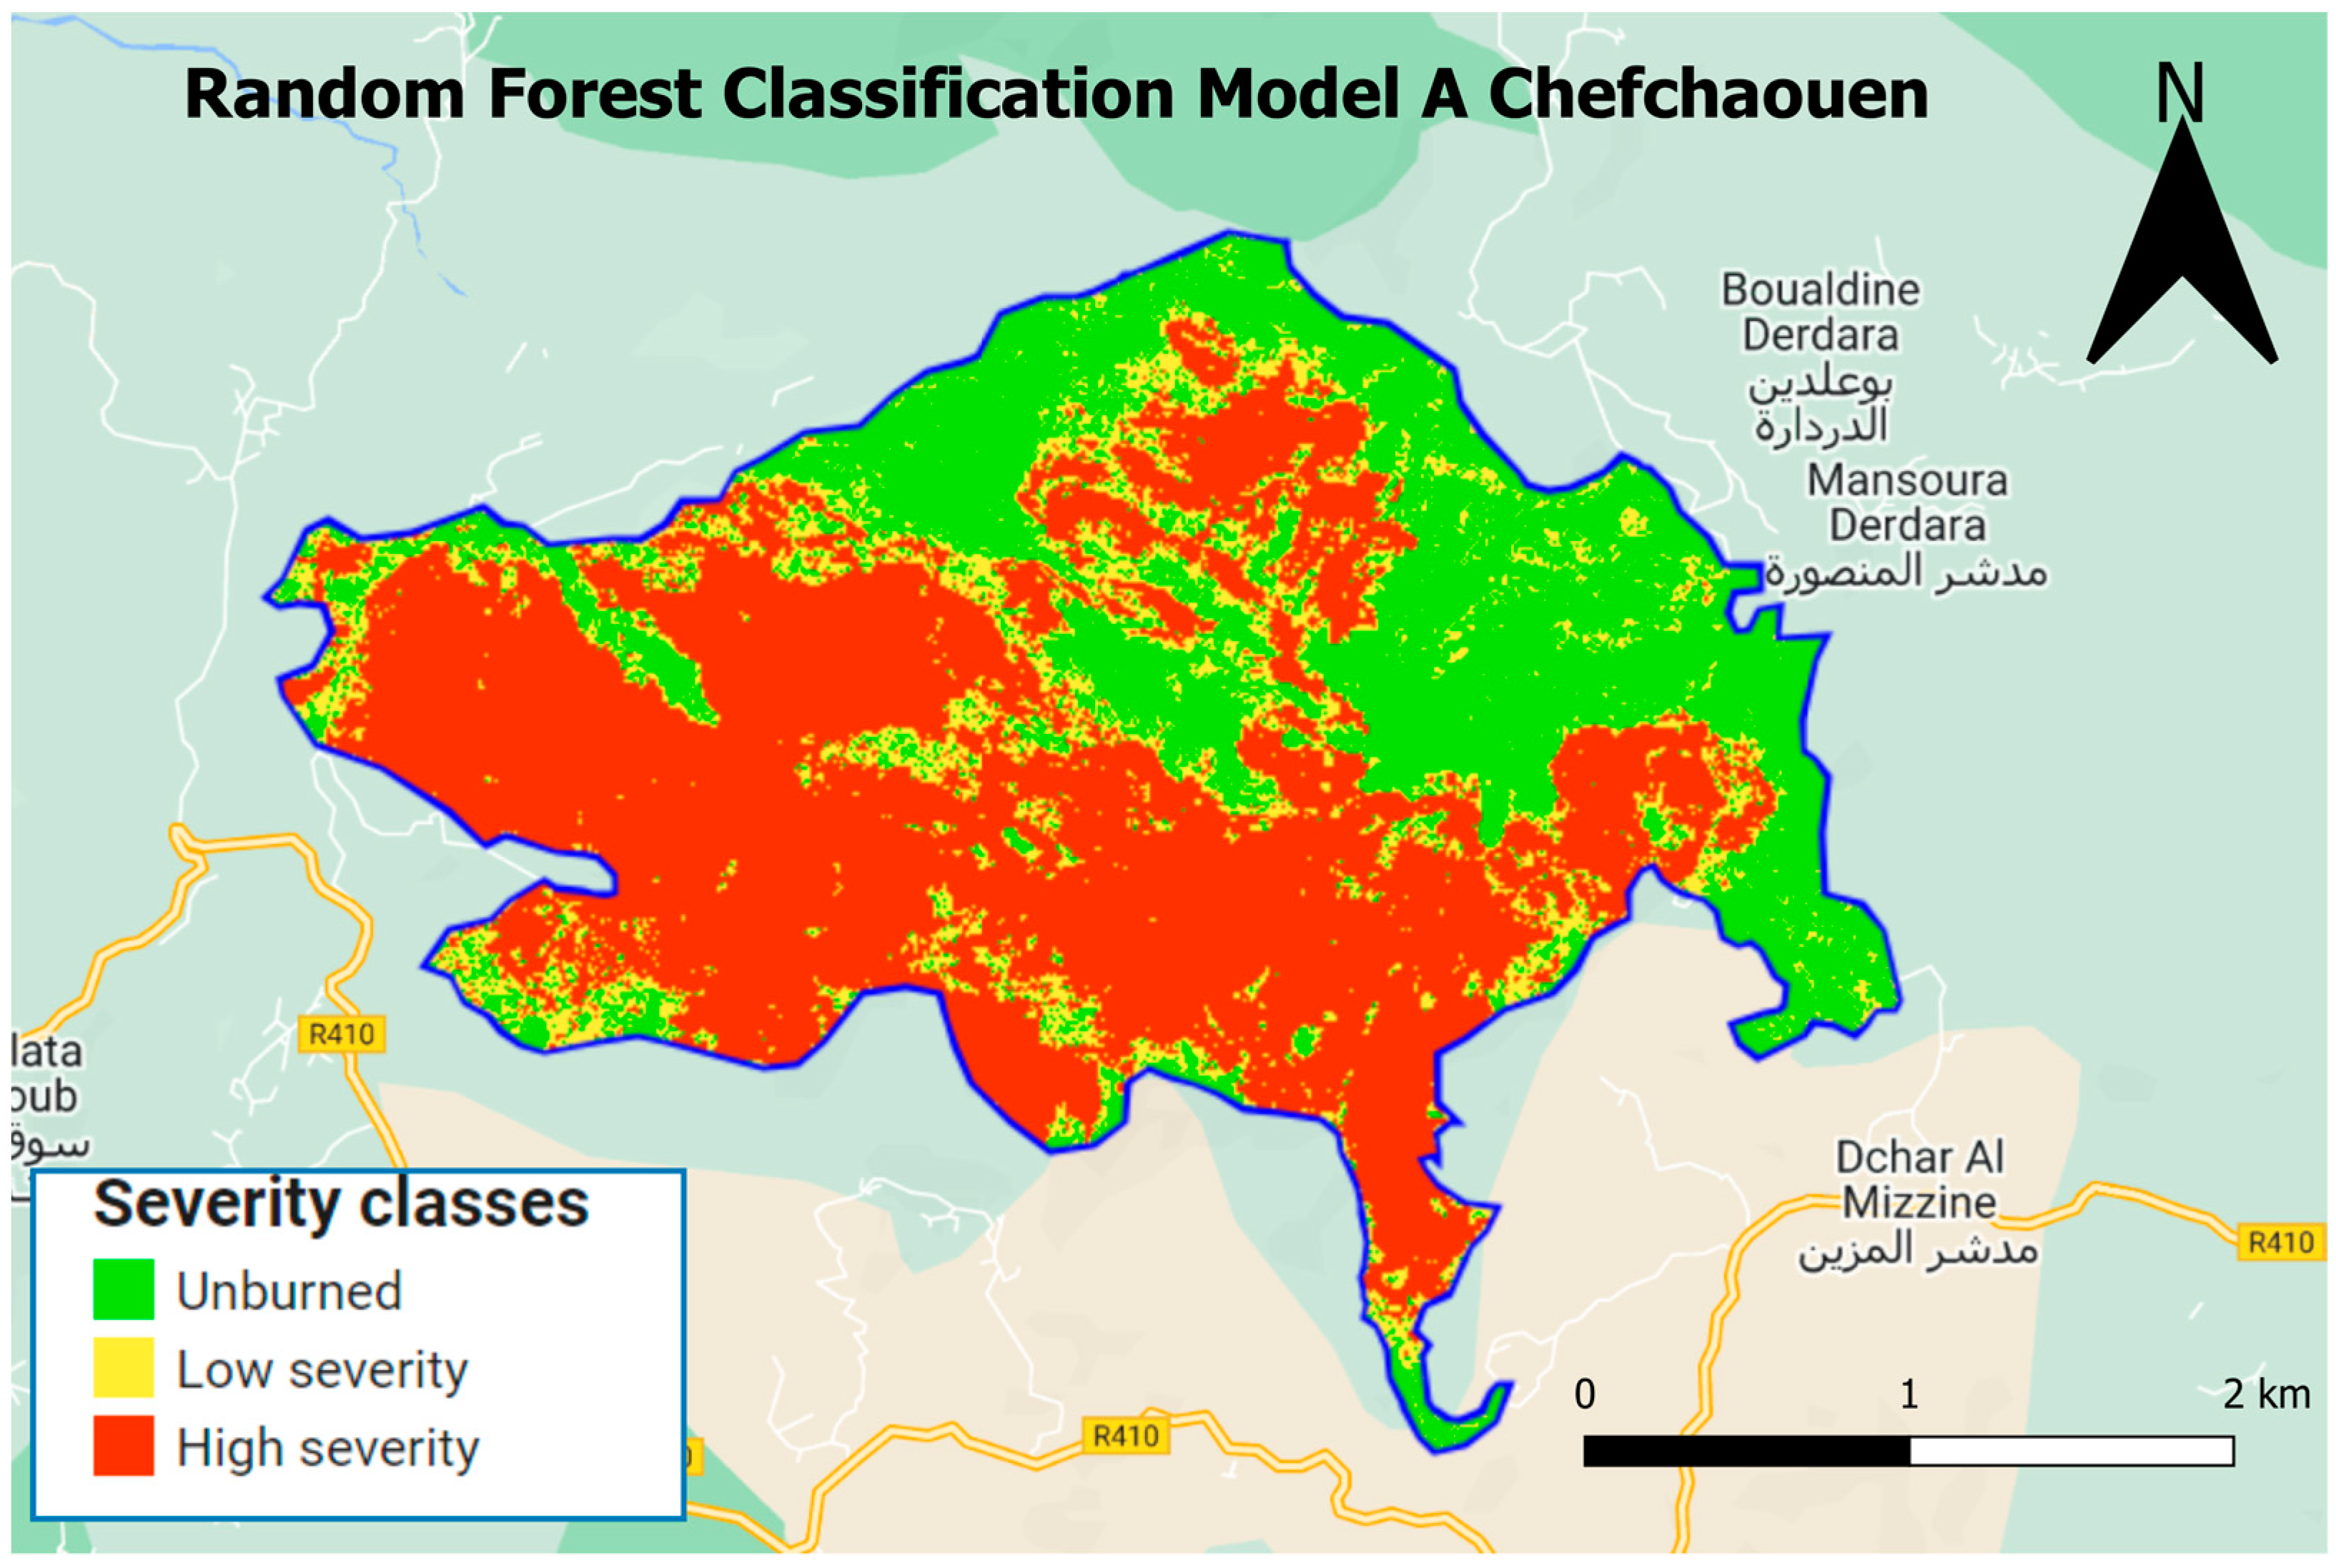
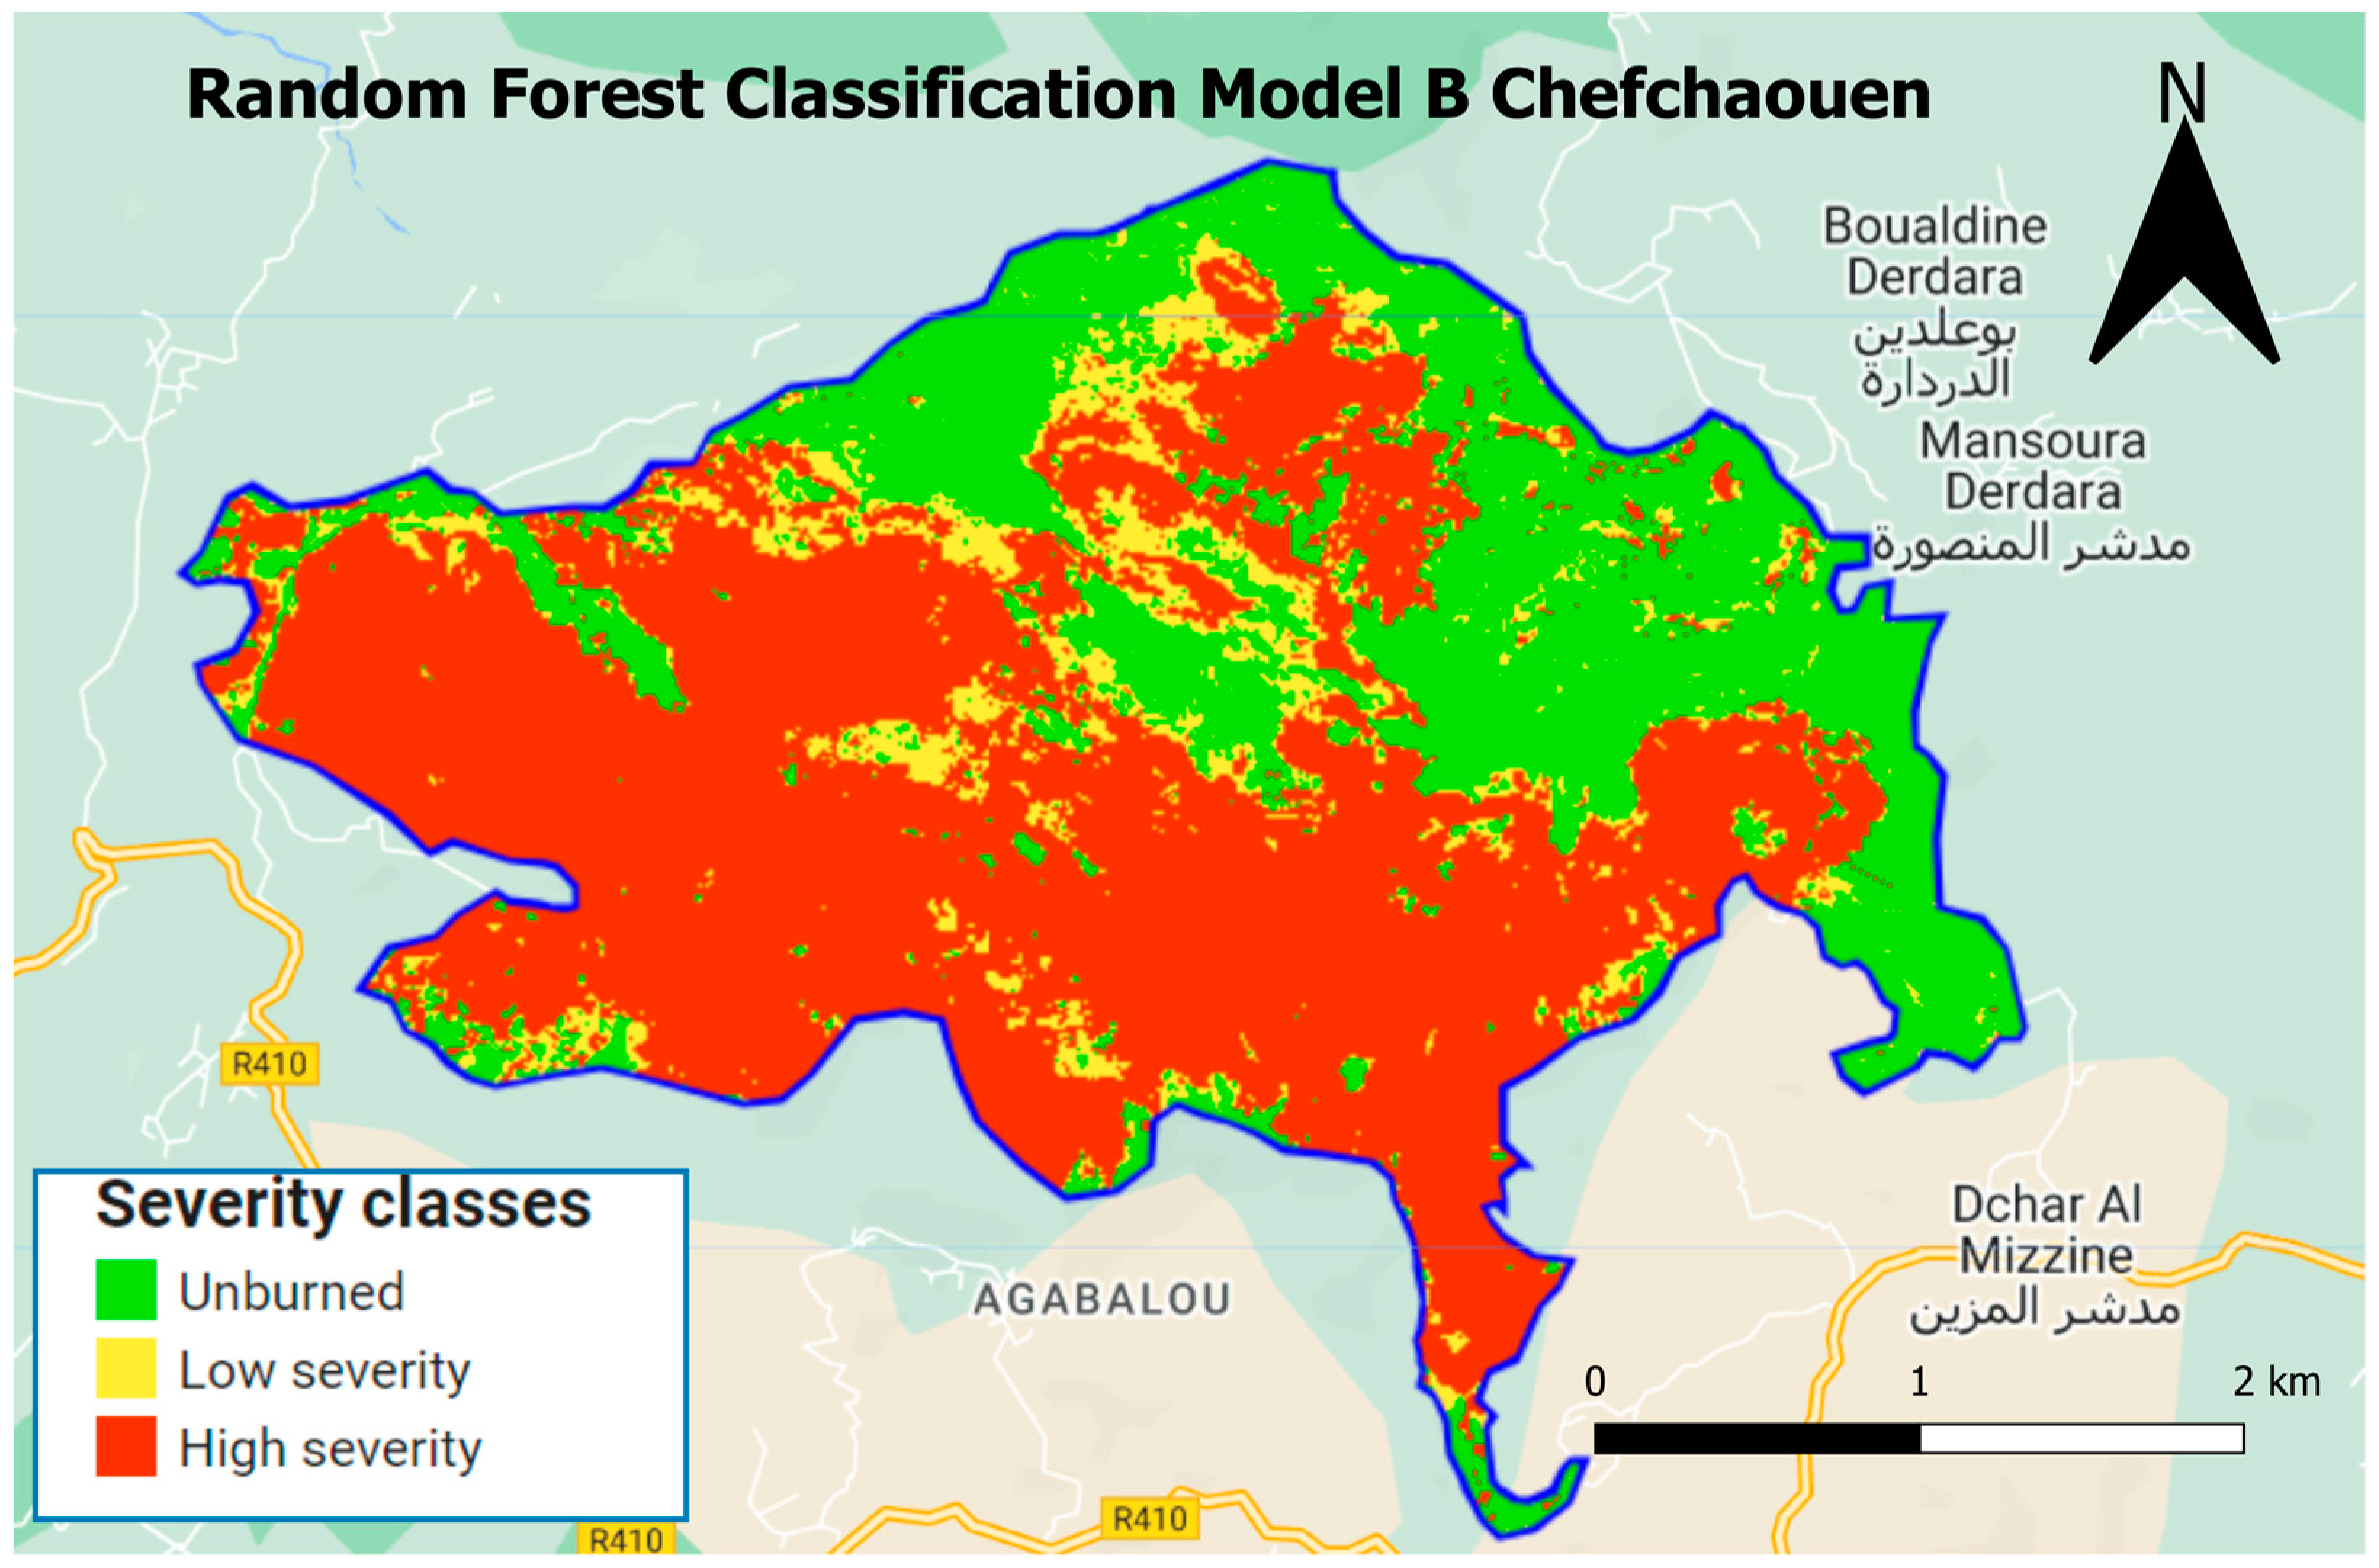
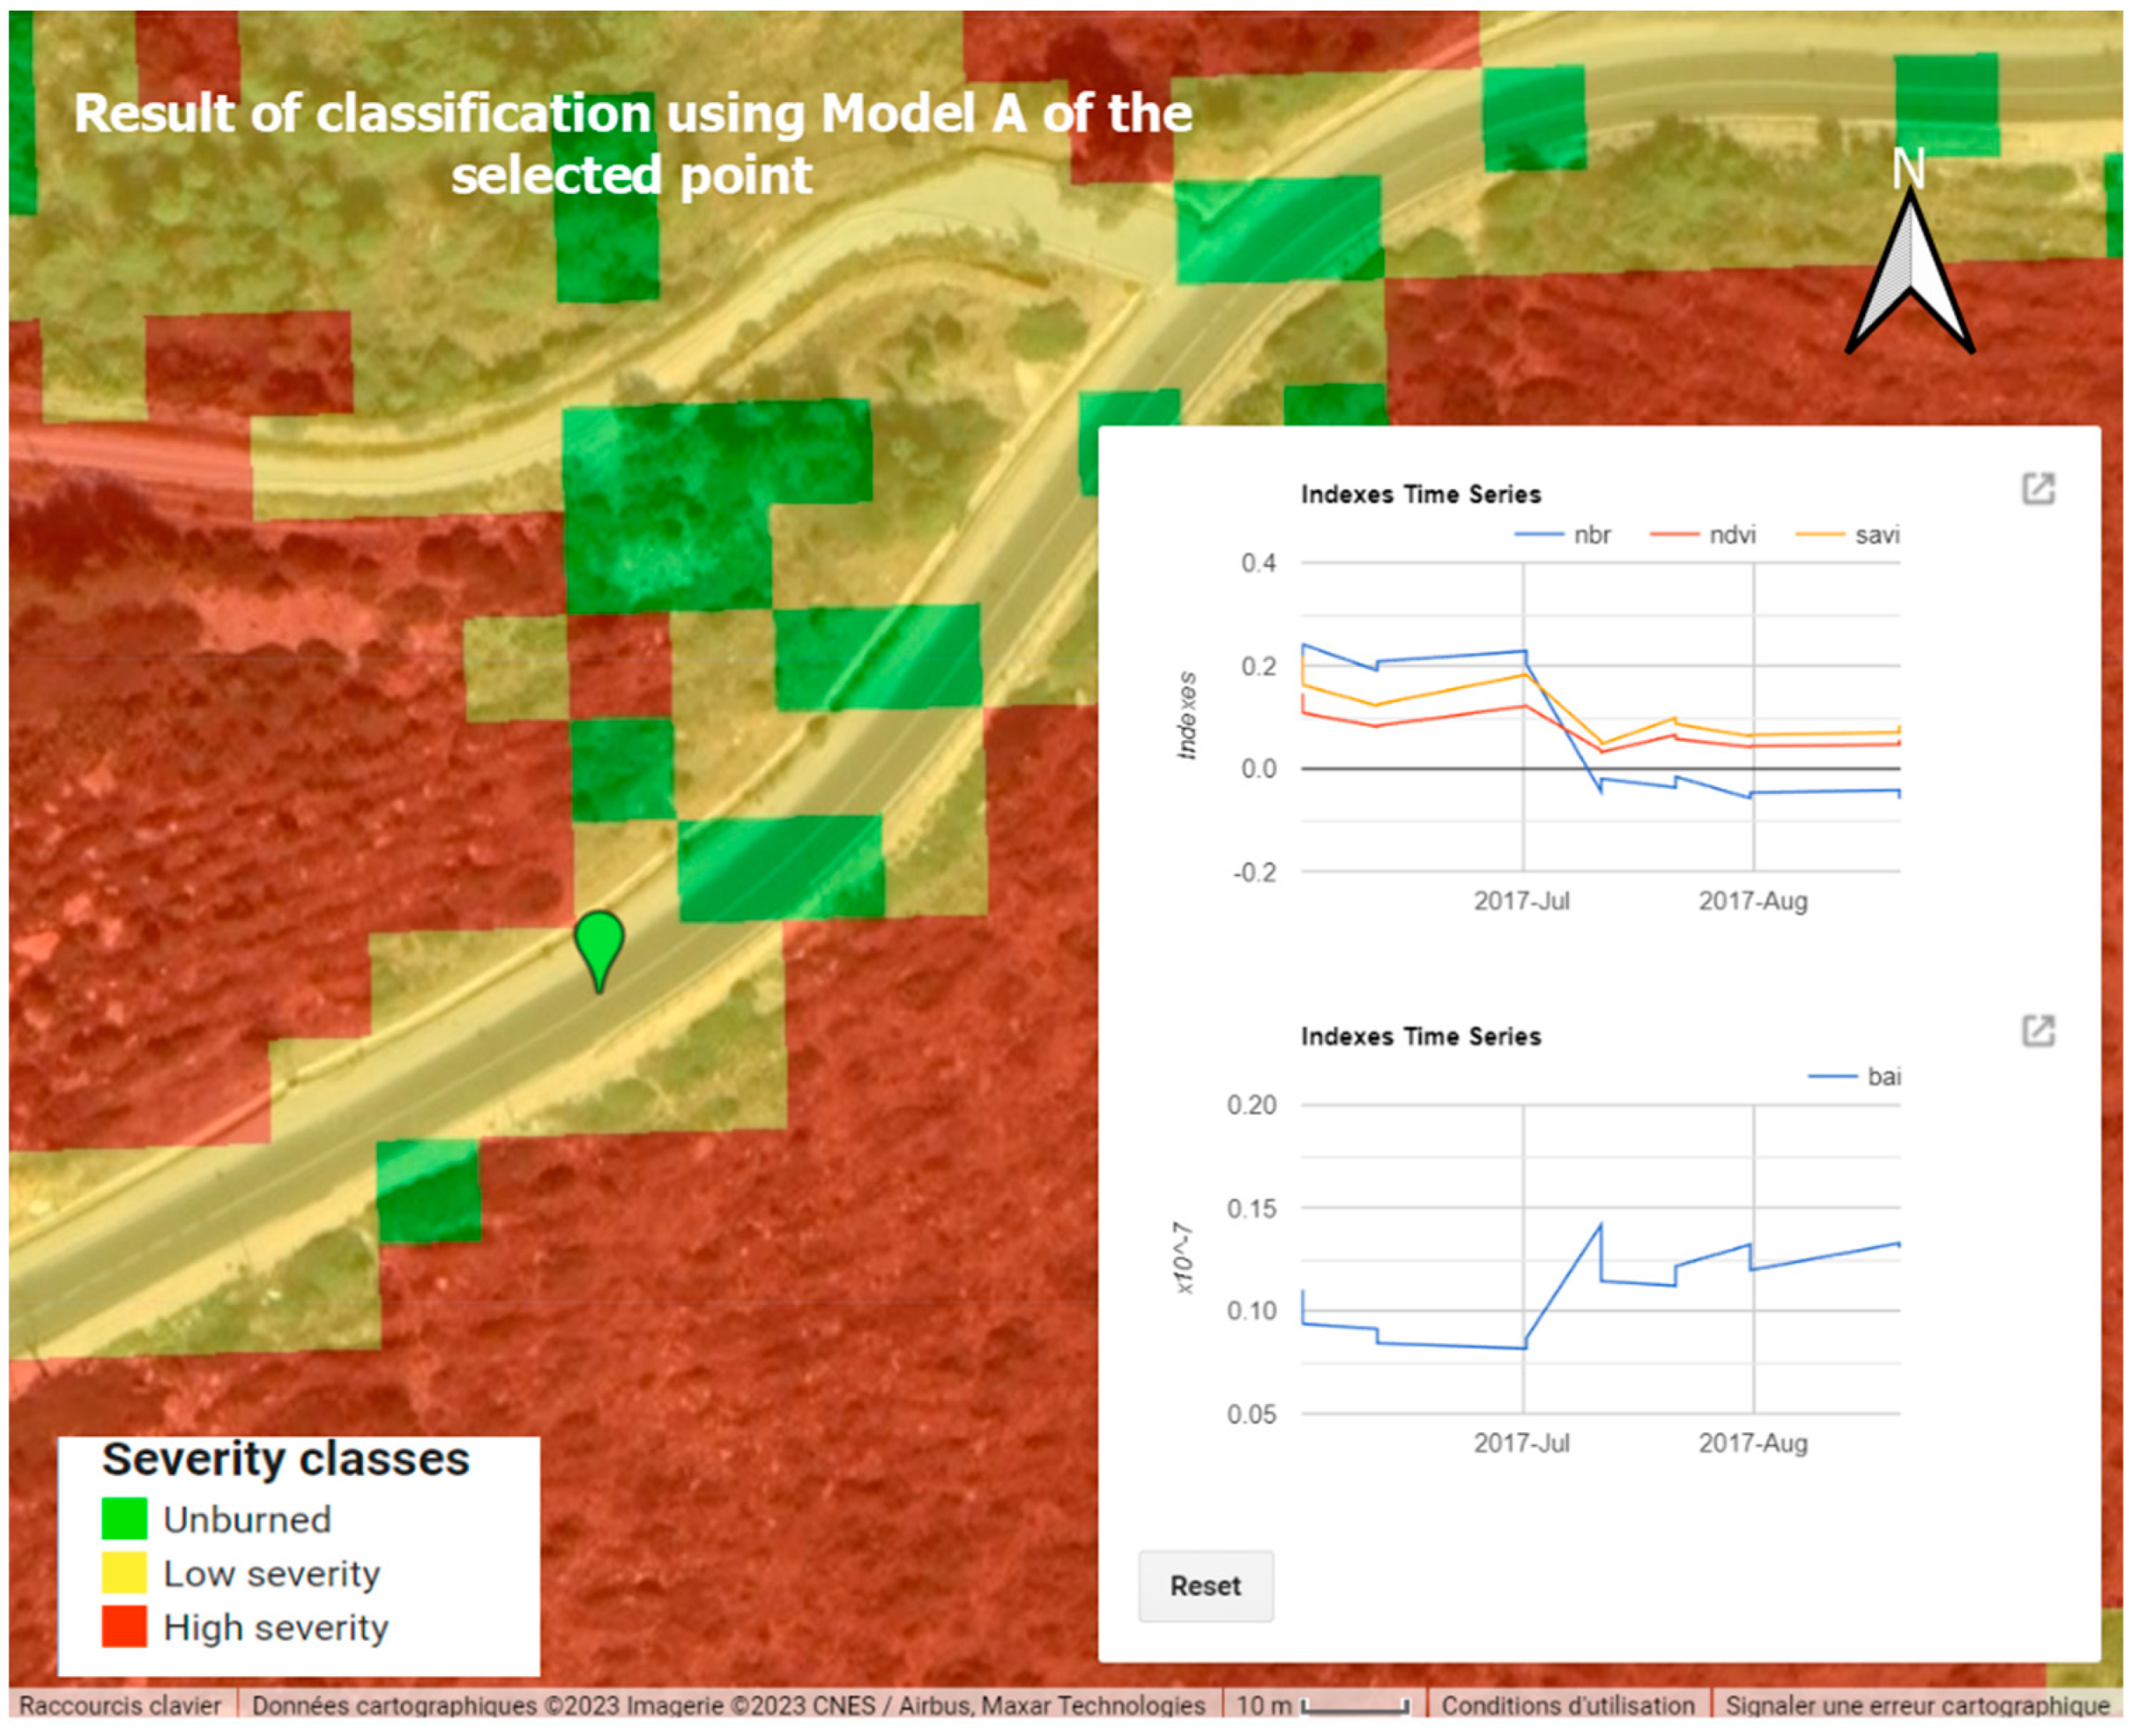
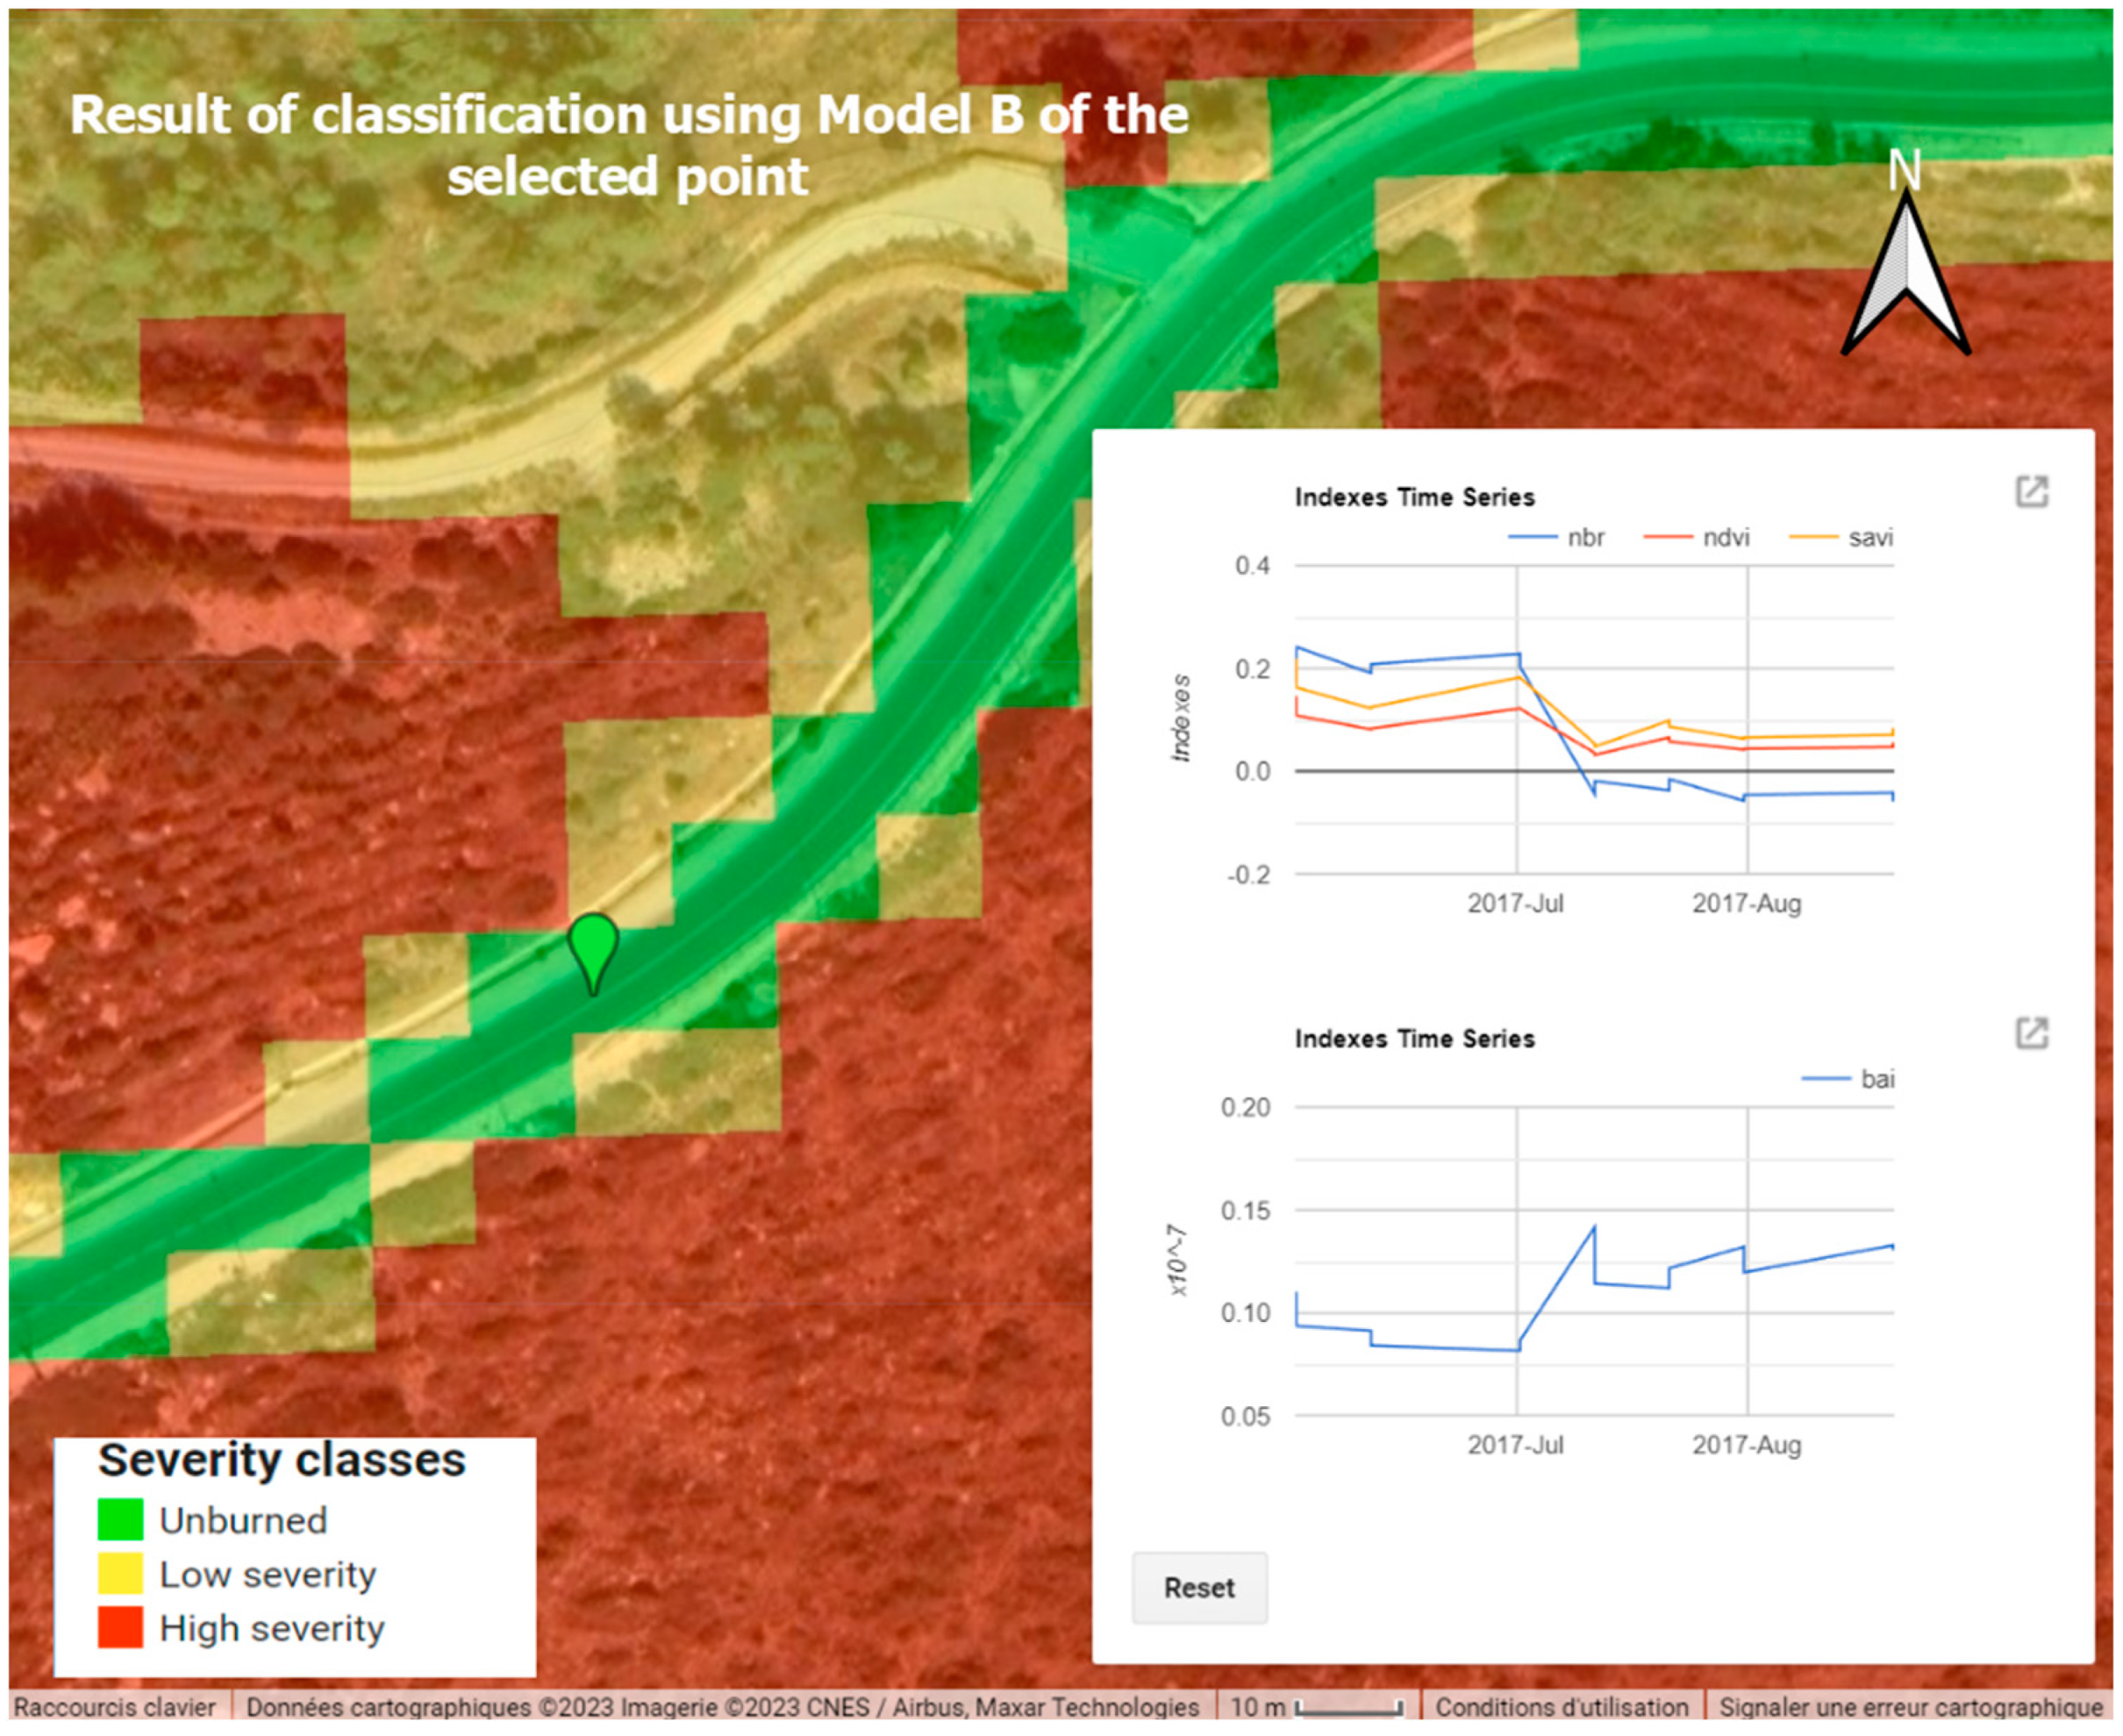
3.3. Random Forest Classification
3.4. Test and Validation
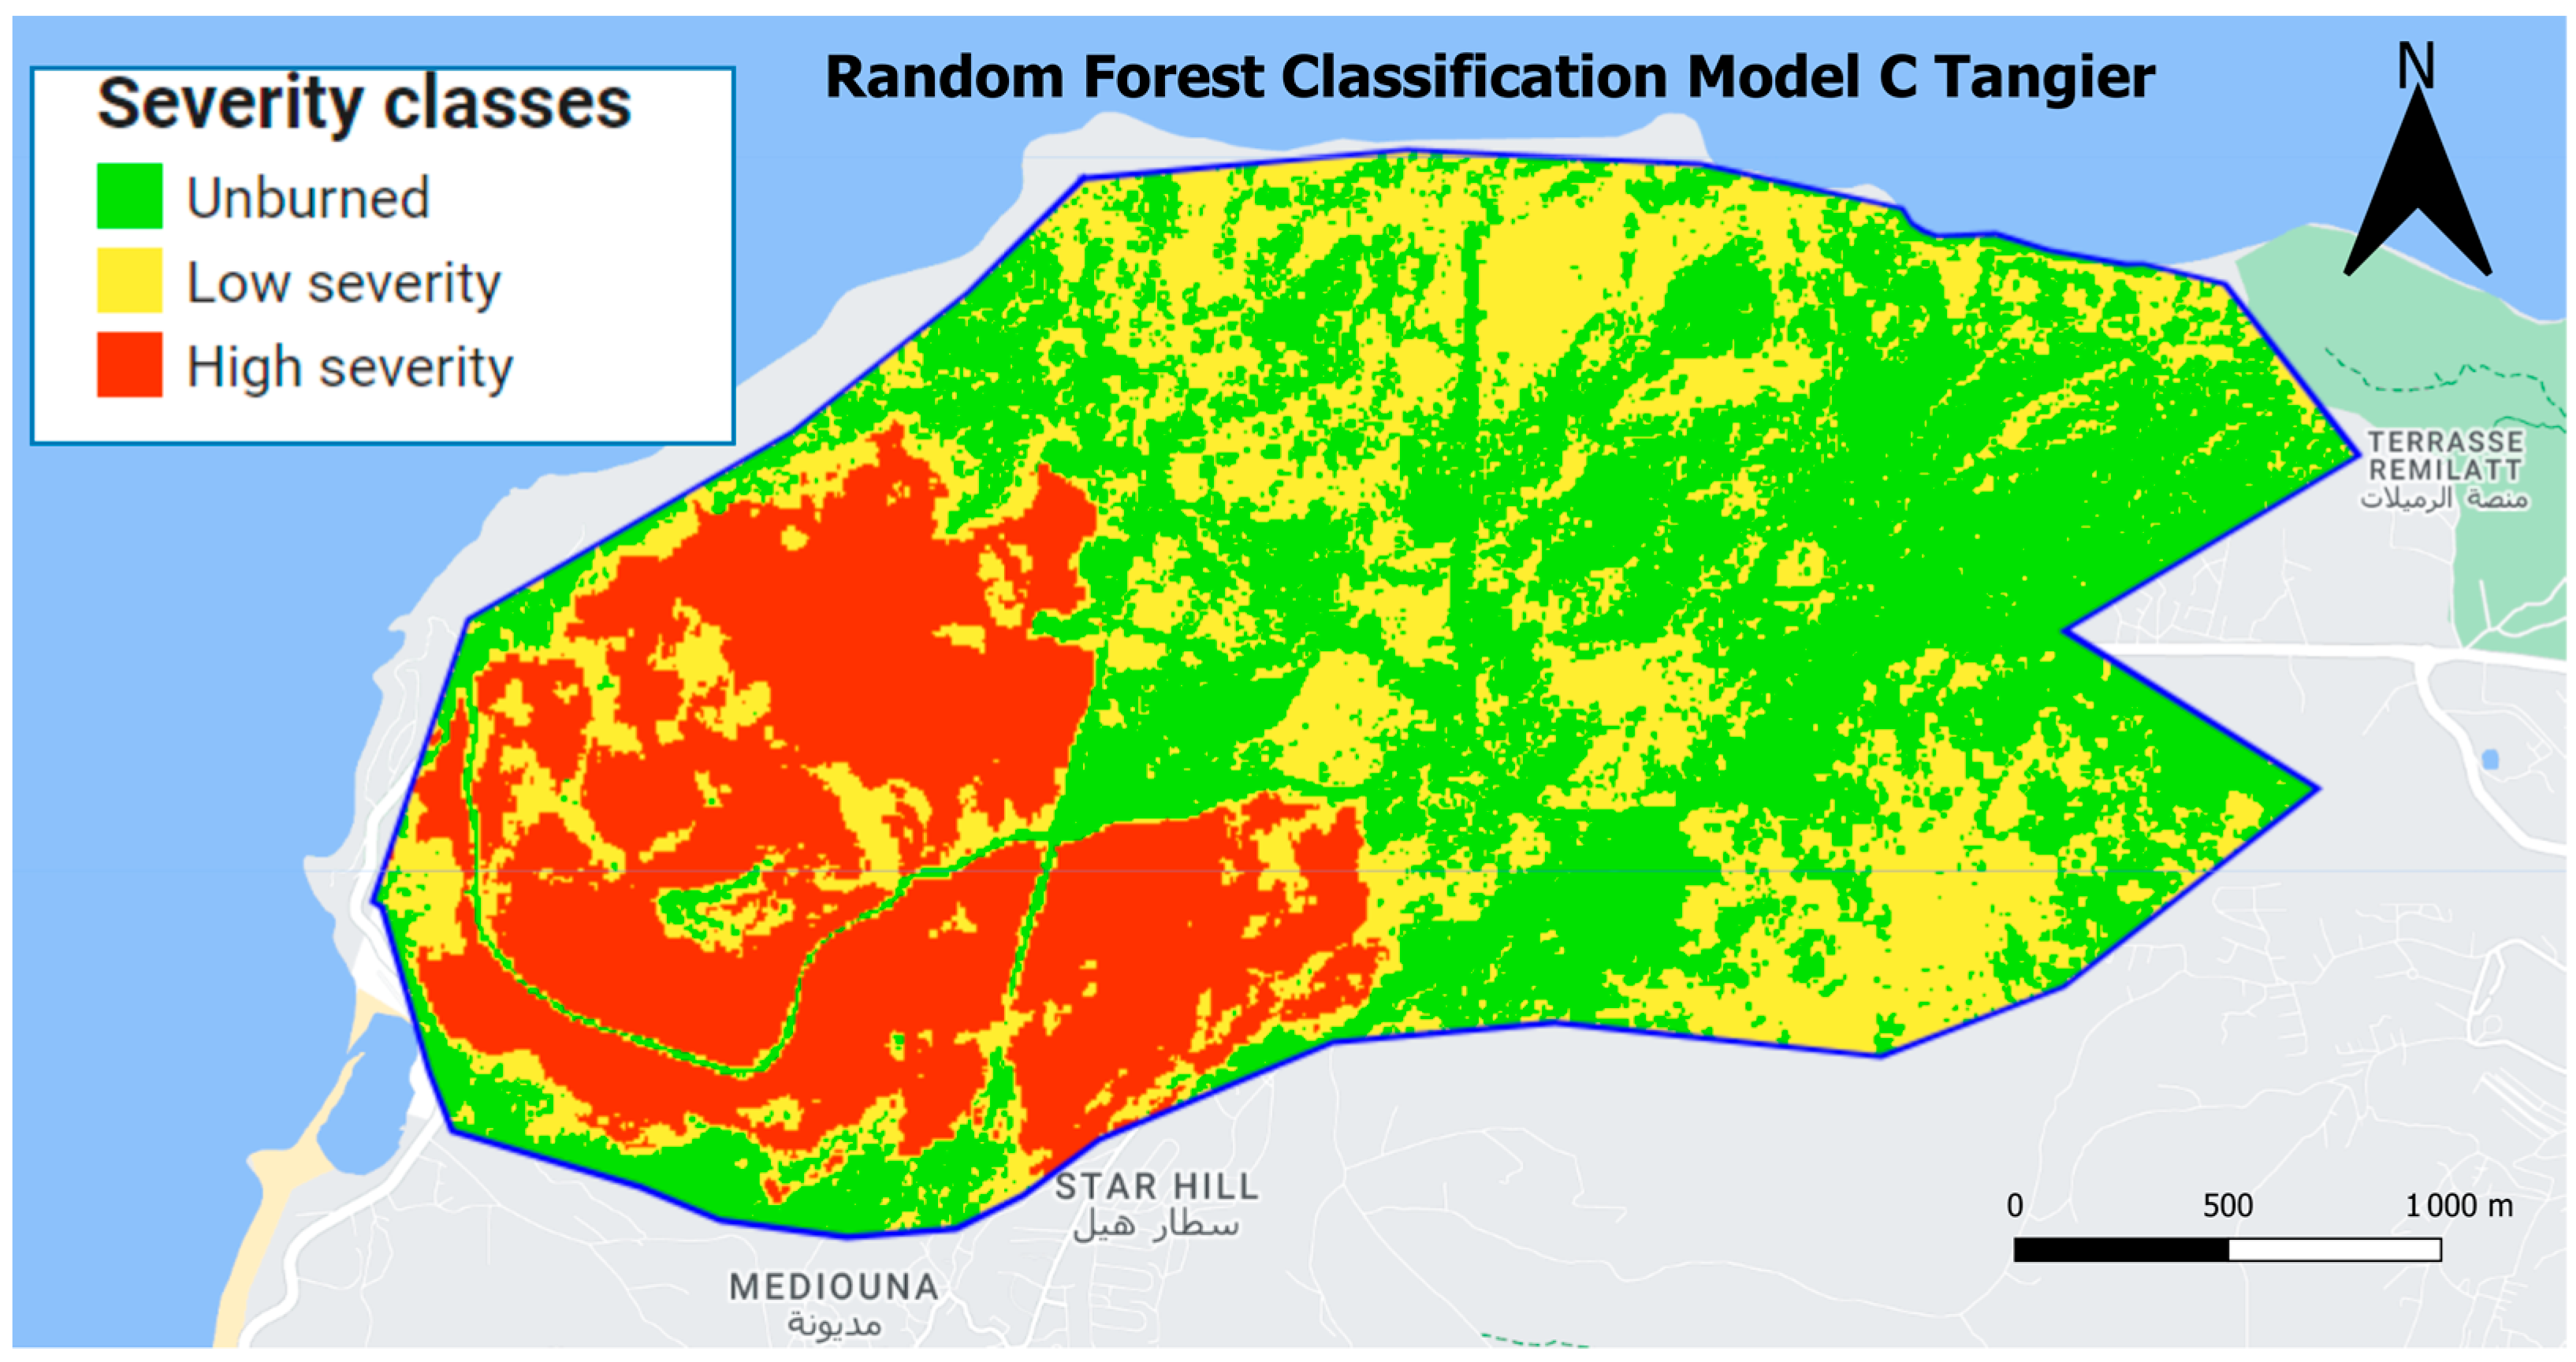
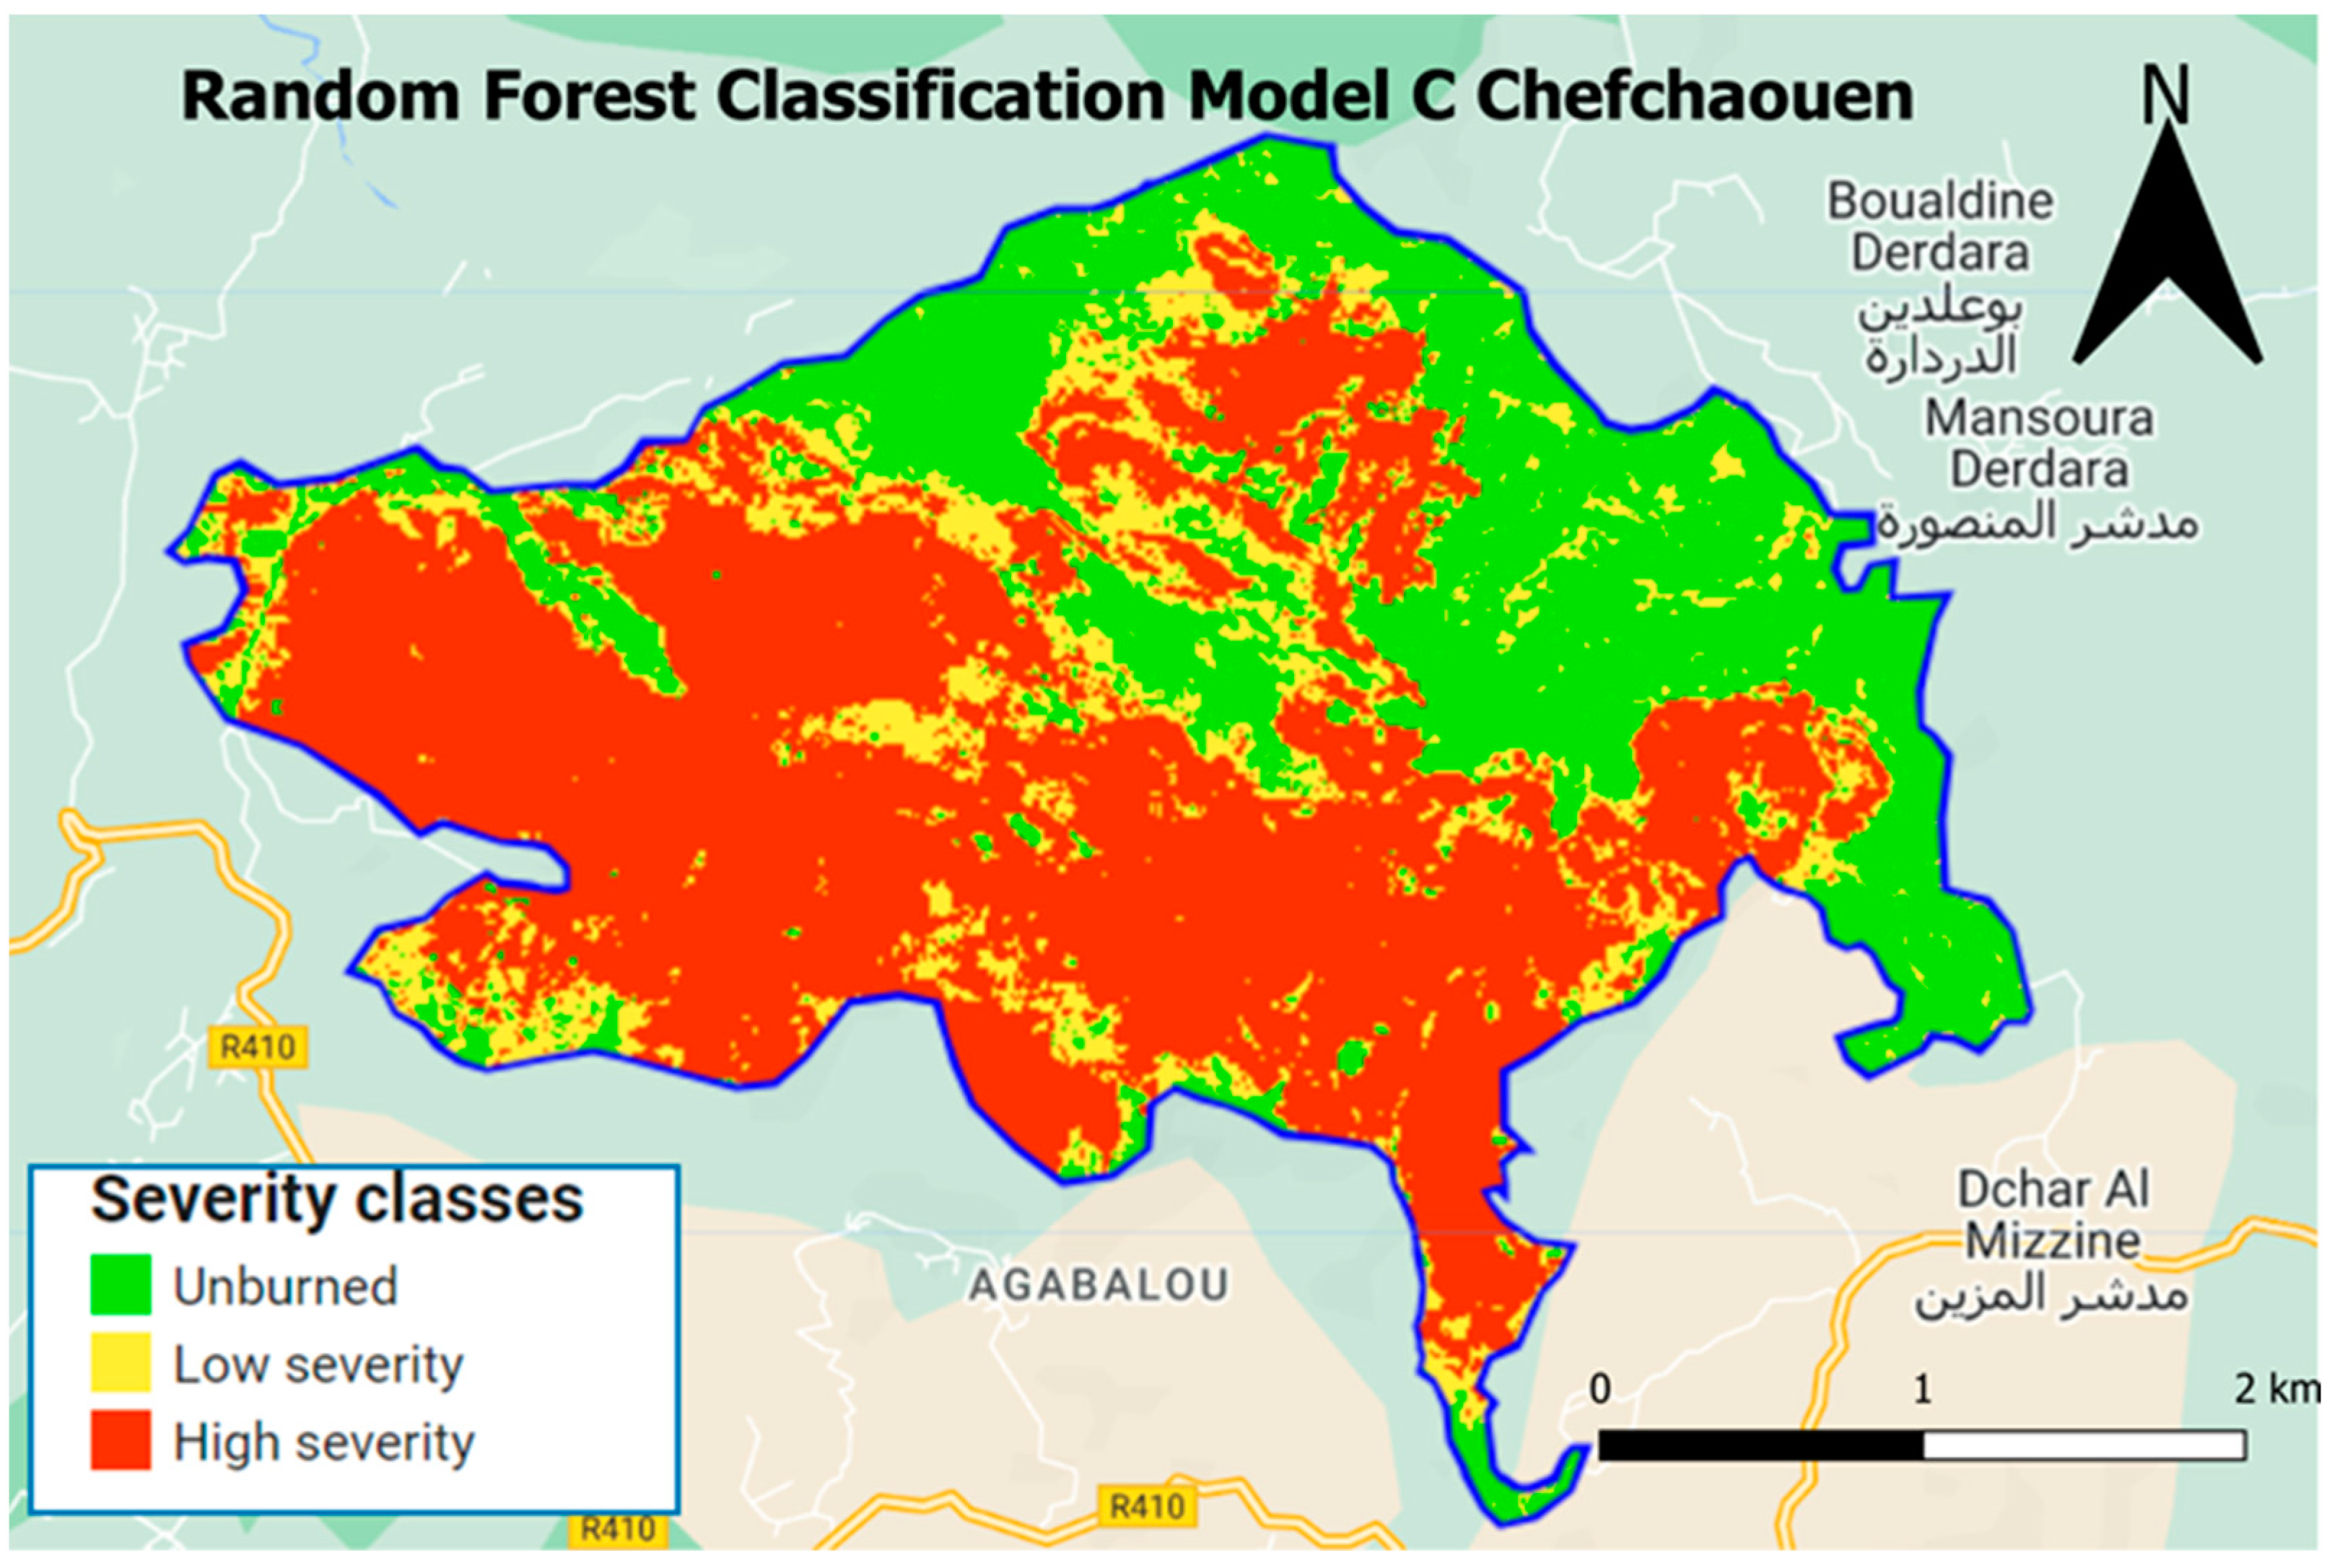
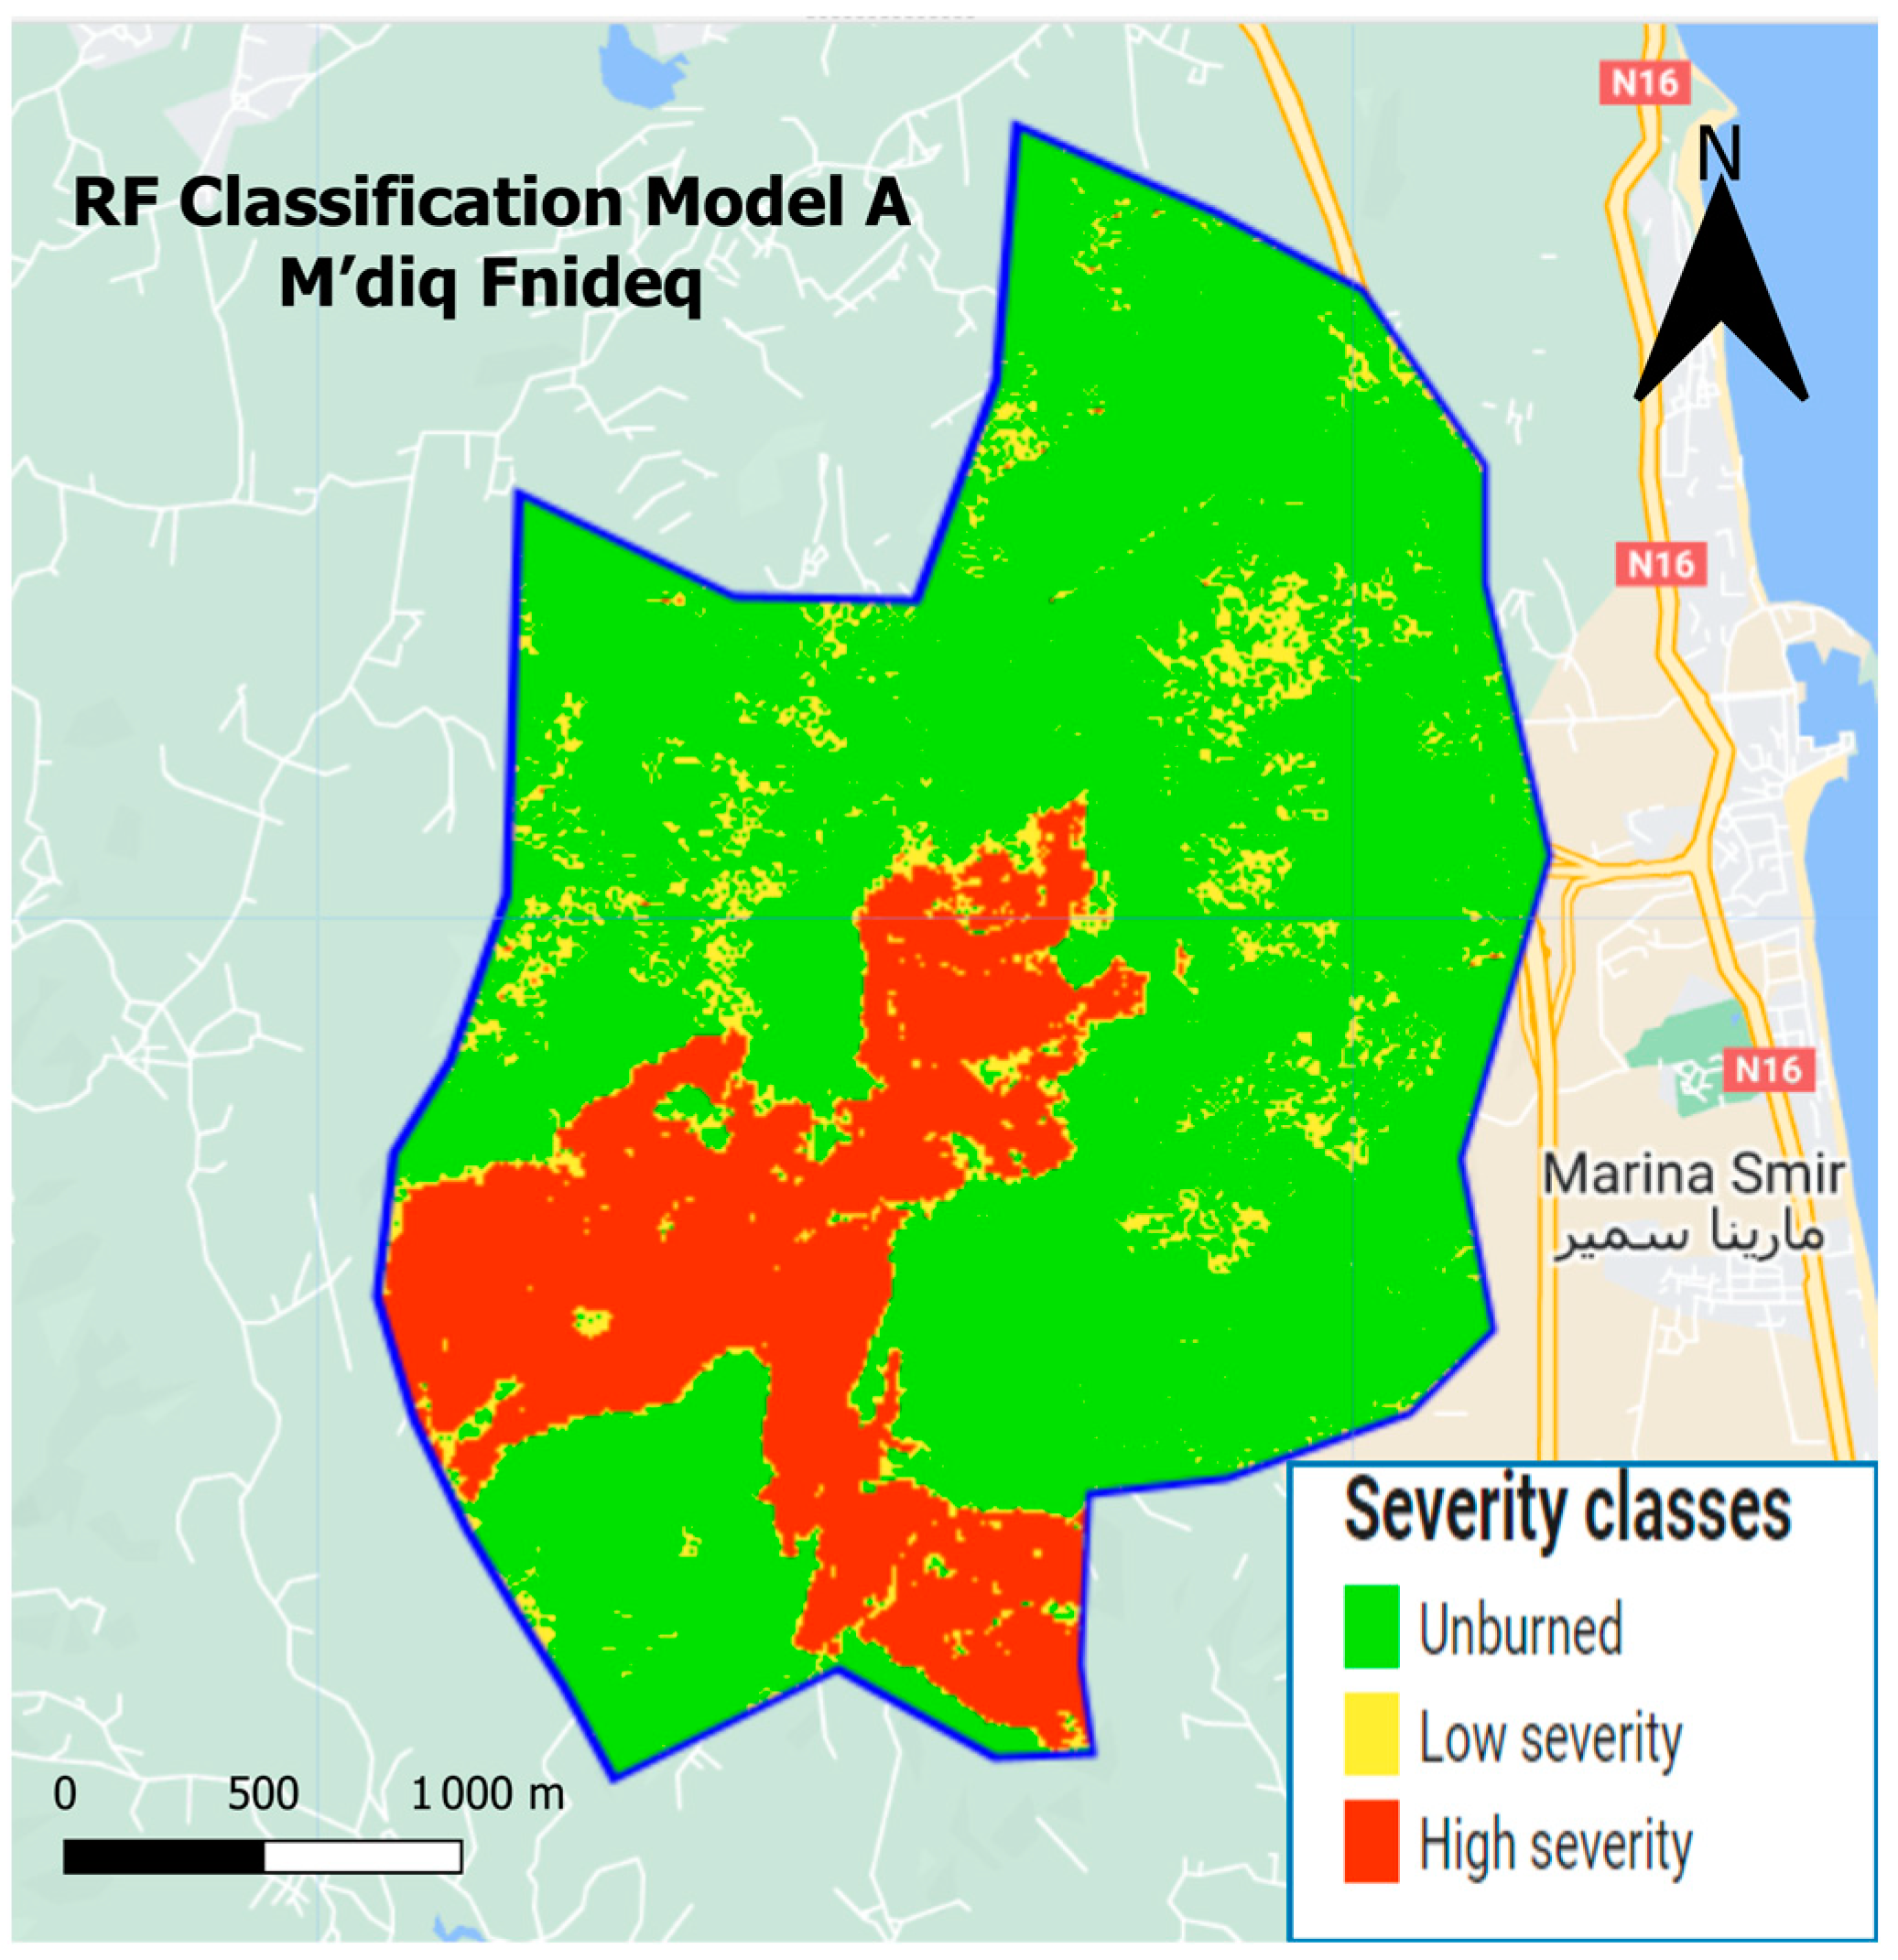
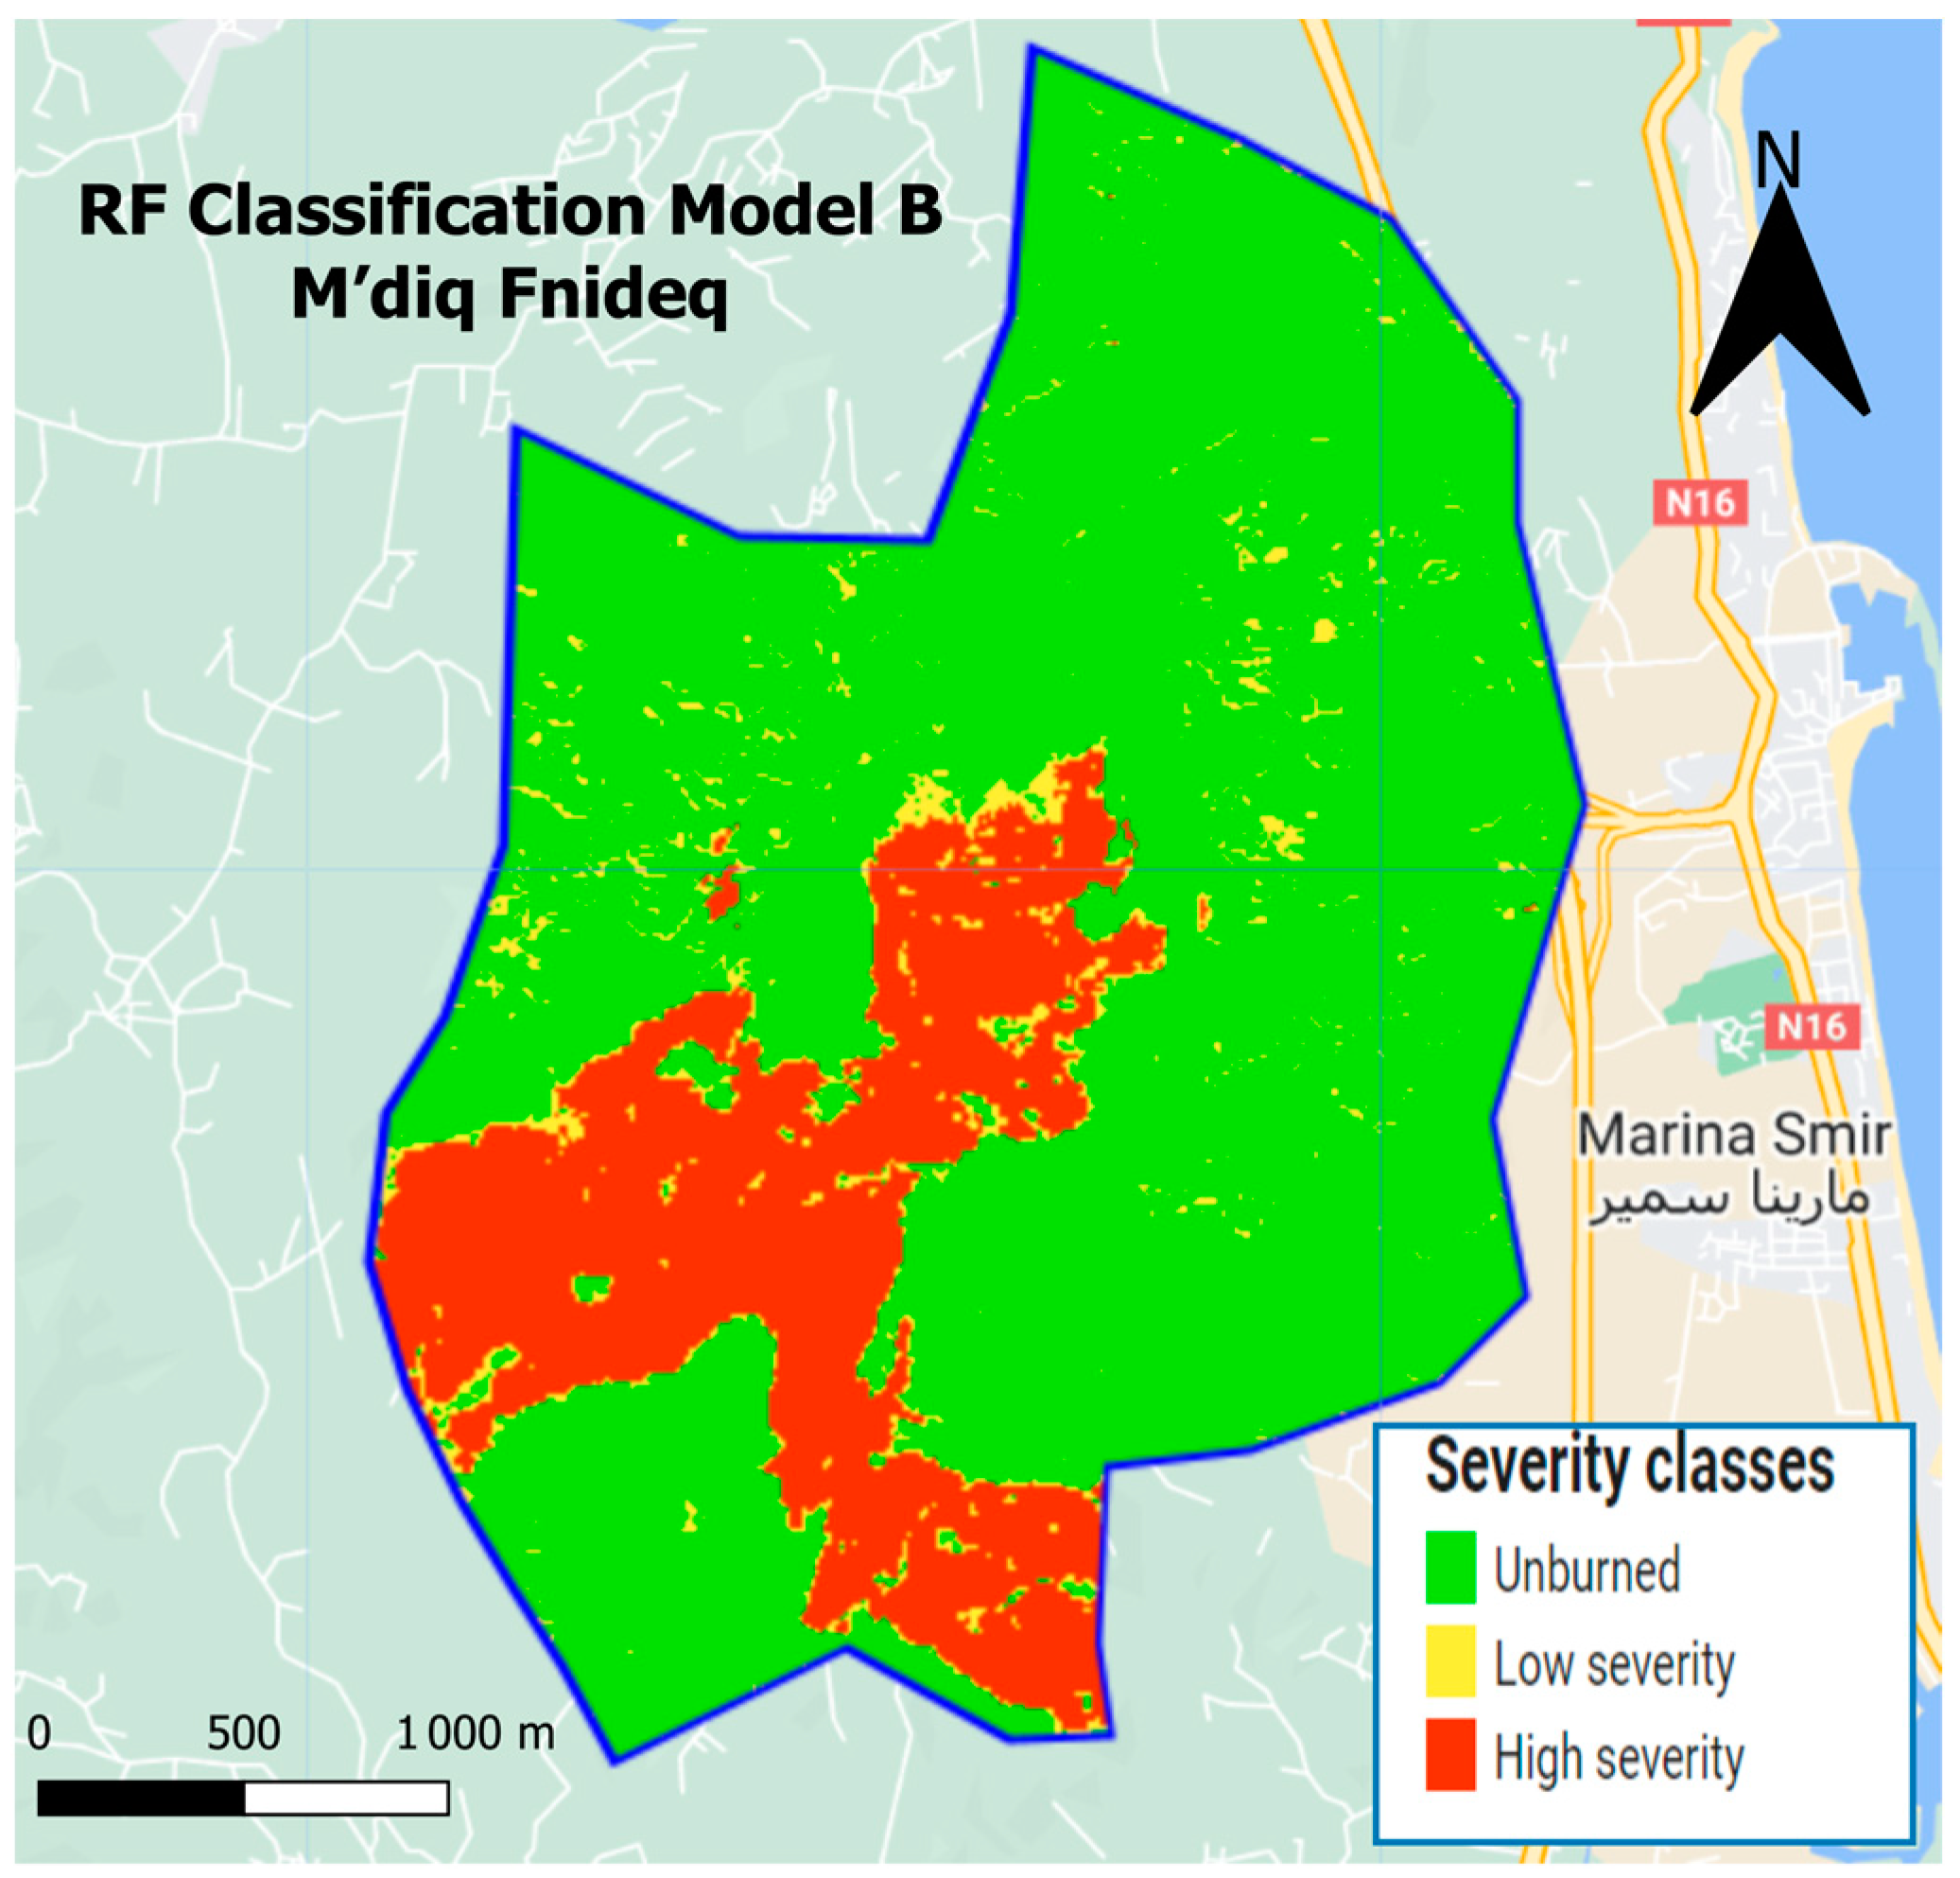
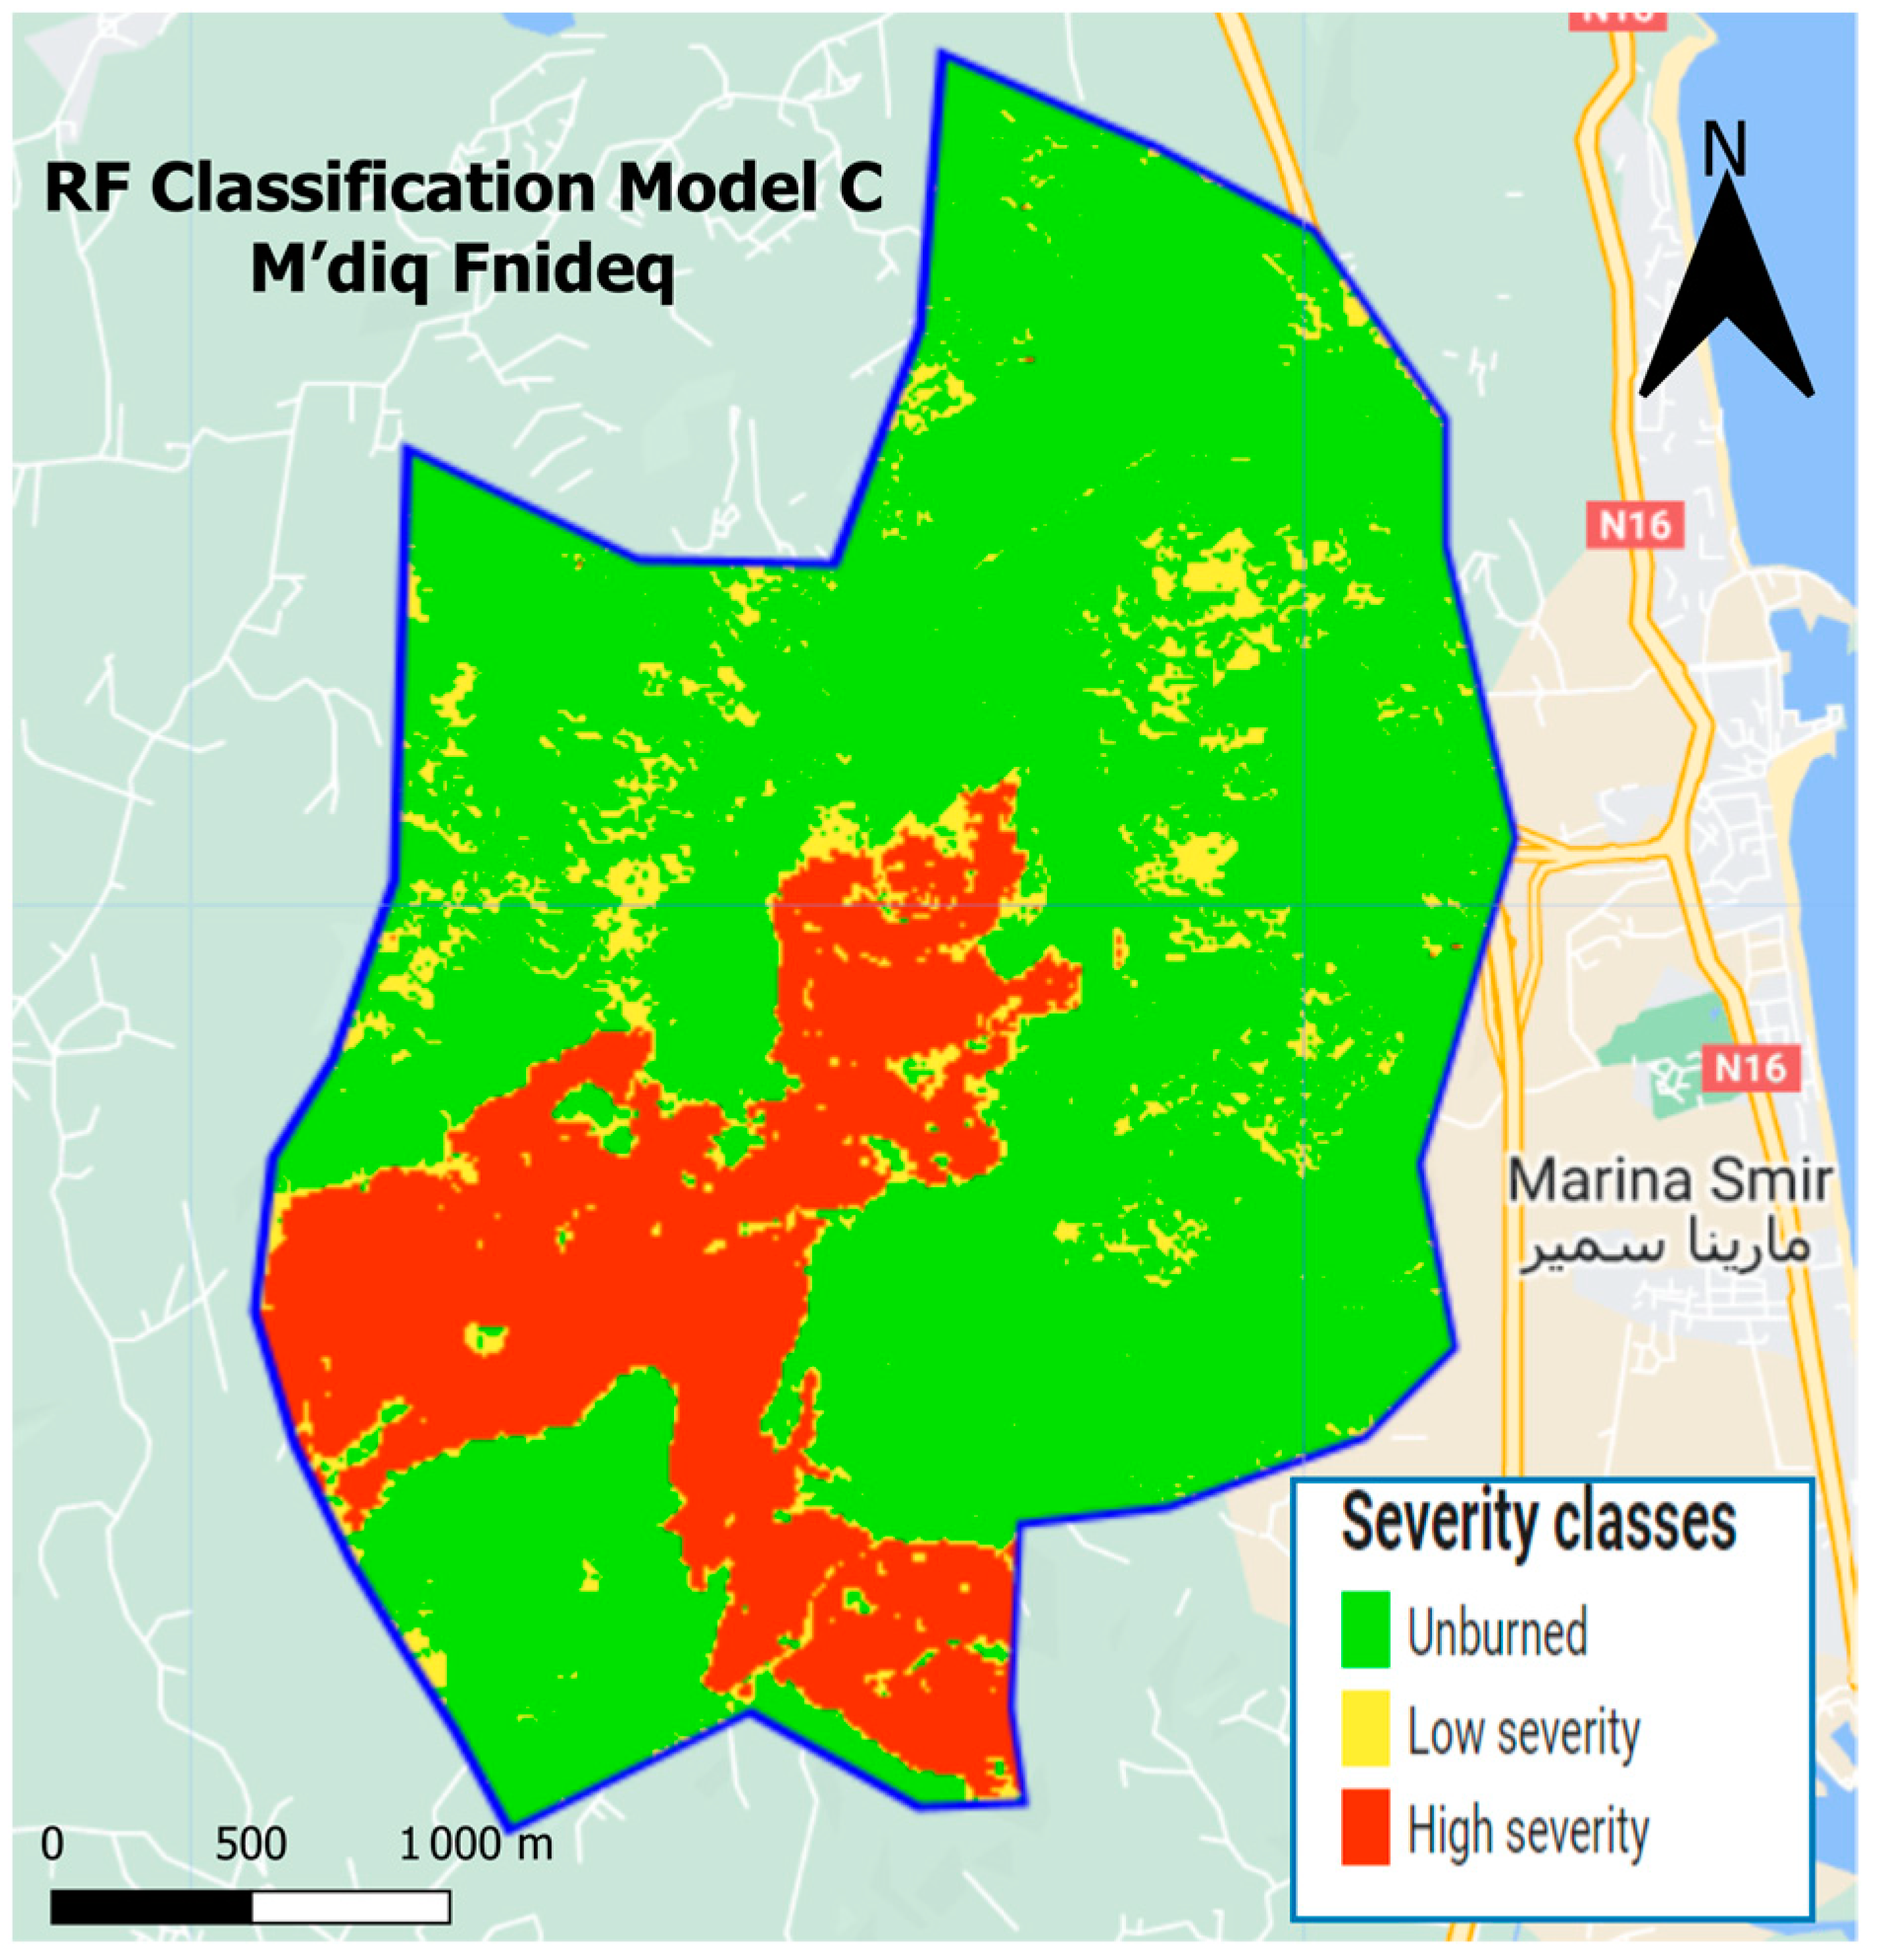
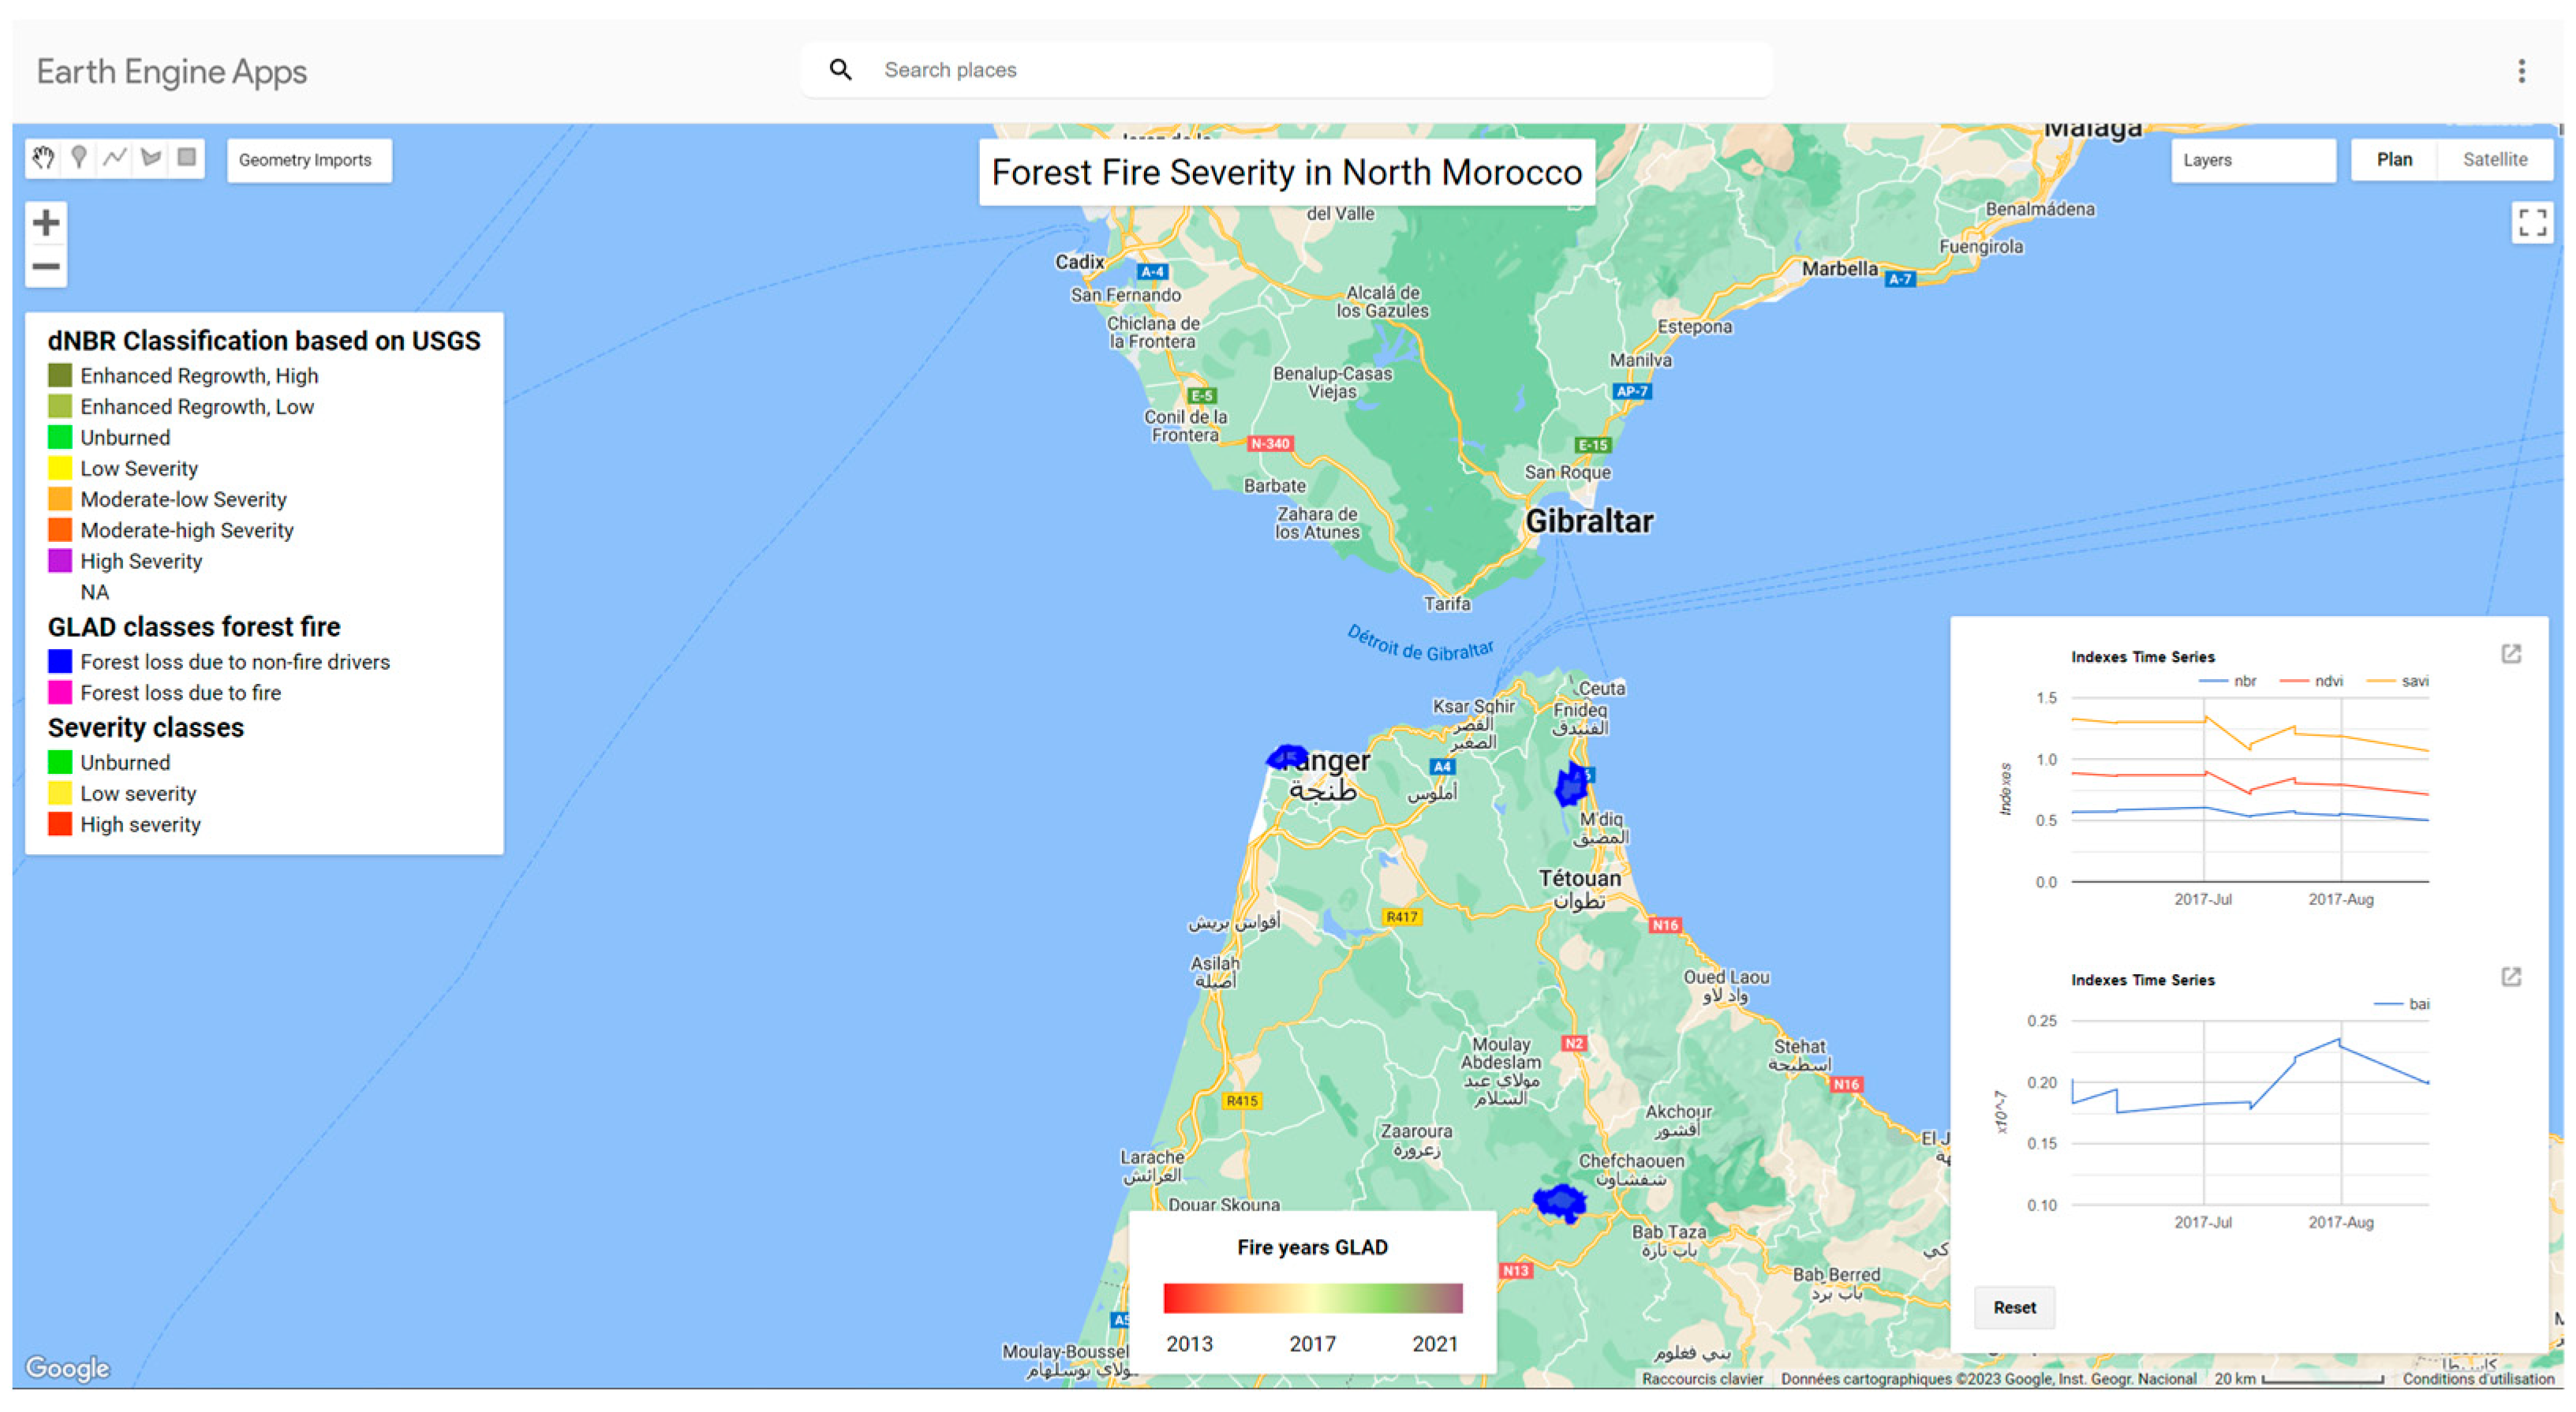
3.5. Results of Mapping the Burned Area on GEE
3.6. Discussion
4. Conclusions
Future Work
Author Contributions
Funding
Data Availability Statement
Conflicts of Interest
References
- Dutra, D.J.; Anderson, L.O.; Fearnside, P.M.; Graça, P.M.L.d.A.; Yanai, A.M.; Dalagnol, R.; Burton, C.; Jones, C.; Betts, R.; Aragão, L.E.O.e.C.d. Fire Dynamics in an Emerging Deforestation Frontier in Southwestern Amazonia, Brazil. Fire 2023, 6, 2. [Google Scholar] [CrossRef]
- Gholamrezaie, H.; Hasanlou, M.; Amani, M.; Mirmazloumi, S.M. Automatic Mapping of Burned Areas Using Landsat 8 Time-Series Images in Google Earth Engine: A Case Study from Iran. Remote Sens. 2022, 14, 6376. [Google Scholar] [CrossRef]
- López-Cruz, S.d.C.; Aryal, D.R.; Velázquez-Sanabria, C.A.; Guevara-Hernández, F.; Venegas-Sandoval, A.; Casanova-Lugo, F.; La O-Arias, M.A.; Venegas-Venegas, J.A.; Reyes-Sosa, M.B.; Pinto-Ruiz, R.; et al. Effect of Prescribed Burning on Tree Diversity, Biomass Stocks and Soil Organic Carbon Storage in Tropical Highland Forests. Forests 2022, 13, 2164. [Google Scholar] [CrossRef]
- Arif, M.; Alghamdi, K.; Sahel, A.; Alosaimi, O.; Alsahaft, E.; Alharthi, A.; Arif, M. Role of Machine Learning Algorithms in Forest Fire Management: A Literature Review. J. Robot. Autom. 2021, 5, 372. [Google Scholar] [CrossRef]
- Baek, S.; Lim, J.; Kim, W. Analysis on the Fire Progression and Severity Variation of the Massive Forest Fire Occurred in Uljin, Korea, 2022. Forests 2022, 13, 2185. [Google Scholar] [CrossRef]
- Liu, J.; Heiskanen, J.; Maeda, E.E.; Pellikka, P.K.E. Burned Area Detection Based on Landsat Time Series in Savannas of Southern Burkina Faso. Int. J. Appl. Earth Obs. Geoinf. 2018, 64, 210–220. [Google Scholar] [CrossRef]
- Bar, S.; Parida, B.R.; Pandey, A.C. Landsat-8 and Sentinel-2 Based Forest Fire Burn Area Mapping Using Machine Learning Algorithms on GEE Cloud Platform over Uttarakhand, Western Himalaya. Remote Sens. Appl. Soc. Environ. 2020, 18, 100324. [Google Scholar] [CrossRef]
- Luz, A.E.O.; Negri, R.G.; Massi, K.G.; Colnago, M.; Silva, E.A.; Casaca, W. Mapping Fire Susceptibility in the Brazilian Amazon Forests Using Multitemporal Remote Sensing and Time-Varying Unsupervised Anomaly Detection. Remote Sens. 2022, 14, 2429. [Google Scholar] [CrossRef]
- Jang, E.; Kang, Y.; Im, J.; Lee, D.-W.; Yoon, J.; Kim, S.-K. Detection and Monitoring of Forest Fires Using Himawari-8 Geostationary Satellite Data in South Korea. Remote Sens. 2019, 11, 271. [Google Scholar] [CrossRef]
- Negri, R.G.; Luz, A.E.O.; Frery, A.C.; Casaca, W. Mapping Burned Areas with Multitemporal–Multispectral Data and Probabilistic Unsupervised Learning. Remote Sens. 2022, 14, 5413. [Google Scholar] [CrossRef]
- Sifakis, N.I.; Iossifidis, C.; Kontoes, C.; Keramitsoglou, I. Wildfire Detection and Tracking over Greece Using MSG-SEVIRI Satellite Data. Remote Sens. 2011, 3, 524–538. [Google Scholar] [CrossRef]
- Meng, R.; Wu, J.; Schwager, K.L.; Zhao, F.; Dennison, P.E.; Cook, B.D.; Brewster, K.; Green, T.M.; Serbin, S.P. Using High Spatial Resolution Satellite Imagery to Map Forest Burn Severity across Spatial Scales in a Pine Barrens Ecosystem. Remote Sens. Environ. 2017, 191, 95–109. [Google Scholar] [CrossRef]
- Liu, S.; Zheng, Y.; Dalponte, M.; Tong, X. A Novel Fire Index-Based Burned Area Change Detection Approach Using Landsat-8 OLI Data. Eur. J. Remote Sens. 2020, 53, 104–112. [Google Scholar] [CrossRef]
- Liu, J.; Maeda, E.E.; Wang, D.; Heiskanen, J. Sensitivity of Spectral Indices on Burned Area Detection Using Landsat Time Series in Savannas of Southern Burkina Faso. Remote Sens. 2021, 13, 2492. [Google Scholar] [CrossRef]
- Rokhmatuloh, A.; Indratmoko, S.; Riyanto, I.; Margatama, L.; Arief, R. Burnt-Area Quick Mapping Method with Synthetic Aperture Radar Data. Appl. Sci. 2022, 12, 11922. [Google Scholar] [CrossRef]
- Gómez, I.; Martín, M.P. Prototyping an Artificial Neural Network for Burned Area Mapping on a Regional Scale in Mediterranean Areas Using MODIS Images. Int. J. Appl. Earth Obs. Geoinf. 2011, 13, 741–752. [Google Scholar] [CrossRef]
- Janiec, P.; Gadal, S. A Comparison of Two Machine Learning Classification Methods for Remote Sensing Predictive Modeling of the Forest Fire in the North-Eastern Siberia. Remote Sens. 2020, 12, 4157. [Google Scholar] [CrossRef]
- Iban, M.C.; Sekertekin, A. Machine Learning Based Wildfire Susceptibility Mapping Using Remotely Sensed Fire Data and GIS: A Case Study of Adana and Mersin Provinces, Turkey. Ecol. Inform. 2022, 69, 101647. [Google Scholar] [CrossRef]
- Tanger-Tetouan-Al Hoceima. Wikipedia 2022.
- Chebli, Y.; Chentouf, M.; Ozer, P.; Hornick, J.-L.; Cabaraux, J.-F. Forest and Silvopastoral Cover Changes and Its Drivers in Northern Morocco. Appl. Geogr. 2018, 101, 23–35. [Google Scholar] [CrossRef]
- Spatial Accessibility of Urban Parks in Tangier City, MOROCCO-ProQuest. Available online: https://www.proquest.com/openview/b618a8410648b9a7f1055cf01f56d322/1?pq-origsite=gscholar&cbl=2037674 (accessed on 12 January 2023).
- Cape Spartel in Tangier: Things to See and How to Get to This Site. Available online: https://www.barcelo.com/guia-turismo/en/morocco/tanger/things-to-do/cape-spartel/ (accessed on 12 January 2023).
- Alasli, M. Static Risk Mapping of Forest Fires in the Case of the Province of Chefchaouen (Morocco). Proc. Int. Cartogr. Assoc. 2019, 2, 1–7. [Google Scholar] [CrossRef]
- Chebli, Y.; El Otmani, S. Mapping Forest and Pasture Cover of Western Rif (Chefchaouen). Afr. Mediterr. Agric. J. Al Awamia 2021, 132, 180–200. [Google Scholar]
- Chebli, Y.; Otmani, S.E.; Chentouf, M.; Hornick, J.-L.; Bindelle, J.; Cabaraux, J.-F. Foraging Behavior of Goats Browsing in Southern Mediterranean Forest Rangeland. Animals 2020, 10, 196. [Google Scholar] [CrossRef]
- Chamal/Tanger-Tetouan-Al Hoceima-Site Officiel. Available online: https://www.visittanger.com/en/nature/jbel-sougna/606ca1d2057e230016cc9af8 (accessed on 12 January 2023).
- Alshawafi, A.; Analla, M.; Alwashali, E.; Ahechti, M.; Aksissou, M. Impacts of Marine Waste, Ingestion of Microplastic in the Fish, Impact on Fishing Yield, M’diq, Morocco. Int. J. Marine Biol. Res. 2018, 3, 1–14. [Google Scholar] [CrossRef] [PubMed]
- Drtta, E. Monographie Préfectorale de Mdiq Fnideq. 2018. Available online: https://www.hcp.ma/region-tanger/Monographie-prefectorale-de-Mdiq-Fnideq-2018_a340.html (accessed on 12 January 2023).
- Nachite, D.; Baijot, E.; Marchesi, N.; Zyadi, F. Plan Local Gizc Pour La Prefecture Littorale De M’diq-Fnideq; SMAP: Cairo, Egypt, 2009. [Google Scholar]
- Roteta, E.; Bastarrika, A.; Ibisate, A.; Chuvieco, E. A Preliminary Global Automatic Burned-Area Algorithm at Medium Resolution in Google Earth Engine. Remote Sens. 2021, 13, 4298. [Google Scholar] [CrossRef]
- Sonia; Ghosh, T.; Gacem, A.; Alsufyani, T.; Alam, M.M.; Yadav, K.K.; Amanullah, M.; Cabral-Pinto, M.M.S. Geospatial Evaluation of Cropping Pattern and Cropping Intensity Using Multi Temporal Harmonized Product of Sentinel-2 Dataset on Google Earth Engine. Appl. Sci. 2022, 12, 12583. [Google Scholar] [CrossRef]
- Tagestad, J.D.; Saltiel, T.M.; Coleman, A.M. Rapid Spaceborne Mapping of Wildfire Retardant Drops for Active Wildfire Management. Remote Sens. 2023, 15, 342. [Google Scholar] [CrossRef]
- Martínez-Casasnovas, J.A.; Escolà, A.; Arnó, J. Use of Farmer Knowledge in the Delineation of Potential Management Zones in Precision Agriculture: A Case Study in Maize (Zea mays L.). Agriculture 2018, 8, 84. [Google Scholar] [CrossRef]
- Praticò, S.; Solano, F.; Di Fazio, S.; Modica, G. Machine Learning Classification of Mediterranean Forest Habitats in Google Earth Engine Based on Seasonal Sentinel-2 Time-Series and Input Image Composition Optimisation. Remote Sens. 2021, 13, 586. [Google Scholar] [CrossRef]
- Kumar, L.; Mutanga, O. Google Earth Engine Applications Since Inception: Usage, Trends, and Potential. Remote Sens. 2018, 10, 1509. [Google Scholar] [CrossRef]
- Piao, Y.; Lee, D.; Park, S.; Kim, H.G.; Jin, Y. Forest Fire Susceptibility Assessment Using Google Earth Engine in Gangwon-Do, Republic of Korea. Geomat. Nat. Hazards Risk 2022, 13, 432–450. [Google Scholar] [CrossRef]
- Teluguntla, P.; Thenkabail, P.S.; Oliphant, A.; Xiong, J.; Gumma, M.K.; Congalton, R.G.; Yadav, K.; Huete, A. A 30-m Landsat-Derived Cropland Extent Product of Australia and China Using Random Forest Machine Learning Algorithm on Google Earth Engine Cloud Computing Platform. ISPRS J. Photogramm. Remote Sens. 2018, 144, 325–340. [Google Scholar] [CrossRef]
- Çolak, E.; Sunar, F. The Importance of Ground-Truth and Crowdsourcing Data for the Statistical and Spatial Analyses of the NASA FIRMS Active Fires in the Mediterranean Turkish Forests. Remote Sens. Appl. Soc. Environ. 2020, 19, 100327. [Google Scholar] [CrossRef]
- NASA; LANCE Firms. Available online: https://firms.modaps.eosdis.nasa.gov/ (accessed on 12 January 2023).
- Roteta, E.; Bastarrika, A.; Franquesa, M.; Chuvieco, E. Landsat and Sentinel-2 Based Burned Area Mapping Tools in Google Earth Engine. Remote Sens. 2021, 13, 816. [Google Scholar] [CrossRef]
- Price, C.; Elsner, P. Uncertainty of Historic GLAD Forest Data in Temperate Climates and Implications for Forest Change Modelling. ISPRS Int. J. Geo-Inf. 2022, 11, 177. [Google Scholar] [CrossRef]
- GLAD. Global Land Cover and Land Use Change, 2000–2020. Available online: https://glad.umd.edu/dataset/GLCLUC2020 (accessed on 12 January 2023).
- Ballère, M.; Bouvet, A.; Mermoz, S.; Le Toan, T.; Koleck, T.; Bedeau, C.; André, M.; Forestier, E.; Frison, P.-L.; Lardeux, C. SAR Data for Tropical Forest Disturbance Alerts in French Guiana: Benefit over Optical Imagery. Remote Sens. Environ. 2021, 252, 112159. [Google Scholar] [CrossRef]
- GLAD. Deforestation Alerts, Explained|Global Forest Watch Blog. Available online: https://www.globalforestwatch.org/blog/data-and-research/glad-deforestation-alerts/ (accessed on 12 January 2023).
- Alcaras, E.; Costantino, D.; Guastaferro, F.; Parente, C.; Pepe, M. Normalized Burn Ratio Plus (NBR+): A New Index for Sentinel-2 Imagery. Remote Sens. 2022, 14, 1727. [Google Scholar] [CrossRef]
- Arisanty, D.; Feindhi Ramadhan, M.; Angriani, P.; Muhaimin, M.; Nur Saputra, A.; Puji Hastuti, K.; Rosadi, D. Utilizing Sentinel-2 Data for Mapping Burned Areas in Banjarbaru Wetlands, South Kalimantan Province. Int. J. For. Res. 2022, 2022, e7936392. [Google Scholar] [CrossRef]
- Meneses, B.M. Vegetation Recovery Patterns in Burned Areas Assessed with Landsat 8 OLI Imagery and Environmental Biophysical Data. Fire 2021, 4, 76. [Google Scholar] [CrossRef]
- Burnt Area Mapping Using Sentinel-2 Data—Digital Earth Africa 2021 Documentation. Available online: https://docs.digitalearthafrica.org/en/latest/sandbox/notebooks/Real_world_examples/Burnt_area_mapping.html (accessed on 12 January 2023).
- Avetisyan, D.; Velizarova, E.; Filchev, L. Post-Fire Forest Vegetation State Monitoring through Satellite Remote Sensing and In Situ Data. Remote Sens. 2022, 14, 6266. [Google Scholar] [CrossRef]
- GISGeography. What Is NDVI (Normalized Difference Vegetation Index)? Available online: https://gisgeography.com/ndvi-normalized-difference-vegetation-index/ (accessed on 12 January 2023).
- Farooq, A. Spectral Vegetation Indices Performance Evaluated for Cholistan Desert. J. Geogr. Reg. Plann. 2012, 5, 98. [Google Scholar] [CrossRef]
- Teshaev, N.; Mamadaliyev, B.; Ibragimov, A.; Khasanov, S. The Soil-Adjusted Vegetation Index for Soil Salinity Assessment in Uzbekistan. ICIGIS 2020, 26, 324–333. [Google Scholar] [CrossRef]
- Burn Indices Background. Available online: https://www.l3harrisgeospatial.com/docs/backgroundburnindices.html (accessed on 12 January 2023).
- Martín, M.; Gómez, I.; Chuvieco, E. Burnt Area Index (BAIM) for Burned Area Discrimination at Regional Scale Using MODIS Data. For. Ecol. Manag. 2006, 234, S221. [Google Scholar] [CrossRef]
- Chuvieco, E.; Martín, M.P.; Palacios, A. Assessment of Different Spectral Indices in the Red-near-Infrared Spectral Domain for Burned Land Discrimination. Int. J. Remote Sens. 2002, 23, 5103–5110. [Google Scholar] [CrossRef]
- Yu, Z.; Di, L.; Rahman, M.S.; Tang, J. Fishpond Mapping by Spectral and Spatial-Based Filtering on Google Earth Engine: A Case Study in Singra Upazila of Bangladesh. Remote Sens. 2020, 12, 2692. [Google Scholar] [CrossRef]
- Rybansky, M. Determination of Forest Structure from Remote Sensing Data for Modeling the Navigation of Rescue Vehicles. Appl. Sci. 2022, 12, 3939. [Google Scholar] [CrossRef]
- Ganteaume, A.; Camia, A.; Jappiot, M.; San-Miguel-Ayanz, J.; Long-Fournel, M.; Lampin, C. A Review of the Main Driving Factors of Forest Fire Ignition Over Europe. Environ. Manag. 2013, 51, 651–662. [Google Scholar] [CrossRef]
- Tazmul Islam, M.; Meng, Q. An Exploratory Study of Sentinel-1 SAR for Rapid Urban Flood Mapping on Google Earth Engine. Int. J. Appl. Earth Obs. Geoinf. 2022, 113, 103002. [Google Scholar] [CrossRef]
- Morocco: Forest Fire near Tangier June 30–July 4|Crisis24. Available online: https://crisis24.garda.com/alerts/2017/07/morocco-forest-fire-near-tangier-june-30-july-4?origin=fr_riskalert (accessed on 12 January 2023).
- Morocco World News. Available online: https://morocco1039.rssing.com/chan-55514505/all_p647.html (accessed on 12 January 2023).
- Chefchaouen. Sougna Wildfire “Under Control”, Nearly 1100 Ha of Vegetation Ravaged. Available online: https://maroc.ma/en/news/chefchaouen-sougna-wildfire-under-control-nearly-1100-ha-vegetation-ravaged (accessed on 12 January 2023).
- Traganos, D.; Poursanidis, D.; Aggarwal, B.; Chrysoulakis, N.; Reinartz, P. Estimating Satellite-Derived Bathymetry (SDB) with the Google Earth Engine and Sentinel-2. Remote Sens. 2018, 10, 859. [Google Scholar] [CrossRef]
- Lee, C.; Park, S.; Kim, T.; Liu, S.; Md Reba, M.N.; Oh, J.; Han, Y. Machine Learning-Based Forest Burned Area Detection with Various Input Variables: A Case Study of South Korea. Appl. Sci. 2022, 12, 10077. [Google Scholar] [CrossRef]
- Sukojo, B.M.; Arimurti, A.S.P. Forest Fire Mapping Using Normalized Burned Ratio and Cloud Computing to Calculate the Losses Incurred in Mount Lawu, Magetan Regency. IOP Conf. Ser. Earth Environ. Sci. 2021, 936, 012002. [Google Scholar] [CrossRef]
- Available online: https://redd.unfccc.int/files/annex_8_mapaa_methodologyresults_ug_frl_1_.pdf (accessed on 10 July 2023).
- 33 Accuracy Assessment–Geemap. Available online: https://geemap.org/notebooks/33_accuracy_assessment/#export-the-result (accessed on 12 January 2023).
- Accuracy Metrics. Available online: http://gsp.humboldt.edu/olm/Courses/GSP_216/lessons/accuracy/metrics.html (accessed on 12 January 2023).
- Shin, T. Understanding Feature Importance and How to Implement It in Python. Available online: https://towardsdatascience.com/understanding-feature-importance-and-how-to-implement-it-in-python-ff0287b20285 (accessed on 10 July 2023).
- Zhang, Y.; Yang, W.; Sun, Y.; Chang, C.; Yu, J.; Zhang, W. Fusion of Multispectral Aerial Imagery and Vegetation Indices for Machine Learning-Based Ground Classification. Remote Sens. 2021, 13, 1411. [Google Scholar] [CrossRef]


| Band Number | Band Name | Central Wavelength (nm) | Bandwidth (nm) |
|---|---|---|---|
| 1 | Coastal aerosol | 443.9 | 27 |
| 2 | Blue | 496.6 | 98 |
| 3 | Green | 560.0 | 45 |
| 4 | Red | 664.5 | 38 |
| 5 | Red Edge 1 | 703.9 | 19 |
| 6 | Red Edge 2 | 740.2 | 18 |
| 7 | Red Edge 3 | 782.5 | 28 |
| 8 | NIR | 835.1 | 145 |
| 8A | Narrow NIR | 864.8 | 33 |
| 9 | Water vapor | 945.0 | 26 |
| 10 | SWIR-Cirrus | 1373.5 | 75 |
| 11 | SWIR 1 | 1613.7 | 143 |
| 12 | SWIR 2 | 2202.4 | 242 |
| Range | SAVI Classification |
|---|---|
| −1.5–0 | Water |
| 0.01–0.37 | High salinity |
| 0.38–0.76 | Moderate salinity |
| 0.77–1.10 | Weak salinity |
| 1.11–1.50 | No salinity |
| Area | Pre-Fire Start | Pre-Fire End | Post-Fire Start | Post-Fire End |
|---|---|---|---|---|
| Tangier | 01-06-2017 | 20-06-2017 | 01-08-2017 | 30-08-2017 |
| M’diq Fnideq | 01-07-2020 | 30-07-2020 | 01-10-2020 | 30-10-2020 |
| Chefchaouen | 01-07-2021 | 30-07-2021 | 01-10-2021 | 30-10-2021 |
| Severity Color | Range | Burn Severity |
|---|---|---|
 | <−0.25 | High post-fire regrowth |
 | −0.25 to −0.1 | Low post-fire regrowth |
 | −0.1 to +0.1 | Unburned |
 | 0.1 to 0.27 | Low severity |
 | 0.27 to 0.44 | Moderate–low severity |
 | 0.44 to 0.66 | Moderate–high severity |
 | >0.66 | High severity |
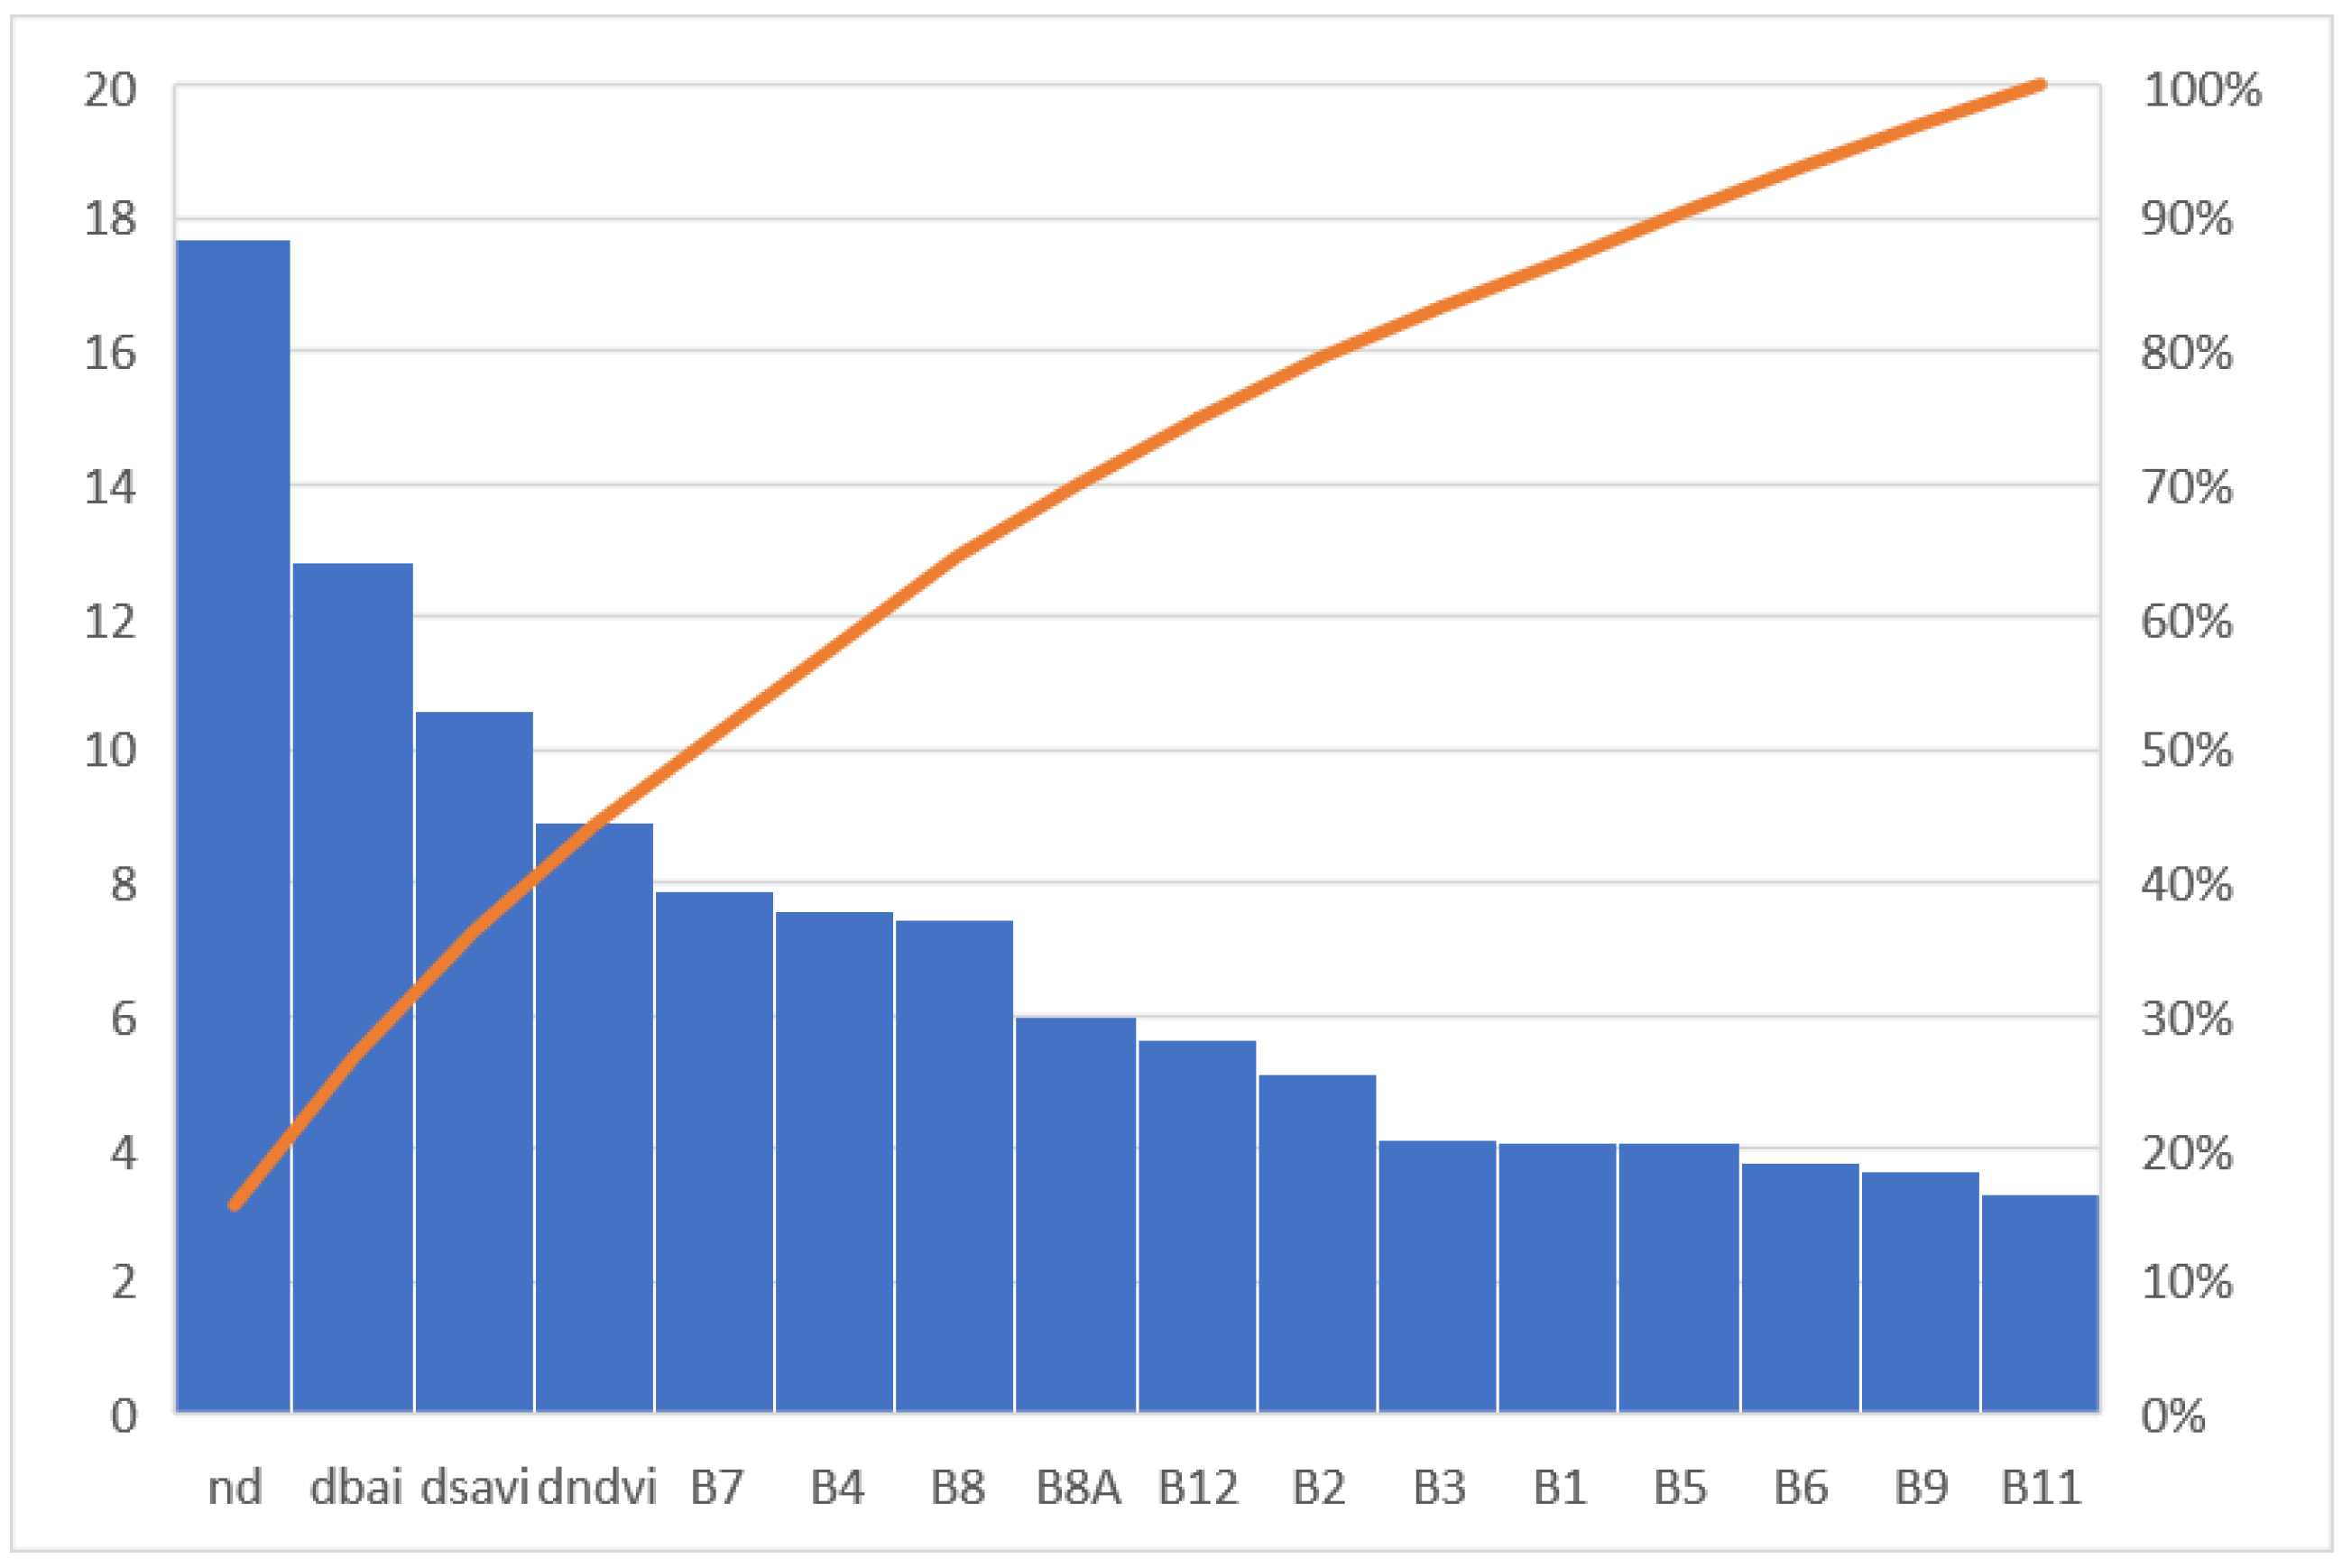
| Band | Feature Importance Score | Feature Importance Score % | Cumulative Importance |
|---|---|---|---|
| nd | 17,689 | 16% | 16% |
| dbai | 12,809 | 11% | 27% |
| dsavi | 10,605 | 9% | 36% |
| dndvi | 8908 | 8% | 44% |
| B7 | 7869 | 7% | 51% |
| B4 | 7579 | 7% | 58% |
| B8 | 7473 | 7% | 65% |
| B8A | 5995 | 5% | 70% |
| B12 | 5641 | 5% | 75% |
| B2 | 5136 | 5% | 80% |
| B3 | 4151 | 4% | 83% |
| B1 | 4098 | 4% | 87% |
| B5 | 4092 | 4% | 90% |
| B6 | 3809 | 3% | 94% |
| B9 | 3651 | 3% | 97% |
| B11 | 3323 | 3% | 100% |
| Model | Number of Indices |
|---|---|
| Model A | 1 (dNBR) |
| Model B | 16 (dNBR, dNDVI, dSAVI, dBAI, twelve bands of S2) |
| Model C | 4 (dNBR, dNDVI, dSAVI, dBAI) |
| Overall Model A | Overall Model B | Overall Model C | Kappa Model A | Kappa Model B | Kappa Model C |
|---|---|---|---|---|---|
| 83% | 95% | 96% | 75% | 92% | 94% |
| Area | Overall Accuracy | Kappa Accuracy |
|---|---|---|
| Chefchaouen | 90% | 85% |
| M’diq Fnideq | 82% | 73% |
| Area | Overall Accuracy | Kappa Accuracy |
|---|---|---|
| Chefchaouen | 87% | 81% |
| M’diq Fnideq | 88% | 82% |
| Area | Overall Accuracy | Kappa Accuracy |
|---|---|---|
| Chefchaouen | 96% | 94% |
| M’diq Fnideq | 97% | 95% |
Disclaimer/Publisher’s Note: The statements, opinions and data contained in all publications are solely those of the individual author(s) and contributor(s) and not of MDPI and/or the editor(s). MDPI and/or the editor(s) disclaim responsibility for any injury to people or property resulting from any ideas, methods, instructions or products referred to in the content. |
© 2023 by the authors. Licensee MDPI, Basel, Switzerland. This article is an open access article distributed under the terms and conditions of the Creative Commons Attribution (CC BY) license (https://creativecommons.org/licenses/by/4.0/).
Share and Cite
Badda, H.; Cherif, E.K.; Boulaassal, H.; Wahbi, M.; Yazidi Alaoui, O.; Maatouk, M.; Bernardino, A.; Coren, F.; El Kharki, O. Improving the Accuracy of Random Forest Classifier for Identifying Burned Areas in the Tangier-Tetouan-Al Hoceima Region Using Google Earth Engine. Remote Sens. 2023, 15, 4226. https://doi.org/10.3390/rs15174226
Badda H, Cherif EK, Boulaassal H, Wahbi M, Yazidi Alaoui O, Maatouk M, Bernardino A, Coren F, El Kharki O. Improving the Accuracy of Random Forest Classifier for Identifying Burned Areas in the Tangier-Tetouan-Al Hoceima Region Using Google Earth Engine. Remote Sensing. 2023; 15(17):4226. https://doi.org/10.3390/rs15174226
Chicago/Turabian StyleBadda, Houda, El Khalil Cherif, Hakim Boulaassal, Miriam Wahbi, Otmane Yazidi Alaoui, Mustapha Maatouk, Alexandre Bernardino, Franco Coren, and Omar El Kharki. 2023. "Improving the Accuracy of Random Forest Classifier for Identifying Burned Areas in the Tangier-Tetouan-Al Hoceima Region Using Google Earth Engine" Remote Sensing 15, no. 17: 4226. https://doi.org/10.3390/rs15174226