
An Interferometric-Synthetic-Aperture-Radar-Based Method for Predicting Long-Term Land Subsidence in Goafs through the Concatenation of Multiple Sources of Short-Term Monitoring Data


Abstract
:1. Introduction
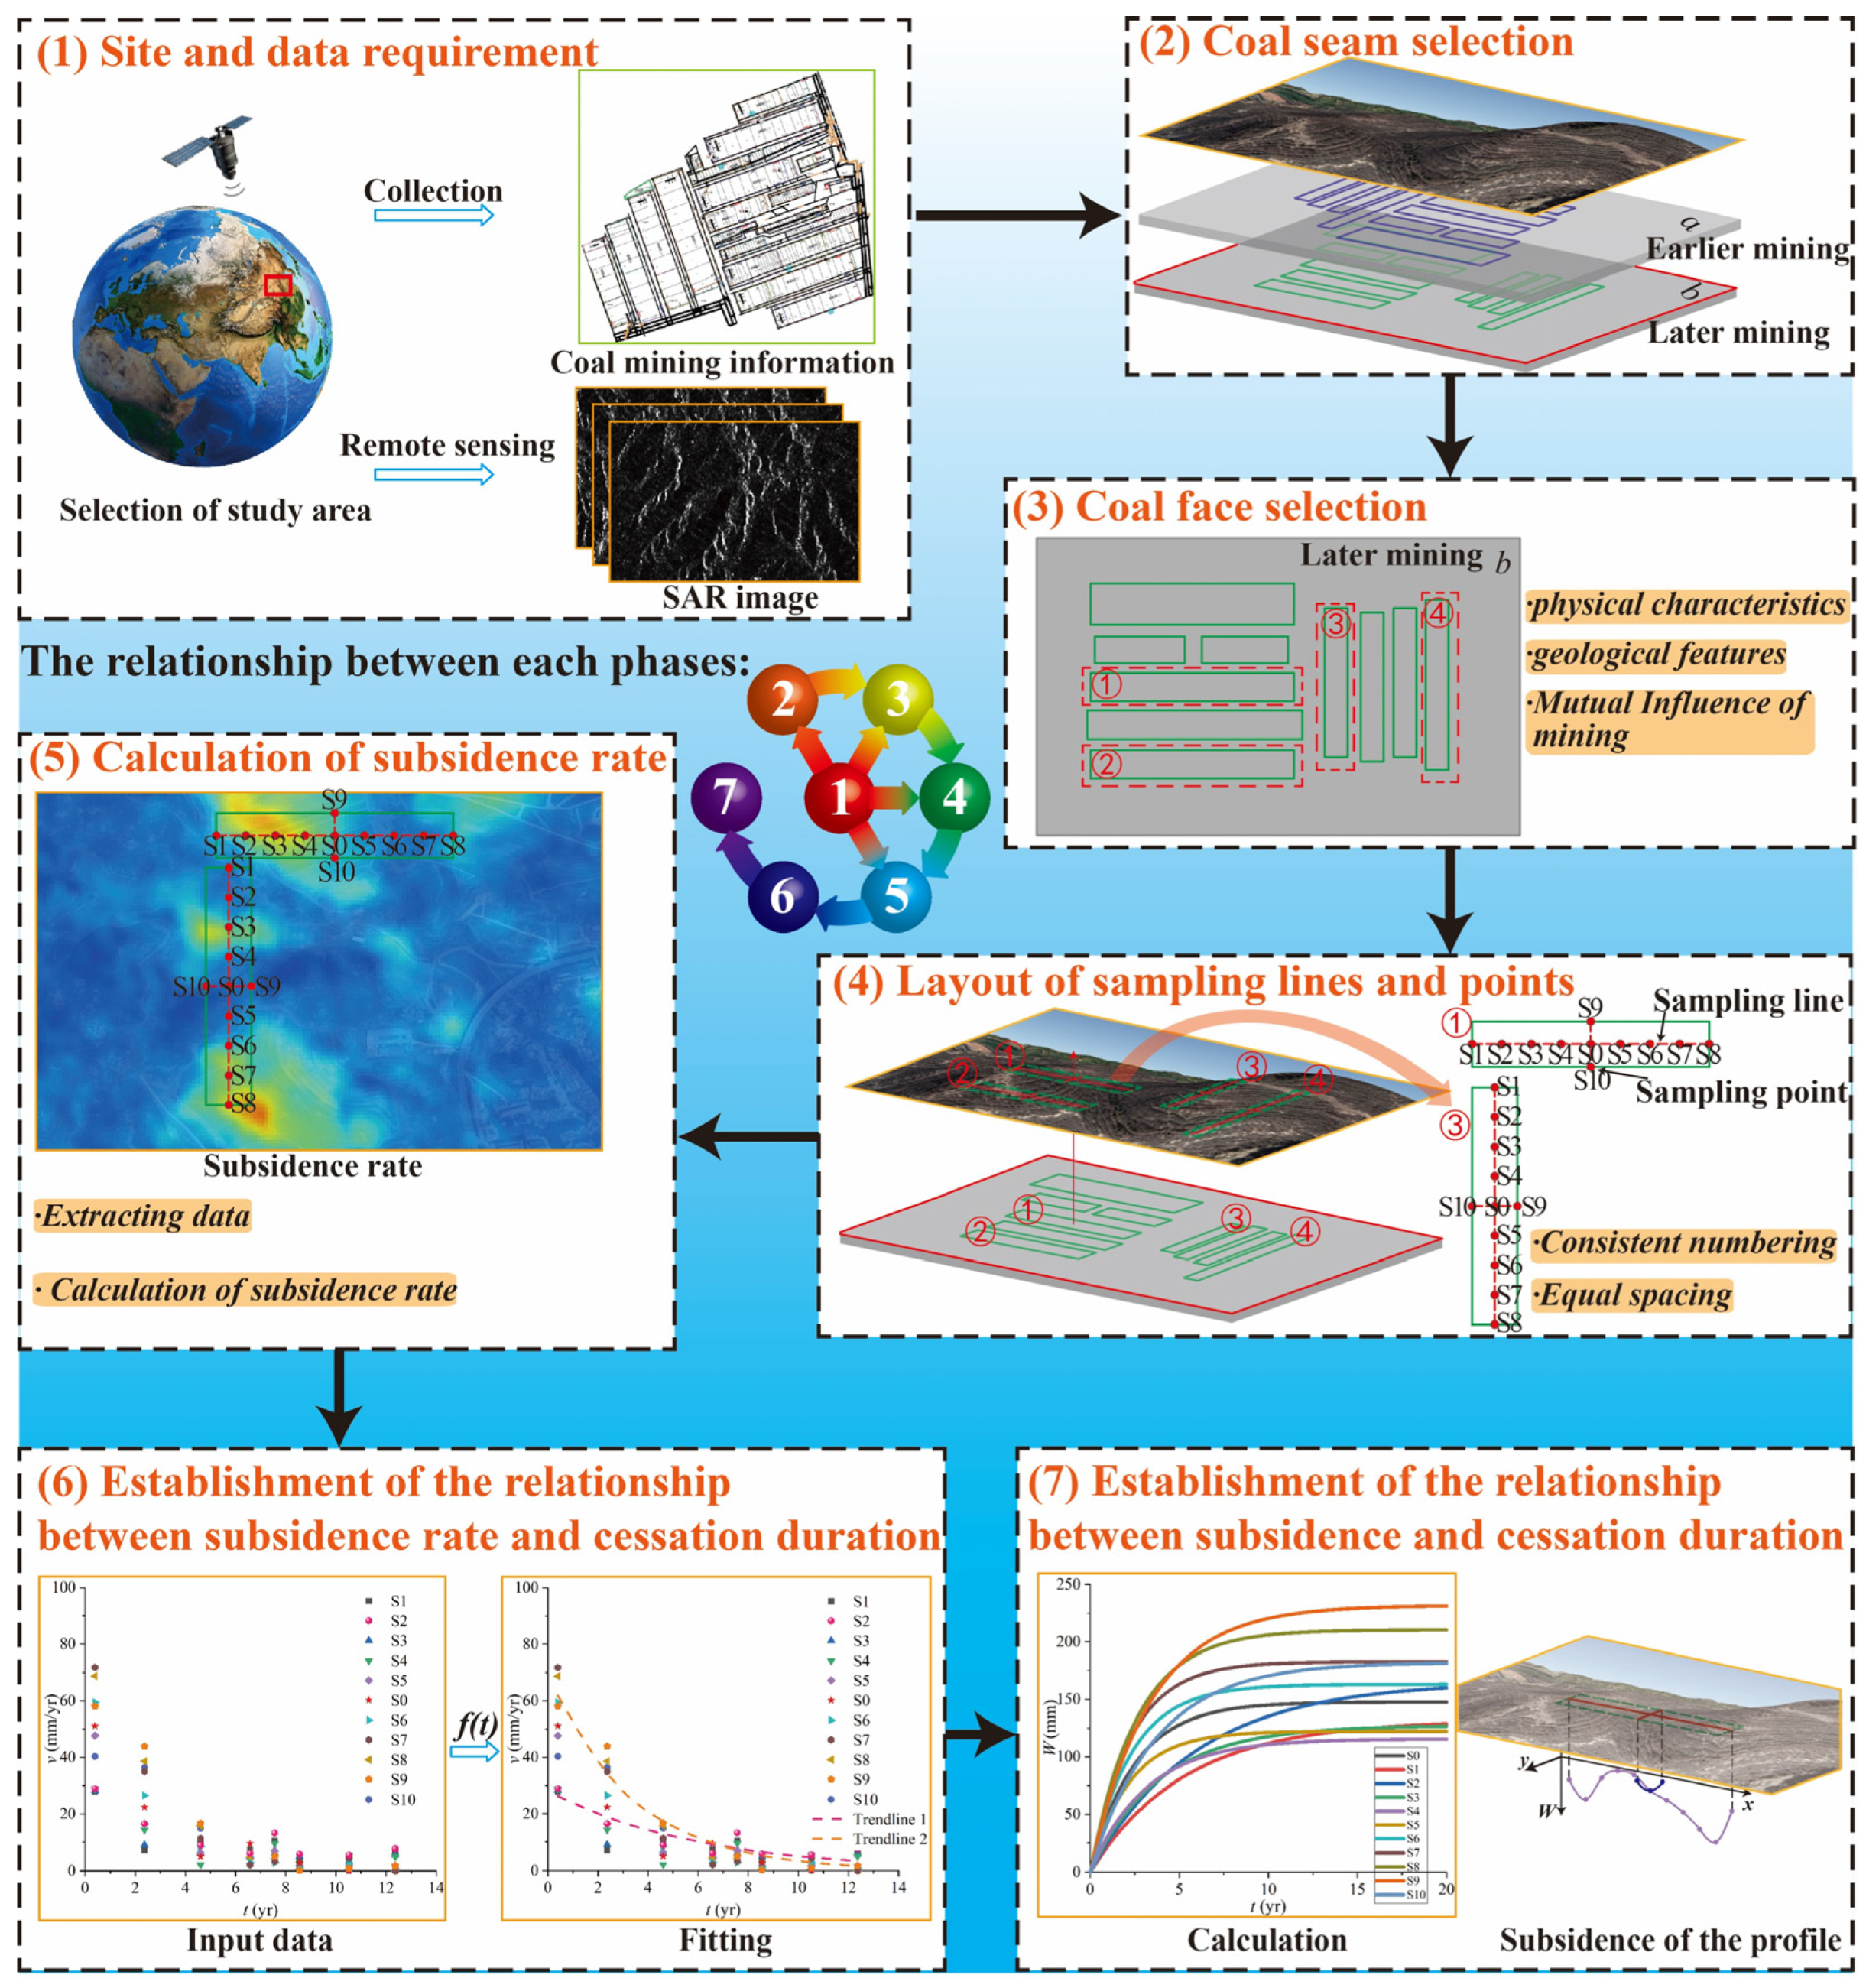
2. Methodology
3. Application
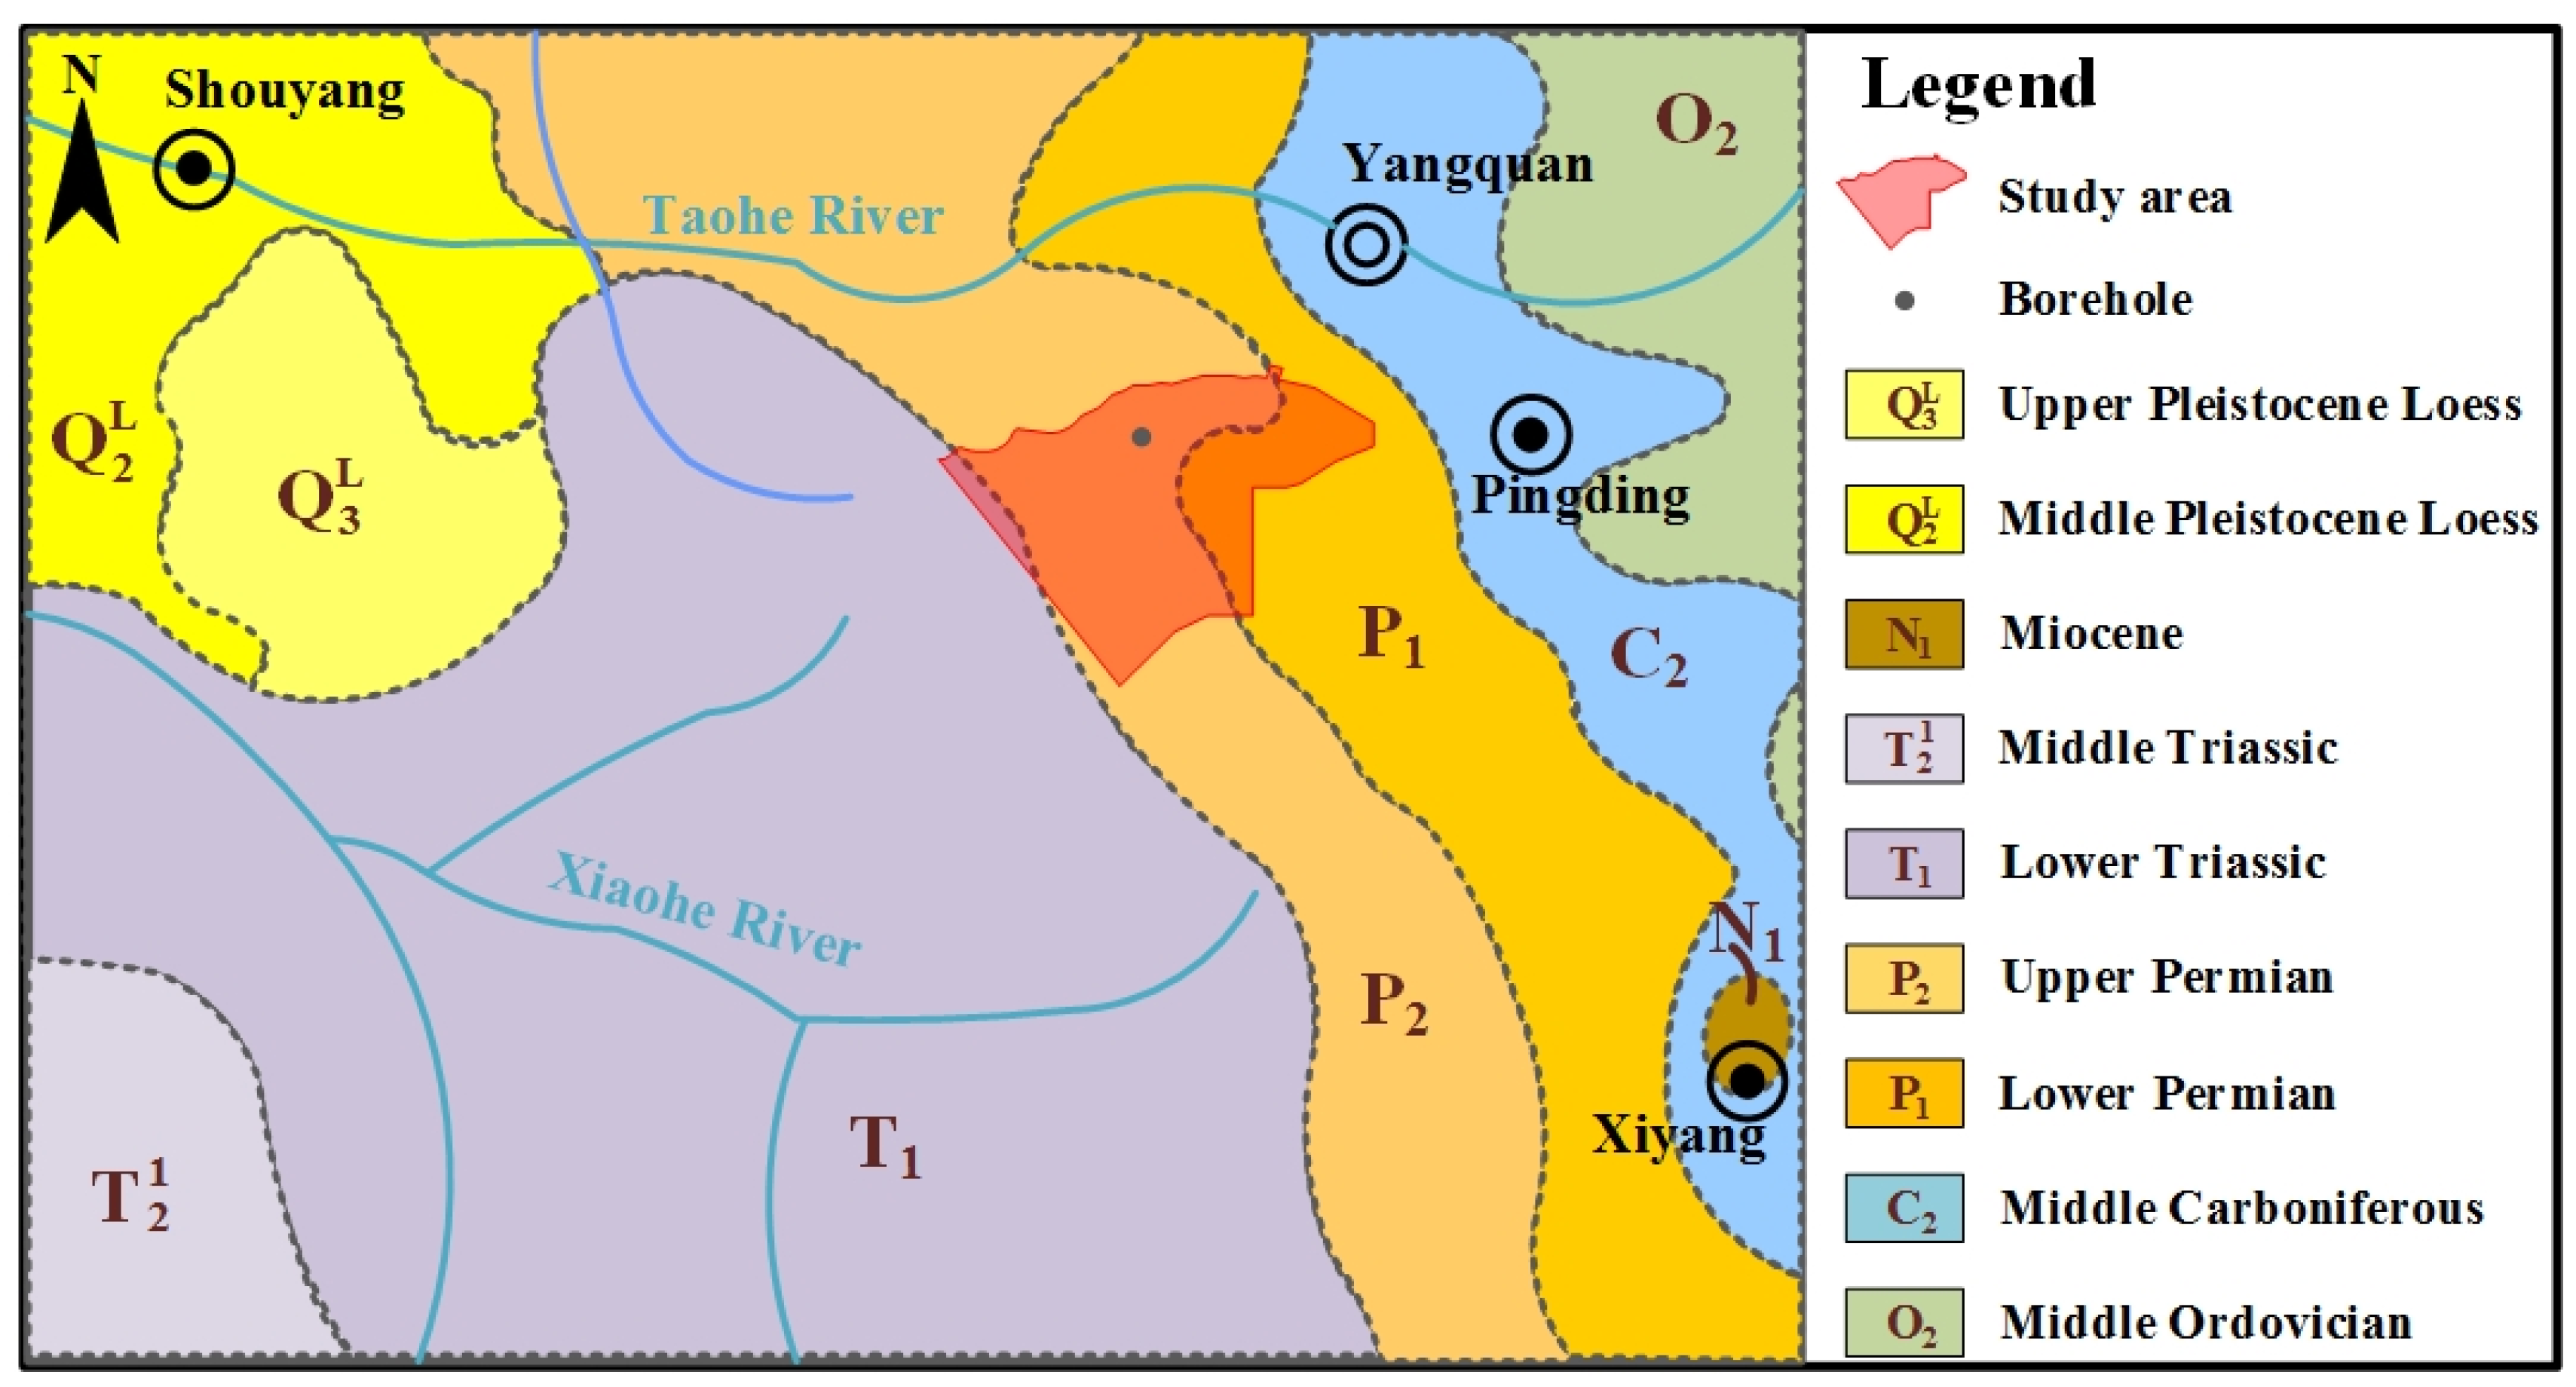
3.1. Study Area
3.2. Selection of Coal Faces and Layout of Sampling Lines and Points
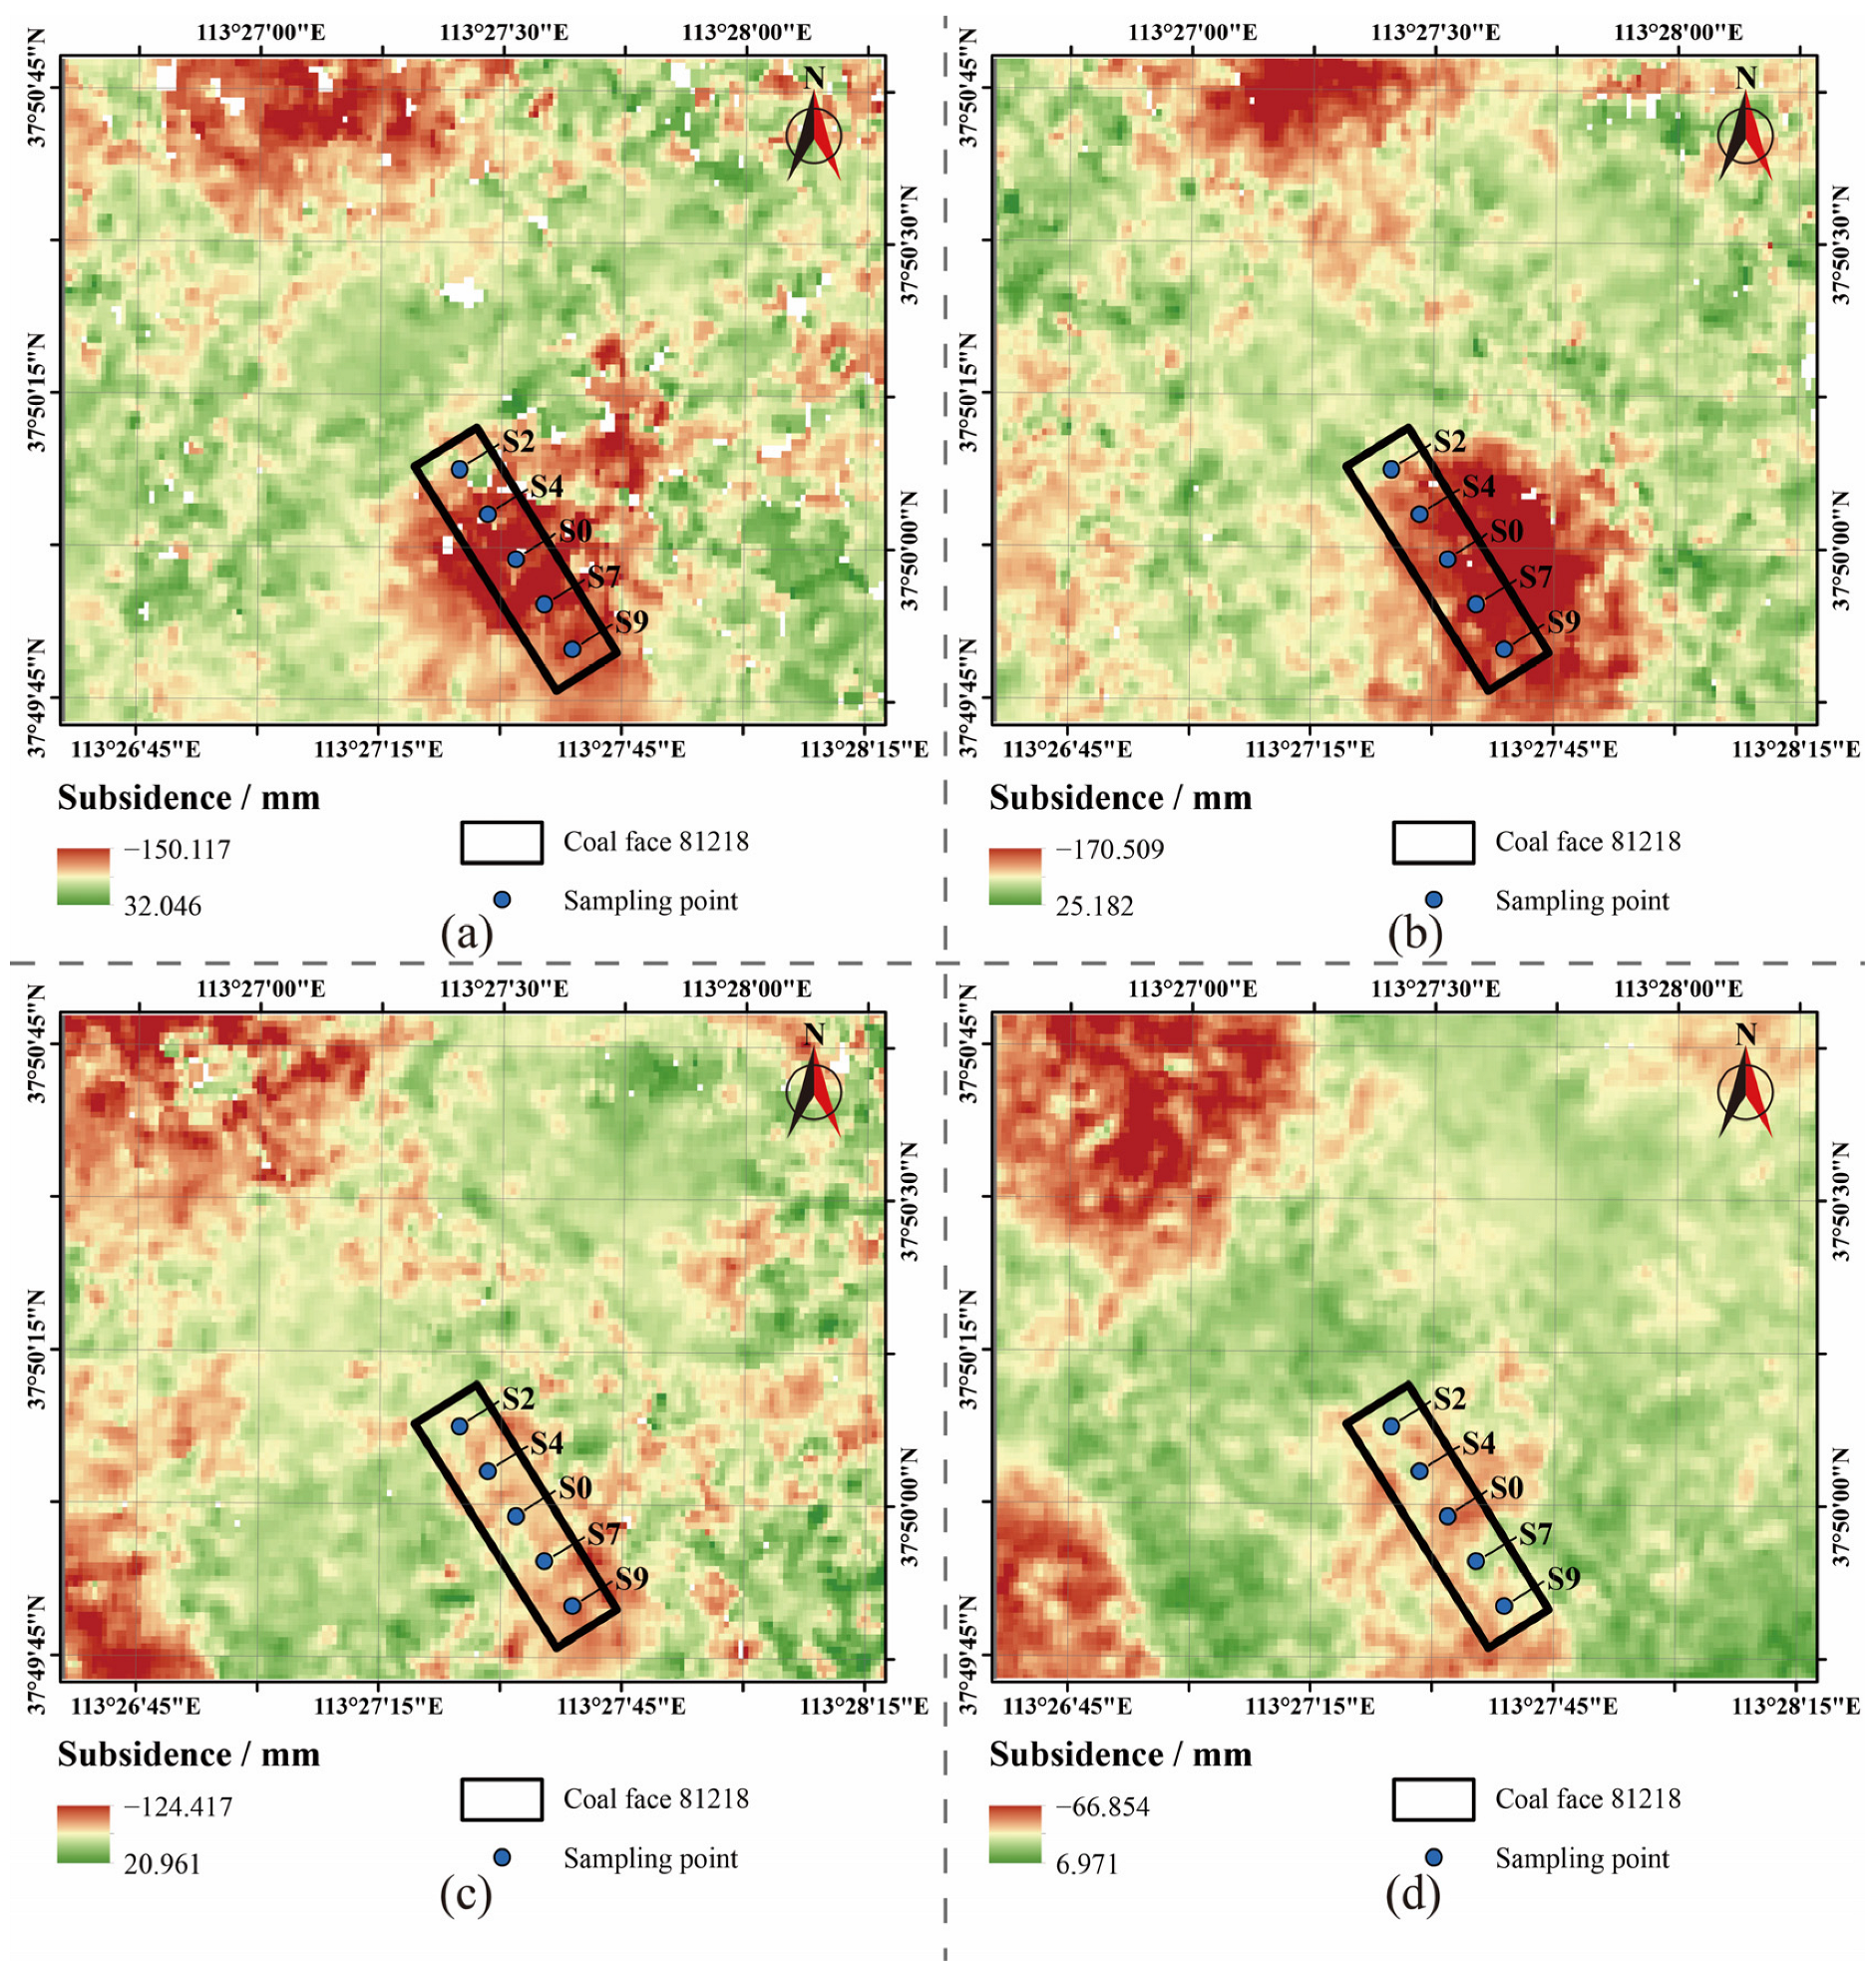
3.3. Relationship between Subsidence Rate and Duration after Coal Mining Cessation
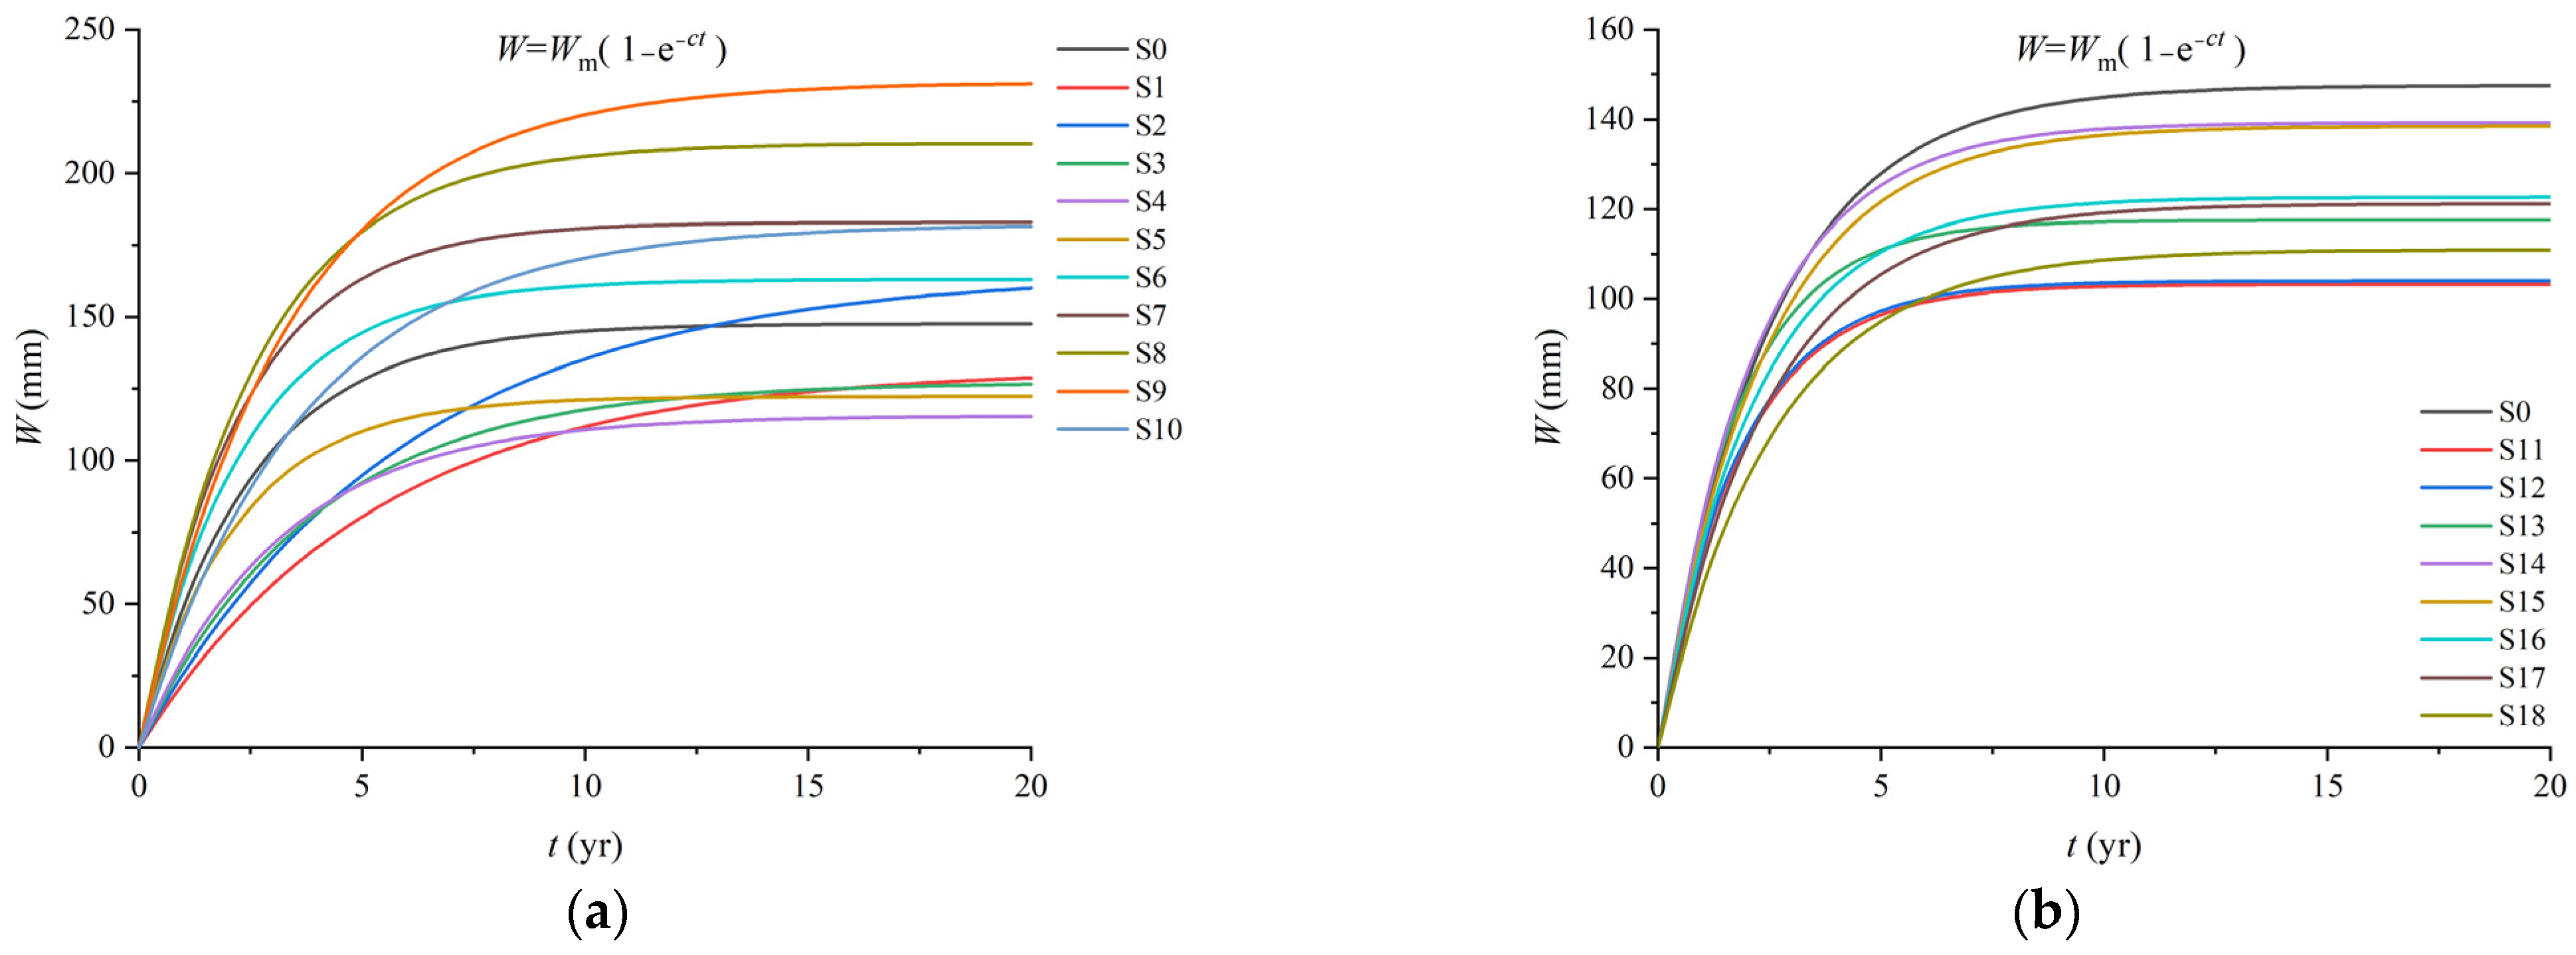
3.4. Relationship between Subsidence and Duration after Coal Mining Cessation
4. Discussion
4.1. Reliability of the Proposed Method
4.2. Regression Parameters of the Fitting Curve
4.3. Applicability of the Proposed Method
5. Conclusions
Author Contributions
Funding
Data Availability Statement
Acknowledgments
Conflicts of Interest
References
- Singh, K.B.; Dhar, B.B. Sinkhole Subsidence Due to Mining. Geotech. Geol. Eng. 1997, 15, 327–341. [Google Scholar] [CrossRef]
- Bankher, K.A.; Al-Harthi, A.A. Earth Fissuring and Land Subsidence in Western Saudi Arabia. Nat. Hazards 1999, 20, 21–42. [Google Scholar] [CrossRef]
- Du, S.; Wang, Y.; Zheng, M.; Zhou, D.; Xia, Y. Goaf Locating Based on InSAR and Probability Integration Method. Remote Sens. 2019, 11, 812. [Google Scholar] [CrossRef]
- Chen, B.; Yu, H.; Zhang, X.; Li, Z.; Kang, J.; Yu, Y.; Yang, J.; Qin, L. Time-Varying Surface Deformation Retrieval and Prediction in Closed Mines through Integration of SBAS InSAR Measurements and LSTM Algorithm. Remote Sens. 2022, 14, 788. [Google Scholar] [CrossRef]
- Guo, Q.; Meng, X.; Li, Y.; Lv, X.; Liu, C. A Prediction Model for the Surface Residual Subsidence in an Abandoned Goaf for Sustainable Development of Resource-Exhausted Cities. J. Clean. Prod. 2021, 279, 123803. [Google Scholar] [CrossRef]
- Yao, X.; Reddish, D. Analysis of Residual Subsidence Movements in the UK Coalfields. Q. J. Eng. Geol. 1994, 27, 15–23. [Google Scholar] [CrossRef]
- Sheorey, P.R.; Loui, J.P.; Singh, K.B.; Singh, S.K. Ground Subsidence Observations and a Modified Influence Function Method for Complete Subsidence Prediction. Int. J. Rock Mech. Min. Sci. 2000, 37, 801–818. [Google Scholar] [CrossRef]
- Unlu, T.; Akcin, H.; Yilmaz, O. An Integrated Approach for the Prediction of Subsidence for Coal Mining Basins. Eng. Geol. 2013, 166, 186–203. [Google Scholar] [CrossRef]
- Mahmoudpour, M.; Khamehchiyan, M.; Nikudel, M.R.; Ghassemi, M.R. Numerical Simulation and Prediction of Regional Land Subsidence Caused by Groundwater Exploitation in the Southwest Plain of Tehran, Iran. Eng. Geol. 2016, 201, 6–28. [Google Scholar] [CrossRef]
- Álvarez-Fernández, M.I.; González-Nicieza, C.; Menéndez-Díaz, A.; Álvarez-Vigil, A.E. Generalization of the n–k Influence Function to Predict Mining Subsidence. Eng. Geol. 2005, 80, 1–36. [Google Scholar] [CrossRef]
- Zhang, L.; Cheng, H.; Yao, Z.; Wang, X. Application of the Improved Knothe Time Function Model in the Prediction of Ground Mining Subsidence: A Case Study from Heze City, Shandong Province, China. Appl. Sci. 2020, 10, 3147. [Google Scholar] [CrossRef]
- Ghabraie, B.; Ghabraie, K.; Ren, G.; Smith, J.V. Numerical Modelling of Multistage Caving Processes: Insights from Multi-Seam Longwall Mining-Induced Subsidence. Int. J. Numer. Anal. Methods Geomech. 2017, 41, 959–975. [Google Scholar] [CrossRef]
- Ghabraie, B.; Ren, G.; Zhang, X.; Smith, J. Physical Modelling of Subsidence from Sequential Extraction of Partially Overlapping Longwall Panels and Study of Substrata Movement Characteristics. Int. J. Coal Geol. 2015, 140, 71–83. [Google Scholar] [CrossRef]
- Suchowerska Iwanec, A.M.; Carter, J.P.; Hambleton, J.P. Geomechanics of Subsidence above Single and Multi-Seam Coal Mining. J. Rock Mech. Geotech. Eng. 2016, 8, 304–313. [Google Scholar] [CrossRef]
- Ishwar, S.G.; Kumar, D. Application of DInSAR in Mine Surface Subsidence Monitoring and Prediction. Curr. Sci. 2017, 112, 46–51. [Google Scholar] [CrossRef]
- Hu, B.; Chen, L.; Zou, Y.; Wu, X.; Washaya, P. Methods for Monitoring Fast and Large Gradient Subsidence in Coal Mining Areas Using SAR Images: A Review. IEEE Access 2021, 9, 159018–159035. [Google Scholar] [CrossRef]
- Zhang, W.; Shi, J.; Yi, H.; Zhu, Y.; Xu, B. Underground Goaf Parameters Estimation by Cross-Iteration with InSAR Measurements. Remote Sens. 2021, 13, 3204. [Google Scholar] [CrossRef]
- Li, T.; Zhang, H.; Fan, H.; Zheng, C.; Liu, J. Position Inversion of Goafs in Deep Coal Seams Based on DS-InSAR Data and the Probability Integral Methods. Remote Sens. 2021, 13, 2898. [Google Scholar] [CrossRef]
- Zhao, B.; Guo, Y.; Mao, X.; Zhai, D.; Zhu, D.; Huo, Y.; Sun, Z.; Wang, J. Prediction Method for Surface Subsidence of Coal Seam Mining in Loess Donga Based on the Probability Integration Model. Energies 2022, 15, 2282. [Google Scholar] [CrossRef]
- Tajdus, K.; Sroka, A.; Misa, R.; Hager, S.; Rusek, J.; Dudek, M.; Wollnik, F. Analysis of Mining-Induced Delayed Surface Subsidence. Minerals 2021, 11, 1187. [Google Scholar] [CrossRef]
- Dudek, M.; Sroka, A.; Tajdus, K.; Misa, R.; Mrochen, D. Assessment and Duration of the Surface Subsidence after the End of Mining Operations. Energies 2022, 15, 8711. [Google Scholar] [CrossRef]
- Can, E.; Kuşcu, Ş.; Mekik, C. Determination of Underground Mining Induced Displacements Using GPS Observations in Zonguldak-Kozlu Hard Coal Basin. Int. J. Coal Geol. 2012, 89, 62–69. [Google Scholar] [CrossRef]
- Koros, W.K.; Agustin, F. Subsidence Surveys at Olkaria Geothermal Field, Kenya. J. Spat. Sci. 2017, 62, 195–205. [Google Scholar] [CrossRef]
- Chen, F.; Lin, H.; Zhang, Y.; Lu, Z. Ground Subsidence Geo-Hazards Induced by Rapid Urbanization: Implications from InSAR Observation and Geological Analysis. Nat. Hazards Earth Syst. Sci. 2012, 12, 935–942. [Google Scholar] [CrossRef]
- Dong, J.; Li, H.; Wang, Y.; Zhang, Y. Characteristics and Monitoring-Based Analysis on Deformation Mechanism of Jianshanying Landslide, Guizhou Province, Southwestern China. Arab. J. Geosci. 2021, 14, 184. [Google Scholar] [CrossRef]
- Xu, G.; Gao, Y.; Li, J.; Xing, M. InSAR Phase Denoising: A Review of Current Technologies and Future Directions. IEEE Geosci. Remote Sens. Mag. 2020, 8, 64–82. [Google Scholar] [CrossRef]
- Xue, F.; Lv, X.; Dou, F.; Yun, Y. A Review of Time-Series Interferometric SAR Techniques: A Tutorial for Surface Deformation Analysis. IEEE Geosci. Remote Sens. Mag. 2020, 8, 22–42. [Google Scholar] [CrossRef]
- Ng, A.H.-M.; Ge, L.; Du, Z.; Wang, S.; Ma, C. Satellite Radar Interferometry for Monitoring Subsidence Induced by Longwall Mining Activity Using Radarsat-2, Sentinel-1 and ALOS-2 Data. Int. J. Appl. Earth Obs. Geoinf. 2017, 61, 92–103. [Google Scholar] [CrossRef]
- Gabriel, A.; Goldstein, R.; Zebker, H. Mapping Small Elevation Changes Over Large Areas—Differential Radar Interferometry. J. Geophys. Res.-Solid Earth Planets 1989, 94, 9183–9191. [Google Scholar] [CrossRef]
- Wright, P.; Stow, R. Detecting Mining Subsidence from Space. Int. J. Remote Sens. 1999, 20, 1183–1188. [Google Scholar] [CrossRef]
- Carnec, C.; Delacourt, C. Three Years of Mining Subsidence Monitored by SAR Interferometry, near Gardanne, France. J. Appl. Geophys. 2000, 43, 43–54. [Google Scholar] [CrossRef]
- Przylucka, M.; Herrera, G.; Graniczny, M.; Colombo, D.; Bejar-Pizarro, M. Combination of Conventional and Advanced DInSAR to Monitor Very Fast Mining Subsidence with TerraSAR-X Data: Bytom City (Poland). Remote Sens. 2015, 7, 5300–5328. [Google Scholar] [CrossRef]
- Antonielli, B.; Sciortino, A.; Scancella, S.; Bozzano, F.; Mazzanti, P. Tracking Deformation Processes at the Legnica Glogow Copper District (Poland) by Satellite InSAR-I: Room and Pillar Mine District. Land 2021, 10, 653. [Google Scholar] [CrossRef]
- Berardino, P.; Fornaro, G.; Lanari, R.; Sansosti, E. A New Algorithm for Surface Deformation Monitoring Based on Small Baseline Differential SAR Interferograms. IEEE Trans. Geosci. Remote Sens. 2002, 40, 2375–2383. [Google Scholar] [CrossRef]
- Hu, B.; Wang, H.-S.; Sun, Y.-L.; Hou, J.-G.; Liang, J. Long-Term Land Subsidence Monitoring of Beijing (China) Using the Small Baseline Subset (SBAS) Technique. Remote Sens. 2014, 6, 3648–3661. [Google Scholar] [CrossRef]
- Solaro, G.; Acocella, V.; Pepe, S.; Ruch, J.; Neri, M.; Sansosti, E. Anatomy of an Unstable Volcano from InSAR: Multiple Processes Affecting Flank Instability at Mt. Etna, 1994–2008. J. Geophys. Res.-Solid Earth 2010, 115, B10405. [Google Scholar] [CrossRef]
- Pawluszek-Filipiak, K.; Borkowski, A. Integration of DInSAR and SBAS Techniques to Determine Mining-Related Deformations Using Sentinel-1 Data: The Case Study of Rydutowy Mine in Poland. Remote Sens. 2020, 12, 242. [Google Scholar] [CrossRef]
- Liu, Z.; Mei, G.; Sun, Y.; Xu, N. Investigating Mining-Induced Surface Subsidence and Potential Damages Based on SBAS-InSAR Monitoring and GIS Techniques: A Case Study. Environ. Earth Sci. 2021, 80, 817. [Google Scholar] [CrossRef]
- Fan, H.D.; Cheng, D.; Deng, K.Z.; Chen, B.Q.; Zhu, C.G. Subsidence Monitoring Using D-InSAR and Probability Integral Prediction Modelling in Deep Mining Areas. Surv. Rev. 2015, 47, 438–445. [Google Scholar] [CrossRef]
- Yang, Z.F.; Li, Z.W.; Zhu, J.J.; Preusse, A.; Yi, H.W.; Wang, Y.J.; Papst, M. An Extension of the InSAR-Based Probability Integral Method and Its Application for Predicting 3-D Mining-Induced Displacements Under Different Extraction Conditions. Ieee Trans. Geosci. Remote Sens. 2017, 55, 3835–3845. [Google Scholar] [CrossRef]
- Yang, Z.F.; Li, Z.W.; Zhu, J.J.; Hu, J.; Wang, Y.J.; Chen, G.L. InSAR-Based Model Parameter Estimation of Probability Integral Method and Its Application for Predicting Mining-Induced Horizontal and Vertical Displacements. IEEE Trans. Geosci. Remote Sens. 2016, 54, 4818–4832. [Google Scholar] [CrossRef]
- Yang, Z.; Li, Z.; Zhu, J.; Yi, H.; Peng, G.; Hu, J.; Wu, L.; Preusse, A.; Wang, Y.; Papst, M. Locating and Defining Underground Goaf Caused by Coal Mining from Space-Borne SAR Interferometry. Isprs J. Photogramm. Remote Sens. 2018, 135, 112–126. [Google Scholar] [CrossRef]
- Zhang, C.; Zhao, Y.; He, X.; Guo, J.; Yan, Y. Space-Sky-Surface Integrated Monitoring System for Overburden Migration Regularity in Shallow-Buried High-Intensity Mining. Bull. Eng. Geol. Environ. 2021, 80, 1403–1417. [Google Scholar] [CrossRef]
- Murdaca, G.; Rucci, A.; Prati, C. Deep Learning for InSAR Phase Filtering: An Optimized Framework for Phase Unwrapping. Remote Sens. 2022, 14, 4956. [Google Scholar] [CrossRef]
- Song, S.; Zhao, X.; Xie, J.; Guan, Y. Grey Correlation Analysis and Regression Estimation of Mining Subsidence in Yu-Shen-Fu Mining Area. In 2011 3rd International Conference on Environmental Science and Information Application Technology Esiat 2011, Vol 10, Pt B; Wu, Y., Ed.; Elsevier Science Bv: Amsterdam, The Netherlands, 2011; Volume 10, pp. 1747–1752. [Google Scholar] [CrossRef]
- Wang, J.; Zhang, J.; Zhang, Q.; Wu, Z.; Zhang, Q.; Wang, Y.; Gao, D. Analysis of the Control Effect and Parameter Optimisation of Urban Surface Deformation in Underground Coal Mining with Solid Backfilling. Adv. Civ. Eng. 2021, 2021, 6705685. [Google Scholar] [CrossRef]
- Wang, H. Key Technologies for Remediation of Multi-Layered and Steeply Inclined Goaf Areas under Highways: A Comprehensive Research Technical Report; Unpublished Report; Shanxi Traffic Layout Reconnaissance Design Institute: Taiyuan, China, 2021. [Google Scholar]
- Diao, X.; Wu, K.; Hu, D.; Li, L.; Zhou, D. Combining Differential SAR Interferometry and the Probability Integral Method for Three-Dimensional Deformation Monitoring of Mining Areas. Int. J. Remote Sens. 2016, 37, 5196–5212. [Google Scholar] [CrossRef]
- Schober, P.; Boer, C.; Schwarte, L.A. Correlation Coefficients: Appropriate Use and Interpretation. Anesth. Analg. 2018, 126, 1763–1768. [Google Scholar] [CrossRef]
- Ostertagová, E.; Ostertag, O. Methodology and Application of Oneway ANOVA. Am. J. Mech. Eng. 2013, 1, 256–261. [Google Scholar] [CrossRef]
- Qin, Y.; Xu, N.; Zhang, Z.; Zhang, B. Failure Process of Rock Strata Due to Multi-Seam Coal Mining: Insights from Physical Modelling. Rock Mech. Rock Eng. 2021, 54, 2219–2232. [Google Scholar] [CrossRef]
- Wang, L.; Li, N.; Zhang, X.; Wei, T.; Chen, Y.; Zha, J. Full Parameters Inversion Model for Mining Subsidence Prediction Using Simulated Annealing Based on Single Line of Sight D-InSAR. Environ. Earth Sci. 2018, 77, 161. [Google Scholar] [CrossRef]
- Li, J.; Zang, M.; Xu, N.; Qin, Y.; Chen, Y. Influence of Residual Deformation of Goaf to Sangzhang Tunnel with Probability Integral Method. J. Eng. Geol. 2021, 29, 564–574. [Google Scholar]


| Number | Cessation Year of the Coal Mining | Time Interval Between Monitoring and Cessation of Coal Mining (Year) |
|---|---|---|
| 1 | 2016 | 0.5 |
| 2 | 2014 | 3 |
| 3 | 2012 | 5 |
| 4 | 2010 | 7 |
| 5 | 2009 | 8 |
| 6 | 2008 | 9 |
| 7 | 2006 | 11 |
| 8 | 2004 | 13 |
| Point | v-t Function | W-t Function | v0 | c | Wm | R2 (%) |
|---|---|---|---|---|---|---|
| 0 | 59.474 | 0.403 | 147.612 | 96.9 | ||
| 1 | 24.784 | 0.188 | 131.809 | 65.9 | ||
| 2 | 28.131 | 0.170 | 165.507 | 80.6 | ||
| 3 | 32.830 | 0.258 | 127.261 | 81.5 | ||
| 4 | 36.495 | 0.316 | 115.539 | 80.6 | ||
| 5 | 56.310 | 0.460 | 122.309 | 97.7 | ||
| 6 | 70.860 | 0.435 | 162.994 | 99.7 | ||
| 7 | 81.562 | 0.446 | 182.919 | 98.9 | ||
| 8 | 80.975 | 0.385 | 210.373 | 99.1 | ||
| 9 | 69.678 | 0.301 | 231.842 | 95.5 | ||
| 10 | 49.958 | 0.274 | 182.281 | 90.9 | ||
| 11 | 56.152 | 0.544 | 103.222 | 90.9 | ||
| 12 | 57.035 | 0.548 | 103.994 | 94.0 | ||
| 13 | 67.484 | 0.574 | 117.528 | 98.4 | ||
| 14 | 64.033 | 0.460 | 139.256 | 98.9 | ||
| 15 | 58.353 | 0.421 | 138.536 | 97.4 | ||
| 16 | 56.574 | 0.461 | 122.639 | 95.1 | ||
| 17 | 49.485 | 0.408 | 121.197 | 96.2 | ||
| 18 | 42.968 | 0.387 | 110.963 | 94.1 |
| Point | Correlation Coefficients | ANOVA (α = 0.05) | |
|---|---|---|---|
| F | Fcrit | ||
| S0 | 0.955135 | 0.187691 | 3.938111 |
| S2 | 0.913511 | 0.721422 | |
| S4 | 0.963451 | 0.037546 | |
| S7 | 0.95684 | 0.187504 | |
| S9 | 0.978571 | 0.172836 | |
Disclaimer/Publisher’s Note: The statements, opinions and data contained in all publications are solely those of the individual author(s) and contributor(s) and not of MDPI and/or the editor(s). MDPI and/or the editor(s) disclaim responsibility for any injury to people or property resulting from any ideas, methods, instructions or products referred to in the content. |
© 2023 by the authors. Licensee MDPI, Basel, Switzerland. This article is an open access article distributed under the terms and conditions of the Creative Commons Attribution (CC BY) license (https://creativecommons.org/licenses/by/4.0/).
Share and Cite
Li, J.; Zang, M.; Xu, N.; Mei, G.; Yang, S. An Interferometric-Synthetic-Aperture-Radar-Based Method for Predicting Long-Term Land Subsidence in Goafs through the Concatenation of Multiple Sources of Short-Term Monitoring Data. Remote Sens. 2023, 15, 4203. https://doi.org/10.3390/rs15174203
Li J, Zang M, Xu N, Mei G, Yang S. An Interferometric-Synthetic-Aperture-Radar-Based Method for Predicting Long-Term Land Subsidence in Goafs through the Concatenation of Multiple Sources of Short-Term Monitoring Data. Remote Sensing. 2023; 15(17):4203. https://doi.org/10.3390/rs15174203
Chicago/Turabian StyleLi, Jinyang, Mingdong Zang, Nengxiong Xu, Gang Mei, and Sen Yang. 2023. "An Interferometric-Synthetic-Aperture-Radar-Based Method for Predicting Long-Term Land Subsidence in Goafs through the Concatenation of Multiple Sources of Short-Term Monitoring Data" Remote Sensing 15, no. 17: 4203. https://doi.org/10.3390/rs15174203