1. Introduction
East Asia is densely populated, economically active, and is more impacted by winter temperature anomaly events than other regions. Crop growth, socioeconomics, and human activities are all directly and indirectly impacted by temperature anomaly events [
1,
2,
3]. Investigating the spatial and temporal distribution traits and potential causes of the winter temperature anomalies in eastern China is of great practical significance because it will help to increase the accuracy of weather and climate predictions in China and ensure the safety of people’s lives and property.
Numerous research studies have been completed recently on the causes of China’s wintertime temperature anomalies. First, abnormal winter temperatures may be linked to atmospheric circulation anomalies. The occurrence of cold waves generally cause cold temperature anomalies in winter in China. One of the prerequisites for the occurrence of cold waves is the formation and maintenance of Siberian high pressure [
4], and when it is strong, the frequency of cold waves in China is high [
5,
6]. The change in China’s winter temperatures is significantly influenced by the East Asian trough as well [
6,
7,
8,
9], and the change in its location will lead to different cooling areas [
10]. In the middle and high latitudes of the Northern Hemisphere during the winter half-year, the Arctic Oscillation (AO) is the dominant mode of atmospheric circulation. The Siberian High and the East Asian trough will be affected, the pressure differential between land and sea will alter, and the frequency of cold waves will change due to AO, which can also excite the Eurasian Pacific (EUP) teleconnection wave train anomalies in the lower and higher troposphere [
11,
12,
13,
14,
15,
16]. Second, external forcing factors like Sea Surface Temperature (SST) may potentially have an impact on winter temperature anomalies. The Arctic Oscillation/North Atlantic Oscillation (AO/NAO), the Eurasian teleconnection (EU), and the intraseasonal shift of the East Asian trough are some of the major atmospheric circulation systems that influence the winter temperature in the Northern Hemisphere. These systems may be related to external forcing factors like ENSO, North Atlantic SST, and polar ice [
10,
17,
18,
19]. ENSO, Arctic sea ice, and tropical Indian Ocean SST anomalies may also have an inter-annual scale impact on the East Asian winter monsoon, causing significant inter-annual changes in the East Asian winter monsoon and causing winter temperature anomalies in China [
20,
21,
22,
23,
24,
25].
The early and late winter temperature cycles are also something that the scholarly community is interested in. The air circulation system that accompanied the change in temperature in the early and late winters was inconsistent, according to Huang and Hu [
26]. Early in the winter, the sea level pressure rises towards Eurasia near the Arctic while falling at lower latitudes. However, the converse is true of late winter. After examining the characteristics of atmospheric variations, Wei et al. hypothesized that they were primarily due to the mid-level teleconnection steering brought on by the interaction of mid-latitude transient waves and steady waves [
27,
28]. According to Sun et al., the primary source of the intraseasonal fluctuation in the intensity of the Siberian high may be the low-level land-sea thermal difference, which went from strength in early winter to weakness in late winter [
29]. Jian et al. asserted that this is additionally impacted by the Indian Ocean-Pacific SST and ENSO in addition to the mid-high latitude circulation system [
30]. The intraseasonal shift of the EU wave train, which may be attributed to the reverse of the AO/NAO in the early and late winters and the influence of wide and the ENSO meridional scales, is the main circulation factor causing the opposite phase of winter temperature in early and late winter, according to Qi et al., who studied the winter temperature in East Asia over the past 60 years [
31].
In numerous earlier research, tropical convective anomalies have been identified as one of the many elements influencing our climate. Outgoing Longwave Radiation (OLR) is the longwave radiation emitted from the Earth’s air system that is observed by satellites. The size of the value is primarily determined by the temperature of the radiating surface, which is higher when the sky is clear and lower when there is cloud coverage due to the low temperature of the cloud. As a result, in the tropics, OLR can reflect the distribution of clouds and cloud height and accurately characterize the strength of convective activities. The Madden-Julian Oscillation (MJO) is one of the most significant anomalous circulation systems in the tropics on an intraseasonal scale, and the MJO can adjust convective activities in the tropics, and the equatorial Rossby-Kelvin waves stimulated by the adiabatic heating of the MJO can affect the potential height distribution of the middle and high latitudes, and regulate the convective activities here [
32,
33,
34]. East Asia is situated in a crucial area for MJO propagation, and MJO activities in this area have an impact on several meteorological and climate systems [
35,
36,
37,
38]. Additionally, anomalies within the stratospheric circulation also can exert influences on both precipitation patterns and surface temperatures [
39,
40,
41,
42,
43,
44].
Beginning in January 2022, China had a highly unusual winter climate, with substantial intraseasonal temperature anomalous that caused January’s balmy temperature to change to February’s frigid ones. This anomaly was most noticeable in eastern China. This paper will focus on the analysis of the inversion phenomenon of the January and February temperatures and will use the Principal Component Analysis method to extract the wave trains and their main modes affecting the winter temperatures in order to have a more thorough understanding of the winter intraseasonal temperature transition anomalies in eastern China. This paper will be based on the characteristics of the temperature in the winter of early 2022 in eastern China and using statistical techniques, the potential causes of the temperature anomaly are addressed.
3. Results
3.1. Temporal and Spatial Characteristics of Temperature Anomalies in Eastern China during Early 2022
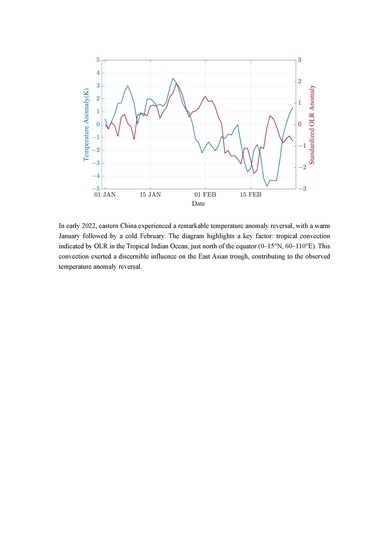
The surface air temperature anomalies in eastern China (20–50°N, 90–125°E) indicate a major intraseasonal change from warm to cold in January and February in early 2022. East China experiences a warm anomaly in January, with warm anomalies greater than 3 K from Qinling to Sayanling and in the western portion of the Mongolian Plateau. The Jiangnan Hills and the middle and lower reaches of the Yangtze River also experience warm anomalies, with two centers of these being 2–2.5 K. Compared to southern China, the warm anomaly in the north is more pronounced. (
Figure 1a). In February, the mean surface air temperature in eastern China exhibits a cold anomaly, and there are three significant cold anomalous areas in key areas, located in the Mongolian Plateau, Yunnan-Guizhou Plateau and the western Jiangnan hills, east of the Bay of Bengal in the Indo-China Peninsula coast. The amplitude of these cold anomalies reaches −3K, which is enhanced in the south compared to that in January. (
Figure 1b). The research is narrowed down to eastern China since the intraseasonal reversal feature of the cold and warm anomalies in January and February is not significant in either the low-latitude or the east and west parts of high-latitude regions of Asia. The intraseasonal shift of temperature anomalies is further illustrated by the average temperature anomaly series in eastern China in January and February (
Figure 1c). It is characterized by an overall positive anomaly in January, with a fluctuating upward trend in the temperature anomaly up to 22 January, when it reaches a peak of 3.6 K and then starts to fall. The negative anomaly ranges from roughly −1K to −2K in early February to about −4 K in mid- and late February. On 20 February, the negative anomaly reached a maximum of −4.79 K. The continuous anomalies that are warmer in January and colder in February at the start of 2022 are what primarily define the temperature anomalies in eastern China. High-altitude locations with heights greater than 3500 m are not taken into account in the analysis of
Figure 1 because their meteorological features considerably differ from those of other places in eastern China.
3.2. Intraseasonal Variations of Potential Factors Influencing Winter Temperatures in China
The initial research demonstrates that a variety of factors, including external forcing factors like ENSO, North Atlantic SST, and polar ice, as well as atmospheric circulation anomalies like AO and the East Asian trough, are responsible for the temperature anomalies in China. However, MJO and the extratropical atmospheric circulation anomalies in the Northern Hemisphere are typically of great interest when discussing the consequences of intraseasonal variability. As a result, our initial attention is given to characterizing the intraseasonal fluctuation of these components.
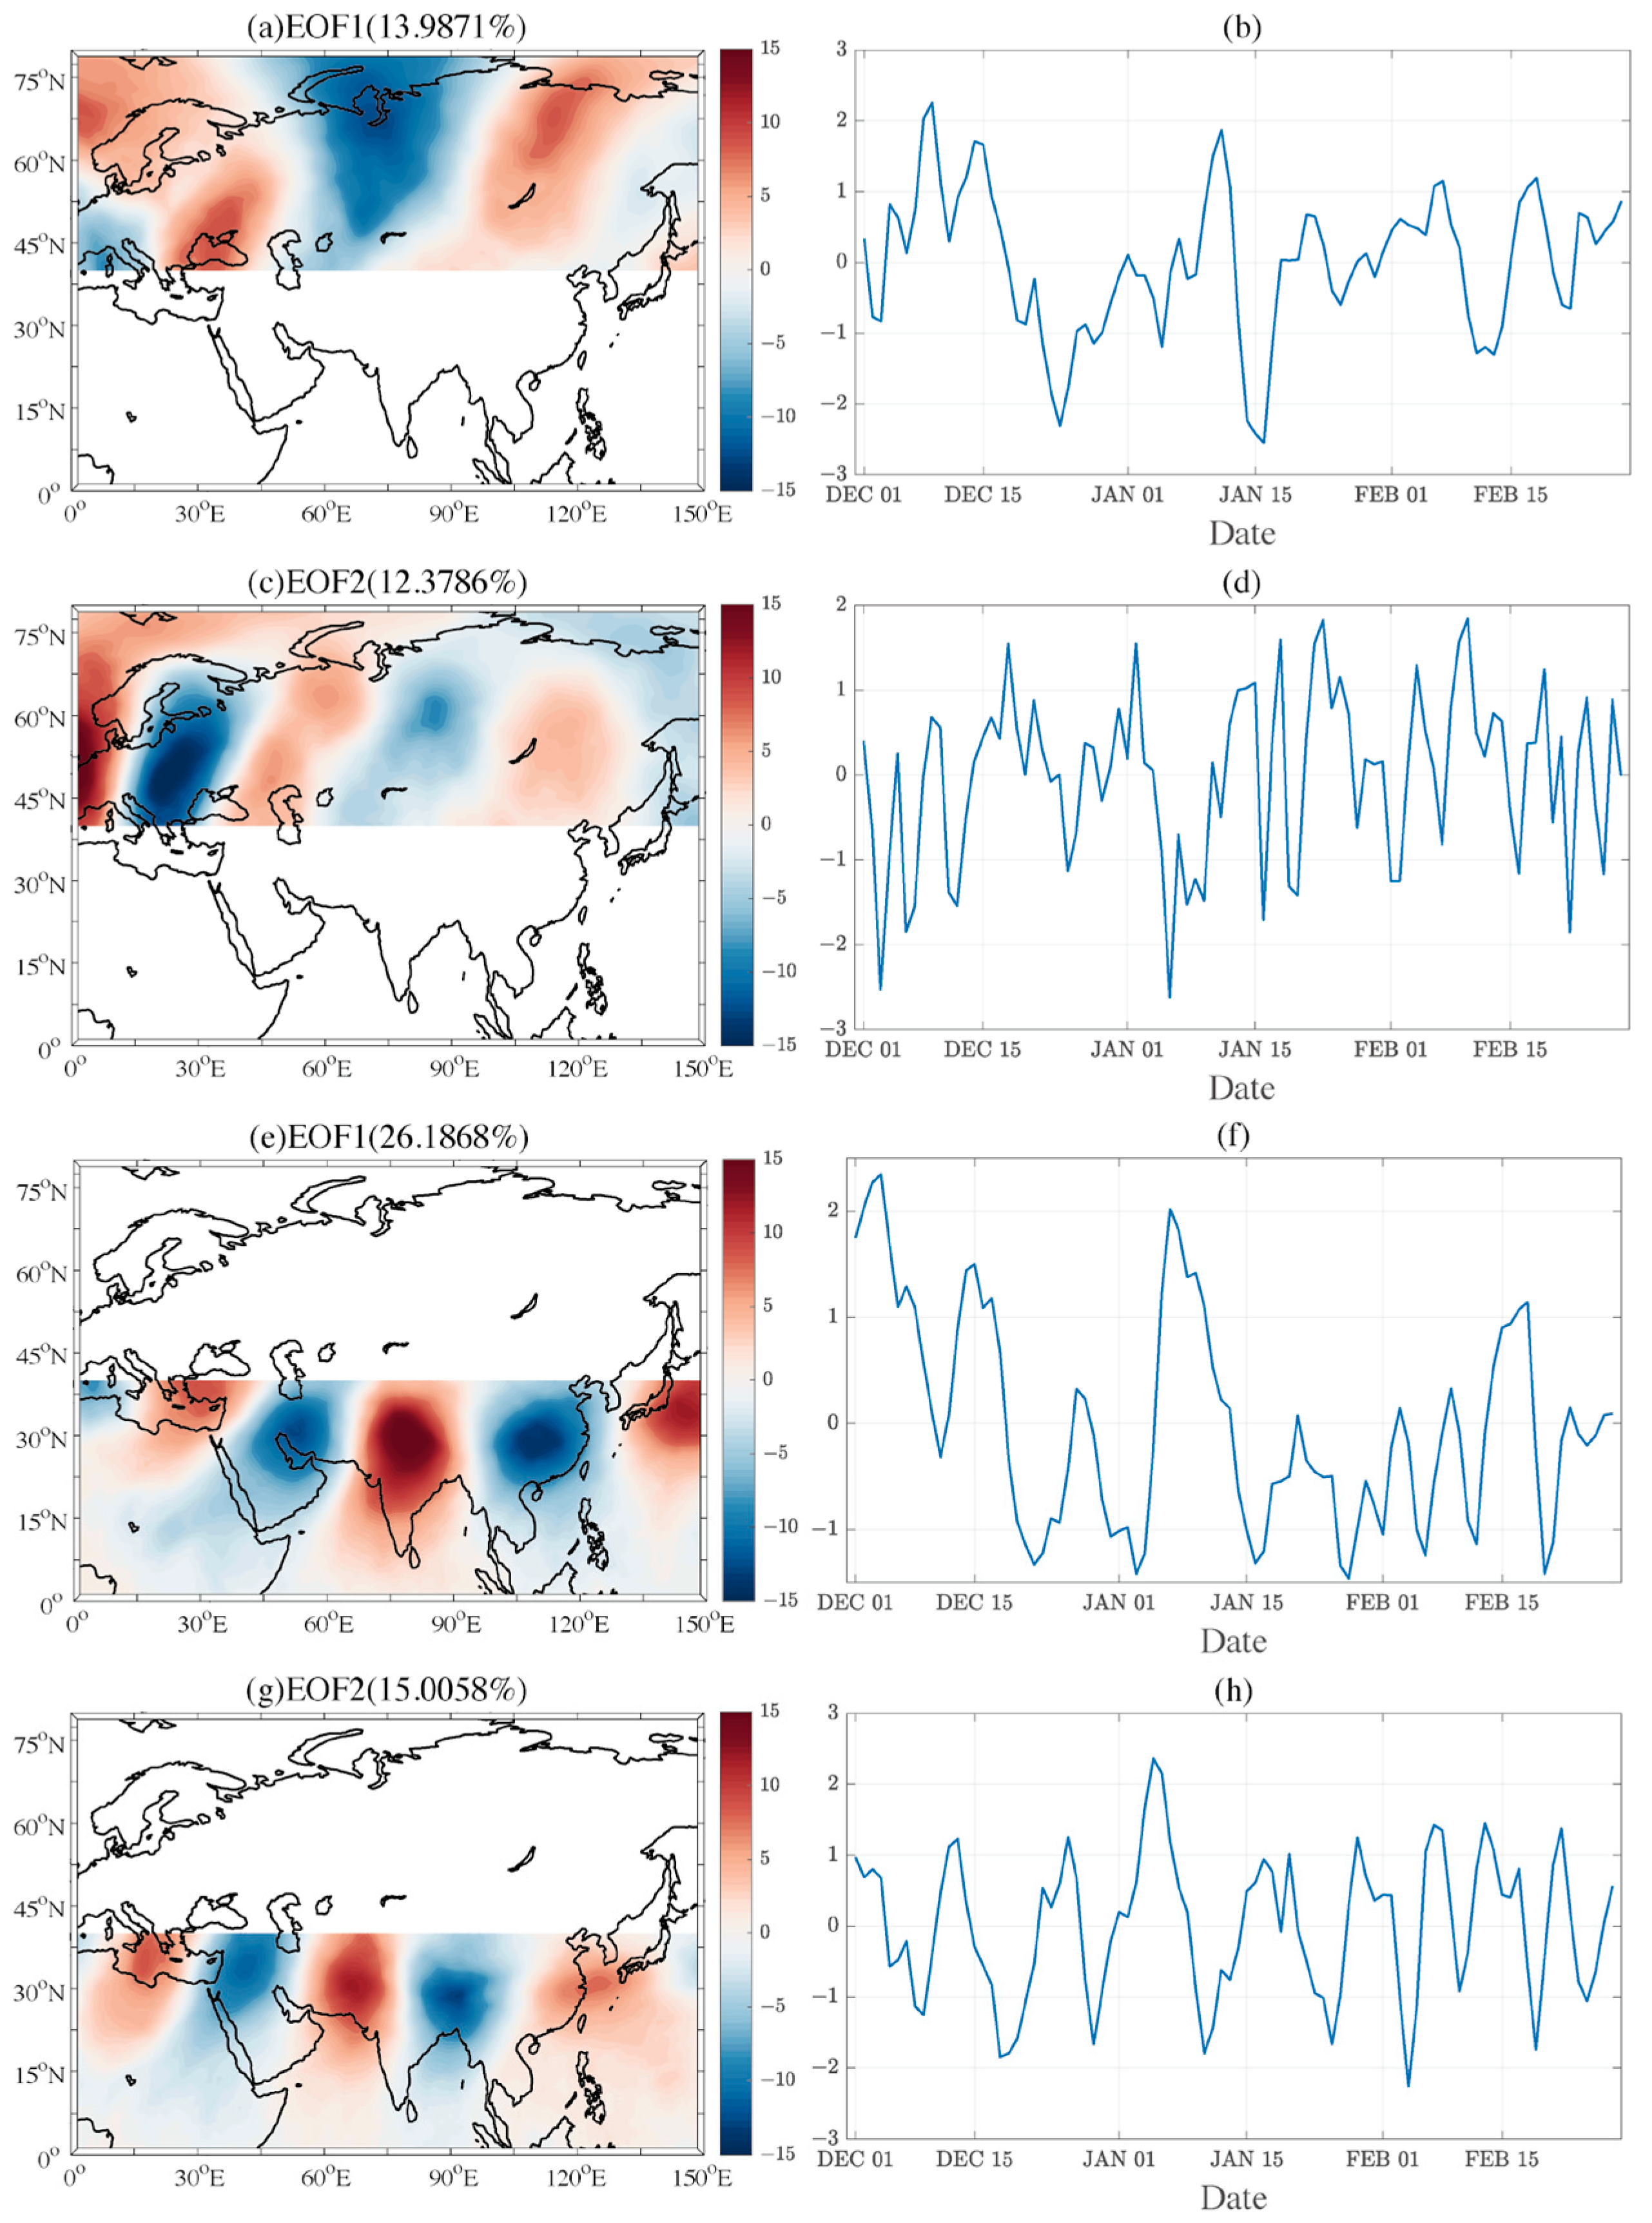
3.2.1. Intraseasonal Evolution of the Upper Tropospheric South and North Branch Wave Trains
We can extract the spatial modes and understand the evolution of the Rossby wave train in the south and north branches of the westerly jets by using EOF analysis of the 250 hPa meridional winds in the north and south of the Eurasian continent during the winter. The north branch wave train is mainly located near 60°N, the first mode explains 14.0% of the overall variation, the second mode explains 12.4% of the total variance, and the first two modes all pass the North test. In the middle of January, the warm phase in eastern China, the significant anomaly centers of ‘+, −, +, −’ are found in the first mode of the 250 hPa meridional wind anomaly EOF (combined with
Figure 2a,b), located in the Alps and the western Apennine Peninsula, the Black Sea, the West Siberian Plain, and the Central Siberian Plateau, respectively. Together, they form a negative anomaly wave train that resembles the Eurasian Teleconnection (EU). The negative anomaly center over the North Sea and the West European Plain changes from a negative to a positive anomaly in the cold period during the middle and late February, and the anomalous centers of ‘−, +, −, +’ form from the west to the east, which means the North Branch wave train shifts into a positive phase. The intraseasonal low-frequency disturbance features of the wave train are also reflected in the time series of the first mode of the North Branch wave train (
Figure 2b). The meridional wind anomaly across the West Siberian Plain is the primary node of this wave train that is affecting northern China. The anomalous warm advection in the middle and lower troposphere at the easterly position below it is supported by its positive anomaly in January, and the anomalous cold advection is supported by its negative anomaly in February. In addition to the advection anomaly directly caused by the meridional wind anomaly, it has also been noted that when the EU wave train is in the negative phase, the subtropical jets in the upper troposphere weaken and the temperate jet steam strengthen, making it difficult for cold air to move northward [
47,
48,
49]. The weakening of the Siberian high pressure and the Aleutian low pressure in the lower troposphere, which is hostile to cold air flowing south, is what causes the warm advection that leads to the high temperatures in eastern China [
31].
The majority of the south branch wave train is situated close to 30°N. The first mode accounts for 26.2% of the overall variation, whereas the second mode accounts for 15.0%. The North test is passed by the first two modes. During the warm period in eastern China, especially in early January, EOF1 of 250 hPa meridional wind anomaly (combined with
Figure 2e,f) has significant ‘+, −, +, −, +’ anomaly centers from west to east over the eastern Mediterranean, the northeastern Arabian Peninsula, the Persian Gulf, the northern Indian Peninsula, the middle and lower reaches of the Yangtze River Plain, and the western Pacific, respectively, forming a positive anomaly south branch wave train of North Africa and Asia Teleconnection. The anomaly centers switch directions in early February, and the south branch wave train enters a negative phase. The wave train’s intraseasonal low-frequency disturbance features are also reflected in the time series of the first mode (
Figure 2f). The meridional wind anomaly across the Indian Peninsula, one of the major nodes in southern China, is impacted by the wave train. The warm anomalous advection in the middle and lower troposphere at the easterly position below it is encouraged by the positive anomaly in January, and the cold one is encouraged by the negative anomaly in February. The East Asian trough deepens during the abnormal cold advection, and there is a sizable positive zonal wind anomaly in the upper subtropical jet region, which significantly enhances the subtropical jet and weakens the temperate jet [
31]. This is favorable for the southward movement of cold air from high latitudes and its accumulation in East Asia. Eastern China sees an unusually low temperature due to the cold advection. However, many investigations have shown that the southern branch trough in conjunction with other meteorological systems can have an important effect on China’s weather. In winter, it is simple to produce powerful cooling and heavy precipitation due to its strong collaboration with strong cold air (temperature gradient grows, baroclinicity increases), deep convergence rising area, and conducive to unstable growth.
3.2.2. Intraseasonal Evolution of Tropical Convective Activity
When there are surface temperature anomalies in eastern China, the OLR in the Asian low-latitude region exhibits large anomalies. The South India Peninsula, the southern Central South Peninsula, and the area surrounding the Malay Peninsula are the main locations of the warm period of temperature anomaly (5–18 January), which correspond to a positive OLR anomaly. The abnormal center value of OLR is about 10–15 W·m
−2, where the convective activity weakened (
Figure 3a). The area of negative OLR anomaly, on the other hand, is located in the southeast of the Bay of Bengal during the time of abnormally cold temperatures (4–21 February), and the abnormal center value of OLR reaches roughly −60 W·m
−2, where convective activity accentuated (
Figure 3b). The OLR anomaly index series is constructed by averaging the OLR anomalies from the eastern Arabian Sea to the western South China Sea (0–15°N, 60–110°E) in the northern hemisphere, where the OLR inversions are the most significant during the two periods (
Figure 3c). The OLR anomaly index series displays a fluctuating rising trend from 5–23 January. The OLR index ranges around 10 W·m
−2 in mid- to late-January. On 23 January, the OLR positive anomaly index peaks at 27.0 W·m
−2. The OLR index ranges between −15 and −35 W·m
−2 from 1–7 February, falling rapidly to approximately −20 W·m
−2. The OLR negative anomaly index reached its peak on 23 January at −24.4 W·m
−2 on 16 February. The surface air temperature anomalies over eastern China have a positive correlation with the OLR anomaly index series, which is positive in January and negative in February.
3.3. Synergistic Effects of Two Rossby Wave Trains and Tropical Convective Activities on Temperature Anomalies in Eastern China
Stepwise regression is utilized to investigate the roles of various elements and their contributions to this winter temperature anomaly occurrence. The first two modes of time series of the northern and southern branch wave trains as well as the OLR anomaly index are employed as five factors. For stepwise regression analysis, the standardized series of the five components over the same time period is used as the independent variable and the regional mean surface 2 m temperature anomaly series during January and February 2022 is used as the dependent variable. The findings are displayed in
Figure 4, which demonstrates the significance of the three factors—The OLR series, the first mode series of the south branch Rossby wave train, and the first modal series of the north branch Rossby wave train. All three factors and the regression equation pass the 95% significance test. The warm anomaly in January and the cold anomaly in February are reflected in the regression result. The regression equation is as follows:
Among them, represents the regression result of the regional average temperature anomaly series, represents the first mode standardized time series of the north branch wave train, represents the first mode standardized time series of the south branch wave train, and represents the OLR anomaly index standardized time series. OLR anomaly, or the impact of convective activity anomaly, which is positively correlated with winter temperature anomaly, is the most significant factor affecting temperature anomaly in eastern China, according to the regression coefficient of each factor. The next section goes through the mechanism by which the tropical convection anomaly impacts the temperature in eastern China. East China’s temperature has a positive correlation with the index of the south branch wave train, which is primarily affected by EOF1. The enhanced southwest warm advection in front of the south branch trough will lead to an increase in temperature in China. Eastern China’s temperature has a negative correlation with the index of the north branch wave train, which is primarily affected by EOF1. China will see cold anomalies as a result of intensified northwesterly cold advection behind the East Asian trough. The average temperature anomaly, which shows a positive anomaly, is essentially steady near 1K in the temperature series produced via regression equation from 6–26 January. The average temperature anomaly exhibits a clear declining trend from 3–7 February, which between 4–21 February is between −3 and 0 K, indicating a negative anomaly. The regression series’ cold and warm intervals match the initial series quite well.
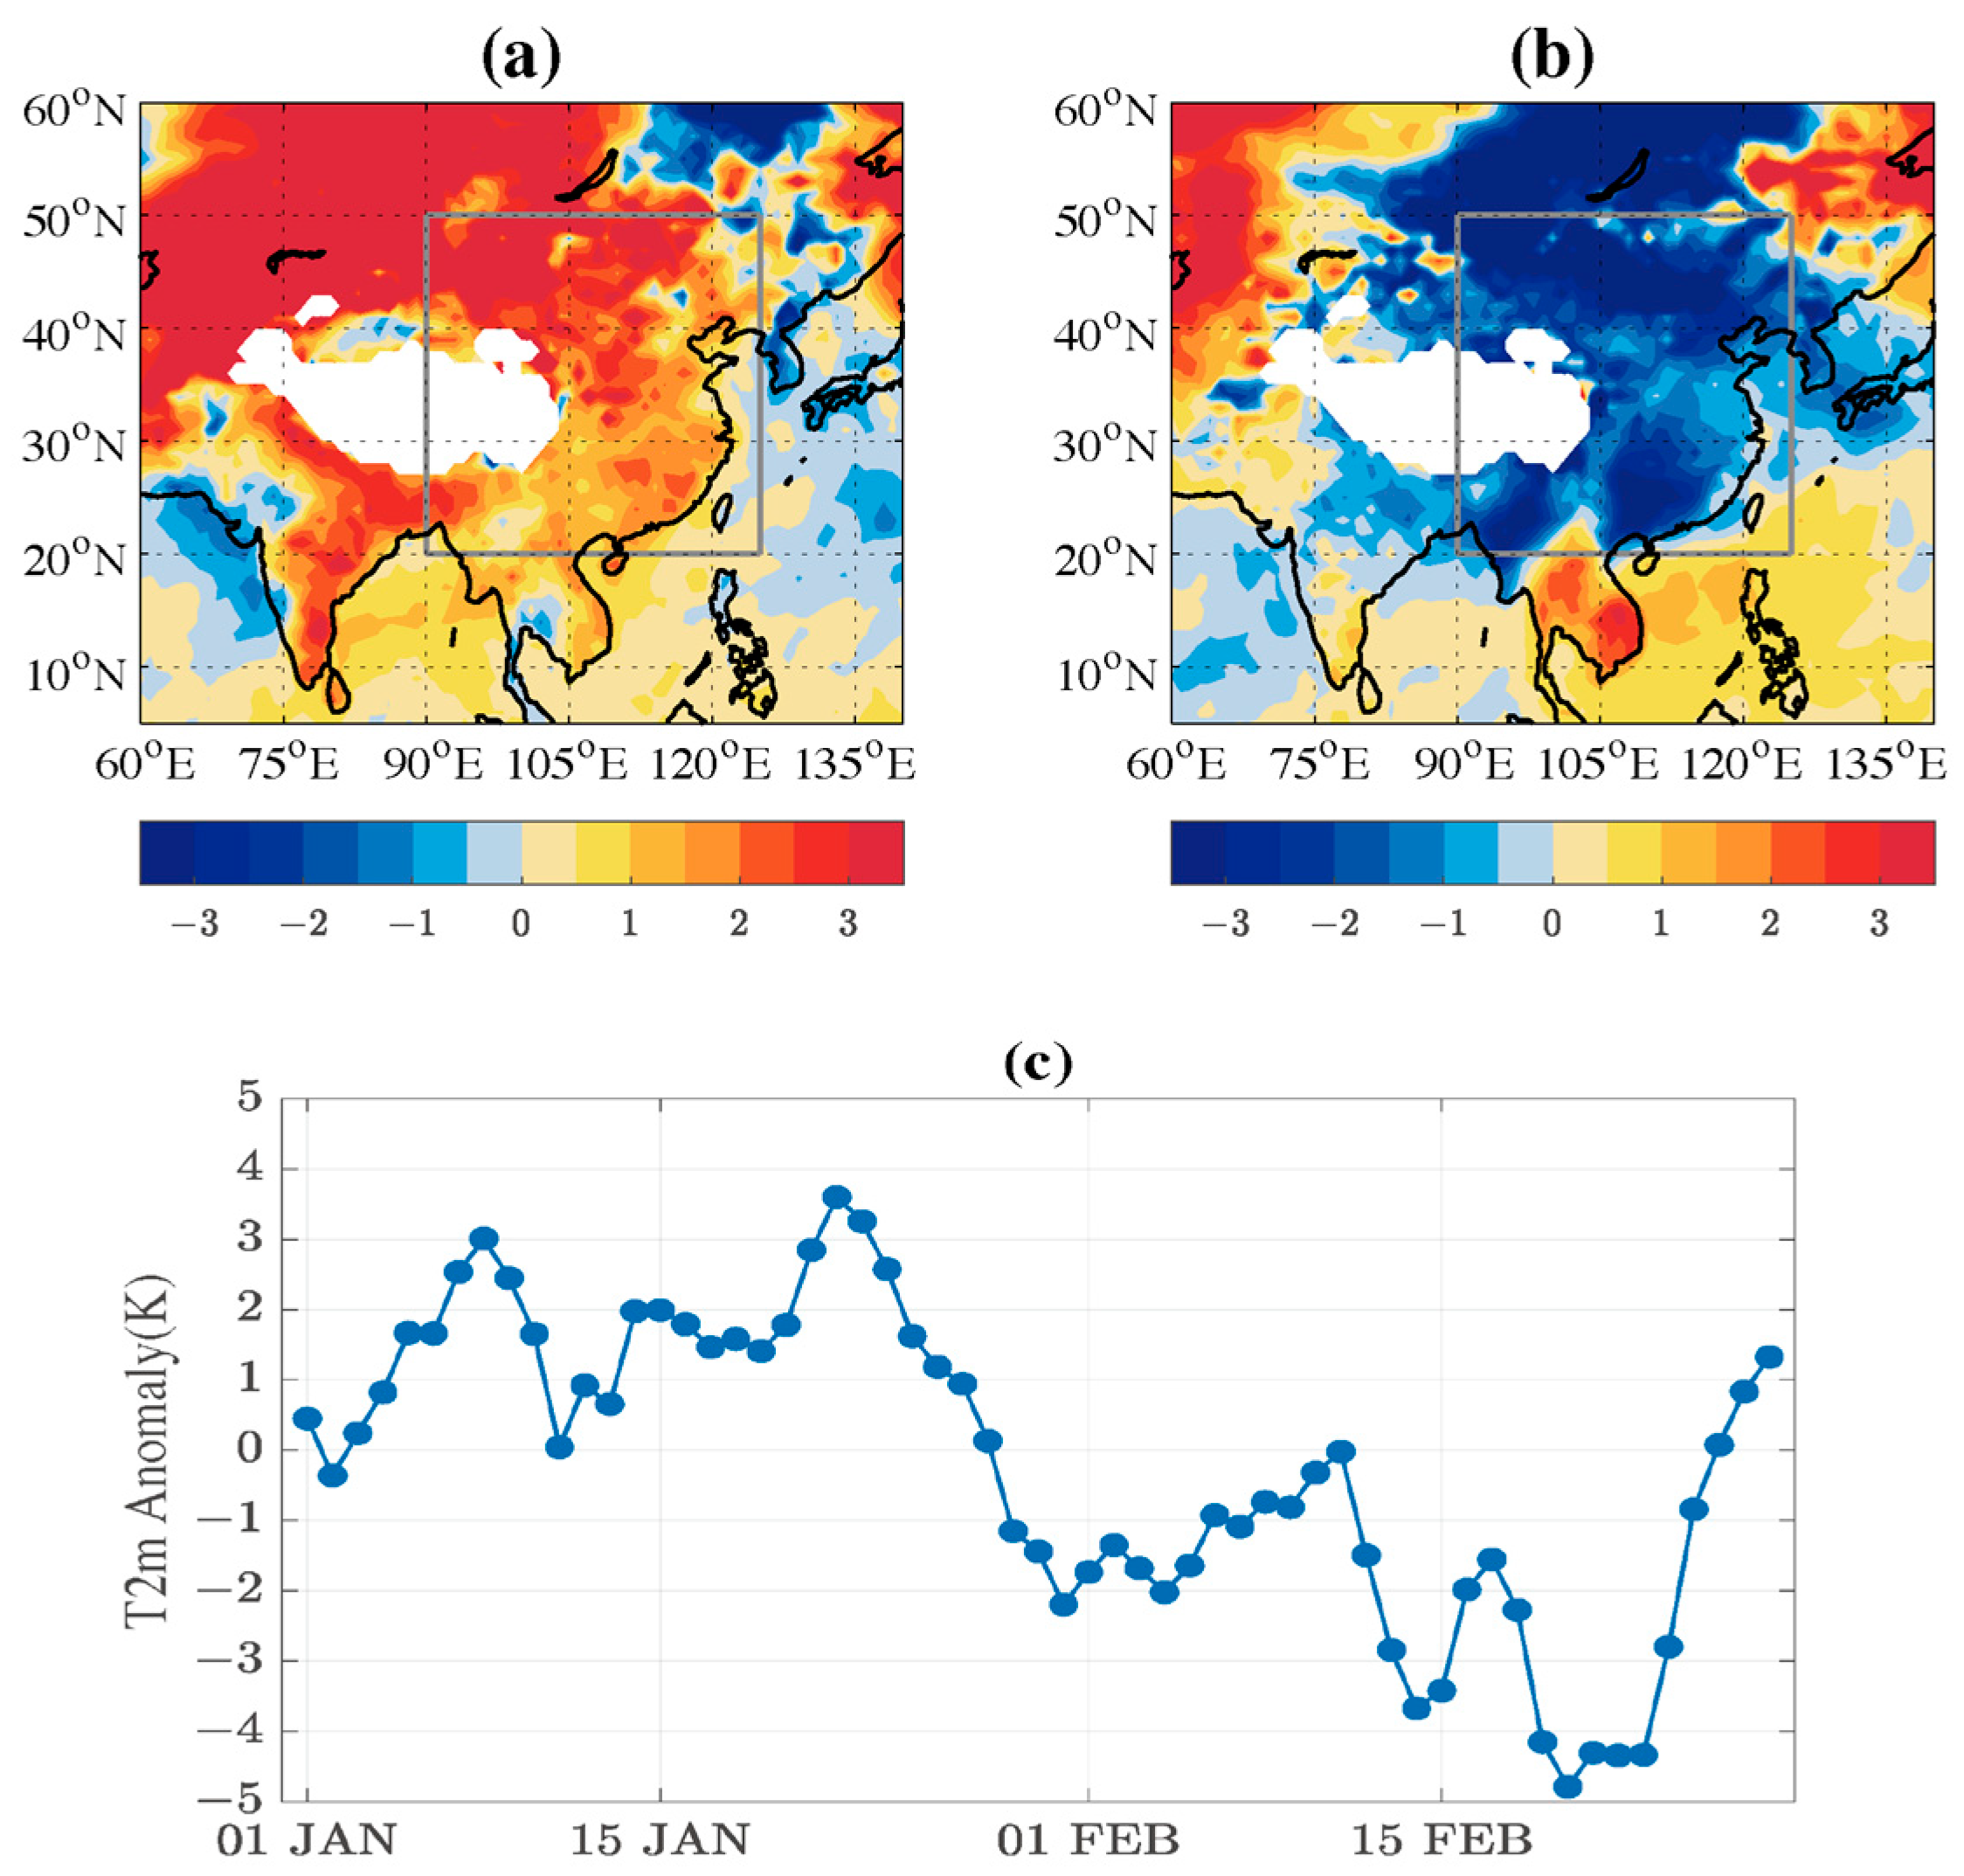
The average 500 hPa geopotential height anomalies throughout the warm and cold periods are shown in
Figure 5a and
Figure 5b, respectively, utilizing the three significant regression components mentioned above for daily multiple regression.
The actual potential height anomaly is consistent with the regression potential height anomaly in
Figure 5. Over the Mongolian Plateau and northern China during the warm period, there is a substantial positive anomaly in the 500 hPa geopotential height. A negative anomaly of around −15 gpm is present close to the Korean Peninsula, and the anomaly center value ranges from 75 to 100 gpm (
Figure 5a). Because of this arrangement, the East Asian trough is more likely to weaken and travel eastward. As a result, the cold advection behind the trough also diminishes, which leads to an atypical warm advection and a rise in temperature in eastern China. It is conducive to the westward movement and strengthening of the East Asian trough, and it will strengthen the cold advection behind the trough, causing the temperature in eastern China to continue to be colder. The 500 hPa geopotential height over northern China and the Tibetan Plateau during the cold period displays a significant negative anomaly between −50 and −70 gpm. (
Figure 5b).
3.4. The Influence Mechanism of Tropical Convection Anomaly on the Temperature in Eastern China
The contribution of OLR in the critical area is the largest among the many regression equations of the aforementioned temperature anomalies. Therefore, the LBM is utilized to discuss the specific process of how tropical convection in the key area affects the temperature in eastern China based on the actual OLR during the cold and warm seasons.
According to
Figure 3a, there are two OLR positive anomaly areas close to the southern Indian Peninsula and the Malay Peninsula during the warm period in January in the numerical experiment of the dry Linear Baroclinic Model (LBM). As a result, these two regions are characterized by heat sinks (
Figure 5a). The 300 hPa wind and the relative vorticity stability response it causes under the stated forcing in the 0–15°N, 60–110°E region are shown in
Figure 5b. A similar southwest-northeast wavy teleconnection pattern to the summer Pacific-Japan (PJ) teleconnection pattern was observed in the East Asian circulation during the warm month of January when the convective activity in the northeast Indian Ocean subsided. The cyclone circulation of one of them is near the Korean Peninsula, and the anticyclone circulation is positioned in the southwest of China. The East Asian trough and the cold advection behind it, which will be weakened by the anticyclone, is helpful in maintaining warm anomalies. According to
Figure 3b, a heat source is provided to the OLR anomaly negative area close to the southeast corner of the Bay of Bengal during the chilly month of February (
Figure 6c).
Figure 6d shows the 300 hPa wind and the relative vorticity stability response it causes in the 0–15°N, 60–110°E region under the indicated forcing. When the convective activity in the northeast Indian Ocean intensifies, the anticyclone in southwest China gets stronger and the cyclonic circulation gets stimulated near the Korean Peninsula. The East Asian trough will be strengthened by the cyclonic circulation, allowing cold anomalies to persist.
It is clear that at the beginning of 2022, anomalous convection activity in the Northeast Indian Ocean energized the southwest-northeast wave train across East Asia, which controlled the strength of the East Asian trough and resulted in surface temperature anomalies at different times. Previous research has demonstrated that the Indian Ocean sea surface temperature anomaly may activate the Pacific-Japan (PJ) teleconnection, altering East Asian temperatures and precipitation [
50]. While the tropical convection anomaly in the northeast Indian Ocean continues to have a significant impact on the temperature anomaly in East Asia in February, tropical convection anomaly frequently plays an essential role in the temperature anomaly in East Asia’s early winter [
51].
4. Conclusions and Discussion
In this study, the reverse characteristics of the temperature anomaly in eastern China at the beginning of 2022—Warmer in January and colder in February—Are analyzed, and the causes of this anomalous shift in temperature are discussed. The main conclusions are summarized as follows:
It primarily shows up as the Rossby wave train’s effects in the south and north westerly jets across Eurasia in the middle and high latitudes. In January, the Rossby waves of the southern and northern branches are respectively in positive and negative phases. Positive meridional wind anomalies are present over the Indian Peninsula and the West Siberian Plain. The southern branch trough is strengthened and the northern branch trough is weakened. Eastern China is warmer as a result of the anomalous warm advection that brought the flow of warm, humid low-latitude air northward. In February, the two Rossby wave trains’ phases are reversed. The south branch Rossby wave is in a negative phase, and the north branch Rossby wave is in a positive phase. The meridional wind over the West Siberian Plain and the Indian Peninsula is negative. The south branch trough weakens and the north branch trough strengthens. The dry and cold airflow in the middle and high latitudes moves southward, and the abnormal cold advection causes the cold anomaly in eastern China in 2022. As a result, China warms due to the heightened southwesterly warm advection in front of the south branch trough, which is positively connected with the temperature in eastern China this year. Eastern China’s temperature and the north branch wave train index have a negative correlation, and China experienced a cold anomaly due to intensified northwest wind cold advection behind the East Asian trough in this temperature anomaly event.
Tropical convection activity in the northeast Indian Ocean decreased in January and increased in February 2022. The surface temperature anomaly in eastern China has a strong positive link with the OLR anomaly index, which has positive anomalies in January and negative anomalies in February. A heat sink of 10–15 W·m−2 OLR anomaly is present near the southern Indian and Malay Peninsulas in January, which sets off an anticyclonic circulation over the Korean Peninsula and weakens the East Asian trough, facilitating warm anomalies to persist. In February, a heat source exists in the southeast of the Bay of Bengal, where the OLR anomaly reaches about −60 W·m−2, and the East Asian trough deepens due to cyclonic circulation over the Korean Peninsula, which favors the persistence of cold anomalies.
The tropical convective activity in the northeast Indian Ocean and the Rossby wave train in the two westerly jets in the middle and high latitudes are concurrent, simultaneously strengthening or weakening the East Asian trough. Consequently, at the beginning of 2022, eastern China is warmer in January and colder in February due to the effect of the East Asian trough.
It is imperative to acknowledge that the findings presented within this manuscript are rooted in a singular case study conducted during the nascent months of 2022. The principles delineated in this investigation hold the potential to function as valuable points of reference for attributing accountability to temperature anomalies during the winter season, as well as for formulating temperature prognostications for impending winters. Concurrently, we hold a positive outlook toward the prospect of assimilating additional discrete case studies in subsequent endeavors, thereby fortifying and extending the scope of our established observations.


