Article

Enabling High-Resolution Micro-Vibration Detection Using Ground-Based Synthetic Aperture Radar: A Case Study for Pipeline Monitoring

1
Department of Photogrammetry and Remote Sensing, School of Surveying and Geospatial Engineering, College of Engineering, University of Tehran, Tehran 141663, Iran
2
Department of Earth Observation Science (EOS), Faculty of Geo-Information Science and Earth Observation (ITC), University of Twente, 7514 AE Enschede, The Netherlands
3
Dipartimento di Scienze e Tecnologie, Centro Direzionale di Napoli, Università degli Studi di Napoli “Parthenope”, Is. C4, 80143 Naples, Italy
*
Author to whom correspondence should be addressed.
Remote Sens. 2023, 15(16), 3981; https://doi.org/10.3390/rs15163981
Submission received: 1 June 2023 / Revised: 7 July 2023 / Accepted: 9 August 2023 / Published: 11 August 2023
(This article belongs to the Special Issue Modeling, Processing and Analysis of Microwave Remote Sensing Data)

Abstract

:
The wellbeing of pipelines is influenced by a range of factors, such as internal and external pressures, as well as deterioration over time due to issues like erosion and corrosion. It is thus essential to establish a reliable monitoring system that can precisely examine pipeline behavior over time in order to prevent potential damages. To this end, pipelines are inspected based on internal and external approaches. Radar, as a non-contact sensing system, can be a suitable choice for external pipeline inspection. Radar is capable of the transmission and receiving of thousands of signals in a second, which reconstructs the displacement signal and is used for a vibration analysis. Synthetic aperture radar (SAR) imaging adds cross-range resolution to radar signals. However, a data acquisition rate of longer than several seconds makes it unsuitable for sub-second vibration monitoring. This study aims to address this limitation by presenting a method for high-resolution vibration monitoring using ground-based SAR (GBSAR) signals. To this end, a signal processing method by modifying the radar’s signal model is presented, which allows for estimating scattering targets’ vibration parameters and angle of arrival with high resolution. The proposed method is validated with numerical simulation and a real case study comprising water pipelines. Moreover, various analyses are presented for the in-depth evaluation of the method’s performance in different situations. The results indicate that the proposed method can be effective in detecting pipeline vibration frequencies with micro-scale amplitudes while providing high spatial resolution for generating accurate vibration maps of pipelines. Also, the comparison with the radar observations shows a high degree of agreement between the frequency responses with the maximum error of 0.25 Hz in some rare instances.

Graphical Abstract

1. Introduction

Deformation and vibration monitoring plays an important role in early damage detection, reducing repair costs, and enhancing safety in structural health monitoring (SHM). In this regard, interferometric processing techniques in radar remote sensing provide valuable insights into structural behavior and conditions, reducing the risk of failures and enhancing safety measures. Unlike contacting sensors like accelerometers, radar is non-contact, non-invasive, and non-destructive, enabling it to measure deformation over extensive areas without causing harm to the structure. Moreover, radar is insensitive to weather and lighting conditions and capable of penetrating through fog or smoke, thus significantly surpassing optical sensors [1]. As a result, studies in SHM are increasingly exploring radar remote sensing across various domains, including civil structures such as bridges [2] and buildings [3], tall structures such as towers [4] and wind turbines [5], cultural heritage [6], and industrial structures such as pipelines [7].
Pipelines are essential for transporting fluids, including gas, oil, and water, from one location to another. However, various factors such as internal or external pressure, stress, and damages such as corrosion, erosion, and cracking pose a threat to pipeline safety. Regular inspections of pipelines can help detect potential issues, enabling preventative measures to be taken before significant problems arise [8]. Thus, pipeline inspections are mainly performed internally or externally. Internal inspections are based on in-line inspection methods and pipeline inspection gauge (PIG) systems [8], while external inspections can be performed with various contact and non-contact sensors. To this end, various external pipeline inspection methods have been proposed in the literature. A vibration monitoring system for water leak detection using accelerometers was presented in [9]. In another study, a system based on a fiber ring cavity laser was presented for the highly sensitive monitoring of gas pipeline vibrations up to 400 kHz [10]. A robotic non-contact monitoring system based on autonomous ground vehicle, radar, and metal magnetic memory sensors was presented in [11] for the condition monitoring and fault detection of buried oil and gas pipelines. In another study, an inspection study for subsurface pipeline fault detection using magnetic sensors was demonstrated in [12]. In particular, changes in a pipeline’s vibration signature, such as an increase in vibration frequency, can be an indication of damages such as a leakage, cracking, or loosened connections [10,13]. Radar technology can provide a continuous monitoring system for simultaneously detecting deformations and vibrations in multiple areas of a pipeline.
Radar interferometry has been investigated, experimented with, and adapted in a wide range of applications in radar remote sensing. The space-based technique makes it feasible to monitor targets’ displacement with an up to sub-millimeter accuracy [14,15,16]. Multi-baseline and/or time-series synthetic aperture radar (SAR) provides cross-range resolution with the interferometric processing of radar signals acquired at different cross-range locations [17]. While the satellite-based SAR interferometry (InSAR) is a mature tool for the large-scale monitoring of the Earth environment, the terrestrial (or ground-based) radar interferometry (TRI), ground-based SAR (GBSAR) interferometry (GBInSAR), and recent ground-based multiple-input-multiple-output (MIMO) radars are mainly categorized as noncontact systems for monitoring dynamics of small areas with a better temporal resolution and lower atmospheric impact than satellite data [18,19,20,21].
GBSAR systems generally enable cross-range resolution by moving the radar sensor on a mechanical rail in a specified trajectory [22]. Ka and Ku frequency bands are most prevalent in GBSAR systems, due to their relatively high resolution and compact size [23,24]. However, recent studies have also demonstrated the effectiveness of automotive 77 GHz W-band radars for structural monitoring [25,26,27,28]. In fact, a higher operational frequency results in a more compact and lighter system and, as a result, simpler deployment [23]. However, these systems, due to their weak power, are suitable for monitoring a single object such as a building, bridge, or wind turbine [5,29,30,31].
Vibration monitoring using radar interferometry has gained more attention due to radar’s capabilities and accurate performance based on recent studies [26,32,33]. Real aperture radars (RAR) have the capability to send and receive thousands of signals per second, allowing for the detection of vibrations with kilohertz frequencies. Nevertheless, the primary disadvantage of radar sensing is the super positioning of moving or stable targets located in the same radial distance but with different cross-range locations. As a result, not only is radar unable to localize targets in a cross-range direction, but also, due to the broadening of the antenna footprint, the accuracy of displacement measurement can be decreased by increasing the distance. Multi-static or MIMO radar systems enabled the cross-range resolution by exploiting a network of multiple transmitter and receiver antennas [23]. Thus, these systems can provide a high data acquisition rate with moderate cross-range resolution for resolving scatterers at range and cross-range directions. However, improving the cross-range resolution in these systems is highly dependent on increasing the number of antennas and improving their geometry, which can dramatically increase the size, complexity, and cost of the system [34].
Compared to the mentioned radar systems, SAR allows for cross-range resolution by relocating the radar and capturing signals from various positions. In contrast to RAR and MIMO systems, one of the challenging issues in SAR (or, more specifically, in our study GBSAR) imaging is the data acquisition interval of several minutes, which prevents its applications for real-time and fast displacement monitoring, such as involving structural vibrations. To address this issue, this paper presents a framework for the high-resolution monitoring of vibrational displacements by processing GBSAR signals. The performance of the proposed framework was validated with numerical simulations and in a case study comprising pipelines with micrometer-scale vibrations. Thus, the main contributions of this paper can be summarized as follows:
  • Presenting a framework for resolving a scatterer’s cross-range location and vibrational displacement parameters from a GBSAR signal.
  • Providing an in-depth analysis on the performance and limitations of the proposed framework.
  • Investigating the applicability of the proposed framework for the high-resolution and accurate imaging of pipelines with micrometer vibrations.
The rest of the paper is organized as follows: Section 2 presents the proposed methodology including the theoretical background. The results of the simulations and real experiments as well as discussion are brought in Section 3. Finally, the summary of this study and concluding marks are drawn in Section 4.

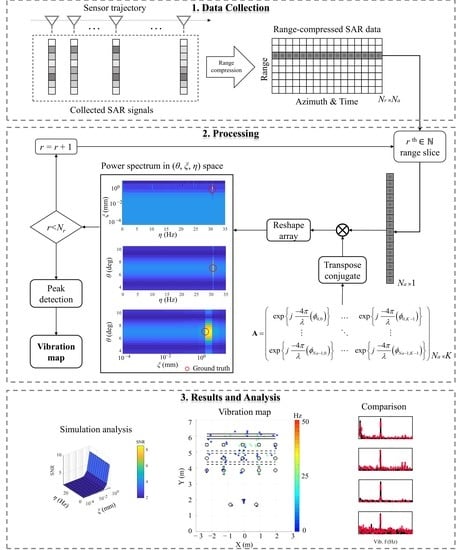
2. Materials and Methods

This section presents the proposed approach for resolving high-resolution SAR imaging and detecting scatterers’ vibration characteristics based on GBSAR signal processing. Firstly, we define the problem and signal model, considering the GBSAR imaging geometry. Next, we explain our processing algorithm for detecting vibrations from GBSAR signals.

2.1. Problem Statement and Signal Model

Azimuth angle or, in other words, angle of arrival (AoA) estimation cannot be achieved with conventional monostatic radar unless signals are collected from different viewing angles. In a GBSAR system, this capability is enabled by moving a radar sensor on a mechanical rail. However, the common approach assumes that scatterers in the scene of interest are stationary during SAR signal acquisition. To detect the targets’ vibration characteristics, it is necessary to account for their effects in the received signal model. Figure 1 illustrates the relative geometry between the transmission geometry with linear GBSAR and a vibrating point scatterer in the scene. At each step on the trajectory, the sensor separately transmits the signal and collects the echo waves, while the target point scatterer vibrates during the imaging process. This section aims to discriminate the scattering targets’ AoA and vibrational deformation parameters by improving the signal model and describing the required SAR imaging considerations.
In this case, we can formulate the recorded GBSAR signals as a multi-temporal stack of Na one-dimensional range profiles with a spatial baseline from the sensor’s zero location along the azimuth axis. Therefore, the raw acquired GBSAR data would form a 2D Nr × Na matrix, where Nr and Na are the number of samples in the range and azimuth directions.
Considering that the recorded signal with the radar sensor is dechirp-on-receive, the range-compressed data of recorded Nr fast-time samples at the mth virtual receiver are given with the Fourier transform of the received signal: src = r{s}. Accordingly, each bin on the acquired range profile is directly related to the pixel’s range. The general signal model for the distribution of received signals from different cross-range points at the rth range slice of the range-compressed SAR signal can be represented as
s r c = θ γ ( θ ) e j 4 π λ ( m sin θ ) d θ
where γ is the function modelling the scattering distribution, θ is the scattering target’s cross-range angle or AoA, and m is the radar’s mth virtual antenna location on the azimuth or along-track axis for m = 0, 1, …, Na − 1, respectively [35,36,37].
The signal model shown in (1) is the starting point for multi-dimensional imaging and the simplest scenario, where the scattering targets are assumed to be fixed during the data acquisition.
Assuming that the scattering target is vibrating during the data acquisition, an extra displacement term needs to be added to the range-compressed signal’s model (1) in order to model the contributions of scattering targets’ displacement in time along with their azimuth AoA (θ).
Vibration refers to the oscillatory motion of an object or system around its equilibrium position. It involves periodic fluctuations characterized by a dominant frequency in the time domain and an amplitude representing the maximum extent of the displacement in space. Hence, at the mth range profile acquisition of GBSAR at time Tm = mtp, the vibration signal can be represented by the sinusoidal function ξsin(2πηTm + φ), where tp denotes the range profile acquisition interval, ξ is the amplitude of the target’s vibration, η denotes the vibration frequency, and φ is the vibration signal’s initial phase.
Thus, in the case of having vibrational displacement behavior, the term representing the displacement needs to be included in the base signal model shown in (1). The modified signal model can be reformulated as follows:
s r c = χ γ ( χ ) e j 4 π λ ( m sin θ ) A o A e j 2 π λ ξ sin ( 2 π η T m + φ ) v i b r a t i o n d θ d ξ d η d φ
In (2), one variable represents the target’s AoA and three variables represent the model for the target’s sinusoidal vibration in the radar’s LOS direction. Thus, for the multi-dimensional modelling of azimuth AoA and vibrational displacement, the vector of unknown variables is defined as χ = [θ, ξ, η, φ] and γ(χ) is the function modelling the scattering distribution along the space of unknowns, χ [38].

2.2. Inversion Model

After performing range compression and revealing the scatterers’ locations in the range direction, the estimation of other unknown parameters, i.e., AoA and vibration parameters, is obtained with the inversion of (2). This process is achieved through a time-domain-matched filtering process and the generation of power spectral density (PSD) maps. Figure 2 illustrates the processing steps for resolving scatterers’ vibration characteristics as well as their AoA from the collected GBSAR signals.
The algorithm begins by generating the system matrix (A) in the domains of interest [39]. The system matrix is a collection of Na × 1 steering vectors (ak), where each steering vector is a reference signal as follows:
a k = a k ( χ k ) = exp { j 2 π λ ( 2 L sin θ k + ξ k sin ( 2 π η k T + φ k ) ) }
where L = [0, 1, …, Na−1] is the vector containing radar’s azimuth locations, and T = [T0, T1, …, TNa−1] is the vector containing signal acquisition times.
Therefore, for K discretized samples of the domain of interest in the variables’ space (χ), the system matrix A ∈ ℂNa×K is obtained by stacking the steering vectors.
For the rth range slice of the measured range-compressed signal x = src(r) ∈ ℂNa×1, (2) can be rewritten as follows:
x = A γ ( χ )
where γ = [γ0, …, γK−1]T ∈ ℂK×1 is collected from the values of the backscattered signals at K discrete bins.
As a result, the inversion of (4) provides the estimated PSD of parameters for the rth range slice as follows:
γ ^ ( χ ) = A H x
where AH is the transpose conjugate of A.
The resulting PSD is represented as a K × 1. By reshaping this array, the final multi-dimensional PSD in the parameter domain is generated. This process is repeated for each range slice. The corresponding AoA and vibration parameters are identified as peak points within the PSD, exhibiting the highest power and indicating the highest match (correlation) with the reference signal. Thus, the scatterers’ position vector χ i in the multi-dimensional search space of parameters can be identified by finding the peak power in the estimated power spectrum [39]:
χ i = arg max χ { | γ ( χ ) | }
Finally, after detecting the range, AoA, and vibrational characteristics of scatterers, the vibration map is obtained by transforming the (R, θ) dimensions to (X = Rcosθ, X = Rsinθ) and vibration frequency and amplitudes can come as the other dimensions.

3. Experiments and Results

This section presents the experiments and results related to high-resolution vibration monitoring from a single pass of GBSAR data for the application of pipeline health monitoring. Firstly, various numerical simulations were conducted to validate and analyze the proposed method’s performance in-depth. Then, we demonstrate the results obtained from a real experiment on a case study of water pipelines with micrometer-scale vibrations.
In this study, we utilized an AWR1642BOOST (https://www.ti.com/product/AWR1642, accessed on 30 May 2023) radar sensor manufactured by Texas Instruments (TI). This sensor generates a linear frequency-modulated continuous wave (FMCW) signal in the W band, with a frequency range of 76–81 GHz, yielding a wavelength of approximately 3.9 mm. After the dechirping process, which includes mixing with a reference signal and low-pass filtering, the digitized dechirped signal is stored in the system’s memory. The maximum affordable signal bandwidth of this system is 4 GHz, but we only exploited 1.5 GHz of signal bandwidth in this study, resulting in a 10 cm resolution in the range direction of the radar. To create SAR imaging and improve the cross-range resolution, we mounted the radar system on a linear mechanical rail with a maximum length of 15 cm and rotation velocity of 5 mm/s. The details of the system parameters are provided in Table 1.

3.1. Simulations and Numerical Experiments

To validate the correct implementation of the method and evaluate it, first, we numerically simulated a point scatterer positioned at a distance of 5 m from the SAR central point with an azimuth angle of θ = 7 degrees. The target was fluctuating with a vibration frequency and amplitude of η = 24.2 Hz and ξ = 0.51 mm, respectively. We used the parameters provided in Table 1 to simulate the radar signal, while for SAR imaging, we simulated an aperture length of 4 cm with a signal repetition time of 8 ms. The parameters specific to this simulation scenario are listed in Table 2. Figure 3 depicts the focused PSD of a simulated point scatterer. To better illustrate the focused signal, we represented the three-dimensional space of AoA, vibration frequency, and vibration amplitude as three two-dimensional surfaces. The obtained results indicate that the proposed method can accurately detect a target’s azimuth angle as well as its vibrational displacement characteristics, namely vibration amplitude and frequency. Therefore, if we define the resolution of signal focusing to be the width of the peak signal at its half-power (−3 dB from the peak power), then from the response of the focused target, we can observe that the vibration frequency and AoA axes exhibit a narrow response with half-power resolutions of 0.03 Hz and 4 degrees, respectively. Conversely, the vibration amplitude axis response is relatively wider, with a half-power resolution of 0.9 mm.
To conduct a further analysis, we examined the effect of the linear synthetic aperture length, which is linearly related to data acquisition time, on the quality of the focused signal in terms of the half-power (−3 dB) resolution and signal-to-noise ratio (SNR). For this experiment, we simulated a point target with the same characteristics as those shown in Table 2. We considered a linear trajectory for the radar from 7.5 mm to 75 mm, which correspond to monitoring durations of 1.5 and 15 s, respectively. The results are presented in Figure 4.
As observed in Figure 4, increasing the length of monitoring time (which results in a longer aperture length) leads to improved half-power resolution for vibration frequency and azimuth angle estimation, along with a higher SNR. This implies a better distinction and probability of detection. However, the resolution of the vibration amplitude is not affected by an increase in monitoring time (and aperture length) and remains fixed at approximately 0.9 mm. Based on these findings, we can infer that for sub-millimeter vibration monitoring purposes, our system might accurately detect multiple vibration frequencies, but their amplitudes might be mixed.
In another simulation experiment, we aimed to further analyze the accuracy of the parameter estimation in more complex scenarios when a point scatterer is vibrating with different frequencies and amplitudes. To achieve this, we conducted simulations for a target vibrating with frequencies ranging from 0 to 30 Hz and amplitudes ranging from 10−7 to 10−3 m. The rest of the simulation parameters were set to the values provided in Table 2.
The estimation error for each vibration scenario is depicted in Figure 5. It can be observed that the SNR of the focused signal decreases as the vibration amplitude decreases, while the effect of vibration frequency is not significant. The vibration frequency estimation error increases primarily in the region with small vibration amplitudes (about <10−3 mm) and for small vibration frequencies (as shown in Figure 5a). However, for small vibration amplitudes (<10−3 mm), the vibration amplitude estimation error increases dramatically at almost all frequencies (as shown in Figure 5b).

3.2. Real Experiments

After the analysis and evaluations with simulated experiments, real experiments were carried out in a case study including a network of water pipelines. The investigated area is shown in Figure 6a. In this area, the SAR image covers the specific zone, enclosing the observation of seven cylindrical metallic pipelines with vertical orientation with respect to the radar’s looking angle. As identified with a blue sign in Figure 6a, two of these pipelines were functioning and the water flow was pumping in them. The remaining pipelines were inactive during the experiment, which are labelled with a red sign in Figure 6a. It is worth noting that these disparate pipelines are connected to each other via the horizontal pipes that are placed near the ceiling. This implies that the vibration of the functioning pipelines could potentially impact the inactive ones, but with a lesser power. Also, a fixed 10 cm trihedral metallic corner reflector was placed in the scene for calibration and comparison purposes (shown with a white sign in Figure 6).
For GBSAR imaging, we specified a 4 cm aperture length, and the radar sensor with a linear velocity of 5 mm/s moved on it. Figure 6b shows the radar’s trajectory on the mechanical rail during the GBSAR imaging process. In this case, the radar’s linear movement continues for 8 s until it reaches the 4 cm synthetic aperture length. After that, the radar is fixed, and signal transmission continues for approximately 5.5 s. Therefore, within 13.5 s of radar observations with a transmission rate of 8 ms, a total of 1687 range profiles were collected to be processed for the SAR imaging and vibration mapping of the study area.
Figure 7 displays the SAR image of the study area obtained through a two-dimensional Fourier transform. However, it is important to note that this method does not account for target displacement during SAR imaging and was solely utilized in this study for visualizing the SAR image of the scene, while the rest of the results presented in this paper are based on the proposed methodology. It is apparent that nearly all targets in the scene are clearly distinguishable, except for one pipe located on the right side of the image. The occlusion of this pipe may be due to the presence of another pipe in the radar’s line of sight direction.
Once the raw data were processed according to the flowchart presented in Figure 2, the scatterers with strong power responses were chosen, and their dominant vibration frequencies were extracted. The resulting vibration frequency map of the studied area is shown in Figure 8a. It can be observed that the corner reflector and inactive pipes display a vibration frequency of zero, while the detected points related to the functional pipelines show a dominant vibration frequency of approximately 25 Hz. Some of the inactive pipes and water pumps also exhibit a similar vibration frequency to the functional pipes, which could be attributed to their interconnection. Additionally, since water pumps regulate the water flow in the pipes, they may demonstrate a similar vibration pattern to the pipes.
For comparison purposes, the vibration frequency map of the MIMO configuration of AWR1642BOOST is presented in Figure 8b. This configuration can generate a virtual array of 1.52 cm by creating eight virtual arrays, and the vibration map was obtained using direct displacement measurement and the time-series radar interferometry processing algorithm. Both the GBSAR and MIMO radar maps exhibit a good agreement and demonstrate similar patterns of vibration frequencies. However, GBSAR provides a cleaner image with a lower presence of clutter and more precise localization of targets in the scene.
Moreover, the difference in dominant vibration frequencies of the scatterers detected from GBSAR data and MIMO radar is illustrated in Figure 9. Based on the results, the frequency detection error varies within a range of ±0.25 Hz. However, the majority of the detected peaks exhibit a zero difference between GBSAR and MIMO radar measurements.
To conduct a more detailed analysis, we extracted the peak power response of all scatterers within the vibration frequency range of 24–25 Hz. The results are presented in Figure 10, where it can be observed that the corner reflector and its two adjacent pipes exhibit the lowest power responses, consistent with the previous figure. Conversely, the other pipelines display higher power responses, with the functional pipes and water pumps demonstrating the strongest responses. In comparison, the other pipes, in close proximity to the functional ones, exhibit relatively weaker power responses.
Figure 11 compares the reconstructed power spectral density of the scatterers detected with GBSAR measurements and MIMO radar. The comparison indicates a high degree of agreement between the frequency responses obtained with GBSAR and MIMO radar. Peak points and noise levels are often very similar, validating our proposed method’s accuracy in reconstructing a scatterer’s vibration frequency response and improving cross-range resolution. However, in some instances, GBSAR processing produces noisier signals than those obtained with MIMO radar measurements. The main possible reasons for this could be the target’s weak backscattering SNR, a weak vibration amplitude, or the interference of scatterers, particularly with the reduction in the cross-range resolution in high ranges. The simulation analysis in Figure 5 also validated that estimating vibration power spectral density for scatterers with a weak vibration amplitude is less reliable and provides lower SNRs. For example, scatterers 60, 71, and 72 (shown in Figure 11 and Figure 12) exhibit a relatively lower vibration SNR, which can be attributed to their weak vibration power and backscattering SNR.

4. Discussion

This study presented a method for high-resolution pipeline vibration monitoring using GBSAR imaging. The method addressed this problem by considering a sinusoidal vibration model and improving the radar’s received signal. This model adds three parameters to the signal equation, the vibration amplitude, frequency, and initial phase shift. Although our experiments were limited on GBSAR, this method can also be applied to the SAR signals collected from airborne or satellite systems for the vibration monitoring of other types of structures such as a bridge or building.
The proposed framework’s performance was validated through simulations and real experiments. The results obtained from MIMO radar interferometric processing were used as a benchmark and for comparison. Previous studies have shown that radar observations exhibit a high correlation with vision-based methods and accelerometers, with a maximum error of approximately 0.02 mm [5,7]. Our simulations revealed that while the resolutions of the AoA and vibration frequency improved with an increasing observation length, the resolution of the vibration amplitude remained at around 0.9 mm in our study. Consequently, our goal was to increase the observation time to improve the resolution of the vibration frequency. This was particularly important since our specific study area had micrometric vibrations. Our analysis indicated that although the estimated vibration amplitudes may be less precise, the vibration frequencies could be estimated with a high precision and reliability.
The estimated vibration signals showed a lower SNR compared to MIMO radar observations. This difference could be attributed to the effects of the sensor’s movement, including fluctuations and interference from the scatterer’s range migration and vibrational displacement. It is important to highlight that in this study, the sensor was situated in a relatively stable environment, and we did not take into consideration the effects of local sensor vibrations. However, it is worth noting that in situations involving intense environmental vibrations, it becomes crucial to model and minimize the effects of instrumental vibrations on the collected radar signal in order to attain reliable and accurate results.
Furthermore, simulations showed that estimating very small vibrations (below the system’s noise level, e.g., 25 microns) at unlike vibration frequencies may lead to unreliable results in terms of estimated vibration amplitudes. However, increasing the vibration amplitude leads to more reliable estimates of the parameters.
In this study, SAR imaging was based on a linear trajectory, even though it has been demonstrated that irregular data acquisition produces the best scatterer resolving in multi-dimensional SAR imaging [39,40]. Nevertheless, irregular imaging may be beneficial for repeat-pass multi-baseline SAR data acquisition, especially in applications such as height or differential tomography [41,42]. However, when collecting single-pass SAR data from various range profiles, irregular imaging poses significant challenges, including the need for the precise estimation of the antenna location at each step and requiring a higher number of samples in the cross-range to improve resolution.
The matched filtering method can be replaced by advanced spectral estimation methods such as Capon or MUSIC to achieve a super-resolution performance for multiple scatterer detection. This is especially beneficial when monitoring targets with high spatial density. These methods make use of the antenna covariance matrix and improved inversion techniques to enhance scatterer resolution with a higher SNR [42,43]. However, this comes at the cost of an increased computational complexity, especially for AoA and vibration modelling with dense cross-range signal sampling and four unknown parameters. Therefore, these methods are suitable for scenarios with coarse cross-range resolution or a dense presence of scatterers with varying vibration behavior.

5. Conclusions

This study presented a GBSAR signal processing framework for the high-resolution monitoring of micrometer-scale vibrations in pipelines. Pipelines are commonly used to transport fluids like water, and regular inspections can aid in identifying potential issues and preventing major problems. As a non-contact monitoring system, radar is capable of sub-second data acquisition rates and displacement monitoring with the interferometric processing of time-series signals. Nonetheless, SAR imaging is required to enable target discrimination in the cross-range direction, which comes at longer data acquisition rates, rendering SAR imaging unsuitable for vibration monitoring. This study tackled this challenge by enhancing the radar signal model and incorporating the target vibration model. Thus, we resolved the vibrational parameters as well as the target’s azimuth angle iteratively using a matched filtering algorithm. We conducted numerous experiments, including numerical simulations and real case studies, to evaluate the proposed framework. The findings demonstrate the efficacy of this approach on GBSAR signals. Based on the analysis provided, vibration frequencies with amplitudes up to 1 micrometer were accurately detected. Moreover, as shown, increasing the monitoring time and synthetic aperture length enhanced the detection results of the target vibration frequency and azimuth angle but proved to be ineffective in improving the detection of the vibration amplitude. The findings of our case study indicate that the proposed method was effective in detecting pipeline vibration frequencies while providing high spatial resolution for generating accurate vibration maps of pipelines. Future works can be dedicated to addressing the remaining challenges of the proposed methodology including the analysis and mitigation of external noises such as a sensor’s fluctuations, using super-pixel methods for reducing the multiple scatterer interferences, and implementing the proposed method on an airborne dataset and conducting further case studies.

Author Contributions

Conceptualization, B.H.; methodology, B.H., J.A. and H.A.; software, B.H.; validation, B.H.; formal analysis, B.H.; investigation, B.H.; resources, B.H. and J.A.; data curation, B.H.; writing—original draft preparation, B.H.; writing—review and editing, B.H., J.A., H.A. and G.F.; visualization, B.H.; supervision, J.A. and H.A.; project administration, J.A. All authors have read and agreed to the published version of the manuscript.

Funding

This research received no external funding.

Data Availability Statement

Not applicable.

Conflicts of Interest

The authors declare no conflict of interest.

References

  1. Pieraccini, M. Monitoring of civil infrastructures by interferometric radar: A review. Sci. World J. 2013, 2013, 786961. [Google Scholar] [CrossRef]
  2. Michel, C.; Keller, S. Advancing Ground-Based Radar Processing for Bridge Infrastructure Monitoring. Sensors 2021, 21, 2172. [Google Scholar] [CrossRef]
  3. Alva, R.E.; Pujades, L.G.; González-Drigo, R.; Luzi, G.; Caselles, O.; Pinzón, L.A. Dynamic Monitoring of a Mid-Rise Building by Real-Aperture Radar Interferometer: Advantages and Limitations. Remote Sens. 2020, 12, 1025. [Google Scholar] [CrossRef] [Green Version]
  4. Luzi, G.; Crosetto, M.; Cuevas-González, M. A radar-based monitoring of the Collserola tower (Barcelona). Mech. Syst. Signal Process. 2014, 49, 234–248. [Google Scholar] [CrossRef] [Green Version]
  5. Baumann-Ouyang, A.; Butt, J.A.; Varga, M.; Wieser, A. MIMO-SAR Interferometric Measurements for Wind Turbine Tower Deformation Monitoring. Energies 2023, 16, 1518. [Google Scholar] [CrossRef]
  6. Chen, F.; Guo, H.; Tapete, D.; Cigna, F.; Piro, S.; Lasaponara, R.; Masini, N. The role of imaging radar in cultural heritage: From technologies to applications. Int. J. Appl. Earth Obs. Geoinf. 2022, 112, 102907. [Google Scholar] [CrossRef]
  7. Monti-Guarnieri, A.; Falcone, P.; d’Aria, D.; Giunta, G. 3D vibration estimation from ground-based radar. Remote Sens. 2018, 10, 1670. [Google Scholar] [CrossRef] [Green Version]
  8. Sampath, S.; Bhattacharya, B.; Aryan, P.; Sohn, H. A real-time, non-contact method for in-line inspection of oil and gas pipelines using optical sensor array. Sensors 2019, 19, 3615. [Google Scholar] [CrossRef]
  9. Martini, A.; Troncossi, M.; Rivola, A. Automatic leak detection in buried plastic pipes of water supply networks by means of vibration measurements. Shock Vib. 2015, 2015, 165304. [Google Scholar] [CrossRef] [Green Version]
  10. Lalam, N.; Lu, P.; Venketeswaran, A.; Buric, M.P. Pipeline Monitoring Using Highly Sensitive Vibration Sensor Based on Fiber Ring Cavity Laser. Sensors 2021, 21, 2078. [Google Scholar] [CrossRef] [PubMed]
  11. Ali, A.A.; Karki, H.; Shukla, A.; Zhang, X. A smart robotic system for non-contact condition monitoring and fault detection in buried pipelines. In Proceedings of the Society of Petroleum Engineers-Abu Dhabi International Petroleum Exhibition and Conference 2018, ADIPEC 2018, Abu Dhabi, United Arab Emirates, 12–15 November 2018; OnePetro: Richardson, TX, USA, 2019. [Google Scholar]
  12. Bhadran, V.; Shukla, A.; Karki, H. Non-contact flaw detection and condition monitoring of subsurface metallic pipelines using magnetometric method. Mater. Today Proc. 2019, 28, 860–864. [Google Scholar] [CrossRef]
  13. Ghazali, M.H.; Hee, L.M.; Leong, M.S. Piping vibration due to pressure pulsations. Adv. Mater. Res. 2014, 845, 350–354. [Google Scholar] [CrossRef]
  14. Bamler, R.; Hartl, P. Synthetic aperture radar interferometry. Inverse Probl. 1998, 14, R1. [Google Scholar] [CrossRef]
  15. Pepe, A.; Calò, F. A Review of Interferometric Synthetic Aperture RADAR (InSAR) Multi-Track Approaches for the Retrieval of Earth’s Surface Displacements. Appl. Sci. 2017, 7, 1264. [Google Scholar] [CrossRef] [Green Version]
  16. Radman, A.; Akhoondzadeh, M.; Hosseiny, B. Integrating InSAR and deep-learning for modeling and predicting subsidence over the adjacent area of Lake Urmia, Iran. GIScience Remote Sens. 2021, 58, 1413–1433. [Google Scholar] [CrossRef]
  17. Reigber, A.; Scheiber, R.; Jager, M.; Prats-Iraola, P.; Hajnsek, I.; Jagdhuber, T.; Papathanassiou, K.P.; Nannini, M.; Aguilera, E.; Baumgartner, S.; et al. Very-High-Resolution Airborne Synthetic Aperture Radar Imaging: Signal Processing and Applications. Proc. IEEE 2013, 101, 759–783. [Google Scholar] [CrossRef] [Green Version]
  18. Li, W.; Wang, Z.; Wang, Y.; Wu, J.; Wang, J.; Jia, Y.; Gui, G. Classification of high-spatial-resolution remote sensing scenes method using transfer learning and deep convolutional neural network. IEEE J. Sel. Top. Appl. Earth Obs. Remote Sens. 2020, 13, 1986–1995. [Google Scholar] [CrossRef]
  19. Zhang, G.; Wu, Y.; Zhao, W.; Zhang, J. Radar-based multipoint displacement measurements of a 1200-m-long suspension bridge. ISPRS J. Photogramm. Remote Sens. 2020, 167, 71–84. [Google Scholar] [CrossRef]
  20. Akbari, V.; Lauknes, T.R.; Rouyet, L.; Negrel, J.; Eltoft, T. Validation of SAR iceberg detection with ground-based radar and GPS measurements. Int. Geosci. Remote Sens. Symp. 2018, 2018, 4623–4626. [Google Scholar] [CrossRef] [Green Version]
  21. Hosseiny, B.; Amini, J.; Safavi-Naeini, S. Simulation and Evaluation of an mm-Wave MIMO Ground-Based SAR Imaging System for Displacement Monitoring. In Proceedings of the 2021 IEEE International Geoscience and Remote Sensing Symposium IGARSS, Brussels, Belgium, 11–16 July 2021; IEEE: Piscataway, NJ, USA, 2021; pp. 8213–8216. [Google Scholar]
  22. Monserrat, O.; Crosetto, M.; Luzi, G. A review of ground-based SAR interferometry for deformation measurement. ISPRS J. Photogramm. Remote Sens. 2014, 93, 40–48. [Google Scholar] [CrossRef] [Green Version]
  23. Pieraccini, M.; Miccinesi, L. Ground-based radar interferometry: A bibliographic review. Remote Sens. 2019, 11, 1029. [Google Scholar] [CrossRef] [Green Version]
  24. Wang, Y.; Hong, W.; Zhang, Y.; Lin, Y.; Li, Y.; Bai, Z.; Zhang, Q.; Lv, S.; Liu, H.; Song, Y. Ground-Based Differential Interferometry SAR: A Review. IEEE Geosci. Remote Sens. Mag. 2020, 8, 43–70. [Google Scholar] [CrossRef]
  25. Baumann-Ouyang, A.; Butt, J.A.; Salido-Monzú, D.; Wieser, A. MIMO-SAR Interferometric Measurements for Structural Monitoring: Accuracy and Limitations. Remote Sens. 2021, 13, 4290. [Google Scholar] [CrossRef]
  26. Ciattaglia, G.; De Santis, A.; Disha, D.; Spinsante, S.; Castellini, P.; Gambi, E. Performance Evaluation of Vibrational Measurements through mmWave Automotive Radars. Remote Sens. 2020, 13, 98. [Google Scholar] [CrossRef]
  27. Hosseiny, B.; Amini, J.; Aghababaei, H. Interferometric Processing of a Developed Mimo Gbsar for Displacement Monitoring. ISPRS Ann. Photogramm. Remote Sens. Spat. Inf. Sci. 2023, X-4/W1-2022, 301–306. [Google Scholar] [CrossRef]
  28. Baumann-Ouyang, A.; Butt, J.A.; Wieser, A. Estimating 3D displacement vectors from line-of-sight observations with application to MIMO-SAR. J. Appl. Geod. 2023, 17, 269–283. [Google Scholar] [CrossRef]
  29. Miccinesi, L.; Consumi, T.; Beni, A.; Pieraccini, M. W-band MIMO GB-SAR for Bridge Testing/Monitoring. Electronics 2021, 10, 2261. [Google Scholar] [CrossRef]
  30. Guarnieri, A.M.; Wang, J.; Wang, Y.; Li, Y.; Huang, X. Fast Displacement Estimation of Multiple Close Targets with MIMO Radar and MUSICAPES Method. Remote Sens. 2022, 14, 2005. [Google Scholar] [CrossRef]
  31. Hosseiny, B.; Amini, J.; Aghababaei, H. Structural displacement monitoring using ground-based synthetic aperture radar. Int. J. Appl. Earth Obs. Geoinf. 2023, 116, 103144. [Google Scholar] [CrossRef]
  32. Xiong, Y.; Peng, Z.; Jiang, W.; He, Q.; Zhang, W.; Meng, G. An Effective Accuracy Evaluation Method for LFMCW Radar Displacement Monitoring with Phasor Statistical Analysis. IEEE Sens. J. 2019, 19, 12224–12234. [Google Scholar] [CrossRef]
  33. Artese, S.; Nico, G. TLS and GB-RAR Measurements of Vibration Frequencies and Oscillation Amplitudes of Tall Structures: An Application to Wind Towers. Appl. Sci. 2020, 10, 2237. [Google Scholar] [CrossRef] [Green Version]
  34. Rojhani, N.; Passafiume, M.; Lucarelli, M.; Collodi, G.; Cidronali, A. Assessment of Compressive Sensing 2 × 2 MIMO Antenna Design for Millimeter-Wave Radar Image Enhancement. Electronics 2020, 9, 624. [Google Scholar] [CrossRef] [Green Version]
  35. Tarchi, D.; Oliveri, F.; Sammartino, P.F. MIMO radar and ground-based SAR imaging systems: Equivalent approaches for remote sensing. IEEE Trans. Geosci. Remote Sens. 2012, 51, 425–435. [Google Scholar] [CrossRef]
  36. Chen, C.-Y. Signal Processing Algorithms for MIMO Radar; California Institute of Technology: Pasadena, CA, USA, 2009; ISBN 1267438711. [Google Scholar]
  37. Fortuny-Guasch, J. A fast and accurate far-field pseudopolar format radar imaging algorithm. IEEE Trans. Geosci. Remote Sens. 2009, 47, 1187–1196. [Google Scholar] [CrossRef]
  38. Zhang, W.; Li, G.; Wang, Z.; Wu, H. Non-contact monitoring of human heartbeat signals using mm-wave frequency-modulated continuous-wave radar under low signal-to-noise ratio conditions. IET Radar Sonar Navig. 2022, 16, 456–469. [Google Scholar] [CrossRef]
  39. Fornaro, G.; Lombardini, F.; Pauciullo, A.; Reale, D.; Viviani, F. Tomographic processing of interferometric SAR data: Developments, applications, and future research perspectives. IEEE Signal Process. Mag. 2014, 31, 41–50. [Google Scholar] [CrossRef]
  40. Lombardini, F. Differential tomography: A new framework for SAR interferometry. IEEE Trans. Geosci. Remote Sens. 2005, 43, 37–44. [Google Scholar] [CrossRef]
  41. Aghababaei, H. On the assessment of non-local multi-looking in detection of persistent scatterers using SAR tomography. Remote Sens. 2020, 12, 3195. [Google Scholar] [CrossRef]
  42. Rambour, C.; Budillon, A.; Johnsy, A.C.; Denis, L.; Tupin, F.; Schirinzi, G. From interferometric to tomographic SAR: A review of synthetic aperture radar tomography-processing techniques for scatterer unmixing in urban areas. IEEE Geosci. Remote Sens. Mag. 2020, 8, 6–29. [Google Scholar] [CrossRef]
  43. Aghababaee, H.; Ferraioli, G.; Schirinzi, G.; Pascazio, V. Regularization of SAR tomography for 3-D height reconstruction in urban areas. IEEE J. Sel. Top. Appl. Earth Obs. Remote Sens. 2019, 12, 648–659. [Google Scholar] [CrossRef]
Figure 1. Relative geometry of a GBSAR data acquisition and a vibrating point scatterer (θ: AoA, ξ: vibration amplitude, η: vibration frequency, ΔR: LOS deformation, X: cross-range direction, and Y: range direction).
Remotesensing 15 03981 g001
Figure 2. Overview of processing flow for resolving vibration parameters and AoA of a study area using GBSAR signals.
Remotesensing 15 03981 g002
Figure 3. Estimated PSD of a simulated experiment: (a) vibration frequency and vibration amplitude map, (b) vibration frequency and AoA map, and (c) vibration amplitude and AoA map (ξ, η, and θ denote vibration amplitude, vibration frequency, and AoA, respectively). (Note that ξ axis has logarithmic scale).
Remotesensing 15 03981 g003
Figure 4. Analysis on the effect of synthetic aperture length and monitoring time on the half-power (−3 dB) resolution of (a) vibration frequency (η), (b) vibration amplitude (ξ), (c) azimuth angle (θ), and (d) signal-to-noise ratio (SNR).
Remotesensing 15 03981 g004
Figure 5. Normalized detection error at different values of vibration frequencies and amplitudes: (a) vibration frequency error, (b) vibration amplitude error, and (c) SNR (Note that ξ axis has logarithmic scale).
Remotesensing 15 03981 g005
Figure 6. Real experiments for water pipeline monitoring: (a) study area, including a network of functioning (marked with blue circles) and not functioning (marked with red circles) pipes; (b) specified radar trajectory on a mechanical rail for signal transmission and SAR imaging.
Remotesensing 15 03981 g006
Figure 7. SAR image of the study area.
Remotesensing 15 03981 g007
Figure 8. Vibration frequency map: (a) GBSAR and (b) MIMO radar.
Remotesensing 15 03981 g008
Figure 9. Vibration frequency difference between GBSAR and MIMO radar.
Remotesensing 15 03981 g009
Figure 10. Normalized vibration frequency response power at 24–25 Hz.
Remotesensing 15 03981 g010
Figure 11. Vibration power spectrums of the detected scatterers compared with the MIMO radar measurements. (The number above each plot indicates the scatterer’s ID, and X and Y indicate the scatterer’s location on the SAR image in meters. For a larger scale of diagrams, the dashed boxes are shown in Figure 12).
Remotesensing 15 03981 g011
Figure 12. Some chosen PSDs from Figure 11 in a larger scale.
Remotesensing 15 03981 g012
Table 1. Parameters of the system used in this study.
NameValue
Radar modelTI-AWR1642BOOST
Signal typeLinear FMCW
System’s operating frequency 76–81 GHz
Carrier frequency (fc)77 GHz
Wavelength (λ)0.0039 m
Bandwidth (B)1.5 GHz
Range resolution 0.1 m
Range samples512
Sweep time 60 μs
Maximum length of SAR0.15 m
Maximum cross-range resolution 0.013 rad
SAR velocity0.005 m/s
Table 2. Specified parameters for numerical simulation of a point target.
ParameterValue
Signal SNR5 dB
SAR length0.04 m
Signal repetition time8 ms
Total acquisition duration8 s
Target’s locationr = 5 m
θ = 7 deg
Target’s vibrationξ = 0.51 mm
η = 24.2 deg
Disclaimer/Publisher’s Note: The statements, opinions and data contained in all publications are solely those of the individual author(s) and contributor(s) and not of MDPI and/or the editor(s). MDPI and/or the editor(s) disclaim responsibility for any injury to people or property resulting from any ideas, methods, instructions or products referred to in the content.

