
Monopulse Parameter Estimation for FDA-MIMO Radar under Mainlobe Deception Jamming
 ,
,
Abstract
:1. Introduction
- The equation of sum-difference monopulse ratio curves for FDA-MIMO radar target angle and range measurement are derived.
- A coarse target location method based on cumulative sampling analysis is proposed in the case that the mainlobe DFTJ completely overwhelms the true target.
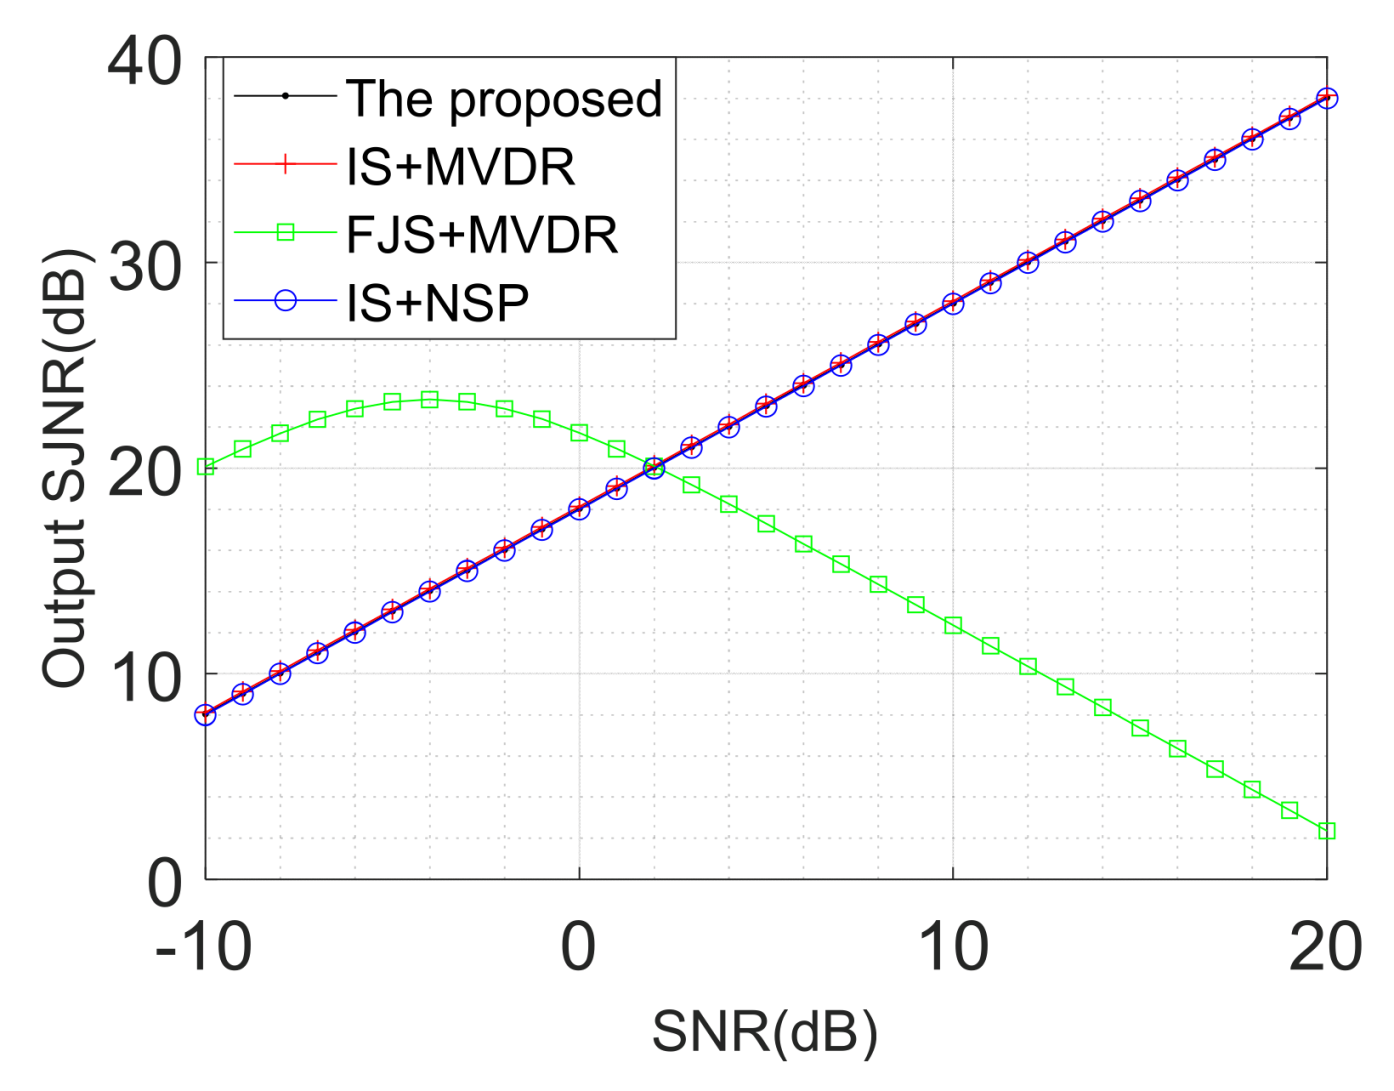
- A mainlobe jamming suppression method based on noise subspace projection (NSP) is proposed. And it has almost exactly the same performance with minimum variance distortionless response (MVDR) in output signal-to-jamming-plus-noise ratio (SJNR).
- The true target position in the time domain can be avoided in sampling to obtain jamming samples and the location performance is better than conventional methods, which is similar to ideal sampling.
2. FDA-MIMO Radar Signal Basic Model
3. Target Location Basic Principles of Sum-Difference Three Channels
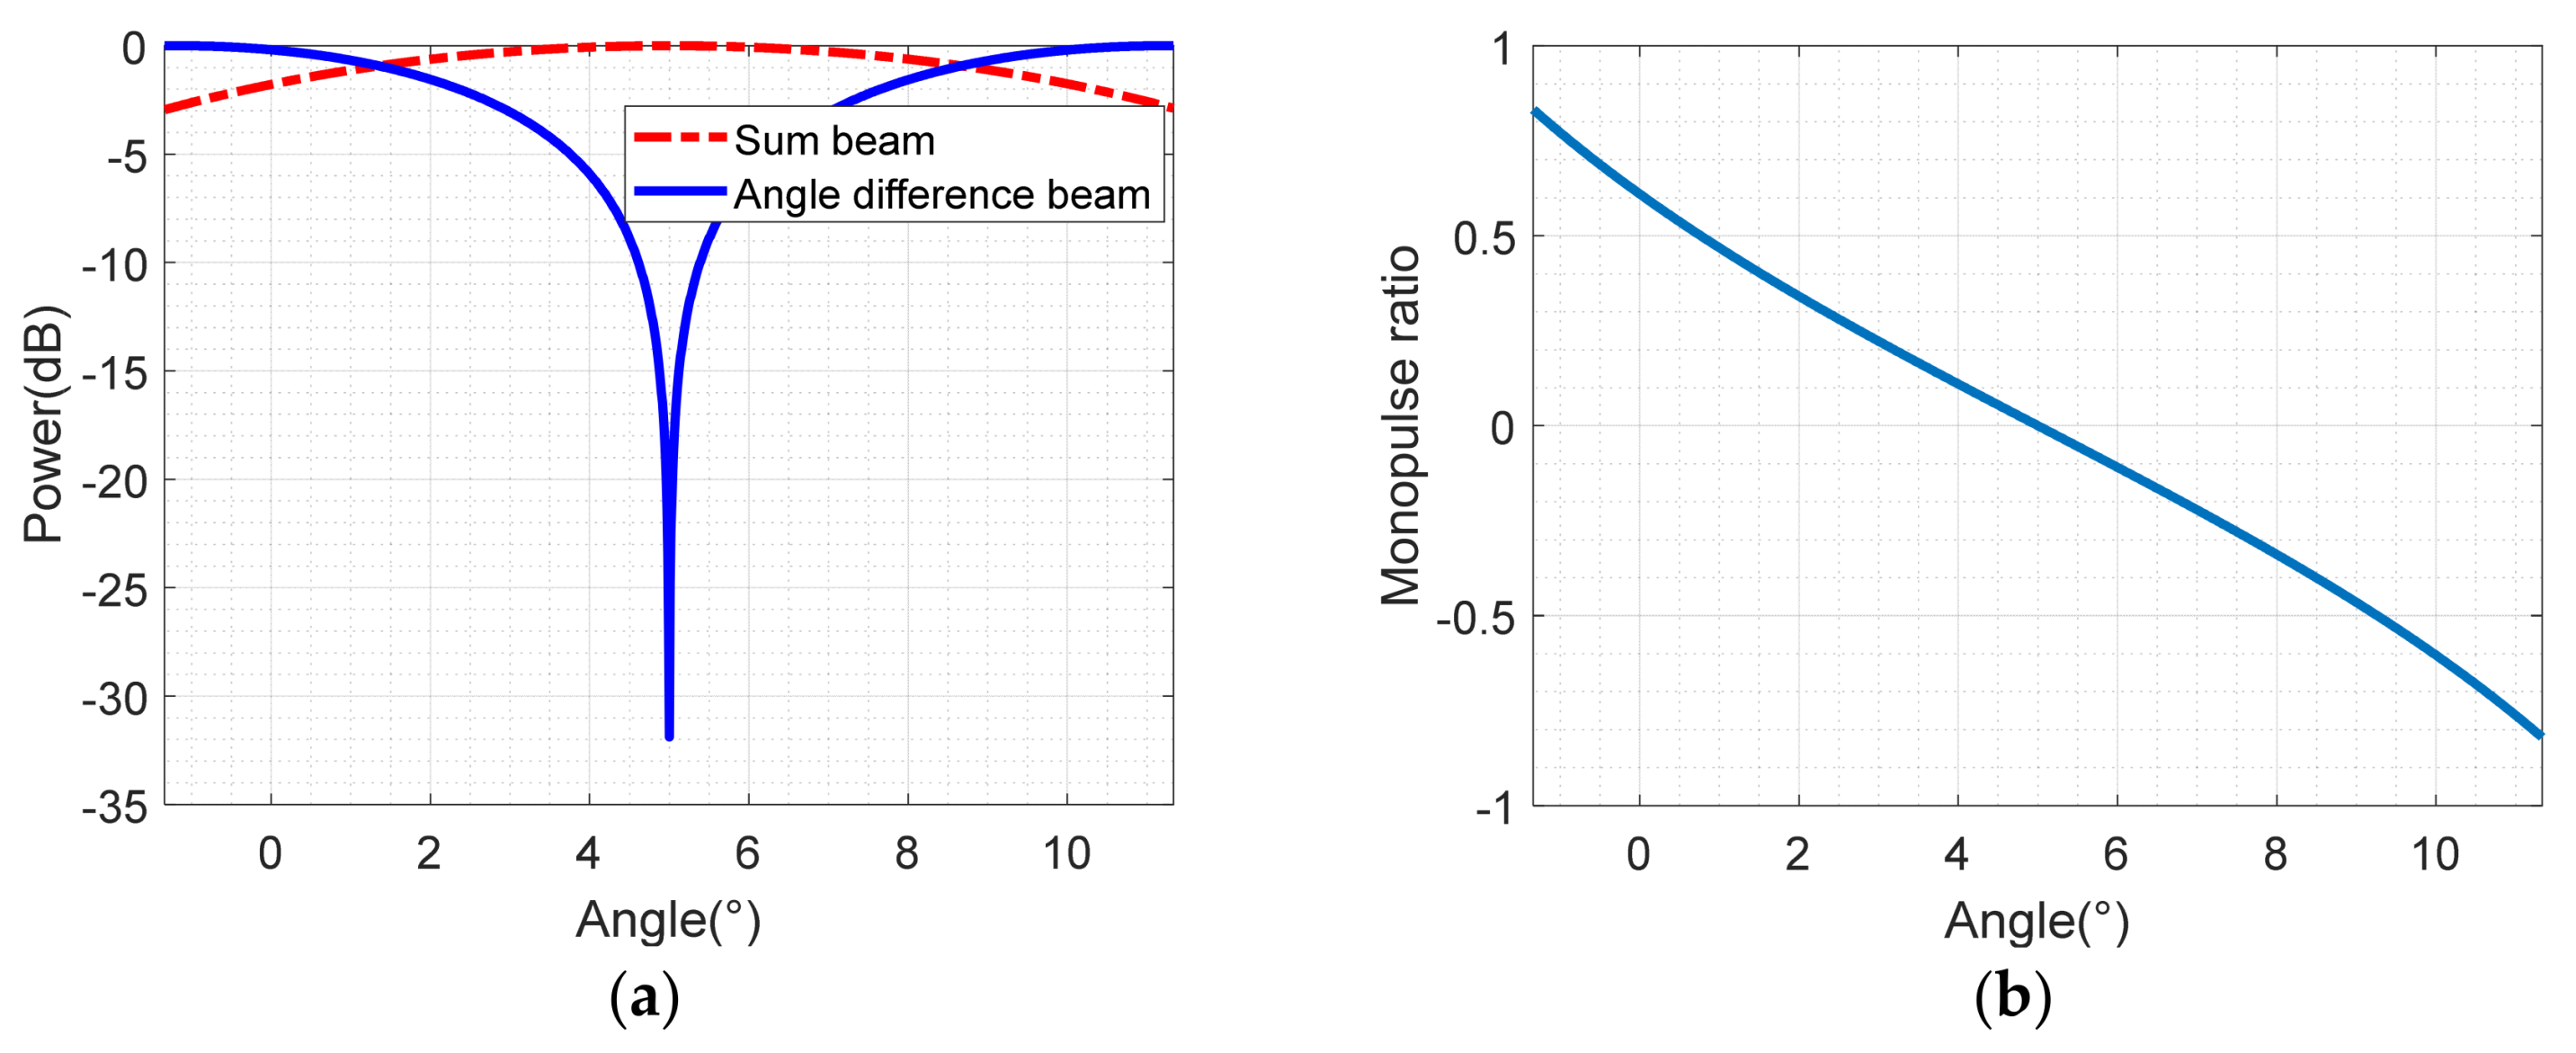
3.1. Basic Principles of Sum-Difference Beam Angle Measurement
3.2. Basic Principles of Sum-Difference Beam Range Measurement
4. A method of Mainlobe DFTJ Suppression and Target Sum-Difference Localization
4.1. Principle of Mainlobe DFTJ Suppression Based on NSP
4.2. Target Location Method Based on Sample Cumulative Sampling Analysis
- (1)
- All data received including the target are sampled and a covariance matrix is constructed. Feature decomposition is carried out and feature vectors are arranged in order from largest to smallest according to the feature values, as shown in Equation (33).
- (2)
- According to Equation (34), the position and correlation coefficient of the feature value corresponding to the feature vector with the strongest correlation with the expected target steering vector are obtained.
- (3)
- Set the sampling threshold and select the data higher than the threshold.
- (4)
- Set the threshold of whether the target is present or not and determine whether there is a target according to Equation (35). If there is no target, an adaptive weight vector can be obtained by sampling in the selected data.
- (5)
- According to Equation (37), the sampling data are obtained by the time cumulative sampling from near to far.
- (6)
- According to Equation (38), the sampling covariance matrix is constructed and the feature decomposition is carried out. The feature vectors are arranged in order from the largest to the smallest according to the feature values.
- (7)
- The sum of the correlation coefficients is calculated between the first feature vectors and the expected steering vector according to Equation (39).
- (8)
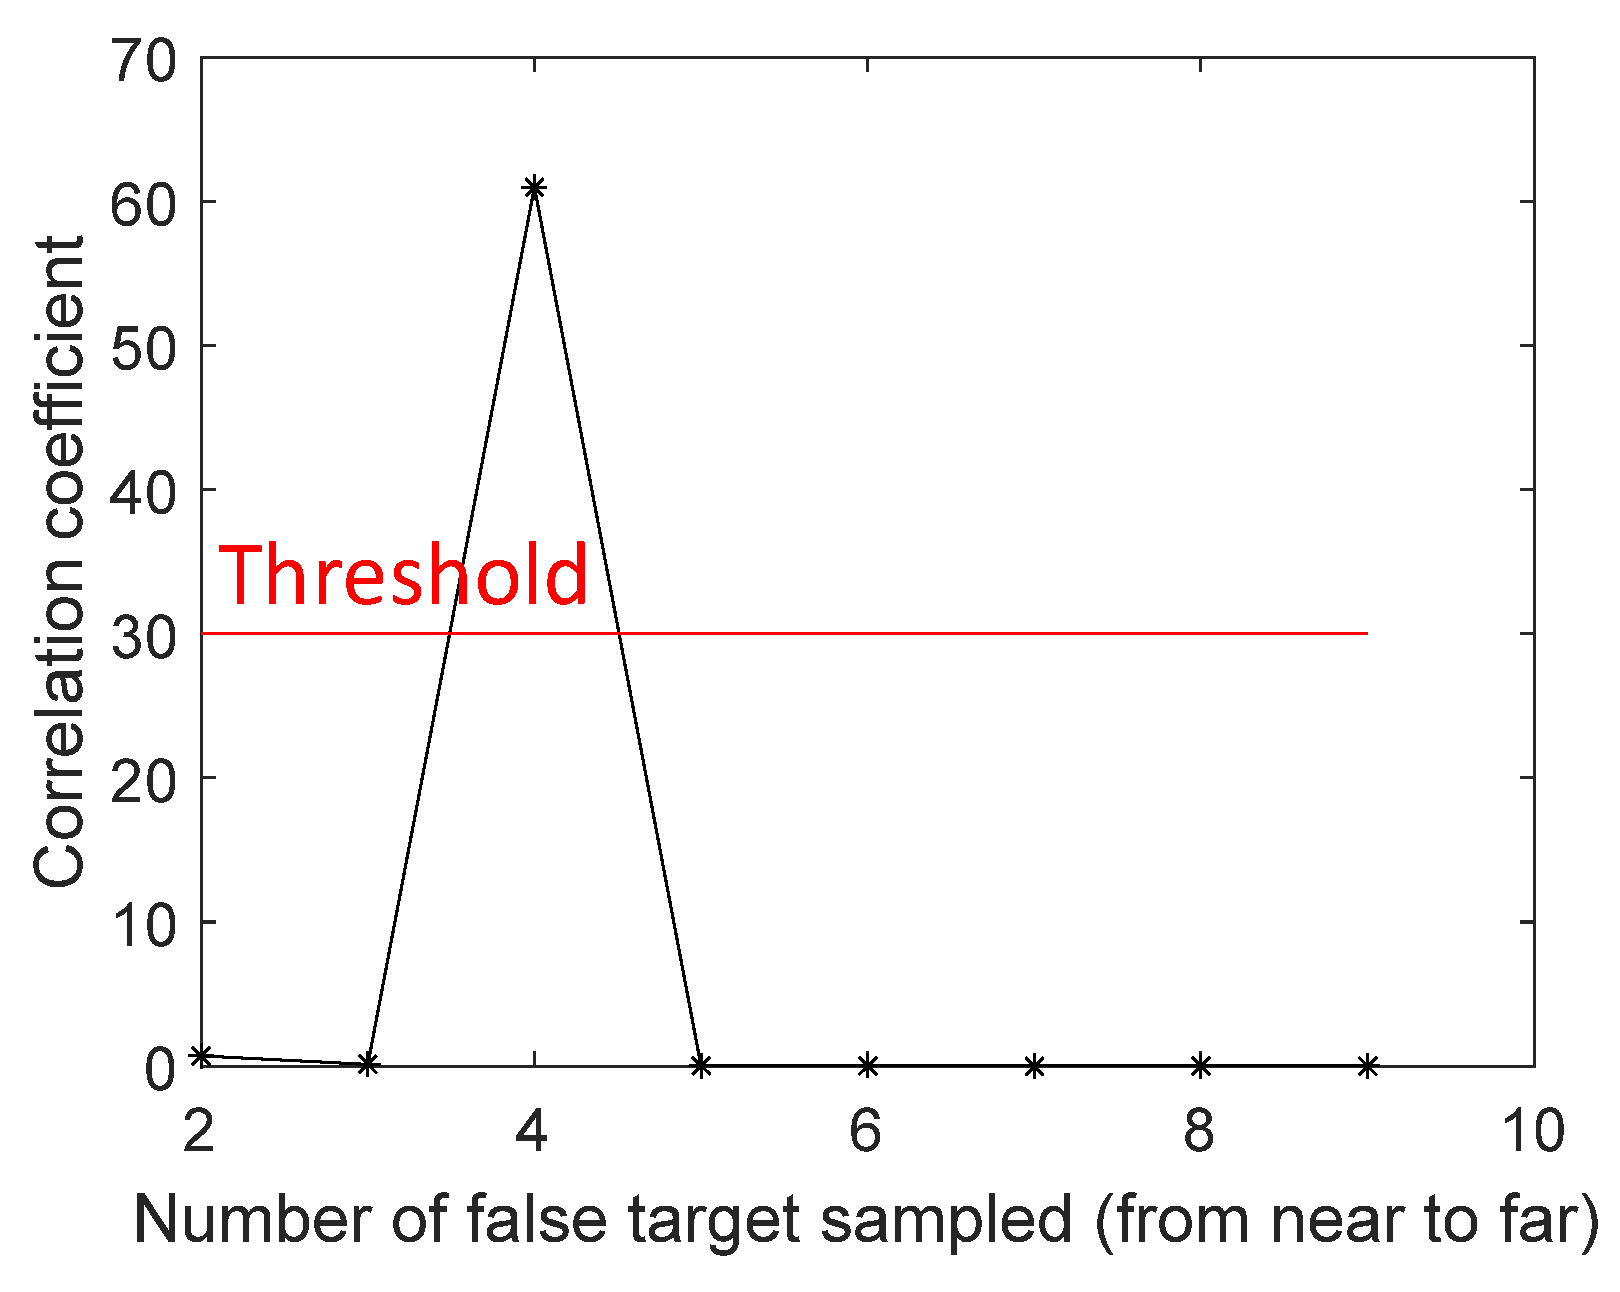
- The target position decision threshold is set to compare whether the difference of the correlation coefficients obtained by two adjacent samples meets Equation (40). If yes, the target can be roughly judged to be located on the range gate and data can be obtained by avoiding the range gate to sample in the selected data. If not, conduct the sampling and turn to step (5) until the cumulative sampling reaches all the data greater than the threshold .
- (9)
- If the cumulative sampling data in all do not satisfy Equation (40), it can be considered that the data higher than the threshold do not contain the target signal. When constructing the adaptive weight vector, data can be obtained by sampling in these data.
- (10)
- The covariance matrix is constructed from the sampled data in steps (3), (8), or (9). And the noise subspace is obtained by feature decomposition according to Equation (27).
- (11)
- Finally, according to Equations (41)–(43), the adaptive weights of the sum-difference three channels are obtained, respectively. Then, the angle and range of the target are estimated by comparing the angle and range ratio of the received data obtained by Equation (45) with the monopulse ratio curve obtained by Equation (44).
5. Simulation Results and Analysis
5.1. Simulation Analysis of Target Sum-Difference Location without Jamming
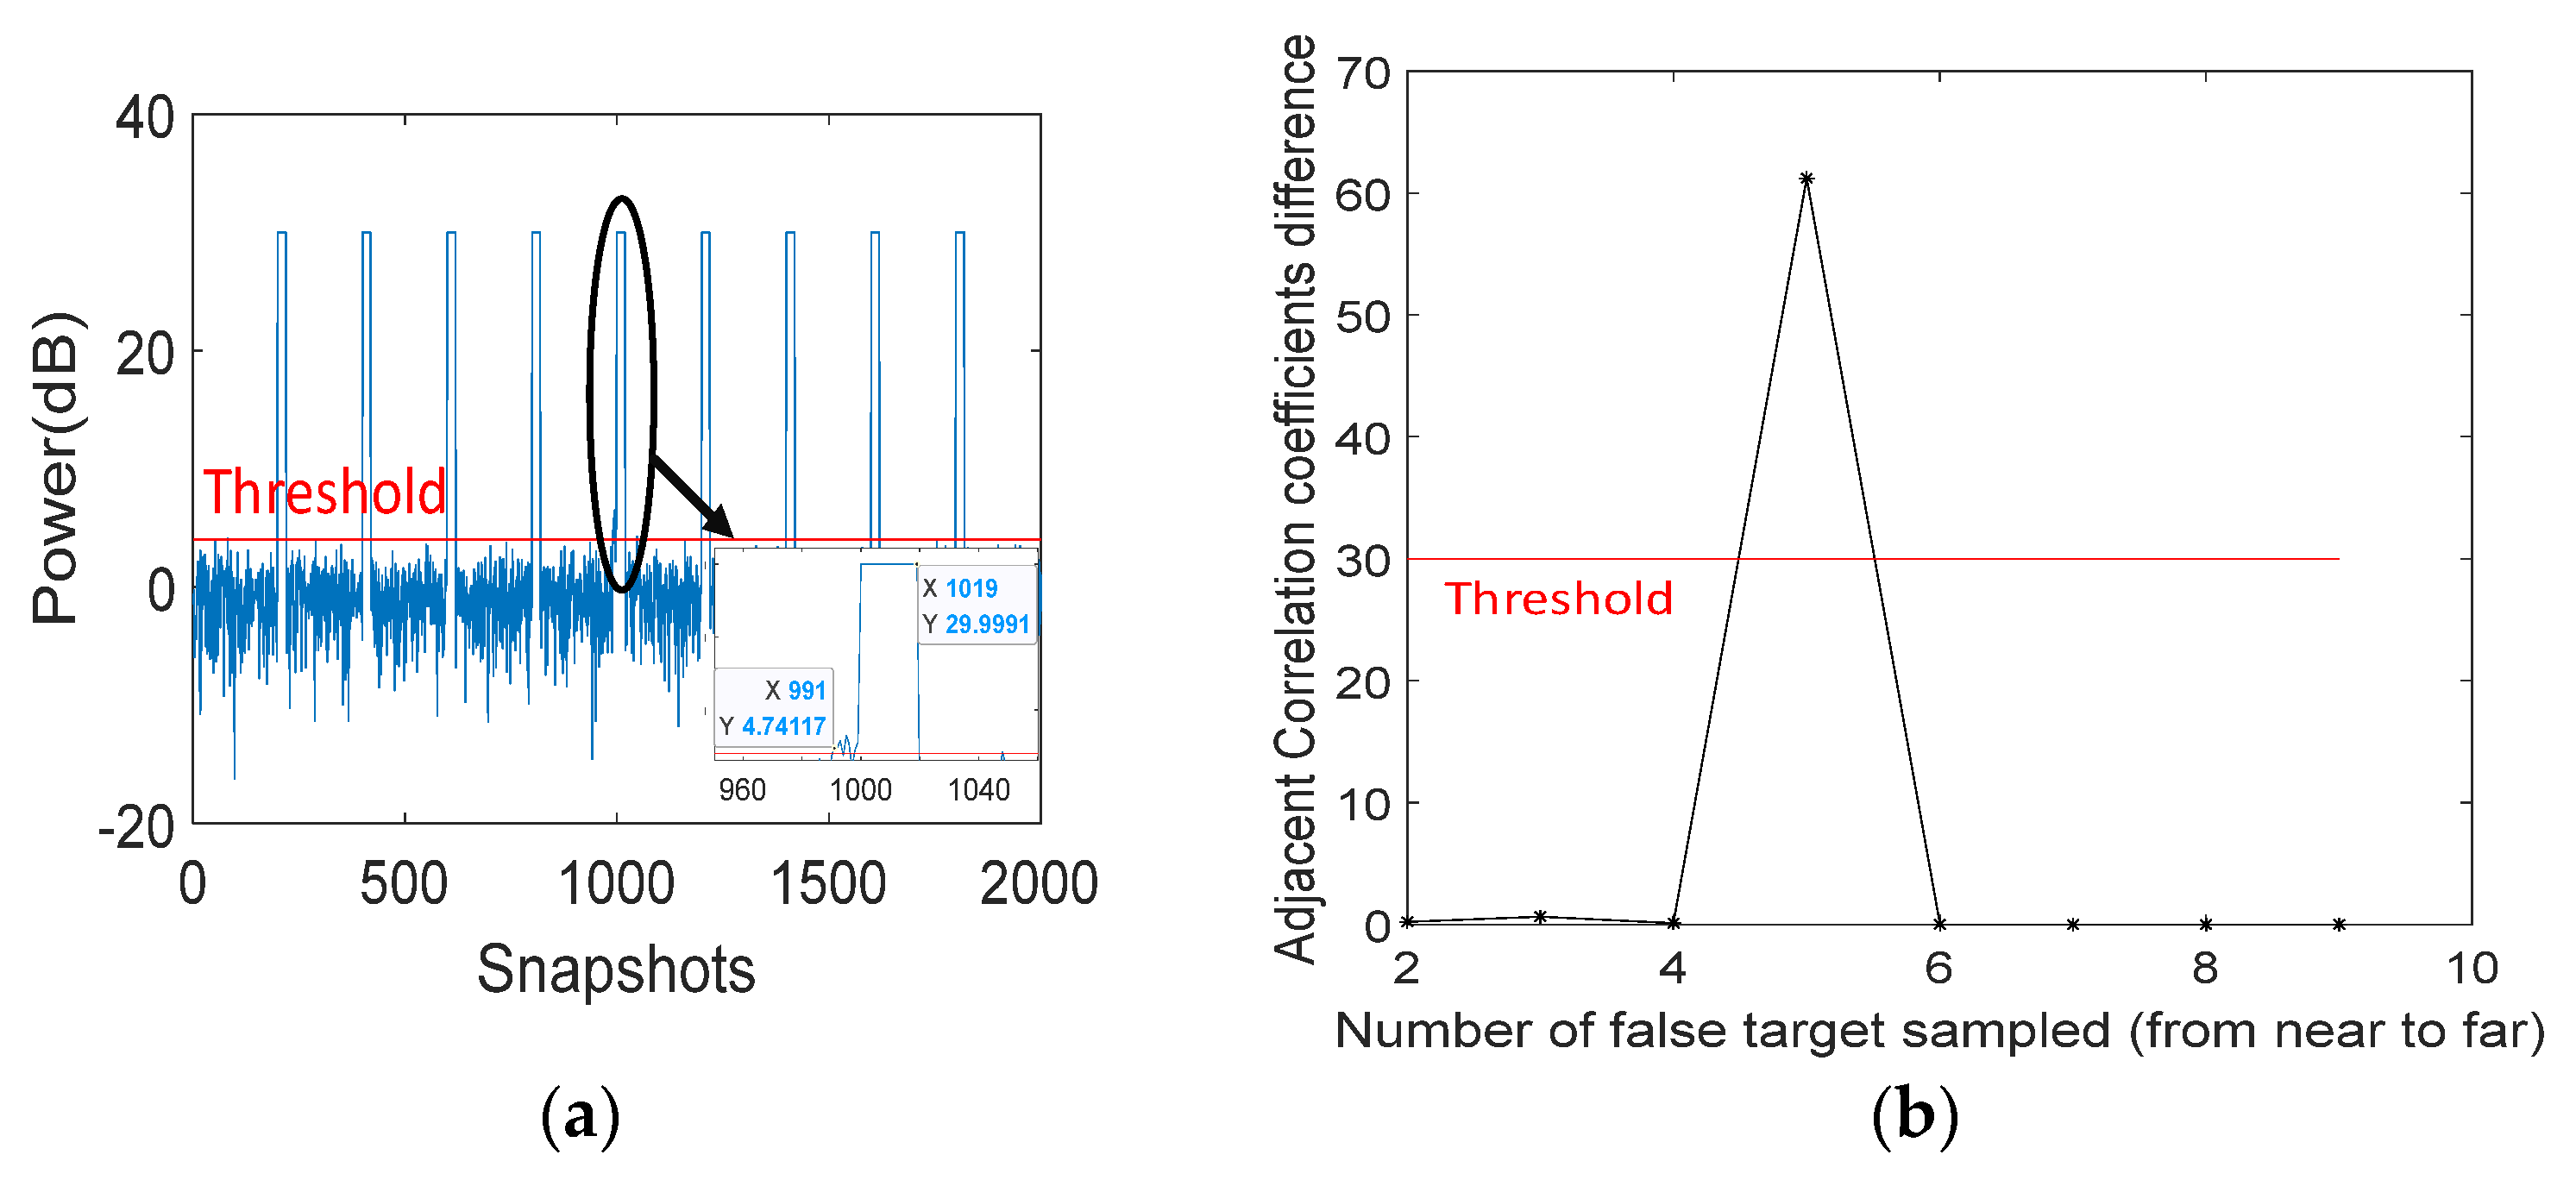
5.2. Simulation Analysis of Target Coarse Location in Time Domain Based on Cumulative Sampling
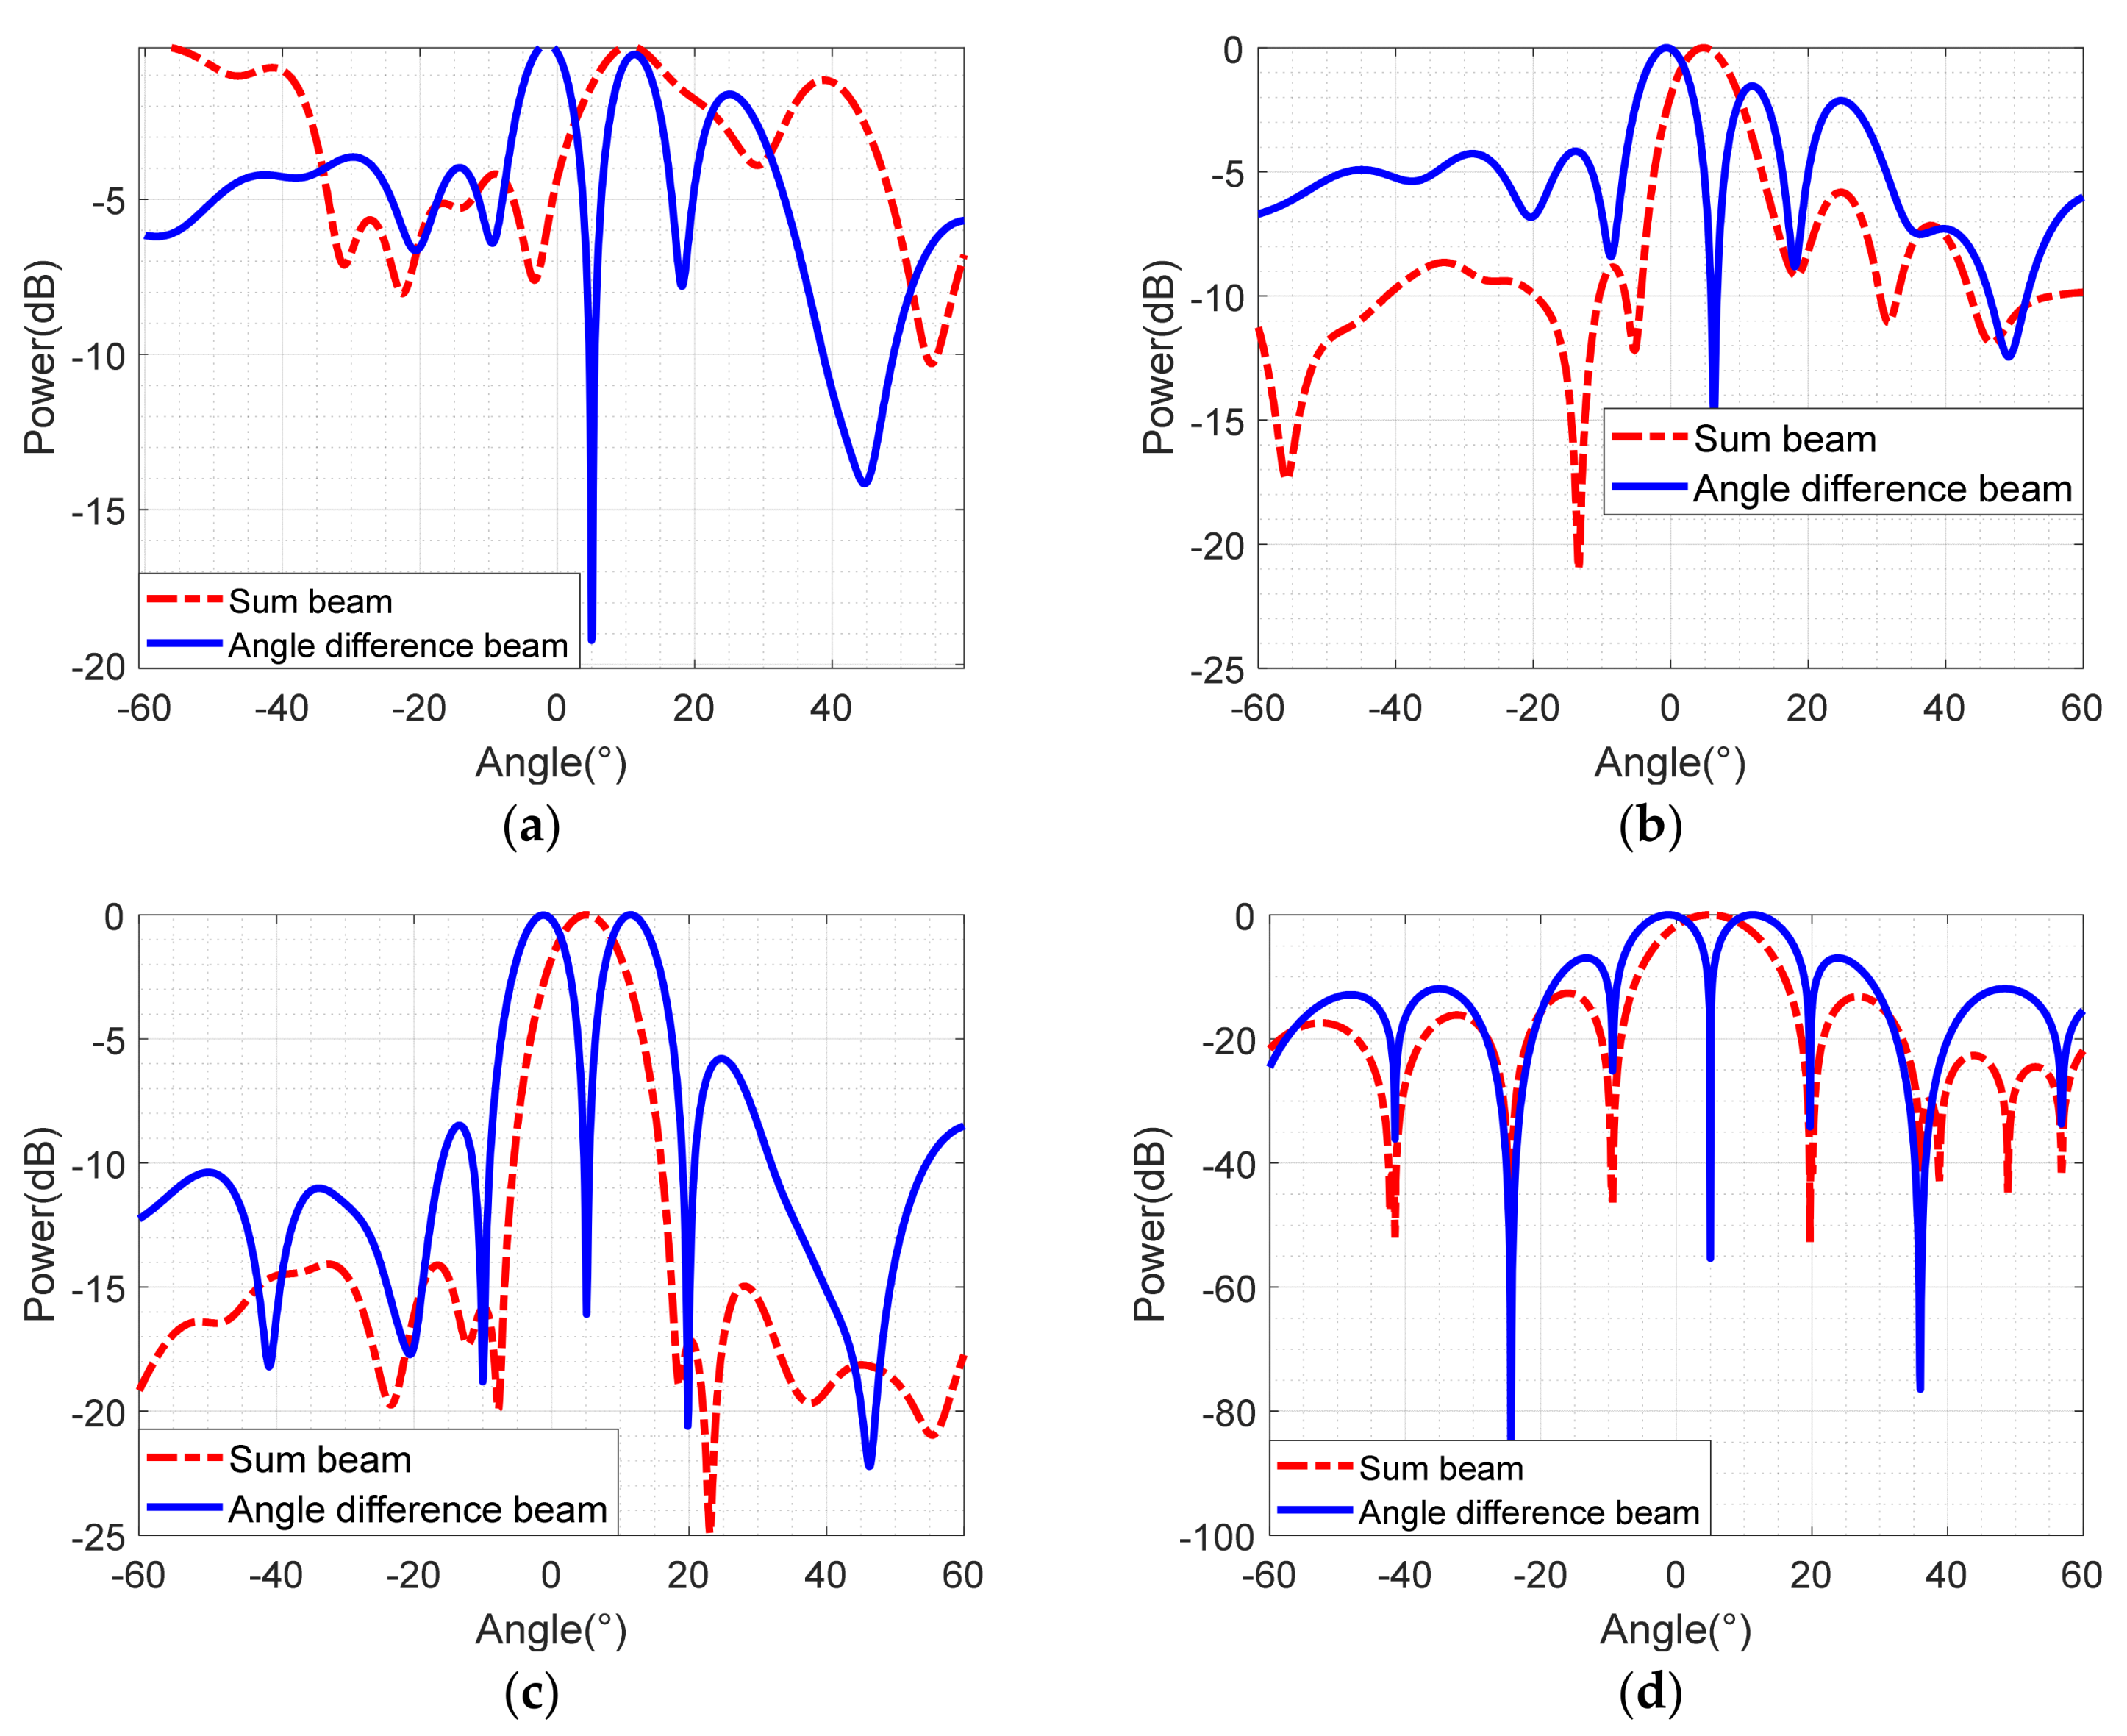
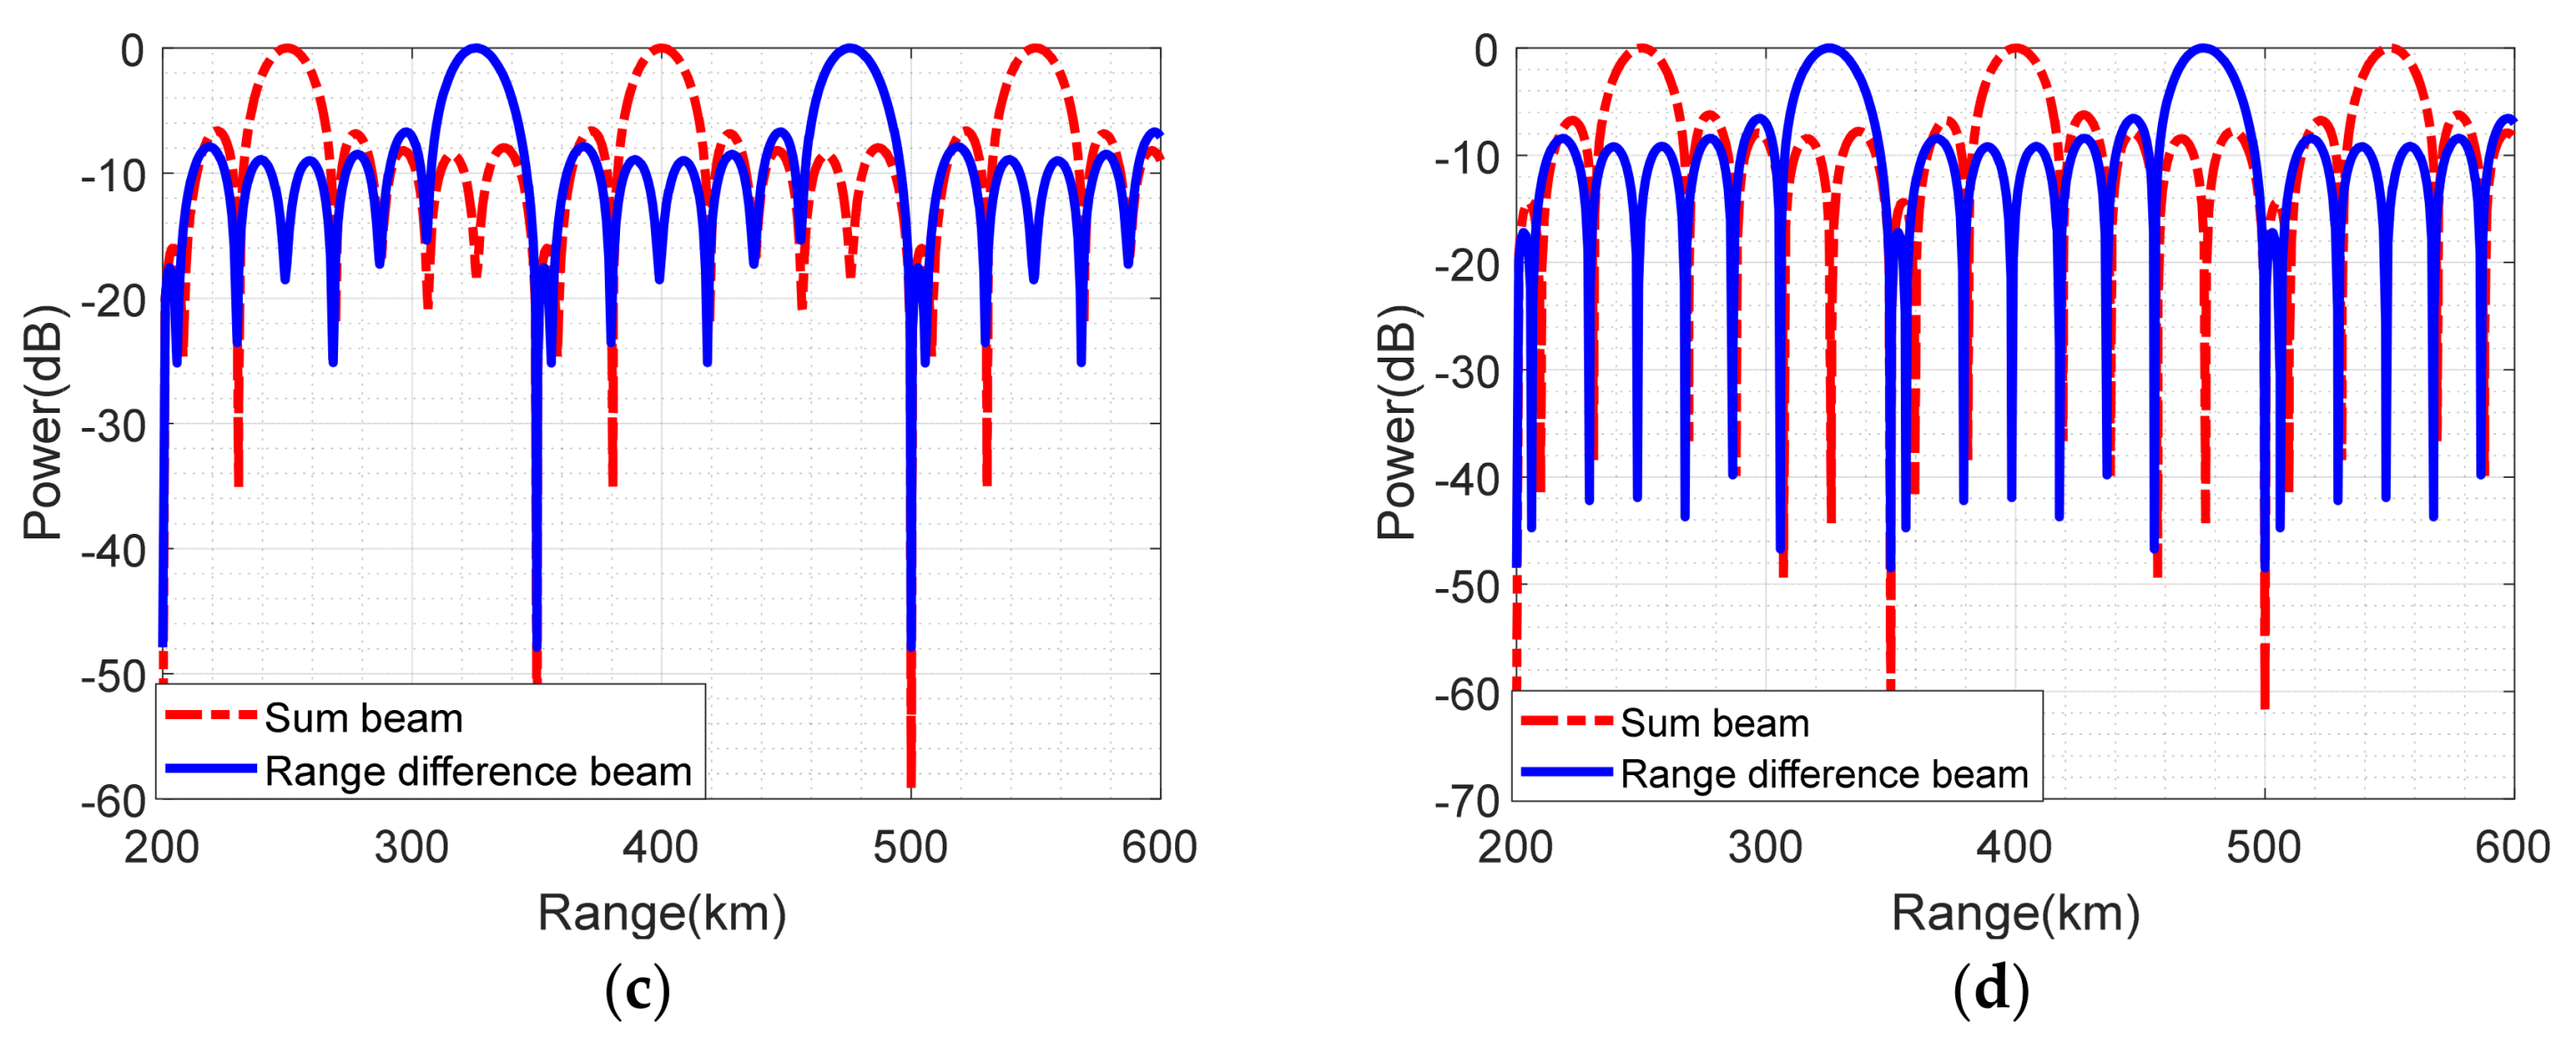
5.3. Simulation Analysis of Target Sum-Difference Location
5.3.1. Comparisons Jamming Suppression in the Time Domain
5.3.2. Comparisons of Sum-Difference Beam and Monopulse Ratio Curve
5.3.3. Comparisons of Output SJNR and Measurement Error
6. Discussions for Sample Cumulative Sampling Analysis
7. Conclusions
Author Contributions
Funding
Data Availability Statement
Conflicts of Interest
References
- Antonik, P.; Wicks, M.; Griffiths, H.; Baker, C. Frequency diverse array radars. In Proceedings of the IEEE Conference on Radar, Verona, NY, USA, 24–27 April 2006; pp. 215–217. [Google Scholar]
- Wang, Y.; Zhu, S.; Lan, L.; Li, X.; Liu, Z.; Wu, Z. Range-Ambiguous Clutter Suppression via FDA MIMO Planar Array Radar with Compressed Sensing. Remote Sens. 2022, 14, 1926. [Google Scholar] [CrossRef]
- Lou, M.; Yang, J.; Li, Z.; Ren, H.; An, H.; Wu, J. Joint Optimal and Adaptive 2-D Spatial Filtering Technique for FDA-MIMO SAR Deception Jamming Separation and Suppression. IEEE Trans. Geosci. Remote Sens. 2022, 60, 5238414. [Google Scholar] [CrossRef]
- Zhang, X.; Wang, W.; So, H. FDA-MIMO Radar Range Ambiguity Clutter Suppression Approach Based on Sparse Dimensionality Reduction STAP. In Proceedings of the IGARSS 2022–2022 IEEE International Geoscience and Remote Sensing Symposium, Kuala Lumpur, Malaysia, 17–22 July 2022; pp. 3003–3006. [Google Scholar] [CrossRef]
- Wang, L.; Wang, W.; So, H. Covariance Matrix Estimation for FDA-MIMO Adaptive Transmit Power Allocation. IEEE Trans. Signal Process. 2022, 70, 3386–3399. [Google Scholar] [CrossRef]
- Zhang, T.; Wang, Z.; Xing, M.; Zhang, S.; Wang, Y. Research on Multi-Domain Dimensionality Reduction Joint Adaptive Processing Method for Range Ambiguous Clutter of FDA-Phase-MIMO Space-Based Early Warning Radar. Remote Sens. 2022, 14, 5536. [Google Scholar] [CrossRef]
- Wang, W.; Zhang, S. Recent Advances in Frequency Diverse Array Radar Techniques. J. Radars 2022, 11, 830–849. [Google Scholar] [CrossRef]
- He, Z.; Cheng, Z.; Li, J.; Zhang, W.; Shi, J. A Survey of Collocated MIMO Radar. J. Radars 2022, 11, 805–829. [Google Scholar] [CrossRef]
- Chen, Y.; Tian, B.; Wang, C.; Zhao, Y. Progress and Prospect of FDA-MIMO Anti-Jamming Technology. Electron. Opt. Control. 2022, 29, 65–72. [Google Scholar]
- Zhang, X.; Wang, C.; Li, J.; WU, Q. Research Progress on Frequency Diversity Array Radar: From System Framework to Parameter Estimation. J. Appl. Sci. Electron. Inf. Eng. 2022, 40, 918–940. [Google Scholar] [CrossRef]
- Lan, L.; Liao, G.; Xu, J.; Zhang, Y. Main-beam range deceptive jamming suppression approach with FDA-MIMO radar. Syst. Eng. Electron. 2018, 40, 997–1003. [Google Scholar] [CrossRef]
- Chen, H.; Lv, M.; Ma, J.; Xia, B.; Liu, Y.; Zhou, M. Exponential FDA-MIMO radar mainlobe jamming suppression based on DL-EVE algorithm. In Proceedings of the 2021 CIE International Conference on Radar, Haikou, China, 15–19 December 2021. [Google Scholar] [CrossRef]
- Gao, X.; Quan, Y.; Li, Y.; Zhu, S.; Xing, M. Main-lobe deceptive jamming suppression with FDA-MIMO radar based on BSS. Syst. Eng. Electron. 2020, 42, 1927–1934. [Google Scholar]
- Zhang, Y.; Liao, G.; Xu, J.; Lan, L. Mainlobe Deceptive Jammer Suppression Based on Quadratic Phase Coding in FDA-MIMO Radar. Remote Sens. 2022, 14, 5831. [Google Scholar] [CrossRef]
- Zhao, Y.; Tian, B.; Wang, C.; Gong, J.; Tan, M.; Zhou, C. Space-time joint suppression method of main-beam SMSP jamming based on FDA-MIMO radar. Syst. Eng. Electron. 2022, 44, 2157–2165. [Google Scholar] [CrossRef]
- Fang, J.; Song, B.; Zhu, M. Anti-mainlobe SMSP Interference Based on Improved Blind Source Separation Algorithm. Mod. Radar 2023, 5, 8–15. [Google Scholar] [CrossRef]
- Xu, Y.; Wang, C.; Gong, J.; Zhao, Y.; Zhou, C. Anti Main Lobe Intermittent Sampling and Forwarding Jamming Method for FDA-MIMO Radar. Electron. Opt. Control. 2022. Available online: http://kns.cnki.net/kcms/detail/41.1227.TN.20221009.1315.002.html (accessed on 10 October 2022).
- Lan, L.; Liao, G.; Xu, J.; Zhu, S.; Zhang, Y. Range-angle-dependent beamforming for FDA-MIMO radar using oblique projection. Sci. China (Inf. Sci.) 2022, 65, 223–241. [Google Scholar] [CrossRef]
- Chen, G.; Wang, C.; Gong, J.; Tan, M.; Liu, Y. Data-Independent Phase-Only Beamforming of FDA-MIMO Radar for Swarm Interference Suppression. Remote Sens. 2023, 15, 1159. [Google Scholar] [CrossRef]
- Wan, P.; Weng, Y.; Xu, J.; Liao, G. Range Gate Pull-Off Mainlobe Jamming Suppression Approach with FDA-MIMO Radar: Theoretical Formalism and Numerical Study. Remote Sens. 2022, 14, 1499. [Google Scholar] [CrossRef]
- Wan, P.; Liao, G.; Xu, J.; Zheng, G. Two-Dimensional Transceiver Beamforming for Mainlobe Jamming Suppression with FDA-MIMO Radar. Math. Probl. Eng. 2022, 2022, 1265658. [Google Scholar] [CrossRef]
- Van, D.; Vanderveen, M.; Paulraj, A. Joint angle and delay estimation using shift-invariance techniques. IEEE Trans. Signal Process. 1997, 46, 405–418. [Google Scholar] [CrossRef] [Green Version]
- Lin, C.; Fang, H. Joint angle and delay estimation in frequency hopping systems. IEEE Trans. Aerosp. Electron. Syst. 2013, 49, 1042–1056. [Google Scholar] [CrossRef]
- Zhang, Z.; Liu, T.; Zeng, L.; Wang, Y. Research on estimation of two-dimensional parameters in frequency diverse array MIMO based on block sparse. J. Huazhong Univ. of Sci. Technol. (Nat. Sci. Ed.) 2021, 49, 58–63. [Google Scholar] [CrossRef]
- Xu, Y.; Shi, X.; Xu, J.; Li, P. Range-angle-dependent beamforming of pulsed frequency diverse array. IEEE Trans. Antennas Propag. 2015, 63, 3262–3267. [Google Scholar] [CrossRef]
- Xu, Y.; Shi, X.; Xu, J.; Huang, L.; Li, W. Range-angle-decoupled beampattern synthesis with subarraybased frequency diverse array. Digit. Signal Process. 2017, 64, 49–59. [Google Scholar] [CrossRef]
- Gao, K.; Wang, W.; Cai, J.; Jie, X. Decoupled frequency diverse array range-angle-dependent beampattern synthesis using non-linearly increasing frequency offsets. IET Microw. Antennas Propag. 2016, 10, 880–884. [Google Scholar] [CrossRef]
- Qin, S.; Zhang, Y.; Amin, M.; Gini, F. Frequency diverse coprime arrays with coprime frequency offsets for multitarget localization. IEEE J. Sel. Top. Signal Process. 2017, 11, 321–335. [Google Scholar] [CrossRef]
- Wang, W.; Shao, H. Range-angle localization of targets by a double-pulse frequency diverse array radar. IEEE J. Sel. Top. Signal Process. 2014, 8, 106–114. [Google Scholar] [CrossRef]
- Zhu, J.; Zhu, S.; Xu, J.; Lan, L.; He, X. Cooperative Range and Angle Estimation With PA and FDA Radars. IEEE Trans. Aerosp. Electron. Syst. 2022, 58, 907–921. [Google Scholar] [CrossRef]
- Guo, Y.; Wang, X.; Shi, J.; Sun, L.; Lan, X. Target Parameter Estimation Algorithm Based on Real-Valued HOSVD for Bistatic FDA-MIMO Radar. Remote Sens. 2023, 15, 1192. [Google Scholar] [CrossRef]
- Zheng, G.; Song, Y. Signal Model and Method for Joint Angle and Range Estimation of Low-Elevation Target in Meter-Wave FDA-MIMO Radar. IEEE Commun. Lett. 2022, 26, 449–453. [Google Scholar] [CrossRef]
- Xu, T.; Wang, X.; Huang, M.; Lan, X.; Sun, L. Tensor-Based Reduced-Dimension MUSIC Method for Parameter Estimation in Monostatic FDA-MIMO Radar. Remote Sens. 2021, 13, 3772. [Google Scholar] [CrossRef]
- Chen, Y.; Tian, B.; Wang, C.; Gong, J.; Tan, M.; Zhao, Y. FDA platform external interference suppression based on MVDR beamforming. Syst. Eng. Electron. 2023, 45, 32–40. [Google Scholar]
- Xu, J.; Liao, G.; Zhu, S.; So, H. Deceptive jamming suppression with frequency diverse MIMO radar. Signal Process. 2015, 113, 9–17. [Google Scholar] [CrossRef]


| Bandwidth | PRI | Snapshots | Size of Range Gate | ||||
|---|---|---|---|---|---|---|---|
| 8 | 3 GHz | 1 kHz | 75 kHz | 20 kHz | 2000 | 1 km |
| Target Location | SNR | Target Range Gate Location | Jammer Location | Number of Jamming | Jamming Range Gates Location | JNR |
|---|---|---|---|---|---|---|
| 5 dB | 80th | 9 | 20th 40th 60th 80th 100th 120th 140th 160th 180th | All are 30 dB |
Disclaimer/Publisher’s Note: The statements, opinions and data contained in all publications are solely those of the individual author(s) and contributor(s) and not of MDPI and/or the editor(s). MDPI and/or the editor(s) disclaim responsibility for any injury to people or property resulting from any ideas, methods, instructions or products referred to in the content. |
© 2023 by the authors. Licensee MDPI, Basel, Switzerland. This article is an open access article distributed under the terms and conditions of the Creative Commons Attribution (CC BY) license (https://creativecommons.org/licenses/by/4.0/).
Share and Cite
Chen, H.; Li, R.; Chen, H.; Qu, Q.; Zhou, B.; Li, B.; Wang, Y. Monopulse Parameter Estimation for FDA-MIMO Radar under Mainlobe Deception Jamming. Remote Sens. 2023, 15, 3947. https://doi.org/10.3390/rs15163947
Chen H, Li R, Chen H, Qu Q, Zhou B, Li B, Wang Y. Monopulse Parameter Estimation for FDA-MIMO Radar under Mainlobe Deception Jamming. Remote Sensing. 2023; 15(16):3947. https://doi.org/10.3390/rs15163947
Chicago/Turabian StyleChen, Hao, Rongfeng Li, Hui Chen, Qizhe Qu, Bilei Zhou, Binbin Li, and Yongliang Wang. 2023. "Monopulse Parameter Estimation for FDA-MIMO Radar under Mainlobe Deception Jamming" Remote Sensing 15, no. 16: 3947. https://doi.org/10.3390/rs15163947