Article

Machine Learning (ML)-Based Copper Mineralization Prospectivity Mapping (MPM) Using Mining Geochemistry Method and Remote Sensing Satellite Data

1
Faculty of Mining, Petroleum and Geophysics Engineering, Shahrood University of Technology, Shahrood 3619995161, Iran
2
School of Earth Sciences & Engineering, Tomsk Polytechnic University, 634050 Tomsk, Russia
3
Institute of Oceanography and Environment (INOS), Universiti Malaysia Terengganu (UMT), Kuala Nerus 21030, Terengganu, Malaysia
*
Author to whom correspondence should be addressed.
Remote Sens. 2023, 15(15), 3708; https://doi.org/10.3390/rs15153708
Submission received: 13 June 2023 / Revised: 20 July 2023 / Accepted: 23 July 2023 / Published: 25 July 2023

Abstract

:
The exploration of buried mineral deposits is required to generate innovative approaches and the integration of multi-source geoscientific datasets. Mining geochemistry methods have been generated based on the theory of multi-formational geochemical dispersion haloes. Satellite remote sensing data is a form of surficial geoscience datasets and can be considered as big data in terms of veracity and volume. The different alteration zones extracted using remote sensing methods have not been yet categorized based on the mineralogical and geochemical types (MGT) of anomalies and cannot discriminate blind mineralization (BM) from zone dispersed mineralization (ZDM). In this research, an innovative approach was developed to optimize remote sensing-based evidential variables using some constructed mining geochemistry models for a machine learning (ML)-based copper prospectivity mapping. Accordingly, several main steps were implemented and analyzed. Initially, the MGT model was executed by studying the distribution of indicator elements of lithogeochemical data extracted from 50 copper deposits from Commonwealth of Independent States (CIS) countries to identify the MGT of geochemical anomalies associated with copper mineralization. Then, the geochemical zonality model was constructed using the database of the porphyry copper deposits of Iran and Kazakhstan to evaluate the geochemical anomalies related to porphyry copper mineralization (e.g., the Saghari deposit located around the Chah-Musa deposit, Toroud-Chah Shirin belt, central north Iran). Subsequently, the results of mining geochemistry models were used to produce the geochemical evidential variable by vertical geochemical zonality (Vz) (Pb × Zn/Cu × Mo) and to optimize the remote sensing-based evidential variables. Finally, a random forest algorithm was applied to integrate the evidential variables for generating a provincial-scale prospectivity mapping of porphyry copper deposits in the Toroud-Chah Shirin belt. The results of this investigation substantiated that the machine learning (ML)-based integration of multi-source geoscientific datasets, such as mining geochemistry techniques and satellite remote sensing data, is an innovative and applicable approach for copper mineralization prospectivity mapping in metallogenic provinces.

1. Introduction

Numerous well-known mineral deposits are undergoing long-term mining and exploitation along with shallow ore resources have been gradually exhausted around the world; therefore, the exploration of covered and buried mineral deposits is required to generate innovative approaches. Appreciating the comprehensive assessment of deep ore resources effectively, economically, and rapidly has become the frontier field of mineral exploration research. Mining geochemistry is one of the most essential disciplines characteristically fulfilled for exploration of deep and concealed mineralization [1,2,3,4,5,6,7,8,9,10,11,12,13,14,15,16,17,18,19,20,21,22,23]. The key purpose of mining geochemistry is to propose an approach for differentiating blind mineralization (BM), outcropping, and zone dispersed mineralization (ZDM) [1,4,10,15,17,18,20]. Many mining geochemistry methods have not been practiced for mineral prospectivity mapping (MPM) using geographic information systems (GIS) [22,24]. These techniques could be divided into three classes, namely mineralogical and geochemical type (MGT), geochemical zonality, and metallometry.
In the last decades, numerous approaches have been efficaciously executed to sort geochemical data responsive for MPM, e.g., [22,24,25,26,27,28,29,30]. Recognition of anomalies associated with ore mineralization and the integration of multi-source geoscientific data is necessary for MPM. The main emphasis has been placed upon big data analytics designed to recognize and incorporate anomalies linked to multi-mineralogical and geochemical types (MGTs) of mineralization, e.g., [10,15,31,32,33]. Incidentally, innovative mathematical models for the delimitation and interpretation of the multi-MGT anomalies have been recommended and implemented, e.g., [34,35,36,37,38,39,40].
The main applications of remote sensing satellite data in MPM are to provide detailed information for identifying hydrothermal alteration zones, detecting geological structures, and distinguishing lithological units. During the previous decades, the extraction of hydrothermal alterations was considered one of the most essential implementations of remote sensing data for provincial mineral exploration campaigns e.g., [41,42,43,44,45,46,47,48]. Discrimination of different alteration zones is a qualitative method to evaluate shallow ore resources. These different alteration zones have not been categorized (considered) based on the MGT of anomalies for MPM and cannot differentiate blind mineralization (BM) from zone dispersed mineralization (ZDM). The MGT and geochemical zonality models are able to recognize the hydrothermal alteration areas related to ore mineralization and to evaluate deep and buried ore resources. Metallometry provides a quantitative connection among point source soil and stream sediment anomalies to improve anomaly detection. This relation is allied with the concept of productivity (area × concentration) and is not governed by concentrations. Monotonous computation of regional data has not been an easy task, but with the advent of GIS, it has been easily premeditated. Thus, metallometric techniques are developed to map geochemical anomalies associated with deposits [49,50]. There are various methods for GIS-based MPM, and different relevant evidential layers are integrated. Ziaii et al. [24] used two sets of evidential layers to relate the presentation of geochemical anomalies of a pathfinder element (e.g., Cu) and Vz in MPM, and demonstrated that Vz in MPM outperforms Cu in MPM. Thus, using the multiplicative supra-ore (Pb × Zn) and sub-ore elements (Cu × Mo) (instead of the single elements), the limitations of using traditional interpolation methods, such as Kriging, on the data [30] were fundamentally solved.
Machine learning (ML) algorithms, such random forest (RF) have great capability for data integration and MPM. Rodriguez-Galiano et al. [51] compared the performances of MLAs, such as artificial neural networks, regression trees, RF, and support vector machines in MPM. The results indicated that the RF overtook the former MLA algorithms and revealed advanced steadiness and vigor with erratic training parameters. Carranza and Laborte [52] investigated the susceptivity of the RF to diverse sets of training data and the performance of RF compared to data-driven methods of MPM. They concluded that RF precisely considers the spatial correlations among the predictor variables and the training deposit and non-deposit locations, and RF is more beneficial than other methods. Carranza and Laborte [53,54] used RF for MPM with a small number of prospects and data with missing values. They realized that RF overtook WofE where a small number of prospects are known. Moreover, RF can control missing values in evidential data through an RF-based attribution method. It is not a black-box technique, unlike artificial neural networks. Zhang et al. [55] tested the capabilities of RF for MPM. They selected several evidential maps allied with Au mineralization, including singularity indices, principal component scores, and distance to intrusions and faults as inputs to the model. Then, they used RF to rank the significance and to recognize the susceptivity of the evidential maps generated based on their spatial correlations to the documented gold mineralization. The results demonstrate that RF could be utilized successfully for MPM in areas with some identified mineral occurrences. Wang et al. [56] used recursive feature elimination and RF to select indicator elements and map geochemical anomalies associated with Cu and W mineralization in a regional scale. Zhang et al. [57] interpreted RF modeling using the variable importance and partial dependence plot and also examined the effectiveness of outlier-based training samples in contrast to using known mineralized locations. They concluded that the MPM resulting from an RF built on outlier-based training set was substandard to those produced by an RF constructed on mineralized location-based training sets, which discloses the prejudice concerning documented mineralized sites in training a data-driven MPM algorithm.
The NE-trending Toroud-Chah Shirin (TCS) belt is placed in the Alborz magmatic belt in the north of Iran [58,59,60,61] (Figure 1). A few studies were conducted in the TCS belt and most of the acquired information is only related to depths of less than 100 m [59,60,61,62,63,64]. Exploration for new deep, concealed, and economic ore resources (mineral deposits) in the TCS belt is challenging owing to the insufficiency of comprehensive geological datasets and arid and mountainous geochemical landscapes [15,35,65,66,67]. In this research, a novel approach was established to optimize remote sensing-based evidential variables using constructed mining geochemistry models for a machine learning (ML)-based copper mineralization prospectivity mapping (MPM). The mining geochemistry methods and satellite remote sensing data processing was examined to select the optimal evidential variables for constructing MPM using the RF technique. Based on the lithogeochemical data extracted from the copper deposits of Commonwealth of Independent States (CIS) countries, the quantitative MGT model was constructed and used to identify the MGT of lithogeochemical anomalies of the Saghari deposit around the Chah-Musa copper deposit in the TCS belt (Figure 1). Subsequently, the alteration zones and geochemical zonality coefficient related to the identified MGT were selected. According to the database of copper deposits in Kazakhstan and Iran, the quantitative zonality model was constructed to assess the lithogeochemical anomalies of the Saghari deposit. Finally, the set of evidential variables, including lithology, structure, alteration and geochemical zonality, and deposit/non-deposit locations were integrated using RF for MPM in the TCS belt.

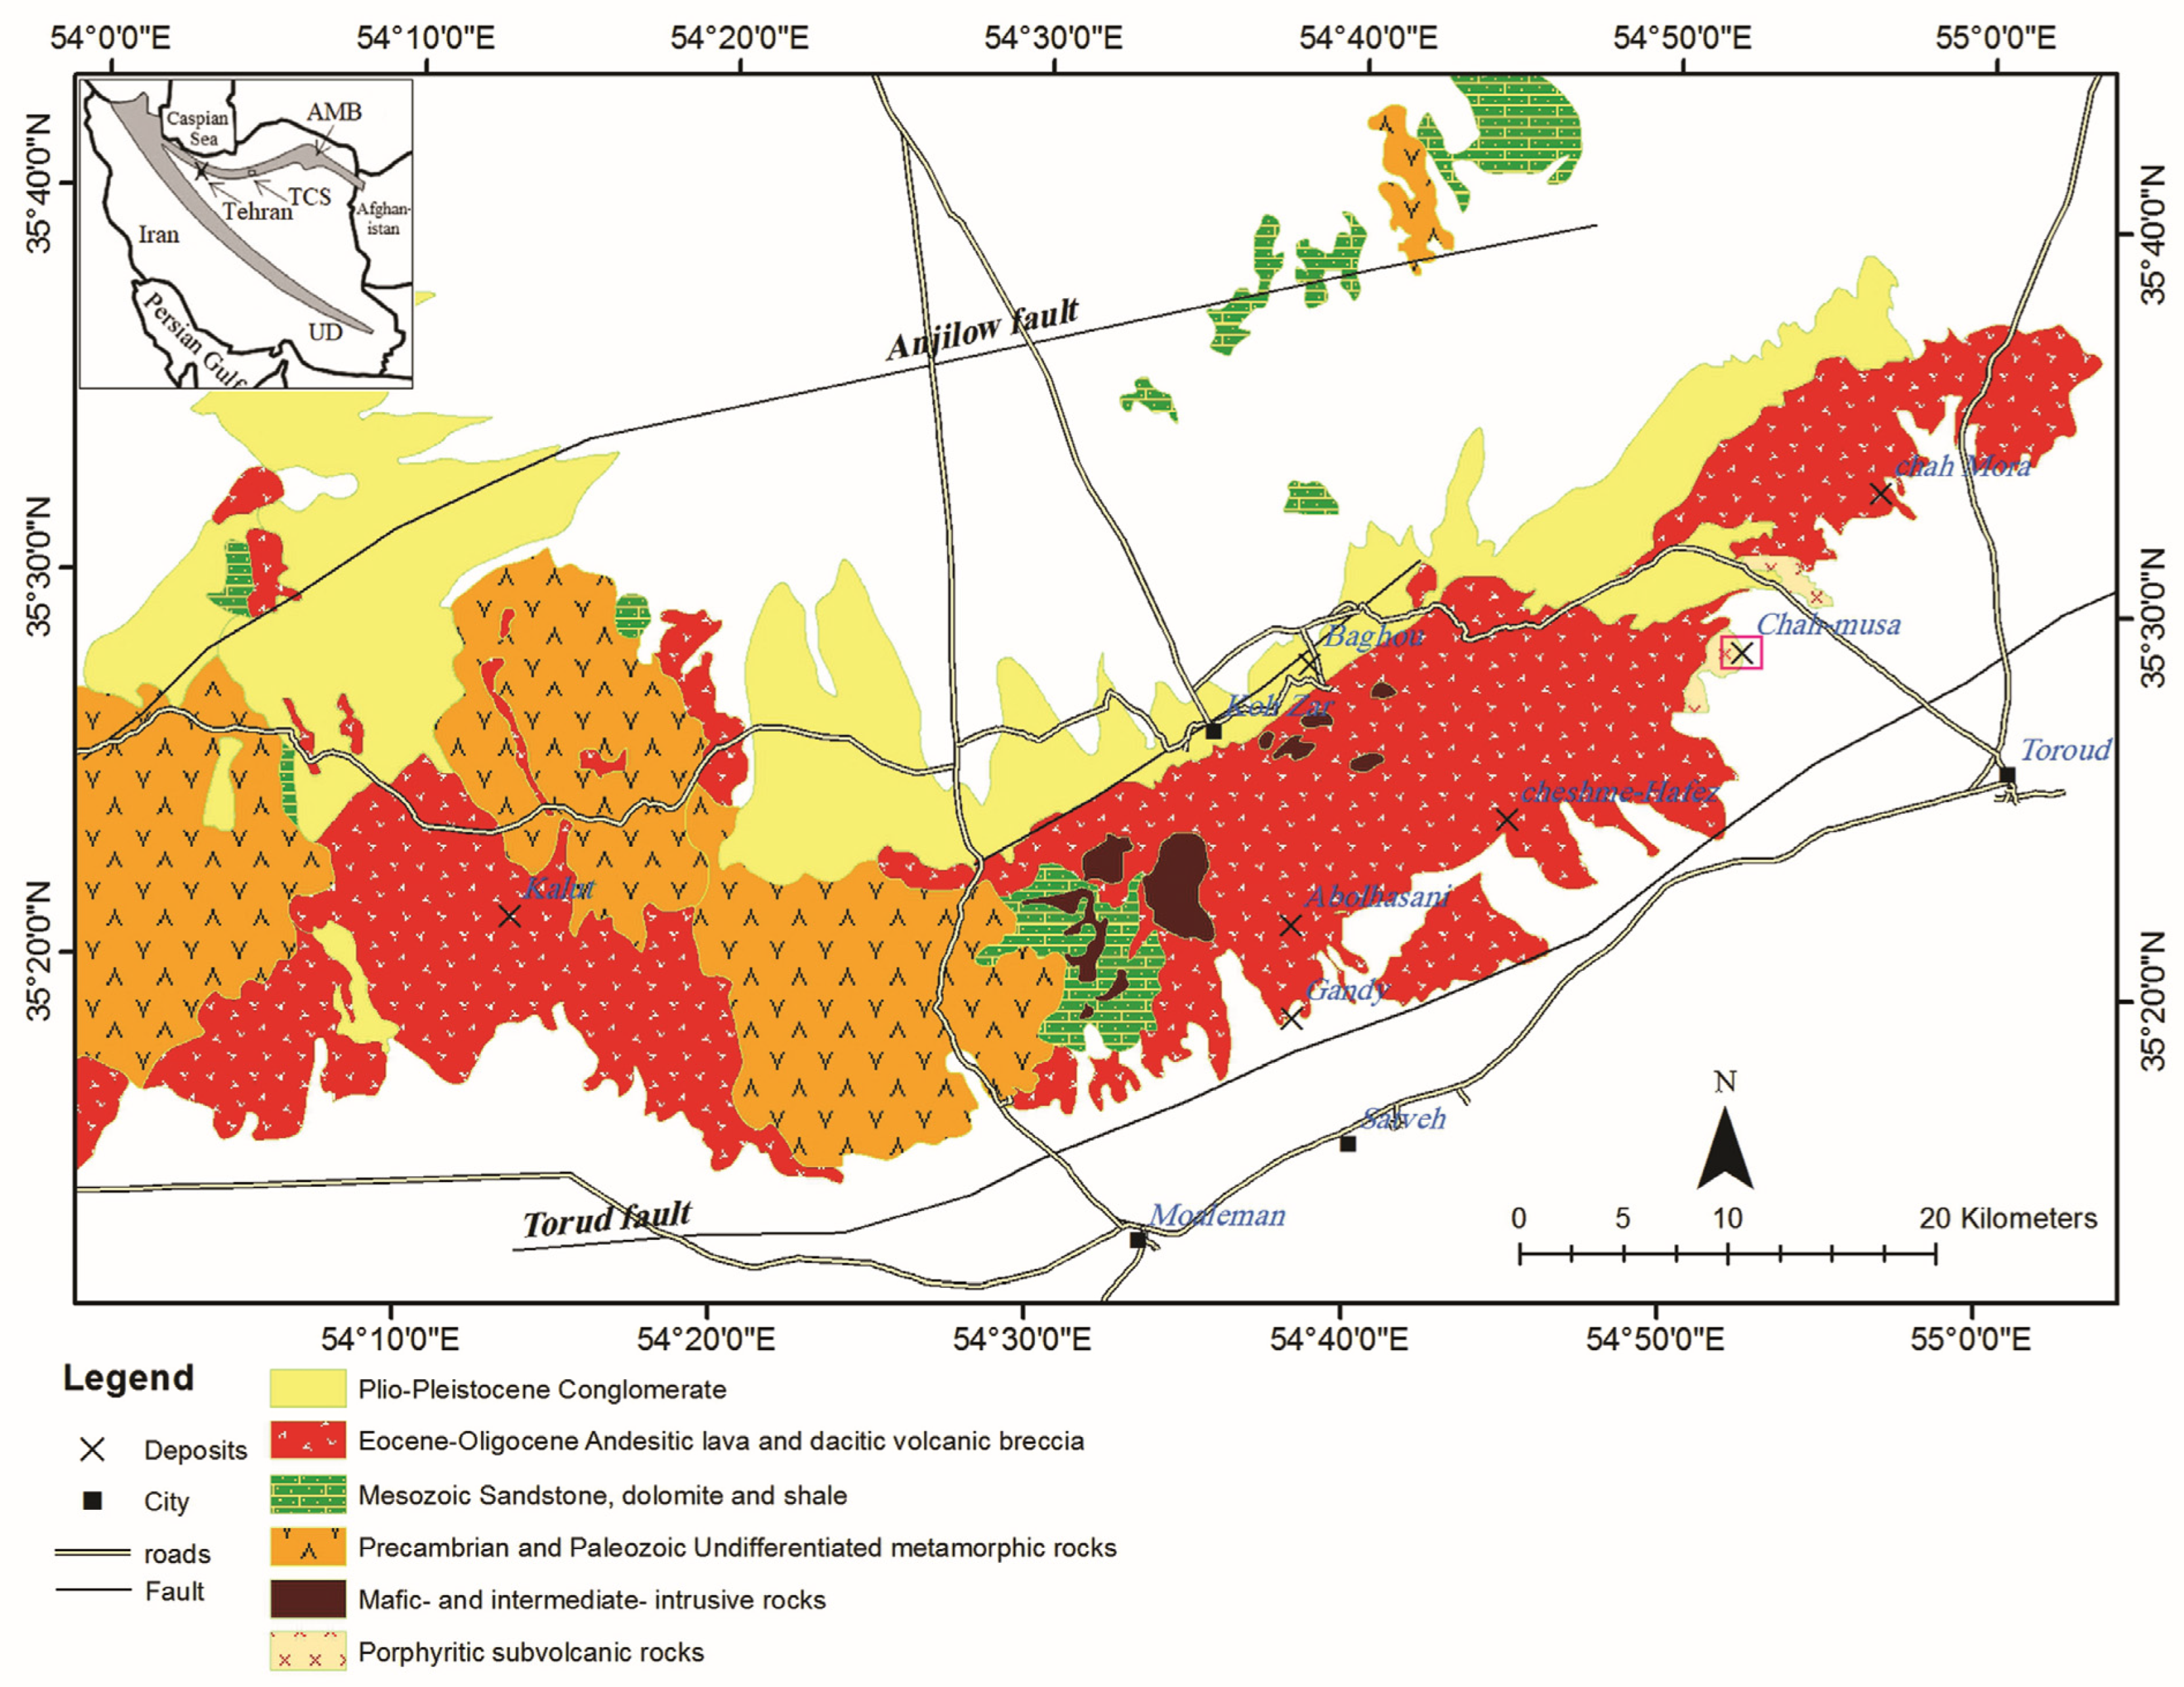
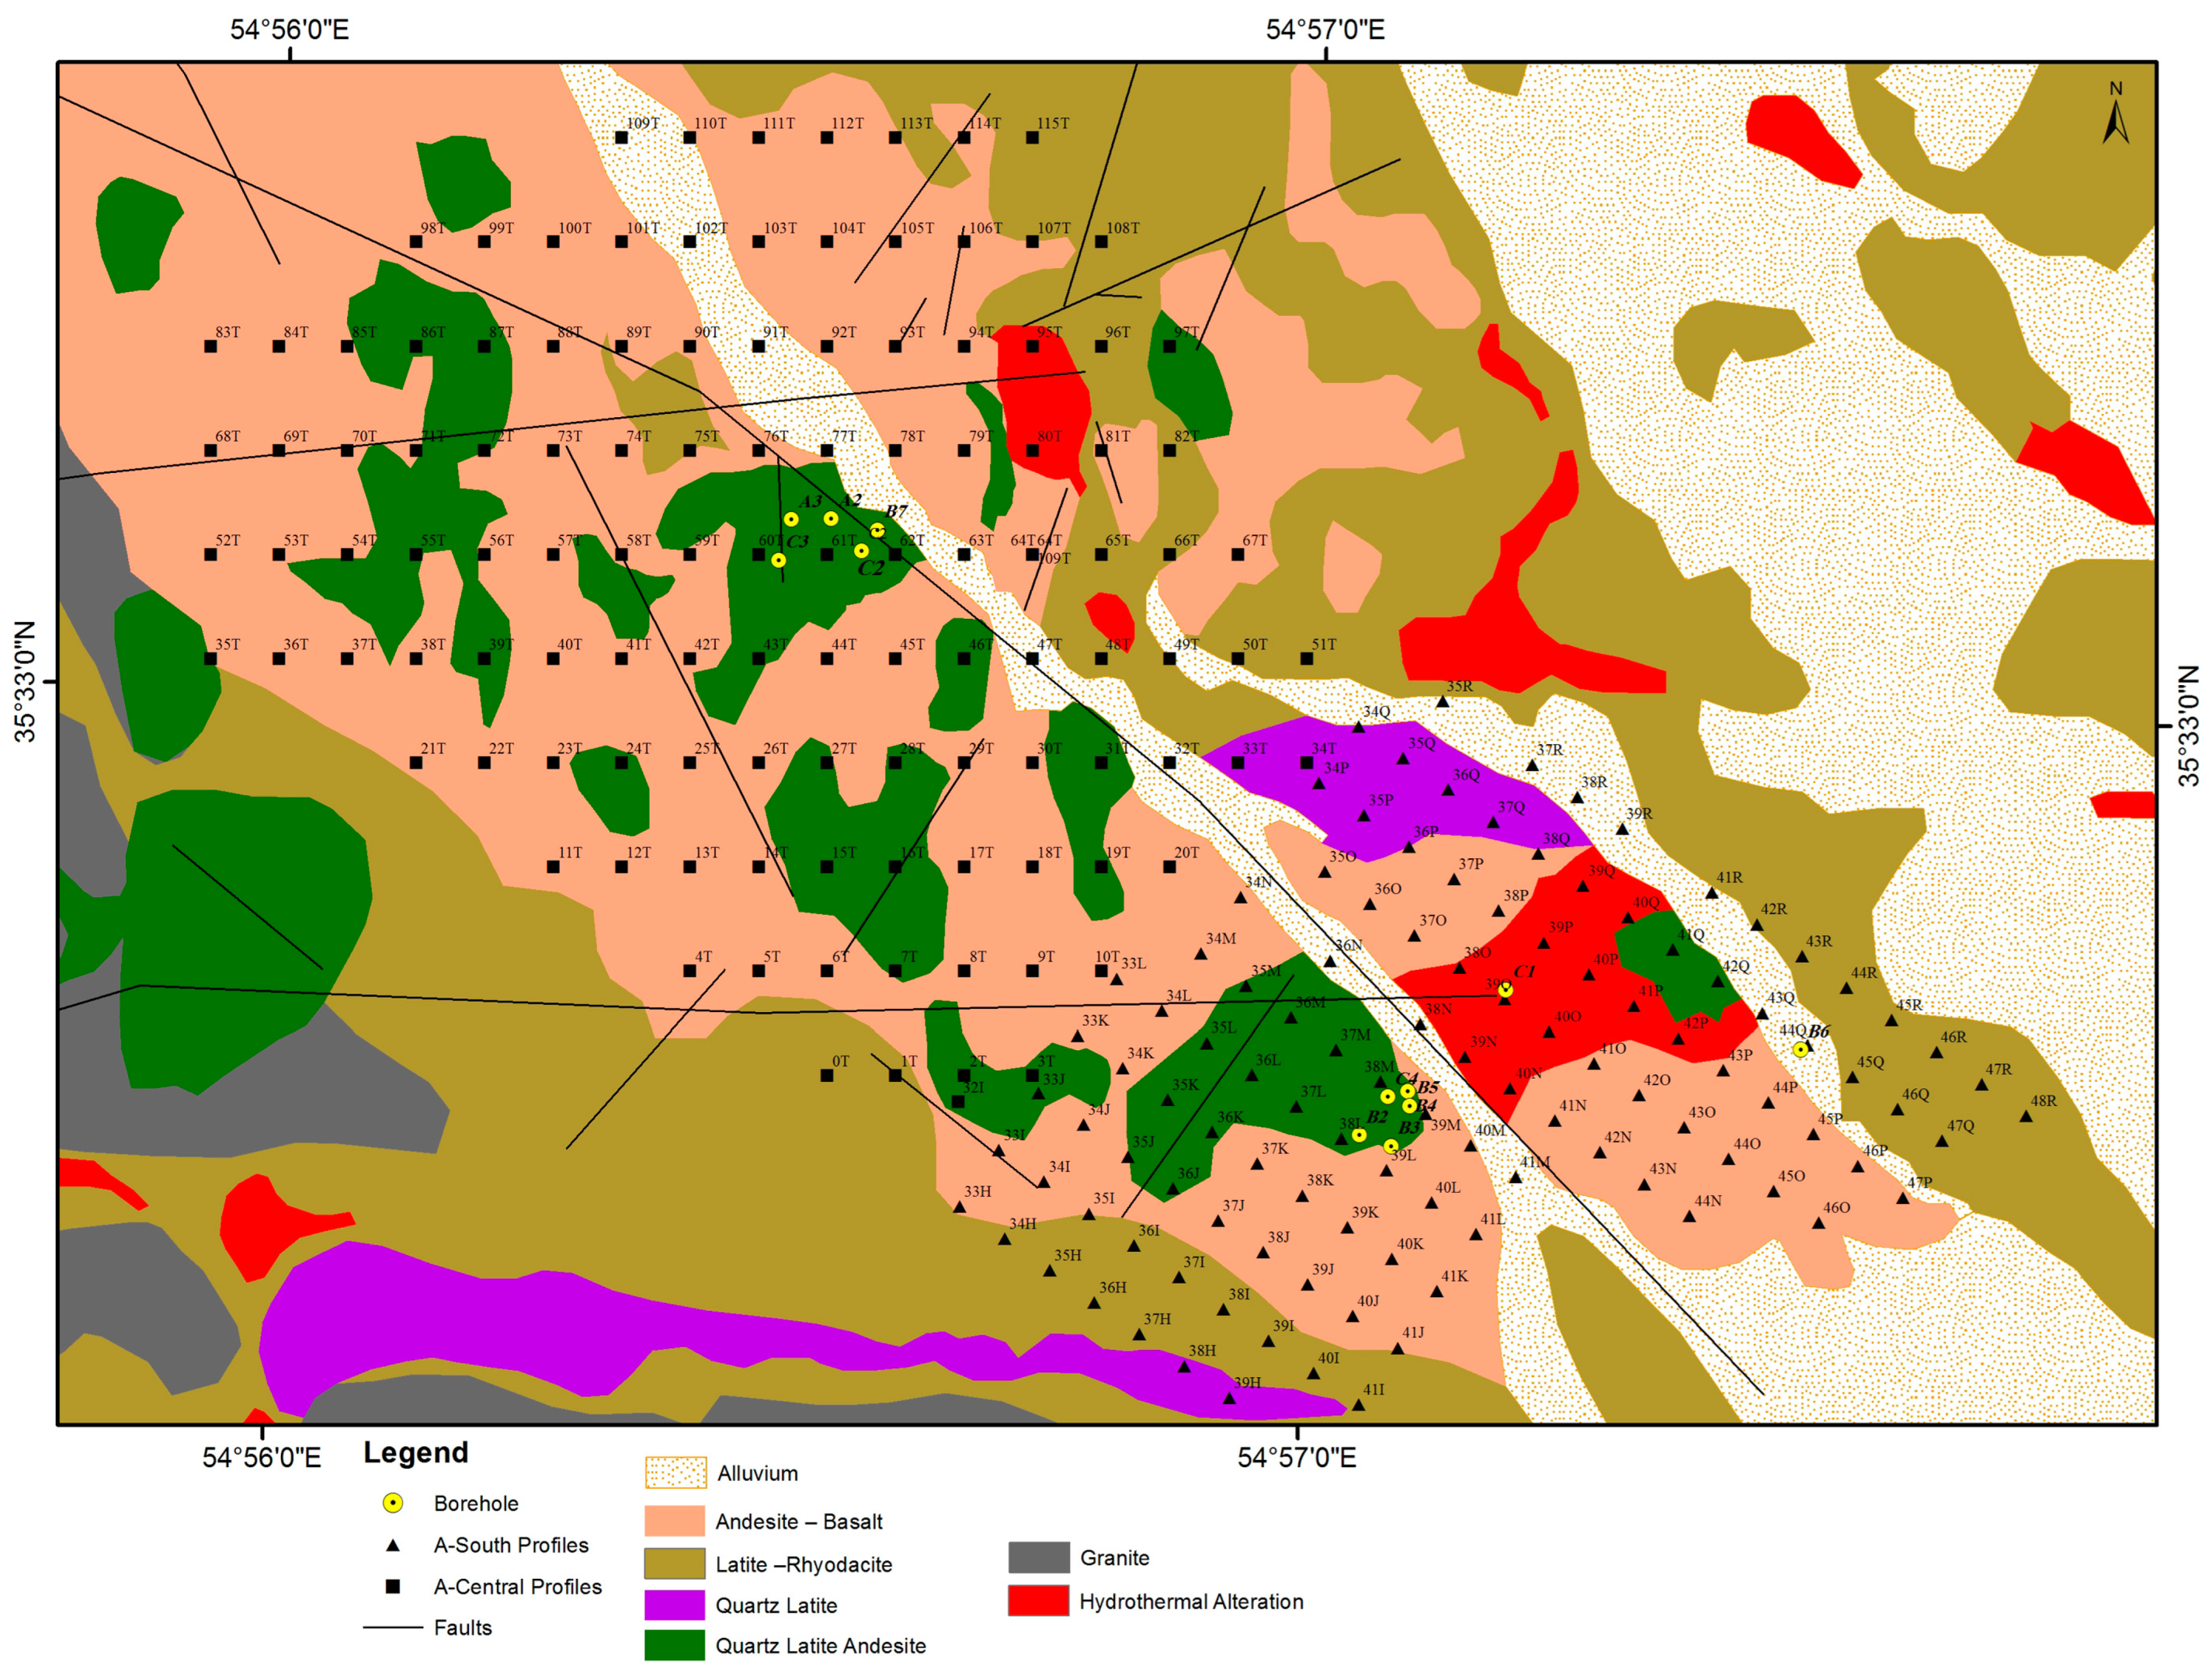
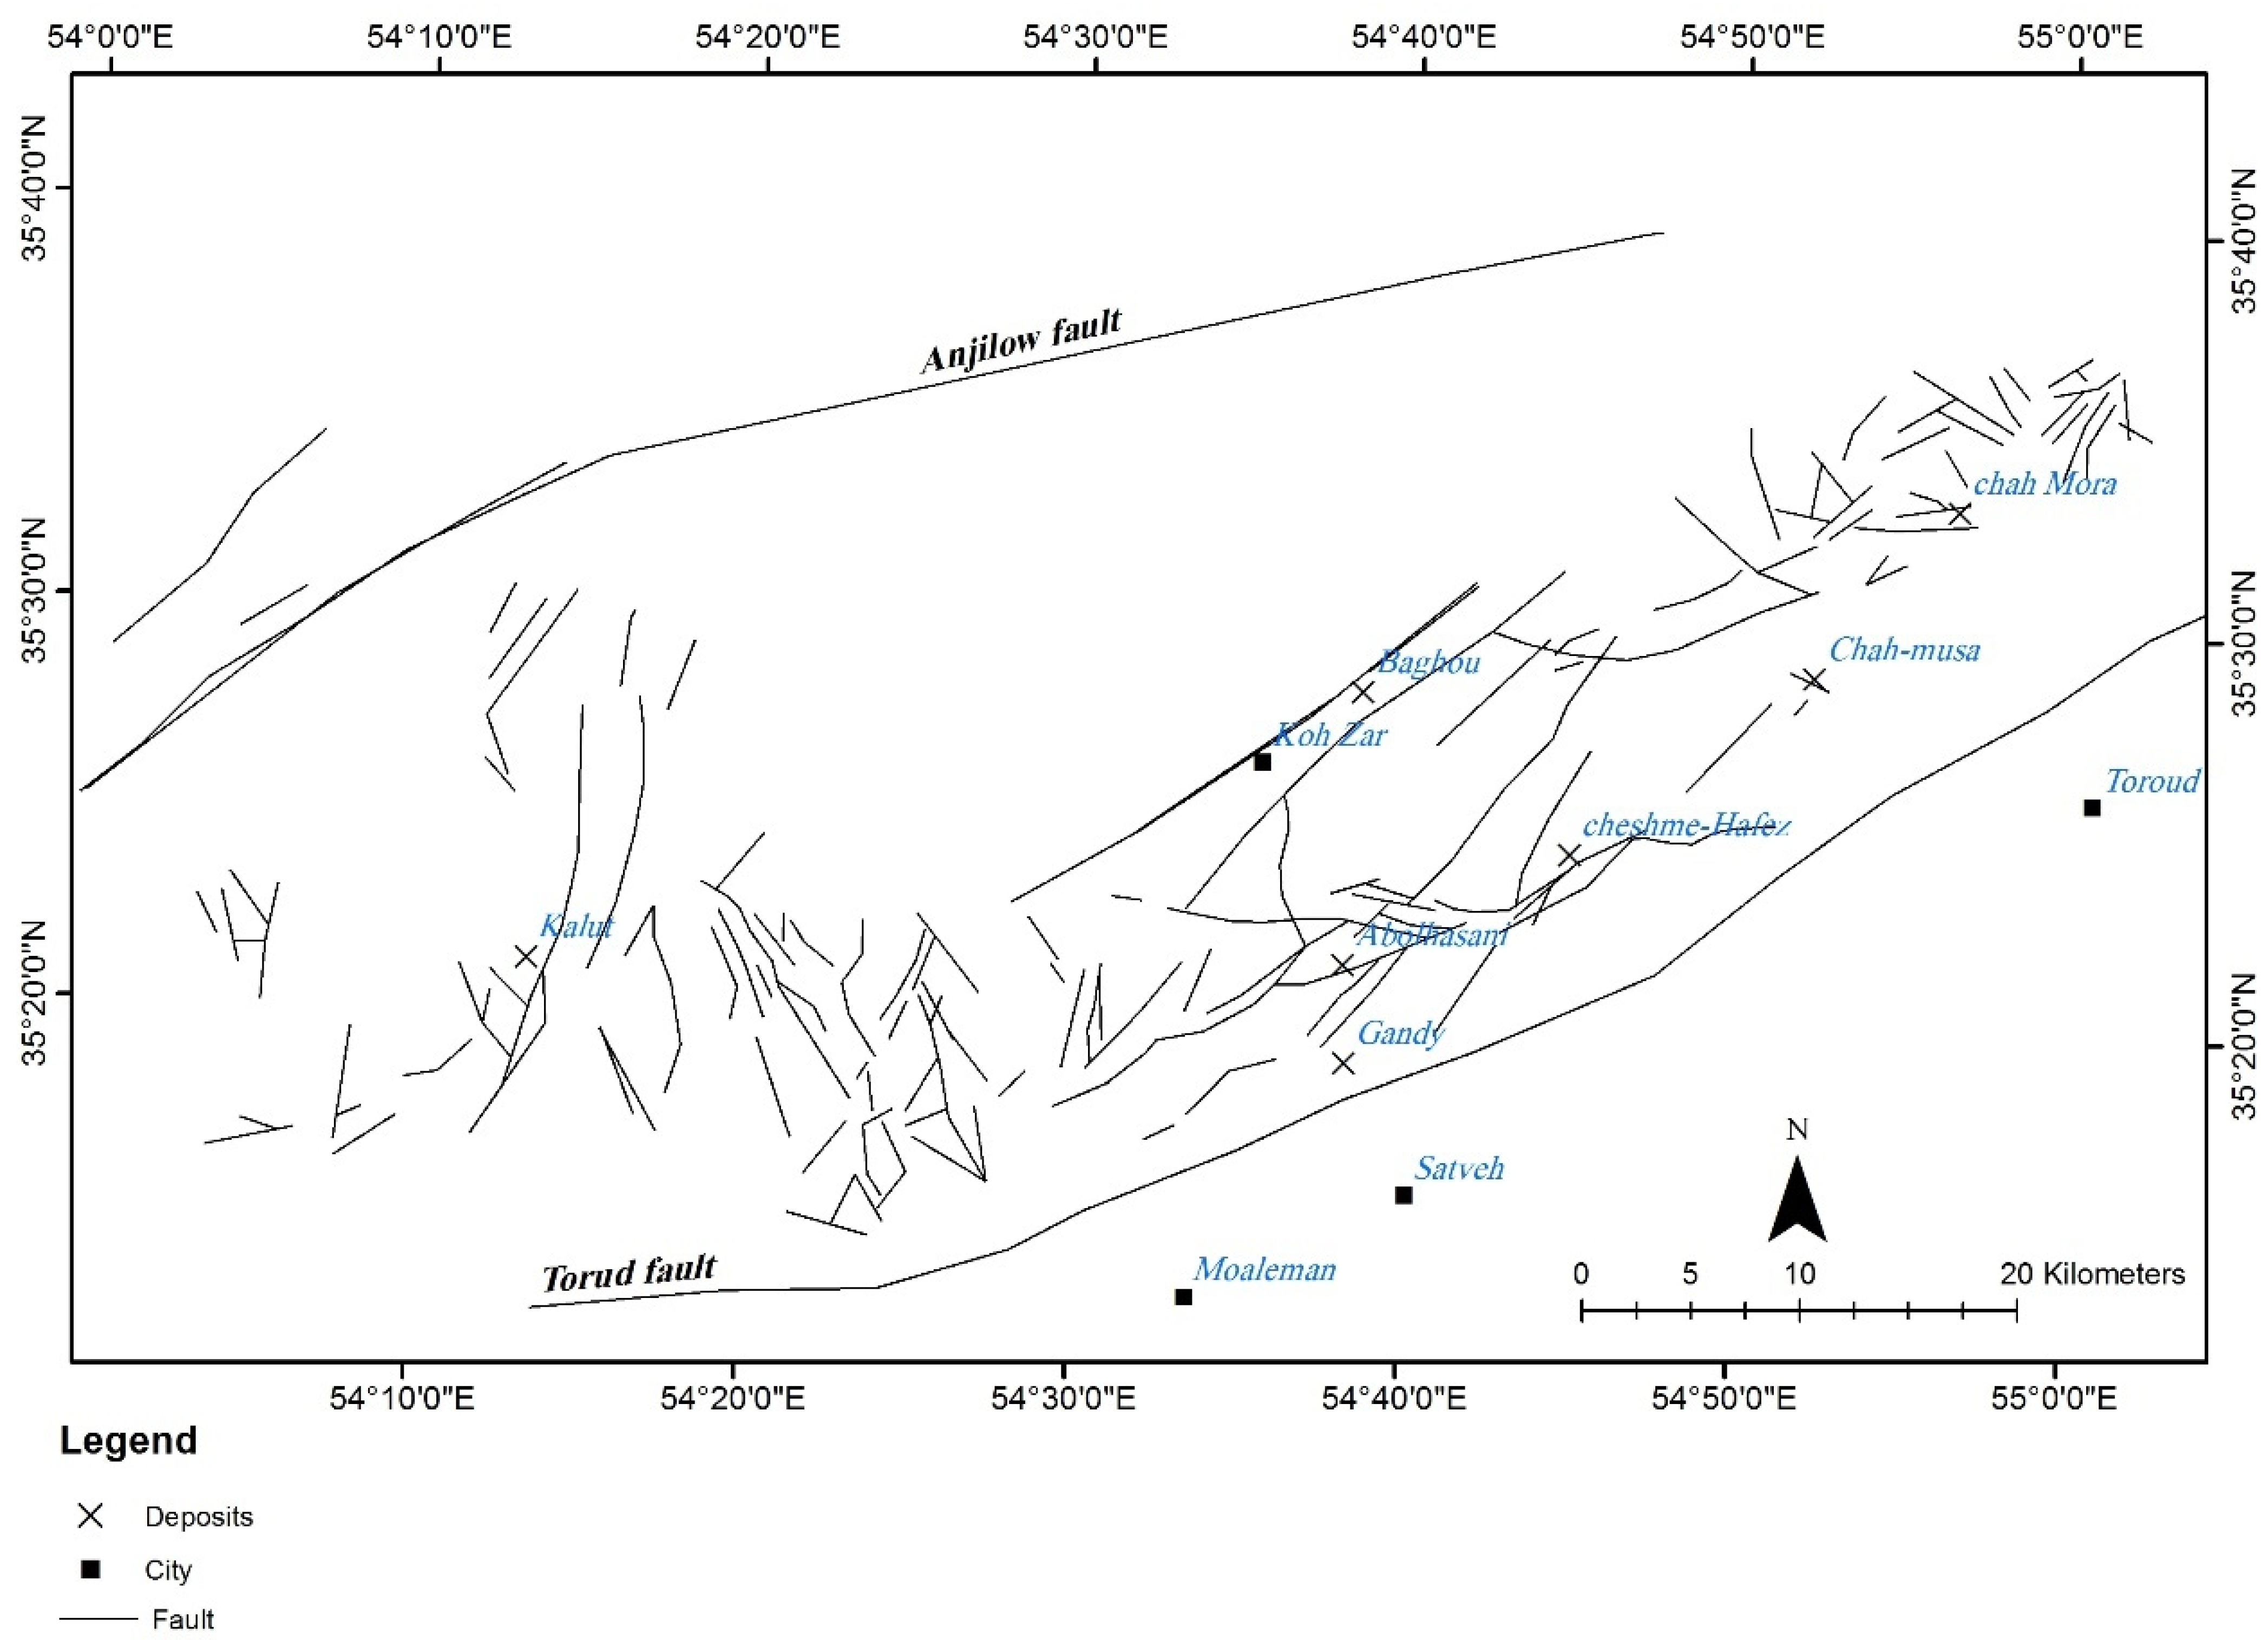
2. Geological Setting
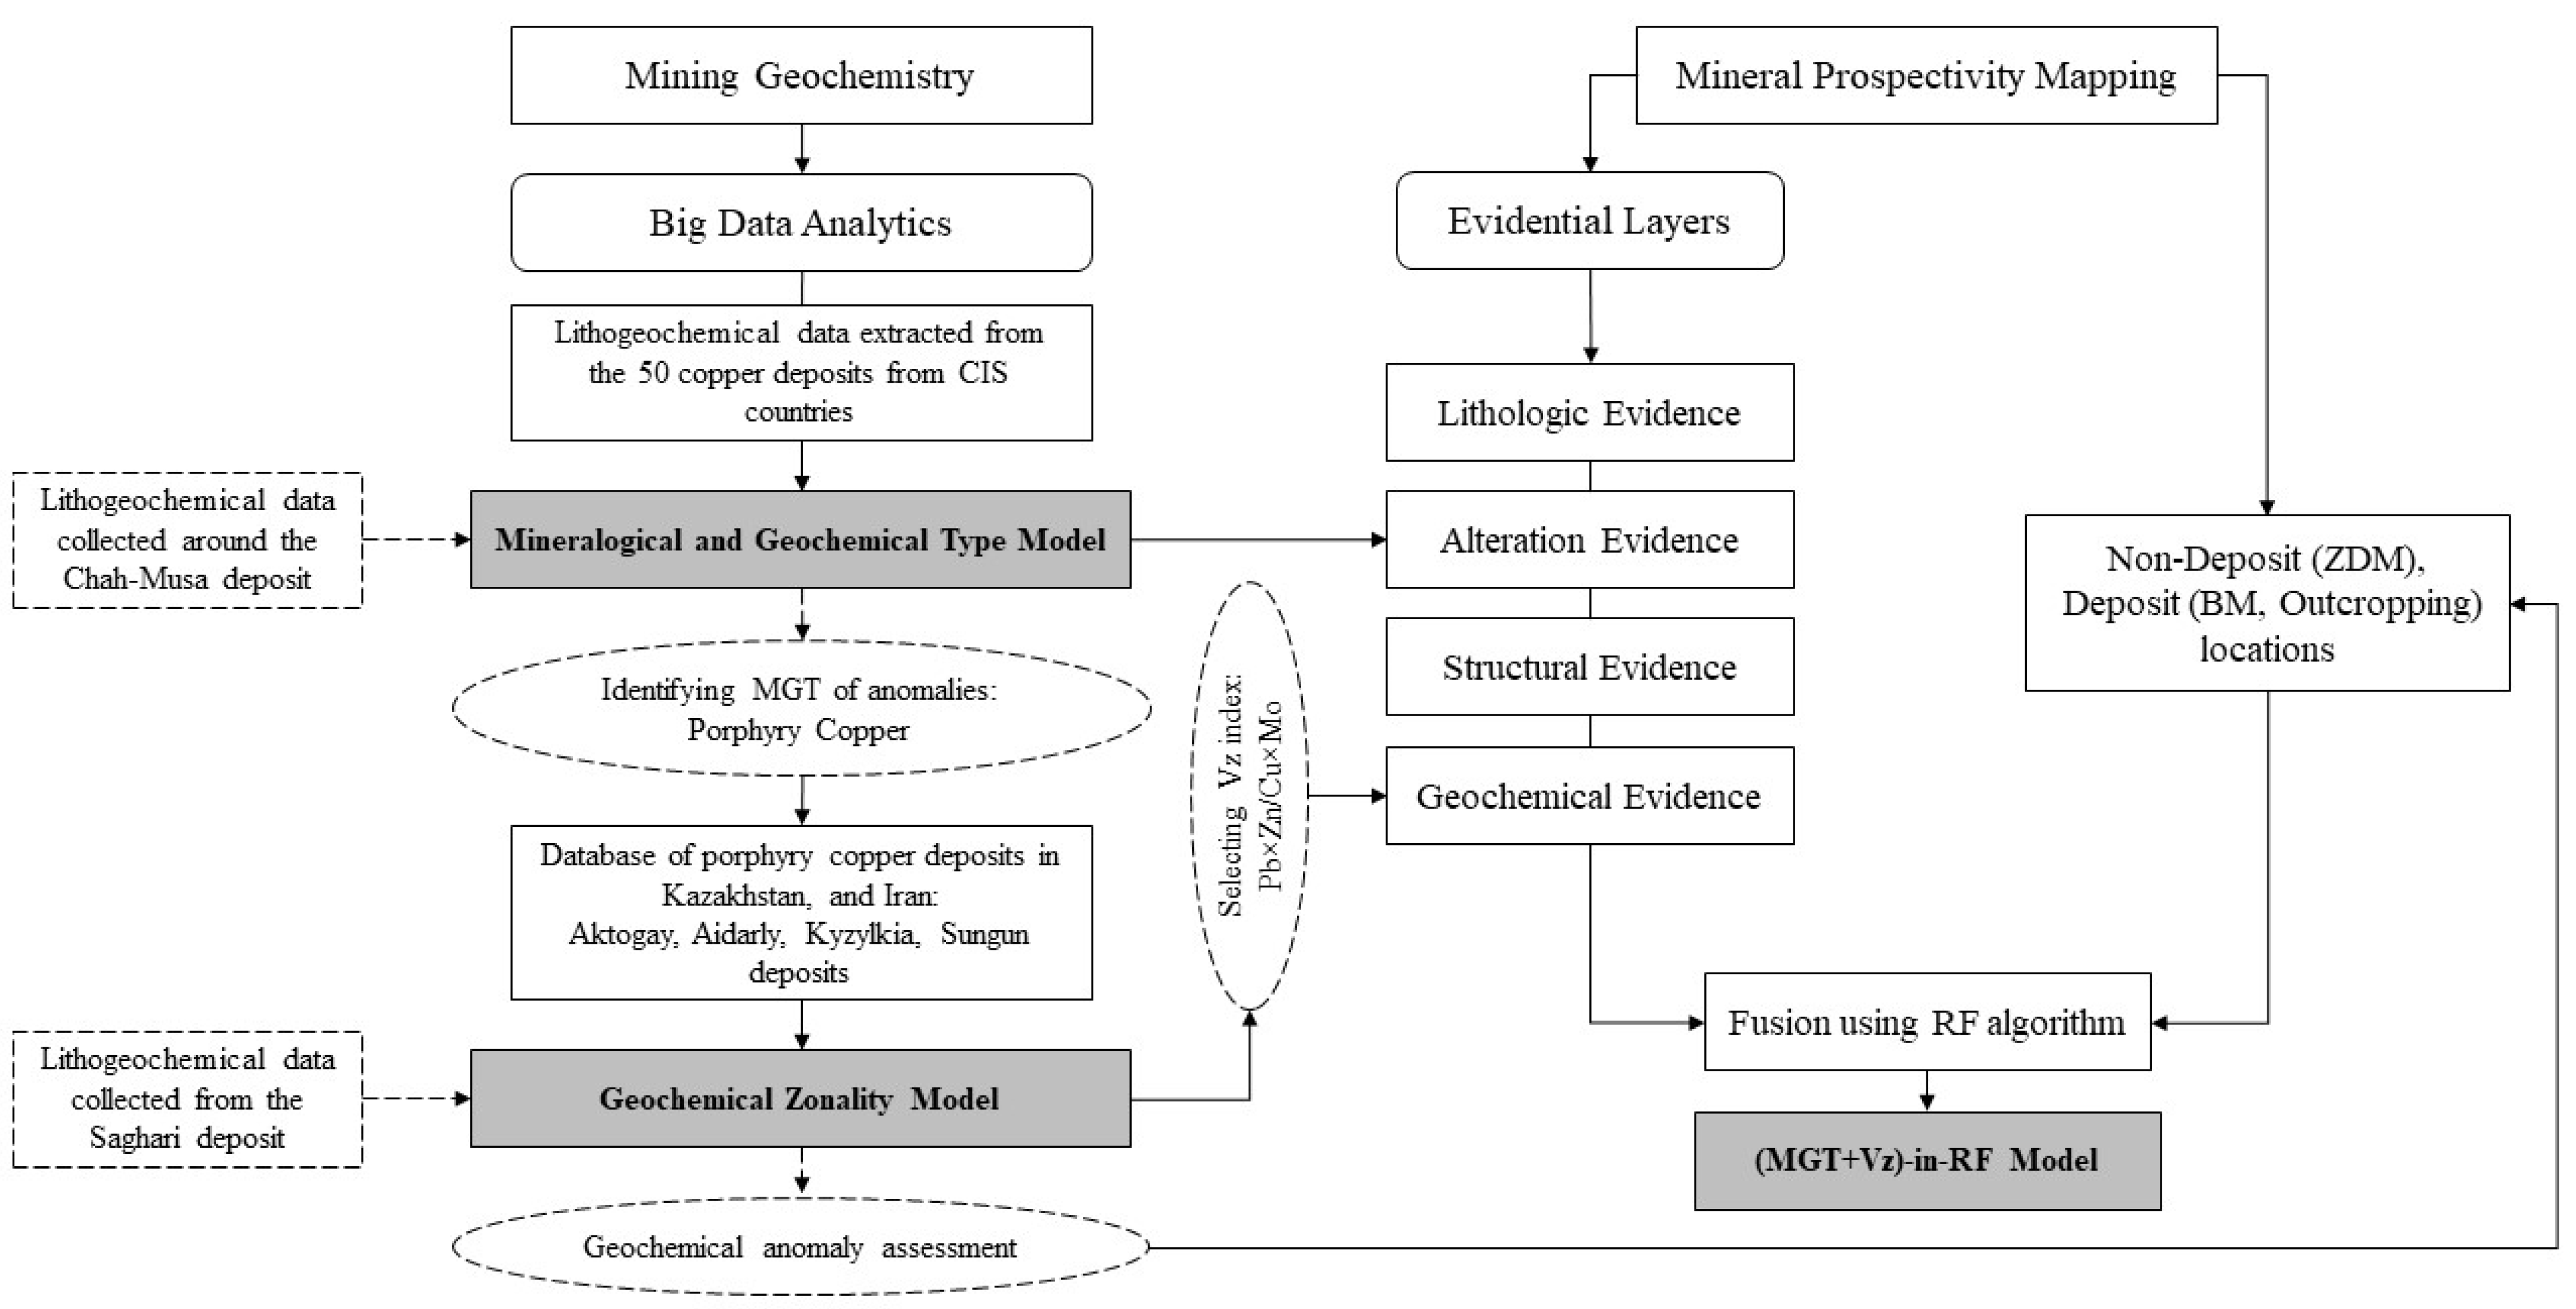
The TCS magmatic arc (Figure 1) comprises an elevated block confined by the Toroud fault to the south, and the Anjilow fault to the north that have the same trends. In this block, NE–SW-trending volcano-intrusive rocks are composed of middle- to upper Eocene andesites and dacites, and Oligocene diorites. Middle- to late Eocene igneous activity include: (i) local andesitic lava flows associated with marls, tuffaceous marlstones, sandstones, and explosively deposited rhyolitic to rhyodacitic tuffs; (ii) basaltic andesite and lava flows, and pyroclastic rocks of andesite, trachy-andesite; (iii) hypabyssal intrusive rocks and subordinate dacitic–rhyodacitic rocks [63,68]. The faults and fractures controlled ore mineralization in the TCS belt, e.g., [60,61].
Figure 1. The geographical position of the TCS belt in Iran and regional geological map of the TCS range, showing mineralization zones, geological structures, and the lithological units. (based on 1:250,000 geologic map of Toroud). AMB: Alborz magmatic belt, UD: Urumieh-Dokhtar zone, TCS: Toroud-Chah Shirin range [69].
Remotesensing 15 03708 g001
Figure 2 shows geological map of the Saghari deposit, which is situated in the north-eastern part of the geological map of Toroud (1:250,000 scale). The Saghari deposit is placed around the Chah-Musa deposit. The Chah-Musa deposit is an active mine. The Chah-Musa porphyritic hornblende diorite subvolcanic intrusion is positioned in the eastern part of the TSC belt [62,63]. It is emplaced into the Eocene volcanic sequence. The egg-shaped Chah-Musa body hosts a copper deposit and interlopes an Eocene sequence of volcanic breccia, agglomerate, and red tuffaceous sediment. Hand specimens exhibit a porphyritic structure [63]. Disseminated-veinlet copper mineralization in the Chah-Musa deposit occurred in Calc-alkaline subvolcanic porphyry-biotite-hornblende andesite bodies which are associated with phyllic and propylitic alterations. Supergene processes produced extensive alterations in hypogene sulfide minerals, such as pyrite, chalcopyrite, and bornite to secondary chalcocite, covellite, digenite, and malachite supergene minerals. The mineralization system is connected to the evolution of hydrothermal fluid mineralization and mixing with cold and low salinity meteoric water resulting in disseminated-veinlet copper mineralization at deep zones, and vein-type copper, zinc, and lead at shallow zones. This has led to the development of elemental and mineralogical zonation [62]. Despite its importance, geologic information about the Chah-Musa deposit is scarce [63].
The study area has an arid climate with deprived vegetation. The occurrence of specific geographical conditions in an arid environment has resulted in the unfeasible execution of geochemical reconnaissance investigations. Many of the identified copper deposits in the study area are considered through advanced zonal patterns of mineralization and hydrothermal alteration zones. The zonal patterns show remarkable differences in element content, reflecting variations in the mineralogical and geochemical compositions of the mineralized and hydrothermally altered zones [24].

3. Methodology

Figure 3 illustrates an outline of the methodological flowchart applied in this analysis to identify and evaluate the geochemical anomalies of the Saghari deposit around the Chah-Musa deposit and to generate mineral prospectivity mapping in the TCS belt.

3.1. Big Data Analytics

The term “Big Data” refers to large datasets and their characteristics, such as different kinds of data sources. The features of big data are essential to the geosciences. The enormous assortment of earth observation data provides a great opening to execute big data analytics to solve geosciences issues [32]. The implications of implementing big data analytics to mineral exploration are to create the geochemical models utilizing diverse types of big data, to categorize the features of the distribution of trace element contents, and to assess the geochemical anomalies. The fundamental function of big data analytics is prediction, making it an ultimate methodology for evaluating multi-formational geochemical anomalies. The databank used to identify the MGTs of geochemical anomalies of the Saghari deposit comprises the lithogeochemical data extracted from the 50 copper deposits in CIS countries. According to the obtained MGT from the previous model, the database used to assess the anomalies associated with mineralization comprises the porphyry copper deposits in Kazakhstan and Iran.

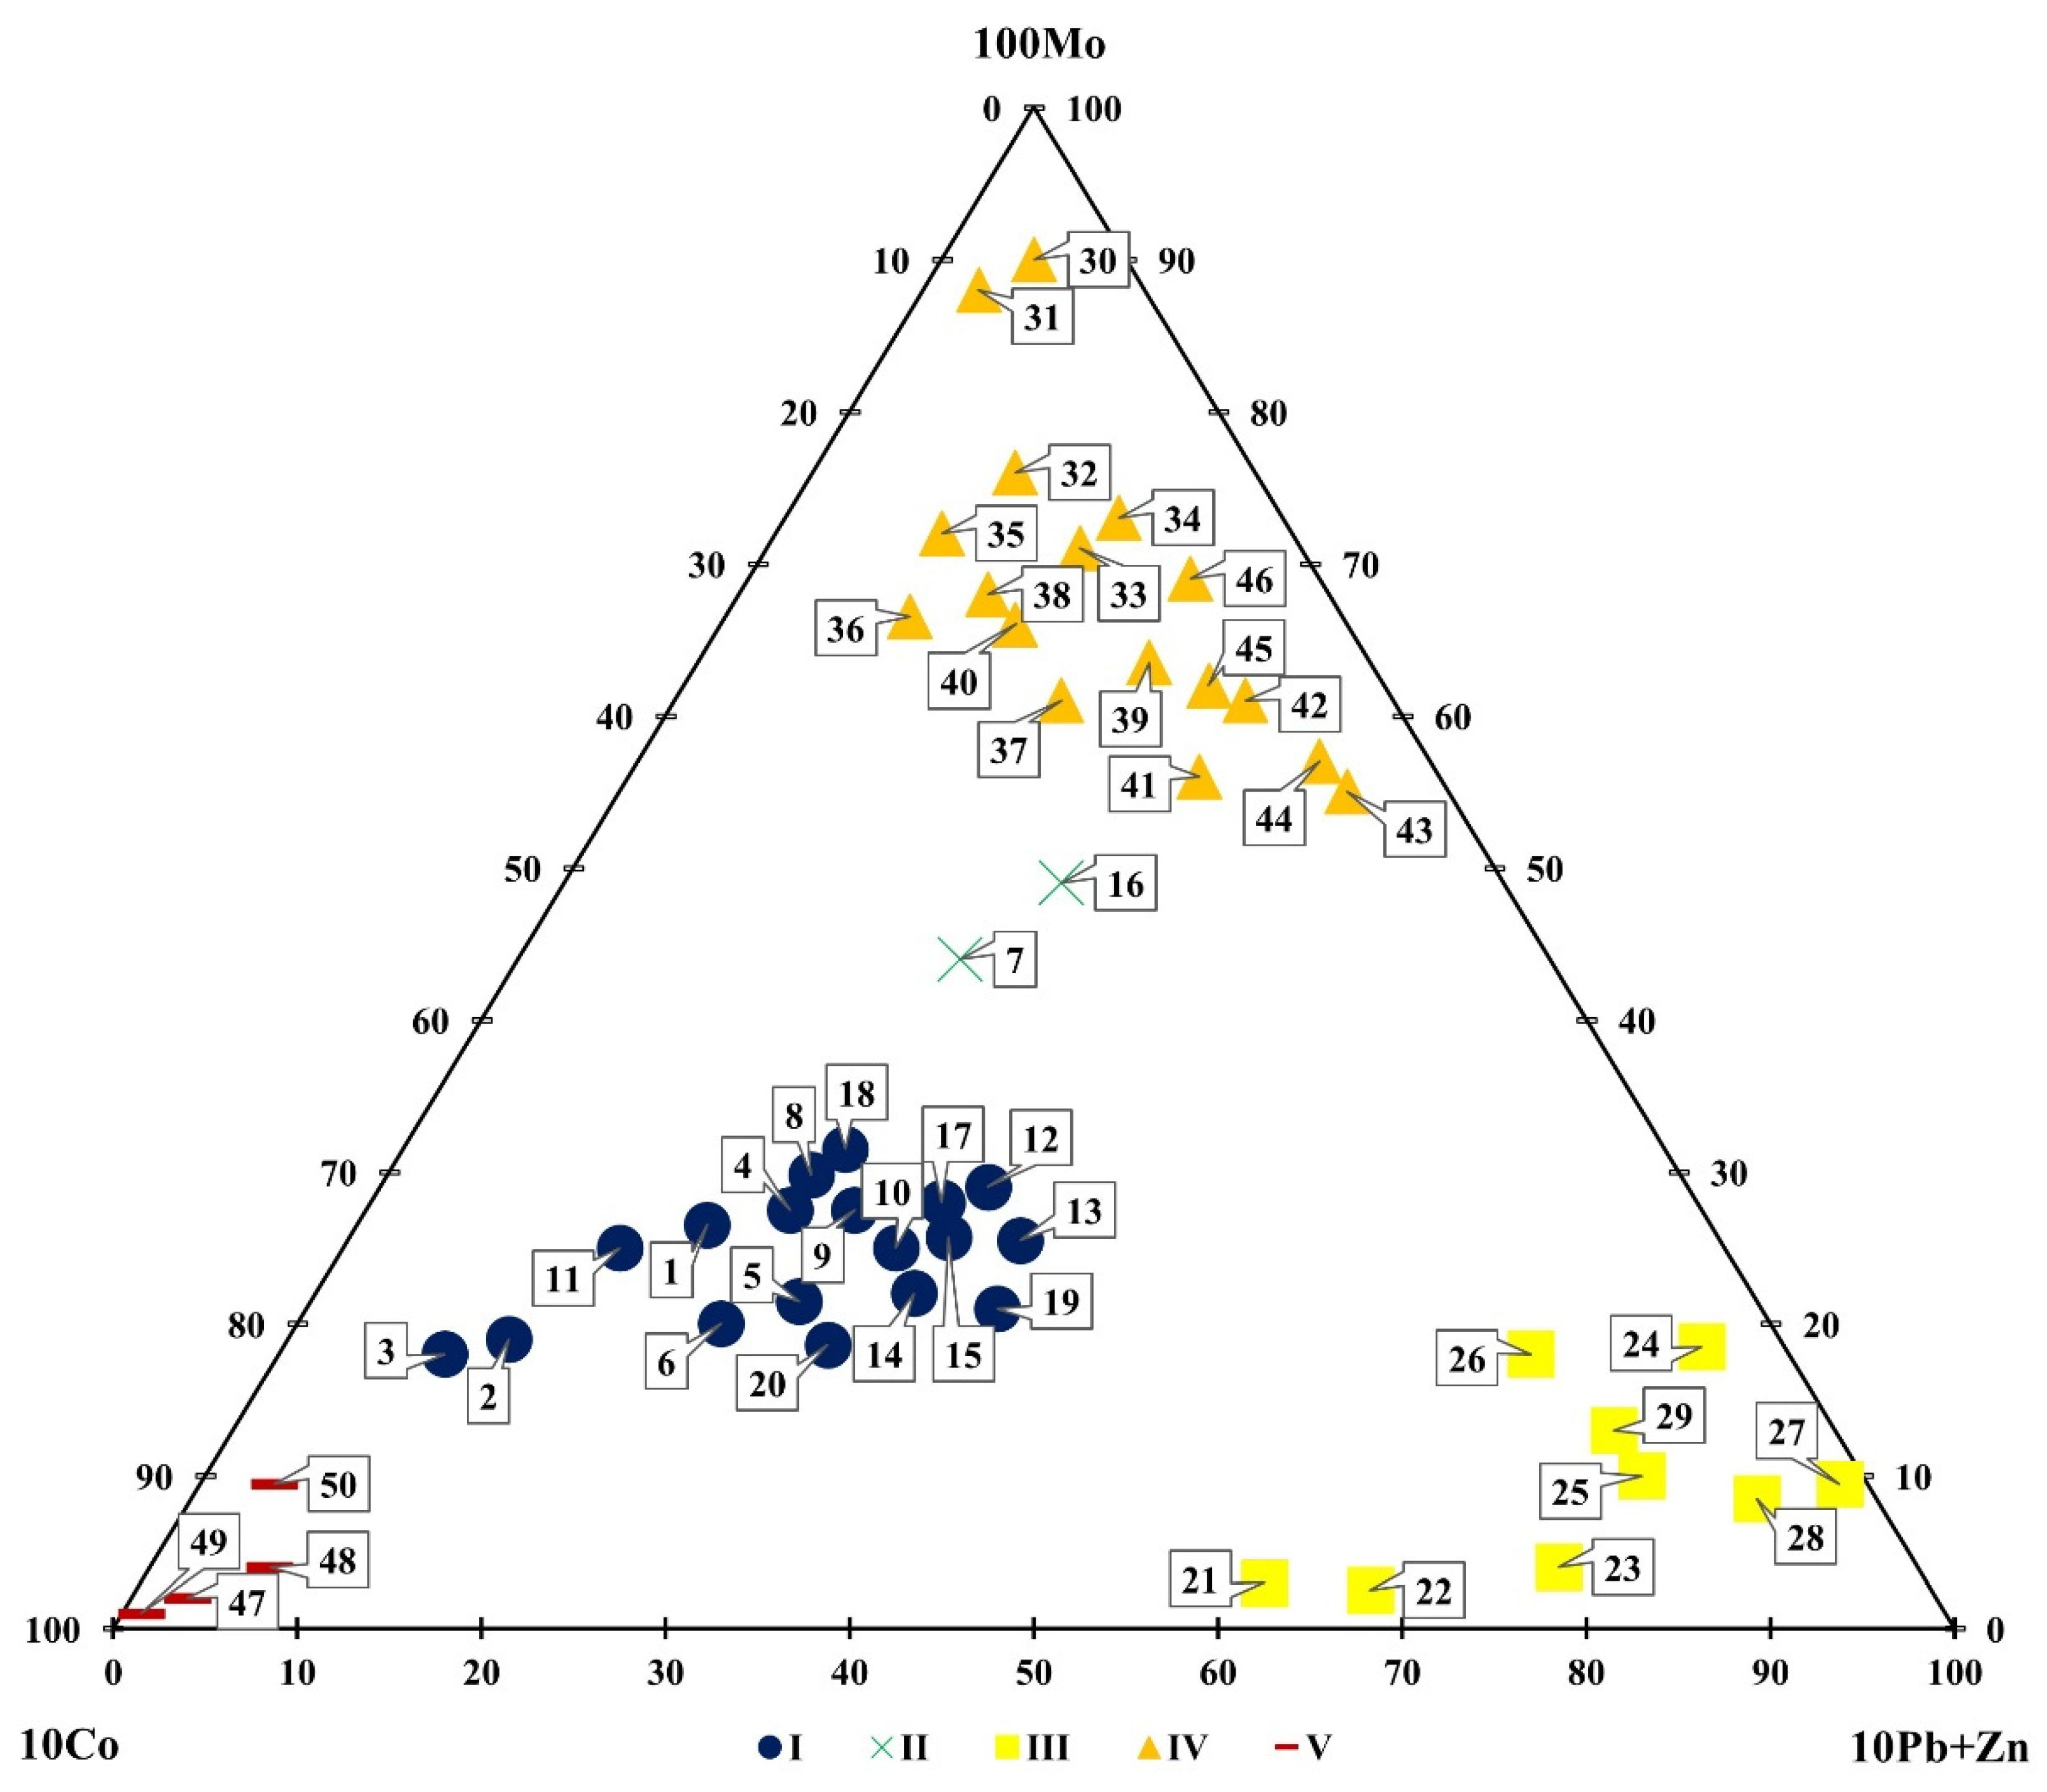
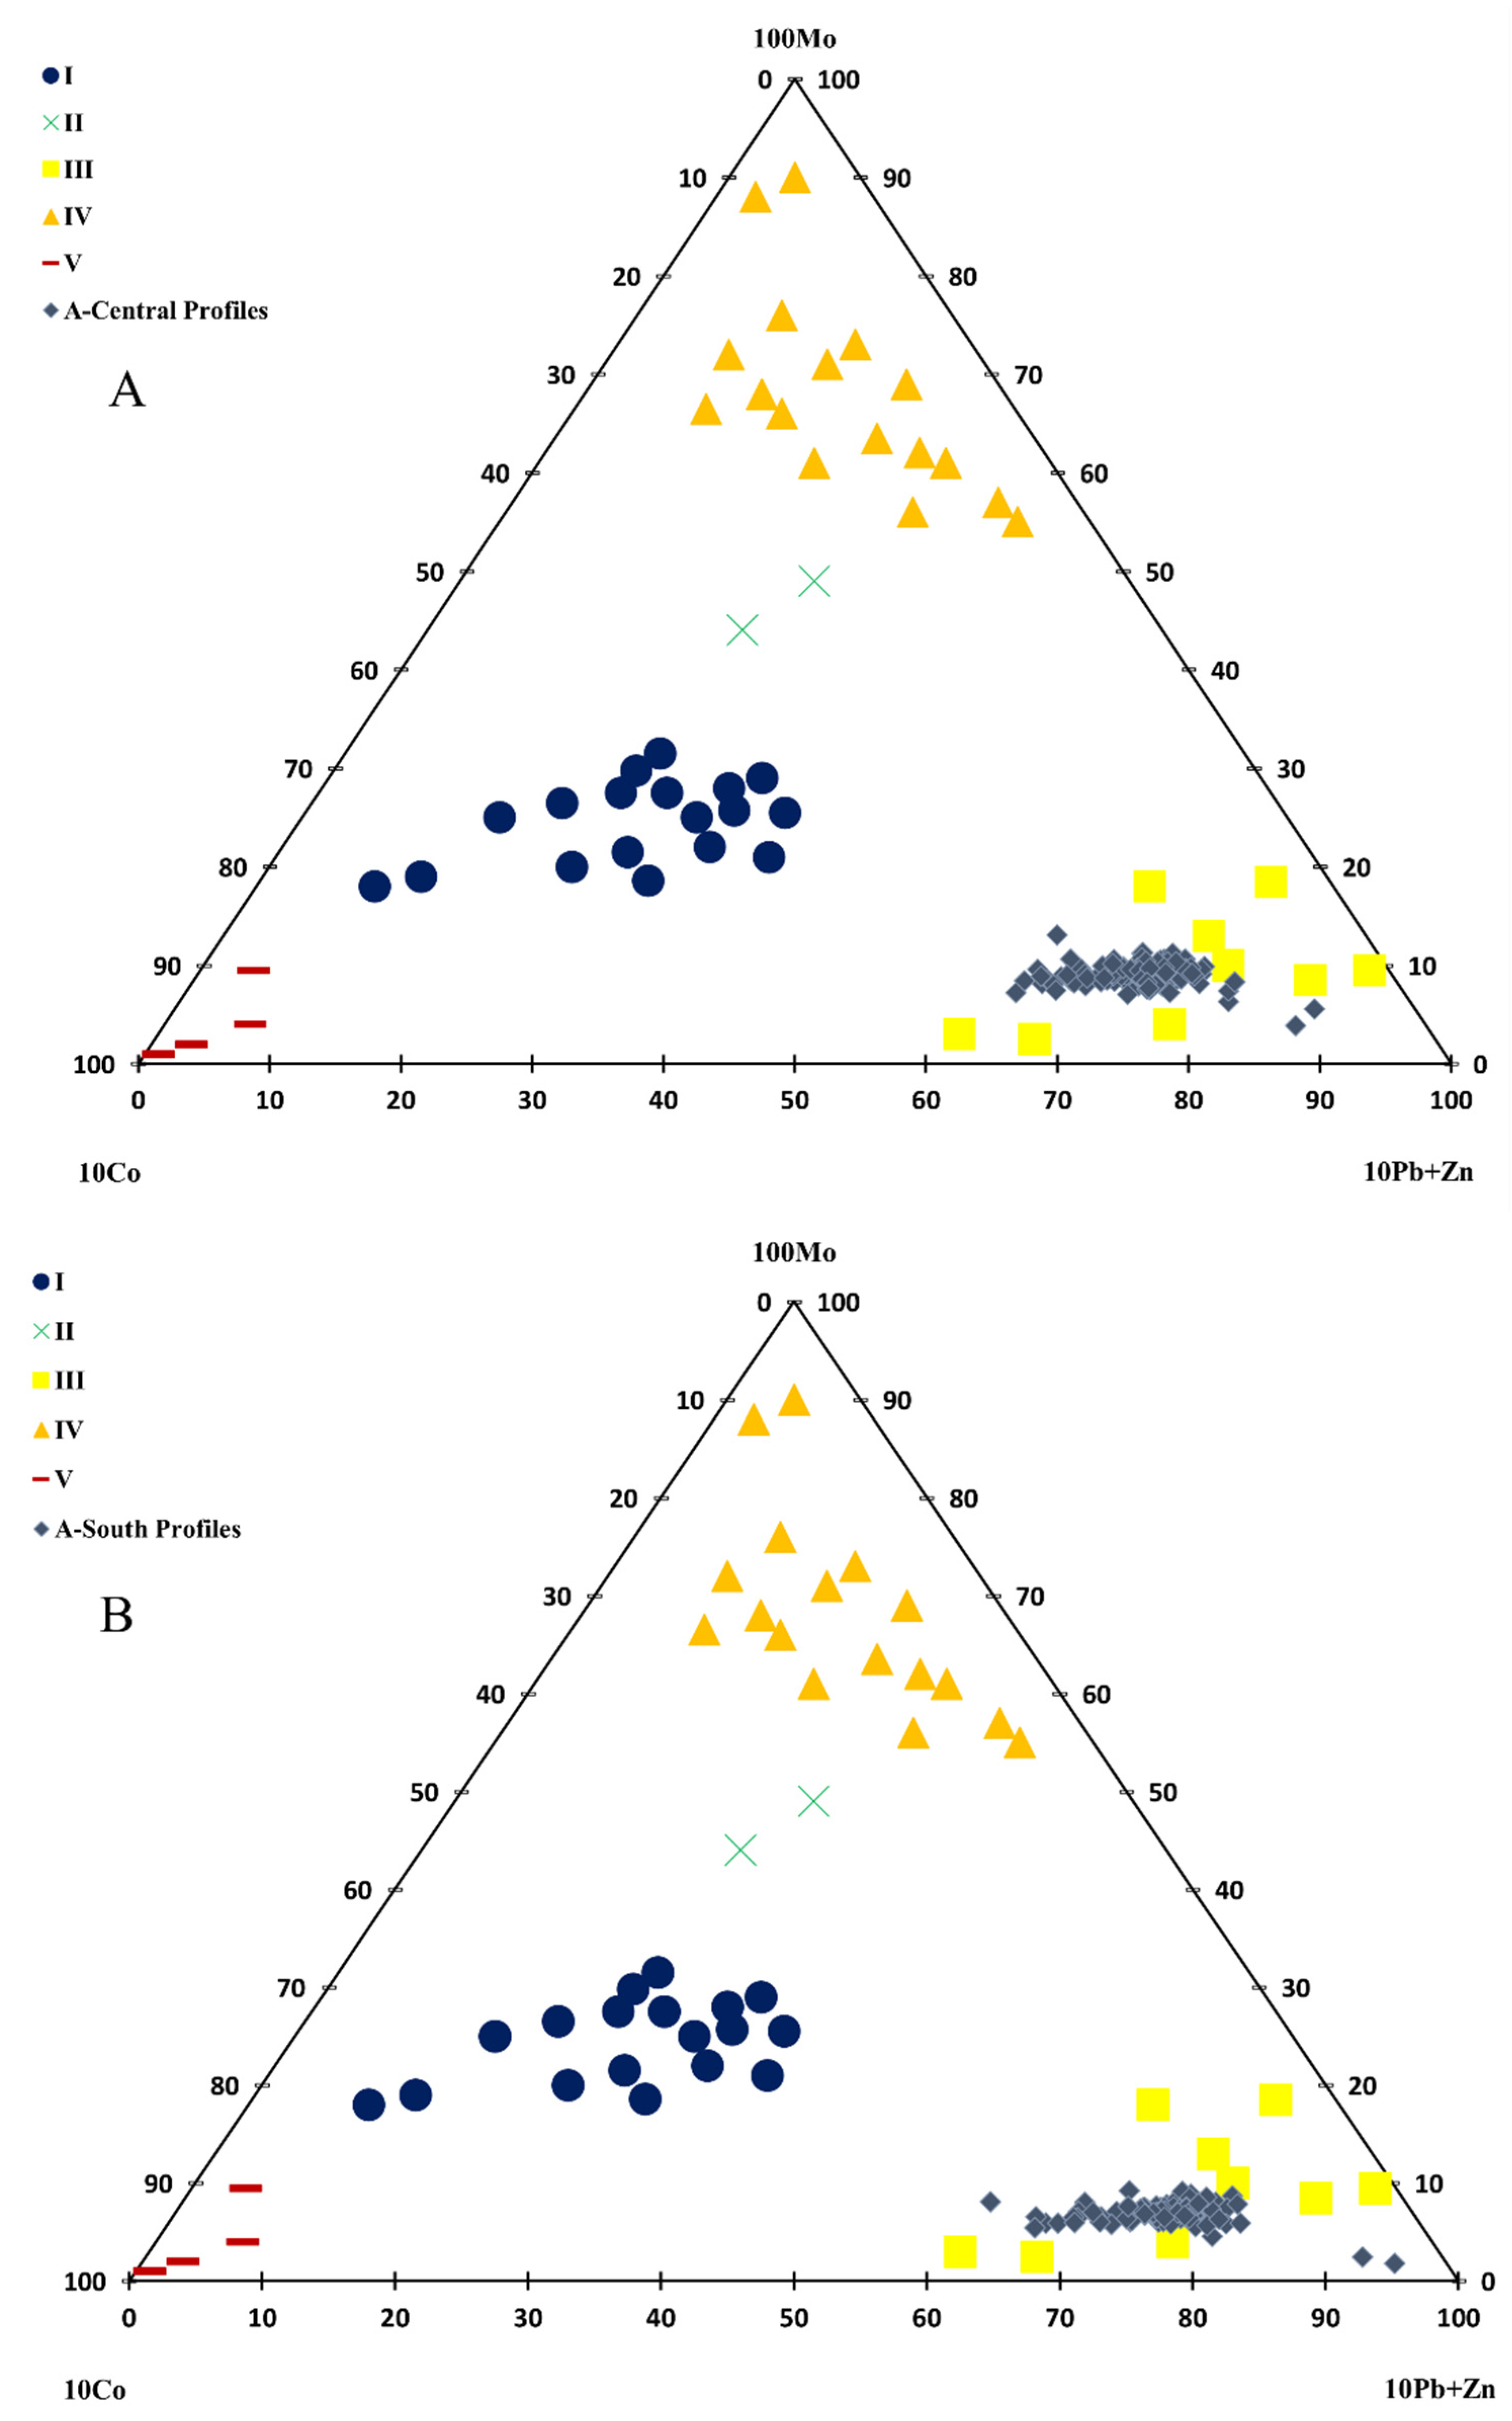
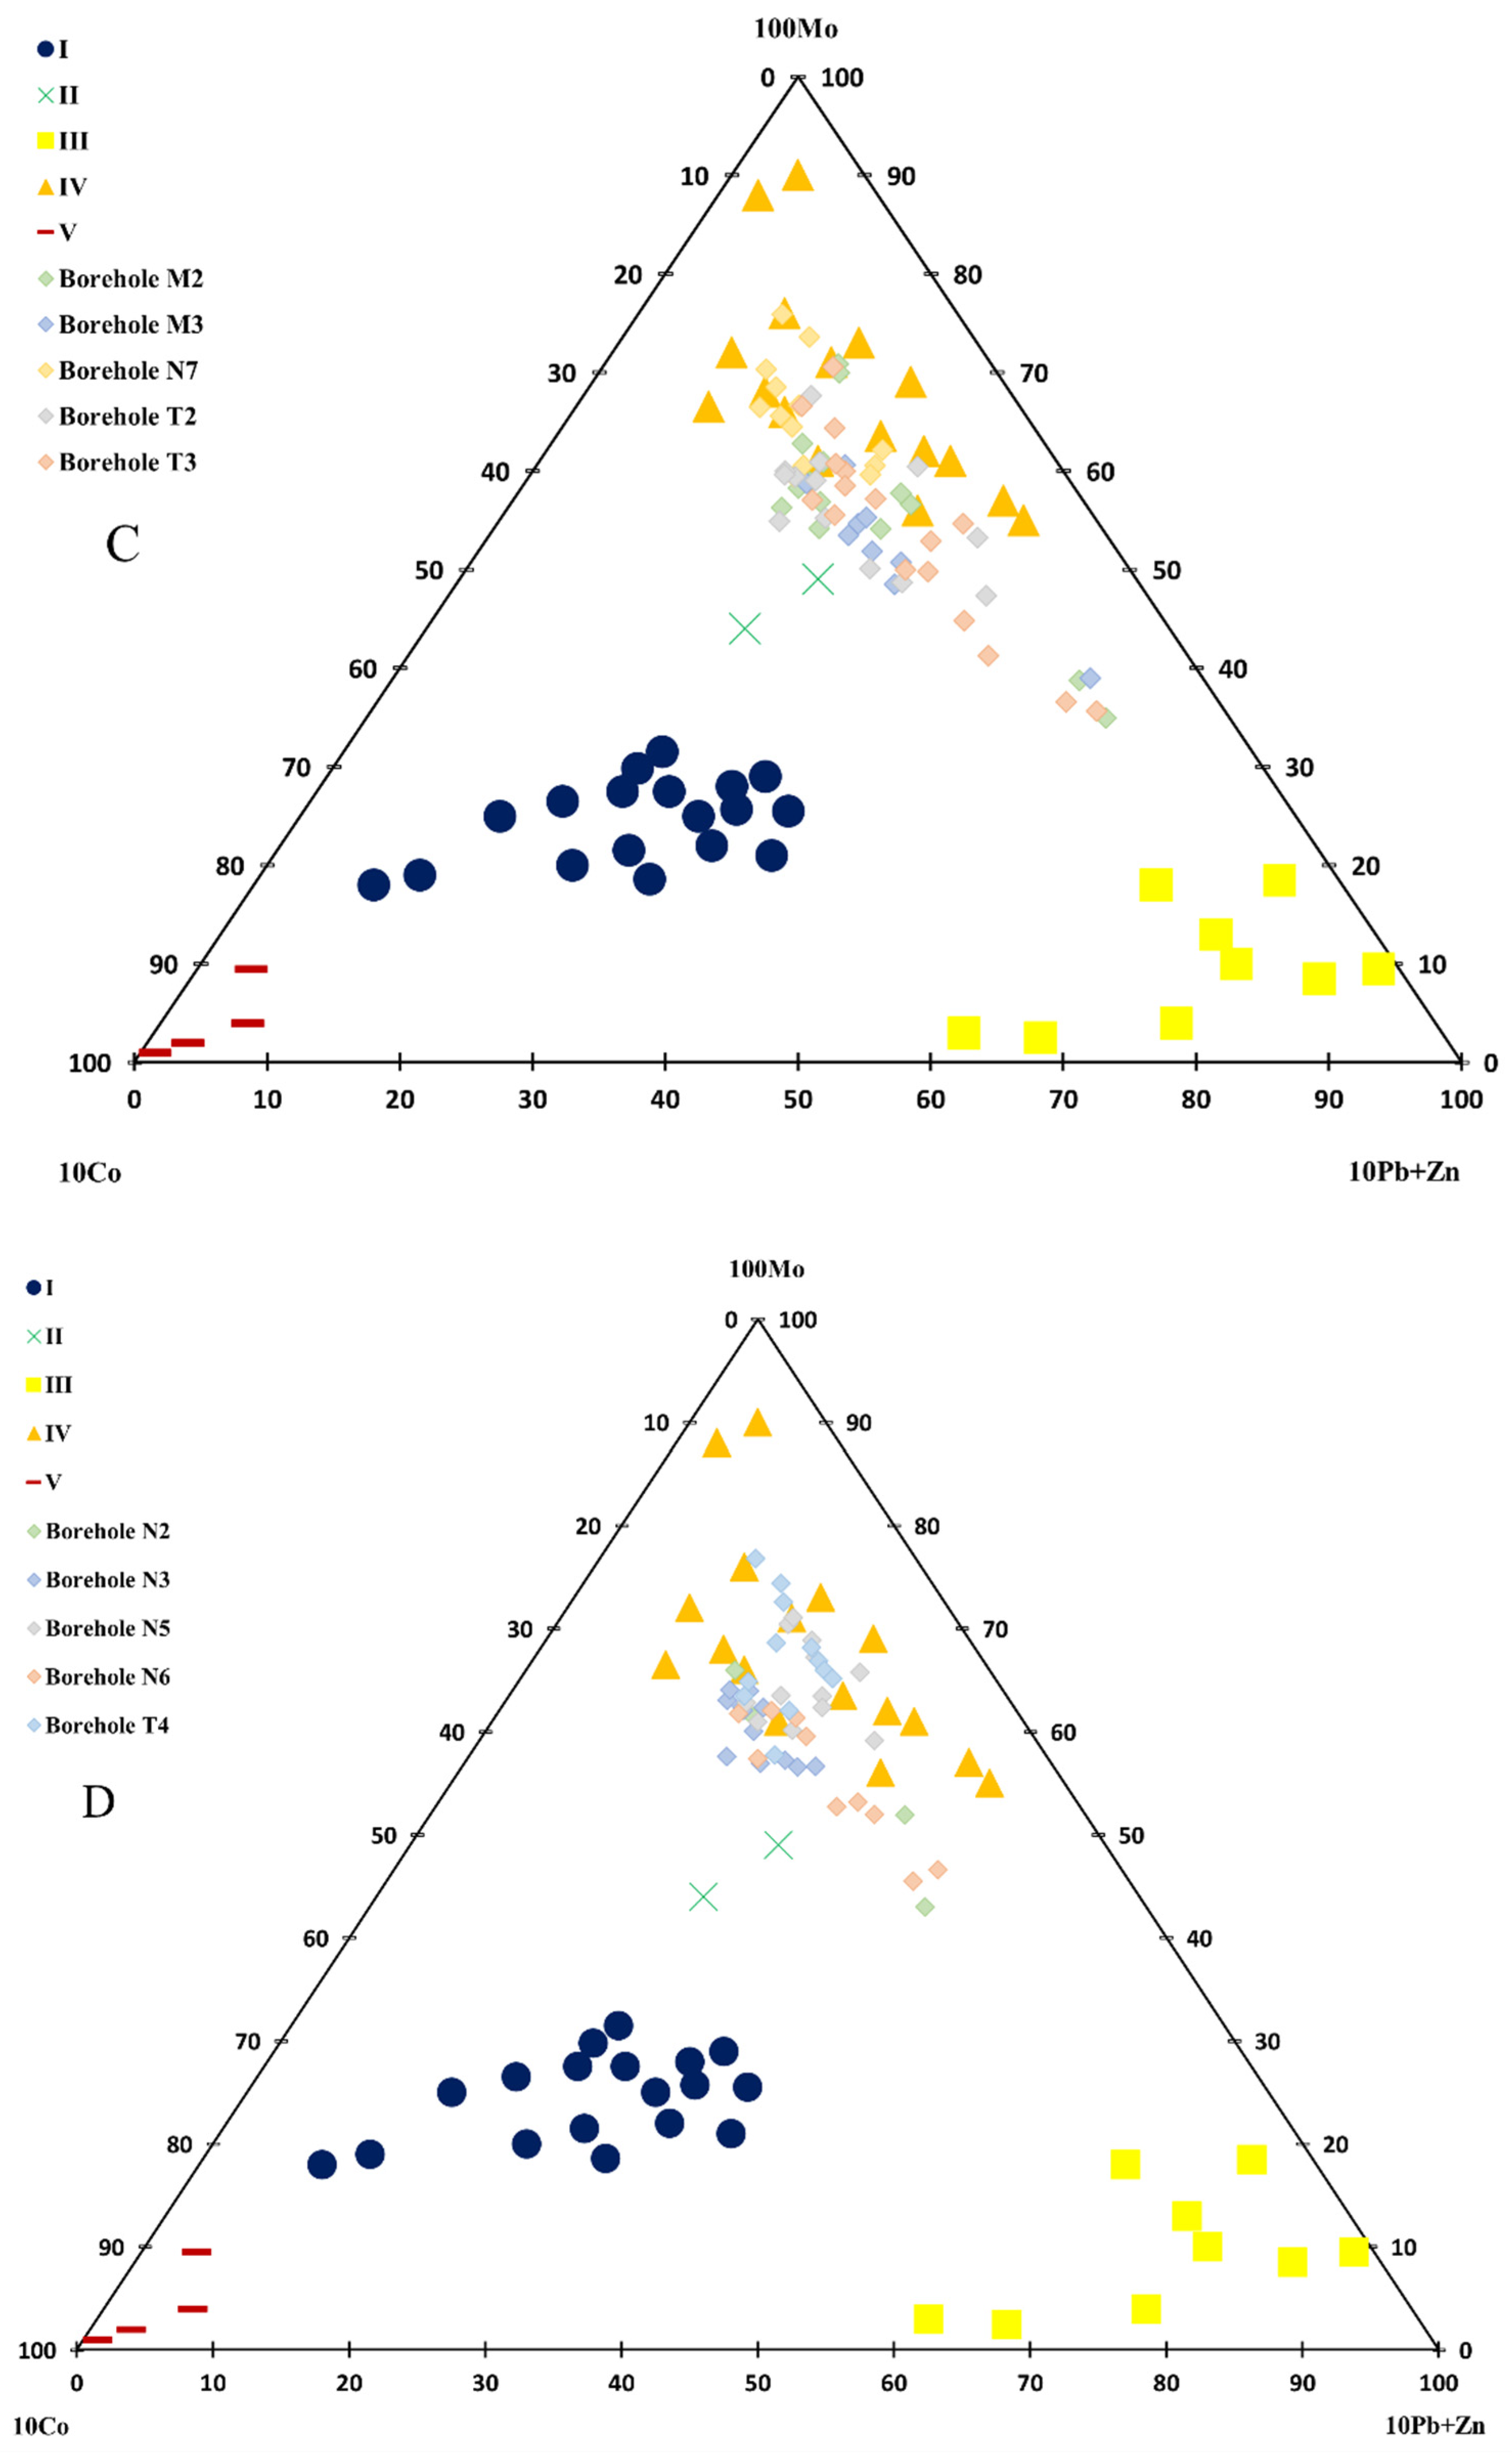
3.2. Mineralogical and Geochemical Type (MGT)

For the geochemical characteristics of deposits, ore occurrence, and associated lithogeochemical anomalies of a particular metal, it is possible to select indicator elements that determine if an area belongs to a specific mineralogical and geochemical type (MGT). The elements that determine the MGT of deposits make it possible to separate similar geochemical anomalies by depicting their composition on a triple diagram. The relative contents of three groups of elements selected for the characteristics of the corresponding MGT are applied on the sides of an equilateral triangle. The percentage of each three components is calculated from the total amount, and the position of the MGT on the plane of the triangle is marked with a point. The displacement of the point from one of the vertices of the triangle determines whether the ore occurrence belongs to the corresponding MGT. Therefore, the separation of copper ore occurrence is possible by constructing a triple diagram using big data analytics.

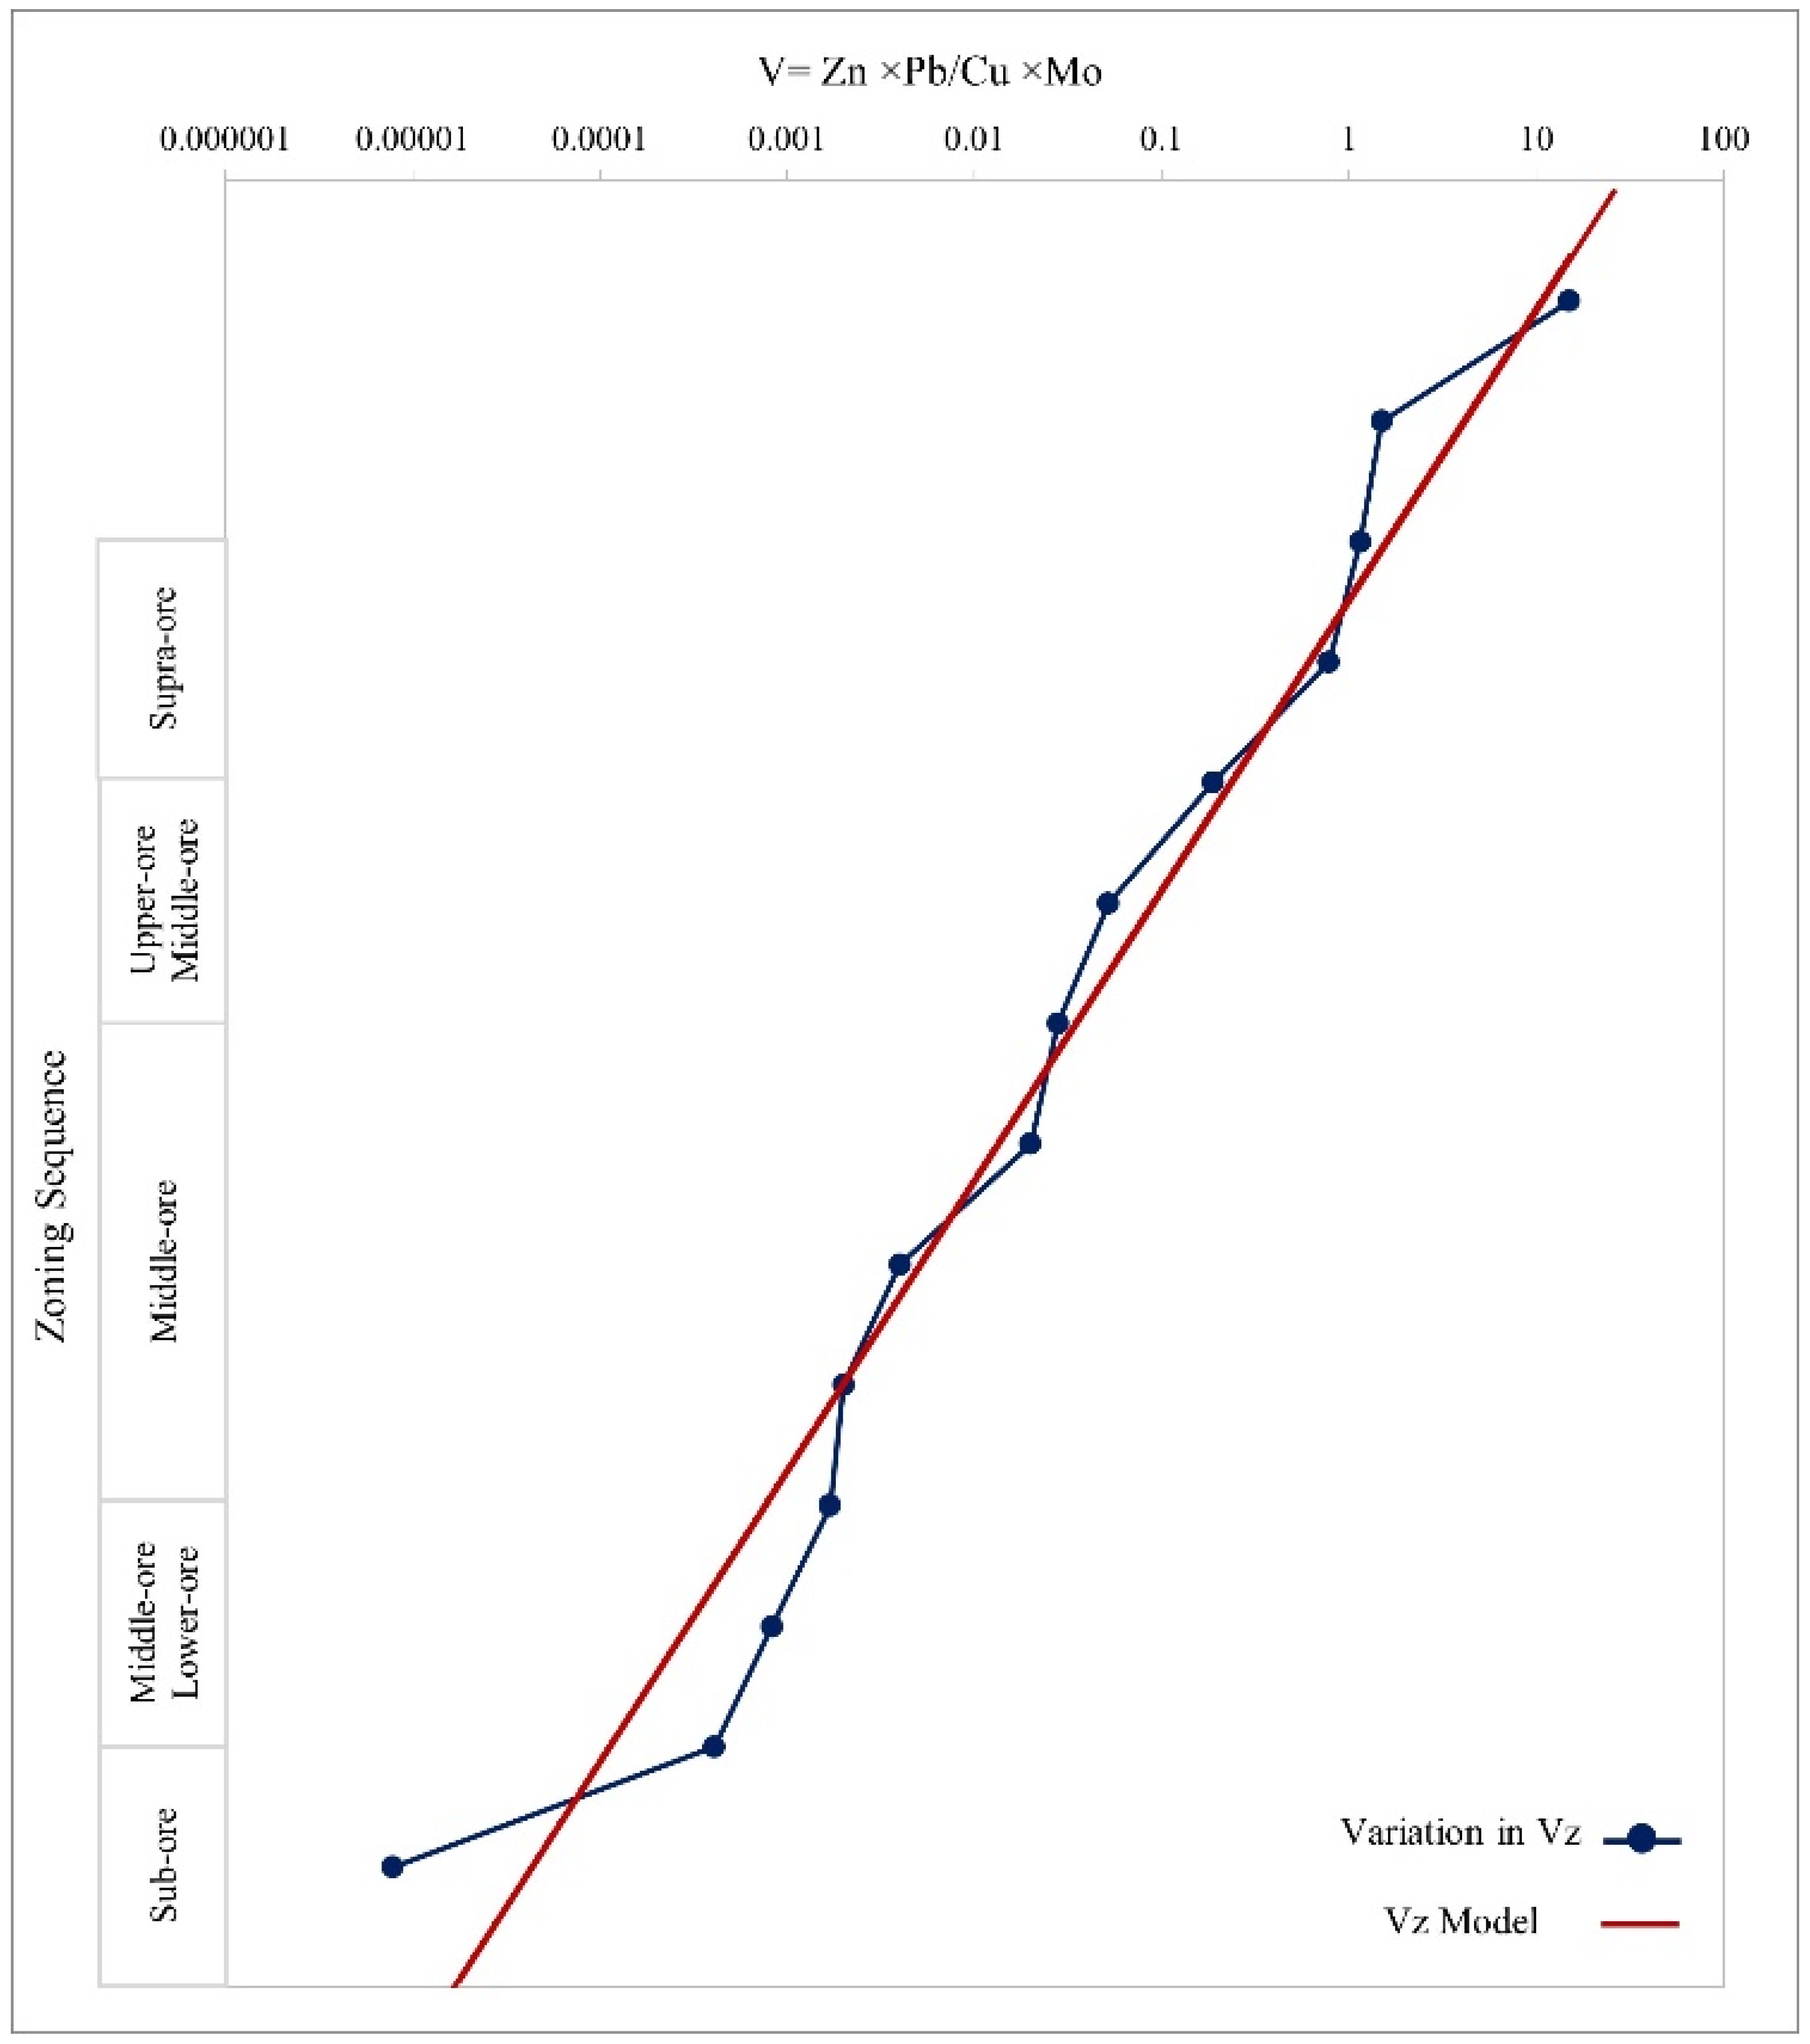
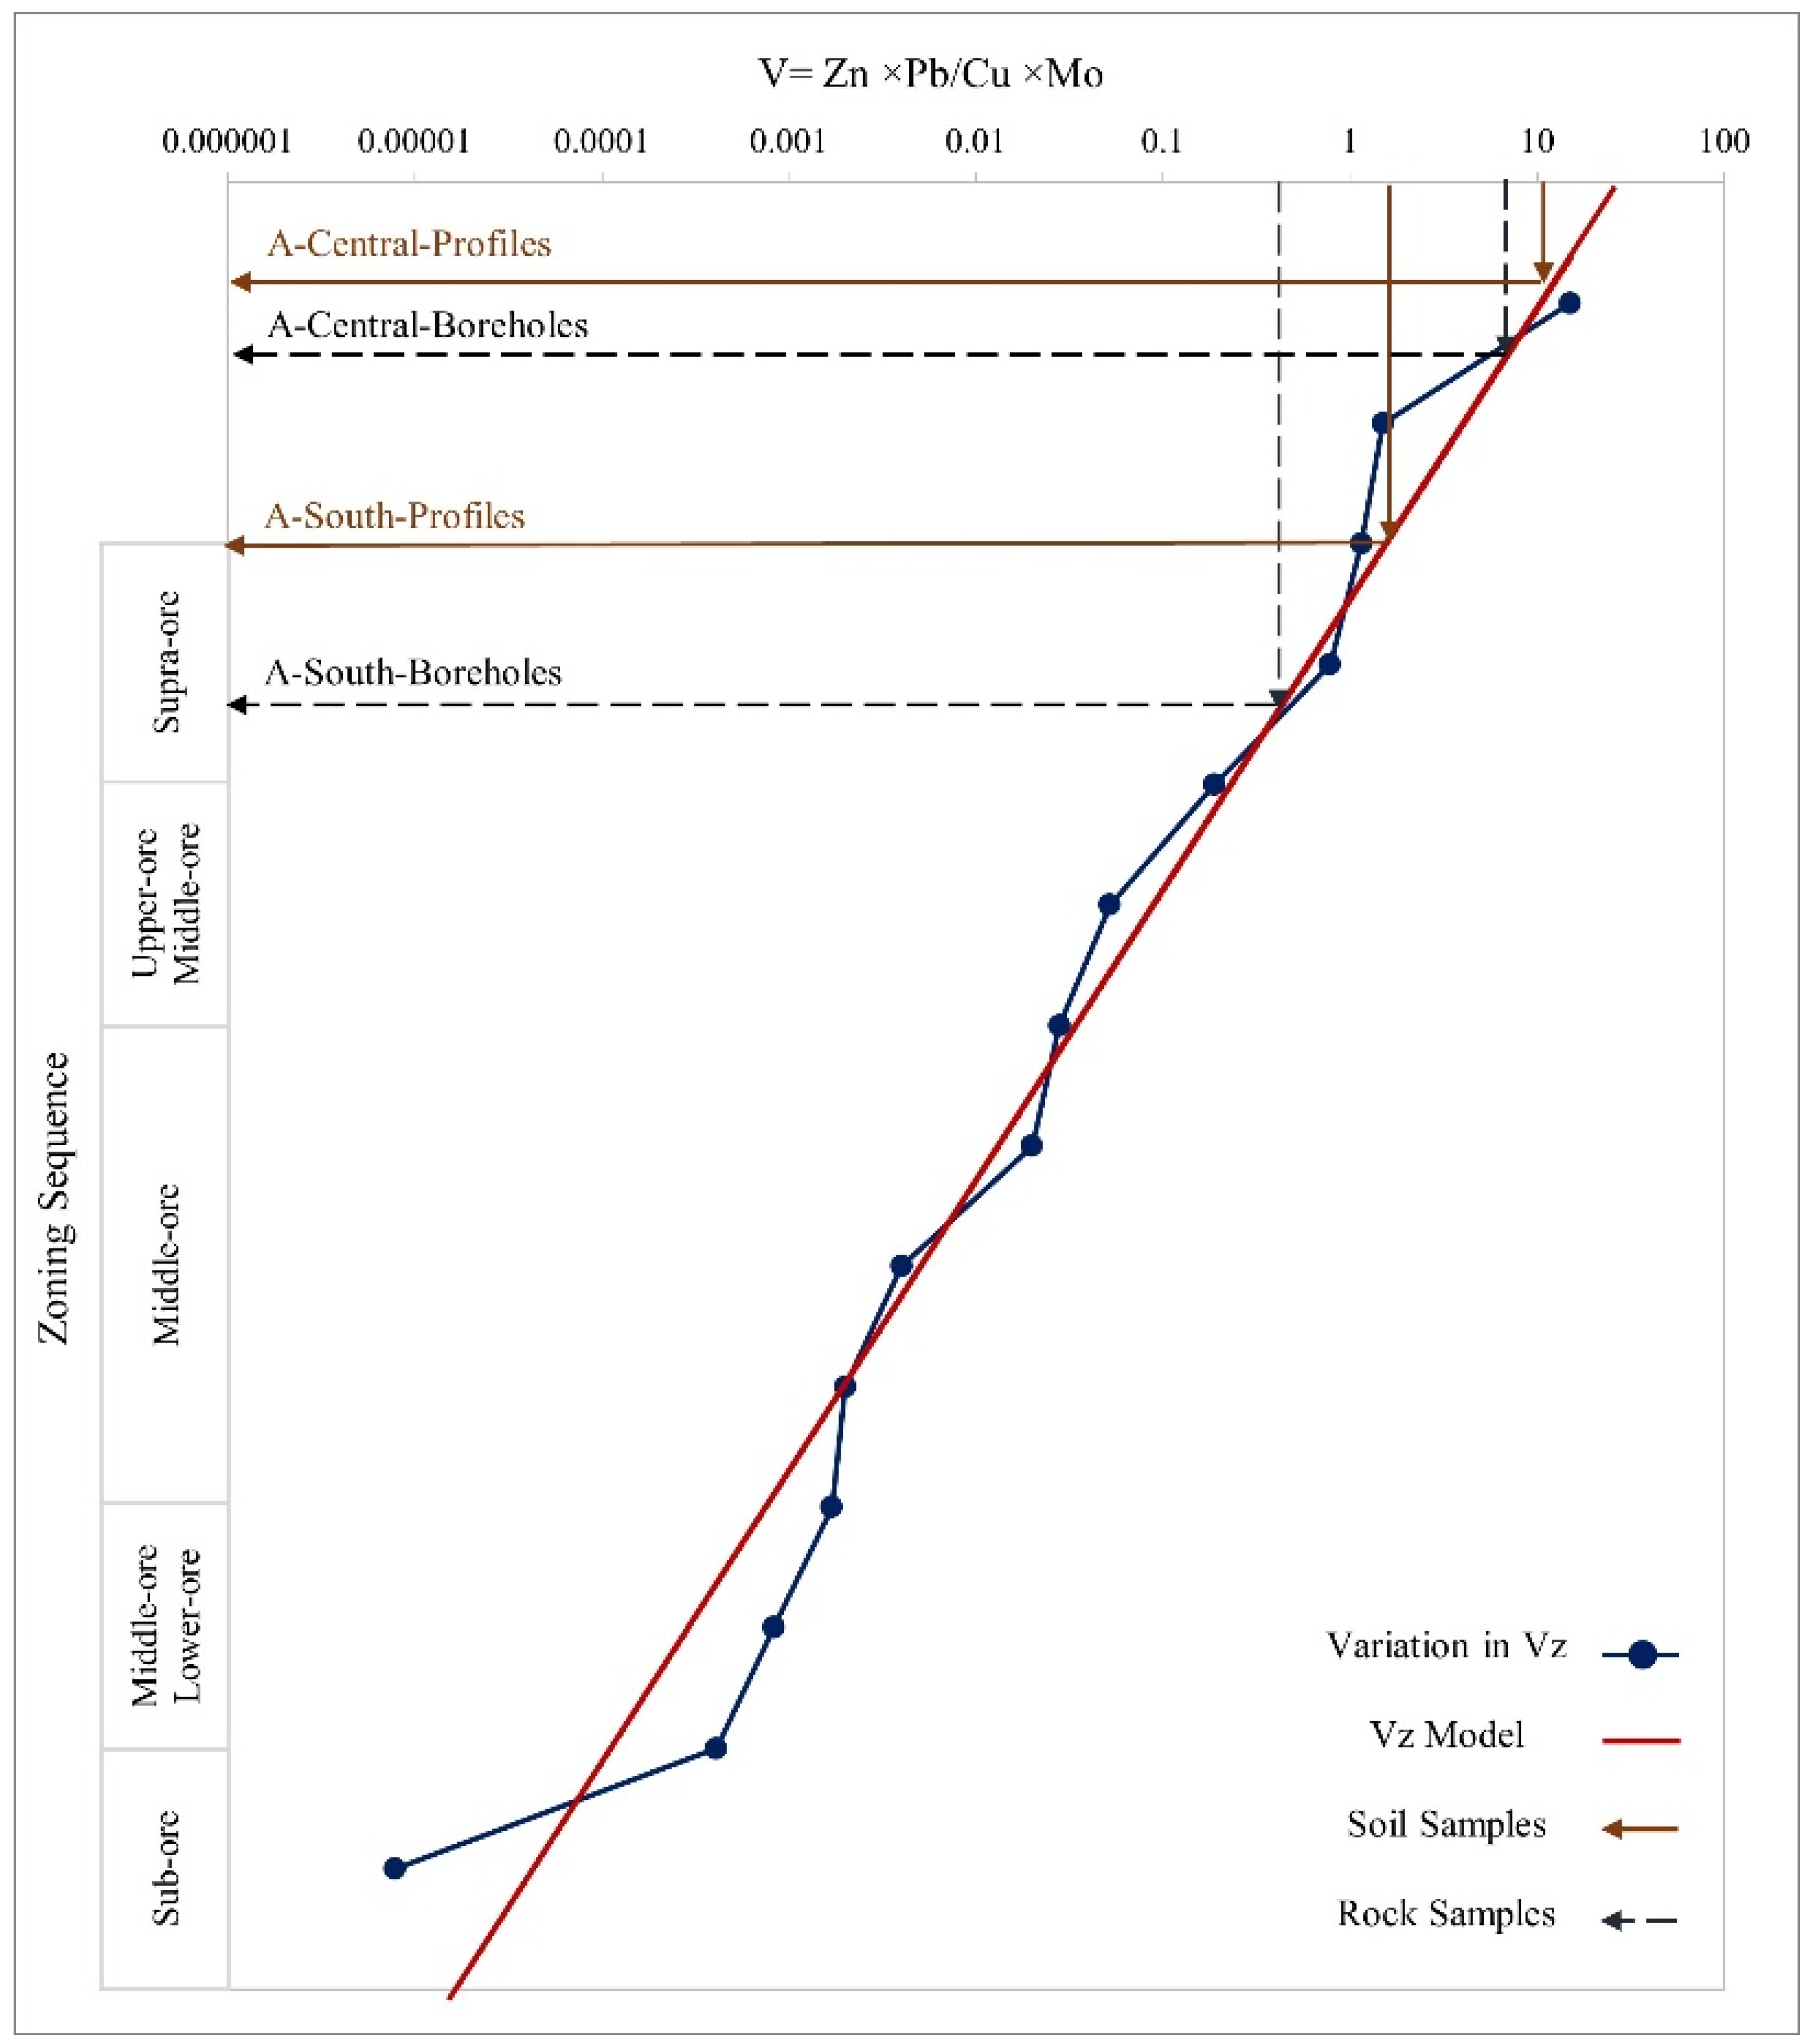
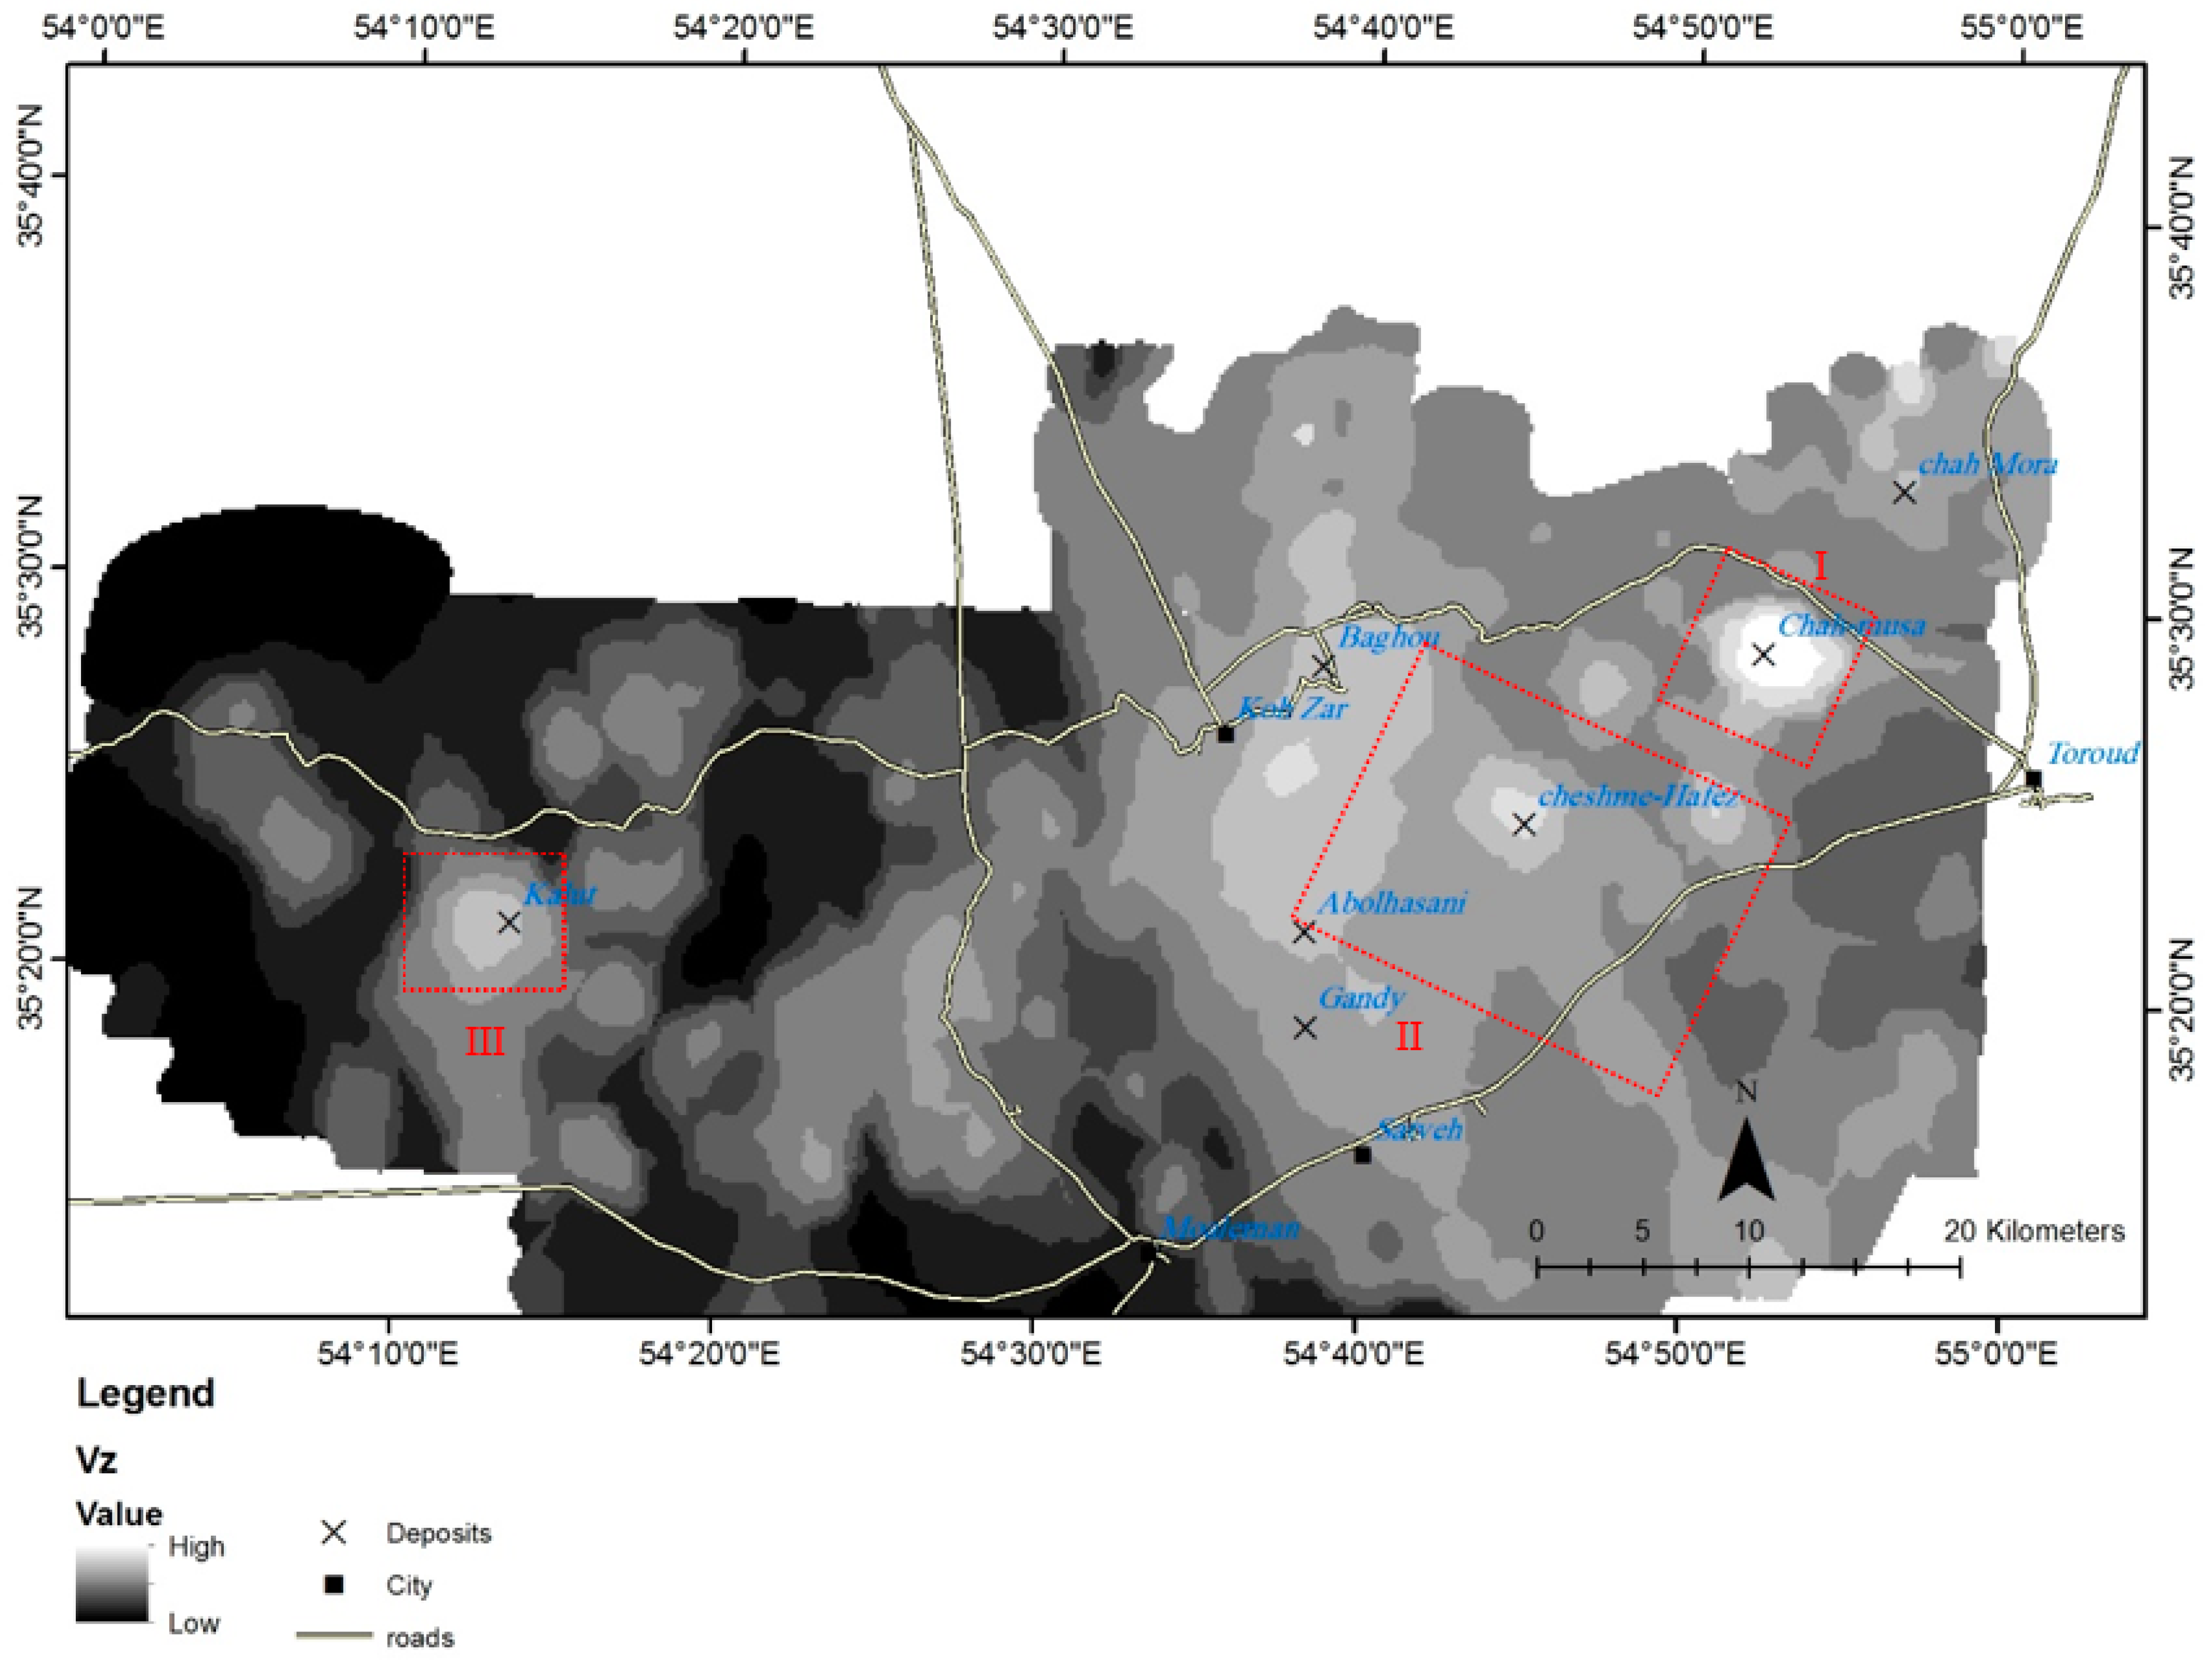
3.3. Vertical Geochemical Zonality Method

Kitaev [70] suggested a multidimensional geochemical field study built on the concept that geological space is comprised of geochemical fields signifying the zonality of element associations. This study considers the dispersion of elements to separate multielement anomalies according to Vz values. Grigorian [4] demonstrated that patterns of Vz around exposed deposits are different from patterns of Vz associated with blind deposits. Recognition of the zonality of geochemical haloes associated with blind deposits can be attained by four corresponding analyses [10]: (i) analysis of element associations representing supra-ore and sub-ore haloes of deposits; (ii) analysis of a single component, implying a false anomaly; (iii) analysis of mean values of indicator elements outside significant geochemical anomalies to eliminate background noise; (iv) mapping of multiplicative geochemical anomalies (i.e., Vz coefficients). The geochemical zonality coefficients for the assessment of the anomalies are derived through investigation of the primary geochemical haloes of typical standard deposits. In most cases, residual secondary soil haloes are correlated in composition and structure with the ore bodies and primary haloes which have produced them. The fruitful application is linked to the landscape–geochemical situations in the ore zones. The universal model for discovering blind mineralization and determining the erosional level is according to three criteria: (i) contour zoning [3,4], (ii) natural field of geochemical associations [71], and (iii) metallometry [35,50].
Based on the average contents of ore elements from big data analytics, the Vz values are calculated and converted into the zoning sequence of geochemical haloes. They are interpolated along the averaging line. Therefore, the geochemical zonality model is constructed. This model is used to assess geochemical anomalies. This model adopts a correlation among vertical zonality coefficient and depth of mineralization response. While the Vz was established initially for the study of lithogeochemical data [70], Grigorian [4] has confirmed that it could be executed using stream sediment geochemical data to study the erosional surfaces of multiplicative anomalies signifying different erosional levels of mineral deposits [4]. Therefore, efficacious identification of anomalous erosional surfaces is allied to the landscape situations of mineralized zones.

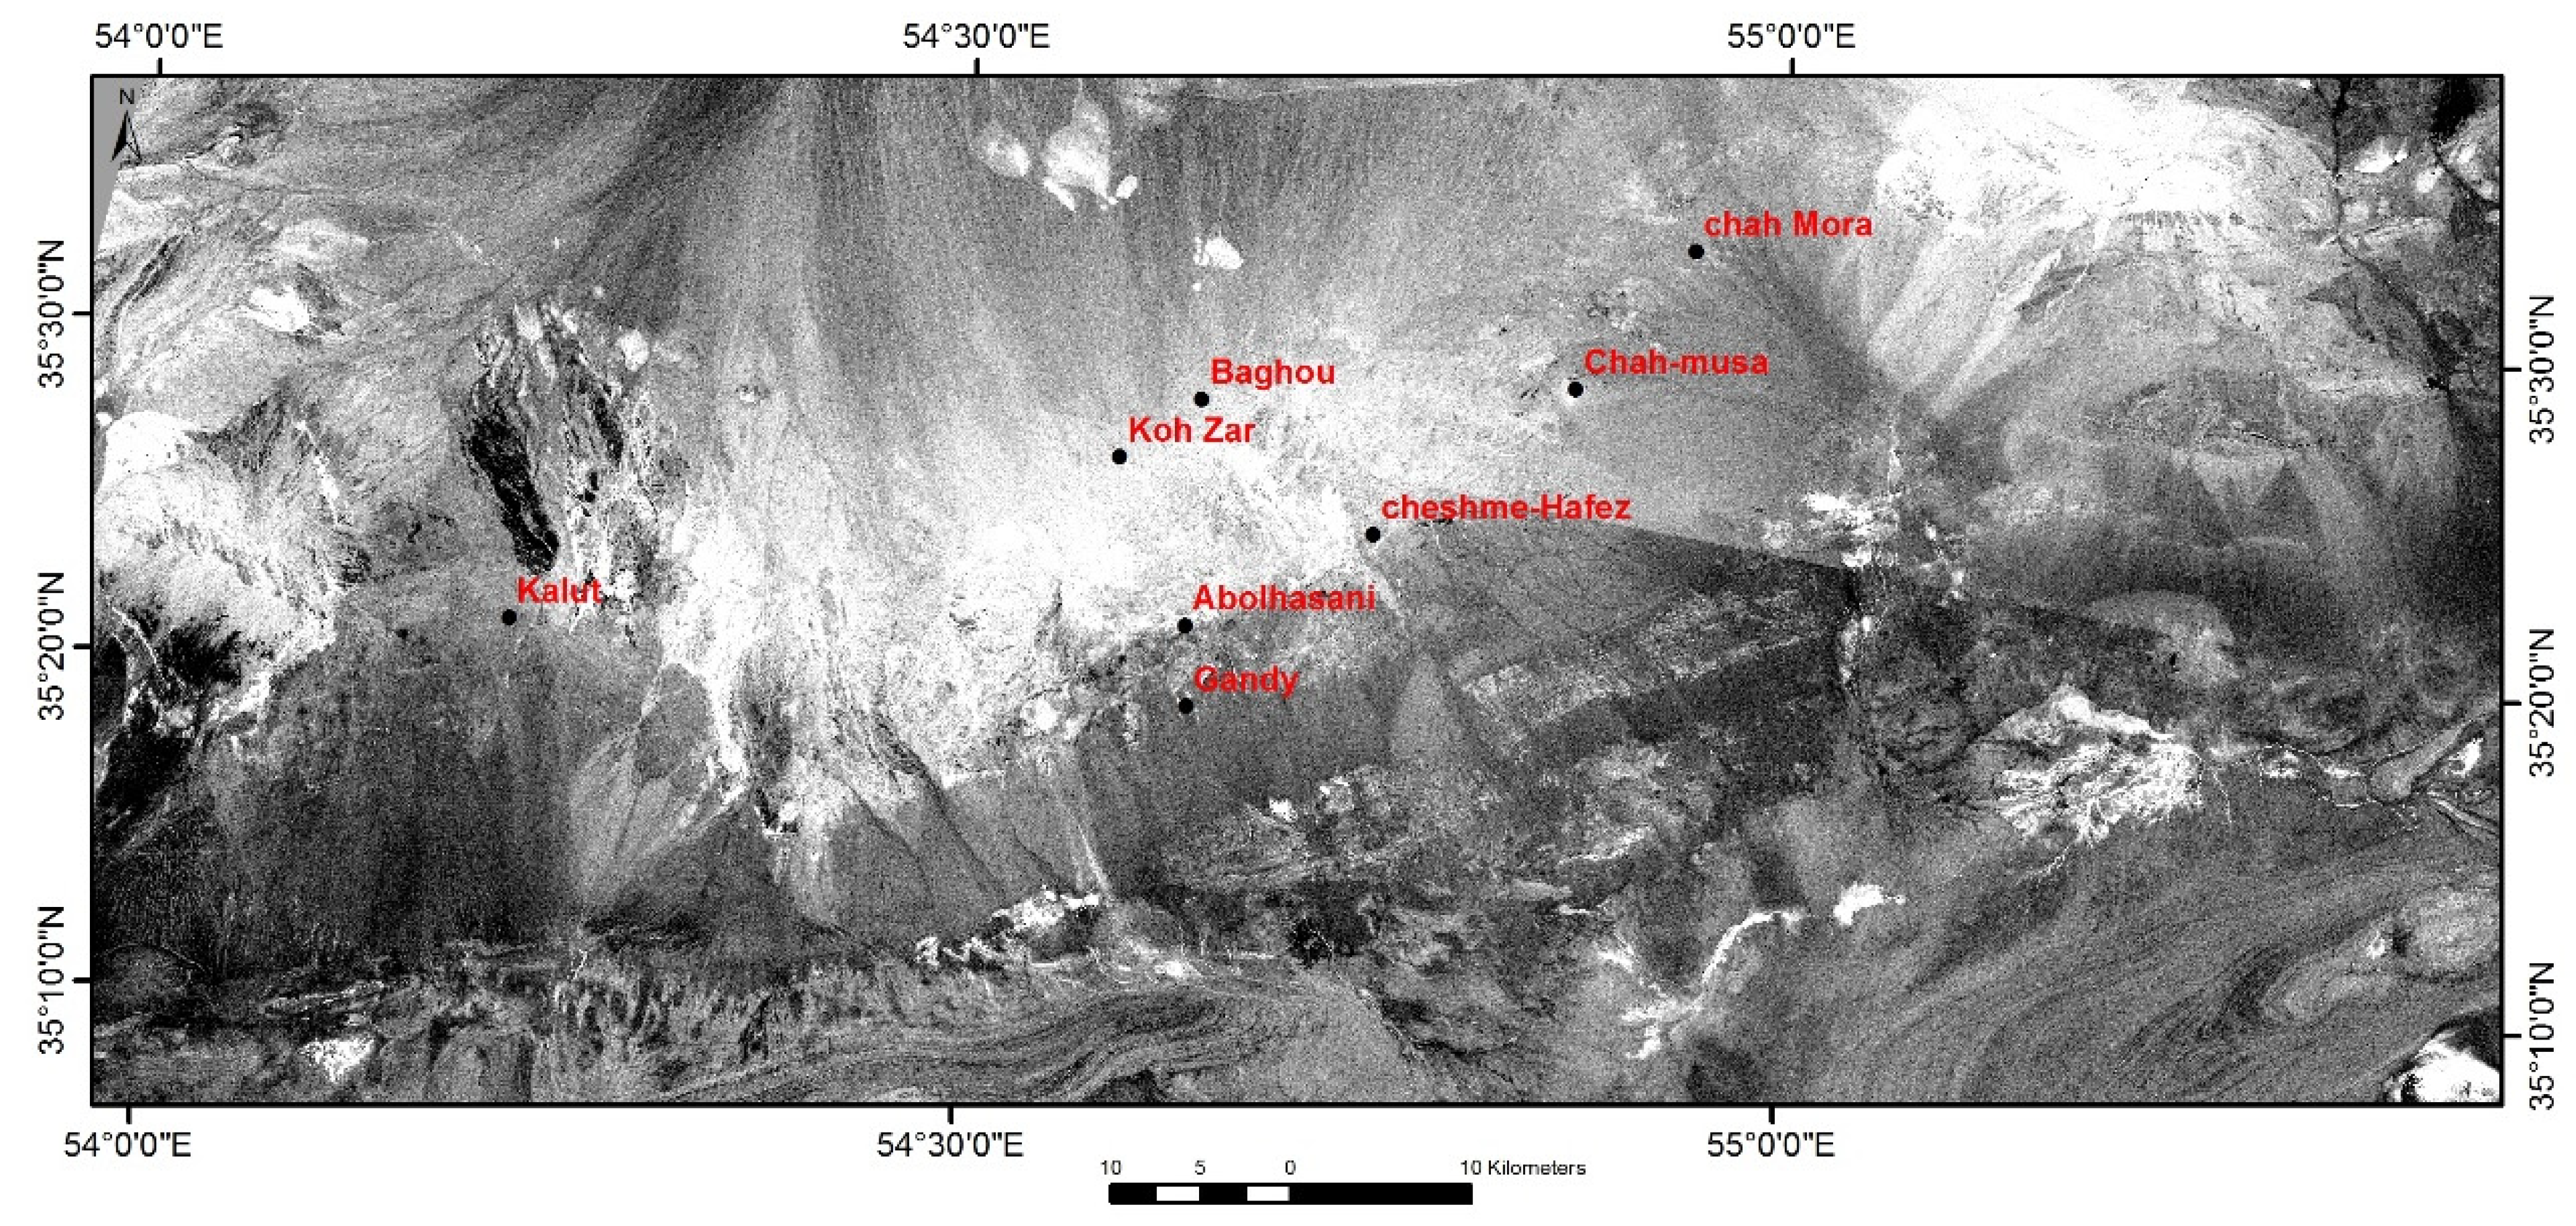
3.4. Remote Sensing Data

The system of hydrothermal ore formation was fundamentally expressed by the analysis of the composition and physicochemical properties of ore-bearing solutions, sources of ore components and ore-forming fluids, and the conditions and mechanisms of ore deposition [72]. The origin of hydrothermal solutions that take part in the formation of most commercial base metal deposits is one of the most important and complicated problems of the model of ore formation. Remote sensing methods are based on the theory of hydrothermal alterations. Remote sensing data are successfully used for mapping hydrothermally altered rocks by virtue of their spectral signatures [73,74,75]. Porphyry copper deposits are characteristically associated with hydrothermal alteration mineral zones, such as gossan, argillic, phyllic, and propylitic [73,76]. Iron oxide minerals (e.g., limonite, jarosite, and a hematite called gossan) show spectral absorption features in the visible to near infrared (0.4 to 1.1 μm) region [77]. Hydroxyl-bearing minerals, such as clay groups, sulfate minerals, and carbonates, represent spectral absorption features in the shortwave infrared (2.0 to 2.5 μm) region [77,78]. Previous studies have confirmed the proficiency of multispectral remote sensing sensors (e.g., ETM+ and ASTER) to map the hydrothermal alterations in minerals and zones associated with copper mineralization [79,80,81,82].

3.4.1. Landsat ETM+ Data Characteristics, Preprocessing and Processing Techniques

Since July 1999, the Landsat ETM+ multispectral sensor onboard the Landsat 7 satellite has obtained images of the Earth’s surface in eight bands. It identifies spectrally-filtered radiation in visible and near infrared (VNIR), short wave infrared (SWIR), longwave infrared (LWIR), and panchromatic bands. It has a 183 km swath width and orbits at an altitude of 705 km. Landsat 7 collects data in accordance with world-wide reference system (WRS), which has cataloged the world’s land mass into 57,784 scenes, each 183 km wide (E–W) by 170 km long (N–S). An ETM+ scene has spatial resolution of 30 m in bands 1–5 and 7 while band 6, thermal infrared (TIR), has a 60 m spatial resolution, and band 8 has spatial resolution of 15 m. In this research, ETM+ image level L1T (Pass 162 and Raw 35) of one scene covering the TCS belt and (date of acquisition 20 July 2000) was used. These data were corrected radiometrically and geometrically.

Principal Component Analysis (PCA)

PCA is a multivariate statistical method which is extensively utilized to diminish the dimension of input data; furthermore, the possibility of useful data loss is minimized. PCA finds a set of linearly uncorrelated components called principal components (PCs) [83,84]. PCs are the projection of input data onto the principal axes or eigenvectors. The output components are arranged based on the variance, in descending order. The PCA builds up a new set of axes orthogonal to each other, and each component is orthogonal to the preceding component [85].
Implementing PCA to map alterations in minerals using multispectral remote sensing data was suggested by Prado and Crosta [86]. The PCA converts the original dataset into a considerably smaller and easier-to-interpret set of uncorrelated variables. The main objective is to eliminate redundancy in multispectral data and extract useful information. PCA is extensively used for mapping hydrothermal alteration minerals associated with ore mineralization in the metallogenic provinces [82,87,88,89]. This method is worthwhile for multivariate datasets, such as multispectral satellite images, with the tenacity of emphasizing spectral responses associated with specific hydrothermal alteration minerals [90]. The number of output PCs is equal to the input spectral bands. However, a small number of PCs deliver significant information about the dataset. Certain spectral bands are designated which comprise absorption and reflection features of alteration minerals. Thus, a new image (PC) is produced on the axes with the new coordinate system [90,91]. The resulting PC (final image) is usually more intelligible compared to the original images.
A PC image comprises the distinctive involvement of eigenvector loadings (magnitude and sign) for the absorption and reflection bands of alteration minerals. The image tone will be bright if the loading is positive in the reflective band of the mineral, and the image tone will be dark for the enhanced target mineral if it is negative [91]. The PCA technique has been successfully implemented with ETM+ and ASTER multispectral data for highlighting spectral responses allied to particular hydrothermal alteration minerals accompanying porphyry copper deposits [75,79,80,82,86,87,88,92,93]. In this analysis, for the ascertainment of an image that comprises information correlated to the spectral signatures of particular target minerals, normal data distribution was assumed, and the covariance matrix was used to calculate the PCs. The eigenvector loadings in each PC image were examined. A PC with significant loadings, which shows an analogous trend to the spectral features of the target alteration minerals, is deliberated as a proper component for identifying the target zones. In this study, PCA was implemented to six ETM+ spectral bands for mapping iron oxides/hydroxides and clay minerals.

3.5. Machine Learning Algorithms

Machine learning algorithms have recently received remarkable attention for geochemical anomaly recognition, especially for multi-formational geochemical anomalies and data integration [94]. Machine learning is a field of artificial intelligence that trains an algorithm to wisely find features and patterns hidden in large amounts of data in order to make decisions or predictions based on new data. Machine learning is able to calculate nonlinear and complex patterns even when deprived of a prior hypothesis that the data follow a known multivariate probability distribution [95,96]. Both positive and negative samples are required to train supervised machine learning algorithms for geochemical anomaly identification. The sites of the documented deposits are considered positive training samples; however, not all selected negative samples are true non-deposit sites [96,97].

Random Forest (RF)

Random forest (RF) is a supervised machine learning method that has been used in geochemical exploration and data integration. This method is an ensemble algorithm that demonstrates an extension of classification and regression trees. It could be utilized to categorize or expect the rate of a target variable built on a quantity of evidential variables [55]. Using the tree structure, the RF algorithm partitions diverse samples with corresponding labels at leaf nodes of ensemble trees [57]. It is consecutively executed from a root node to a terminal node (leaf) to make recurrent predictions [55,98].
The basic classifiers in the RF method are classification and regression trees, which utilize a bagging system to determine that training subsets are casually selected, with each subset forming a decision tree [99]. The bagging system means that nearly one-third of the accessible training samples are not utilized in the building of RF trees; instead, they are utilized to certify the expectation accuracy (also called ‘‘out-of-bag’’ (OOB) samples). The OOB error is a balanced evaluation of the simplification error during RF analysis [96]. The evidential variables utilized for each node in the decision tree are also unsystematically selected. The result of RF modeling is related to the mediocre expectation of all trees convoluted in the model [55]. The RF algorithm starts by dividing parent nodes (i.e., evidential features) into binary portions, where child nodes are purer than the parent node. Examining all of the splits produces optimal splits that amplify the ‘‘purity’’ of the resulting trees. The RF algorithm utilizes the Gini impurity index to compute the information purity of child nodes equated with their parent nodes, with dividing thresholds calculated from the extreme decline in purity rates [98]. This dividing process is reiterated until a halt circumstance is obtained [55].
The RF algorithm as a nonlinear and nonparametric method is suitable for an extensive array of expectation delinquents and delivers adaptable prominence indices [100]. The key RF adaptable prominence indices include the “Gini importance” and the “Accuracy importance”. The first designates the change in “Gini gain” dividing criterion presented by each variable through classification. The second equates the expectation accuracy before and after a variable is arbitrarily permuted without changing the rest of the variables, and the difference in prediction accuracy is considered an index of the permuted variable. This measure deliberates the effect of each variable independently and the multivariate interactions with other variables. The elucidation capability of RF modeling is conducted using indices of variable importance. Variable importance indices have been popular for variable selection, but still there is irregularity when diverse sorts of predictor variables are utilized [100]. The variable importance ranking in RF based on diverse training sets delivers insights into evidence maps for MPM [57].
The benefits of the RF algorithm take in the bagging technique, which implicates unsystematic resampling and replacement, and produces diverse training subsets, which could successively be utilized to create decision trees. Therefore, the multiplicity inside the model is increased, and relationships among trees are avoided through the RF process. It permits excellent stability and prediction accuracy because some inputs are not utilized, escaping definite variations. Superlative evidential characteristics are utilized as dividing points to facilitate tree growth throughout the RF process. The unsystematic assortment of evidential characteristics is utilized as fragment of the whole set of input evidential characteristics. As such, it decreases relationships among trees and the simplification error inside RF models [55].

3.6. Properties of Geochemical Data

Secondary and primary geochemical dispersion zones are sampled and analyzed to identify geochemical patterns reflecting the primary geological structures in the Saghari deposit around the Chah-Musa deposit. A total of 233 samples were taken from 2 areas of the Saghari deposit (A-Central and A-South) at a local scale (see Figure 2). The soil samples were assayed using inductively coupled plasma–mass spectrometry (ICP-MS) and the concentrations of 34 elements were determined. Additionally, 12 exploratory drilled boreholes were excavated in the A-Central and A-South areas, and 146 samples were taken from these boreholes (sampling intervals of 5 m) using a chip-channel sampling technique. The rock samples were submitted to the laboratory for chemical analysis using ICP-MS and the concentrations of 32 elements were measured (see Figure 2). While all soil and rock samples were analyzed for 34 and 32 elements, respectively, only specific elements including Co, Cu, Mo, Pb, and Zn are discussed here.

3.7. Spatial Dataset

Various spatial databases have been obtained from of the Geological Survey of Iran (GSI). Spatial databases include (i) locations of copper deposits/occurrences, (ii) lithologic units from the 1:250,000 scale geological/structural map of Toroud, (iii) fault/fracture lineaments digitized from the 1:250,000 scale geological/structural map of Toroud, (iv) map of hydrothermally altered rocks extracted from ETM+ multispectral satellite data, and (v) stream sediment geochemical data (samples analyzed by the ICP method) related to the TCS belt. The geochemical data represent a total drainage basin area (i.e., sampling density of one sample per 2–3 km2). Software packages, including ArcGIS (version 10.8), and ENVI (version 5.6) were used for processing the spatial datasets in this research. Subsequently, the datasets were integrated using the RF algorithm in the R Statistical Environment (version R-4.2.2) for regional-scale prospectivity mapping of copper deposits in the TCS belt.

4. Analysis and Results

4.1. The Mineralogical and Geochemical Model

Big data consisting of the results of the analysis of lithogeochemical samples collected from copper deposits, ore occurrences, and associated lithogeochemical anomalies in Russia, Kazakhstan, and Armenia were used to construct the triple diagram with the following coordinates: Mo-Co-(Pb + Zn). On the diagram (see Figure 4), Cu-polymetallic deposits and ore occurrences are clearly distinguished (the vertex of the Pb + Zn triangle) as Cu-Mo and Cu-porphyry (Mo) and Cu-massive Sulfide and Cu-Ni (Co). Since the Clarks of the elements taken for classification are incommensurable, the components are introduced: 100 for Mo, and 10 for Pb and Co. Among Cu-Mo and Cu-porphyry forms (IV), Mo is the determining element, and molybdenite is one of the main minerals. Ores of Cu-polymetallic deposits (III), in addition to pyrite and chalcopyrite, contain galena and sphalerite, which makes it possible to attribute Pb and Zn to the elements whose increased contents determine this MGT. In the ore composition of Cu-massive sulfide (I) and Cu-Ni deposits (V), the role is played by Zn and Co, and by Co, respectively. The displacement of points 7 and 16 (see Figure 4), corresponding, respectively, to the Avangard and Kusmurun deposits (Kazakhstan) towards the vertex “Mo”, is due to its increased content in oxidized ores and association with iron hydroxides and the formation of ferrimolybdite [34,35].
The 3D MGT model was employed to clarify the relationship between the trace element contenst of lithogeochemical samples and the MGT of geochemical anomaly. Thus, the probability of MGT mineralization of lithogeochemical samples collected from the Saghari deposit was identified. The trace element contents of samples based on the coordinates (Mo-Co-(Pb + Zn)) of the model were plotted to identify their MGT. As shown in Figure 5, the placement of the soil samples collected from the A-Central and A-South areas towards the vertex “Pb + Zn” of the triangle determines the Cu-polymetallic MGT. Also, the placement of the rock samples collected from A-Central and A-South boreholes towards the vertex “Mo” of the triangle determines the Cu-porphyry MGT. The results show a multi-MGT anomaly superposition that is a combination of two MGTs: Cu-polymetallic and Cu-porphyry.

4.2. Vertical Geochemical Zonality Model

Based on big data containing the average contents of ore elements for Aktogay (Kazakhstan), Aidarly (Kazakhstan), Kyzylkia (Kazakhstan), and Sungun (Iran) deposits, the values of the vertical geochemical zonality coefficient (Vz) were calculated and converted into the zoning sequence of geochemical haloes. They are interpolated along the averaging straight line. Thus, the graph of the monotonous Vz was constructed in a linear scale along the ordinate axis (depth, m) and a logarithmic scale along the abscissa axis (geochemical zonality coefficient, Vz). The vertical variations in Vz (Pb × Zn/Cu × Mo) in ores and primary haloes associated with four porphyry copper deposits in areas of the same landscape–geochemical conditions in different countries (Kazakhstan, Iran) were shown in Figure 6. Despite the considerable differences in the local geological settings of individual porphyry copper deposits, falling the points on a straight line and decreasing downward the values of Vz indicate the existence of a quantitatively uniform vertical zonality in the primary haloes of the deposits [4,10]. Accordingly, vertical variations in values of Vz permit the discrepancy of mineralization levels and their primary halos (supra-ore, upper-ore, ore, lower-ore, and sub-ore) [4,35,49]. Furthermore, it can be realized from Figure 6 that similar values of Vz imply similar depths of mineralization and primary haloes. Therefore, primary halos of deposits at diverse depths are indicated by particular values of Vz. The importance of Vz is for the identification of erosional surfaces signifying vertical levels of geochemical anomalies. In other words, element data utilized as numerators of Vz signify supra-ore to ore element associations whereas those used as denominators demonstrate ore to sub-ore element associations. Concerning the present level of erosion, high values of Vz imply the presence of subcropping to blind deposits whereas low values of Vz indicate outcropping or already eroded deposits. The geochemical zonality model was used to emphasize that a recognized function (linear or nonlinear) is adequate to model the connections among the parameters of geochemical haloes and responses of the depth of mineralization [4].
The geochemical zonality model makes the erosional level assessment of any geochemical anomaly in a given MGT possible. This model was used to interpret the lithogeochemical samples in the Saghari deposit. Before the analysis of the anomalous patterns, their component anomalies should be reconstructed. These components must consider the following: (a) coexistence of two local maxima for supra-ore and sup-ore (this coexistence implies blind mineralization); (b) existence of a single component implies ZDM; (c) using mean value geochemical indicator elements, outside geochemical anomalies, for eliminating background noise in data interpretation; (d) the multiplicative geochemical anomalies and their spatial associations with particular geological features are essential aspects of mineral distribution for exploration and understanding ore geometry.
To evaluate the potential for the occurrence of blind mineralization associated with the anomalies, the values of Vz were calculated for lithogeochemical data. Based on calculations on the soil samples collected from the A-Central area and the model, blind mineralization (BM) was recognized. This anomaly has been tested by drilling five boreholes. As shown in Table 1 and Figure 7, the A-Central anomaly is promising for blind mineralization. According to the results of Vz for soil samples collected from the A-South area and the model, outcropping mineralization was identified. This anomaly has been tested by drilling seven boreholes. The obtained results of these boreholes and the model also demonstrated outcropping mineralization (Figure 7 and Table 1). Therefore, the geochemical zonality method within the A-Central and A-South areas revealed two geochemical anomalies including BM and outcropping. Furthermore, the field observations of the Saghari deposit (placed around the Chah-Musa deposit) have confirmed the results of the model.

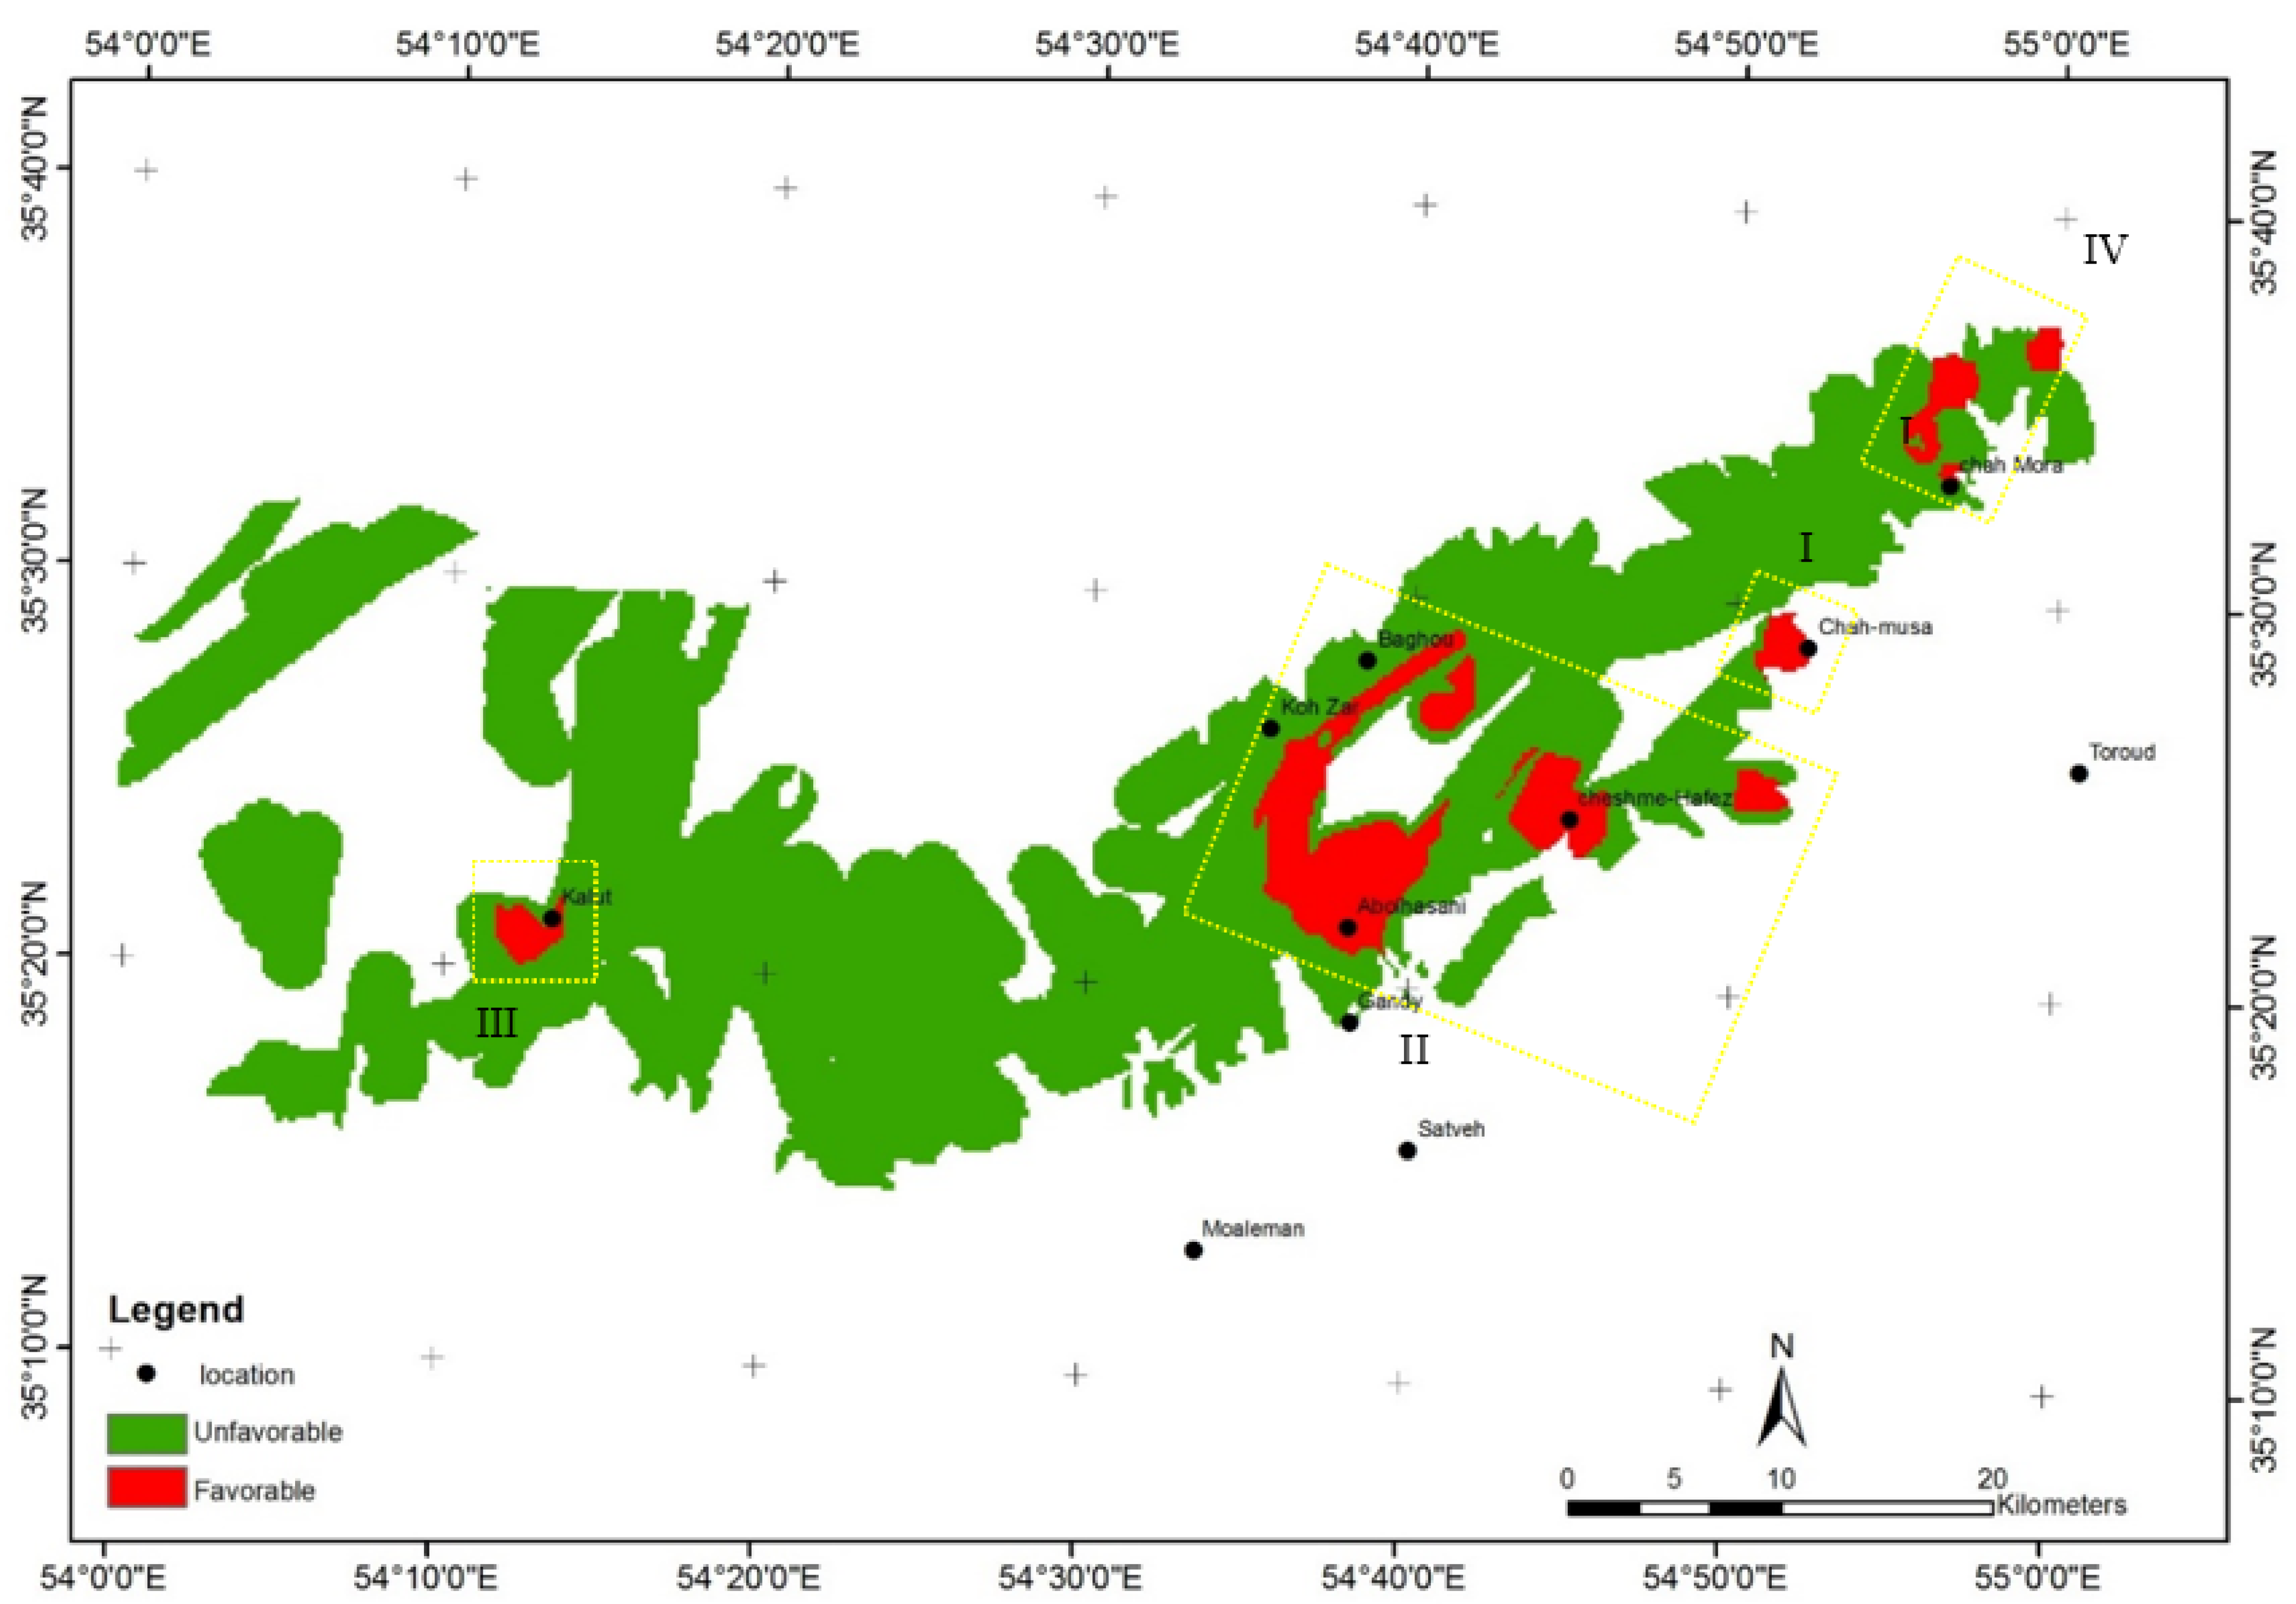
4.3. Mineral Prospectivity Mapping Model for Porphyry Copper Deposits

There is a main porphyry copper mine namely Chah-Musa deposit located close to the Saghari deposit (see Figure 1). The analyses characterized here intention to realize a provincial-scale answer to the question ‘‘Which fragments of the TCS belt have high potential for undiscovered porphyry copper deposits?’’. The answer will be provided according to the spatial associations of the documented porphyry copper deposits with evidential layers.

4.3.1. Spatial Evidence of Prospectivity for Porphyry Copper Deposit

The set of evidential layers includes the lithological map, the map of fault/fracture lineaments, the alteration map, and the geochemical map. The mining geochemistry-based models were used to optimize the evidential layers used in MPM. The mineralogical and geochemical types (MGTs), and geochemical zonality coefficient (Vz) of multi-elements around deposits and their spatial associations with specific geological, structural, and geochemical features are significant aspects that are valuable to consider in MPM. Based on the MGT model, the Saghari deposit was classified as a porphyry copper type; then, the alteration evidence layer was optimized. Additionally, Vz (Pb × Zn/Cu × Mo) was selected. Based on the geochemical zonality model, the Vz was used to optimize the geochemical evidence layer. Therefore, the spatial datasets utilized for predictive modeling of prospectivity for porphyry copper deposits in TCS included a lithological map, a map of faults/fractures, the locations of porphyry copper prospects and deposits (see Figure 1), an alteration map, and a map of multi-element geochemical anomalies (Vz).

Lithological and Structural Evidence

Six lithologic units were extracted from the 1:250,000 scale geological map of the TCS range (see Figure 1). This lithological map was used as input to the RF modeling. Analysis of the mineral system associated with the porphyry copper mineralization in TCS indicates that it is worth assessing the spatial association of the target variables (deposit and non-deposit locations) in terms of distances to faults. As such, fault/fracture lineaments were extracted from the 1:250,000 scale geological map of Toroud (see Figure 1); then, distance to fault/fracture was considered to create the fault/fracture evidential map. This evidential map was used as the input for the RF modeling (Figure 8).

Alteration Evidence

The PCA was applied to ETM+ spectral bands for extracting spectral signatures that reflect the existence of hydrothermally altered rocks associated with porphyry copper deposits in the TCS belt. The eigenvectors and eigenvalues for bands 1, 2, 3, 4, 5, and 7 of ETM+ were calculated. The eigenvector matrix of the selected ETM+ spectral bands is shown in Table 2. Several PC images were produced by running PCA. The specific PC images related to geological features were selected based on eigenvector loadings. For instance, iron oxide minerals, such as limonite, jarosite and hematite, have high reflectance within 0.63 to 0.69 μm (the equivalent to ETM+ band 3) and high absorption within 0.45 to 0.52 μm (the equivalent to ETM+ band 1). Clay minerals and carbonates show high reflectance in the range of 1.55 to 1.75 μm and high absorption in 2.08 to 2.35 μm that correspond with ETM+ bands 5 and 7, respectively [74,75,77,78]. Looking for alteration minerals, including iron oxide/hydroxides and clay minerals and carbonates, indicates that PC4 enhances the presence of iron oxide/hydroxides because it has high eigenvector loadings of different signs in bands 1 (0.401) and 3 (−0.593). Thus, the PC4 image shows iron oxide/hydroxides as dark pixels. PC5 enhances the presence of clay minerals and carbonates because it has strong eigenvector loadings of different signs in bands 5 (−0.50) and 7 (0.64). Therefore, clay minerals and carbonates are mapped as dark pixels in the PC5 image.
Because of the arid and mountainous landscapes in the TCS belt, it is unlikely that ore mineralized areas are strongly indicated by the existence of secondary iron oxide/hydroxides [45]. In contrast, outcropping porphyry copper deposits are mostly associated with argillic and phyllic alteration zones [43,45]. Thus, the image of PC5, possibly reflecting the presence of hydrothermal alteration zones associated with ore minerals, can be considered as an evidential layer of porphyry copper mineralization. On the other hand, according to the spectral characteristics of clay minerals and carbonates (i.e., reflection in band 5, absorption in band 7), the image of PC5 must be negated (i.e., multiplied by −1) to manifest hydrothermally altered rocks as bright pixels (Figure 9). This image reflects the spatial distribution of argillic and phyllic alteration zones in the TCS belt. Spectral anomalies of the altered rocks appear as bright pixels in Figure 9.

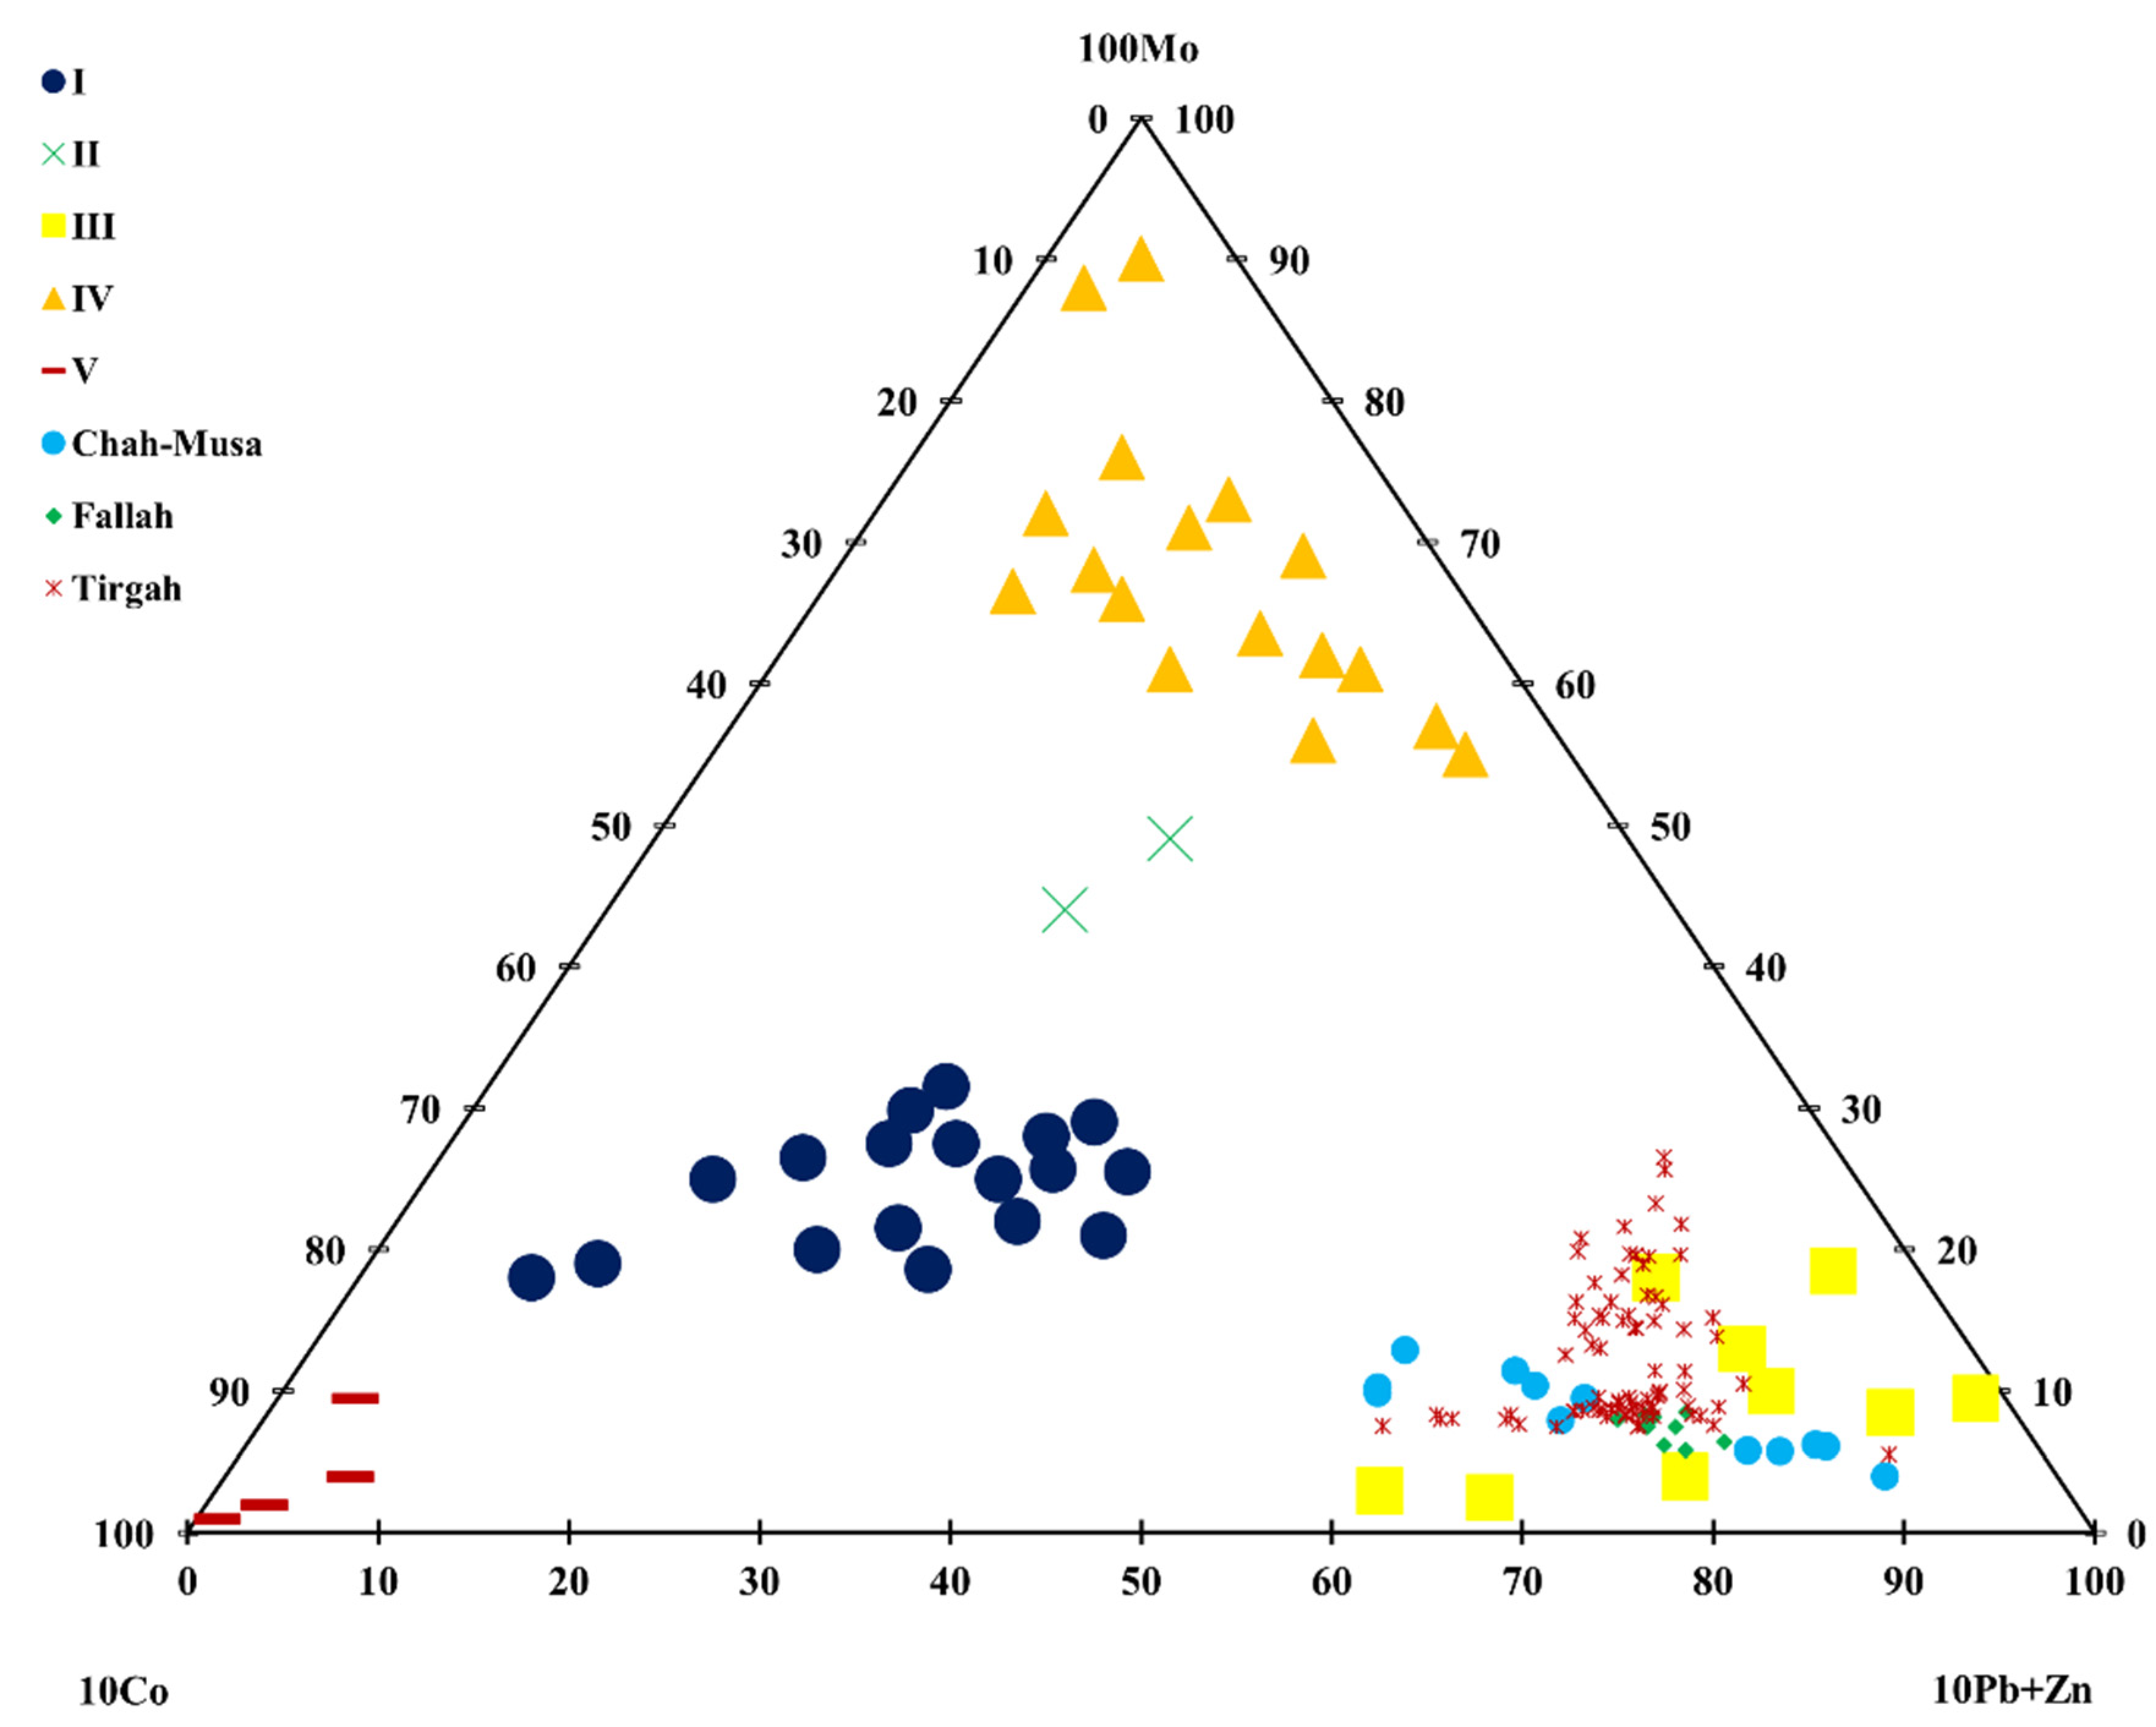
Geochemical Evidence

Multiplicative geochemical data of Pb × Zn and Cu × Mo were initially generated. The interpolated map of Vz was used as spatial evidence of porphyry copper prospectivity (Figure 10). The values in the interpolated Vz map were individually rescaled linearly to the range [0, 1]. High Vz values would suggest supra-ore to ore multielement anomalies accompanying blind to subcropping porphyry copper mineralization (Figure 10). With this hypothesis, the TCS can be segmented into three zones where possible porphyry copper deposits exist at diverse levels. Zone I can be considered as a potential zone for the exploration of subcropping to blind porphyry copper deposits, while the other zone could be a potential zone for the exploration of outcropping porphyry copper deposits.

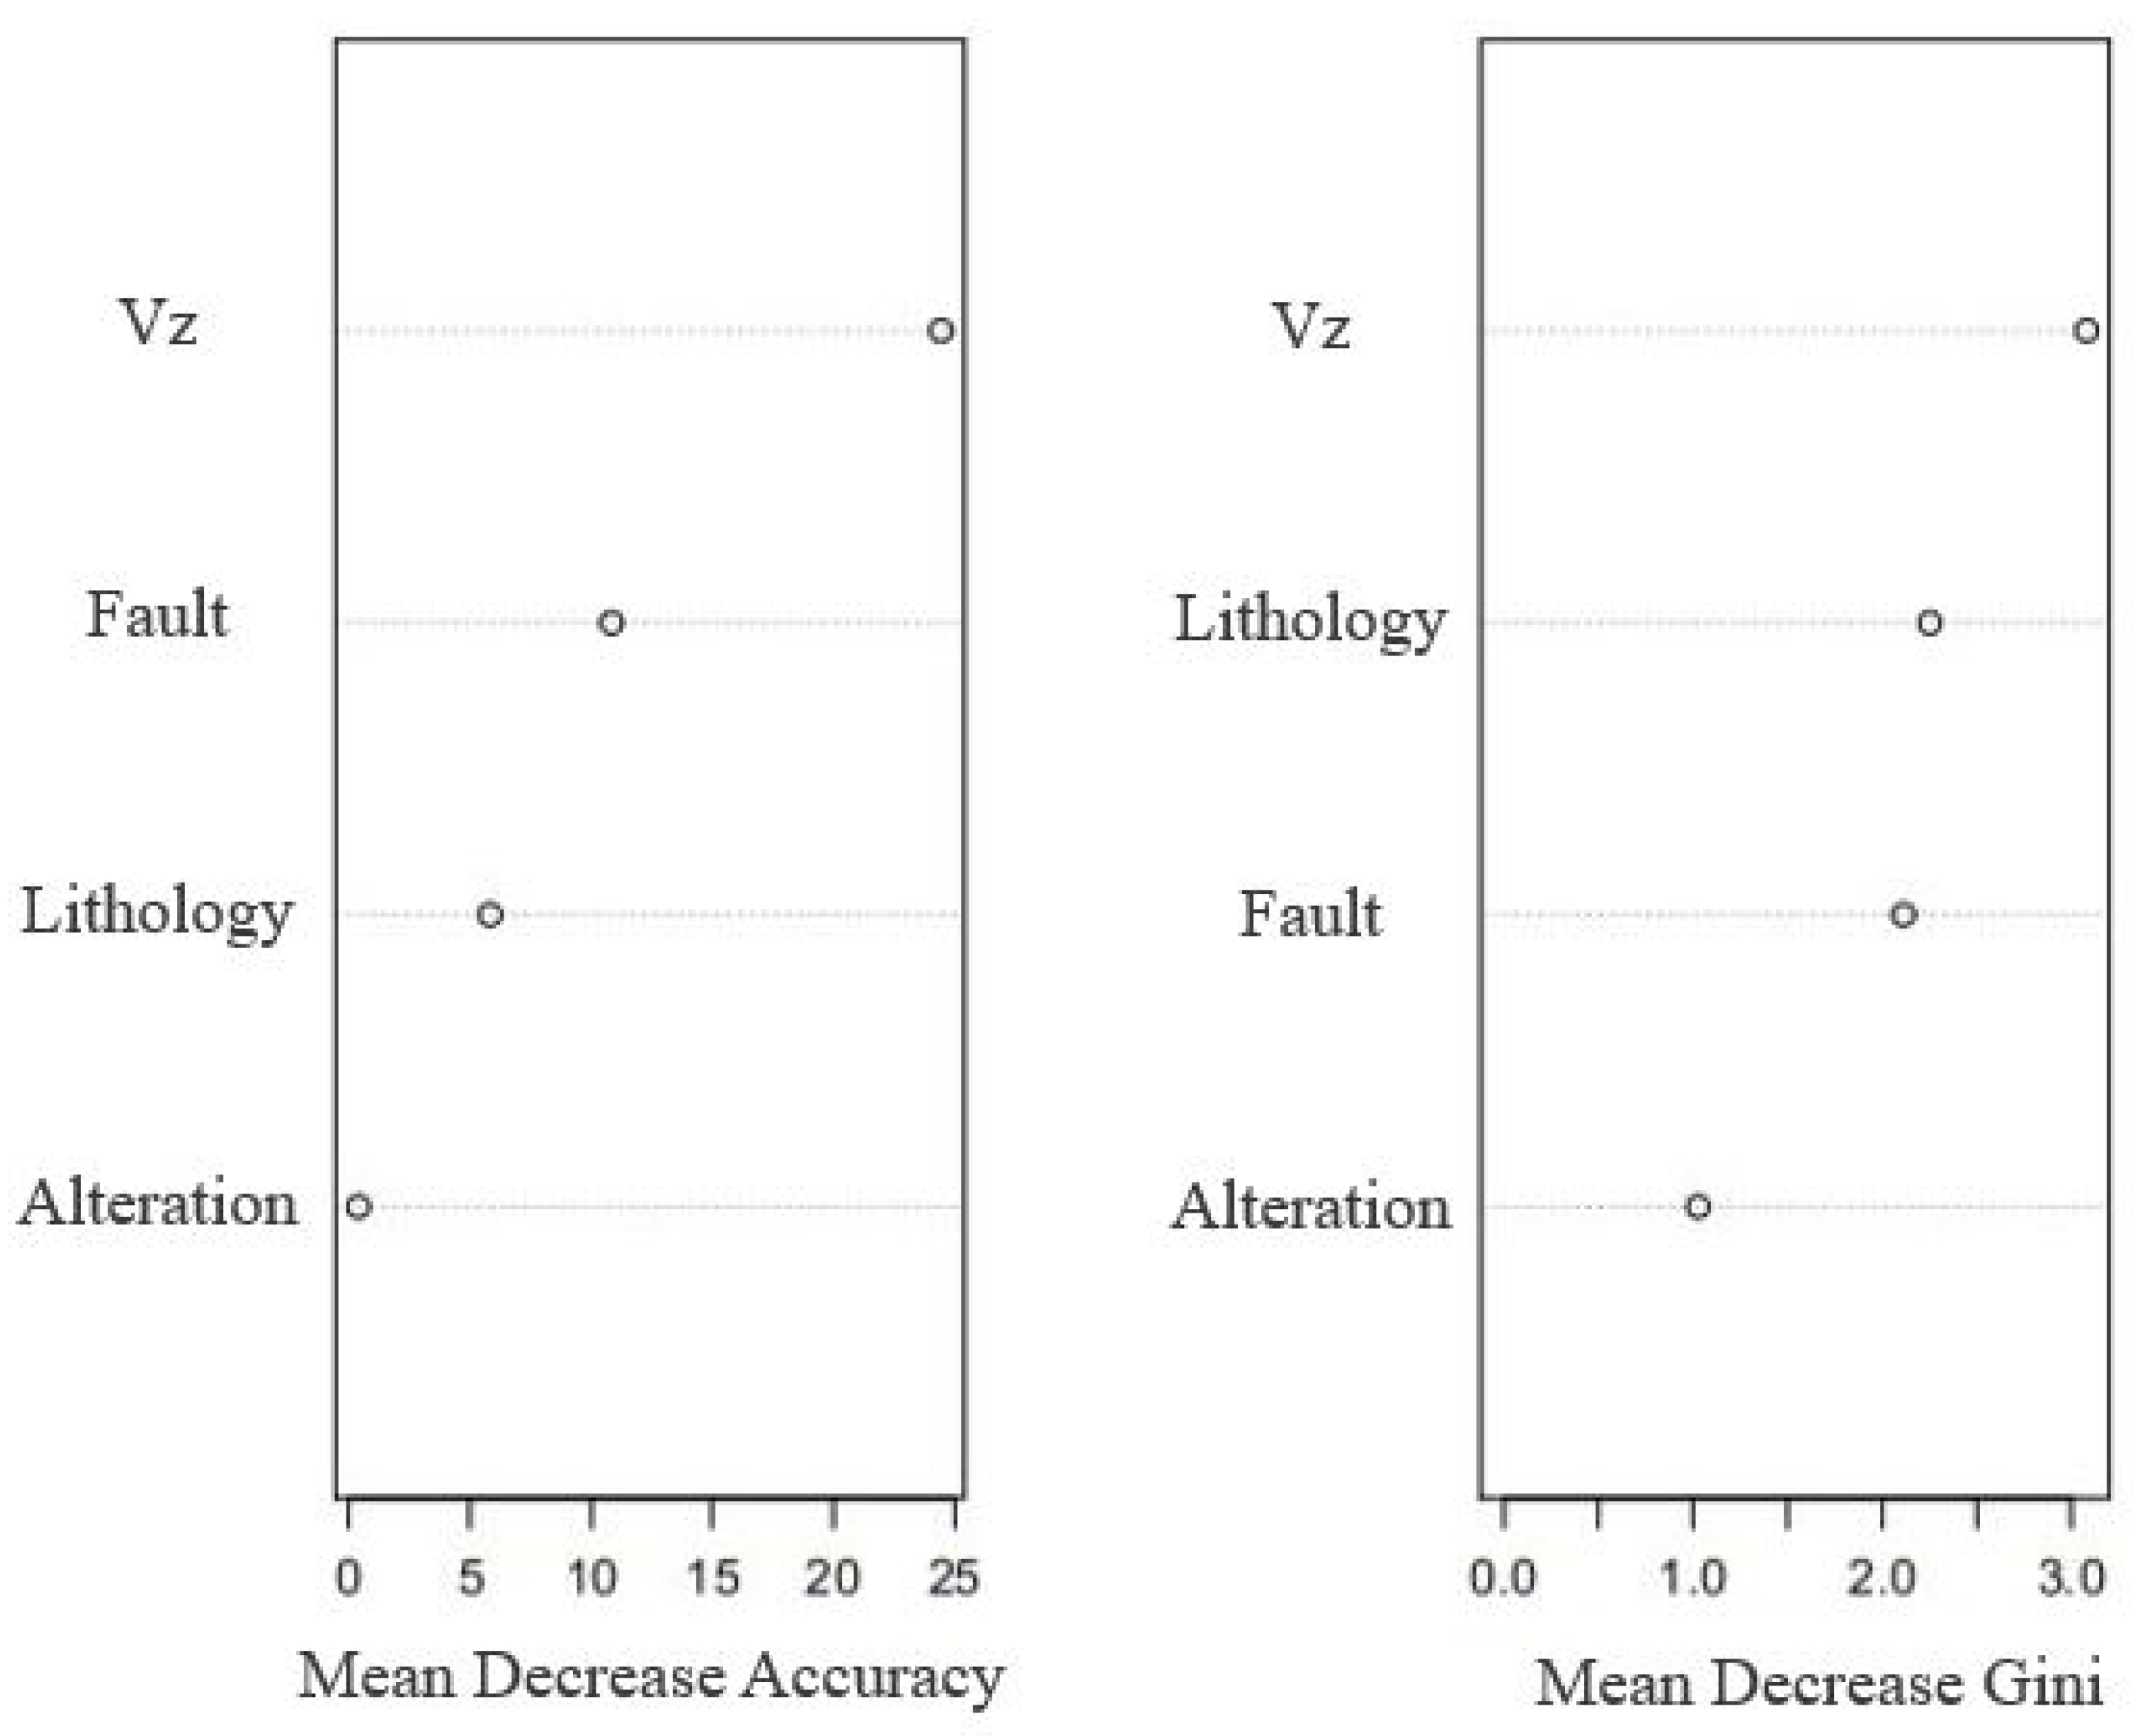
4.3.2. Integration of Evidential Layers Using RF Algorithm

The lithology, structure, alteration, and geochemical evidential layers were integrated using the RF algorithm for regional-scale prospectivity mineral mapping of porphyry copper deposits in the TCS belt. The RF package within the R statistical environment was used for the (MGT + Vz)-in-RF modeling to calculate the spatial associations of known porphyry copper deposits in the TCS belt with individual layers of spatial evidence [102,103]. The parameters of the RF model were the number of trees (k) and the number of evidential layers (m) that were arbitrarily sampled at each split. The m value can be experimentally determined by calculating the square root of the total number of evidential maps. Even though Breiman [98] and Liaw and Wiener [102] designated that an m value as low as 1 can yield accurate results, Gromping [104] described that the m value needs to include at least two evidential variables. Multiple experiments pointed out that the m parameter is constant with the empirical value mentioned above, and the minimum k value of 1000 produces both the lowest prediction errors and the most stable predictions. The appropriate rates of the parameters show that the RF algorithm will realize a fit among the targets (deposits and non-deposits) and evidential layers. The evidential layers input into the model can then be implemented to the model to calculate probabilities for all locations.
According to the results of RF analysis of spatial associations among the documented porphyry copper deposits and the individual layers of spatial evidence, the RF modeling generated a relationship between high-probability areas and areas showing documented porphyry copper deposits. The integration experiment was performed using lithological, structural, alteration, and Vz geochemical maps. The result of the experiment is referred to as the (MGT + Vz)-in-RF model.
Based on (MGT + Vz)-in-RF model, there seem to be four subareas of high potential zones that warrant further exploration (Figure 11). Subareas II, III, and IV could be favorable principally for exploration of outcropping porphyry copper deposits, while Subarea I could be favorable for the exploration of blind to subcropping porphyry copper deposits. Actually, prior to the organization of this this manuscript, blind porphyry copper mineralization was intersected by borehole exploration in Subarea I.
The RF algorithm similarly rates the significance of evidential variables using mean decrease accuracy and mean decrease Gini indices (Figure 12). The first index reflects the decline in accuracy in the whole model using out-of-bag (OOB) data, whereas the second index computes the average gain of purity by using splits of a given variable. The results of both indices indicated that the most important evidential map was Vz. The geochemical evidential layer (i.e., the Vz map), compared to the three geological evidential layers (lithology, Fault/fracture lineaments, and alteration), had stronger spatial associations with the known porphyry copper deposits in the TCS belt (Figure 12).
Although the geochemical evidential layer represents stream sediments, which are materials transported away from their sources, whereas the geological evidential layers represent in situ materials like the mineral deposits under examination, the Vz map, compared to the other geological evidential maps, provided better spatial evidence of porphyry copper prospectivity. The Vz indices are able to reflect geochemical variations in vertical directions; in fact, it might be unrelated to mineral deposits. It is mainly essential if the geochemical zonality method is executed using stream sediment geochemical data, which characterize earth materials upstream from a sampling site. Faults typically show vital roles in porphyry copper mineralization [4]. In the TCS belt, faults and fractures structurally controlled porphyry copper mineralization [61]. Based on the mean decrease accuracy index, it was the second most important evidential variable.

4.3.3. Validation

Subarea I was investigated in this research. In Subarea I, the Saghari, Fallah, and Tirgah deposits are located around the Chah-Musa deposit. The Fallah and Tirgah deposits were used to validate the presented strategy (Figure 13). The Vz values of the Tirgah and Fallah deposits are 0.11 and 24.6, respectively. The Fallah deposit is promising for blind mineralization.

5. Discussion

It has been long recognized that the level of erosion, not just the ore-forming environment, influences the observed time and space distribution of metallogenic patterns [105,106,107,108]. The recent works on the TCS belt are related to depths of less than 100 m. Exploration of new concealed, deep, and economic resources is challenging because of the lack of in-depth geological information and the arid and mountainous geochemical landscapes. The Saghari deposit is located around the Chah-Musa deposit in the eastern part of the TSC belt. Geologic information about the Chah-Musa deposit is scarce despite its importance. As such, the recognition of geochemical patterns, including the spatial association of geochemical patterns, geochemical element associations, and geochemical anomalies related to mineralization is essential. This research demonstrated that the MGT and Vz models can be applied around the Chah-Musa deposit to recognize the mineralogical and geochemical types of the anomalies associated with copper mineralization, and evaluate anomalies (BM, ZDM, and outcropping) and their erosional surfaces.
The MGT model was established to discriminate five types of copper deposits based on trace elements of lithogeochemical samples using Big Data analytics extracted from 50 copper deposits in CIS countries. Supported by the testing set collected from the Saghari deposit (zone A), the performance of the MGT model shows that trace elements in lithogeochemical samples can be used to discriminate copper deposit types which cannot be distinguished from polymetal and porphyry deposits. Furthermore, these results further indicated that lithogeochemical samples of copper deposits carry unique geochemical features inherited from the ore-forming fluids. Hence, big data analytics can find some patterns to construct a well-behaved MGT model. The MGT model showed that the discrimination of copper deposit types is impacted by multi-elements in lithogeochemical samples, while each element has different effects on the discrimination. According to the big data extracted, several elements contributed to the research of lithogeochemical samples, including Mo, Pb, Zn, and Co. Mo is the determining element and molybdenite is one of the main minerals among Cu-Mo and Cu porphyry deposits. In addition to pyrite and chalcopyrite, Cu-polymetallic deposits contain galena and sphalerite, which makes it possible to attribute Pb and Zn to the elements whose increased contents determine this type. Zn and Co, and Co play an important role in Cu-massive sulfide and Cu-Ni deposits, respectively. The information extracted by big data analytics not only provided interpretations for classification results but also contributed to the understanding of their geochemistry.
For the first time, using the constructed MGT model, it has been proved that the MGT type of the Saghari deposit is a multi-mineralogical and geochemical type, namely involving polymetallic and porphyry copper mineralization. Metal associations in porphyry systems not only vary as a function of emplacement depth but also as a function of porphyry intrusion composition. Through time, uplift and erosion events variably destroy and subsidence and burial events variably cover these contrasting levels of the porphyry ore-forming environment. Moreover, cover can protect a porphyry environment from destruction by subsequent erosion. Therefore, the observed metal associations and distribution of porphyry-related systems is a complex reflection of the ore-forming environment, the level of erosion, and the extent of the cover of a porphyry system.
The zonality method resolves the problems of exploration for BM and identification of ZDM. The zonality model was established using the database of copper deposits in Kazakhstan and Iran and the Vz coefficient of porphyry copper (Pb × Zn/Cu × Mo) to assess the possibilities for the occurrence of blind mineralization associated with the anomalies around the Chah-Musa deposit. The results of mining geochemistry models using lithogeochemical samples determined that the Saghari deposit belongs to the polymetallic type (on the surface, oxide part) and porphyry copper type (at a depth, sulfide part).
The different alteration zones have not been categorized based on the MGT of anomalies for MPM and cannot differentiate BM from ZDM. These mining geochemistry models are able to identify the hydrothermal alteration zones associated with porphyry copper mineralization and to evaluate deep and buried ore resources. Implementation of the Vz model in mineral prospectivity permits further clarification about whether delimited potential areas are acceptable for exploration of outcropping or blind mineral deposits because the perception of the geochemical zonality method detects the discrepancy between sub- and supra-ore anomalies. This added-value information from Vz coefficients is vital in planning exploration projects. Nevertheless, integration of maps of Vz coefficients with other maps utilized as spatial evidence is imperative in filtering out false signals of mineral prospectivity represented in every layer of evidence. Although methods for GIS-based mineral prospectivity mapping are typically well established, it is essential to analyze which techniques of geochemical data processing produce anomaly maps that lead to optimum models of mineral prospectivity mapping. Random forest outperformed the other machine learning algorithms for data integration and MPM. In this research, for the first time, geochemical zonality anomalies instead of anomalies of pathfinder elements (e.g., Cu) were used as one of several evidential maps to construct MPM based on RF for porphyry copper mineralization in the TCS belt. Based on the results of mean decrease accuracy and mean decrease Gini indices, the Vz was the most important evidential map and had stronger spatial associations with the documented porphyry copper deposits in the TCS. The result showed the applicability of the (MGT + Vz)-in-RF for regional-scale prospectivity mapping of porphyry copper deposits. Our attempts can, thus, provide some inspiration for future research to apply mining geochemistry models using big data analytics and remote sensing data to optimize the evidential variables used in MPM.

6. Conclusions

  • A novel approach was accomplished in this study to optimize remote sensing-based evidential variables using mining geochemistry models for an RF-based copper mineralization prospectivity mapping (MPM).
  • The MGT and Vz models were applied around the Chah-Musa deposit to identify the MGTs of the anomalies related to copper mineralization, and to evaluate anomalies (BM, ZDM, and outcropping) and the erosional surfaces. The mining geochemistry models determined that the Saghari deposit belongs to the polymetallic type (on the surface, oxide part) and porphyry copper type (at a depth, sulfide part). The possibilities for the occurrence of blind mineralization associated with the anomalies around the Chah-Musa deposit were assessed. The hydrothermal alteration zones associated with porphyry copper mineralization (argillic and phyllic alteration) were identified using PCA on ETM+ spectral bands.
  • The random forest algorithm was applied to merge the evidence variables to develop a provincial-scale prospectivity map of porphyry copper deposits. Furthermore, a geochemical zonality coefficient (Pb × Zn/Cu × Mo) was used as one of several evidential maps to construct MPM based on RF for porphyry copper mineralization in the TCS belt. The result showed high applicability of the (MGT + Vz)-in-RF for mineral prospectivity mapping of porphyry copper deposits. This study explored buried copper deposits in the TCS belt through innovative approaches by integrating multi-source geoscientific datasets. The study contributes to the current efforts in searching for innovative and cost-effective methods for mineral exploration in mining sectors, and the approach can be used for MPM in metallogenic provinces around the world.

Author Contributions

Conceptualization, M.A. and M.Z.; methodology, M.A., M.Z. and A.B.P.; software, M.A.; validation, M.A. and T.T.; writing—original draft preparation, M.A.; writing—review and editing, A.B.P.; visualization, M.A., M.Z. and T.T. All authors have read and agreed to the published version of the manuscript.

Funding

This research received no external funding.

Data Availability Statement

Not Applicable.

Acknowledgments

The research was funded by the School of Mining, Petroleum and Geophysics Engineering at the Shahrood University of Technology, and Faravar Kanyab Gisoum Company. The authors are grateful to M. Ziaei, CEO of Faravar Kanyab Gisoum Co. (Shahrood, Iran), for useful suggestions which helped us to introduce a new branch of mining geochemistry. The School of Earth Sciences & Engineering, Tomsk Polytechnic University and Institute of Oceanography and Environment (INOS), Universiti Malaysia Terengganu (UMT) is also acknowledged for providing financial support and facilities for editing, rewriting, and re-organizing the manuscript.

Conflicts of Interest

The authors declare no conflict of interest.

Appendix A

I: Cu-Massive Sulfide (1. “50 years of October”, Southern deposit; 2. “50 years of October”, Central deposit; 3. “50 years of October”, Northern deposit; 4. Kizil Kibachi, Profile XIV; 5. Limannoye, Profile 60, 6. Vanguard, Profile XVIII; 8. Vanguard, oxidized ore; 9. Novo-Makanskoye, borehole 98; 10. Novo-Makanskoye, secondary scattering halo; 11. Tesiktas, ore zone I; 12. Tesiktas, ore zone III; 13. Tesiktas, ore zone IV; 14. Kusmurun, Profile III; 15. Kusmurun, Profile IV; 17. Kusmurun, oxidized ores; 18. Vlasinchikhnskoye, North, Caucasus; 19. kafan, depth 1040 m; 20. Kafan, depth 945 m);
II: Oxidized Cu-massive sulfide (7. Vanguard; 16. Kusmurun);
III: Cu-polymetallic deposits (21. Priorskoe, Profile VI; 22. Priorskoe, Profile X; 23. Sary-oba, North Mugodzhary; 24. Ayaguzskoe, East Kazakhstan; 25. Mizek, East Kazakhstan; 26. Kenkazgan; 27. “Ukolodtsa”; 28. Efimovskoe; 29. Shaumyan, Northern Armenia);
IV: Cu-Mo-porphyry deposits (30. Chatyrkul, Profile 41; 31. Chatyrkul, Profile 7; 32. Kounrad; 33. Sokurkoy; 34. Kaskyrkazgan; 35. Kenkuduk; 36. Koksay; 37. Aureolny; 38. Borly, 39. Kepcham; 40. Almaly, 41. Zhorga, 42. Stansiya, 43. Dalniy, 44. Kalmakyr, 45. Kajaran, 46. Agarak);
V: Cu-Ni deposits (47. Goryunsky, well, 11; 48. Komkor, Profile III; 49. Komkor, Profile IV; 50. Bakaiskoye, Mugodzhary) [34,35].

References

  1. Beus, A.A.; Grigorian, S.V. Geochemical Exploration Methods for Mineral Deposits; Applied Publishing Ltd.: Wilmette, IL, USA, 1977; 287p. [Google Scholar]
  2. Levinson, A.A. Introduction to Exploration Geochemistry; Applied Publishing: Wilmette, IL, USA, 1980; 924p. [Google Scholar]
  3. Grigorian, S.V. Secondary Lithochemical Haloes in Prospecting for Hidden Mineralization; Nedra Publishing House: Moscow, Russia, 1985; p. 176. (In Russian) [Google Scholar]
  4. Grigorian, S.V. Mining Geochemistry; Nedra Publishing House: Moscow, Russia, 1992; p. 310. (In Russian) [Google Scholar]
  5. Chen, Y.; Zhao, P. Zonation in primary halos and geochemical prospecting pattern for the Guilaizhuang gold deposit, eastern China. Nonrenew. Resour. 1998, 7, 37–44. [Google Scholar]
  6. Ziaii, M.; Pouyan, A.A.; Ziaii, M. Geochemical anomaly recognition using fuzzy C-means cluster analysis. Wseas Trans. Syst. 2006, 5, 2424–2430. [Google Scholar]
  7. Cheng, Q. Mapping singularities with stream sediment geochemical data for prediction of undiscovered mineral deposits in Gejiu, Yunnan Province, China. Ore Geol. Rev. 2007, 32, 314–324. [Google Scholar] [CrossRef]
  8. Chen, Y.; Huang, J.; Liang, Z. Geochemical characteristics and zonation of primary halos of Pulang porphyry copper deposit, Northwestern Yunnan Province, Southwestern China. J. China Univ. Geosci. 2008, 19, 371–377. [Google Scholar]
  9. Carranza, E.J.M.; Owusu, E.A.; Hale, M. Mapping of prospectivity and estimation of number of undiscovered prospects for lode gold, southwestern Ashanti Belt, Ghana. Miner. Depos. 2009, 44, 915–938. [Google Scholar] [CrossRef]
  10. Ziaii, M.; Pouyan, A.A.; Ziaei, M. Neuro-fuzzy modelling in mining geochemistry: Identification of geochemical anomalies. J. Geochem. Explor. 2009, 100, 25–36. [Google Scholar] [CrossRef]
  11. Zuo, R.; Cheng, Q.; Agterberg, F.; Xia, Q. Application of singularity mapping technique to identify local anomalies using stream sediment geochemical data, a case study from Gangdese, Tibet, western China. J. Geochem. Explor. 2009, 101, 225–235. [Google Scholar] [CrossRef]
  12. Sun, X.; Gong, Q.; Wang, Q.; Yang, L.; Wang, C.; Wang, Z. Application of local singularity model to delineate geochemical anomalies in Xiong’ershan gold and molybdenum ore district, Western Henan province, China. J. Geochem. Explor. 2010, 107, 21–29. [Google Scholar] [CrossRef]
  13. Hamedani, M.L.; Plimer, I.R.; Xu, C. Orebody modelling for exploration: The Western mineralization, Broken Hill, NSW. Nat. Resour. Res. 2012, 21, 325–345. [Google Scholar] [CrossRef]
  14. Cheng, Q. Singularity theory and methods for mapping geochemical anomalies caused by buried sources and for predicting undiscovered mineral deposits in covered areas. J. Geochem. Explor. 2012, 122, 55–70. [Google Scholar] [CrossRef]
  15. Ziaii, M.; Ardejani, F.D.; Ziaei, M.; Soleymani, A.A. Neuro-fuzzy modeling based genetic algorithms for identification of geochemical anomalies in mining geochemistry. Appl. Geochem. 2012, 27, 663–676. [Google Scholar] [CrossRef]
  16. Zuo, R.; Xia, Q.; Zhang, D. A comparison study of the C–A and S–A models with singularity analysis to identify geochemical anomalies in covered areas. Appl. Geochem. 2013, 33, 165–172. [Google Scholar] [CrossRef]
  17. Safari, S.; Ziaii, M.; Ghoorchi, M. Integration of singularity and zonality methods for prospectivity map of blind mineralization. Int. J. Min. Geo-Eng. 2016, 50, 189–194. [Google Scholar]
  18. Safari Sinegani, S.; Ziaii, M.; Ghoorchi, M.; Sadeghi, M. Application of concentration gradient coefficients in mining geochemistry: A comparison of copper mineralization in Iran and Canada. J. Min. Environ. 2018, 9, 277–292. [Google Scholar]
  19. Ziaii, M.; Safari, S.; Timkin, T.; Voroshilov, V.; Yakich, T. Identification of geochemical anomalies of the porphyry–Cu deposits using concentration gradient modelling: A case study, Jebal-Barez area, Iran. J. Geochem. Explor. 2019, 199, 16–30. [Google Scholar] [CrossRef]
  20. Safari, S.; Ziaii, M. Singularity of zonality, the indicator for quantitative evaluation of anomalies in mining geochemistry, Case study: Kerver. J. Min. Eng. 2019, 14, 76–91. [Google Scholar]
  21. Macheyeki, A.S.; Li, X.; Kafumu, D.P.; Yuan, F. Applied Geochemistry: Advances in Mineral Exploration Techniques; Elsevier: Amsterdam, The Netherlands, 2020. [Google Scholar]
  22. Timkin, T.; Abedini, M.; Ziaii, M.; Ghasemi, M.R. Geochemical and Hydrothermal Alteration Patterns of the Abrisham-Rud Porphyry Copper District, Semnan Province, Iran. Minerals 2022, 12, 103. [Google Scholar] [CrossRef]
  23. Sun, W.; Zheng, Y.; Wang, W.; Feng, X.; Zhu, X.; Zhang, Z.; Hou, H.; Ge, L.; Lv, H. Geochemical Characteristics of Primary Halos and Prospecting Significance of the Qulong Porphyry Copper–Molybdenum Deposit in Tibet. Minerals 2023, 13, 333. [Google Scholar] [CrossRef]
  24. Ziaii, M.; Carranza, E.J.M.; Ziaei, M. Application of geochemical zonality coefficients in mineral prospectivity mapping. Comput. Geosci. 2011, 37, 1935–1945. [Google Scholar] [CrossRef]
  25. Carranza, E.J.M.; Sadeghi, M. Predictive mapping of prospectivity and quantitative estimation of undiscovered VMS deposits in Skellefte district (Sweden). Ore Geol. Rev. 2010, 38, 219–241. [Google Scholar] [CrossRef]
  26. Carranza, E.J.M. From predictive mapping of mineral prospectivity to quantitative estimation of number of undiscovered prospects. Resour. Geol. 2010, 61, 30–51. [Google Scholar] [CrossRef]
  27. Yousefi, M.; Kamkar-Rouhani, A.; Carranza, E.J.M. Geochemical mineralization probability index (GMPI): A new approach to generate enhanced stream sediment geochemical evidential map for increasing probability of success in mineral potential mapping. J. Geochem. Explor. 2012, 115, 24–35. [Google Scholar] [CrossRef]
  28. Yousefi, M.; Kamkar-Rouhani, A.; Carranza, E.J.M. Application of staged factor analysis and logistic function to create a fuzzy stream sediment geochemical evidence layer for mineral prospectivity mapping. Geochem. Explor. Environ. Anal. 2014, 14, 45–58. [Google Scholar] [CrossRef]
  29. Chattoraj, S.L.; Prasad, G.; Sharma, R.U.; van der Meer, F.D.; Guha, A.; Pour, A.B. Integration of remote sensing, gravity and geochemical data for exploration of Cu-mineralization in Alwar basin, Rajasthan, India. Int. J. Appl. Earth Obs. Geoinf. 2020, 91, 102162. [Google Scholar] [CrossRef]
  30. Bai, S.; Zhao, J. A New Strategy to Fuse Remote Sensing Data and Geochemical Data with Different Machine Learning Methods. Remote Sens. 2023, 15, 930. [Google Scholar] [CrossRef]
  31. Zuo, R.; Xiong, Y. Big data analytics of identifying geochemical anomalies supported by machine learning methods. Nat. Resour. Res. 2018, 27, 5–13. [Google Scholar] [CrossRef]
  32. Xiong, Y.; Zuo, R.; Carranza, E.J.M. Mapping mineral prospectivity through big data analytics and a deep learning algorithm. Ore Geol. Rev. 2018, 102, 811–817. [Google Scholar] [CrossRef]
  33. Liu, Y.; Carranza, E.J.M.; Xia, Q. Developments in Quantitative Assessment and Modeling of Mineral Resource Potential: An Overview. Nat. Resour. Res. 2022, 31, 1825–1840. [Google Scholar] [CrossRef]
  34. Matveev, A.A.; Solovov, A.P. Geochemical Methods of Prospecting for Ore Deposits; Moscow State University Publishing House: Moscow, Russia, 1985; 232p. (In Russian) [Google Scholar]
  35. Arkhipov, A.Y.; Bugrov, V.A.; Vorobyov, S.A.; Gershman, D.M.; Grigorian, S.V.; Kiyatovsky, E.M.; Matveev, A.A.; Milyaev, S.A.; Nikolaev, V.A.; Perelman, A.I.; et al. Handbook of Geochemical Prospecting for Minerals; Nedra: Moscow, Russia, 1990. (In Russian) [Google Scholar]
  36. Ziaii, M. Method of Rational Mineralogical and Geochemical Sampling of Gold Ore Occurrences. Ph.D. Thesis, Russian Academy of Science (IGEM RAN), Moscow, Russia, 1999. (In Russian). [Google Scholar]
  37. Garigorin, S.V.; Liakhovich, T.T.; Getmansky, I.I.; Ziaii, M. Trace elements in minerals as a criterion of geochemical anomaly estimations. J. Sci. Technol. 1999, 1, 22–26, (In Russian with English Abstract). [Google Scholar]
  38. Grigorian, S.V.; Liakhovich, T.T.; Getmansky, I.I.; Ziaii, M. Geochemical spectrum of minerals as a criterion of gold ores type identification. J. Sci. Technol. 1999, 3, 5–8, (In Russian with English Abstract). [Google Scholar]
  39. Ziaii, M.; Abedi, A.; Ziaei, M. Geochemical and mineralogical pattern recognition and modeling with a Bayesian approach to hydrothermal gold deposits. Appl. Geochem. 2009, 24, 1142–1146. [Google Scholar] [CrossRef]
  40. Chen, Z.; Xiong, Y.; Yin, B.; Sun, S.; Zuo, R. Recognizing geochemical patterns related to mineralization using a self-organizing map. Appl. Geochem. 2023, 151, 105621. [Google Scholar] [CrossRef]
  41. Kazemi, H. Exploring Promising Areas for Copper Deposits in the Trood Area—Using Remote Sensing and GIS. Master’s Thesis, Shahrood University of Technology, Shahrood, Iran, 2007. [Google Scholar]
  42. Ziaii, M.; Abedi, A.; Ziaei, M.; Kamkar Rouhani, A.; Zendahdel, A. GIS modelling for Au-Pb-Zn potential mapping in Torud-Chah Shirin area-Iran. J. Min. Environ. 2010, 1, 17–27. [Google Scholar]
  43. Noori, L.; Pour, A.B.; Askari, G.; Taghipour, N.; Pradhan, B.; Lee, C.W.; Honarmand, M. Comparison of different algorithms to map hydrothermal alteration zones using ASTER remote sensing data for polymetallic vein-type ore exploration: Toroud–Chahshirin Magmatic Belt (TCMB), North Iran. Remote Sens. 2019, 11, 495. [Google Scholar] [CrossRef] [Green Version]
  44. Zamyad, M.; Afzal, P.; Pourkermani, M.; Nouri, R.; Jafari, M.R. Determination of hydrothermal alteration zones using remote sensing methods in Tirka Area, Toroud, NE Iran. J. Indian Soc. Remote Sens. 2019, 47, 1817–1830. [Google Scholar] [CrossRef]
  45. Shirmard, H.; Farahbakhsh, E.; Beiranvand Pour, A.; Muslim, A.M.; Müller, R.D.; Chandra, R. Integration of selective dimensionality reduction techniques for mineral exploration using ASTER satellite data. Remote Sens. 2020, 12, 1261. [Google Scholar] [CrossRef] [Green Version]
  46. Pour, A.B.; Zoheir, B.; Pradhan, B.; Hashim, M. Editorial for the special issue: Multispectral and hyperspectral remote sensing data for mineral exploration and environmental monitoring of mined areas. Remote Sens. 2021, 13, 519. [Google Scholar] [CrossRef]
  47. Mamouch, Y.; Attou, A.; Miftah, A.; Ouchchen, M.; Dadi, B.; Achkouch, L.; Et-tayea, Y.; Allaoui, A.; Boualoul, M.; Randazzo, G.; et al. Mapping of Hydrothermal Alteration Zones in the Kelâat M’Gouna Region Using Airborne Gamma-Ray Spectrometry and Remote Sensing Data: Mining Implications (Eastern Anti-Atlas, Morocco). Appl. Sci. 2022, 12, 957. [Google Scholar] [CrossRef]
  48. Yousufi, A.; Ahmadi, H.; Bekbotayeva, A.; Arshamov, Y.; Baisalova, A.; Omarova, G.; Pekkan, E. Integration of Remote Sensing and Field Data in Ophiolite Investigations: A Case Study of Logar Ophiolite Complex, SE Afghanistan. Minerals 2023, 13, 234. [Google Scholar] [CrossRef]
  49. Solovov, A.P. Geochemical Prospecting for Mineral Deposits; Englsih Edition; Mir Publication: Moscow, Russia, 1987; 287p. [Google Scholar]
  50. Moon, C.J. Towards a quantitative model of downstream dilution of point source geochemical anomalies. J. Geochem. Explor. 1999, 65, 111–132. [Google Scholar] [CrossRef]
  51. Rodriguez-Galiano, V.; Sanchez-Castillo, M.; Chica-Olmo, M.; Chica-Rivas, M.J.O.G.R. Machine learning predictive models for mineral prospectivity: An evaluation of neural networks, random forest, regression trees and support vector machines. Ore Geol. Rev. 2015, 71, 804–818. [Google Scholar] [CrossRef]
  52. Carranza, E.J.M.; Laborte, A.G. Data-driven predictive mapping of gold prospectivity, Baguio district, Philippines: Application of Random Forests algorithm. Ore Geol. Rev. 2015, 71, 777–787. [Google Scholar] [CrossRef]
  53. Carranza, E.J.M.; Laborte, A.G. Random forest predictive modeling of mineral prospectivity with small number of prospects and data with missing values in Abra (Philippines). Comput. Geosci. 2015, 74, 60–70. [Google Scholar] [CrossRef]
  54. Carranza, E.J.M.; Laborte, A.G. Data-driven predictive modeling of mineral prospectivity using random forests: A case study in Catanduanes Island (Philippines). Nat. Resour. Res. 2016, 25, 35–50. [Google Scholar] [CrossRef]
  55. Zhang, S.; Xiao, K.; Carranza, E.J.M.; Yang, F. Maximum entropy and random forest modeling of mineral potential: Analysis of gold prospectivity in the Hezuo–Meiwu district, west Qinling Orogen, China. Nat. Resour. Res. 2019, 28, 645–664. [Google Scholar] [CrossRef]
  56. Wang, C.; Pan, Y.; Chen, J.; Ouyang, Y.; Rao, J.; Jiang, Q. Indicator element selection and geochemical anomaly mapping using recursive feature elimination and random forest methods in the Jingdezhen region of Jiangxi Province, South China. Appl. Geochem. 2020, 122, 104760. [Google Scholar] [CrossRef]
  57. Zhang, S.; Carranza, E.J.M.; Xiao, K.; Wei, H.; Yang, F.; Chen, Z.; Li, N.; Xiang, J. Mineral prospectivity mapping based on isolation forest and random forest: Implication for the existence of spatial signature of mineralization in outliers. Nat. Resour. Res. 2022, 31, 1981–1999. [Google Scholar] [CrossRef]
  58. Alavi, M. Tectonostratigraphic synthesis and structural style of the Alborz Mountain system in northern Iran. J. Geodyn. 1996, 21, 1–33. [Google Scholar] [CrossRef]
  59. Shamanian, G.H.; Hedenquist, J.W.; Hattori, K.H.; Hassanzadeh, J. The Gandy and Abolhassani epithermal prospects in the Alborz magmatic arc, Semnan province, Northern Iran. Econ. Geol. 2004, 99, 691–712. [Google Scholar] [CrossRef]
  60. TaleFazel, E.; Mehrabi, B.; Siani, M.G. Epithermal systems of the Torud–Chah Shirin district, northern Iran: Ore-fluid evolution and geodynamic setting. Ore Geol. Rev. 2019, 109, 253–275. [Google Scholar] [CrossRef]
  61. Mehrabi, B.; Ghasemi, S.M.; Tale, F.E. Structural control on epithermal mineralization in the Troud-Chah Shirin belt using point pattern and Fry analyses, north of Iran. Geotectonics 2015, 49, 320–331. [Google Scholar] [CrossRef]
  62. Imamjomeh, A.; Rastad, E.; Bouzari, F.; Omran, N.R. An introduction to individual disseminated-veinlet and vein mineralization system of Cu (Pb-Zn) in the Chahmoosa-Gholekaftaran mining district, eastern part of Toroud-Chahshirin magmatic arc. Sci. Q. J. Geosci. 2008, 70, 112–125. [Google Scholar]
  63. Seifivand, A.; Sheibi, M. Ballooning emplacement and alteration of the Chah-Musa subvolcanic intrusion (NE Iran) inferred from magnetic susceptibility and fabric. Geol. Mag. 2020, 157, 621–639. [Google Scholar] [CrossRef]
  64. Khalaj, M.; Hassan-Nezhad, A.; Alizadeh, H.; Babaei, A.H.; Ghorbani, G. Investigation of mineralization fluid evolution of hydrothermal vein copper deposits: Based on studies of fluid inclusions at Chah Mousa area (north of central Iran). Adv. Appl. Geol. 2021, 11, 116–135. [Google Scholar]
  65. Bugrov, V. Geochemical sampling techniques in the Eastern Desert of Egypt. J. Geochem. Explor. 1974, 3, 67–75. [Google Scholar] [CrossRef]
  66. Perelman, A.I. Landscape Geochemistry; Higher School: Moscow, Russia, 1975; 341p. (In Russian) [Google Scholar]
  67. Li, Q.; Xi, X.; Ren, T.; Zhao, Y.; Che, G. Geochemical exploration in the semiarid steppe terrain of eastern Inner Mongolia—A case history. J. Geochem. Explor. 1989, 33, 27–46. [Google Scholar]
  68. Houshmandzadeh, A.R.; Alavi, M.N.; Haghipour, A.A. Evolution of Geological Phenomenon in Toroud Area (Precambrian to Recent); Report H5; Geological Survey & Mineral Exploration of Iran: Tehran, Iran, 1978. [Google Scholar]
  69. Geological Survey of Iran (GSI). Geological Map of Toroud; 1:250,000 Series; Geological Survey of Iran (GSI): Tehran, Iran, 1978. [Google Scholar]
  70. Kitaev, N.A. Multidimensional analysis of geochemical fields. Math. Geol. 1991, 23, 15–32. [Google Scholar] [CrossRef]
  71. Baranov, E.V. Endogenetic Haloes Associated with Massive Sulphide Deposits; Nedra Publishing House: Moscow, Russia, 1987; p. 294. (In Russian) [Google Scholar]
  72. Safonov, Y.G. Hydrothermal gold deposits: Distribution, geological-genetic types, and productivity of ore-forming systems. Geol. Ore Depos. 1997, 30, 20–32. [Google Scholar]
  73. Mars, J.C.; Rowan, L.C. Regional mapping of phyllic- and argillic-altered rocks in the Zagros magmatic arc, Iran, using Advanced Spaceborne Thermal Emission and Reflection Radiometer (ASTER) data and logical operator algorithms. Geosphere 2006, 2, 161–186. [Google Scholar] [CrossRef]
  74. Di Tommaso, I.; Rubinstein, N. Hydrothermal alteration mapping using ASTER data in the Infiernillo porphyry deposit, Argentina. Ore Geol. Rev. 2007, 32, 275–290. [Google Scholar] [CrossRef]
  75. Pour, B.A.; Hashim, M. The application of ASTER remote sensing data to porphyry copper and epithermal gold deposits. Ore Geol. Rev. 2012, 44, 1–9. [Google Scholar] [CrossRef] [Green Version]
  76. Lowell, J.D.; Guilbert, J.M. Lateral and vertical alteration-mineralization zoning in porphyry ore deposits. Econ. Geol. Bull. Soc. Econ. Geol. 1970, 65, 373–408. [Google Scholar] [CrossRef]
  77. Hunt, G.R.; Ashley, P. Spectra of altered rocks in the visible and near infrared. Econ. Geol. 1979, 74, 1613–1629. [Google Scholar] [CrossRef]
  78. Crowley, J.K.; Vergo, N. Near-infrared reflectance spectra of mixtures of kaolin group minerals: Use in clay mineral studies. Clays Clay Miner. 1988, 36, 310–316. [Google Scholar] [CrossRef]
  79. Pour, B.A.; Hashim, M. Identification of hydrothermal alteration minerals for exploring of porphyry copper deposit using ASTER data, SE Iran. J. Asian Earth Sci. 2011, 42, 1309–1323. [Google Scholar] [CrossRef]
  80. Pour, B.A.; Hashim, M. Identifying areas of high economic-potential copper mineralization using ASTER data in Urumieh-Dokhtar Volcanic Belt, Iran. Adv. Space Res. 2012, 49, 753–769. [Google Scholar] [CrossRef]
  81. Hu, B.; Xu, Y.; Wan, B.; Wu, X.; Yi, G. Hydrothermally altered mineral mapping using synthetic application of Sentinel-2A MSI, ASTER and Hyperion data in the Duolong area, Tibetan Plateau, China. Ore Geol. Rev. 2018, 101, 384–397. [Google Scholar] [CrossRef]
  82. Pour, A.B.; Hashim, M.; Hong, J.K.; Park, Y. Lithological and alteration mineral mapping in poorly exposed lithologies using Landsat-8 and ASTER satellite data: North-eastern Graham Land, Antarctic Peninsula. Ore Geol. Rev. 2019, 108, 112–133. [Google Scholar] [CrossRef]
  83. Pearson, K. LIII. On lines and planes of closest fit to systems of points in space. Lond. Edinb. Dublin Philos. Mag. J. Sci. 1901, 2, 559–572. [Google Scholar] [CrossRef] [Green Version]
  84. Jolliffe, I.T. Principal Component Analysis for Special Types of Data, 2nd ed.; Springer: New York, NY, USA, 2002. [Google Scholar]
  85. Yang, J.; Cheng, Q. A comparative study of independent component analysis with principal component analysis in geological objects identification, Part I: Simulations. J. Geochem. Explor. 2015, 149, 127–135. [Google Scholar] [CrossRef]
  86. Prado, I.M.; Crosta, A.P. Evaluating Geoscan AMSS Mk-II for gold exploration in the Fazenda Maria Preta District, Rio Itapicuru Greenstone Belt, Bahia State, Brazil. Boletim IG-USP. Série Científica 1997, 28, 63–83. [Google Scholar] [CrossRef] [Green Version]
  87. Pour, A.B.; Park, T.S.; Park, Y.; Hong, J.K.; Zoheir, B.; Pradhan, B.; Ayoobi, I.; Hashim, M. Application of Multi-Sensor Satellite Data for Exploration of Zn-Pb Sulfide Mineralization in the Franklinian Basin, North Greenland. Remote Sens. 2018, 10, 1186. [Google Scholar] [CrossRef] [Green Version]
  88. Pour, A.B.; Park, T.-Y.S.; Park, Y.; Hong, J.K.; Muslim, A.M.; Läufer, A.; Crispini, L.; Pradhan, B.; Zoheir, B.; Rahmani, O.; et al. Landsat-8, advanced spaceborne thermal emission and reflection radiometer, and WorldView-3 multispectral satellite imagery for prospecting copper-gold mineralization in the northeastern Inglefield Mobile Belt (IMB), northwest Greenland. Remote Sens. 2019, 11, 2430. [Google Scholar] [CrossRef] [Green Version]
  89. Pour, A.B.; Park, Y.; Crispini, L.; Läufer, A.; Kuk Hong, J.; Park, T.-Y.S.; Zoheir, B.; Pradhan, B.; Muslim, A.M.; Hossain, M.S.; et al. Mapping Listvenite Occurrences in the Damage Zones of Northern Victoria Land, Antarctica Using ASTER Satellite Remote Sensing Data. Remote Sens. 2019, 11, 1408. [Google Scholar] [CrossRef] [Green Version]
  90. Crosta, A.P.; De Souza Filho, C.R.; Azevedo, F.; Brodie, C. Targeting key alteration minerals in epithermal deposits in Patagonia, Argentina, using ASTER imagery and principal component analysis. Int. J. Remote Sens. 2003, 24, 4233–4240. [Google Scholar] [CrossRef]
  91. Loughlin, W.P. Principal component analysis for alteration mapping. Photogramm. Eng. Remote Sens. 1991, 57, 1163–1169. [Google Scholar]
  92. Honarmand, M.; Ranjbar, H.; Shahabpour, J. Application of principal component analysis and spectral angle mapper in the mapping of hydrothermal alteration in the Jebal–Barez Area, Southeastern Iran. Resour. Geol. 2012, 62, 119–139. [Google Scholar] [CrossRef]
  93. Khaleghi, M.; Ranjbar, H.; Shahabpour, J.; Honarmand, M. Spectral angle mapping, spectral information divergence, and principal component analysis of the ASTER SWIR data for exploration of porphyry copper mineralization in the Sarduiyeh area, Kerman province, Iran. Appl. Geomat. 2014, 6, 49–58. [Google Scholar] [CrossRef]
  94. Zuo, R. Machine learning of mineralization-related geochemical anomalies: A review of potential methods. Nat. Resour. Res. 2017, 26, 457–464. [Google Scholar] [CrossRef]
  95. Zuo, R.; Xiong, Y.; Wang, J.; Carranza, E.J.M. Deep learning and its application in geochemical mapping. Earth-Sci. Rev. 2019, 192, 1–14. [Google Scholar] [CrossRef]
  96. Zuo, R.; Wang, J.; Xiong, Y.; Wang, Z. The processing methods of geochemical exploration data: Past, present, and future. Appl. Geochem. 2021, 132, 105072. [Google Scholar] [CrossRef]
  97. Zuo, R.; Wang, Z. Effects of random negative training samples on mineral prospectivity mapping. Nat. Resour. Res. 2020, 29, 3443–3455. [Google Scholar] [CrossRef]
  98. Breiman, L. Random forests. Mach. Learn. 2001, 45, 5–32. [Google Scholar] [CrossRef] [Green Version]
  99. Breiman, L. Bagging predictors. Mach. Learn. 1996, 24, 123–140. [Google Scholar] [CrossRef] [Green Version]
  100. Strobl, C.; Boulesteix, A.L.; Zeileis, A.; Hothorn, T. Bias in random forest variable importance measures: Illustrations, sources and a solution. BMC Bioinform. 2007, 8, 25. [Google Scholar] [CrossRef] [Green Version]
  101. Ziaii, M. Lithogeochemical Exploration Methods for Porphyry Copper Deposit in Sungun, NW Iran. Unpublished Master’s Thesis, Moscow State University (MSU), Moscow, Russia, 1996; p. 98. (In Russian). [Google Scholar]
  102. Liaw, A.; Wiener, M. Classification and regression by randomForest. R News 2002, 2, 18–22. [Google Scholar]
  103. R Development Core Team. The R Project for Statistical Computing. 2008. Available online: http://www.R-project.org (accessed on 28 October 2018).
  104. Grömping, U. Variable importance assessment in regression: Linear regression versus random forest. Am. Stat. 2009, 63, 308–319. [Google Scholar] [CrossRef]
  105. Barton, M.D. Granitic magmatism and metallogeny of southwestern North America. Earth Environ. Sci. Trans. R. Soc. Edinb. 1996, 87, 261–280. [Google Scholar]
  106. Groves, D.I.; Vielreicher, R.M.; Goldfarb, R.J.; Condie, K.C. Controls on the heterogeneous distribution of mineral deposits through time. Geol. Soc. Lond. Spec. Publ. 2005, 248, 71–101. [Google Scholar] [CrossRef]
  107. Kesler, S.E.; Wilkinson, B.H. The role of exhumation in the temporal distribution of ore deposits. Econ. Geol. 2006, 101, 919–922. [Google Scholar] [CrossRef]
  108. Zürcher, L.; Hammarstrom, J.M.; Mars, J.C.; Ludington, S.D.; Zientek, M.L. Relationship between Porphyry Systems, Crustal Preservation Levels, and Amount of Exploration in Magmatic Belts of the Central Tethys Region; Society of Economic Geologists: Littleton, CO, USA, 2016. [Google Scholar]
Figure 2. Geological map of the Saghari deposit showing A-Central and A-South profiles (80 × 100 m2) and the location of exploratory drilled boreholes.
Remotesensing 15 03708 g002
Figure 3. Graphical representation of the workflow used in this study.
Remotesensing 15 03708 g003
Figure 4. The 3D diagram to classify the mineralogical and geochemical types of Cu deposits, ore occurrence, and associated lithogeochemical anomalies in Russia, Kazakhstan, and Armenia. I: Cu-massive sulfide, II: oxidized Cu-massive sulfide, III: Cu-polymetallic, IV: Cu-Mo-porphyry, V: Cu-Ni deposits [34,35] (see Appendix A).
Remotesensing 15 03708 g004
Figure 5. Distribution of lithogeochemical samples of the Saghari deposit in the 3D MGT model: (A) A-Central Profiles, (B) A-South Profiles, (C) A-Central Boreholes, and (D) A-South Boreholes.
Remotesensing 15 03708 g005aRemotesensing 15 03708 g005b
Figure 6. Vertical geochemical zonality (Vz) model for porphyry copper deposits according to typical standard porphyry copper deposits in Kazakhstan and Iran [101].
Remotesensing 15 03708 g006
Figure 7. Plot of lithogeochemical samples of the Saghari deposit in the geochemical zonality model.
Remotesensing 15 03708 g007
Figure 8. Structural evidential map of the TCS used for RF modeling.
Remotesensing 15 03708 g008
Figure 9. Negated PC5 image showing the presence of argillic and phyllic alteration zones as bright pixels in the TCS belt.
Remotesensing 15 03708 g009
Figure 10. Geochemical evidential map of the TCS used for RF modeling. Vz (Pb × Zn/Cu × Mo) values derived from stream sediment geochemical data. Zone I: potential for the exploration of subcropping to blind porphyry copper deposits, Zone II and III: potential zone for the exploration of outcropping porphyry copper deposits.
Remotesensing 15 03708 g010
Figure 11. The (MGT + Vz)-in-RF porphyry copper prospectivity map of the TCS belt.
Remotesensing 15 03708 g011
Figure 12. Relative importance of evidential variables used during (MGT + Vz)-in-RF modeling.
Remotesensing 15 03708 g012
Figure 13. Distribution of lithogeochemical samples of the Fallah and Tirgah deposits in the 3D MGT model.
Remotesensing 15 03708 g013
Table 1. Results of lithogeochemical data of the Saghari deposit and Vz model.
Soil SamplesVz IndexAssessmentRock SamplesVz IndexAssessment
A-Central Profiles12.32Blind mineralizationA-Central Boreholes7.54BM
35T-51T13.60Blind mineralizationA27.64BM
52T-67T8.84Blind mineralizationA330.23BM
68T-82T10.86Blind mineralizationB74.50BM
Three Profiles10.73Blind mineralizationB23.17BM
C310.03BM
A-South Profiles2.11Outcropping mineralizationA-South Boreholes0.42Outcropping
33L-41L2.13Outcropping mineralizationB21.80Outcropping
34M-41M1.34Outcropping mineralizationB30.79Outcropping
34N-44N2.08Outcropping mineralizationB40.04Outcropping
35O-46O2.51Outcropping mineralizationB50.11Outcropping
34P-47P1.85Outcropping mineralizationB60.76Outcropping
Five Profiles1.90Outcropping mineralizationC11.85Outcropping
C40.17Outcropping
Table 2. Eigenvector matrix of six ETM+ spectral bands.
PC1PC2PC3PC4PC5PC6
Band 10.310.460.520.400.250.44
Band 20.350.370.210.02−0.09−0.83
Band 30.490.31−0.19−0.59−0.410.32
Band 40.380.11−0.770.390.32−0.01
Band 50.47−0.580.150.40−0.500.03
Band 70.42−0.450.20−0.420.64−0.04
Disclaimer/Publisher’s Note: The statements, opinions and data contained in all publications are solely those of the individual author(s) and contributor(s) and not of MDPI and/or the editor(s). MDPI and/or the editor(s) disclaim responsibility for any injury to people or property resulting from any ideas, methods, instructions or products referred to in the content.

