Article

A Preliminary Analysis of Typical Structures and Microphysical Characteristics of Precipitation in Northeastern China Cold Vortexes

1
Key Laboratory of Mesoscale Severe Weather, Ministry of Education, School of Atmospheric Sciences, Nanjing University, Nanjing 210023, China
2
Key Laboratory of Transportation Meteorology of China Meteorological Administration, Nanjing Joint Institute for Atmospheric Sciences, Nanjing 210041, China
3
Anhui Province Key Laboratory of Atmospheric Science and Satellite Remote Sensing, Institute of Meteorological Sciences, Hefei 230031, China
4
Suzhou Meteorological Bureau, Suzhou 215131, China
*
Authors to whom correspondence should be addressed.
Remote Sens. 2023, 15(13), 3399; https://doi.org/10.3390/rs15133399
Submission received: 10 May 2023 / Revised: 28 June 2023 / Accepted: 30 June 2023 / Published: 4 July 2023

Abstract

:
The northeastern China cold vortex (NCCV) is the main weather system affecting Northeast China. Based on the precipitation products from the dual-frequency precipitation radar (DPR) onboard the Global Precipitation Measurement core observatory (GPM) satellite, the precipitation structures and microphysical properties for different rain types in 6432 NCCVs from 2014 to 2019 were studied using dynamic composite analysis. Our results show that the precipitation in NCCVs is dominated by stratiform precipitation. Regions with high stratiform and convective precipitation frequency have a comma shape. The growth mechanism of precipitation particles changes at ~4 km in altitude, the lower particles grow through collision (more pronounced in convective precipitation), and the upper hydrometeors grow through the Bergeron process. Additionally, the precipitation structures and microphysical properties exhibit great regional variations in NCCVs. The rainfall for all rain types is the strongest in the southeast region within an NCCV, mainly characterized by higher near-surface droplet concentration, while precipitation events occur more frequently in the southeast region for all rain types. There are active rimming growth processes above the melting layer for convective precipitation in the western region of an NCCV. In the southeast region of an NCCV, the collision growth of droplets in both types of precipitation is the most obvious.

1. Introduction

The cutoff low over the northeastern China–Siberian section of the northwestern Pacific coast is usually called the northeastern China cold vortex (NCCV) [1]. At present, the widely used definition of an NCCV is as follows: (1) At 500 hPa, there is a low-pressure system with an evident cold trough or a cold core, and at least one closed geopotential height contour (4 dagpm interval). (2) The system appears in the region (35–60°N, 115–145°E). (3) The system in the defined area must last for at least three days [2,3,4]. The NCCV can be accompanied by strong convective weather such as rainstorms, tornadoes, and hail during its formation, development, persistence, and dissipation, which brings economic loss and human casualties to Northeast China. It is also worth noting that an NCCV can provide favorable conditions for the initiation of mesoscale convective systems [5], which cause asymmetries of precipitation in their interior. Obviously, it is particularly important and urgent to study the precipitation structures of the NCCV in the background of the frequent occurrence and serious impact of NCCVs on society in recent years.
During the past two decades, progress has been made in the study of macrocharacteristics and favorable conditions of precipitation inside the NCCV [6,7,8,9,10,11,12,13]. The NCCV precipitation has obvious asymmetry distribution, i.e., the east side of the NCCV is the main area of precipitation [6,7], and the mesoscale weather generally occurs in the southern half of the NCCV [8]. During different life stages of the NCCV, the precipitation characteristics are different. Rainstorms generally occur in the development stage of the NCCV [9]. At this stage, the cloud system at its head develops vigorously [10], and most of these systems are characterized by large-scale mixed precipitation on the south side of the NCCV. At the mature stage, the precipitation in the NCCV is mostly isolated convective precipitation [11], and the precipitation center is located closer to the NCCV center [12]. In the dissipation stage of the NCCV, the comma-shaped cloud system is not obvious, and the main form of precipitation is isolated convective precipitation [10,11], with less frequent heavy rainfall events [9]. The variations of environmental characteristics in the NCCV are responsible for the different precipitation distributions. The positive vorticity advection is located in the east side of the NCCV, and its forcing produces an updraft, which is favorable for precipitation formation [13]. The convergence of water vapor occurs in the head and tail of the NCCV comma-shaped cloud system, associated with the low-level jet and high-energy wet tongue in the tail of the NCCV, making the convection develop violently [10]. During the development period of the NCCV, the main factors affecting the precipitation area are convective available potential energy and water vapor flux. During the mature period, the convection is basically in the area with high convective available potential energy and humidity. During the dissipation period, the convective precipitation is also related to the low-level convergence line [11]. These previous studies are mostly limited to individual cases or typical periods such as summer and flood seasons. The comprehensive statistical analysis from multiple factors for different rain types in the NCCV is relatively rare.
It is worth noting that the microphysical structures and processes inside the NCCV play an important role on precipitation and clouds [14]. Studying the microphysical characteristics of the NCCV’s precipitation is crucial for understanding the NCCV’s structures, providing the reference for cloud and precipitation modules in NCCV modeling, and improving the accuracy of numerical predictions. Using observations from an aircraft, Qi et al. [15] found that there was a high-concentration area of ice particles in the upper part of the convective cloud band, and that ice particles increased rapidly in the areas with high supercooled water content, which plays an important role on precipitation. Zhao and Lei [16] studied the precipitation microphysics of the NCCV from the late-mature stage to the dissipation stage using aircraft observations. They found that the particle concentration in the warm layer of the clouds was larger, while in the supercooled water layer, the particle concentration was much smaller. The high concentration of ice particles in the layer between −3 and −6 °C is caused by the Hallett–Mossop ice-crystal multiplication process. Zhong et al. [17] analyzed an NCCV in July based on CloudSat satellite data. In the development stage of the NCCV, the convective clouds in the warm front on the east side of the NCCV were mainly composed of ice water, corresponding to the strong echo band, and the liquid water was mainly in the southeast quadrant of the NCCV. In the mature stage, the convective systems with more ice water content were mostly located on the north side of the NCCV, and the liquid water was mainly distributed below the 0 °C layer of the NCCV center. At present, due to the high cost of aircraft observation and the incomplete information of cloud and precipitation obtained by ground-based radar [18], our understanding of the precipitation structure and microphysical characteristics in NCCVs is still insufficient. Hence, it is necessary to introduce more refined data to study the internal microphysical structure of the NCCV systematically and comprehensively.
The Global Precipitation Measurement core observatory (GPM) satellite can detect precipitation activity in the range of 65°S–65°N, which provides us with an excellent opportunity to study the precipitation characteristics of the NCCV in mid- and high-latitude regions [19]. The dual-frequency precipitation radar (DPR) onboard the GPM satellite has the ability to detect microphysical characteristics, which have been widely used in the study of tropical and extratropical cyclones [20,21,22,23,24]. Therefore, the three-dimensional structures and microphysical properties and process of precipitation in NCCVs will be analyzed using GPM DPR from 2014 to 2019 in the present study.

2. Materials and Methods

2.1. GPM Satellite and Precipitation Data

GPM DPR was designed by the Japanese Aerospace Exploration Agency (JAXA) and the National Institute of Communication Technology (NICT). It consists of a Ku-band precipitation radar (KuPR, 13.6 GHz) and a Ka-band precipitation radar (KaPR, 35.5 GHz). The detection area can cover 65°S–65°N on the Earth [24,25,26]. The KuPR has only one scanning mode (normal scan, NS), and its minimum detectable reflectivity is 14.5 dBZ. The KaPR has two scanning modes, matched scan (MS) and high-sensitivity scan (HS). The minimum detectable reflectivity is 16.7 dBZ and 10.2 dBZ, respectively [27]. The droplet-size parameters of hydrometeors can be inverted by different responses of the KuPR and the KaPR to hydrometeors [28]. Using ground-based observations, scholars have verified the reliability of the droplet-size distribution retrieved by DPR [29]. We used the GPM dual-frequency precipitation product 2ADPR from 2014 to 2019, including the rain type, near-surface rain rate, storm-top height, and droplet-size distributions (DSDs). Above the melting layer, for mixed-phase and solid-phase hydrometeors, the liquid-equivalent DSDs were retrieved from the official 2ADPR dataset [30].

2.2. GPM Products for Rain Types

The variable typePrecip in the Classification Module (CSF Module) of GPM data provides rain-type classification made by various methods: the single-frequency horizontal pattern method (H-method), vertical profiling method (V-method) and measured dual-frequency ratio method (DFRm-method) [19]. In the V-method, the melting-layer bright band (BB) is first detected. The detection of the BB is to determine whether the vertical profile of radar reflectivity satisfies certain conditions which are typical for the profile of the radar reflectivity factor when a BB exits by examining the vertical profile of the radar reflectivity factor. When a BB is detected, if the reflectivity factor in the rain area does not exceed the convection threshold (46 dBZ), then the rain type is stratiform. When no BB is detected and the reflectivity factor exceeds the conventional convective threshold (40 dBZ), the rain type is convective. If rain type is neither stratiform nor convective, the rain type is other. In the H-method, the horizontal distribution of representative radar reflectivity factors, i.e., the maximum value of the reflectivity factor along the considered radar beam in the rain region, is detected. Rain-type classification adopts a modified University of Washington convective/stratiform separation method, which is divided into three categories: stratiform, convective, and other. Detection of convective precipitation is made first. The rain type is stratiform if it is not convective, unless the reflectivity factor is very small and has almost identical noise. If rain type is neither stratiform nor convective, it is other.
For the same precipitation profile, due to the different rain-type classification methods, the results may be different. Therefore, the variable typePrecip unifies rain types by the above classification methods, that is, the single-frequency method and the dual-frequency method are used to unify the rain types. In the dual-frequency method, the DFRm-method is used to detect the BB, which classifies rain into three types: stratiform, convective, and transition. The dual-frequency method merges the rain type of the DFRm-method with the single-frequency Ku-band rain type, and it outputs a unified rain type: stratiform, convective, and other. The features for the unification of the dual-frequency method are as follows: When the DFRm rain type is convective or stratiform, if no BB is detected, the unified rain type follows the DFRm rain type. If a BB is detected, however, the unified rain type is stratiform. When the DFRm rain type is transition or the DFRm processing is skipped, the single-frequency Ku-band rain type is the unified rain type. If heavy ice precipitation (HIP) or winter convection is detected, some stratiform type is changed into a convective type.
Since the rain-type identification by the DFRm-method considers observations from two bands, the rain types are probably more reliable. Therefore, the rain types in the present study are retrieved from the dual-frequency method. Figure 1 shows the spatial distribution of 10.4 μm brightness temperature from the Japanese Himawari-7 meteorological satellite, as well as the rain type, storm-top height, and radar echo at 6 km height from GPM DPR for the NCCV at 1200 UTC on 12 June 2014. The brightness temperature of the cloud system in the region of 24–28°N and 136–140°E is low (Figure 1a), and the radar echo intensity at 6 km is higher than 20 dBZ (Figure 1d). However, this region is classified as stratiform by GPM in Figure 1b. From the vertical profile of the radar echo of the NCCV (Figure 2), there is a clear BB inside the cloud system in this region, and the echo intensity in the BB is larger than that in the upper and lower layers. The BB is the main feature of the stratiform precipitation echo, indicating that the airflow in the stratiform precipitation is stable and there is no obvious convective activity. For the convective precipitation on the southeastern edge of the stratiform region, the storm-top height is less than 5 km. It can be seen in Figure 2d that there is no BB in the precipitation system, and there is a strong echo higher than 40 dBZ in the radar reflectivity factor. Therefore, the rain types from the dual-frequency method in GPM have relatively high reliability from the vertical and horizontal distribution of radar echoes.

2.3. Reanalysis Data

The 500 hPa geopotential height fields are extracted from the fifth-generation European Centre for Medium-Range Weather Forecasts (ECMWF) atmospheric reanalysis (ERA5) data with a temporal resolution of 1 h and a spatial resolution of 0.25° × 0.25° [31]. They were used to correct the initial 6 h NCCV centers provided by Chen et al. [1] which were identified from a reanalysis dataset with a temporal resolution of 6 h and a spatial resolution of 1° × 1°. Firstly, NCCV centers at hourly resolution are obtained from the initial 6 h ones by a linear interpolation method. Secondly, the 1° resolution NCCV centers are refined to 0.25° resolution using the ERA5 500 hPa geopotential height field. The NCCV center is corrected by the lowest geopotential height within 1° from the original NCCV center. In this way, we can obtain the NCCV centers at hourly resolution, and match the NCCV centers with GPM data at the same time.

2.4. NCCV Coordinate System and Dynamic Composite Analysis

For the convenience of statistics, an NCCV coordinate system is defined in this study. In this coordinate system, the origin represents the center of the NCCV, the x axis indicates the east–west direction, and the y axis indicates the north–south direction.
The near-surface rain rate and other physical variables for precipitation were analyzed using dynamic composite analysis [7,32] in the NCCV coordinate system. The formula of dynamic composite analysis is
S ¯ x , y = 1 N t = 1 N S t x , y ,
where S t x , y are the physical variables at time t, and x , y are the coordinates in the composite area, which moves with the position of the NCCV center. N is the total number of samples, and S ¯ x , y is the average value of the samples obtained after the dynamic composite analysis. In the composite analysis, the NCCV center is used as the composite center; we took 2000 km in each direction around the NCCV center [24] to perform dynamic composite analysis in a square area with a side length of 4000 km.
In total, 6432 NCCV cases from 2014 to 2019 are used in the dynamic composite analysis. These things considered, the samples with near-surface rain rate greater than 0.5 mm h−1 are defined as precipitation samples.

3. Results

3.1. Subsection Horizontal Distributions of Stratiform and Convective Precipitation in the NCCV

3.1.1. Precipitation Characteristics

In order to understand the internal precipitation structure of the NCCV, the horizontal distribution of near-surface rain rate (the total rain rate of the precipitation samples in the grid divided by the number of precipitation samples), precipitation frequency (the number of precipitation samples in the grid divided by the number of total observational samples), and storm-top height of total, stratiform, and convective precipitation in the NCCV coordinate system are given, respectively (Figure 3). There are obvious regional differences in the distribution of near-surface rain rate for two types of precipitation. The rain rate is high in the south of the NCCV, especially in the southeast region, while it is the smallest in the northeast (Figure 3a–c), which may be related to the more abundant water vapor transport in the south [1]. The rain rate of stratiform in the southeast quadrant (Figure 3b) is generally higher than 2 mm h−1, while it is generally lower than 2 mm h−1 in other regions. Compared to stratiform precipitation, the convective rain rate (Figure 3c) is generally larger in the NCCV, and the rain rate in the south of the NCCV is higher than 3.5 mm h−1, while the rain rate in other regions is also higher than 2 mm h−1. The horizontal distribution of the total rain rate (Figure 3a) is similar to that of stratiform, which is related to the high proportion of stratiform precipitation in the NCCV. The rain rate of stratiform in each region is smaller than that of convective precipitation, while the precipitation frequency is significantly higher, indicating that the precipitation in the NCCV is more composed of stratiform precipitation with weaker precipitation intensity.
There is an obvious comma-shaped rain band for the precipitation frequency distribution of the NCCV, which is consistent with the research results of Chen et al. [1] (Figure 3d–f). For total (Figure 3d) and stratiform (Figure 3e) precipitation, the regions with precipitation frequency higher than 4% are mainly located over the small area near the center in the northeast of the NCCV and a large area in the southeast of the NCCV. This is in good agreement with previous research results that the east side of the NCCV is the main area of precipitation [6,7], while in most of the other areas of the NCCV, precipitation frequency is generally lower than 1.5%. With the increase in the distance from the center of the NCCV, the region with high precipitation frequency shifts from the northeast to the southeast quadrant. Compared to stratiform precipitation, the frequency of convective precipitation is lower in all regions. The precipitation frequency in the comma-shaped rain band is mainly in the range of 0.5–1.5%, while it is basically lower than 0.5% in other regions (Figure 3f). As the distance to the center of the NCCV increases, the high convective precipitation frequency occurs, and the frequency of convective precipitation increases in the southeast quadrant, which is probably related to the higher instability and more moisture in this region (figure omitted).
The horizontal distribution of storm-top height in the NCCV also has an obvious asymmetric structure (Figure 3g–i). For total (Figure 3g) and stratiform (Figure 3h) precipitation, the storm-top height is highest (4.5–6.5 km) in the southwest quadrant and lowest in the northeast quadrant. Although the precipitation cloud develops deeply in the southwest regions, the rain rate is small. Conversely, the storm-top height in the northern half of the NCCV is basically lower than 4.5 km, indicating shallower precipitation clouds, and the rain rate is also small. The storm-top height in the southeast region of the NCCV is generally lower than 5 km, but the rain rate is the largest in the NCCV, which may be related to the more abundant water vapor in this area [1]. The convective precipitation cloud in the west of the NCCV develops higher (Figure 3i), and the average storm-top height is higher than 5 km, even up to 8 km in some areas which also have a higher rain rate. The storm-top height in the southeast quadrant of the NCCV is basically lower than 4.5 km, but the rain rate is the highest in the NCCV. One possible explanation is that these areas are mostly located over the ocean, where shallow convection with low storm-top height prevails, according to a previous study [22]. The sufficient water vapor over the ocean may provide favorable moisture conditions for the formation of shallow convection.
To better understand the contribution of stratiform and convective precipitation within the NCCV and the distribution of NCCV precipitation, the horizontal distribution of precipitation amount contribution (the total rain rate of stratiform/convective precipitation samples divided by the total rain rate of precipitation samples), and precipitation frequency contribution (the number of stratiform/convective precipitation samples in the grid divided by the number of precipitation samples) for stratiform and convective precipitation within 2000 km of the NCCV center are given (Figure 4a–d). Overall, the precipitation in NCCVs is dominated by stratiform precipitation, and the precipitation frequency (mostly more than 70%) and amount contribution (mostly more than 60%) of stratiform precipitation are greater than that of convection precipitation. The difference between convective and stratiform precipitation amount (frequency) contributions is the largest in the northeast quadrant of the NCCV. The latter is significantly higher than the former. For example, in the northeast of the NCCV, the contribution of stratiform precipitation amount (frequency) can reach 80% (90%), while convective precipitation is less than 20% (10%). It is worth noting that in the southwest of the NCCV, although the contribution of convective precipitation frequency is smaller than that of stratiform precipitation (basically less than 30%), the contribution of precipitation amount is higher than 60% locally, exceeding stratiform precipitation. For stratiform and convective precipitation, the distribution of precipitation frequency contribution of the NCCV (Figure 4c,d) is very similar to that of precipitation amount contribution (Figure 4a,b). Generally, the regions with high (low) precipitation frequency contribution also exhibit a high (low) precipitation amount contribution. However, since the rain rate of stratiform is generally lower than that of convective, the contribution of the rain amount is smaller than the frequency for stratiform precipitation. On the contrary, the contribution of the convective precipitation amount increases compared to the frequency contribution.

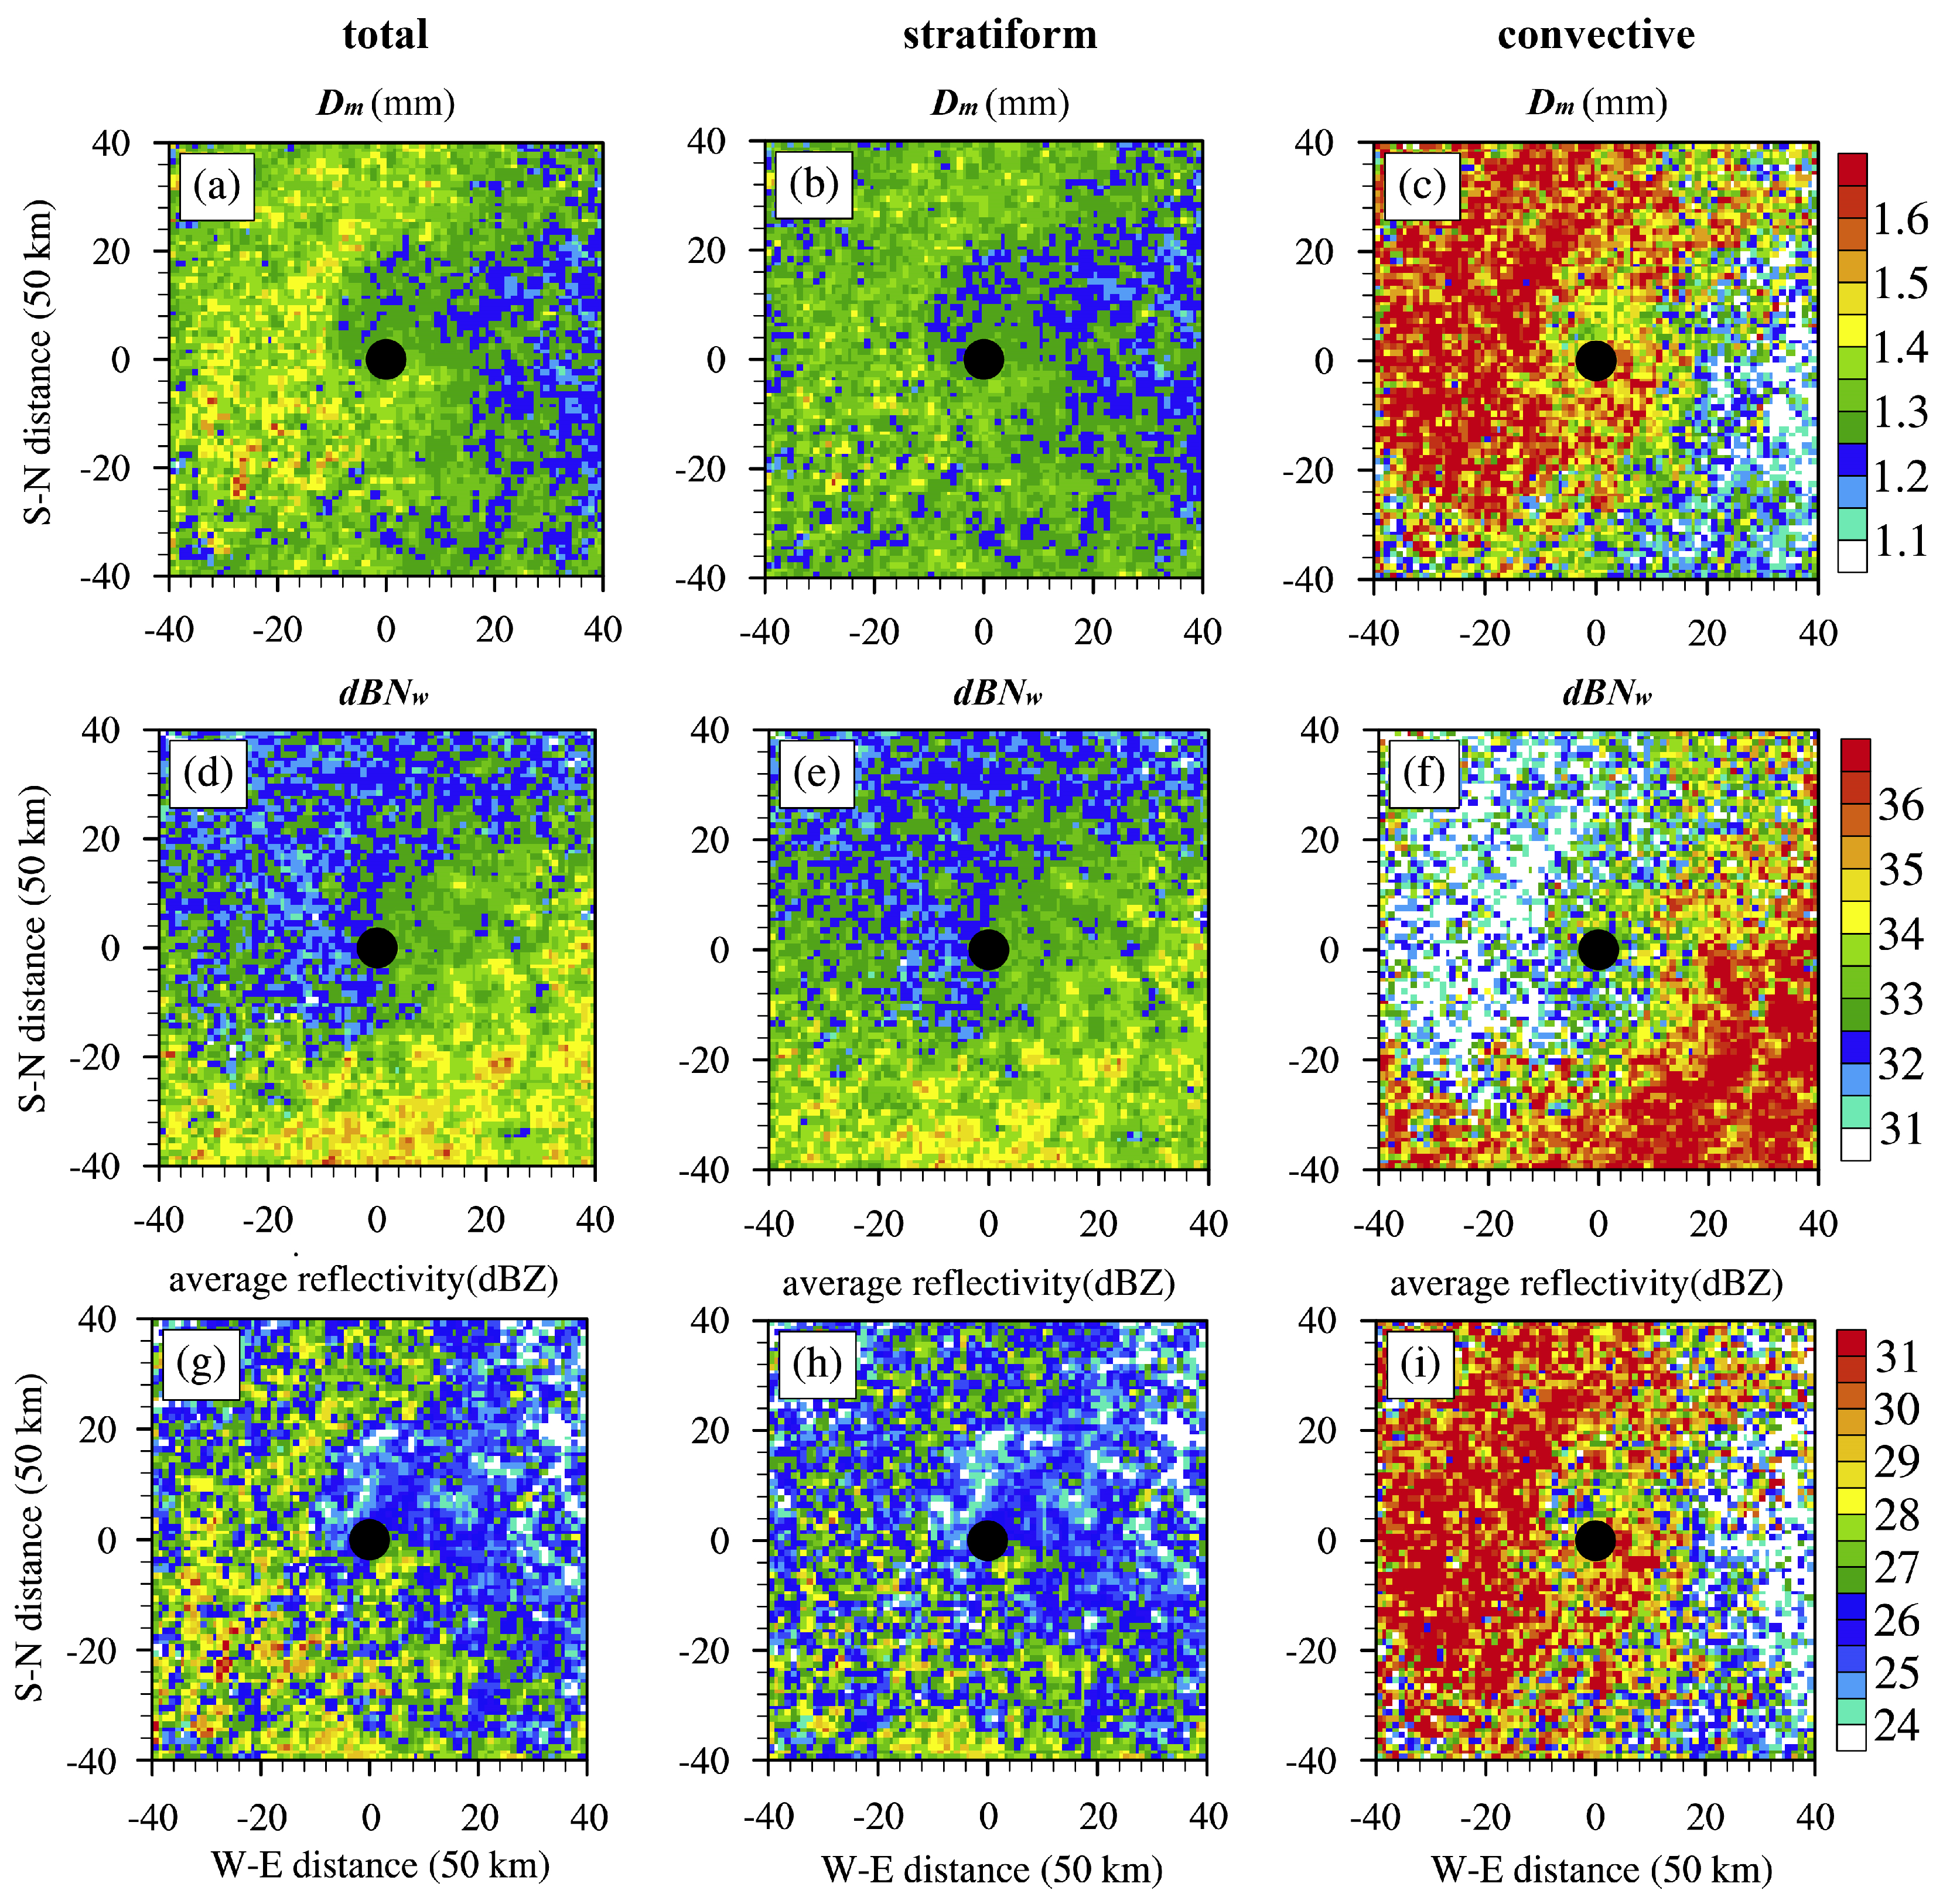
3.1.2. Characteristics of Near-Surface Microphysics

Rain rate is controlled by both raindrop concentration and raindrop size [28]. The microphysical structure and process inside the NCCV also play a very important role in precipitation [14]. The characteristics of the DSD can reflect the microphysical processes of precipitation. The DSD parameters provided by GPM 2ADPR products are used, including Dm and dBNw, where Dm represents the size of the particles and Nw represents the particle concentration. In order to reduce the influence of DSD retrieval uncertainties caused by ground clutters, the Dm and dBNw at 2.5 km height are chosen to represent the near-surface DSDs. In order to facilitate the display, dBNw is used to represent the particle concentration parameter (dBNw = 10log10 (Nw)).
The near-surface particle diameter (Figure 5a–c), concentration (Figure 5d–f), and radar reflectivity (Figure 5g–i) are very similar horizontal distributions for stratiform and convective precipitation. The Dm and reflectivity factor in the southeast quadrant of the NCCV are small and the dBNw is high, while the dBNw and reflectivity factor in the northwest quadrant are low and the Dm is large. For stratiform precipitation (Figure 5b), the Dm in the northwest quadrant is generally higher than 1.3 mm and the dBNw is lower than 33, while the Dm in the southeast is mostly higher than 1.25 mm and the dBNw is about 34. For convective precipitation, the Dm in the northwest is generally higher than 1.45 mm and the dBNw is lower than 32. The Dm in the southeast is generally below 1.25 mm and the dBNw is generally higher than 36. For convective and stratiform precipitation, the radar reflectivity is very similar to the Dm distribution, which is mainly because the near-surface echo intensity is more affected by particle size. For convective and stratiform precipitation, the near-surface rain rate is close to the horizontal distribution of dBNw. For example, the high rain rate of different types of precipitation in the southeast quadrant of the NCCV (Figure 3a–c) corresponds to the high concentration of particles (smaller size), while the weak precipitation in the northwest quadrant corresponds to the low concentration of hydrometeors (larger size). This shows that the rain rate in the NCCV is closely related to the raindrop concentration. The heavy precipitation in the southeast is mainly contributed to by higher raindrop concentration.
Compared to stratiform precipitation, convective precipitation generally has stronger near-surface echoes, smaller particle concentration, and larger particle size in the western and northwestern regions of the NCCV, while the convective precipitation in the eastern and southeastern quadrants generally has weaker near-surface radar echo, higher particle concentration, and smaller particle size. This shows that there are differences in the microphysical processes of precipitation in different types of precipitation clouds and different quadrants. The following section will further study the variation of precipitation characteristics in different regions in the NCCV.

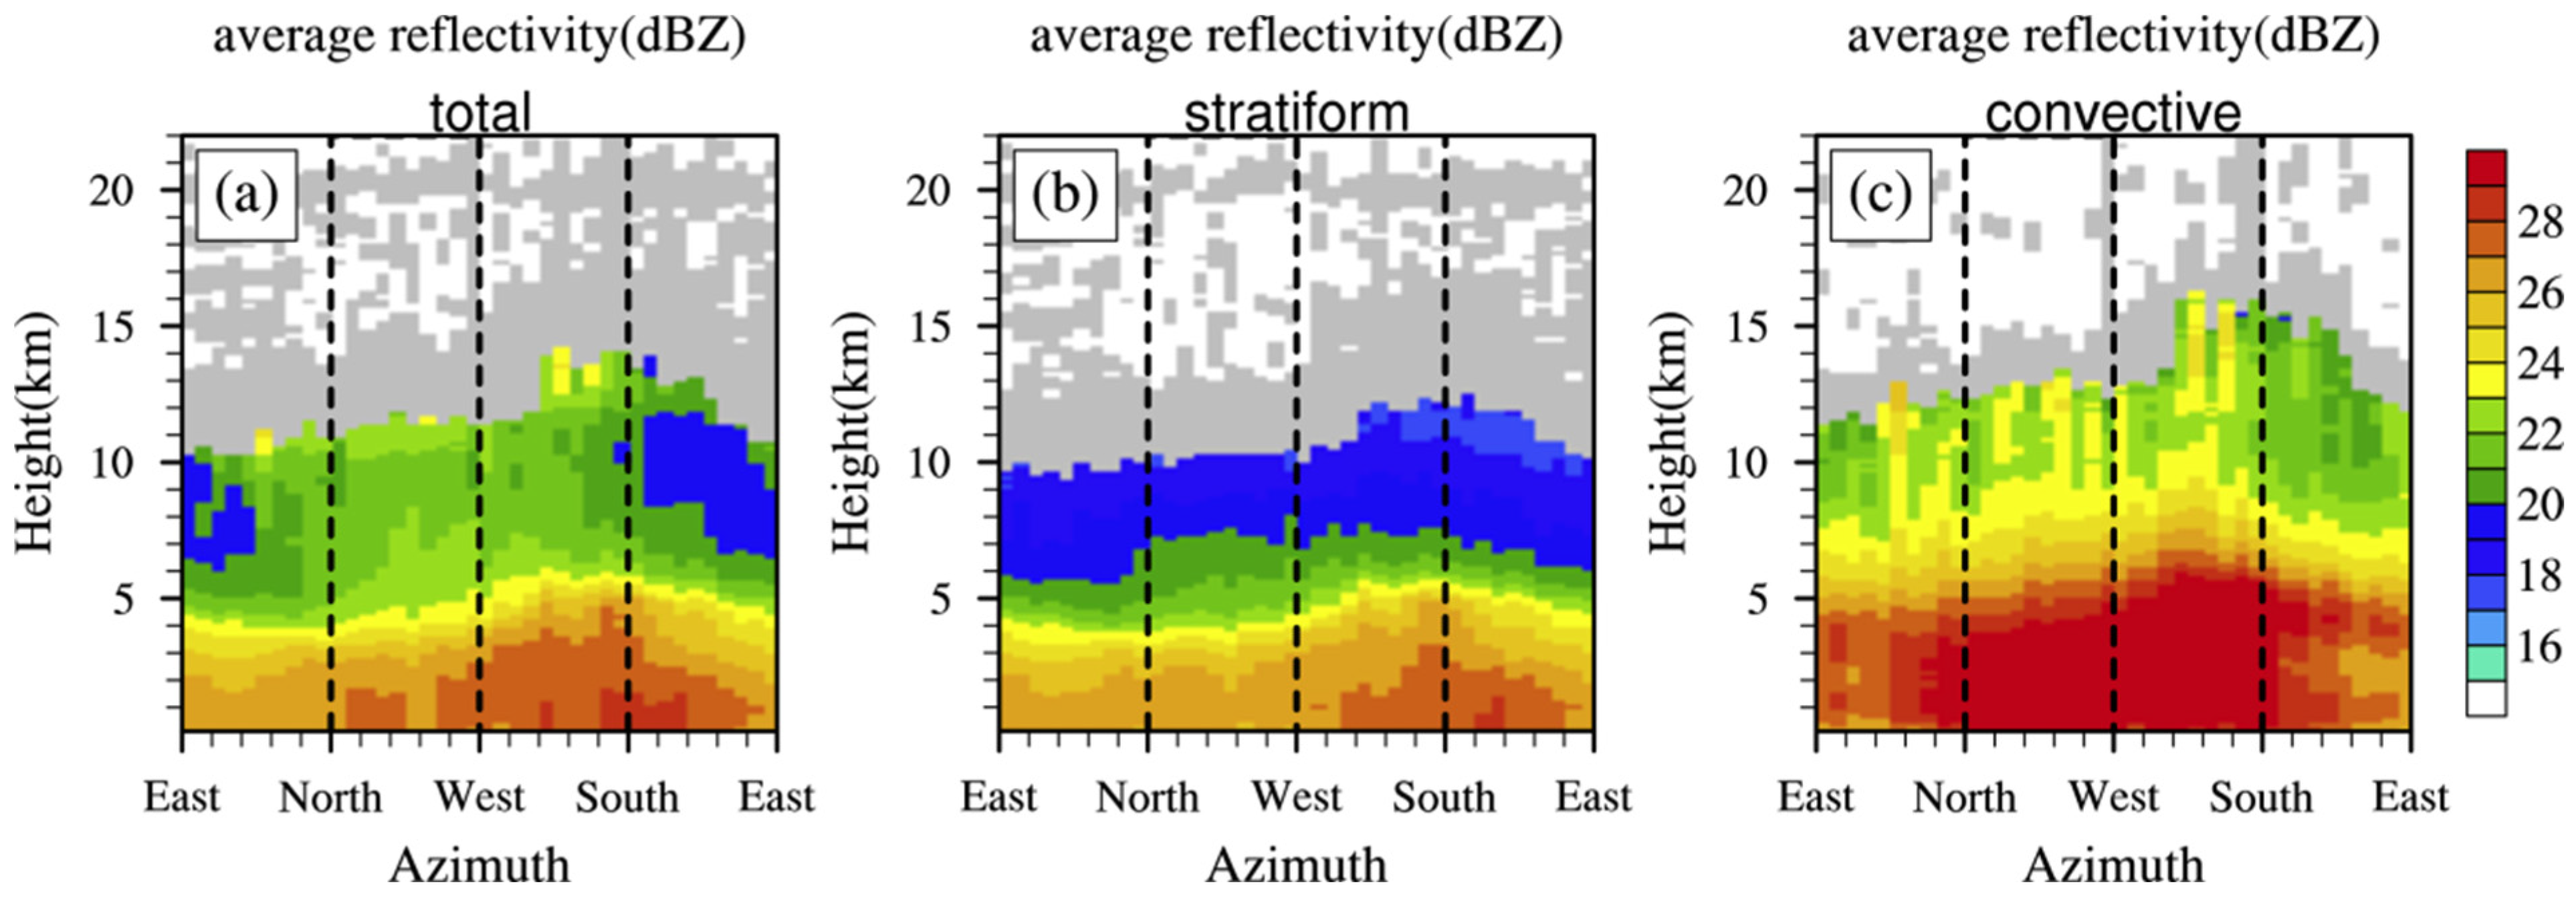
3.2. Azimuthal Distributions of Stratiform and Convective Precipitation in NCCV

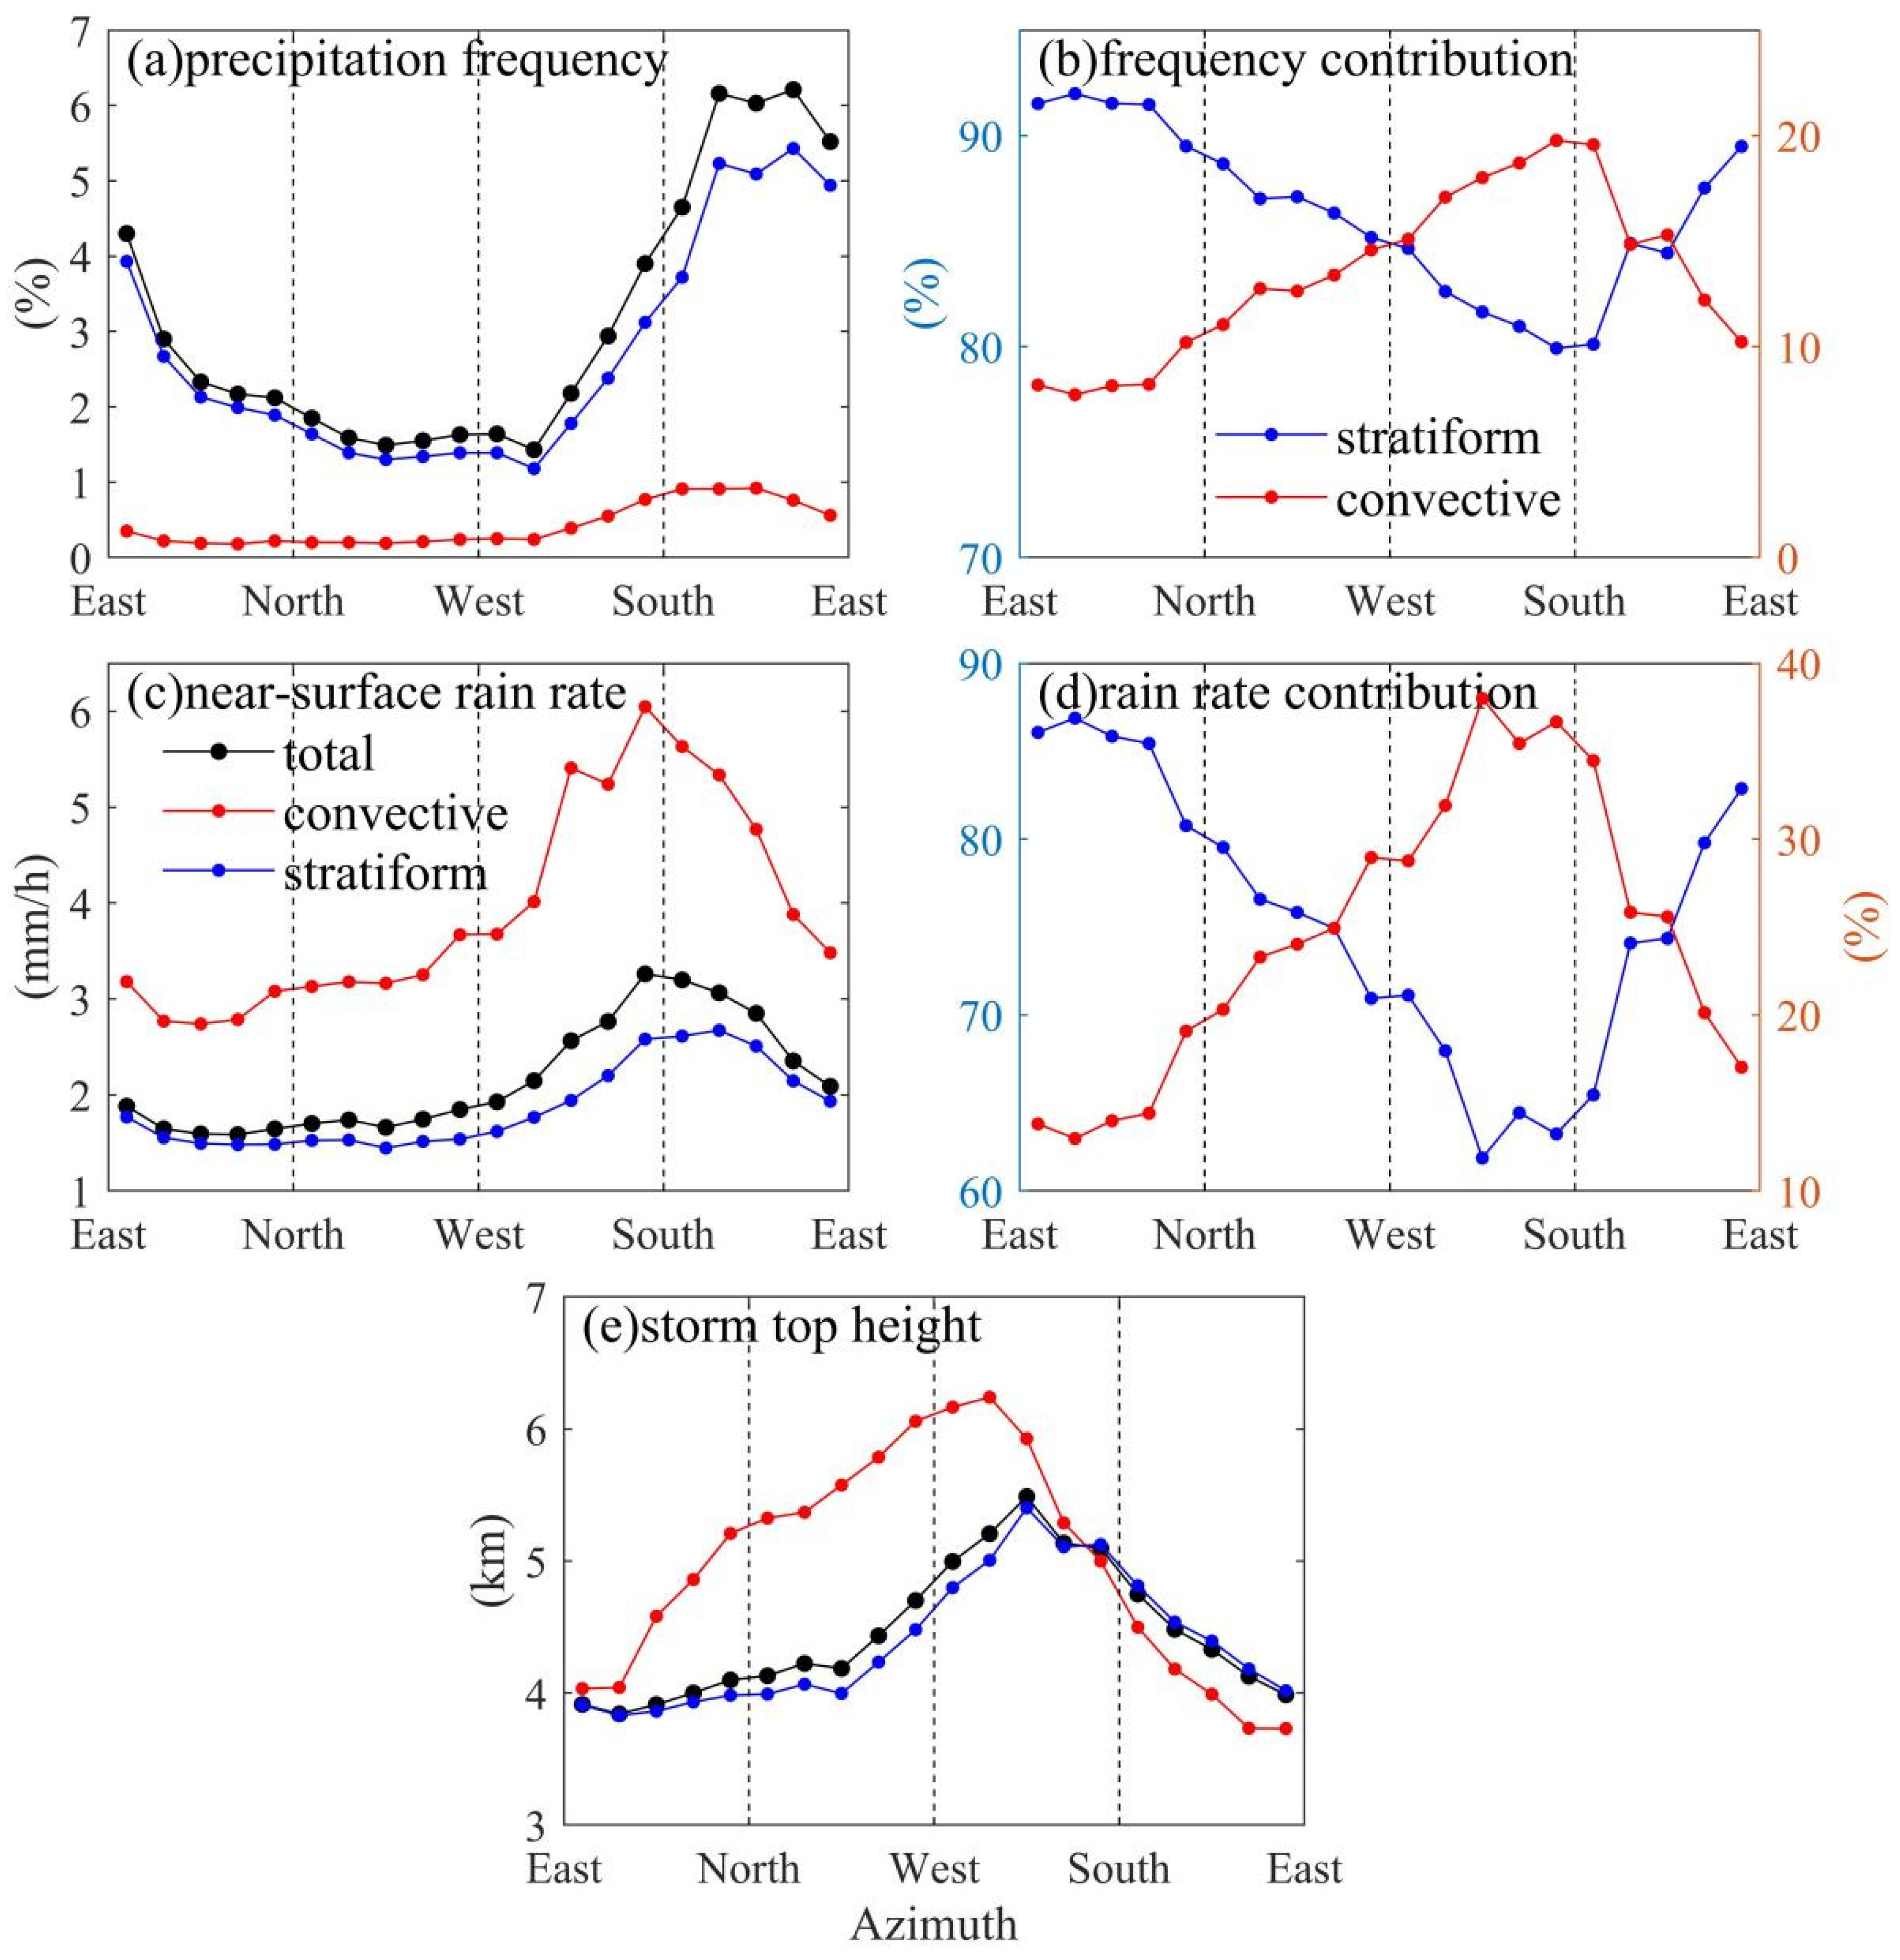
3.2.1. Precipitation Characteristics

The above studies show that there is a significant asymmetric structure in the horizontal distribution characteristics of stratiform and convective precipitation in the NCCV. In order to understand the distribution characteristics and differences of precipitation in different directions within the NCCV, the azimuth distribution of precipitation frequency, near-surface rain rate, precipitation frequency contribution, precipitation amount contribution, and storm-top height within 2000 km of the NCCV center are given in Figure 6.
The peak value of precipitation frequency is in the southeast quadrant of the NCCV for different rain types (Figure 6a). In each direction of the NCCV, the frequency of stratiform precipitation is greater than that of convective precipitation. This indicates that the NCCV precipitation is dominated by stratiform precipitation, which is consistent with the horizontal distribution (Figure 3e,f). The convective precipitation frequency changes slightly in the northern half of the NCCV, while it gradually increases from west to southeast, and then gradually decreases to the east. The peak of the precipitation frequency is about 1% in the southeast of the NCCV. The frequency of stratiform precipitation varies greatly in different directions of the NCCV. From the east side of the NCCV to the southwest, the frequency of stratiform precipitation gradually decreases and reaches the minimum in the southwest of the NCCV, about 1.3%. Then to the southeast, the frequency of precipitation increases rapidly and reaches the peak in the southeast of the NCCV, about 4%. The azimuthal distribution of the total precipitation frequency is basically consistent with that of stratiform precipitation but is larger than that of stratiform precipitation in each direction.
The peak of average rain rate in the NCCV is in the south of the NCCV (Figure 6b) for convective and stratiform precipitation, which is more westward than the peak of precipitation frequency. In all directions in the NCCV, the convective rain rate is higher than that of stratiform precipitation. The convective rain rate varies greatly in different directions of the NCCV. It gradually increases from the east side to the south side in the NCCV and reaches the peak in the southwest (about 6 mm h−1), and then gradually decreases to the east side. The stratiform rain rate changes little in the northern region of the NCCV and gradually increases from the west to the south. The peak is in the south of the NCCV, about 2.67 mm h− 1. From south to east, the stratiform rain rate gradually decreases. Due to the high proportion of stratiform precipitation, the azimuth distribution characteristics of the total rain rate are basically the same as the stratiform rain rate, which is not described here.
In all directions within the NCCV, the precipitation frequency and amount contribution for stratiform precipitation is greater than those of convective precipitation; they are generally between 80% and 90%, and 60% and 90%, respectively. The precipitation amount and frequency contribution for stratiform precipitation are the lowest in the southwest quadrant and the highest in the northeast quadrant of the NCCV (Figure 6c,d). On the contrary, the contribution of convective precipitation is the highest in the southwest region and the lowest in the northeast region. The precipitation frequency and amount contribution for stratiform precipitation increase slightly from the east to the south of the NCCV, reaching the peak in the northeast quadrant, about 92% and 87%, respectively. After that, they gradually decrease and reach the valley in the southwest, at about 80% and 62%, respectively. On the contrary, the peak value of convective precipitation contribution is in the southwest of the NCCV center; the contribution of precipitation frequency and the amount is about 19.8% and 37%, respectively. The valley value is in the northeast, where the frequency contribution is about 7.7% and the precipitation amount contribution is about 13%.
The peak of average storm-top height for all types of precipitation in the NCCV is in the southwest quadrant of the NCCV, while the peak of convection is more westward. The valley of the storm-top height is in the east (Figure 6e). The storm-top height of convective precipitation in the southeast of the NCCV is smaller than that of stratiform, while it is opposite in other quadrants. The storm-top height of convective precipitation varies greatly in different directions. From the east side to the southwest side, it gradually increases, reaching a peak in the southwest, about 6.24 km, and then to the east side, the storm-top height gradually decreases, reaching the valley value in the east. The storm-top height peak value of stratiform precipitation is about 5.4 km in the southwest, and the valley value is about 3.83 km in the east of the NCCV. The azimuth distribution of storm-top height for total precipitation is basically consistent with that for stratiform precipitation, which is related to the large proportion of stratiform precipitation in the NCCV.

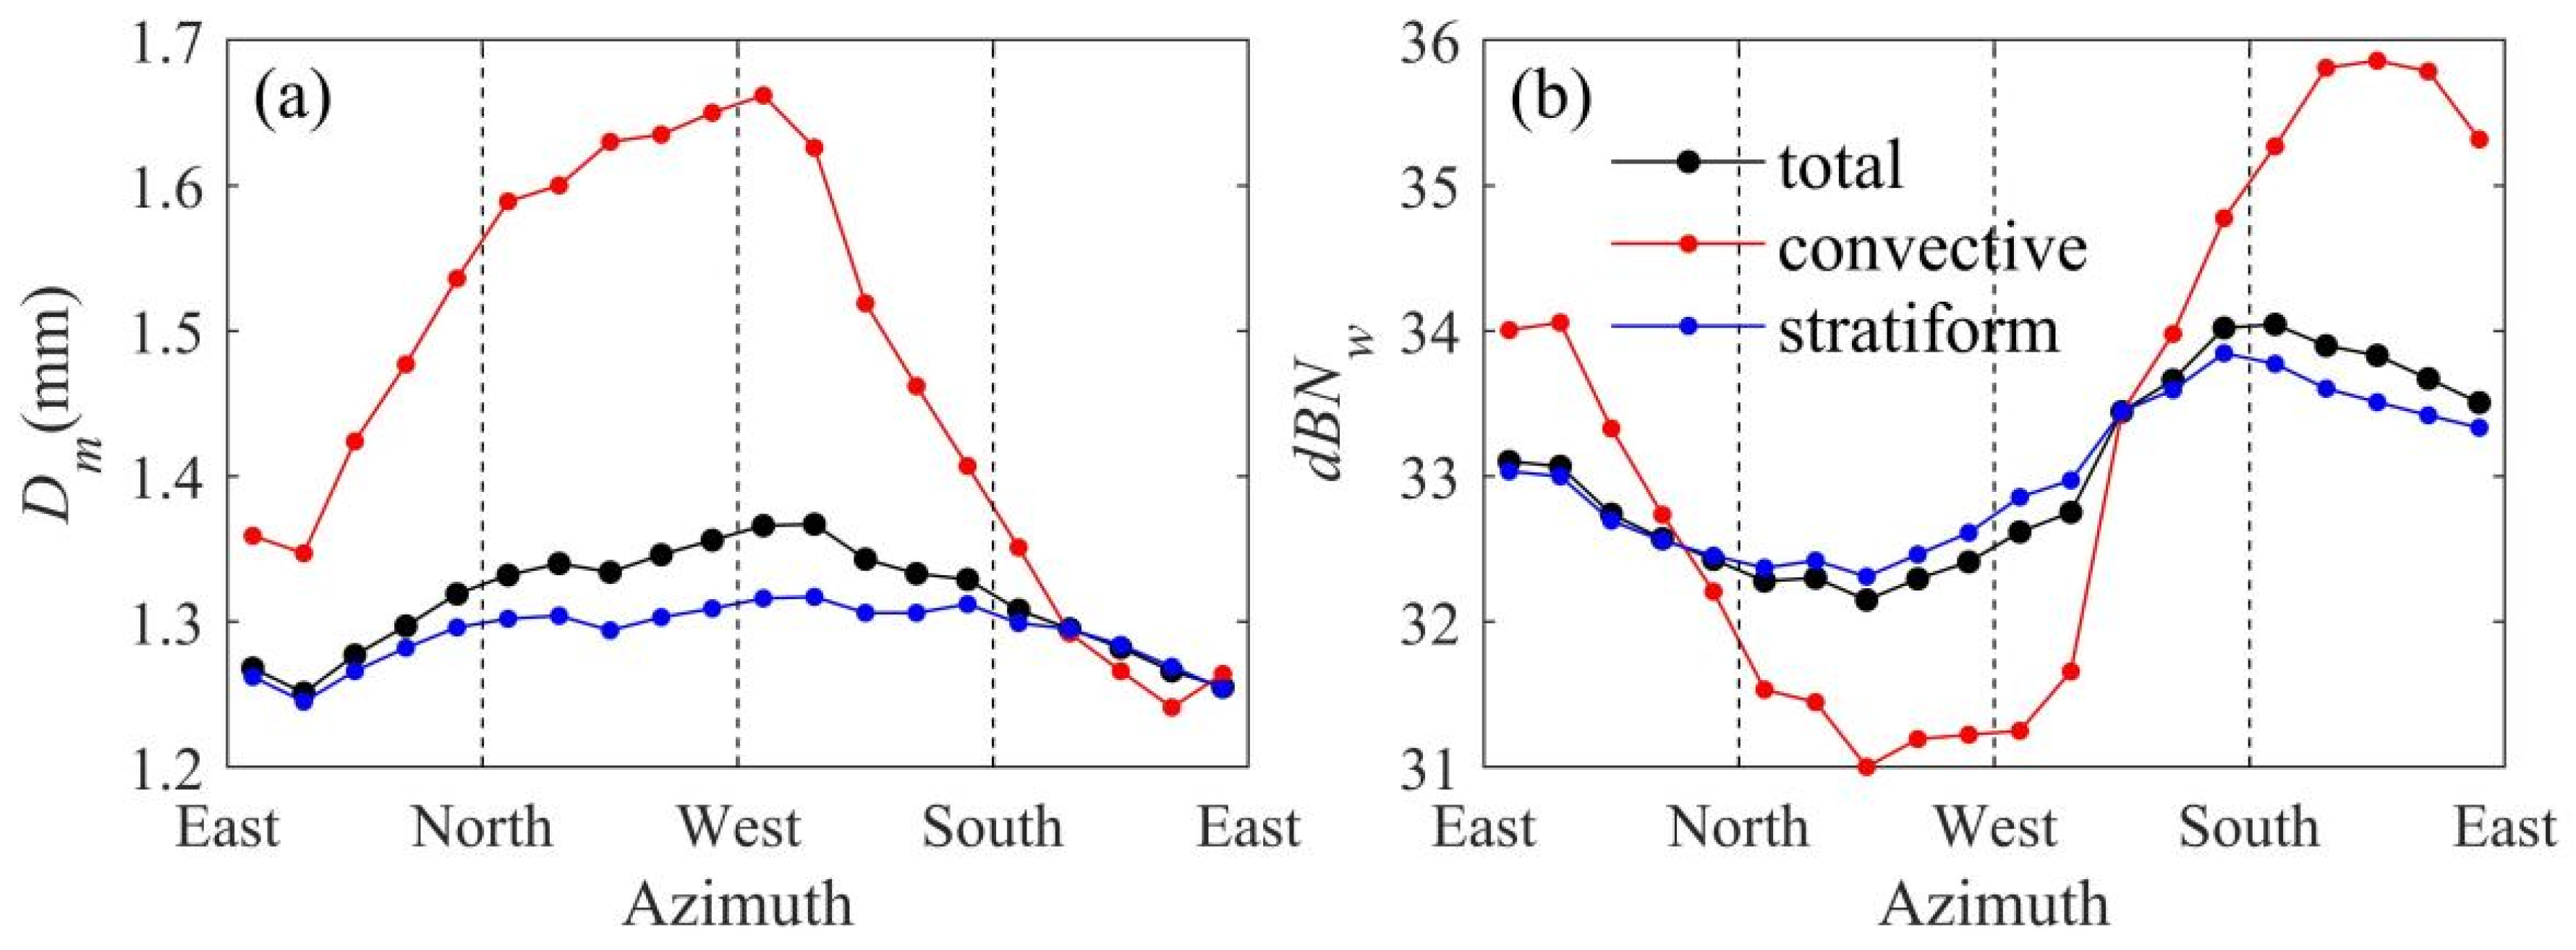
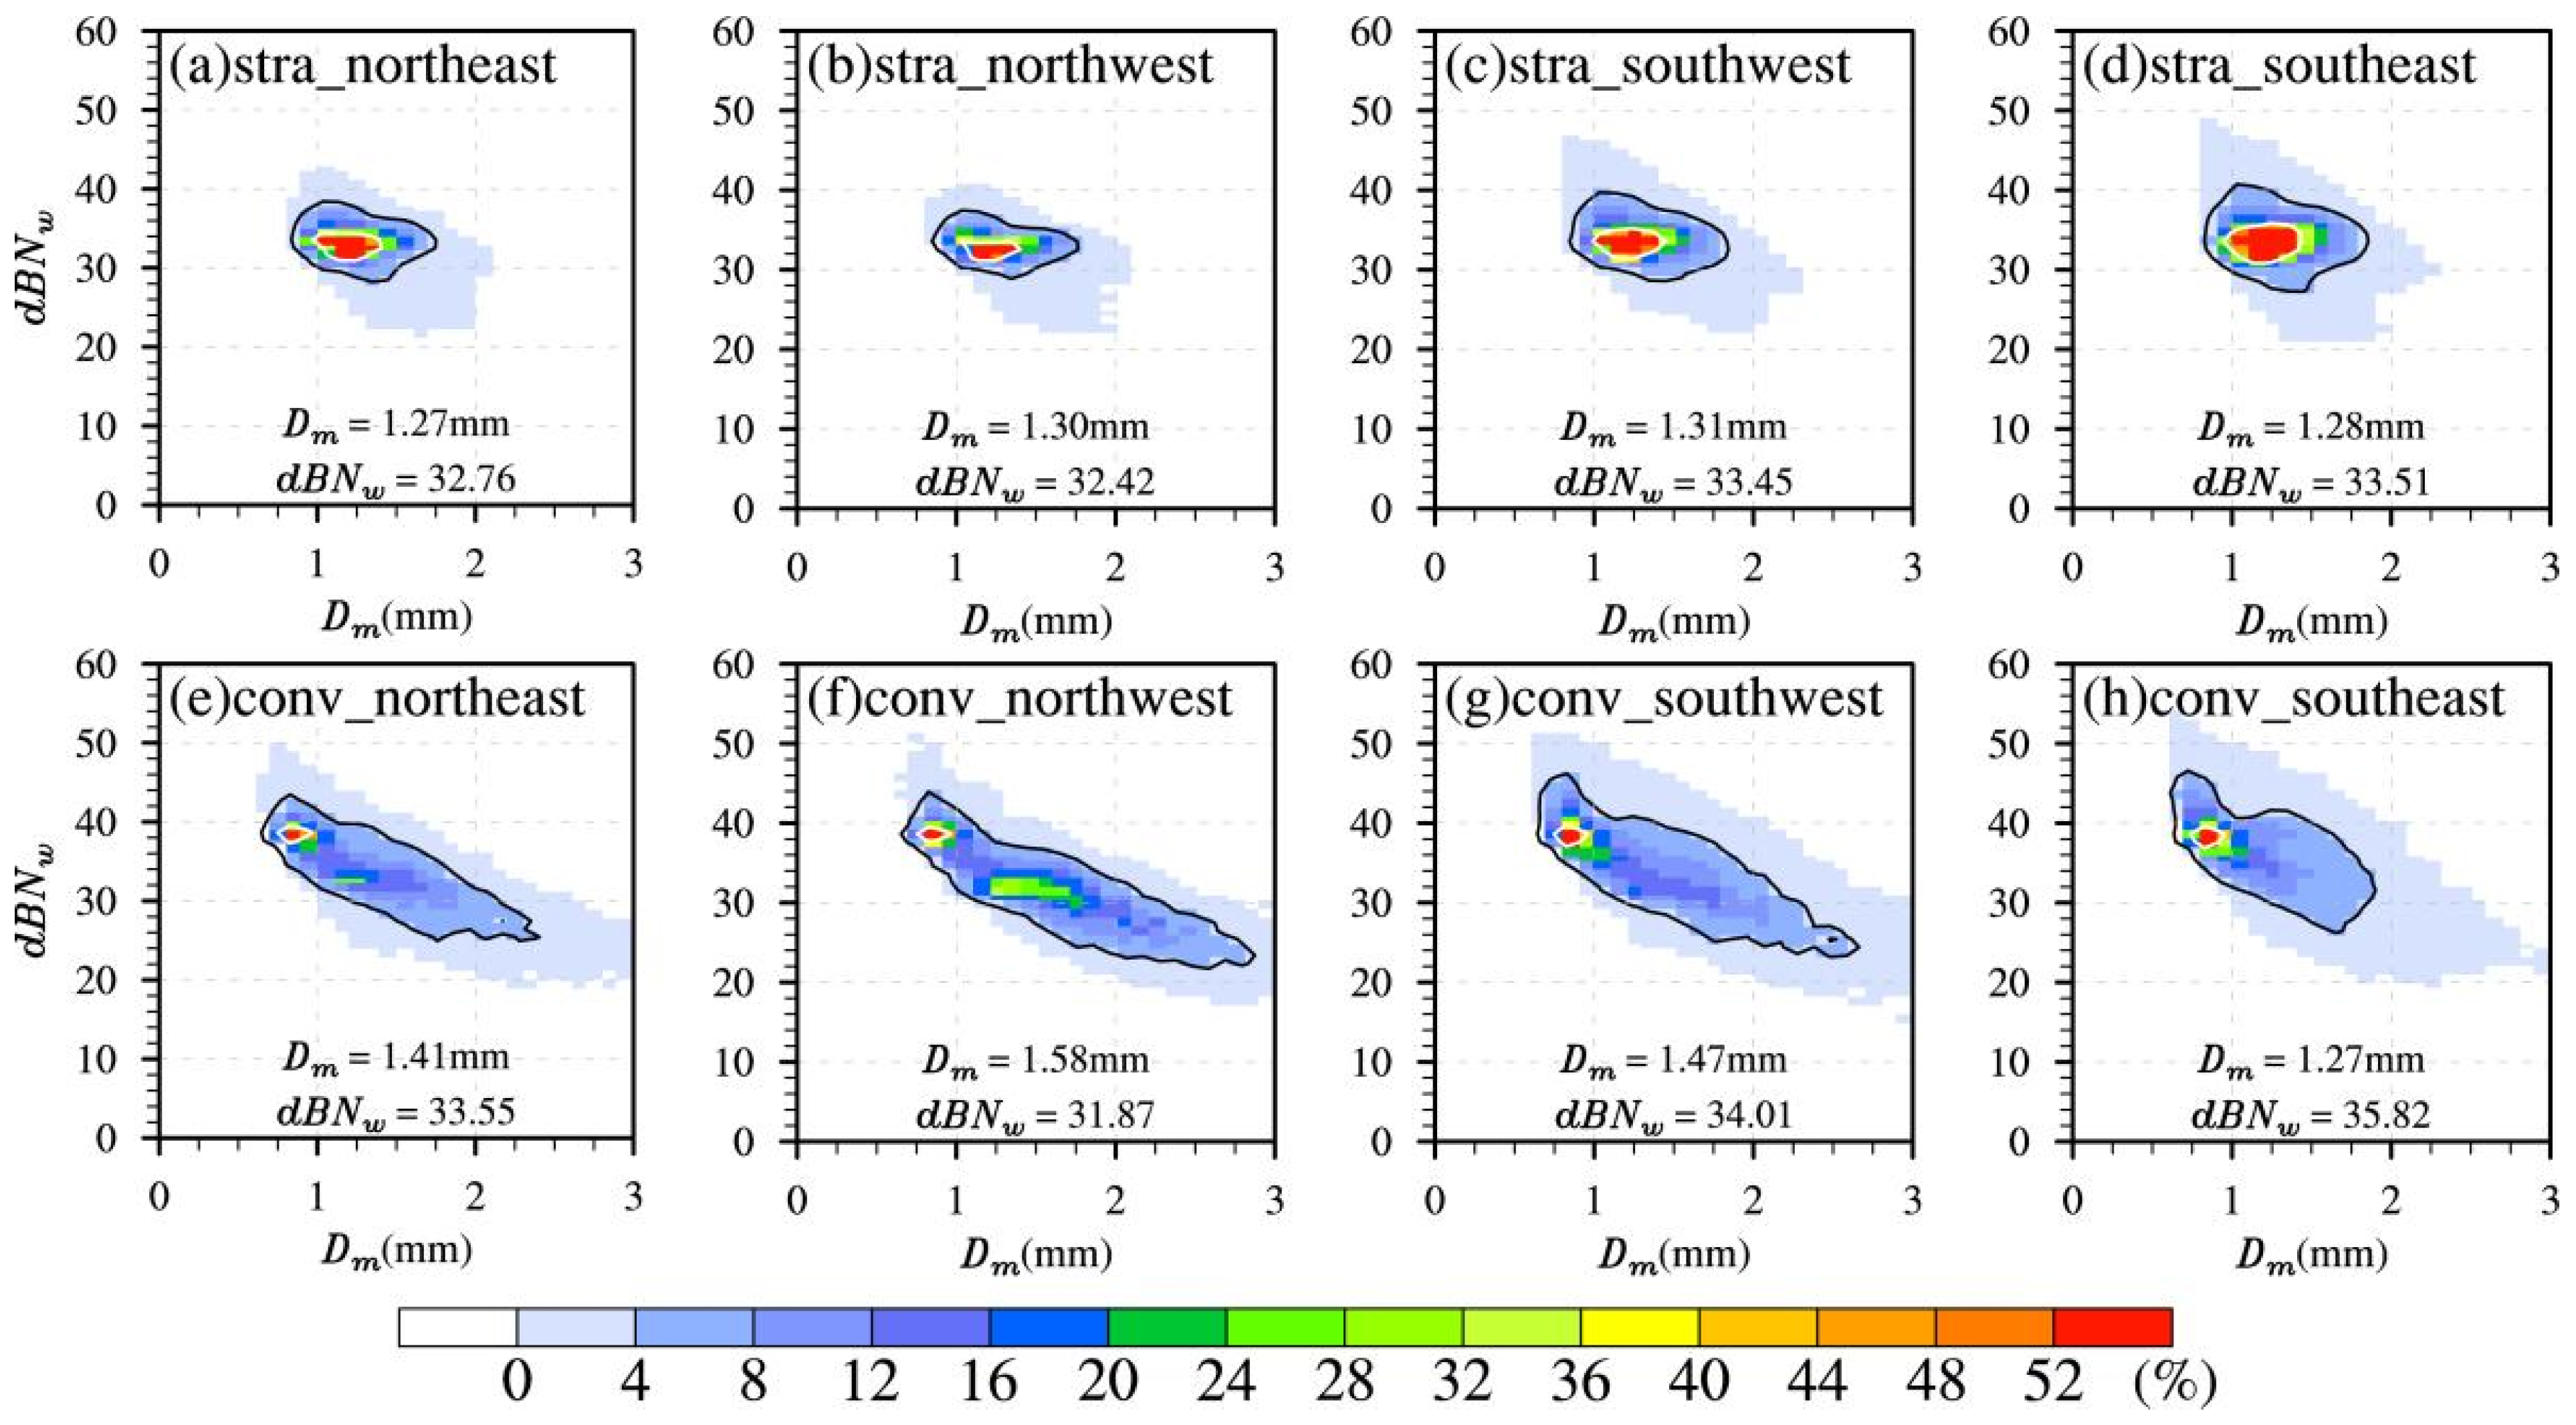
3.2.2. Characteristics of Near-Surface Microphysics

Figure 7a,b shows the azimuthal distribution of near-surface Dm and dBNw of the total, stratiform, and convective precipitation in the NCCV. The Dm for different types of precipitation shows obvious asymmetry, and the azimuth distribution characteristics are similar (Figure 7a). The peak values are in the west of the NCCV, and the valley values are in the east. Except for the southeast quadrant, the Dm of convective precipitation is generally larger than that of stratiform in all directions. The Dm of convective precipitation changes the most in different directions within the NCCV (the asymmetry is more obvious). From the east side of the NCCV to the west side, the Dm gradually increases and continues to the east side, where the Dm gradually decreases. The peak value in the west is about 1.66 mm, and the valley value is in the southeast, about 1.24 mm. For stratiform precipitation, the average azimuthal variation of Dm is small, with a peak of about 1.32 mm in the west and a valley of about 1.25 mm in the east. The Dm distribution of total precipitation is similar to that of stratiform precipitation.
The azimuth distributions of dBNw for different types of precipitation are also obviously similar (Figure 7b). In the southeast or south of the NCCV, the concentration of precipitation particles is the highest (~36); the lowest is in the northwest (~31) for both convective and stratiform precipitation. The variation of convective precipitation in different directions is larger than that of stratiform clouds. From the east side of the NCCV to the northwest side, the particle concentration gradually decreases, and then to the southeast side, the particle concentration gradually increases. The peak value in the southeast is about 35.9, and the valley value in the northwest is about 31. For stratiform precipitation, the peak value is about 33.8 in the south, and the valley value is about 32.3 in the northwest. The particle concentration distribution of total precipitation is basically consistent with that of stratiform. In general, the concentration of convective precipitation systems will have lower concentration and larger hydrometeors, while in Figure 7b, except in the southeast and northeast quadrants of the NCCV, the concentration of droplets in convective precipitation is relatively smaller, which proves that the microphysical distribution varies with weather systems [21,23,24,33]. However, for a specific type of precipitation, the peak and valley values of particle concentration are opposite to that of Dm, which is related to the characteristics of the droplet-size distribution (high-concentration small particles or low-concentration large particles). This is consistent with the research results of Qi et al. [15] that particle concentration and diameter showed a negative correlation. In addition, compared to Dm, near-surface rain rates for the different types in the NCCV (Figure 6b) are closer to the azimuth distribution of the dBNw. Especially for stratiform precipitation, the peak of heavy rain rate in the south corresponds well to the peak of high concentrations of hydrometeors in the south.
The above results reveal the different characteristics of near-surface DSDs of the NCCV precipitation in different directions. In order to further analyze the near-surface microphysics at different positions in the NCCV and study the corresponding relationship between particle concentration and particle size, Figure 8 shows the two-dimensional frequency distribution of dBNw and Dm at 2.5 km in four quadrants for convective and stratiform precipitation in the NCCV coordinate system. The stratiform and convection in each quadrant generally have high concentrations of small particles and low concentrations of large particles. The DSDs of stratiform precipitation are more concentrated, while the DSDs of convective precipitation are much wider, with higher concentrations and larger hydrometeors.
For stratiform precipitation (Figure 8a–d), the particle Dm is mainly concentrated between 0.8 and 2.4 mm, and the dBNw is mainly between 22 and 46. There are differences in DSDs in different quadrants. The DSDs in the southeast quadrant are the widest, followed by the southwest quadrant, and the average particle concentration is higher and the diameter is larger in the two quadrants, corresponding to a high rain rate. For convective precipitation (Figure 8e–h), the Dm is concentrated between 0.6 and 3.0 mm, and the dBNw is between 18 and 52. The difference of DSDs in different quadrants is more significant than that in stratiform clouds. There are two peak centers of DSDs, located in the northeast and northwest quadrants of the NCCV. One peak center is concentrated on Dm in the range of 0.8–1 mm, and the dBNw is concentrated in the range of 38–40, which is composed of a high concentration of small particles. Another peak center is concentrated when Dm ranges from 1.25 to 1.75 mm, and the dBNw is concentrated from 30 to 34, which indicates a low concentration of large particles probably resulted from deep convection. However, there is only the former DSD peak center in the southwest and southeast quadrants, which may be caused by a higher proportion of shallow convective precipitation in these regions. For the southeast and southwest quadrants with higher convective rain rates, the strong convective precipitation on the southeast side of the NCCV is mainly contributed to by near-surface high-concentration hydrometeor particles. The average diameter of the hydrometeor particles is the smallest, 1.27 mm, while the dBNw is the largest, 35.82. The DSDs are also more concentrated on large dBNw values and small Dm values (high particle concentration and small particle diameter, indicated by white solid lines), with few particles with Dm higher than 2 mm. The stronger convective rain rate in the southwest quadrant is contributed to by higher particle concentration (dBNw = 34.01) and larger particle size (Dm = 1.47 mm).

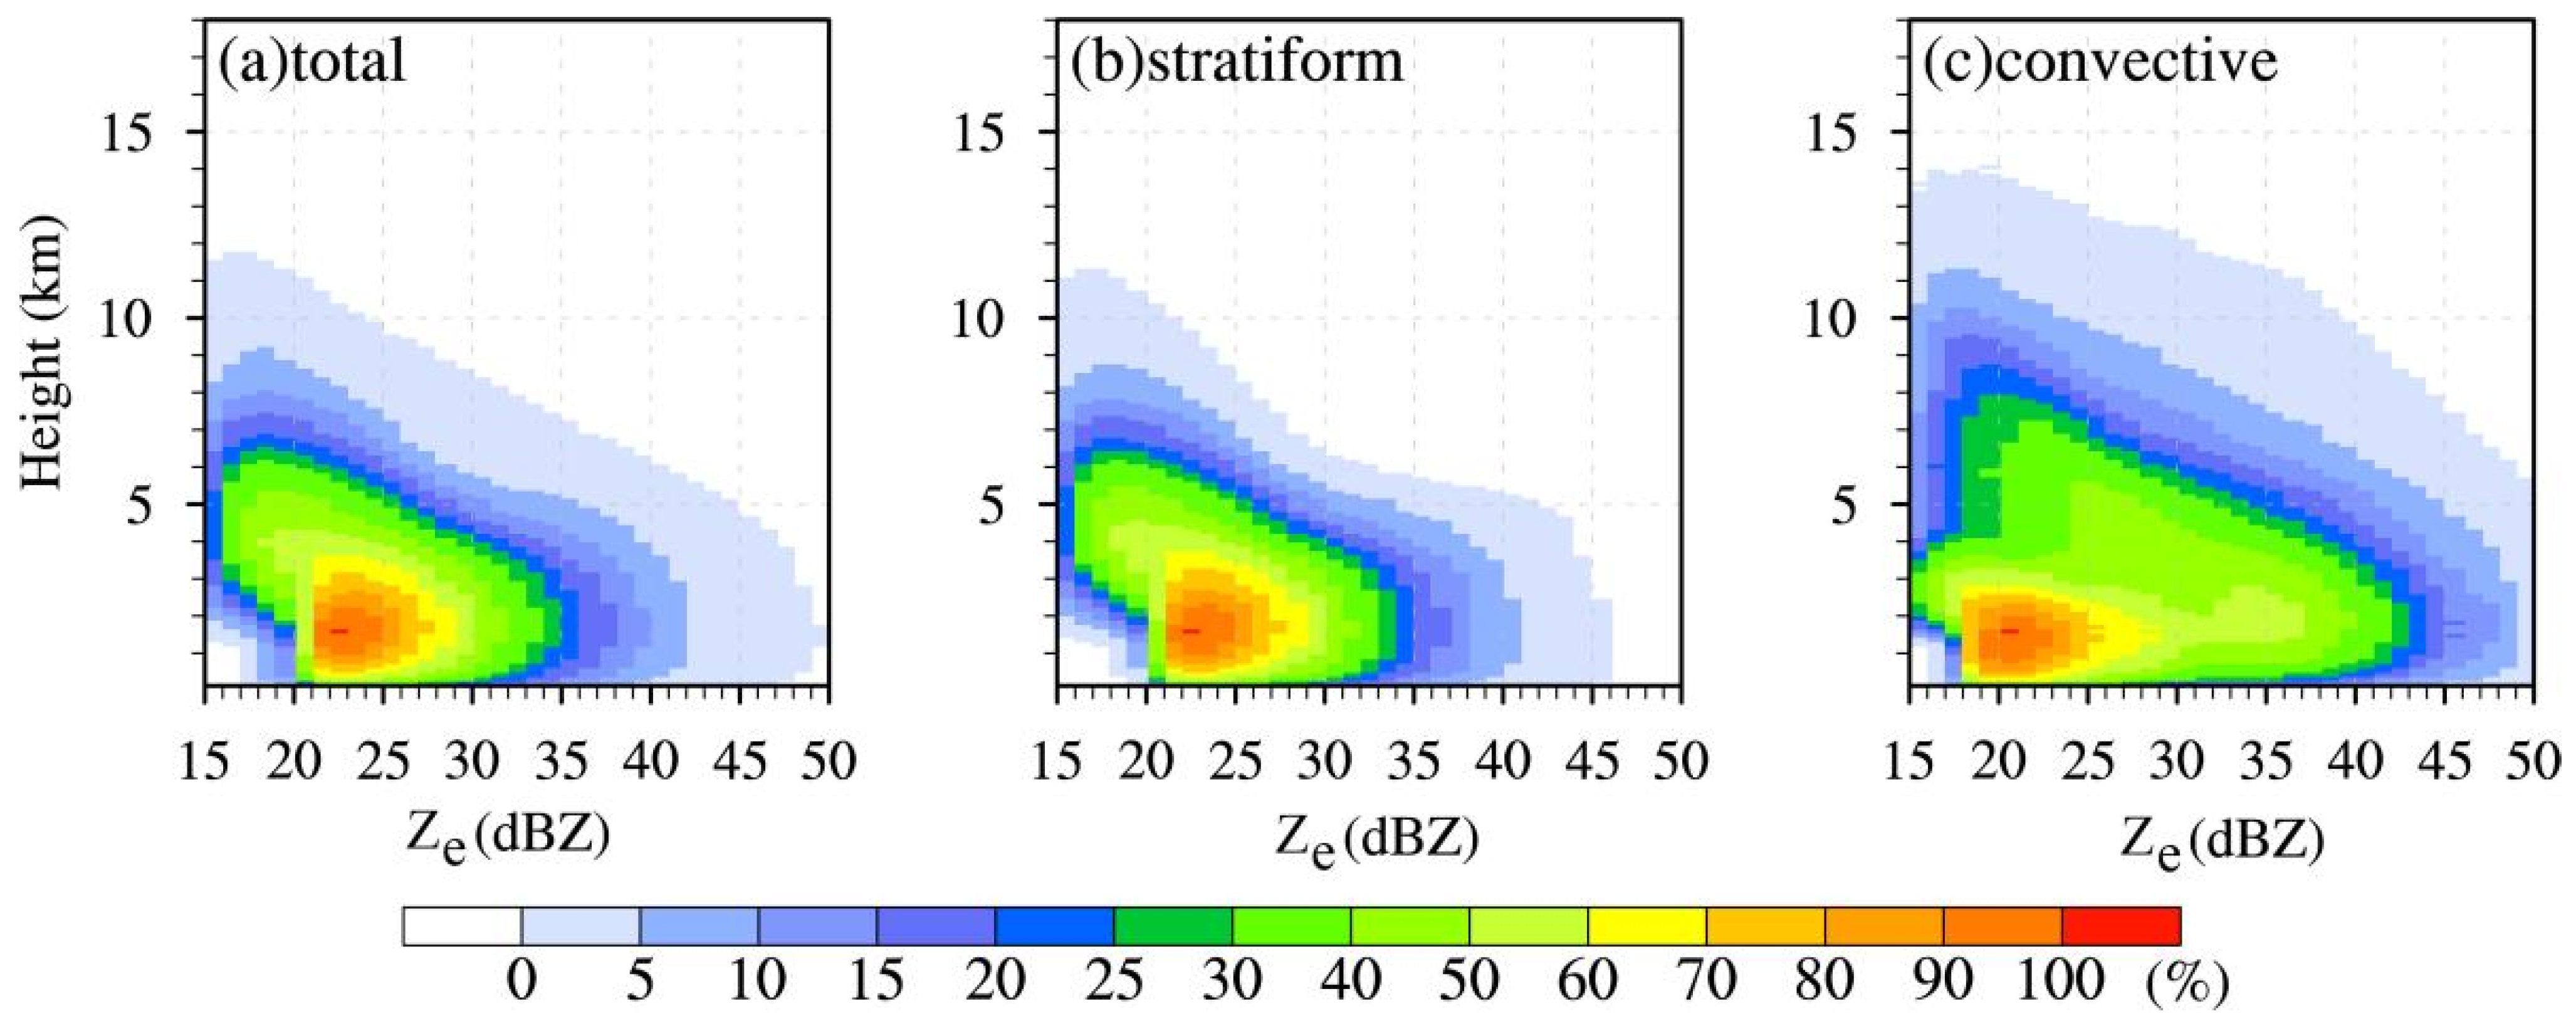
3.3. Vertical Structure Characteristics of Stratiform and Convective Precipitation in NCCV

3.3.1. Precipitation Characteristics

The vertical distribution structure of the radar echo of precipitation can effectively reflect the vertical distributions of solid, liquid, and solid–liquid mixed particles in the NCCV precipitation cloud. Contoured frequency by altitude diagram (CFAD) is helpful to clearly show the vertical structure characteristics of the NCCV precipitation. Figure 9 shows the CFAD distribution of radar reflectivity of total, stratiform, and convective precipitation within 2000 km in NCCV coordinate systems from 2014 to 2019. Above 4 km, the radar reflectivity factors for all types of precipitation increase rapidly with the decrease in height, and the hydrometeors such as supercooled water and ice crystals in this layer continue to freeze and grow through the Bergeron process. For total precipitation (Figure 9a) and stratiform precipitation (Figure 9b), radar echoes are mainly distributed between 20 dBZ and 29 dBZ below 4 km, and as the height decreases, the radar reflectivity factor can reach a larger value, showing a wider radar reflectivity factor spectrum. The frequency of 40 dBZ can reach 5%, reflecting the collision-growth process of particles. For convective precipitation below 4 km, the increase in radar reflectivity factor is more obvious with the decrease in height, reflecting the more obvious collision-growth process. Compared to stratiform clouds, the radar reflectivity factor spectrum of convective precipitation below 4 km is wider, which is distributed from 17 dBZ to 50 dBZ. There is a shallow precipitation characteristic area, the echo is concentrated below 3 km, and the echo is between 17 dBZ and 28 dBZ. Another echo center is below 3 km, and the echo is in the range of 32–37 dBZ, indicating deep convection. These two echo centers corresponded well to the two frequency centers of near-surface DSDs (Figure 8). Particularly, there is a clear BB feature for stratiform precipitation, showing a sudden increase in echo impacted by the melted ice particles at the height of approximately 3~4 km in altitude.
In order to further explore the vertical variation characteristics and differences of precipitation in different quadrants within the NCCV, Figure 10 shows the CFADs of radar reflectivity for total, stratiform, and convective precipitation in each quadrant within 2000 km in the NCCV coordinate system from 2014 to 2019. For stratiform precipitation (Figure 10a–d), the echo top in the southwest quadrant is the highest and the echo is the strongest, followed by the southeast quadrant of the NCCV. The echo top of stratiform precipitation in the southwest quadrant of the NCCV is about 12 km, and the echo is mainly concentrated below 5 km, distributed between 20 dBZ and 30 dBZ. The echo top of the southeast quadrant is about 11 km, and the echo is concentrated below 4 km, distributed in 20–30 dBZ. The storm-top heights of the northwest and northeast quadrants are 10 and 9 km, respectively, and the echoes are concentrated below 4 km, distributed from 20 dBZ to 28 dBZ. Significant BB characteristic areas can be seen in each quadrant. The BB is higher in the southwest and southeast quadrants, indicating that the melting layer is also higher. Below 5 km, as the height decreases, the radar reflectivity factor value in the southeast quadrant can reach a greater value, the spectral width is wider, and the particle collision-growth process is the most obvious. This may be due to the relatively stronger upward movement in the southeast quadrant, and the raindrops fall against the airflow, which is conducive to rapid collision growth.
For convective precipitation (Figure 10e–h), the echo height and intensity in each quadrant are greater than those of stratiform precipitation, and the echo spectrum width is much wider. As the height decreases, the echo spectrum width increases more significantly, indicating that the collision growth of particles is more obvious. The CFAD in each quadrant is significantly different. In the southeast and northeast quadrants, the width of the echo spectrum increases more significantly as the altitude decreases, indicating that the collision growth of particles is more obvious. The shallow convection characteristic area can be seen in each quadrant, and the echo is concentrated below 3 km, distributed in 18–27 dBZ. This characteristic is particularly significant in the southeast quadrant of the NCCV. Probably because this area is mostly located in the ocean, shallow convection occurs easily on the sea surface, resulting in a high proportion of shallow convection and an obvious characteristic area. In the other three quadrants, a deep convective feature area can be seen, and the echo is generally concentrated in 32–39 dBZ, which is particularly significant in the northwest quadrant of the NCCV. In the northwest and southwest quadrants of convective precipitation (Figure 10f,g), the storm-top height is higher, and the radar echo above 4 km altitude is stronger, which increases rapidly with the decrease in height, reflecting the microphysical processes such as ice-crystal and rime growth. Below 4 km in altitude, the radar echo also increases rapidly with the decrease in height, which reflects the obvious collision-growth process in this area, which is consistent with the discovery that the near-surface particles have larger diameters and smaller concentrations (Figure 5).
In order to further explore the precipitation structures in the NCCV at different directions and heights, the azimuthal average profiles of radar reflectivity for total, stratiform, and convective precipitation within 2000 km in the NCCV coordinate system from 2014 to 2019 are presented in Figure 11. For total precipitation (Figure 11a) and stratiform precipitation (Figure 11b) below 10 km, the reflectivity factor increases with the decrease in height. This phenomenon is the most significant in the southeast quadrant, indicating collision growth of particles, corresponding well to the high rain rate in the quadrant. For convective precipitation (Figure 11c), the echo intensity of each position in the NCCV is greater than that of the stratiform. The reflectivity factor in the southwest and northwest quadrants of the NCCV increase with the decrease in height, indicating that the particles continue to collide and grow during the falling process. The height of the convective echo top in some areas within the southwest of the NCCV is higher than 14 km, indicating that there is penetrating convection in the area [34]. In the southeast and northeast, the echo is smaller than that in the west side of the NCCV, which is different from the results of the individual case [17] that the east of the NCCV corresponds to a strong echo. In the southeast quadrant of the NCCV, the storm heights in some areas can be as high as 14 km, but the frequency of occurrence of these deep clouds over this region is relatively low. The reflectivity of the upper layer is the smallest, part of which is lower than 21 dBZ, and the reflectivity near the height of 4 km is up to 28 dBZ. The reflectivity factor increases rapidly with the decrease in height, indicating that the particle collision growth is more obvious. However, within the height of 2–3 km, there is a relatively weak echo area, which may be due to the breakup of particles in the lower layer, showing that the particle diameter decreases significantly and the concentration increases.

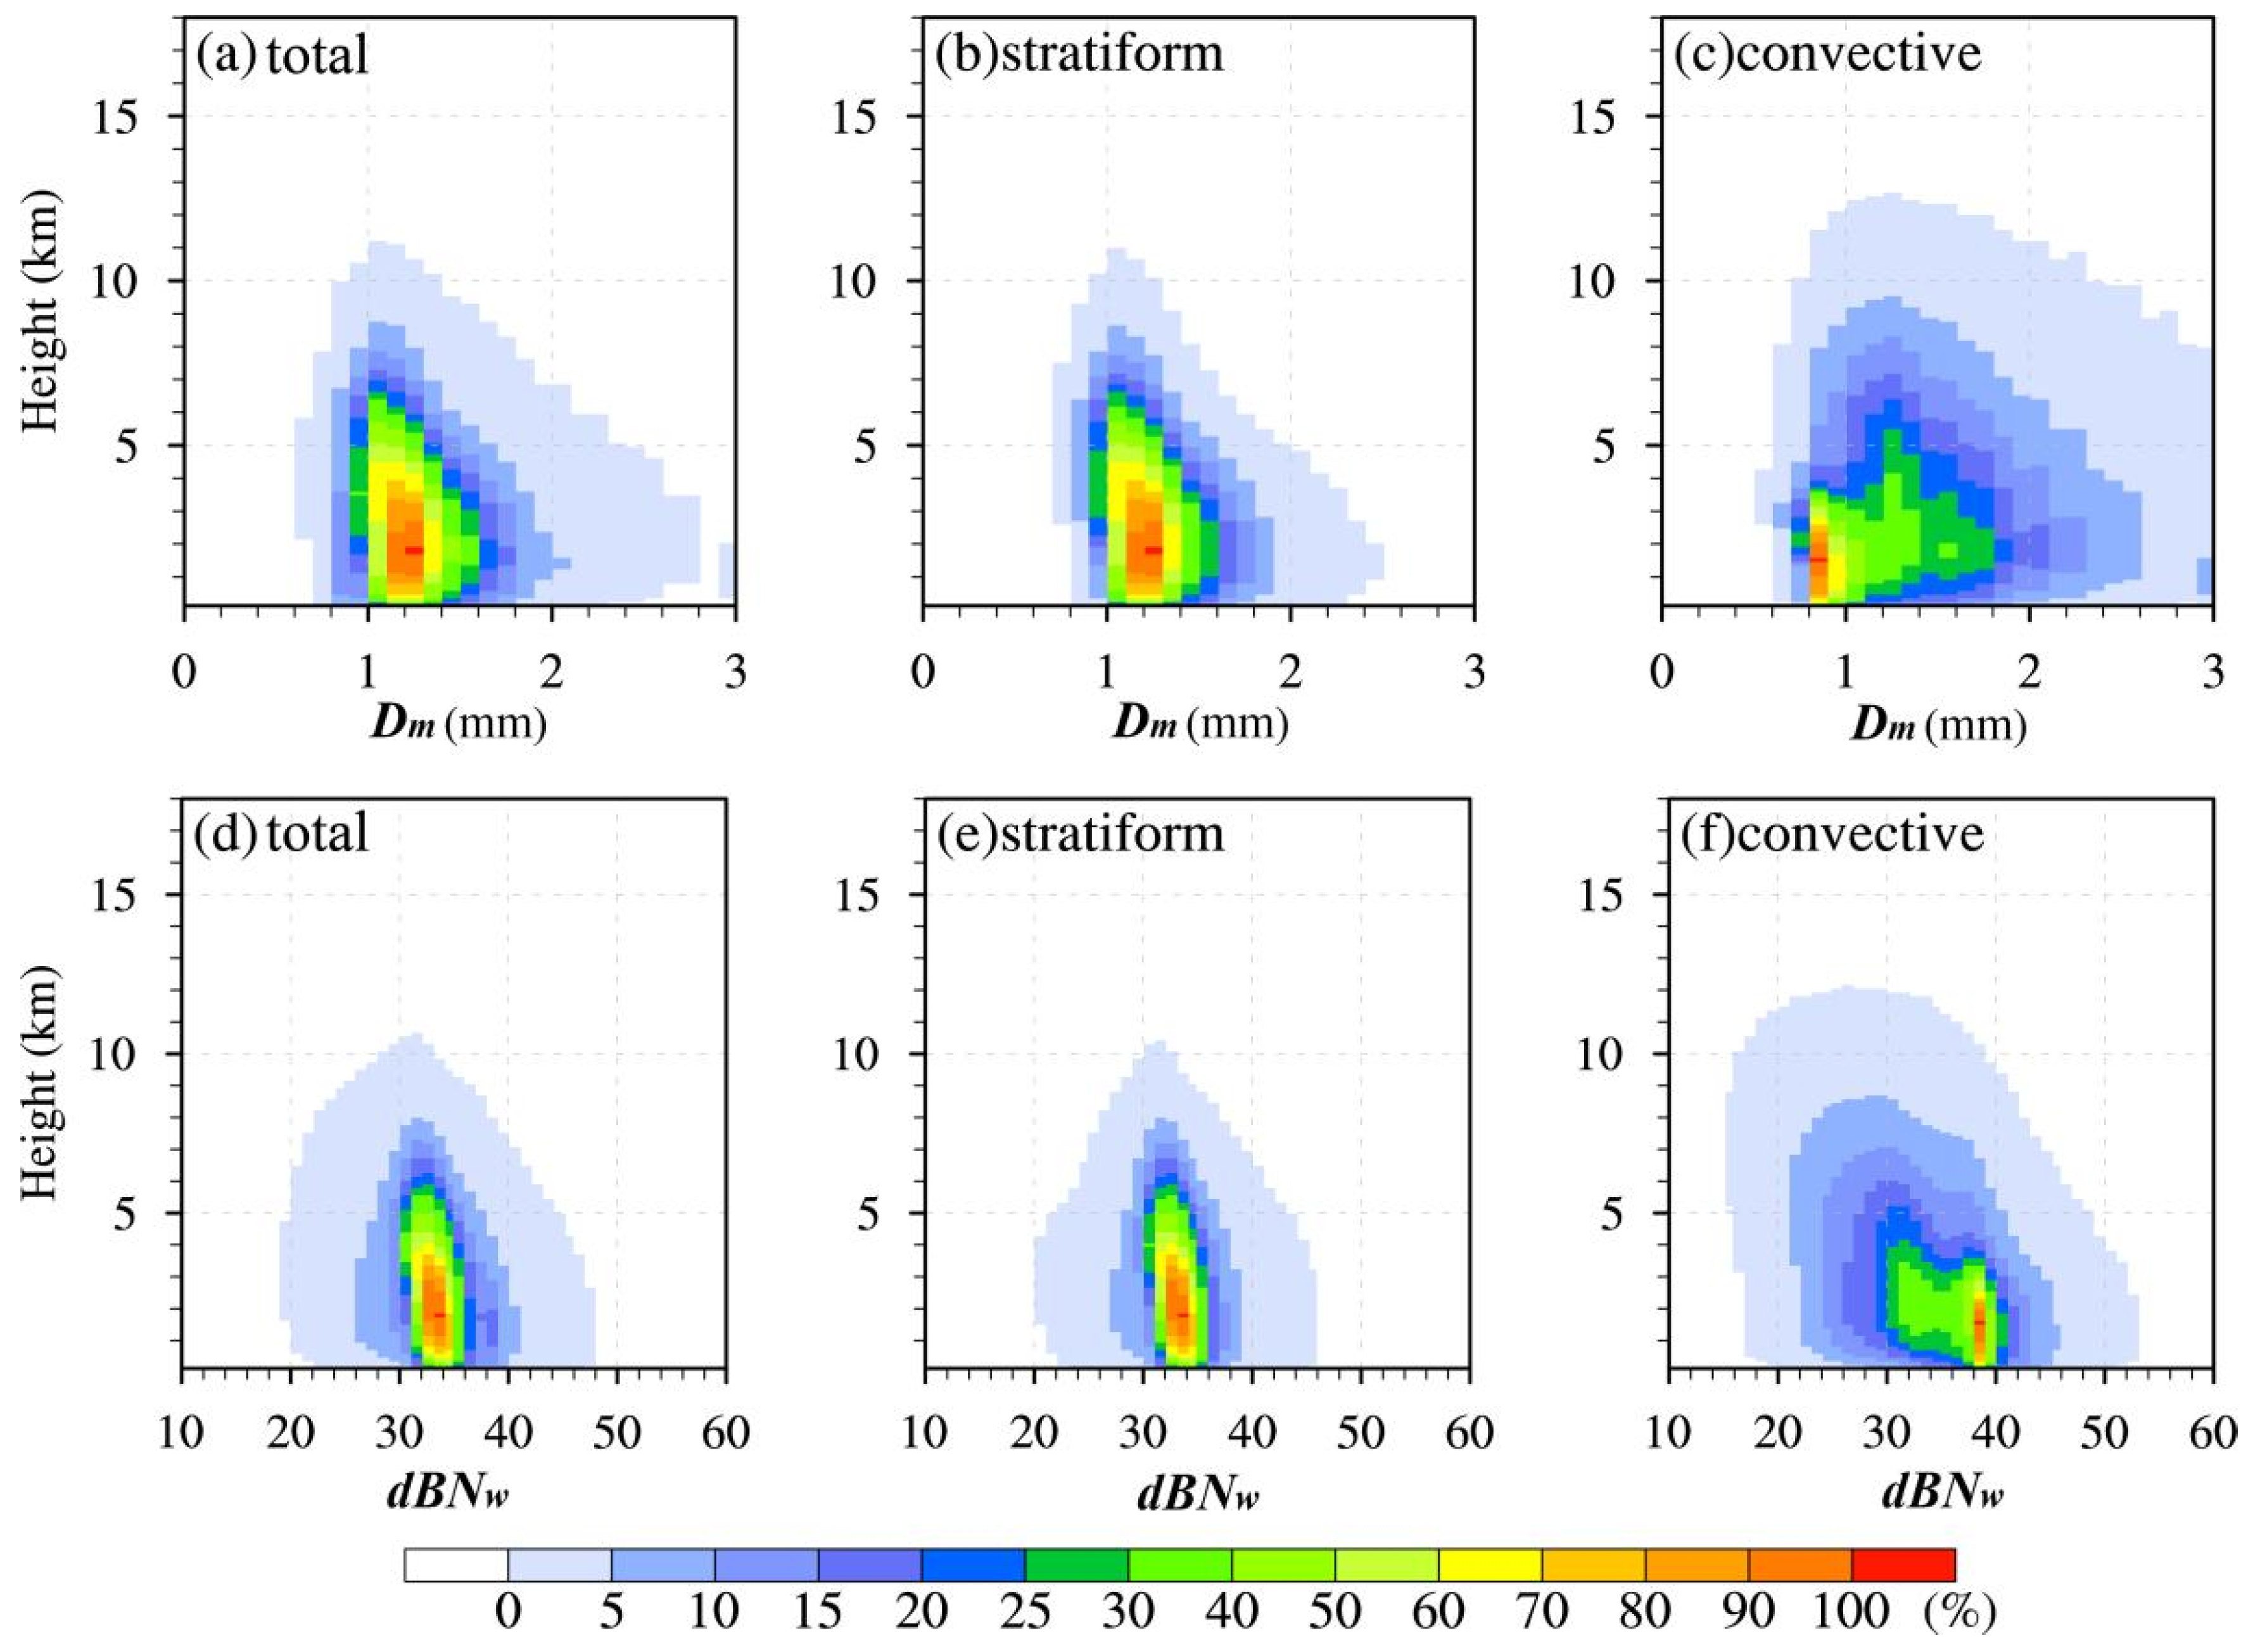
3.3.2. Microphysical Structures

The intensity of precipitation echo is affected by both particle concentration and particle size. Figure 12 shows the CFAD of Dm and dBNw of total, stratiform, and convective precipitation within 2000 km in the NCCV coordinate system from 2014 to 2019. The dBNw of convective precipitation is larger (smaller) than that of stratiform below (above) 5 km in altitude. The Dm of convective precipitation is larger than stratiform precipitation above 5 km in altitude. The stronger ascending motion within convective clouds may bring hydrometers to higher altitude and increases the chances of collision, which eventually leads to large-sized hydrometeors and low concentrations. The Dm of total precipitation (Figure 12a) is concentrated between 0.6 and 2.8 mm at each height layer, and the dBNw is almost concentrated between 20 and 48 (Figure 12d); the Dm of stratiform precipitation (Figure 12b) is mainly concentrated between 0.8 and 2.4 mm, and the dBNw is almost concentrated between 20 and 46 (Figure 12e). The Dm of convective precipitation (Figure 12c) is mainly concentrated between 0.6 and 3 mm, and the distribution of dBNw is mainly concentrated between 18 and 52. As the height decreases, the particle diameter and concentration of convective and stratiform precipitation increase, and the spectral width increases, which corresponds to the increase in reflectivity. In convective precipitation, there are two high-frequency regions for particle concentration and size. Particles with a Dm of 0.8 to 1 mm and a dBNw of 38 to 40 correspond to shallow convection and mainly high concentrations of small particles. Another high-frequency characteristic region corresponds to deep convection. The Dm is within 1.2 to 1.6 mm, and the dBNw is 30 to 36.

4. Discussion

It is important to know the limitations of the present study. To obtain the NCCV center, ERA5 data at a temporal resolution of 1 h and a spatial resolution of 0.25 degree are used in this study. Despite the high spatial–temporal resolution, it is still coarser than that of the DPR observations. The uncertainties during the processes in the identification of the NCCV center may introduce uncertainties to the results. However, the relatively large number of samples (6432 NCCVs) included in the synthetic analysis may partially cancel out the uncertainties. These things considered, since the GPM cannot continuously observe the precipitation systems, the analysis of the particle growth and precipitation process formation can only be derived by deduction, based on the dynamic composite maps.
Here, we try to provide some explanations on the distributions of NCCV precipitation frequency and intensity. First, the frequency of convective systems is relatively higher in the southern part of the NCCV. This may be because the NCCV provides a favorable circulation background to guide the cold air southward. If there are heating conditions at the lower level, an unstable stratification with high-level dry, cold air and low-level warm and humid air will be formed, which is conducive to the triggering of the convective system [5,35,36]. The warm and cold air usually intersect in the southern half of the NCCV, which is also the rear part of the warm and humid tongue [8]. At the same time, the coupling of high- and low-level jets under the background of NCCV causes a large-scale upward movement on the southeast side of the system, which invigorates deep convection and heavy rain [37]. In addition, the average storm-top height for all types of precipitation is highest in the southwest quadrant, while average rain rate in the NCCV is largest in the south of the NCCV. The mechanism of the obvious phase differences of storm-top height and rain rate is unknown, and a study of this will be carried out in our subsequent research.

5. Conclusions

To reveal the microphysical characteristics of NCCV precipitation, an NCCV coordinate system is firstly introduced in the present study. Under the coordinate system, the horizontal distribution, azimuth distribution, and vertical structures of stratiform and convective precipitation in the NCCV are hereafter explored during 2014–2019. The main findings are listed as follow.
The near-surface rain rate for convective precipitation in the NCCV is stronger than that for stratiform precipitation, while the convective precipitation frequency is lower than stratiform precipitation. The contribution of precipitation frequency and precipitation amount for stratiform precipitation are both larger than those for convection precipitation, which are generally higher than 70% and 60%, respectively. The regions with high convective and stratiform precipitation frequency have a comma-shaped distribution. With the increase in the distance from the NCCV center, the region with frequent stratiform precipitation occurrence shifts from the northeast quadrant to the southeast quadrant, while it is mainly located in the southeast quadrant for convective precipitation. The near-surface droplet sizes of the strong stratiform and convective rain rates inside the NCCV are not larger than those of smaller rain rates, while the droplet concentration is much higher. This indicates the great contribution of high droplet concentration to intense rain rate in the NCCV. The echo top of convective precipitation is higher than that for stratiform precipitation in the NCCV. Below 4 km, the radar reflectivity increases as the altitude decreases for both convective and stratiform precipitation, but with a much more obvious increase for convective precipitation, indicating more efficient collision-growth processes. Above 4 km, hydrometeor particles such as supercooled water and ice crystals in convective and stratiform precipitation grow through the Bergeron process. The stronger updraft in convective precipitation clouds may provide favorable environmental conditions for the growth of precipitation particles. As a result, the droplet concentration of convective precipitation is greater than that for stratiform below 5 km, but above 5 km, the concentration is smaller than stratiform and the droplet diameter is larger. There are shallow and deep convections in the convective precipitation inside the NCCV. Compared to shallow convection, deep convection has a larger droplet diameter, lower concentration, and stronger echo near the surface.
The precipitation and microphysical structures vary in different regions of the NCCV for stratiform and convective precipitation. Convective and stratiform precipitation mostly occurred in the south part of the NCCV, and the near-surface rain rates are also the largest in this region, especially in the southeast quadrant of the NCCV. The peak convective and stratiform rain rates are 6 mm h−1 and 2.67 mm h−1 in the southeast quadrant, respectively. In addition, the precipitation frequency in the southeast quadrant of the NCCV is also the largest, with the azimuthal averages of convective and stratiform precipitation frequencies reaching 1% and 4%, respectively. The frequency and precipitation contribution of stratiform precipitation are the lowest in the southwest of the NCCV and the highest in the northeast quadrant (reaching 92% and 87%, respectively). On the contrary, the contribution peaks of convective precipitation frequency and amount in the southwest quadrant of the NCCV are 19.8% and 37%, respectively. Convective and stratiform precipitation have peak storm-top heights in the southwest quadrant of the NCCV. The peak values of droplet concentration and diameter are in the southeast and west of the NCCV, respectively. In the northwest and southwest quadrants of the NCCV, convective clouds develop deeply, and the radar echo above the melting layer is stronger than those in other quadrants, which increases rapidly as the height decreases, indicating the microphysical processes such as collision-growth and rimming processes of ice crystals and other hydrometeors. Below the melting layer, as the height decreases, the radar echo increases rapidly, indicating collision-growth processes, leading to the prevalence of a low concentration of large-sized droplets at the near-surface, while due to the relatively insufficient water vapor in this quadrant, the near-surface rain rate is relatively low. In the southeast quadrant of the NCCV, the storm-top heights are low for convective and stratiform precipitation. The collision growth of droplets is more significant than that in other quadrants. However, due to the fragmentation of droplets during the falling process, the rain hydrometeors near the surface are mainly composed of high-concentration and small-sized droplets. The high concentrations of hydrometeors together with enough water vapor supply provide favorable conditions for heavy rain rate in this quadrant.
Previous studies have revealed the difference of DSDs in different seasons and regions and different precipitation systems [21,23,24,33]. As a continuation of this work, future work on the microphysical structures of NCCV precipitation in different seasons, and their differences among different precipitation systems (such as Meiyu precipitation) are worthy of further investigation using the joint observations from ground-based and satellite-based instruments, which will help us gain a deeper knowledge of NCCV precipitation.

Author Contributions

Conceptualization, X.Z. and F.C.; methodology, X.Z., F.C. and X.C.; software, F.C. and X.C.; validation, X.Z. and F.C.; formal analysis, J.W. and F.C.; investigation, X.Z. and F.C.; resources, X.Z.; data curation, F.C.; writing—original draft preparation, J.W.; writing—review and editing, X.Z. and F.C.; visualization, J.W., X.Z. and F.C.; supervision, X.Z., F.C. and Y.W.; project administration, X.Z; funding acquisition, X.Z. All authors have read and agreed to the published version of the manuscript.

Funding

This work was financially supported by the National Natural Science Foundation of China (42175006), the Fengyun Application Pioneering Project (FY-APP-2021.0101), Jiangsu Youth Talent Promotion Project (2021-084), the Basic Research Fund of CAMS (2020R002), and the National Natural Science Foundation of China (41805023).

Data Availability Statement

The ERA5 data are publicly available at https://cds.climate.copernicus.eu/cdsapp#!/dataset/reanalysis-era5-pressure-levels?tab=overview, accessed on 5 September 2022. The GPM DPR dataset can be obtained from https://gpm.nasa.gov/data/directory, accessed on 4 September 2022. The lists of 20-year NCCVs are available for free at Zenodo via https://doi.org/10.5281/zenodo.5571340, accessed on 1 September 2022. The Himawari-7 data used in our study can be downloaded from http://weather.is.kochi-u.ac.jp/sat/, accessed on 21 October 2022.

Acknowledgments

The authors thank the editors and three reviewers for their helpful comments and valuable suggestions, which improved the manuscript.

Conflicts of Interest

The authors declare no conflict of interest.

References

  1. Chen, X.; Zhuge, X.; Zhang, X.; Wang, Y.; Xue, D. Objective Identification and Climatic Characteristics of Heavy-Precipitation Northeastern China Cold Vortexes. Adv. Atmos. Sci. 2023, 40, 305–316. [Google Scholar] [CrossRef]
  2. Wang, W.; Li, J.; Hu, C.; Li, J.; Jiao, M. A review of definition, identification and quantitative investigation on Northeast cold vortex. Sci. Meteor. Sin. 2017, 37, 394–402. (In Chinese) [Google Scholar]
  3. Sun, L.; Zheng, X.; Wang, Q. The climatological characteristics of northeast cold vortex in China. J. Appl. Meteor Sci. 1994, 5, 297–303. (In Chinese) [Google Scholar]
  4. Zheng, X.; Zhang, T.; Bai, R. Rainstorm in Northeast China, 6th ed.; Meteorological Press: Beijing, China, 1992; pp. 129–151. [Google Scholar]
  5. Li, S.; Ding, Z.; Dai, P.; Liu, Y.; Han, Y. Recent Advances in Research on Northeast China Cold Vortex. J. Arid. Meteor. 2016, 34, 13–19. (In Chinese) [Google Scholar] [CrossRef]
  6. Sun, L.; An, G.; Gao, Z.; Tang, X.; Ding, L.; Shen, B. A composite diagnostic study of heavy rain caused by the northeast cold vortex over Songhuajiang-Nenjiang River Basin in summer of 1998. J. Appl. Meteor. Sci. 2002, 13, 156–162. (In Chinese) [Google Scholar]
  7. Shen, X.; Zhang, C.; Gao, H.; Wang, L.; Li, X. Classification and dynamic composite analysis of three kinds of high altitude cold vortex. Torrential Rain Disasters 2020, 39, 1–9. (In Chinese) [Google Scholar] [CrossRef]
  8. Bai, R.; Sun, Y. The Background Analysis Study of Mesoscale Weather of the Cold Vortex in Northeast China. Heilongjiang Meteor. 1997, 3, 7–8. (In Chinese) [Google Scholar]
  9. Zhang, Y.; Lei, H.; Qian, Z. Analyses of Formation Mechanisms of a Rainstorm during the Declining Phase of a Northeast Cold Vortex. Chin. J. Atmos. Sci. 2008, 32, 481–498. (In Chinese) [Google Scholar]
  10. Liu, Y.; Wang, D.; Zhang, Z.; Zhong, S. A comprehensive analysis of the structure of a northeast China-cold-vortex and its characteristics of evolution. Acta Meteor. Sin. 2012, 70, 354–370. (In Chinese) [Google Scholar] [CrossRef]
  11. Chen, L.; Zhang, L.; Zhou, X. Characteristic of lnstable Energy Distribution in Cold Vortex over Northeastern China and lts Relation to Precipitation Area. Plateau Meteor. 2008, 27, 339–348. (In Chinese) [Google Scholar]
  12. Qi, D.; Yuan, M.; Zhou, Y.; Han, B. Analysis of the Relationship between Structures of a Cold Vortex Process and Rainfall over the Northeast China. Plateau Meteor. 2020, 39, 808–818. (In Chinese) [Google Scholar] [CrossRef]
  13. Hsieh, Y.-P. An Investigation of A Selected Cold Vortex over North America. J. Meteor. 1949, 6, 401–410. [Google Scholar] [CrossRef]
  14. Pruppacher, H.R.; Klett, J.D.; Wang, P.K. Microphysics of Clouds and Precipitation. Aerosol Sci. Tech. 1998, 28, 381–382. [Google Scholar] [CrossRef] [Green Version]
  15. Qi, Y.; Guo, X.; Jin, D. An Observational Study of Macro/Microphysical Structures of Convective Rainbands of a Cold Vortex over Northeast China. Chin. J. Atmos. Sci. 2007, 31, 621–634. (In Chinese) [Google Scholar] [CrossRef]
  16. Zhao, Z.; Lei, H. Observed Microphysical Structure of Nimbostratus in Northeast Cold Vortex over China. Atmos. Res. 2014, 142, 91–99. [Google Scholar] [CrossRef]
  17. Zhong, S.; Wang, D.; Zhang, R.; Liu, Y. Vertical Structure of Convective Cloud in a Cold Vortex over Northeastern China Using CloudSat Data. J. Appl. Meteor. Sci. 2011, 22, 257–264. (In Chinese) [Google Scholar] [CrossRef]
  18. Li, S.; Li, Y.; Sun, G.; Song, W. Cloud microphysical characteristics in the development of stratocumulus clouds over Eastern China. Chin. J. Geophys. 2019, 62, 4513–4526. [Google Scholar]
  19. Iguchi, T.; Seto, S.; Meneghini, R.; Yoshida, N.; Awaka, J.; Le, M.; Chandrasekar, V.; Brodzik, S.; Kubota, T.; Takahashi, N. GPM/DPR Level-2 Algorithm Theoretical Basis Document. JAXA–NASA Tech. Rep. 2021; 238p. Available online: https://gpm.nasa.gov/sites/default/files/2022-06/ATBD_DPR_V07A.pdf (accessed on 19 April 2023).
  20. Chen, F.; Huang, H. Comparisons of Gauge, TMPA and IMERG Products for Monsoon and Tropical Cyclone Precipitation in Southern China. Pure Appl. Geophys. 2019, 176, 1767–1784. [Google Scholar] [CrossRef]
  21. Chen, F.; Fu, Y.; Yang, Y. Regional Variability of Precipitation in Tropical Cyclones over the Western North Pacific Revealed by the GPM Dual-Frequency Precipitation Radar and Microwave Imager. J. Geophys. Res. Atmos. 2019, 124, 11281–11296. [Google Scholar] [CrossRef]
  22. Chen, F.; Fu, Y.; Liu, P.; Yang, Y. Seasonal Variability of Storm Top Altitudes in the Tropics and Subtropics Observed by TRMM PR. Atmos. Res. 2016, 169, 113–126. [Google Scholar] [CrossRef]
  23. Zhang, A.; Chen, Y.; Pan, X.; Hu, Y.; Chen, S.; Li, W. Precipitation Microphysics of Tropical Cyclones over Northeast China in 2020. Remote Sens. 2022, 14, 2188. [Google Scholar] [CrossRef]
  24. Zhang, A.; Chen, Y.; Zhang, X.; Zhang, Q.; Fu, Y. Structure of Cyclonic Precipitation in the Northern Pacific Storm Track Measured by GPM DPR. J. Hydrometeorol. 2020, 21, 227–240. [Google Scholar] [CrossRef]
  25. Hou, A.Y.; Kakar, R.K.; Neeck, S.; Azarbarzin, A.A.; Kummerow, C.D.; Kojima, M.; Oki, R.; Nakamura, K.; Iguchi, T. The Global Precipitation Measurement Mission. Bull. Amer. Meteor. Soc. 2014, 95, 701–722. [Google Scholar] [CrossRef]
  26. Zhang, A.; Fu, Y. Life Cycle Effects on the Vertical Structure of Precipitation in East China Measured by Himawari-8 and GPM DPR. Mon. Weather Rev. 2018, 146, 2183–2199. [Google Scholar] [CrossRef]
  27. Hamada, A.; Takayabu, Y.N. Improvements in Detection of Light Precipitation with the Global Precipitation Measurement Dual-Frequency Precipitation Radar (GPM DPR). J. Atmos. Ocean. Tech. 2016, 33, 653–667. [Google Scholar] [CrossRef]
  28. Iguchi, T.; Seto, S.; Meneghini, R.; Yoshida, N.; Awaka, J.; Kubota, T.; Kozu, T.; Chandra, V.; Le, M.; Liao, L.; et al. An Overview of the Precipitation Retrieval Algorithm for the Dual-Frequency Precipitation Radar (DPR) on the Global Precipitation Measurement (GPM) Mission’s Core Satellite. Kyoto, Japan, 9 November 2012; Shimoda, H., Xiong, X., Cao, C., Gu, X., Kim, C., Kiran Kumar, A.S., Eds.; SPIE: Bellingham, WA, USA, 85281C. [CrossRef]
  29. Huang, H.; Zhao, K.; Fu, P.; Chen, H.; Chen, G.; Zhang, Y. Validation of Precipitation Measurements from the Dual-Frequency Precipitation Radar Onboard the GPM Core Observatory Using a Polarimetric Radar in South China. IEEE Trans. Geosci. Remote Sens. 2022, 60, 1–16. [Google Scholar] [CrossRef]
  30. Seto, S.; Iguchi, T.; Oki, T. The Basic Performance of a Precipitation Retrieval Algorithm for the Global Precipitation Measurement Mission’s Single/Dual-Frequency Radar Measurements. IEEE T. Geosci. Remote 2013, 51, 5239–5251. [Google Scholar] [CrossRef] [Green Version]
  31. Hersbach, H.; Bell, B.; Berrisford, P.; Hirahara, S.; Horányi, A.; Muñoz Sabater, J.; Nicolas, J.; Peubey, C.; Radu, R.; Schepers, D.; et al. The ERA5 global reanalysis. Q. J. Roy. Meteor. Soc. 2020, 146, 1999–2049. [Google Scholar] [CrossRef]
  32. Li, S.; Ding, Z.; Liu, Y.; Tian, L. Statistical and composite analysis on short-time heavy rainfall of Liaoning province under Northeast China cold vortex. Sci. Meteor. Sin. 2017, 37, 70–77. (In Chinese) [Google Scholar] [CrossRef]
  33. Radhakrishna, B.; Satheesh, S.K.; Rao, T.R.; Saikranthi, K.; Sunilkumar, K. Assessment of DSDs of GPM-DPR with ground-based disdrometer at seasonal scale over Gadanki, India. J. Geophys. Res. Atmos. 2016, 121, 11792–11802. [Google Scholar] [CrossRef]
  34. Xian, T.; Fu, Y. Characteristics of Tropopause-Penetrating Convection Determined by TRMM and COSMIC GPS Radio Occultation Measurements: Tropopause-Penetrating Convection. J. Geophys. Res. Atmos. 2015, 120, 7006–7024. [Google Scholar] [CrossRef] [Green Version]
  35. Knippertz, P.; Martin, J.E. Tropical plumes and extreme precipitation in subtropical and tropical West Africa. Q. J. Roy. Meteor. Soc. 2010, 131, 2337–2365. [Google Scholar] [CrossRef] [Green Version]
  36. Zhong, S.; Wang, D.; Zhang, R.; Liu, Y. Study of Mesoscale Convective System in Heavy Rainstorm Process at a Cold Vortex Development Stage. Plateau Meteor. 2013, 32, 435–445. (In Chinese) [Google Scholar] [CrossRef]
  37. Wang, Z.; Li, J.; Wang, F.; Lin, C. Asymmetric Characteristics of the Northeast Cold Vortex and Its Effect on Heavy Rain. Plateau Meteor. 2015, 34, 1721–1731. (In Chinese) [Google Scholar] [CrossRef]
Figure 1. (a) The 10.4 μm infrared brightness temperature of the Himawari-7 satellite (shading, k), (b) the rain type identified by GPM DPR (shading, unitless), with yellow (blue) representing convection (stratiform), (c) the storm-top height (shading, km), and (d) the reflectivity at 6 km height (shading, dBZ) within 2000 km distance of the NCCV center at 1200 UTC on 12 June 2014 with GPM orbit No.001631. (The purple lines represent the swath of GPM DPR; the ‘+’ represents the NCCV center; and lines AB, CD, EF, and GH represent the section position in Figure 2).
Remotesensing 15 03399 g001
Figure 2. Vertical sections of the radar echo along lines (a) AB, (b) CD, (c) EF, and (d) GH in Figure 1d. The X axis represents the latitude along the cross-section direction. The yellow and blue dots at the 11 km altitude represent the convective and stratiform precipitation retrieved from the dual-frequency method in GPM, respectively.
Remotesensing 15 03399 g002
Figure 3. The distribution of (ac) near-surface rain rate (shading, mm h−1), (df) precipitation frequency (shading, %), and (gi) storm-top height (shading, km) for total, stratiform, and convective precipitation at each 50 km × 50 km grid in the NCCV coordinate system, derived from GPM DPR for 2014–2019. (The black dots represent the NCCV center; 6432 NCCVs are included in the dynamic composite analysis).
Remotesensing 15 03399 g003
Figure 4. The distribution of (a,b) precipitation contribution (shading, %), and (c,d) precipitation frequency contribution (shading, %) for total, stratiform, and convective precipitation at each 50 km × 50 km grid in the NCCV coordinate system, derived from GPM DPR for 2014–2019. (The black dots represent the NCCV center; 6432 NCCVs are included in the dynamic composite analysis).
Remotesensing 15 03399 g004
Figure 5. The distribution of near-surface (ac) droplet mass-weighted mean diameter Dm (shading, mm), (df) particle concentration parameter dBNw (shading, no unit), and (gi) average reflectivity (shading, dBZ) for total, stratiform, and convective precipitation at each 50 km × 50 km grid in the NCCV coordinate system, derived from GPM DPR for 2014–2019. (The black dots represent the NCCV center; 6432 NCCVs are included in the dynamic composite analysis).
Remotesensing 15 03399 g005
Figure 6. The azimuthal distributions of (a) precipitation frequency, (b) near-surface rain rate, (c) precipitation frequency contribution, (d) precipitation contribution, and (e) storm-top height for total (black solid lines), stratiform (blue solid lines), and convective (red solid lines) precipitation in the NCCV coordinate system, derived from GPM DPR for 2014–2019. (A total of 6432 NCCVs are included in the dynamic composite analysis; samples should be within 2000 km distance of the NCCV center).
Remotesensing 15 03399 g006
Figure 7. The azimuthal distributions of near-surface (a) droplet mass-weighted mean diameter Dm, and (b) particle concentration parameter dBNw for total (black solid lines), stratiform (blue solid lines), and convective (red solid lines) precipitation in the NCCV coordinate system, derived from GPM DPR for 2014–2019. (A total of 6432 NCCVs are included in the dynamic composite analysis; samples should be within 2000 km distance of the NCCV center).
Remotesensing 15 03399 g007
Figure 8. The frequency pattern (shading, %) in two-dimensional space of Dm and dBNw at 2.5 km in the (a,e) northeast, (b,f) northwest, (c,g) southwest, and (d,h) southeast regions within 2000 km distance of the NCCV center for stratiform and convective precipitation. (The black (white) solid line represents the frequency higher than 4% (36%)).
Remotesensing 15 03399 g008
Figure 9. The CFADs (shading, %) of the Ku-band reflectivity for (a) total, (b) stratiform, and (c) convective precipitation within 2000 km distance of the NCCV center, derived from GPM DPR for 2014–2019.
Remotesensing 15 03399 g009
Figure 10. The CFADs (shading, %) of the Ku-band reflectivity in the (a,e) northeast, (b,f) northwest, (c,g) southwest, and (d,h) southeast regions within 2000 km distance of the NCCV center for stratiform and convective precipitation, derived from GPM DPR for 2014–2019.
Remotesensing 15 03399 g010
Figure 11. The azimuthal distribution of Ku-band reflectivity (shading, dBZ) for (a) total, (b) stratiform, and (c) convective precipitation within 2000 km distance of the NCCV center, derived from GPM DPR for 2014–2019. (The sample size in the gray area is less than 0.1% of the maximum sample size).
Remotesensing 15 03399 g011
Figure 12. The contoured frequency (shading, %) by altitude diagram of Dm and d B N w for (a,d) total, (b,e) stratiform, and (c,f) convective precipitation within 2000 km distance of the NCCV center, derived from GPM DPR for 2014–2019.
Remotesensing 15 03399 g012
Disclaimer/Publisher’s Note: The statements, opinions and data contained in all publications are solely those of the individual author(s) and contributor(s) and not of MDPI and/or the editor(s). MDPI and/or the editor(s) disclaim responsibility for any injury to people or property resulting from any ideas, methods, instructions or products referred to in the content.

