Article

Landslide Hazard Assessment in Highway Areas of Guangxi Using Remote Sensing Data and a Pre-Trained XGBoost Model

1
National Engineering Research Center for Transportation Safety and Emergency Informatics, China Transport Telecommunications & Information Center, Beijing 100028, China
2
School of Traffic and Transportation, Beijing Jiaotong University, Beijing 100044, China
3
State Grid Siji Location Service Co., Ltd., Beijing 102200, China
4
GuangXi Communications Design Group Co., Ltd., Nanning 530012, China
*
Author to whom correspondence should be addressed.
Remote Sens. 2023, 15(13), 3350; https://doi.org/10.3390/rs15133350
Submission received: 9 May 2023 / Revised: 16 June 2023 / Accepted: 28 June 2023 / Published: 30 June 2023
(This article belongs to the Special Issue Remote Sensing and GIS for Monitoring Urbanization and Urban Health)

Abstract

:
This study presents a novel method for assessing landslide hazards along highways using remote sensing and machine learning. We extract geospatial features such as slope, aspect, and rainfall over Guangxi, China, and apply an extreme gradient boosting model pre-trained on contiguous United States datasets. The model produces susceptibility maps that indicate landslide probability at different scales. However, the lack of accurate data on historical landslides in Guangxi challenges the model evaluation and comparison between regions. To overcome this, we calibrate the model to fit the local conditions in Guangxi. The calibrated model agrees with the observed landslide locations, implying its capability to capture regional variations in landslide mechanisms. We apply the model at a 30 m resolution along the Heba Expressway and validate it against reports from July 2021 to March 2022. The model correctly predicts five of seven landslide events in this period with a reasonable alarm rate. This framework has the potential for large-scale landslide risk management by informing transportation planning and infrastructure maintenance decisions. More data on landslide timing and human disturbance events may improve the model’s accuracy across diverse geographical areas and terrains.

1. Introduction

Landslides are a common natural disaster that pose a significant threat to human society and the environment. They can be triggered by various factors, such as intense rainfall, earthquake shaking, water level change, or human activities [1]. The occurrence of landslides is often accompanied by secondary disasters such as mudflows, which can endanger lives and property [2]. In recent years, the frequency and scale of landslides have increased due to factors like climate change and human activities [3,4].
Guangxi Zhuang Autonomous Region in China is a region prone to landslides due to its complex terrain and landform, which are affected by natural hazards such as typhoons and heavy rains. Landslides in Guangxi often cause damage to infrastructure and agricultural land, and even lead to casualties. For instance, the Jingxi landslide in June 2010 resulted in 26 deaths and 4 missing. Therefore, it is important to conduct research on landslide hazard assessment techniques to better forecast and prevent landslides in Guangxi, which can enhance the protection of the local people and the sustainable development of the region. However, traditional field investigation approaches are often time-consuming, expensive, and difficult to implement for regional-scale analysis.
Landslide hazard assessment is a complex task that involves several aspects. It requires the identification of landslide-prone areas, the evaluation of landslide-triggering factors, the estimation of landslide frequency and magnitude, and the assessment of potential consequences and risks. Different methods have been developed and applied for landslide hazard assessment, depending on the scale, purpose, data availability, and complexity of the problem [5,6]. The main challenges of landslide hazard assessment are to select appropriate methods, integrate multiple factors and sources of uncertainty, and validate and communicate the results effectively. Some of the commonly used methods for landslide hazard assessment are heuristic, statistical, deterministic, probabilistic, and multi-criteria decision-making methods [7]. Heuristic methods are based on expert knowledge and experience, and they assign qualitative ratings or weights to different factors influencing landslides [8]. Statistical methods are based on empirical relationships between landslide occurrence and explanatory variables, and they use mathematical models to calculate the probability of or susceptibility to landslides [2]. Deterministic methods are based on physical laws and principles, and they evaluate the stability or instability of slopes under given conditions [9]. Probabilistic methods are based on stochastic models and Bayesian inference, and they estimate the likelihood or frequency of landslides considering uncertainties in input data and parameters [10]. Multi-criteria decision-making methods are based on analytical techniques and fuzzy logic, and they combine multiple criteria and preferences to rank or classify landslide hazards [11]. Each method has its advantages and limitations, and no single method can be universally applicable or optimal for all situations. Therefore, it is important to choose a suitable method according to the objectives, data availability, scale, and complexity of the study area. Moreover, it is also useful to compare different methods or combine multiple methods to improve the reliability and accuracy of landslide hazard assessment.
Recent advances in remote sensing and machine learning provide powerful tools for landslide hazard assessment over large areas [12,13,14,15,16,17,18]. Remote sensing techniques enable the acquisition of key biophysical indicators related to slope instability over vast areas. Machine learning algorithms can detect complex patterns from big data and generate predictive models. Studies have applied remote sensing and machine learning for landslide hazard assessment, but there are still challenges and opportunities for further development [19,20,21].
This study introduces a novel methodology for landslide hazard assessment along highways that integrates an extreme gradient boosting (XGBoost) model and geospatial analysis. The framework uses remote sensing imagery and geospatial data to capture the variations in topography, hydrology, soil properties, and vegetation conditions over Guangxi, China. XGBoost is an efficient and scalable end-to-end tree-boosting system that has achieved state-of-the-art results on many machine learning challenges [22,23,24,25]. It can capture complex and nonlinear relationships between landslide factors and susceptibility, and it can also handle imbalanced data and missing values effectively [26]. In our proposed framework, we adopt the XGBoost algorithm to first pre-train a base model on United States (U.S.) datasets and then calibrate it for local conditions in Guangxi using statistical approaches. The calibrated model is then applied to a 30 m resolution site along the landslide-prone Heba Expressway for validation with documented landslide events from 2021 to 2022 [27,28,29,30,31]. According to the results of this work, the framework has the potential to provide quantitative risk assessment over large areas to aid policymaking, reduce loss from disasters, and promote environmentally sustainable infrastructure in mountainous regions. Continued progress in remote sensing, machine learning, and computing power is poised to enable the wider application of this approach worldwide.
The rest of this paper is organized as follows: Section 2 introduces the study area and the data sources. Section 3 describes the methodology, including the data processing, the machine learning models, and the evaluation metrics. Section 4 presents the results and discussion. Section 5 concludes the paper and suggests some future work.

2. Study Area and Data Sources

2.1. Study Area

The study area of this paper is Guangxi, a coastal autonomous region in southern China that covers an area of about 237,600 square kilometers. The region has complex terrain and frequent landslide disasters, which not only pose a great threat to road traffic safety but also have a serious impact on surrounding residents and enterprises. Guangxi was chosen as the study area because it is one of the major areas prone to landslides in China. According to historical data from the catalog, over 15,000 geological hazards occurred in Guangxi in the past few decades (1950–2020), among which over 4200 landslides were predominantly located within a 1 km range along roads. Figure 1 shows the spatial distribution of all recorded landslides along roads in Guangxi from 1950 to 2020.

2.2. Remote Sensing and Terrain Data

In general, landslide risk assessment requires the identification and analysis of various factors that influence the occurrence of landslides, such as geology, topography, soil type, vegetation cover, and rainfall patterns. Previous studies have shown that these factors vary in different regions and need to be selected based on local conditions. In this paper, we focus on the Guangxi area in China, where landslides are frequent and pose a serious threat to the local population and infrastructure. Based on the geological terrain, historical landslide patterns, and existing research in this area, we selected 12 landslide conditioning factors, namely, slope angle, slope aspect, three types of precipitation, soil moisture, lithology, vegetation index, two types of land cover, distance to faults, and distance to rivers. In addition, besides conditioning factors, the landslide catalog is also an important source of data for landslide susceptibility mapping. It can be used to identify areas prone to landslides and to develop effective landslide risk management strategies.
  • Slope (1) and aspect (2) are important terrain factors that affect landslide occurrence. Steep terrain and slopes with different orientations can influence soil stability and the risk of soil erosion.
  • Daily (3) and antecedent rainfall (4) (7 days in this paper) are important climate factors that affect soil saturation and pore water pressure. The amount and distribution of rainfall can both affect soil stability. In addition, to avoid overfitting the pre-trained models on the training set, this study further incorporated daily accumulated precipitation information for the past 10 years (5) in the region, which could help reduce biases caused by differences in regional precipitation distribution.
  • Soil moisture (6) is another important soil factor, and excessive moisture can make soil unstable and increase the risk of landslides.
  • The Normalized Difference Vegetation Index (NDVI) (7), as a vegetation index, can reflect the density of vegetation. Dense vegetation can reduce soil erosion and improve soil stability.
  • Land cover type is a key factor that influences soil stability and affects its physical and chemical properties. We used two kinds of classification from the Moderate Resolution Imaging Spectroradiometer (MODIS) in this paper. The first one is the International Geosphere-Biosphere Programme (IGBP) (8), which consists of 17 classes defined by the IGBP. These data indicate the dominant land cover type for each pixel every year. The second one is the annual Leaf Area Index (LAI) (9) based on land cover type, which is an important variable for estimating photosynthesis, evapotranspiration, and crop growth. Moreover, by combining annual LAI with the latest NDVI, we can capture the heterogeneity and dynamics of land surface properties in our model.
  • Lithology (10) is one of the important factors affecting soil stability, and different types of rocks can affect the properties and stability of the soil.
Details about all variables utilized in this work can be found in Table 1 and Table 2.
7.
Distance to faults (11) and rivers (12) are also important factors influencing landslide occurrence. Faults can weaken the rock mass and make it vulnerable to sliding. Rivers can erode the toe of slopes and cause bank collapse. In addition, river erosion and undercutting on the outside bends of meandering rivers can also trigger landslides.

3. Methodology

3.1. Landslide Hazard Assessment (LHA) Framework

The steps of landslide hazard assessment may vary depending on the scale, purpose, and data availability of the study. However, a general framework can be summarized as follows:
  • Define the study area and objectives of the assessment.
  • Collect and review existing data on landslide inventory, causative factors, and consequences.
  • Select and apply appropriate methods and techniques for landslide susceptibility, hazard, and risk analysis.
  • Validate and evaluate the results of the analysis using historical records, field observations, or expert opinions.
  • Prepare and present landslide hazard maps and reports with recommendations for mitigation measures and further studies.
In this work, we chose the XGBoost algorithm together with 12 landslide conditioning factors for implementing the Landslide Hazard Assessment (LHA) model. One of the challenges we faced while collecting information on landslides in Guangxi was the lack of detailed geological disaster data. Specifically, the data often did not include important time information, which is essential for understanding the temporal patterns and trends of landslides and developing a suitable landslide risk assessment model. To overcome this challenge, we used a pre-trained model that was based on data from the U.S. with complete information. Then, we calibrated and transferred the pre-trained model to assess landslide hazards in the Guangxi area. Additionally, by considering the transferability and generality of the pre-trained model as well as the larger area and coarse resolution in training data, the grid cells were chosen as the mapping unit instead of the slope units [32,33,34,35,36].

3.2. XGBoost Algorithm

XGBoost is a powerful machine learning algorithm that has shown a lot of promise for landslide hazard mapping and assessment. It is an ensemble method that combines many decision trees to produce robust predictions, even with noisy and complex data. XGBoost also offers advantages like built-in cross-validation, handling of missing values, and computational scalability. However, XGBoost also has some significant limitations in this domain. It may face challenges in extrapolating to new regions. XGBoost is also prone to overfitting with small datasets and is not inherently interpretable, limiting transparency for end users. While XGBoost should definitely be considered as a tool for landslide mapping, it needs to be implemented carefully with these limitations in mind. With issues of scalability and interpretability adequately addressed, XGBoost can be a highly effective method for modeling landslide hazards over large areas [22,37,38,39].

3.2.1. Sample Preparation

Landslides are complex natural phenomenon that involve various factors and have high uncertainty and randomness. To predict the likelihood of landslides effectively, we needed to construct a reliable sample set that represented the conditions and characteristics of landslide occurrence. However, landslides are rare events both globally and regionally, so using all data in study areas as samples will create a severe imbalance between positive (landslide area) and negative samples (non-landslide area), which will impair the predictive performance of the model. Therefore, we applied a date-based sampling method; that is, on the day of a landslide event, we randomly selected 100 areas that did not experience landslides as negative samples, which, along with the landslide events as positive samples, formed a sample data set. This way, we could control the overall ratio of positive to negative samples in the data while also considering the temporal factors that affect landslides.
Finally, after removing invalid and missing data samples, we obtained a total of 197,431 model samples, including 1963 positive samples and 195,468 negative samples.

3.2.2. Model Training, Evaluation, and Validation

When training XGBoost, we usually need to divide the dataset into three parts: training set, test set, and validation set. The training set is used to train the model parameters, and the test and validation sets are used to evaluate the model’s generalization ability, which is unknown during the training process to avoid overfitting or underfitting. There are many ways to create training sets, test sets, and validation sets. A common method is random splitting. That is, the dataset is shuffled randomly and then allocated to the training set, test set, and validation set according to a certain proportion.
In this paper, we used the data from 2009 to 2017 from the United States Geological Survey (USGS) NASA (National Aeronautics and Space Administration) Global Landslide Catalog and randomly split it into 80% training set and 20% test set. This can ensure that the distribution of the dataset is uniform and there will be no situation where there are too many or too few of a certain category or feature. In addition, we also used all the data after 2018 as a validation set to evaluate the model’s generalization ability. Since the validation set comes from different time and geographic distributions, it can better test the model’s adaptability to unknown data. Table 3 shows the three subsets used in this article for training the model.
Besides a high-quality dataset, the choice of model parameters is also very important for improving the performance and generalization ability of the model. In this article, we used the grid search method to determine the model parameters such as the learning rate, tree depth, and subsampling rate. Grid search is a technique that evaluates the performance of different combinations of parameters on a given dataset using cross-validation. The parameter value combined with the highest evaluation metric is finally selected as the optimal parameter combination. Parameter ranges selected for grid search are shown in Table 4.
In terms of the evaluation of model results, we calculated the metrics on the test set and validation set with the optimal parameters of XGBoost, including overall accuracy (OA), kappa coefficients, F1-score, true-positive rate (TPR), false-positive rate (FPR), recall, and Area Under the Curve (AUC). Recall is the TPR, which is the ratio of true positives to the total number of positives. It assesses how well the model can identify the target conditions (in this case, landslides). Overall accuracy measures the total proportion of correct predictions, regardless of class. However, OA can be misleading when there is a class imbalance, so additional metrics are needed. The kappa coefficient measures the proportion of agreement beyond what would be expected by chance alone. It is considered a robust measure when there are multiple categories and high accuracy that could be due to class imbalance. The F1-score is the harmonic mean of recall and precision, providing a balanced measure of the model’s accuracy on the positive class. Finally, the AUC measures the area under the Receiver Operating Characteristic (ROC) curve, which plots the true-positive rate against the false-positive rate at various threshold settings. The AUC ranges from 0 to 1, with higher values indicating better distinguishing ability between the target and non-target classes [40,41,42].
Equations of evaluation metrics are as follows:
O A = T P + T N T P + F P + F N + T N
R e c a l l = T P T P + F N
P r e c i s i o n = T P T P + F P
F 1 score = 2     P r e c i s i o n     R e c a l l P r e c i s i o n + R e c a l l
K a p p a = ( O A C A ) ( 1 C A )
C A = ( T P + F N ) ( T P + F P ) + ( F P + T N ) ( F N + T N ) ( T P + F P F N + T N ) 2
where TP is the number of true-positive predictions, which means the number of positive samples that are correctly predicted as positive. FP is the number of false-positive predictions, which means the number of negative samples that are incorrectly predicted as positive. TN is the number of true-negative predictions, which means the number of negative samples that are correctly predicted as negative. FN is the number of false-negative predictions, which means the number of positive samples that are incorrectly predicted as negative.

4. Results and Discussion

4.1. Evaluation of Pre-Trained Model in the Contiguous United States

In this section, we compare the performance of seven machine learning algorithms on three datasets to evaluate their applicability in a landslide hazards assessment task. The algorithms included XGboost-1, XGBoost-2 (less complex), MLP-1 (MultiLayer Perceptron with 8 × 8 layers), MLP-2 (16 × 16 layers), MLP-3 (32 × 32 layers), Support Vector Machine (SVM), and logistic regression (LR).
As mentioned in Section 3.2.2, the metrics used to evaluate the models were AUC, kappa, F1-score, recall, overall accuracy, TPR, and FPR, which could provide insights into how well the model is performing and help in comparing different models or algorithms. However, due to the serious imbalance problem in the landslide and non-landslide samples, we utilized the weighted recall and F1-score instead of the recall and F1-score for the landslide class. These weighted metrics were calculated with the classification report function provided by Scikit-learn in Python.
Finally, we summarize the metrics of seven models on three datasets in Table 5.
The results above show that the performance of the seven models varies depending on the dataset and the metric used. To compare them more clearly, we highlight some key points as follows:
  • The XGBoost-2 model achieved the best performance in most of the metrics, especially in F1-score, recall, FPR, and overall accuracy, which represent the overall classification ability and precision. However, it also had a significant drop in kappa and TPR on the validation set, which means it was less consistent and sensitive in LHA.
  • MLP-3 showed similar performance to XGBoost-2, ranking second in most of the metrics. Compared to XGBoost-2, MLP-3 was slightly inferior, especially on the test and validation sets. There was a steep decline in metrics from training sets to test and validation sets, indicating a more serious overfitting problem.
  • XGBoost-1 and MLP-2 also share similar performances in most metrics. In general, XGBoost-1 was slightly better than MLP-2 as all metrics ranked 1–3 among seven models. As for MLP-2, most values ranked third but with small gaps (1–2%) with XGBoost-1. It should be noted that both XGBoost-1 and MLP-2 had an obvious improvement in TPR but a slight loss in FPR on validation sets compared to XGBoost-2 and MLP-3. A higher TPR with a relatively low FPR is more valuable for balancing the accuracy and management cost in engineering applications for LHA.
  • Finally, the SVM and LR models did not outperform XGBoost and MLP models. The classification performance and generalization ability were relatively poor. However, the LR model was the most robust one when tested on three datasets. The difference in metrics only ranged from 2 to 3%.
In summary, based on the overall ranks in metrics, we can infer that the XGBoost-1 model outperformed the other models in this evaluation scenario. The MLP-2 model ranked second and showed a stable trade-off between TPR and FPR. The XGBoost-2 and MLP-3 models had lower ranks but achieved higher scores in LHA, which could be preferable for applications that prioritize accuracy over sensitivity and specificity. Therefore, we finally chose the XGBoost-1 model as the best choice for this problem domain. We also report the optimal parameters of the XGBoost-1 model in Table 6 and visualize the feature importance and the ROC curves for this model in Figure 2 and Figure 3. Feature importance is a technique that assigns a score to each input feature based on how useful it is for predicting the target variable. Feature importance scores can help us understand which features are most relevant for our prediction task, and which ones can be ignored or removed.
The results in Figure 2 show that our model identified slope as the most important factor influencing landslide risk. However, the relationship between slope and landslide susceptibility is not linear, but rather complex and influenced by multiple factors. The slope is an important first-order control, but not the only one.
  • The slope is the most important factor affecting landslide occurrence in the region, according to the ranking analysis. Aspect also influences landslides but to a lesser degree. Generally, slope stability decreases when slope and aspect are unfavorable, as they increase the driving forces. However, when the slope exceeds a certain threshold, collapse becomes more likely than a landslide. Therefore, setting an optimal maximum slope value to distinguish between landslide and collapse could further improve the performance of the LHA model.
  • Climatic factors (daily rainfall, antecedent rainfall, and extreme rainfall) are also important features of the model. The importance of daily rainfall and antecedent rainfall (7 days) ranks third and fourth, respectively, indicating that the amount and distribution of rainfall are important reasons for soil instability in the region. For example, as rainwater infiltrates into the soil, it fills up the pore spaces and exerts pressure on soil particles. When the pore pressure builds up rapidly due to intense daily rainfall, it reduces the effective stress between soil particles that provide shear strength. This can quickly destabilize the slope and trigger landslides. In contrast, antecedent rainfall has already had time to drain from the soil, so it contributes less to elevated pore pressures on the specific day of landslide occurrence. In addition, sudden heavy rains will also increase the risk of landslides as excessive rainfall can increase soil saturation and pore water pressure, thus reducing soil shear strength and stability.
  • Land cover factors (LAI land cover and IGBP land cover) also account for a relatively large weight in the important features of the model. The importance of LAI and IGBP classification ranks second and fifth, respectively, reflecting that land use type has a great influence on slope stability. This is because different land covers have different impacts on vegetation coverage, soil structure, and hydrological processes, thus affecting slope stability.
  • Vegetation factors (NDVI) are also one of the features considered in the model. Their importance ranks ninth, indicating that vegetation cover is also a factor affecting landslide occurrence, but relatively less than other factors such as terrain, climate, and land use type. In general, dense vegetation can improve slope stability by reinforcing soil shear strength through its root system.
  • Geological factors (lithology) and distance to faults and rivers also account for a certain weight in the model features. The importance of rock type, fault distance, and river distance ranks 7th, 10th, and 12th, respectively. These factors can weaken the rock mass and trigger slope collapse.
  • Soil properties (soil moisture) matter because weaker, more porous soils with low shear strength saturate more easily and provide less resistance to sliding. Pore pressures rise quickly in these soils during intense rain, reducing stability.
In summary, the proposed LHA model comprehensively considers factors such as terrain, climate, land use, vegetation, geology, and so on. Among them, terrain, climate, and land use type are important features of the model, which contribute greatly to the assessment of landslide risk. The analysis results of the model are reasonable to some extent and also provide a reference for us to further study the mechanism of landslides and improve the assessment model.

4.2. Evaluation of Pre-Trained Model Performance in Guangxi

To assess the pre-trained XGBoost model’s generalizability across spatial scales and regions, two evaluation schemes were deployed for LHA in Guangxi. The first scheme calibrated the pre-trained model using the local landslide inventory to evaluate landslide hazards along highways across Guangxi. By calibrating to regional conditions, the pre-trained model accounted for broad-scale differences influencing slope stability across Guangxi and generated an overview of landslide susceptibility over a large area. This examined the model’s ability to adapt to variable controls for land sliding at a regional scale. The second scheme selected a subsection from 141 to 143 km of the Heba Expressway as the validation site to evaluate landslide hazard assessment at 30 m resolution using the calibrated pre-trained model. This evaluated the model’s capability to detect triggers of landslides at the hillslope scale, which commonly operates at a higher resolution. Together, the schemes assessed the pre-trained model’s potential for generalization across spatial scales as well as regional adaptation.

4.2.1. Calibrating the Pre-Trained Model for LHA across Guangxi

Conventional calibration approaches for model transfer rely on accurate data on the precise timing of landslide events, which were lacking in this study. Thus, to evaluate the pre-trained model in Guangxi, an alternative method was developed based on the spatial consistency between the predicted landslide hazard map and the distribution of known landslides. Specially, we first used the pre-trained model to calculate the daily landslide hazard probability along Guangxi roads within the time range of the landslide catalog. After that, we aggregated these probabilities and extracted the 98th percentile value to represent the overall probability of a hazardous landslide occurring. Finally, to verify the performance of our probabilistic model, we overlaid the final hazard map with a catalog of landslide occurrence locations from the same period and obtained Figure 4.
As shown in the probability map above, the pre-trained model developed in this paper generally produced relatively low-risk probability (less than 0.4 in most landslide points) when applied in the Guangxi region, making it difficult to determine whether an area is at risk. This phenomenon may be attributed to the fact that the pre-trained model is based on the regional characteristics of the United States, and applying it to a different region without calibration will lead to performance degradation due to feature distribution differences. To address this issue, this study adopted a statistical-based threshold-setting method and reclassified the regional risk probability. The threshold-setting method was as follows: (1) the probability values of all landslide points in the landslide catalog were extracted from the probability map; (2) percentiles were set according to the landslide areas of historical events, such as the {2, 39, 89, 99} calculated by counting landslides areas in the range of 100, 1000, 10,000, and 100,000 m2; (3) the percentiles were used to reclassify the predicted probability into five categories of landslide hazard levels (from very low to very high as illustrated in Table 7); (4) urban and flat areas (<5 degree according to the minimum of slope that reported landslides) that rarely suffer landslides, and extreme steep areas (>58 degree, 98th percentile of slope that reported landslides) that are more prone to develop collapses instead of landslides, were mapped out.
After classification, we obtained the corresponding landslide risk as shown in Figure 5. Here, we only focused on highway roadsides, so only areas that were covered with highways are given in the figure.
The classified landslide hazard map that we produced is now clearer and consistent with the landslide catalog of Guangxi. The map shows that the regions with high landslide risk are mainly located in the mountainous areas of Guangxi, where the terrain is steep and the geology is complex. These areas are also prone to stone desertification due to the unique karst landscape. In contrast, the central and southern parts of Guangxi have a lower landslide risk because of their flat terrain and simple geology. Overall, the calibrated pre-trained model showed a high level of consistency in estimating the relative landslide hazard along the transportation network. This indicates that our pre-trained model can be transferred across different regions and still perform well.

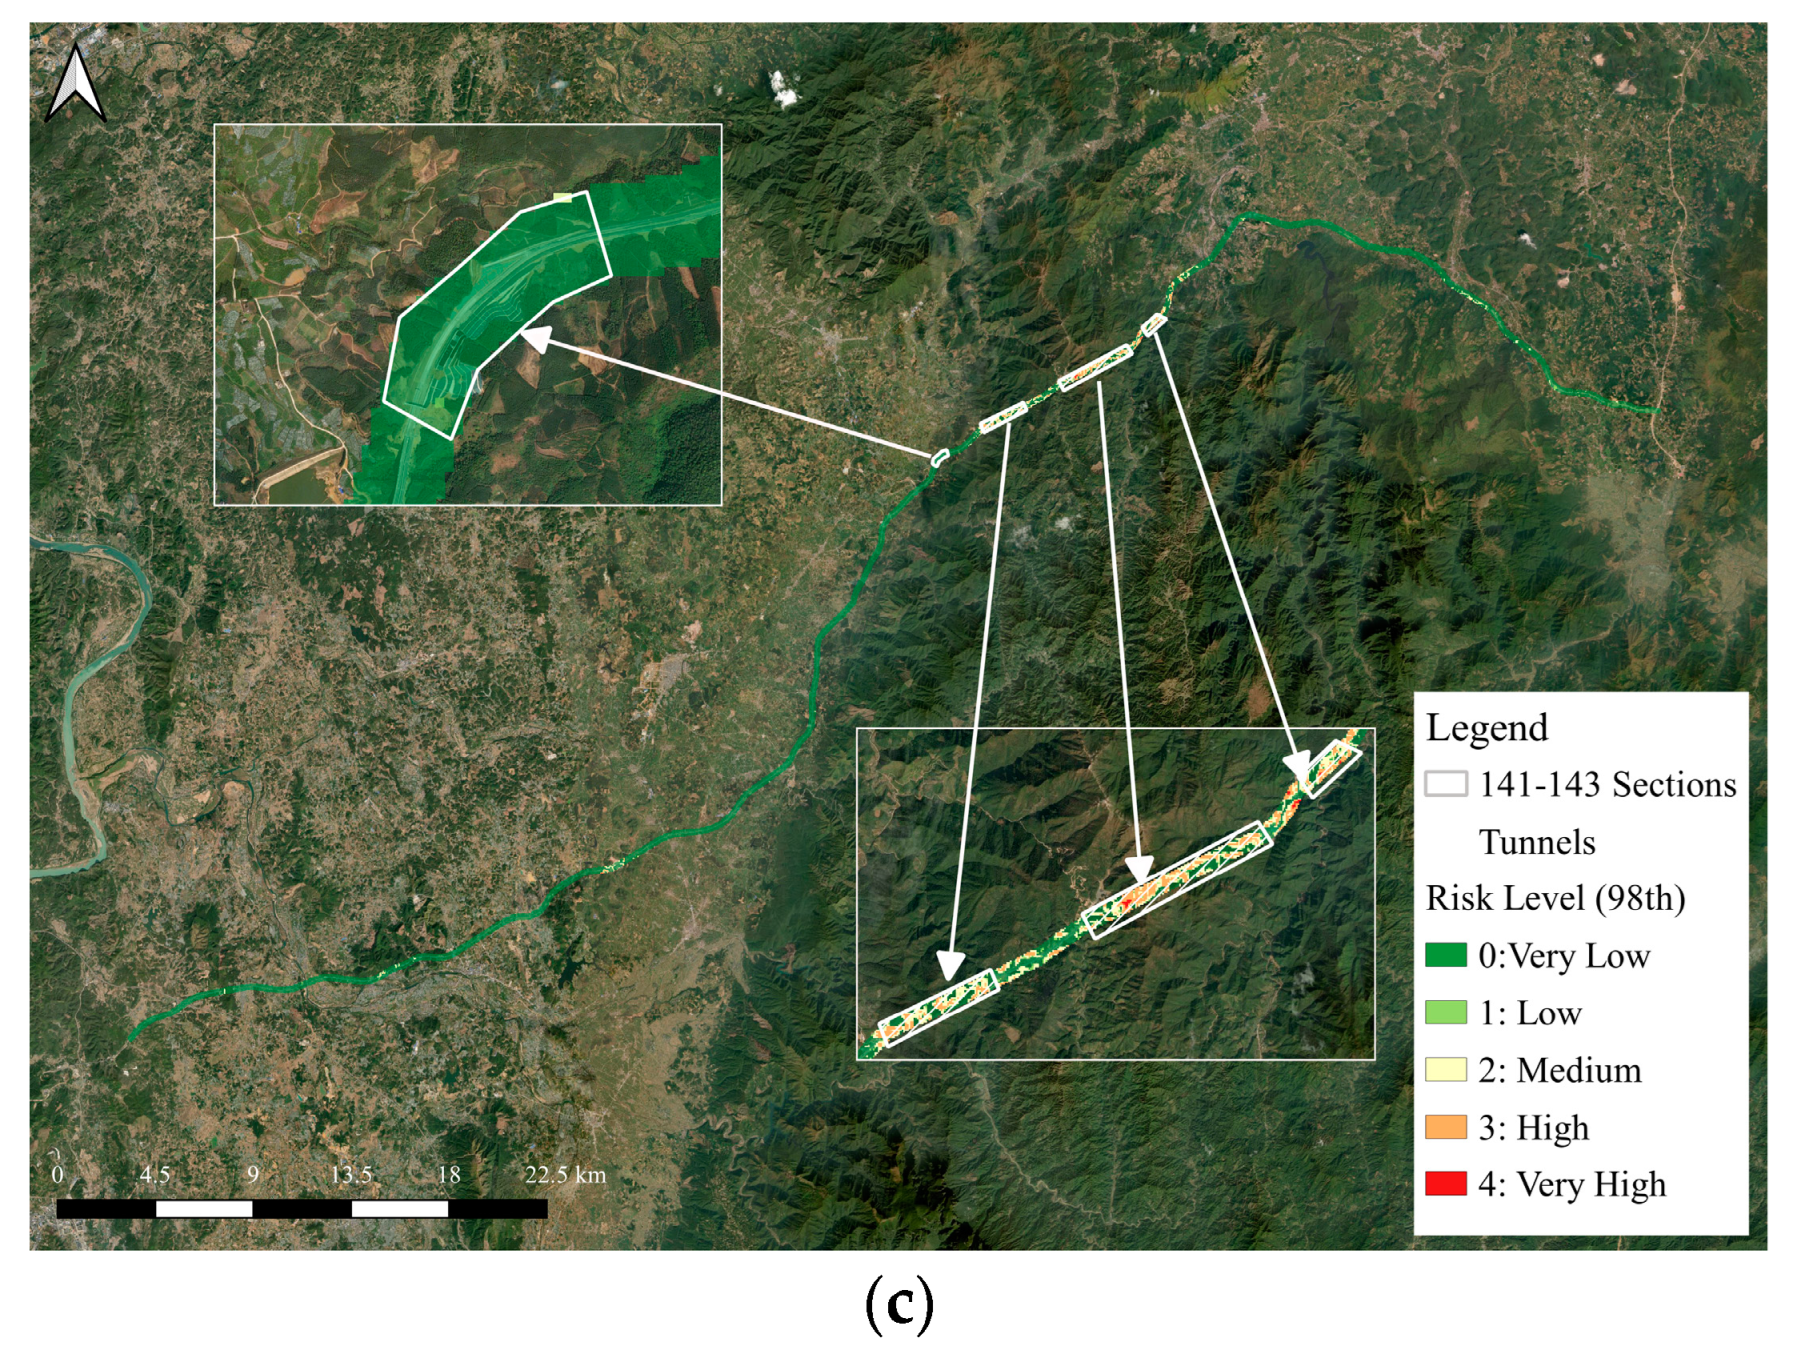
4.2.2. Validating Localized Landslide Hazard Assessment at High Resolution

This section presents a daily evaluation of our predictions based on the date information of landslide events on the Heba Expressway, which was not available in the previous section. The Heba Expressway is a highway project in China that connects Hezhou and Bama. We collected the reports of seven landslides that occurred near sections 141–143 from July 2021 to March 2022 during the construction. We also improved the image resolution from 1 km to 30 m to further validate the performance of the pre-trained model. Specifically, we replaced the land cover data from the MODIS product (250 m) to the China Land Cover Dataset (CLCD) (30 m) with the mapping given in Table 8 and used the HLS images (30 m) for calculating the NDVI instead of the MODIS product (500 m). Moreover, due to the improvement in resolution, the set of percentiles for the probability convention was also updated according to the area of pixels. They are now 1, 2, 12, and 66 based on the percentage of landslide areas in the segments of [5 × 5, 10 × 10, 20 × 20, 50 × 50] m2.
On the other hand, as the Harmonized Landsat Sentinel-2 (HLS) project is not a daily product, we utilized a new method for LHA in this section as follows:
  • First, we set an 8-day data collection cycle and fused the collected data of the same type to achieve a gap-filled and high-quality image for driving the model. According to the data illustration in Table 2, using 8 days as a cycle can ensure at least two images of the same type are obtained within the cycle for data fusion. The cycle length can be adjusted according to the needs, as long as the main data features of the model are not empty.
  • Next, we used the cycle-synthesized data to predict the landslide risk for each day within the cycle and took the maximum value as the output of the cycle’s risk probability. The reason for this process is that we assume that the landslide risk is mainly influenced by the cumulative effects of rainfall and soil moisture. Therefore, taking the maximum value can capture the highest risk level within a cycle.
Table 9 shows the final predicted results for each prediction cycle covering the landslide and Figure 6 gives the distribution of predicted risk pixels. For comparison, we also provide the results of the MLP-2 and LR models.
The table and figures show that the XGBoost-1 model successfully predicted and warned of five landslide events in the first, fourth, and fifth prediction periods. In these periods, the model identified 3, 1, and 14 pixels with medium or higher risk, respectively. However, the model failed to detect any risk pixels in the second and third prediction periods, and only one pixel in the fourth period. This suggests that the model’s performance is inconsistent and depends on various factors. Some possible reasons are the following: (1) The input variables did not include human interference factors. The study area had some construction activities that may alter the soil’s physical and hydrological properties and affect the occurrence of landslides. These factors were not considered in the model training, resulting in the model’s inability to adapt to this change. (2) The model parameters and weights were not finely adjusted. Due to the limited number of samples in the study area, this paper used a statistical threshold-setting method to determine the predicted risk levels. This method is simple and easy to implement, but it cannot fully utilize the data, nor can it effectively handle nonlinearity and complexity problems. (3) The data resolution was mismatched. The model was trained based on 1 km resolution data, but 30 m resolution data were used for testing in this section. This may have led to a decline in data accuracy and quality and also affected the model’s generalization ability.
The MLP-2 model showed a similar overall performance to the XGBoost-1 model, even with a higher resolution, while the LR model performed poorly. The LR model labeled only 1 and 3 pixels as risky in periods 4 and 5, respectively, while the MLP-2 model labeled 1, 2, and 30 pixels as risky in periods 1, 4, and 5, respectively. Based on these results, we can infer that the MLP-2 model was slightly better than the XGBoost-1 model for the Heba Expressway. However, as we discussed earlier, the ability of a model to effectively control the false-alarm rate is also critical for real applications, which can avoid unnecessary alerts and interventions that save costs in landslide prevention management. To illustrate this, we calculated the 98th percentile of daily probabilities to count the risk frequency.
Figure 7 shows the distribution of the final predicted risk levels along the Heba Expressway with these three models.
As seen from the figure, the LR model was the most conservative, classifying fewer pixels as risky than the other two models. This contradicts the conclusions in Section 4.1 and suggests that the LR model might have poor generative ability when applied to a different region or resolution. Only 8.8% of the pixels were classified as a higher than medium risk level by the LR model, compared to about 20% by the pre-trained model. The MLP-2 model was the least conservative, classifying 14.7% of the pixels as risky, which was similar to the pre-trained model. The XGBoost-1 model classified 12.5% of the pixels as risky, which was also close to the pre-trained model. However, many of the risk pixels identified by these three models were located on the segments of tunnels (see zoomed inset), which were not suitable for our method since we focused on the roadside slopes that could be observed by satellites. After omitting these segments, the percentages of risk pixels were 4.2% for LR, 6% for XGBoost-1, and 9.5% for MLP-2. Based on these results, we conclude that all three models could work along the Heba Expressway under a 30 m resolution, but the LR model is not recommended for real applications unless further validation is completed. Both the XGBoost-1 and MLP-2 models showed good agreement with the results in Section 4.1, but the XGBoost-1 model could balance the effectiveness of landslide identification and the ratio of high-risk pixels better than the MLP-2 model. Therefore, we recommend the XGBoost-1 model for LHA applications.
In conclusion, this paper demonstrates the feasibility and effectiveness of using a pre-trained model to evaluate landslide hazards along a highway. The model can identify high-risk areas and provide useful information for mitigation and prevention measures. Despite some limitations, we can further refine and improve the model to enhance its accuracy and efficiency in practice, especially with more landslide samples. In addition, the results in Figure 7 indicate that risk levels vary with different models, suggesting that a further study on the integration of models would also improve the performance of pre-trained models in LHA.

5. Conclusions

Landslide disasters pose a serious threat to the safety of people and property along highways, especially in mountainous areas like Guangxi, China. To effectively prevent and mitigate landslide hazards, it is crucial to assess landslide risk and identify vulnerable locations. Remote sensing techniques have been widely used for landslide detection and monitoring because they provide large-scale, high-resolution, and multi-temporal data on various factors influencing landslide occurrence.
In this study, we propose a novel method that extracts these features from remote sensing data and feeds them into a pre-trained XGBoost model. The model can produce landslide hazard maps at different scales (1 km and 30 m in this work) and indicate the risk level (0–4) of landslide occurrence for each pixel. We compare the performance of the XGBoost model with other models such as MLP and LR on the test and validation datasets. The results show that the XGBoost model outperformed other models on most metrics, such as the AUC, F1-score, and kappa, indicating that it can avoid overfitting and achieve better trade-offs between TPR and FPR. When validated on the Heba Expressway, our method successfully recognized five out of seven events, with an alert rate of 6%. Compared to the MLP and LR models, the XGBoost model could provide a good balance between alert rate and landslide identification. Our method shows promise as a useful landslide hazard assessment tool that can provide valuable information for the preliminary risk evaluation of transportation networks and help prioritize areas needing further investigation or intervention.
Nevertheless, our method also faces some limitations. One major challenge is the scarcity of data on landslide occurrence in Guangxi. This hinders our ability to evaluate and compare model performance across different locations and to update the model with new data. Future research should gather more data on the temporal and spatial patterns of landslides in Guangxi and similar regions to better calibrate and validate the pre-trained model. Moreover, exploring the combinations of different types of models could also be valuable to enhance the performance of pre-trained models in LHA. Despite these limitations, the results on the Heba Expressway illustrate the potential of this method as a decision support tool for broad-scale risk assessment and management in the absence of timing data.
To conclude, this study proposes an innovative framework for landslide hazard assessment along highways based on remote sensing data and a pre-trained XGBoost model. This framework can help pinpoint areas susceptible to landslides at various scales and provide useful information for the preliminary risk assessment of transportation networks. This can potentially benefit transportation planning and emergency response by improving the resilience of critical infrastructure against landslide hazards.

Author Contributions

Conceptualization, Y.Z. (Yuze Zhang) and L.D.; methodology, Y.Z. (Yuze Zhang), L.D., and Y.H.; validation, Y.Z. (Yuze Zhang), Y.S., Y.Z. (Yu Zang) and M.Z.; formal analysis, Y.Z. (Yuze Zhang), L.D., and Y.H.; investigation, Y.S. and M.Z.; resources and data curation, Y.Z. (Yuze Zhang), Y.S., Y.H. and M.Z.; writing—original draft preparation, Y.Z. (Yuze Zhang) and Y.Z. (Yu Zang); writing—review and editing, Y.Z. (Yuze Zhang) and L.D.; visualization, Y.Z. (Yuze Zhang) and Y.H. All authors have read and agreed to the published version of the manuscript.

Funding

This work is supported by the National Natural Science Foundation of China (No. 42001301) and the Guangxi Science and Technology Project (AB20159034).

Conflicts of Interest

The authors declare no conflict of interest.

References

  1. Schuster, R.L. Socioeconomic Significance of Landslides. In Landslides: Investigation and Mitigation; Turner, A.K., Schuster, R.L., Eds.; Transportation Research Board Special Report 247; National Academy Press: Washington, DC, USA, 1996. [Google Scholar]
  2. Dai, F.C.; Lee, C.F.; Ngai, Y.Y. Landslide Risk Assessment and Management: An Overview. Eng. Geol. 2002, 64, 65–87. [Google Scholar] [CrossRef]
  3. Crozier, M.J. Deciphering the Effect of Climate Change on Landslide Activity: A Review. Geomorphology 2010, 124, 260–267. [Google Scholar] [CrossRef]
  4. Petley, D.N. Global Patterns of Loss of Life from Landslides. Geology 2012, 40, 927–930. [Google Scholar] [CrossRef]
  5. Varnes, D.J. Landslide Hazard Zonation: A Review of Principles and Practice; UNESCO: Paris, France, 1984. [Google Scholar]
  6. Guzzetti, F. Landslide Hazard and Risk Assessment. PhD. Thesis, University of Bonn, Bonn, Germany, 2006. [Google Scholar]
  7. Pardeshi, S.D.; Autade, S.E.; Pardeshi, S.S. Landslide Hazard Assessment: Recent Trends and Techniques; Springer Plus: Berlin/Heidelberg, Germany, 2013; Volume 2, p. 523. [Google Scholar]
  8. Lee, S.; Pradhan, B. Landslide hazard mapping at Selangor, Malaysia using frequency ratio and logistic regression models. Landslides 2007, 4, 33–41. [Google Scholar] [CrossRef]
  9. Hungr, O. A model for the runout analysis of rapid flow slides, debris flows, and avalanches. Can. Geotech. J. 1995, 32, 610–623. [Google Scholar] [CrossRef]
  10. Baecher, G.B.; Christian, J.T. Reliability and Statistics in Geotechnical Engineering; Wiley: Chichester, UK, 2003. [Google Scholar]
  11. Malczewski, J. GIS-based multicriteria decision analysis: A survey of the literature. Int. J. Geogr. Inf. Sci. 2006, 20, 703–726. [Google Scholar] [CrossRef]
  12. Ado, M.; Wang, R.-Y.; Lv, G.-A.; Jiao, L. Landslide Susceptibility Mapping Using Machine Learning: A Literature Survey. Remote Sens. 2022, 14, 3029. [Google Scholar] [CrossRef]
  13. Yu, H.; Li, S.; Ruan, W.; Yao, J.; Liu, Y.; Zhang, L. Landslide Susceptibility Mapping and Driving Mechanisms in a Vulnerable Region Based on Multiple Machine Learning Models. Remote Sens. 2023, 15, 1886. [Google Scholar] [CrossRef]
  14. Chen, S.; Abd Razak, K.I.; Shi, X.; Huang, R. Landslide susceptibility mapping using machine learning algorithms and multi-source remote sensing data. J. Mt. Sci. 2020, 17, 1897–1914. [Google Scholar]
  15. Chen, Z.; Shahabi, H.; Shirzadi, A.; Chien, S.-F.; Koufos, G.D.; Yu, M.; Alipour, S.; Zhang, Y.; Yang, T.; Xu, C.; et al. Landslide susceptibility mapping using multi-source remote sensing data and an ensemble machine learning algorithm. Remote Sens. Environ. 2020, 246, 111853. [Google Scholar]
  16. Alvioli, M.; Melillo, M.; Baum, R.L. A comparison of machine learning algorithms for regional landslide susceptibility mapping. Landslides 2020, 17, 1059–1078. [Google Scholar]
  17. Hong, S.-H.; Park, J.; Lee, J.-S.; Kim, K.-S.; Yi, M.-J. Landslide susceptibility mapping using deep learning-based convolutional neural networks with high-resolution satellite imagery. Remote Sens. Lett. 2020, 11, 725–734. [Google Scholar]
  18. Maji, A.K.; Martha, T.R.; Kerle, N.; van Westen, C.J. Landslide susceptibility mapping using deep convolutional neural network with multi-source remote sensing data. Geomat. Nat. Hazards Risk 2020, 11, 2336–2355. [Google Scholar]
  19. Lissak, C.; Bartsch, A.; Michele, M.D.; Gomez, C.; Maquaire, O.; Raucoules, D.; Roulland, T. Remote Sensing for Assessing Landslides and Associated Hazards. Surv. Geophys. 2020, 41, 1391–1435. [Google Scholar] [CrossRef]
  20. Casagli, N.; Intrieri, E.; Tofani, V.; Gigli, G.; Raspini, F. Landslide detection, monitoring and prediction with remote-sensing techniques. Nat. Rev. Earth Environ. 2023, 4, 51–64. [Google Scholar] [CrossRef]
  21. Li, Z.; Chen, W.; Wang, J. Landslide identification using machine learning. J. Mt. Sci. 2020, 17, 1379–1392. [Google Scholar]
  22. Chen, T.; Guestrin, C. XGBoost: A Scalable Tree Boosting System. In Proceedings of the 22nd ACM SIGKDD International Conference on Knowledge Discovery and Data Mining, San Francisco, CA, USA, 13–17 August 2016. [Google Scholar]
  23. Althuwaynee, M.A.; Pradhan, B.; Lee, S.; Buchroithner, M.F. Landslide susceptibility mapping using XGBoost machine learning algorithm. Geomat. Nat. Hazards Risk 2020, 11, 2829–2854. [Google Scholar]
  24. Pradhan, S.; Devkar, G.; Singh, U.K.; Kumari, P.; Singh, R. Landslide susceptibility assessment using XGBoost machine learning model: A case study of Uttarakhand state in India. Geocarto Int. 2020, 35, 1788–1813. [Google Scholar]
  25. Rahmati, S.; Moumenifar, U.; Monavari, S.M.; Jolaei, S.A.; Shahabi, H. A novel hybrid machine learning model based on XGBoost and MARS for landslide susceptibility assessment. Catena 2020, 187, 104352. [Google Scholar]
  26. Zhang, Y.; Takara, K.; Tachikawa, T. Landslide susceptibility mapping using an improved XGboost algorithm: A case study in the Kii Peninsula, Japan. Remote Sens. 2020, 12, 3413. [Google Scholar]
  27. Breiman, L. Bagging predictors. Machine Learn. 1996, 24, 123–140. [Google Scholar] [CrossRef] [Green Version]
  28. Paudel, U.; Oguchi, T.; Hayakawa, Y. Multi-resolution landslide susceptibility analysis using a DEM and random forest. Int. J. Geosci. 2016, 7, 726–743. [Google Scholar] [CrossRef] [Green Version]
  29. Xu, Q.; Huang, R.Q.; Xiang, X.Q. Time and Spacial Predicting of Geological Hazards Occurrence. J. Mt. Sci. 2000, S1, 112–117. [Google Scholar]
  30. Youssef, A.M.; Pourghasemi, H.R.; Pourtaghi, Z.S.; Al-Katheeri, M.M. Landslide susceptibility mapping using random forest, boosted regression tree, classification and regression tree, and general linear models and comparison of their performance at Wadi Tayyah Basin, Asir Region, Saudi Arabia. Landslides 2016, 13, 839–856. [Google Scholar] [CrossRef]
  31. Chen, T.; Zhong, Z.Y.; Niu, R.Q.; Liu, T.; Chen, S.Y. Mapping landslide susceptibility based on deep belief network. Geomatics Inf. Sci. Wuhan Univ. 2020, 45, 1809–1817. [Google Scholar]
  32. Guzzetti, F.; Carrara, A.; Cardinali, M.; Reichenbach, P. Landslide hazard evaluation: A review of current techniques and their application in a multi-scale study, Central Italy. Geomorphology 1999, 31, 181–216. [Google Scholar] [CrossRef]
  33. Feizizadeh, B.; Blaschke, T. An uncertainty and sensitivity analysis approach for GIS-based multicriteria landslide susceptibility mapping. Int. J. Geogr. Inf. Sci. 2014, 28, 610–638. [Google Scholar] [CrossRef] [Green Version]
  34. Van Den Eeckhaut, M.; Vanwalleghem, T.; Poesen, J.; Govers, G.; Verstraeten, G.; Vandekerckhove, L. Prediction of landslide susceptibility using rare events logistic regression: A case-study in the Flemish Ardennes (Belgium). Geomorphology 2006, 76, 392–410. [Google Scholar] [CrossRef]
  35. Blahut, J.; Van Westen, C.J.; Sterlacchini, S. Analysis of landslide inventories for accurate prediction of debris-flow source areas. Geomorphology 2010, 119, 36–51. [Google Scholar] [CrossRef]
  36. Felicísimo, Á.M.; Cuartero, A.; Remondo, J.; Quirós, E. Mapping landslide susceptibility with logistic regression, multiple adaptive regression splines, classification and regression trees, and maximum entropy methods: A comparative study. Landslides 2012, 10, 175–189. [Google Scholar] [CrossRef]
  37. Chen, T.; He, T. Higgs boson discovery with boosted trees. In Proceedings of the NIPS 2014 Workshop on High-energy Physics and Machine Learning 2015, Montreal, QC, Canada, 8–13 December 2014; PMLR: New York, NY, USA, 2015; Volume 42. [Google Scholar]
  38. James, G.M.; Witten, D.; Hastie, T.; Tibshirani, R. An Introduction to Statistical Learning; Springer: New York, NY, USA, 2018; Volume 103, p. 18. [Google Scholar]
  39. Molnar, C. Interpretable Machine Learning; Lulu Press: Morrisville, NC, USA, 2019. [Google Scholar]
  40. Lv, L.; Chen, T.; Dou, J.; Plaza, A. A hybrid ensemble-based deep-learning framework for landslide susceptibility mapping. Int. J. Appl. Earth Obs. Geoinf. 2022, 108, 102713. [Google Scholar] [CrossRef]
  41. He, Y.; Zhao, Z.; Yang, W.; Yan, H.; Liu, T. A unified network of information considering superimposed landslide factors sequence and pixel spatial neighbourhood for landslide susceptibility mapping. Int. J. Appl. Earth Obs. Geoinf. 2021, 104, 102508. [Google Scholar] [CrossRef]
  42. Gao, X.; Chen, T.; Niu, R.; Plaza, A. Recognition and mapping of landslide using a fully convolutional densenet and influencing factors. IEEE J. Sel. Top. Appl. Earth Obs. Remote Sens. 2021, 14, 7881–7894. [Google Scholar] [CrossRef]
Figure 1. Spatial distribution of landslides along roads in Guangxi from 1950 to 2020.
Remotesensing 15 03350 g001
Figure 2. Feature importance of pre-trained model.
Remotesensing 15 03350 g002
Figure 3. Plots of ROC curves with different sets.
Remotesensing 15 03350 g003
Figure 4. Overlay of landslide events and 98th probability map of predicted landslide hazard in Guangxi.
Remotesensing 15 03350 g004
Figure 5. Landslide susceptibility map of highways in Guangxi Province.
Remotesensing 15 03350 g005
Figure 6. Predicted hazard pixels in study areas: (a) 2021-07-04 (XGBoost-1/MLP-2); (b) 2022-01-17 (XGboost-1/MLP-2); (c) 2022-03-30 (XGBoost-1/MLP-2/LR).
Remotesensing 15 03350 g006aRemotesensing 15 03350 g006b
Figure 7. Landslide hazard levels along Heba Expressway: (a) XGBoost-1; (b) MLP-2; (c) LR.
Remotesensing 15 03350 g007aRemotesensing 15 03350 g007b
Table 1. Selected landslide catalogs.
Landslide CatalogTime RangeLandslide EventsReference
United States2009–20201963https://www.gislounge.com/using-nasas-global-landslide-catalog-for-landslide-risk-management/ (accessed on 13 May 2023)
Guangxi1950–20204229/
Heba Expressway2021.01–2022.037/
Table 2. Selected indicators and data sources.
IndicatorSourceDatasetTime
Resolution
Spatial ResolutionReference
Slope and AspectASTGTM3 DEMDEM/30 mhttps://lpdaac.usgs.gov/products/astgtmv003/ (accessed on 13 May 2023)
RainfallGPM Level 3 IMERG Late DailyPrecipitation1 day10 kmhttps://gpm.nasa.gov/data/directory (accessed on 13 May 2023)
Soil MoistureSMAP L4Root zone soil moisture percentile1 day9000 mhttps://grace.jpl.nasa.gov/data/get-data/ (accessed on 13 May 2023)
NDVIMODIS Surface Reflectance Daily L2GSurface Reflectance1 day500 mhttps://lpdaac.usgs.gov/products/mod09gav061/ (accessed on 13 May 2023)
Harmonized Landsat Sentinel-2 (HLS)2–3 days30 mhttps://lpdaac.usgs.gov/products/hlsl30v002/ (accessed on 13 May 2023)
Land Cover TypesMODIS Land Cover TypeLC_Type1(IGBP) and 3(LAI)1 year250 mhttps://lpdaac.usgs.gov/products/modis_products_table/mcd12q1 (accessed on 13 May 2023)
China Land Cover Dataset (CLCD)/30 mhttps://essd.copernicus.org/articles/13/3907/2021/ (accessed on 13 May 2023)
LithologyGlobal Lithological Map (GLiM)///https://www.earthdoc.org/content/papers/10.3997/2214-4609.201802924 (accessed on 13 May 2023)
Table 3. Summary of datasets for model training.
DatasetTotalTime RangePositive Samples
Training145,7382009–20171478
Test36,435335
Validation15,2582018–2020150
Total197,431-1963
Table 4. Parameters for grid search.
Parameter NameParameter ContentValue Range
Learning RateThe rate at which the model learns0.001, 0.05, 0.1
Max DepthsThe maximum depth of the tree3, 4, 5,
SubsamplesThe subsample ratio of the training instances0.5, 0.8, 1.0
GammaThe minimum loss reduction. The larger it is, the more conservative the algorithm will be.0, 0.01, 0.1
Minimum Child WeightThe minimum sum of instance weight (hessian) needed in a child1, 2, 3
EstimatorsNumber of gradient-boosted trees100, 200, 300
Table 5. Evaluation metrics of 7 pre-trained models.
MetricsDatasetsXGBoost-1XGBoost-2MLP-1
(8 × 8)
MLP-2
(16 × 16)
MLP-3
(32 × 32)
SVMLR
AUC (%)Training97979596988892
Test95969495938792
Validation93939491908691
Kappa (%)Training81807679856168
Test78787477705770
Validation68637268645567
Weighted F1-Score (%)Training94959393949191
Test94959394949191
Validation93949292938889
Weighted Recall (%)Training89918889918584
Test89918889908585
Validation88908688897982
Overall Accuracy (%)Training89918889918584
Test89918889908585
Validation88908688897982
FPR (%)Training1191211101516
Test1191211101515
Validation12101412112118
TPR (%)Training92898890957684
Test88878688797286
Validation80738680757585
Table 6. Values of hyperparameters for pre-trained model.
Parameter NameValues
Learning Rate0.1
Max Depths4
Subsamples0.5
Gamma0.1
Minimum Child Weight2
Estimators200
Tree Methodexact
Table 7. Thresholds for classifying the predicted probabilities.
Classified NumberRisk LevelPercentile Thresholds
0Very Low<2nd%
1Low[2nd%, 39th%)
2Medium[39th%, 89th%)
3High[89th%, 99th%)
4Very High≥99th%
Table 8. Mapping of MODIS land cover and ICLD surface types.
ICLD ValuesIGBP ValuesLAI Values
1123
255
362
4101
5170
6159
7169
81310
9119
Table 9. Landslide prediction results for each cycle.
Prediction
Cycle
Start DateEnd DateLandslide
Occurrence
Predicted Risk Pixels
(≥Medium)
XGBoost-1MLP-2LR
14 July 202111 July 202111 July 2021310
4 July 202111 July 202112 July 2021
224 October 202131 October 202125 October 2021000
317 November 202124 November 202124 November 2021000
417 January 202224 January 202218 January 2022121
17 January 202224 January 202223 January 2022
530 March 20226 April 202231 March 202214303
Disclaimer/Publisher’s Note: The statements, opinions and data contained in all publications are solely those of the individual author(s) and contributor(s) and not of MDPI and/or the editor(s). MDPI and/or the editor(s) disclaim responsibility for any injury to people or property resulting from any ideas, methods, instructions or products referred to in the content.

