Article

Spatio-Temporal Evolution and Coupled Coordination of LUCC and ESV in Cities of the Transition Zone, Shenmu City, China

1
Institute of Environment and Social Development, Chang’an University, Xi’an 710054, China
2
School of Architecture, Chang’an University, Xi’an 710061, China
3
Key Laboratory of Subsurface Hydrology and Ecological Effects in Arid Region, Ministry of Education, Chang’an University, Xi’an 710054, China
4
School of Water and Environment, Chang’an University, Xi’an 710054, China
5
Xi’an Monitoring, Modelling and Early Warning of Watershed Spatial Hydrology International Science and Technology Cooperation Base, Chang’an University, Xi’an 710054, China
*
Authors to whom correspondence should be addressed.
Remote Sens. 2023, 15(12), 3136; https://doi.org/10.3390/rs15123136
Submission received: 5 May 2023 / Revised: 9 June 2023 / Accepted: 12 June 2023 / Published: 15 June 2023

Abstract

:
This study investigates the spatial-temporal evolution and the interconnectedness of land use/cover change (LUCC) and ecosystem service value (ESV). Such analysis can offer theoretical guidance and support decision-making for sustainable land resource development and ecological preservation in ecologically vulnerable cities within the Loess Plateau-Maowusu Desert transition zone. Utilizing Landsat data spanning 2000–2020, the paper examines the synergistic relationship between ESV and land use intensity in Shenmu City through bivariate spatial autocorrelation and the coupled coordination degree (CCD) model. Our findings indicate that the area of construction land in Shenmu City experienced the most significant change between 2000 and 2020, with a dynamism rate of 76.8%. This shift resulted in a decrease in the total ESV, from RMB 10.059 billion in 2000 to RMB 9.906 billion in 2020. The bivariate spatial autocorrelation analysis reveals a significant positive spatial correlation between ESV and land use intensity, while the CCD levels for both demonstrate a fluctuating yet overall upward trend over the 20-year period. The paper uncovers the spatial-temporal evolution of LUCC and ESV in Shenmu City along with their interconnected dynamics. The research outcomes can contribute valuable insights for reinforcing land resource utilization and promoting sustainable regional development within cities in the Loess Plateau-Maowusu Desert transition zone.

1. Introduction

Ecosystem services (ES) refer to the goods and services necessary for life that are obtained either directly or indirectly from the structure, processes, and functions of ecosystems [1,2]. They are vital for human wellbeing and survival, as well as regional and global ecological stability [3,4,5,6], and are a prominent focus in current geography and ecology research [7,8]. In recent ecosystem services research, the emphasis has shifted from the roles and mechanisms of ES to the connection between ES and human activities [9]. Costanza et al. evaluated the alterations in ecosystem services value (ESV) at a worldwide scale [10], revealing that the global ESV in 2014 was lower than in 2008, indicating a decline in global ecosystem functions. Factors contributing to these changes encompass population pressure, poverty, agricultural expansion, and infrastructure intensification [11,12,13]. In China, ongoing socio-economic growth over the last few years has led to an annual expansion in land use and demand, with vast amounts of land being converted into construction areas, resulting in a substantial decrease in ecological land such as forests and grasslands. This contributes to a decline in ESV and a growing conflict between land supply and demand. Consequently, investigating the association between land use/cover change (LUCC) and ESV is crucial to providing a theoretical foundation for advancing regional ecological development and sustainable progress.
To ensure that each value provided by ES is appropriately considered in environmental decision-making, it is necessary to quantify them. If the value of ecosystem service (ESV) is not quantified, it may be overlooked, leading to potential harm to the entire biosphere [1]. In 1997, Costanza et al. [1] were the first to categorize and assess ecosystem service functions (ESF) globally, employing a quantitative ESV model utilizing global ecosystem averages which has since become a fundamental basis for ESV research. However, it is worth mentioning that the value coefficients in this model are grounded in global ecosystem averages and may vary across different study areas, resulting in differences in ES levels [14]. Therefore, it is necessary to adjust the coefficients to some extent to prevent the accuracy of ESV assessments from being affected [15]. To better apply Costanza’s findings to regional-scale research in China. A Chinese Terrestrial Ecosystem Unit Area Ecological Service Value Equivalence Table was developed and enhanced by [16,17], utilizing Costanza’s evaluation model. This approach has been widely used in ESV assessments in China’s forests [18], grasslands [19], lakes [20,21], and urban areas [22,23,24]. However, there are differences in the actual ES at different regional scales in China, and the equivalence factor coefficients need to be adjusted further based on the specific features of the study region. Consequently, numerous scholars have attempted to adjust the coefficients [25,26,27]. This paper comprehensively considered the annual grain production and socioeconomic statistics of farmland in Shenmu City to make adjustments to the ESV coefficients, ensuring more accurate assessment results. LUCC impacts the values of ES by altering their framework and function [28,29,30]. Recent studies have demonstrated that some researchers employ methods like machine learning random forest algorithms to analyze LUCC and its social driving factors within various regions, and to forecast future LUCC trends [31,32]. Both domestic and international scholars have extensively studied the interdependence of LUCC and ESV, as the decline of important ESVs not only disrupts the balance of the ecosystem but also impacts the ecological benefits that humans derive from it. This highlights the significance of maintaining a sustainable balance between LUCC and ESV [33,34,35]. Currently, research on the relationship between the two mainly includes: analyzing the spatiotemporal distribution of ESV based on LUCC [36,37,38,39]; forecasting future changes in ESV through the use of LUCC models [40,41,42]; examining how landscape patterns influence ES in [43,44]; investigating synergistic and trade-off relationships between ES [37,38]. Although previous studies have provided insights into the influence of regional-scale LUCC on ESV, the spatiotemporal evolution of LUCC and ESV, as well as the coupled and coordinated relationships, require further exploration.
Shenmu City is a core area of ecological security and a critical zone for sand control in China, and the uncoordinated development of LUCC and ESV in the region can also pose a major threat to the local ecological environment [9].To tackle the aforementioned problems, a scientific evaluation of the ESV in the area is required, along with an analysis of the correlation between LUCC and ESV. Currently, the existing studies in the region have an early chronology [45], and research into the bond between LUCC and ESV have been lacking in recent years, with limited research conducted over long periods of time [46,47]. Furthermore, the degree of land utilization is a significant measure of the extent of land use, as indicated in reference [2]. In essence, we investigated how ESV and land use intensity are interconnected using the CCD model to measure the degree of coupling coordination. The primary aim of this research is: (1) Analyze the characteristics of Land Use and Cover Change (LUCC) and its effect on Ecosystem Services Value (ESV) in Shenmu City from the years 2000 to 2020. (2) Examine the bivariate spatial autocorrelation between ESV and land use intensity within the same timeframe and location. (3) Investigate the synchronization and spatial-temporal distribution characteristics of LUCC and ESV in Shenmu City over the twenty-year period. The spatial and temporal distribution characteristics of regional coupling coordination types are analyzed according to the delineated coupling coordination guidelines. Through these research objectives, we aim to provide a reference for comprehensive management decisions on ecological protection, land use planning, and eco-economic accounting in Shenmu City, as well as research methods and technical information for urban ecological environment management in the Loess Plateau-Maowusu Desert transition zone.

2. Materials and Methods

2.1. Study Area

Shenmu City is located in China Shaanxi Province’s Yulin City and shares borders with Shanxi Province and Inner Mongolia Autonomous Region. It is located in the northeastern part of the Loess Plateau-Maowusu Desert transition zone, in the transition area of the Loess Plateau, Sichuan and Yunnan ecological barriers and the northern sand control belt in China’s national ecological security strategy pattern. For the Sichuan-Yunnan district of the Loess Plateau and a transitional area for the northern sand control zone in the national environmental security plan of China. The city’s geographical coordinates are 38°23′N–39°27′N and 109°40′E–110°54′E, covering a total area of approximately 747,416 hm2 (Figure 1). The city is divided into three geomorphological zones. The west and northwest regions comprise desert beach areas, accounting for 51.3% of the total area of Shenmu City. These areas mainly include two types of landforms, desert areas, and beach areas, with fixed sand, semi-fixed sand, flowing dunes, grass beaches, and gentler terrain with a lower wet beach and sea. The central, eastern, northern, and southern areas consist of loess hilly areas, accounting for 37.6% of the total area of Shenmu City. The landforms of this area mainly include a loess mount area and a sand-covered loess mount area, with an undulating surface mount, gully, and fragmented terrain. The Yellow River canyon hilly area, representing 11.1% of the overall extent of Shenmu City, is situated along the Yellow River and features narrow valley roads, exposed rocks, cliffs, and steep slopes (Table 1). Shenmu City is the largest county-level city in Shaanxi Province, consisting of 14 towns, 6 streets, and 326 administrative villages. As of July 2022, the total population of the city was 576,400.

2.2. Data Source

The land cover data utilized in this study was sourced from five phases of remote sensing data, accessed via the China Resources and Environment Science and Data Center website (https://www.resdc.cn/Default.aspx, accessed on 14 March 2023), spanning the years 2000, 2005, 2010, 2015, and 2020. The data include Landsat-TM/ETM, Landsat-TM, and Landsat8-Operational Land Imager data with a resolution of 30m. The relevant socioeconomic data of Shenmu City were sourced from the “Work Report of Shenmu Municipal Government” in previous years and the website of Shenmu Municipal People’s Government (http://www.sxsm.gov.cn/, accessed on 28 May 2023). The Statistical Yearbook of Shenmu City from past years provided data on the combined grain sown area and production figures, and the crop prices were obtained from the website of the Shaanxi Provincial Grain and Material Reserve Bureau (http://lswz.shaanxi.gov.cn/, accessed on 14 March 2023).

2.3. Methods

The aim of this study is to examine how the changes in land use in Shenmu City from 2000 to 2020 have affected the temporal and spatial development of ecosystem services and their interdependence. Initially, this paper outlines the dynamic degree of land use, land use intensity, and land use type transition matrix to examine the spatiotemporal features of LUCC. Secondly, an ESV equivalence table for Shenmu City is constructed, and the ESV undergoes evaluation through the use of the equivalence factor method. Thirdly, sensitivity indicators are implemented to gauge the dependability of the evaluation outcomes. Fourthly, we employ a bivariate spatial autocorrelation model to measure the spatial interaction between intensity of land use and ESV. Lastly, we use the CCD model to investigate the coupled coordination relationship between land use intensity and ESV. The method structure is depicted in the Figure 2.

2.3.1. Degree of Land Use Dynamics

Land use dynamics degree is a method used to quantify changes in a specific type of land within a designated study region during a defined timeframe [48]. This approach is typically expressed as a percentage and can be utilized to perform the calculation:
K = U b U a U a × 1 T
K is the measure of the temporal variability of a particular land category in the research region, while U a and   U b represents the initial and final spatial extent of the same category, and T signifies the length of the duration of study in years.

2.3.2. Land Use Intensity

In general, human behaviors have a direct effect on land use intensity, which can be categorized into four tiers: level 1 representing unused land; level 2 including water bodies, forests, and grasslands; level 3 encompassing arable land; and level 4 consisting of construction land [49]. The mathematical expression for calculating land use intensity is:
Q a = 100 × i = 1 n A i × C i
In this framework, Q a denotes the overall density of land utilization, A i denotes the level of land use intensity, and C i denotes the proportion of land area allocated to various land use categories.

2.3.3. Matrix for Transferring Land Use Types

The land use transfer matrix is a tool used in system analysis to quantitatively describe the state of and changes in a system. It presents changes in land use classes over a two-year period in matrix form, which can enhance comprehension of temporal shifts in land use patterns. Additionally, when combined with GIS spatial analysis functions, it can offer a more intuitive depiction of the spatial distribution of land use transfers within a specified region [45]. The matrix can be expressed as:
S i j = ( S 11 S 1 n S n 1 S n n )
In this formula, i , j = 1 , 2 , 3 · · · , n , S refers to the land use area, where as S i j represents the area of land class that was converted from one class to another. n is the variable used to represent the number of land use types pre- and post-transfer, with i and j indicates the land use types before and after the transfer correspondingly.

2.3.4. ESV Estimation

This paper is based on the “Chinese Ecosystem Service Value Equivalent Factor Table” compiled by Xie et al. [16] as the original equivalence table. On this basis, coefficients were modified according to the actual land area proportion in Shenmu City, and the 14 secondary classifications in the original equivalence table were matched with the six land types in this paper. Specifically, the service value coefficient for dry land was replaced with that of arable land; the average of four service value coefficients for coniferous forest, broadleaf forest, mixed coniferous forest, and shrub was taken for forest land; the average of three service value coefficients for grassland, scrub, and meadow was taken for grassland; the average of two service value coefficients for water system and wetland was taken for watershed; the service value coefficient for desert was taken for unused land. Furthermore, as per Xie et al.’s [17] initial equivalence table, ESV computation did not factor in construction land. Using the aforementioned adjusted equivalence coefficients, the ESV equivalence coefficients for Shenmu City were determined and are provided in Table 2.
The research in question utilized the methodology of Xie et al. [16], which employed the ESV equivalent factor at 1/7 of the grain value per hectare per year to determine the economic value coefficient in the study location. Using the grain production and price levels specific to the study area, the formula below was utilized to estimate the annual economic value of natural grain production for farmland.
E a = 1 7 × Y × P
In the formula, E a denotes the functional output of food production per unit area of the farmland ecosystem within the study region (Yuan/ hm 2 ), while Y represents the mean annual grain yield during the study period ( kg / hm 2 · a ) and P represents the average grain price in Shenmu City in 2020 (Yuan/kg).
Xie et al.’s “Chinese Ecosystem Service Value Equivalent Factor Table” was utilized to adjust the economic assessment of the yearly grain production per land area. Using the reference standard while considering the present conditions of the study region. After the correction, the average grain yield in Shenmu City from 2000 to 2020 was 3874.67 kg / hm 2 , with an average purchase price of 2.28 yuan / kg . The study area’s annual grain yield per unit area of farmland was determined to have an economic value of 1262.03 yuan / hm 2 . Using this value, the ESV for Shenmu City was derived (Table 3). The formula used to calculate ESV is given as follows: E S V = E a × A , where A represents the total farmland area in Shenmu City.
E S V = i = 1 n ( A i × V C i )
E S V f = i = 1 n ( A i × V C f i )
ESV stands for the value of ecosystem services in the given formula. A i represents the area of the i th land use type ( hm 2 ), V C i denotes the coefficient for the ESV of the i th type of land use, while E S V f denotes the value of the f th ecosystem service function, and V C f i represents the f th ESV of the i th land use type.

2.3.5. Sensitivity Index Analysis

The Elasticity Analysis Model from economics is used in conducting a sensitivity analysis for ESV to determine the extent to which changes in the Ecological Value Coefficient (VC) affects ESV [50].The ESV Sensitivity Index (CS) is used to indicate the ESV change resulting from a 1% VC alteration. When the CS exceeds 1, ESV exhibits elasticity to VC, indicating subpar precision and reduced result reliability. Conversely, assuming a CS value below 1, ESV demonstrates inelasticity to VC, which implies increased result accuracy and credibility. Additionally, as CS increases, the influence of the ESV coefficient change on total ESV for a particular land category becomes more pronounced. emphasizing the importance of accuracy in assessing the whole ESV [46]. The formula used to calculate CS is given below:
C S = | ( E S V j E S V i ) / E S V i ) V C j k V C i k V C i k |
In the formula, C S represents ESV sensitivity; V C j and V C i respectively represent the initial value coefficient and adjusted value coefficient of the k th land class; E S V j and E S V i represent the total initial ESV value and the total adjusted ESV value, respectively.

2.3.6. Spatial Autocorrelation Test

One potential application of spatial autocorrelation analysis is to examine the presence of spatial clustering and heterogeneity in a given attribute value. This is typically measured using global and local Moran’s I indices, which reveal the spatial distribution characteristics [51].This research utilized bivariate spatial autocorrelation analysis to examine the spatial correlation between ESV and intensity of land use. This study employs Bivariate Moran’s I, which includes global bivariate spatial autocorrelation and local bivariate spatial autocorrelation, to analyze the spatial agglomeration and dispersion patterns between ESV and land-use intensity [52,53].The global Moran’s I index, which varies from −1 to 1, was employed. A negative Moran’s I value signifies an unfavorable correlation between economic growth and ESV, whereas a positive Moran’s I value implies a favorable correlation between ESV and land use intensity. If the Moran’s I index approaches zero, it suggests a scattered pattern in the correlation between ESV and land use intensity.

2.3.7. Analyzing the Coordination between LUCC and ESV

The CCD, which stands for coupled coordination degree, measures the degree of correlation between different systems [52]. Coupling refers to the phenomena where two or more systems influence each other through various interaction methods. The Coupling Degree (CD) describes the extent of these interactions between systems or elements. The Coupling Coordination Degree (CCD) is an indicator developed based on CD, which measures the degree of coupling in the development of integrated systems [50]. Although initially used mainly in software systems, it has now been adopted for analyzing correlations between various phenomena such as LUCC and ESV, urbanization, and more [9]. Consequently, in this study, the CCD model is utilized to assess the interdependence between LUCC and ESV. The formula used for this purpose is as follows:
U = 2 u 1 × u 2 ( u 1 + u 2 ) 2
{ S = U × T T = α u 1 + β u 2
In this study, U stands for coupling degree, S stands for coordination degree, and T represents CCD. Intensity of land use and ESV weights are denoted by α and β respectively, and both are set to 0.5. Intensity of land use and ESV are normalized and represented by u 1 and u 2 respectively. To provide a clearer description of the diversity of land use types coupled coordination, a hierarchical structure has been established for the coupled coordination [54].

3. Results

3.1. LUCC Characteristics

The LUCC of Shenmu City was analyzed for the 5-year periods of 2000, 2005, 2010, 2015, and 2020 to obtain the spatiotemporal characteristics of land use changes (Figure 3). A breakdown of the area share and change for each category in Shenmu City during the study period was also conducted (Figure 4 and Figure 5). During these five periods, the dominant land use types were grassland, cropland, and unused land, which together comprised over 90% of the total land coverage. As of 2020, the area of each category in descending order were: grassland (55%) to cropland (24.73%) to unused land (10.52%) to construction land (3.93%) to forest land (3.48%) to water (2.34%). Upon analyzing the distribution traits of each category and aligning them with Shenmu City’s natural landform zones, it is evident that forest land, arable land, and water bodies are primarily located within the Loess Hills area, the desert beach area, and the Hongyinnao freshwater lake in the city’s northwestern part. Conversely, unused land predominantly appears in the desert and the canyon hilly areas, characterized by their narrow topography in the city’s west. The grassland distribution is most dispersed (Figure 6).

3.1.1. Land Use Dynamic Degree

Drawing upon the data on changes in land use for Shenmu City spanning 2000 to 2020, we calculated the trend of area change and land use dynamic attitude for each land category (Table 4).
The land categories ranked in descending order based on their kinetic attitudes are: construction land (76.8%), cropland (−0.6%), forest land (0.5%), watershed (−0.2%), unused land (−0.2%), and grassland (0.01%). The forest land and grassland categories rose from 2000 to 2010 and decreased from 2010 to 2020, with kinetic attitudes of 0.5% and 0.01%, respectively, and the change in kinetic attitude was consistent. The kinetic attitude of cropland was −0.6% and showed a continuous decrease throughout the duration of the study. The change in kinetic attitude of the above three land categories is closely related to the farmland conversion to forest and grassland policy and the trend of socio-economic development in Shenmu City over the study period. Specifically, during the 2000–2010 decade, the implementation of the policy promoting the conversion of farmland back to forests and grasslands resulted in an expansion of both forest and grassland areas, while simultaneously reducing the extent of cultivated land. During the entire duration of the study, construction land exhibited the largest area change among all categories with a kinetic attitude of 76.8%, reflecting the trend of rapid urbanization and socio-economic development in Shenmu City. The significant increase within the scope of construction land had a notable effect on water area and unused land, which showed an overall decreasing trend with a kinetic attitude of −0.2%.

3.1.2. Land Use Conversion Pattern

In this study, we analyze and quantify the transfer process between categories in Shenmu City through the land use transfer matrix (Figure 7). The results are as follows.
(1)
During the period of 2000–2010 in Shenmu City, the transfer characteristics of various land categories were mainly characterized by the transfer of arable land and grassland to construction land, with an area of 1619.5 (23.61%) and 4198.8 hm2 (61.21%), respectively, and the area of construction land increased significantly. Throughout this duration, the construction land increased from 1796.1 hm2 (0.24%) in 2000 to 8459.6 hm2 (1.13%) in 2010. In general, the transfer of construction land was the most prominent, with a notable rise in the total area during this period. In addition, grassland and cropland also showed characteristics of migration. In contrast, the transfer of forest land, unused land, and water area was smaller.
(2)
From 2010 to 2020 inclusive, there was a more pronounced shift in land use in Shenmu City, with a doubling in the domain of construction land. Grassland, which had the highest area share, shifted by a total of 23,639.1 hm2, most of which was converted to arable land and construction land, with areas of 4440.5 and 14,906.3 hm2, respectively.
(3)
Throughout the period of investigation, it is evident that the gradual expansion of construction land in Shenmu City resulted in significant encroachment on ecological land, including grassland, arable land, and unused land, which resulted in slow degradation of the ecological environment. Additionally, the transfer process among arable land, forest land, and watershed also demonstrates Shenmu City’s response to the farmland-to-forest and grass project policy.

3.1.3. Analysis of Land Use Intensity Changes

By analyzing the land use change data of each township and subdistrict in Shenmu City from 2000 to 2020, we calculated land use intensity and its variations over various years (Table 5). The findings indicate that land use intensity in Shenmu City demonstrated a downward trend initially, followed by an increasing trend, with the smallest and largest values observed in 2005 and 2020, respectively. Among the different towns and villages surveyed, six have exhibited a land use intensity trend that aligns with Shen Mu City; whereas, five others have demonstrated a consistent trajectory of either increase or decrease in land use intensity. Notably, Dabaodang Town and Wanzhen Town have undergone the most significant fluctuations in land use intensity. On a broader scale, Shenmu City’s land use intensity has generally displayed an escalating pattern during the span of 2000 to 2020, with a cumulative increase quantified at 4.43.

3.2. Ecosystem Service Value Change Characteristics

3.2.1. Ecosystem Service Value Temporal Change Characteristics

Utilizing the findings of the aforementioned investigation, the LUCC was updated with the ESV of Shenmu City for the duration of the study, thereby enabling the determination of alterations in each category’s ESV from 2000 to 2020 (Figure 8 and Table 6). The analysis of the transformed data leads to the following conclusions.
Throughout the study duration, there was an escalation in the ESV indices of both forest land and grassland. Notably, the ESV index of forest land demonstrated a consistent upsurge across the three study periods of 2000, 2005, and 2010, implying an expansion in the forest land area during this interval. The ESV index decreased somewhat in 2015 and 2020 but showed an overall increasing trend. Compared to 2000, the ESV index of forest land increased by a total of CNY 0.058 billion in 2020. The ESV index of grassland also increased in the three study periods of 2000, 2005, and 2010, reaching a maximum value of CNY 6.489 billion in 2010 and decreasing, thereafter, to CNY 6.259 billion in 2020, with a total increase of CNY 4 million in the ESV index compared to 2000.
The ESV indices of arable land, watershed, and unused land all decreased, decreasing by CNY 0.131 billion, CNY 0.08 billion, and CNY 5 million, respectively. Of these, the ESV index of arable land continuously decreased in the five study periods from 2000 to 2020, from CNY 1.066 billion in 2000 to CNY 0.935 billion in 2020, with the most significant decrease due to the execution of the Green Grain Program and the encroachment of construction land. The ESV index of watershed continuously decreased in the four study periods from 2000 to 2015, primarily caused by the change from watersheds to forest land or arable land and ecological degradation such as water drying up. The ESV index of unused land fluctuated greatly from 2000 to 2010, increasing from CNY 0.114 billion in 2000 to CNY 0.118 billion in 2005, then decreasing to CNY 0.112 billion in 2010 and remaining stable from 2010 to 2020.
Grasslands and watersheds are the main types of land providing ecosystem services (ESV) in Shenmu City, with their combined share of ESV reaching over 80%. From 2000 to 2005, there was some growth in the total ESV in Shenmu City, primarily caused by the expansion of woodlands and grasslands as well as the relative stability of other land types. However, in the following 15 years, the total ESV in Shenmu City experienced a continuous decline, as the ecological environment worsened, the overall ESV declined from CNY 10.059 billion in 2000 to CNY 9.906 billion in 2020. The primary reason for this decline is the doubling of the construction land area, which has led to the continuous shrinkage of ecological land such as arable land, forest land, grassland, and water area. This, in turn, has caused ecological problems in the environment such as the drying up of water areas, soil erosion, and soil sanding.

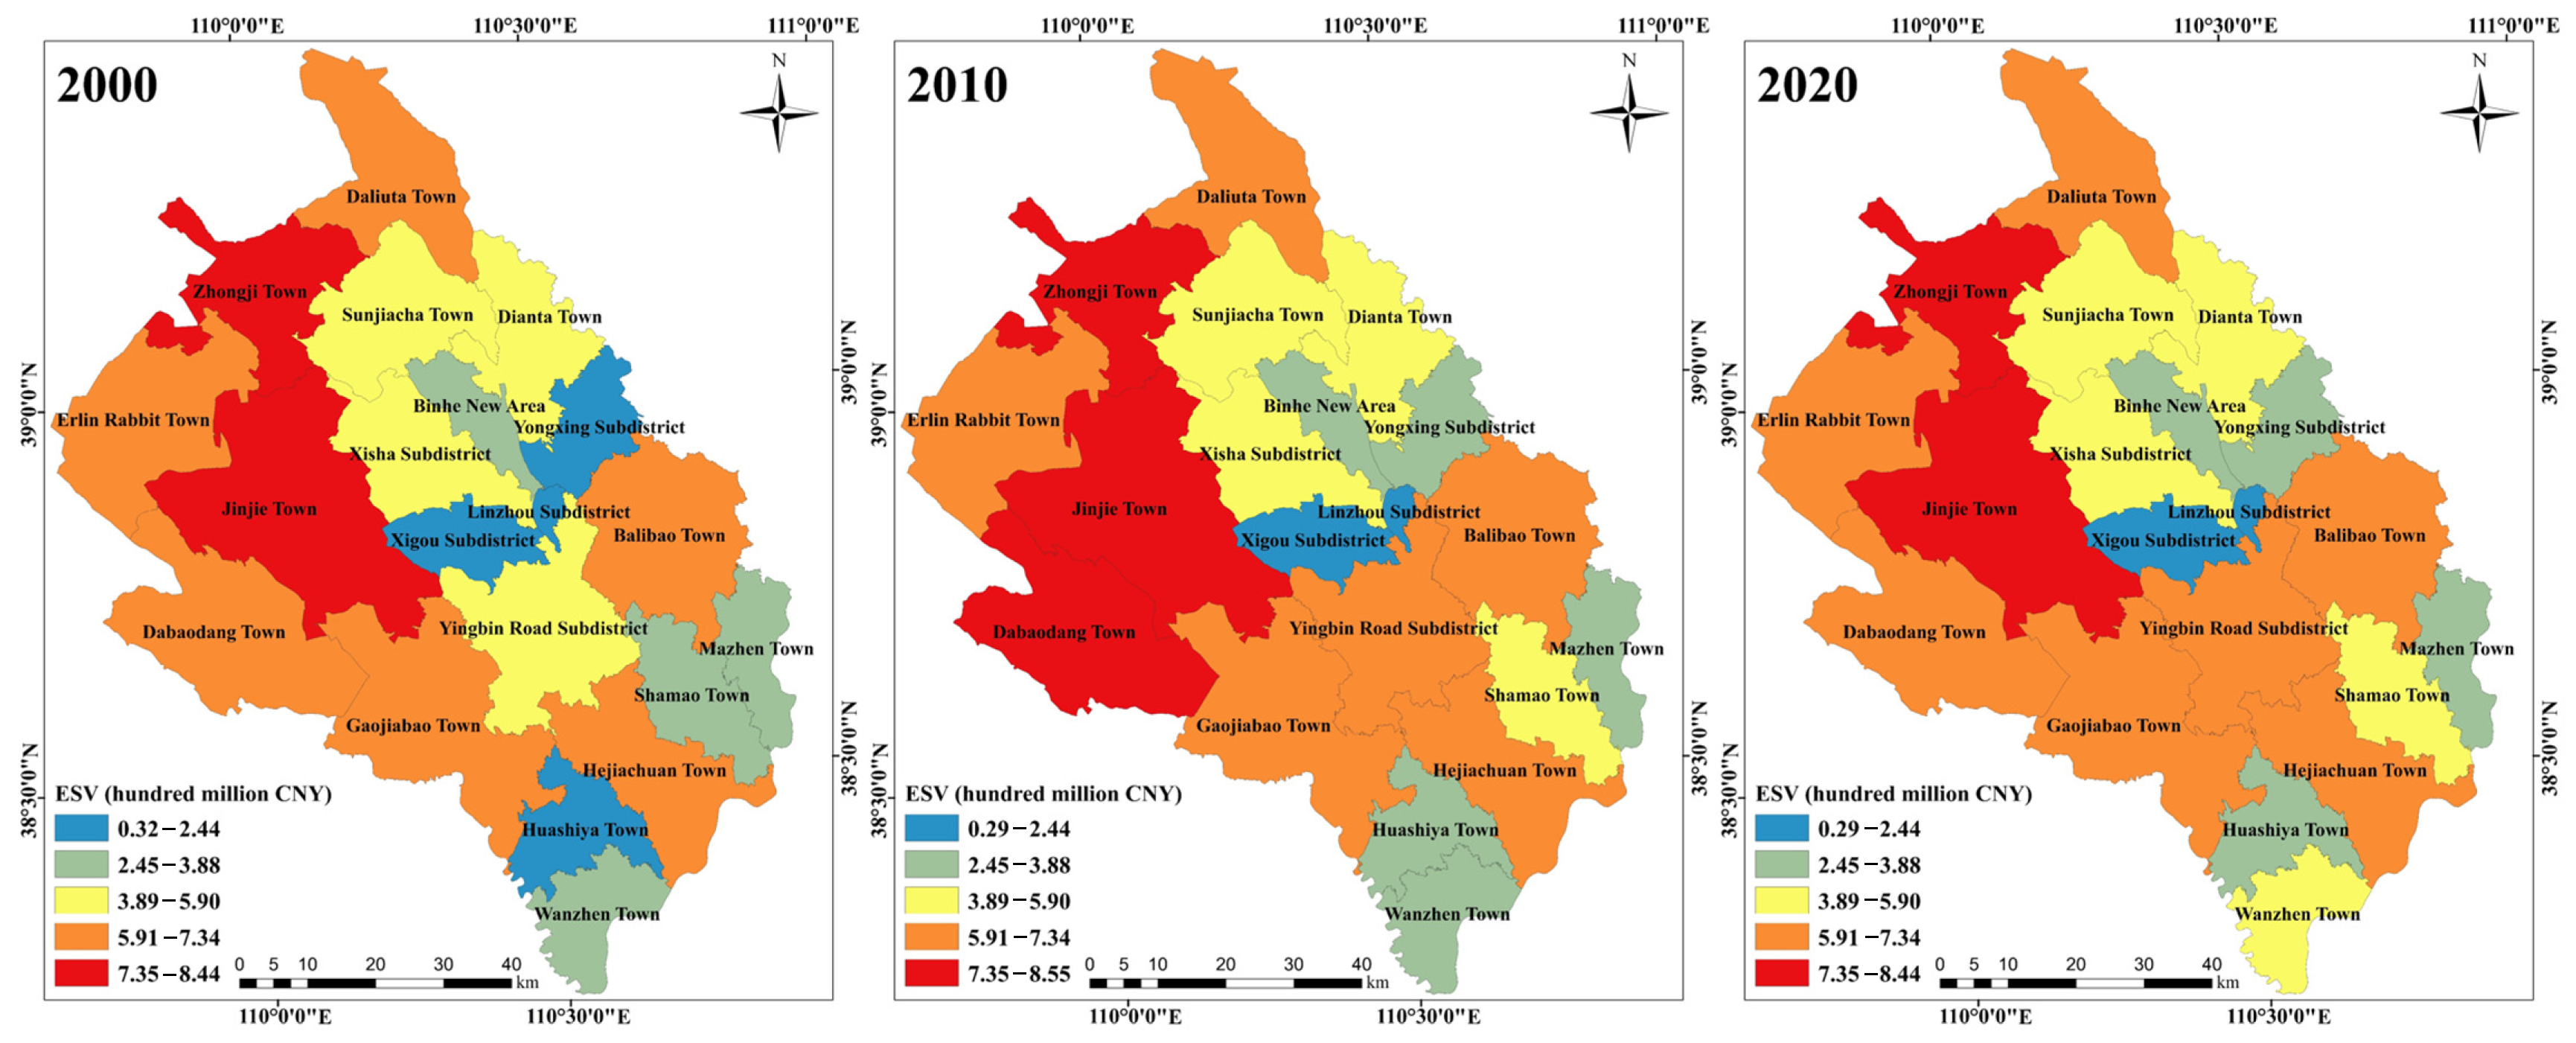
3.2.2. Ecosystem Service Value Spatial Change Characteristics

Through the analysis of the spatial changes in ESV during the study period (Figure 9), combined with the changes in land classes in Shenmu City, it can be inferred that the changes in ESV distribution across the study area coincide significantly with the changes in land classes, and the mutual transfer between land classes is the main factor causing the spatial changes in ESV.
The growth area of ESV corresponds to the migration area of two types of ecological land: woodland and grassland. From the above study, it is evident from the study that both woodland and grassland experienced a positive growth in land area during the research period. While grassland and water are the primary land types that contribute to ESV, the area of water demonstrated a declining trend throughout the study duration. Consequently, the growth and migration of woodland and grassland are the principal factors that contribute to the ESV growth area.
The reduction in ESV is directly linked to the expansion of construction land. The reduction in ESV throughout the research timeframe corresponded with the increase in construction land. Being the land type with the highest growth rate, the growth of urban development results in the depletion of ecological land, such as forest land and grassland, which is the primary cause for the decline of ESV in the geographic scope of the study.
Based on the administrative division of Shenmu City and the ESV values of each township in 2000, 2010, and 2020 (Figure 10), it is reasonable to assume that the ESV values in Shenmu City are generally distributed in a pattern of “elevated in the northwestern region and lower in the southeastern region”, and during the study period, the two townships with the highest ESV values (greater than RMB 735 million) were Jinjie Township and Zhongji Township, both located in the northwestern part of Shenmu City. These landforms provide important conditions for the protection of ecological land such as forest land and grassland. The four townships and streets with the lowest ESV values (less than RMB 244 million) were Linzhou Street, Yongxing Street, Xigou Street, and Huashiya Township, which are primarily situated in the eastern, southern, and central regions of Shenmu City. These areas share common characteristics of dense human activities and rapid urbanization resulting in large expansion of construction land, which leads to the decline of ESV values.

3.2.3. ESV Change of ESF Indicators

In this study, the ESV of each ESF indicator within the scope of the study was analyzed to determine the ESV changes for each ESF indicator in Shenmu City from 2000 to 2020 (Figure 11 and Figure 12). Throughout the duration of the study, the five ESF indicators—hydrological regulation, climate regulation, soil conservation, biodiversity, and gas regulation—held the highest weighting of ESV during the period under study, ranging between 8% and 29%. Conversely, the remaining six indicators presented a considerably lower weighting, fluctuating between 0.9% and 8%, which suggests that these five ESF indicators are the best representatives of ESV changes in Shenmu City.
By 2020, the ESV value of each ESF indicator as a proportion of the total ESV value was ranked as follows: hydrological regulation (28.38%) to climate regulation (20.20%) to soil conservation (11.39%) to biodiversity (9.29%) to gas regulation (8.94%) to environmental purification (7.63%) to aesthetic landscape (4.32%) to food production (3.46%) to raw material production (3.04%) to water supply (2.37%) to maintenance of nutrient cycles (0.97%).
By 2020, the ESVs of 10 out of the 11 ESF indicators had decreased compared to the study starting year. The exception was climate regulation, which had increased compared to the study starting year. The decreases were ranked in the following order: hydrological regulation (55 million yuan) to soil conservation (28 million yuan) to food production (27 million yuan) to gas regulation (17 million yuan) to raw material production (12 million yuan) to water supply (5 million yuan) to environmental purification (4 million yuan), maintenance of nutrient cycles (4 million yuan) to biodiversity (3 million yuan) to aesthetic landscape (2 million yuan).

3.3. Sensitivity Analysis

This paper illustrates the findings from ESV assessment by adjusting the ecological service value coefficient (VC) of each land use type in the study area upwards and downwards by 50% simultaneously, and calculating the ESV sensitivity index (CS) for various land cover categories within the study region during the years 2000, 2005, 2010, 2015, and 2020 according to the sensitivity equation of ESV (7) (Table 7), as an illustration of the reliability.
According to Table 7, it is apparent that the CS for each land use type in Shenmu City is less than 1 (0.01–0.64) in different years, and the values do not differ significantly from one year to another. Overall, grassland is among the land cover categories that exhibit reactivity indices of ESV to VC, watershed, cropland, forest land and unused land in descending order. Among these, grassland has the highest sensitivity index of 0.64433 in 2010, which indicates that a 1% increase in grassland VC will increase ESV by 0.64433%. This suggests that the ESV in the research area is not significantly affected by VC, which enhances the credibility of the study findings.

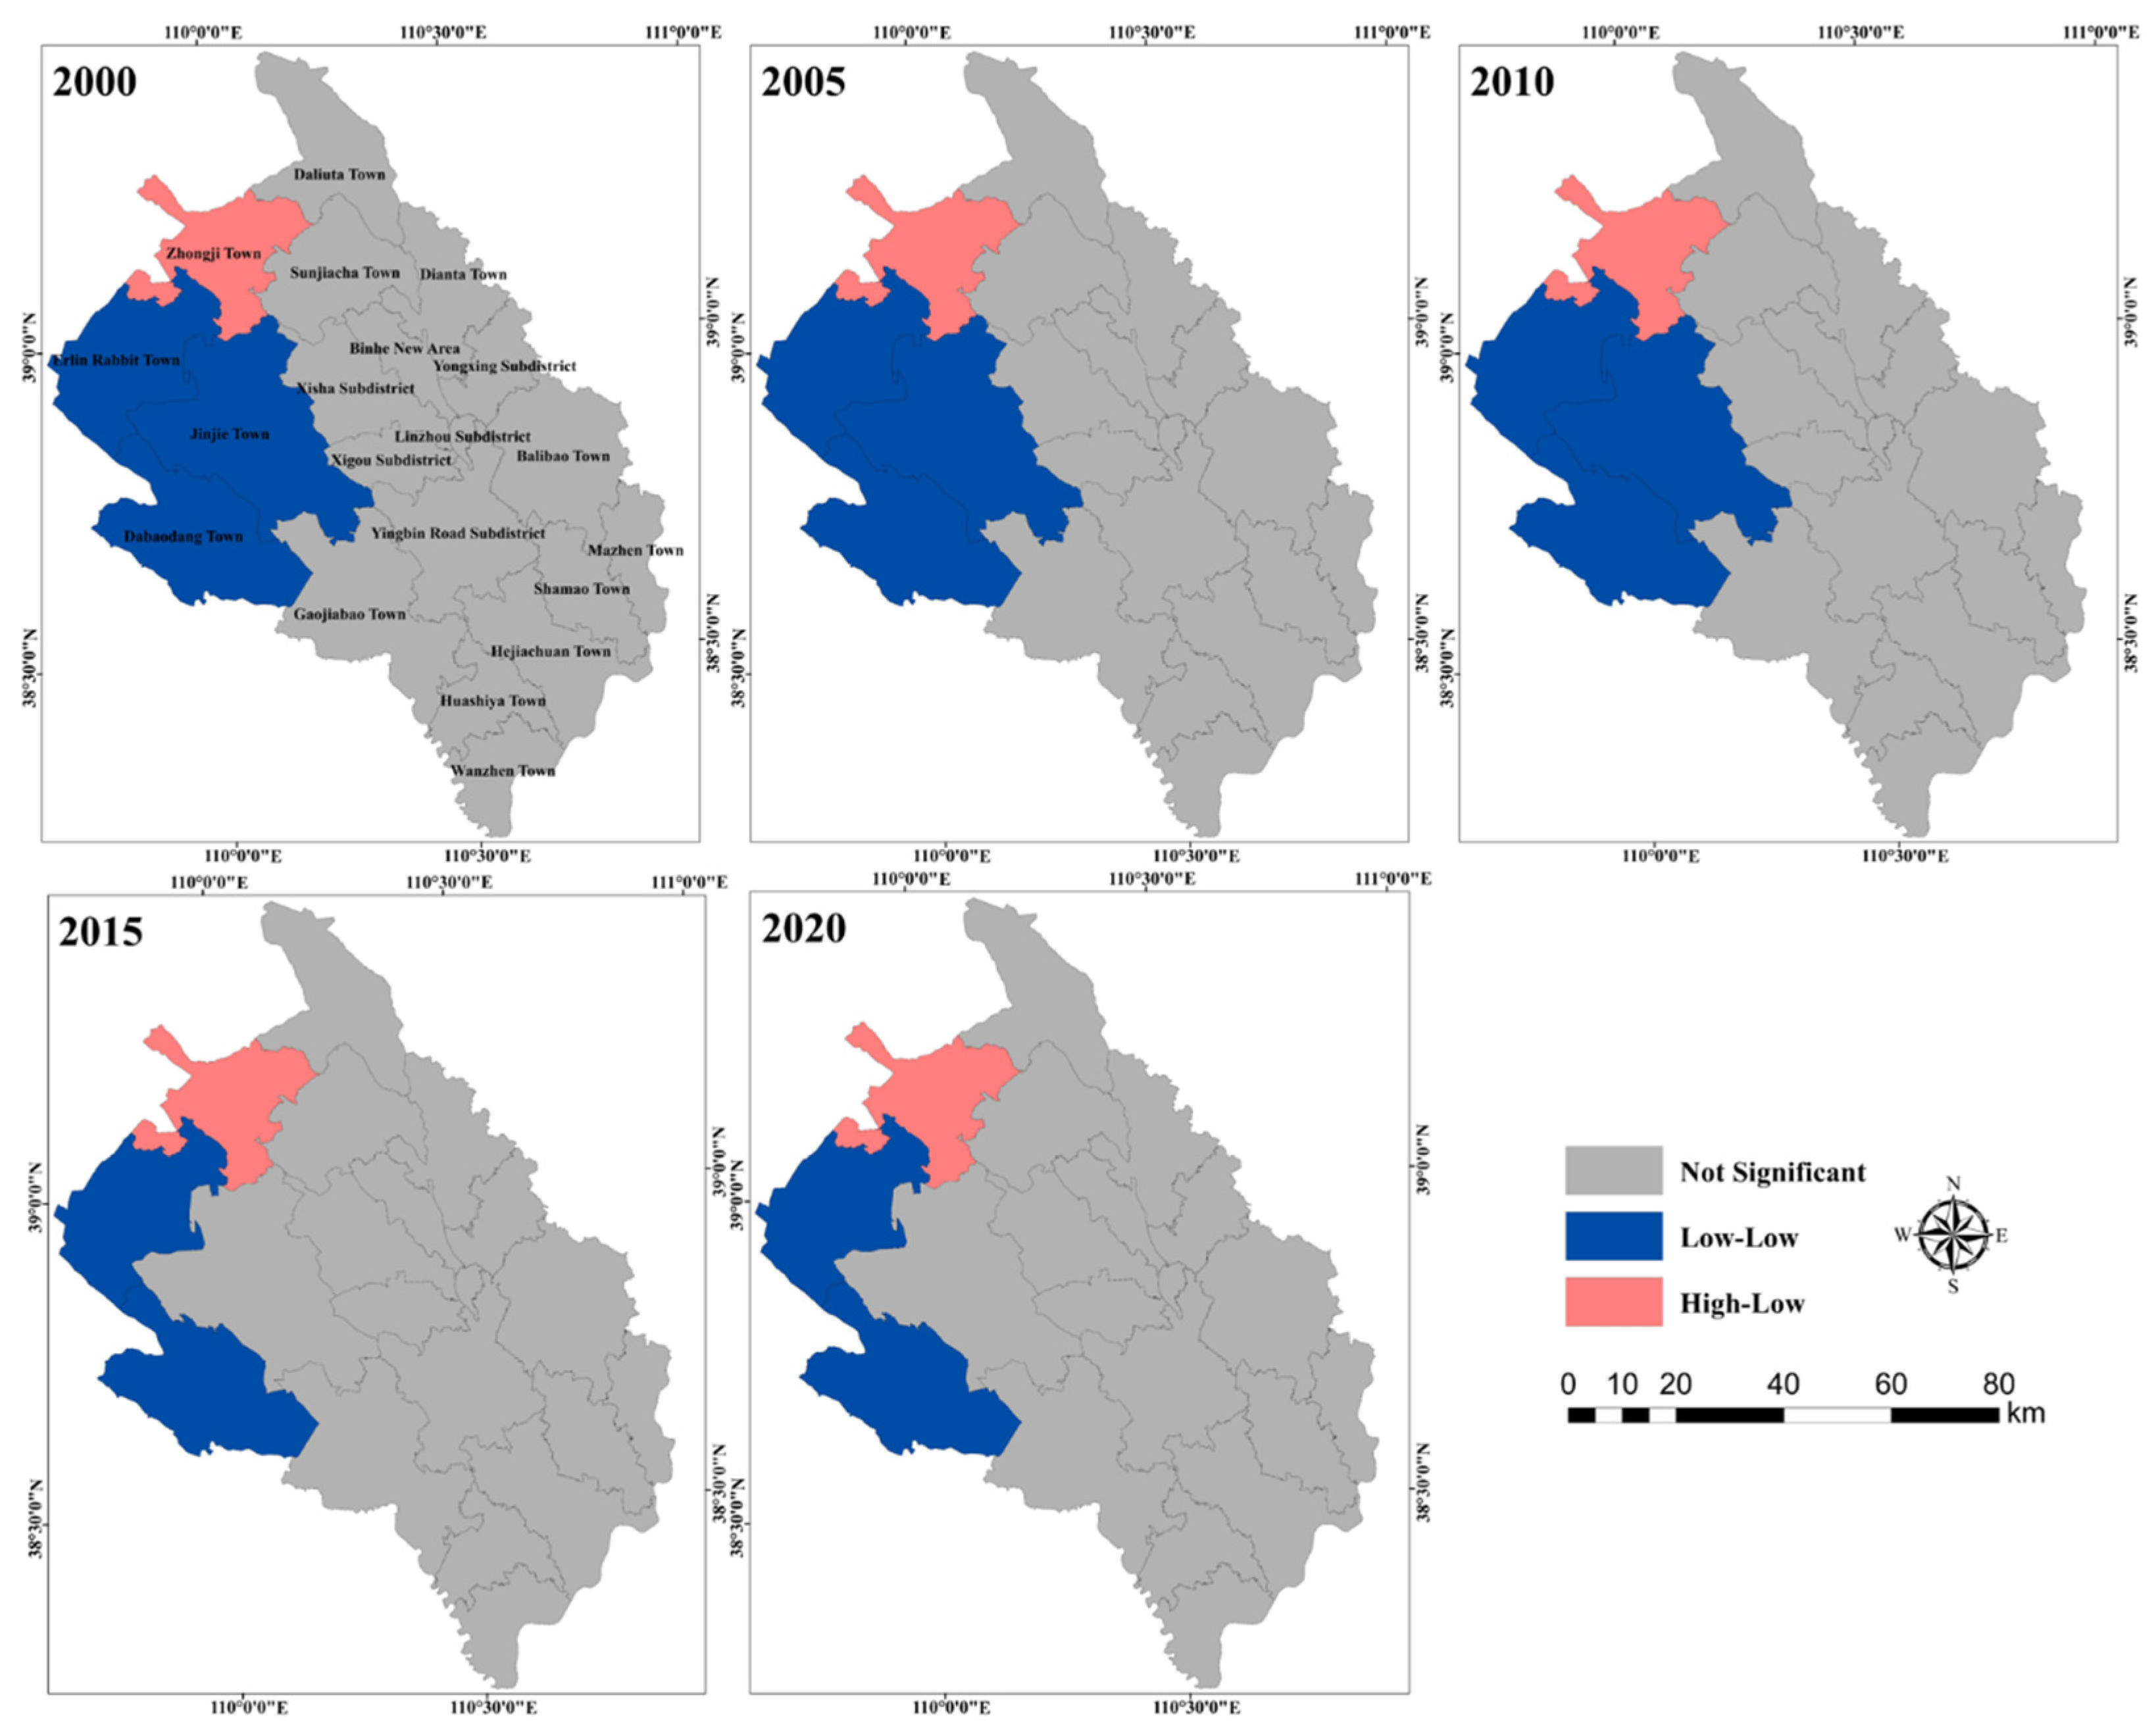
3.4. Spatial Autocorrelation between ESV and Land Use Intensity in Shenmu City

To delve deeper into the spatial correlation between ESV and land use intensity in Shenmu City, the results of the bivariate spatial autocorrelation test reveal that the Moran’s I index values for the average ESV and intensity of land utilization in Shenmu City in 2000, 2005, 2010, 2015, and 2020 were 0.113, 0.129, 0.114, 0.092, and 0.097 (p < 0.001), respectively. This indicates a positive spatial correlation between intensity of land utilization and ESV, meaning that as intensity of land utilization increases, ESV also rises. In light of the bivariate LISA spatial distribution map of ESV and land use intensity (Figure 13), during the study period, Zhongji Town belongs to the high-low type area (regions with high average ESV and low land use intensity), while Erlin Rabbit Town, Jinjie Town, and Dabaodang Town belong to the low-low type area (regions with low average ESV and low land use intensity).

3.5. Coupling Coordination Analysis of ESV and LUCC

The coupled coordination degree model was used to reveal the spatial distribution of the degree of coordinated development of LUCC and ESV in Shenmu City from 2000 to 2020 (Figure 14).
Examining the spatial variations, eight out of the 20 townships and streets in Shenmu City underwent shifts in their coordination levels between 2000 and 2020. Six townships, demonstrated an uptick in coordination level, separately Huashiya Town, Erlin Rabbit Town, Xisha Subdistrict, Yingbin Road Subdistrict, Yongxing Subdistrict, Shamao Town. Whereas the remaining two exhibited a decline, separately Linzhou Subdistrict, Xigou Subdistrict.
In terms of temporal changes, in 2000, 2005, 2010, 2015, and 2020, the combined CCD of LUCC and ESV in Shenmu City was 0.609, 0.616, 0.604, 0.621, and 0.638 respectively, when all coordination levels are in the primary coordination state, the minimum and maximum values were attained in 2010 and 2020, correspondingly the overall trend is one of fluctuation and increase (Figure 15). The main reasons for these changes include: from 2000 to 2010, rapid economic construction led to the transformation of vast expanses of high-yield ESV land into construction land, which disturbed the organization and operation of the ecosystem and led to a decrease in CCD. After 2010, the continued execution of the local government’s policy to convert farmland into forests and the increase in vegetation coverage had a positive impact on critical ecosystems, leading to a gradual rebound in CCD levels.

4. Discussion

4.1. Main Drivers of LUCC Changes

The interconnection between human activities and the ecological environment can cause changes in spatial patterns, which in turn leads to changes in the ecological environment [55,56,57,58]. Both socioeconomic and natural factors are objective factors influencing land use change, such as urbanization, population growth, culture, climate change, and land use policies [59,60,61,62]. These changes have significant impacts on both biodiversity and ecosystem services [63,64].
Our study yielded the same results, confirming that the configuration and allocation of land utilization in Shenmu City underwent significant changes between 2000 and 2020. Specifically, the amount of arable land, water bodies, and unused land decreased, while the quantity of forest land, grassland, and construction land increased. Notably, the growth in construction land outpaced that of other land types. The rise in forest land and grassland in Shenmu City can be attributed to both natural disasters that occurred in the area, as well as the Chinese government’s initiative to convert farmland into forest and grassland in response to environmental concerns.
Influenced by natural factors such as a loose surface material base, fragile soil structures, uneven spatial and temporal distribution of rainfall, dry and windy conditions, and strong erosion, the ecosystem vulnerability of Shenmu City is highly typical. In order to avoid natural disasters and secondary hazards, people have planted trees for windbreaks and sand fixation, reclaimed farmland, and planned routes, changing the original land use structure [65,66,67]. In 1999, the conversion of farmland into forests and grasslands was experimentally carried out in several counties located in the northern region of Shaanxi Province, and some progress was made [68]. Since 2002, the project has been implemented throughout northern Shaanxi Province, directly promoting the transformation of arable land into forest land and grassland in Shenmu City, significantly increasing vegetation coverage. This has contributed to the conservation of soil and water, ecological balance, and wind and sand control for the entire city, with the ecological environment noticeably improved.
The increase in construction land suggests that Shenmu City’s urbanization process has accelerated over these 20 years, and the intensity of land use has continually grown. With economic development and population growth, urban expansion has made construction land the primary land use change type in Shenmu City. Additionally, Shenmu is a crucial coal energy production base in Shaanxi Province and the largest coal-producing county (city) in China, with abundant coal resources. In recent years, the coal industry-led industrial economy has rapidly developed, with Shenmu City producing a total of 309 million tons of raw coal in 2021 and reaching an annual industrial output value of 330.265 billion yuan, a 63.2% year-on-year increase. While the coal industry has spurred rapid economic development, it has not only greatly increased the demand for construction land but also destroyed vast amounts of groundwater and land resources, leading to changes in land use.

4.2. Main Drivers of ESV Changes

Land use change and ESV change are closely related [69]. The close relationship between LUCC and ESV spatial and temporal changes in Shenmu City can also be seen. Moreover, there are also complex linkages and mutual constraints among the various resource elements of the ecosystem in Shenmu City.

4.2.1. Drivers of Temporal Changes in ESV

In terms of ESV changes by land category, between 2000 and 2020, except for forest land (growth rate 9.85%) and grassland (growth rate 0.06%) that showed an increase in ESV, the ESV of cropland (decline rate 12.29%), water bodies (decline rate 3.93%), and unused land (decline rate 4.39%) all decreased to varying degrees. This caused the total ESV value in Shenmu City to decline from 10.059 billion CNY in 2000 to 9.906 billion CNY in 2020. The rapid growth of construction land is the direct factor causing the decline in total ESV value and the change in ESV spatial distribution in Shenmu City. In recent years, as a national key energy and mineral base, Shenmu has witnessed massive development of regional coal resources, rapid growth in energy base construction, accelerated construction of small towns, increased intensity of human land use, and intensified issues such as drought, land desertification, and soil erosion, exacerbating the deterioration of the ecological environment. This has made the fragile ecological environment in the region more complex and contributed to the decline in ecosystem service functions.

4.2.2. Driving Factors of Spatial Change in ESV

Socio-economic and natural factors cause land use changes, which in turn lead to spatial changes in ESV. Earlier research has indicated that the expansion of urban areas onto ecological land, including farmland, woodland, and bodies of water, may lead to a decline in ESV [70]. Additionally, natural topography is one of the reasons for the differences in regional ESV spatial distribution [71], which is also confirmed in our study.
During the study period, the two townships with the highest ESV (greater than RMB 735 million) included Zhongji Township, which is located in the Hongyinnao Watershed Area. Being the biggest freshwater lake in the arid and semi-arid parts of China’s deserts, this region is vital for maintaining the local climate, water equilibrium, and biodiversity, which are responsible for the high ESV output in Zhongji Township. Furthermore, the decline of ESV in certain regions of Shenmu City during the research period was closely linked to the increase in the extent of construction land. This is mainly due to the national policy focus on western development in recent years, which has led to rapid economic and social growth in Shenmu City. Meanwhile, the study period showed that the four townships and streets with the lowest ESV (below RMB 244 million) are concentrated in the central, southern, and eastern regions of Shenmu City, where human activities are highly concentrated. The rapid expansion of construction land due to urbanization has contributed to the decline in ESV.
Shenmu City is a microcosm of the cities in the Loess Plateau-Maowusu Desert transition zone in China. Urbanization in this region has not only greatly contributed to land conversion and ESV loss but also introduced social and environmental stresses such as traffic congestion, social isolation, and rural poverty [71]. Our observations align with previous studies, indicating that LUCC is one of the primary drivers of ESV change and that the rate and intensity of LUCC are continuing to increase [29,72].

4.2.3. Drivers of ESV Changes in ESF Indicators

In terms of ESV changes in ESF indicators, firstly, alterations in the types of land use and structures within the research site have led to changes in ESV. For example, the reduction of hydrological regulation, soil conservation, the production of food and the production of raw materials indices may be linked to the decline of forest land, grassland, and cropland within the research site. On the other hand, the increase of climate regulation indices may be associated with the increase of non-ecological land, including construction sites and water areas, in the research area. Secondly, demographic, economic, and social factors have influenced the changes in ESV. For example, the decrease in indices such as water resource provision, environmental purification, and nutrient cycling maintenance may be related to water consumption, environmental pollution, and nutrient loss caused by population growth, industrialization, and urbanization within the scope of the study; the decline of aesthetic scenery or view index may be related to factors such as the degradation of natural scenery and human disturbances within the research region. In addition, climate change within the region under investigation may also have an impact on ESV changes. For example, the increase in climate regulation index may be related to climate changes such as rising temperatures and increased precipitation in the study area; the decline of biodiversity index may be related to climate disasters such as drought, frost, pests, and diseases in the study area.

4.3. Spatial and Temporal Evolution and Coupled Coordination Relationship between ESV and LUCC

Prior studies have affirmed that the degree of CCD between degree of land utilization and ESV is a reliable measure of the congruence between LUCC and ESV, as well as the interdependence between humans and land [73]. Regarding the interdependence between degree of land utilization and ESV coordination, studies have shown that the increase of vegetation cover, carrying out afforestation initiatives, and heightened ecological protection awareness can promote the increase of coupling coordination between the two, while unreasonable land use can hinder the development of ES and cause a decrease in coupling [2]. This research conclusion is also confirmed in this paper. Throughout the study period, there was a trend of “increase (2000–2005)—decrease (2005–2010)—increase (2010–2020)” in the level of coupling between intensity of land use and ESV in Shenmu City. Combining this trend with the ecological protection policies and economic development of Shenmu City Over the course of the research period, confirms the impact of the factors mentioned in the previous study on coupling coordination degree. Meanwhile, during the research period, the extent of coordination in coupling levels between intensity of land use and ESV in Shenmu City were predominantly in a state of primary coordination, although some townships and streets experienced extreme dissonance. This reflects the prominence of human-land relationship contradictions in certain areas of Shenmu City, indicating that land use planning and economic development strategies need to be adjusted in a timely manner. Overall, the extent of coordination in coupling between intensity of land use and ESV is complex, and modifications in one factor can have an impact on the other [74]. Hence, incorporating the wise utilization of land resources in future planning and management of land use will aid in preserving a favorable coupling between LUCC and ESV. Conversely, imprudent use may result in a decrease in land resources and a deterioration of the ecological environment [75]. Simultaneously, it is imperative to acknowledge that the synchronized progression of LUCC and ESV is a protracted and incremental undertaking. For regions in Shenmu City with deficient coupling coordination or steadily declining coordination levels, sustainable land use development tactics ought to be adopted to attain the ecological and environmental benefits coupled with land use efficiency. This can be achieved by implementing novel urbanization strategies and instituting ecological compensation systems.

4.4. Limitations of the Study and Future Directions

Although the ESV method of calculation is well backed by existing research, there are still some uncertainties and limitations in this study. As the region with the most extensive and concentrated human activities, built-up land plays a vital role in delivering ecosystem services [76]. Nevertheless, given the absence of pertinent data and reliable methodologies, and taking into account the findings of Xie Gao et al.’s research [16,17], which did not include construction land in ESV calculations, this paper does not account for the ESV generated by construction land that is significantly influenced by human activities. To conduct a more comprehensive evaluation of the regional ESV, it is crucial to compute the ESV generated by construction land in forthcoming studies. Moreover, our investigation only delved into the spatial correlation and coupling attributes between land use intensity and ESV, and did not scrutinize the spatial interplay between ESV and other socioeconomic or environmental factors.In subsequent studies, spatial regression models can be utilized to delve deeper into the correlation between ESV and other influencing factors.

5. Conclusions

Drawing upon the LUCC data and the refined ESV assessment model for Shenmu City, this research scrutinizes the spatiotemporal attributes of LUCC and ESV from 2000 to 2020. We used bivariate spatial autocorrelation to investigate the spatial relationship between ESV and land use intensity, while the CCD model was utilized to probe the coupled coordination relationship between ESV and land use intensity. The findings reveal that from 2000 to 2020, the acreage of arable land, water bodies, and unused land in Shenmu City dwindled, whereas the acreage of forest land, grassland, and construction land escalated. Notably, the alteration in the area of construction land outstripped that of other land categories.
The general ESV of Shenmu City manifests a wavering downward trajectory, dropping from 10.059 billion yuan in 2000 to 9.906 billion yuan in 2020. Grasslands and water bodies are the primary land types contributing to ESV. The spatial arrangement of ESV reveals a “northwest high and southeast low” pattern. Within the ecosystem services, hydrological regulation and climate regulation boast the highest ESV values, comprising more than 45% of the entire ESV. Sensitivity analysis reveals that all sensitivity indices are below 1, suggesting that the assessment results possess reasonable value factors and high credibility.
The analysis of spatial autocorrelation between two variables indicates a positive correlation between the average value of ecosystem services and the intensity of land use in Shenmu City throughout the research period. Additionally, the CCD between ESV and land use intensity initially declines before rising, with the smallest and largest points occurring in 2010 and 2020, respectively. All levels are within the primary coordination stage. The overall CCD for towns and streets follows a similar trend, with eight towns and streets experiencing changes in coordination levels during the study period. As a result, Shenmu City’s future land use planning should prioritize the harmonious development of socio-economic factors and ecological environmental protection.

Author Contributions

Conceptualization, Y.X., Q.Z. and P.L.; Methodology, Y.X. and Q.Z.; Validation, Y.X.; Formal analysis, Y.X. and Q.Z.; Writing—Original draft preparation, Y.X.; Writing—Review and editing, Q.Z. and Y.X.; Visualization, Q.Z.; Project administration, Q.Z. and H.B.; Funding acquisition, Q.Z., H.B. and J.L. All authors have read and agreed to the published version of the manuscript.

Funding

This work was supported by the National Key R&D Programs (2022YFC3802803), the Programs of the Shaanxi Province Planned Project of Basic Research in Natural Science (2022JQ-574), the Shaanxi Province Philosophy and Social Science Research Project (2022ND0244), and the Supported by the Fundamental Research Funds for the Central Universities (300102410104).

Acknowledgments

The authors would like to thank the anonymous reviewers and the editors for their constructive comments of this manuscript.

Conflicts of Interest

The authors declare no conflict of interest.

References

  1. Costanza, R.; d’Arge, R.; de Groot, R.; Farber, S.; Grasso, M.; Hannon, B.; Limburg, K.; Naeem, S.; O’Neill, R.V.; Paruelo, J.; et al. The value of the world’s ecosystem services and natural capital. Nature 1997, 387, 253–260. [Google Scholar] [CrossRef]
  2. He, N.; Zhou, Y.; Wang, L.; Li, Q.; Zuo, Q.; Liu, J. Spatiotemporal differentiation and the coupling analysis of ecosystem service value with land use change in Hubei Province, China. Ecol. Indic. 2022, 145, 109693. [Google Scholar] [CrossRef]
  3. Swartz, C.E. Ecosystems and human well-being: Synthesis. Phys. Teach. 1996, 34, 534. [Google Scholar] [CrossRef]
  4. de Groot, R.; Brander, L.; van der Ploeg, S.; Costanza, R.; Bernard, F.; Braat, L.; Christie, M.; Crossman, N.; Ghermandi, A.; Hein, L.; et al. Global estimates of the value of ecosystems and their services in monetary units. Ecosyst. Serv. 2012, 1, 50–61. [Google Scholar] [CrossRef]
  5. Crossman, N.D.; Burkhard, B.; Nedkov, S.; Willemen, L.; Petz, K.; Palomo, I.; Drakou, E.G.; Martin-Lopez, B.; McPhearson, T.; Boyanova, K.; et al. A blueprint for mapping and modelling ecosystem services. Ecosyst. Serv. 2013, 4, 4–14. [Google Scholar] [CrossRef]
  6. Wang, X.F.; Luo, P.P.; Zheng, Y.; Duan, W.L.; Wang, S.T.; Zhu, W.; Zhang, Y.Z.; Nover, D. Drought Disasters in China from 1991 to 2018: Analysis of Spatiotemporal Trends and Characteristics. Remote Sens. 2023, 15, 1708. [Google Scholar] [CrossRef]
  7. Fu, B.; Zhang, L. Land-use change and ecosystem services: Concepts, methods and progress. Prog. Geogr. 2014, 33, 441–446. [Google Scholar]
  8. Yang, H.; Zheng, L.; Wang, Y.; Li, J.F.; Zhang, B.W.; Bi, Y.Z. Quantifying the Relationship between Land Use Intensity and Ecosystem Services’ Value in the Hanjiang River Basin: A Case Study of the Hubei Section. Int. J. Environ. Res. Public Health 2022, 19, 10950. [Google Scholar] [CrossRef] [PubMed]
  9. Sun, Y.X.; Liu, S.L.; Dong, Y.H.; An, Y.; Shi, F.N.; Dong, S.K.; Liu, G.H. Spatio-temporal evolution scenarios and the coupling analysis of ecosystem services with land use change in China. Sci. Total Environ. 2019, 681, 211–225. [Google Scholar] [CrossRef] [PubMed]
  10. Costanza, R.; de Groot, R.; Sutton, P.; van der Ploeg, S.; Anderson, S.J.; Kubiszewski, I.; Farber, S.; Turner, R.K. Changes in the global value of ecosystem services. Glob. Environ. Chang. 2014, 26, 152–158. [Google Scholar] [CrossRef]
  11. Bargali, K.; Bargali, S. Germination capacity of seeds of leguminous plants under water deficit conditions: Implication for restoration of degraded lands in Kumaun Himalaya. Trop. Ecol. 2016, 57, 445–453. [Google Scholar]
  12. Davidar, P.; Sahoo, S.; Mammen, P.C.; Acharya, P.; Puyravaud, J.P.; Arjunan, M.; Garrigues, J.P.; Roessingh, K. Assessing the extent and causes of forest degradation in India: Where do we stand? Biol. Conserv. 2010, 143, 2937–2944. [Google Scholar] [CrossRef]
  13. Manral, V.; Bargali, K.; Bargali, S.S.; Shahi, C. Changes in soil biochemical properties following replacement of Banj oak forest with Chir pine in Central Himalaya, India. Ecol. Process. 2020, 9, 30. [Google Scholar] [CrossRef]
  14. Lei, H.; Koch, J.; Shi, H. An Analysis of Spatio-Temporal Urbanization Patterns in Northwest China. Land 2020, 9, 411. [Google Scholar] [CrossRef]
  15. Champ, P.A.; Boyle, K.J.; Brown, T.C.; Peterson, L.G. A Primer on Nonmarket Valuation; Springer: Berlin/Heidelberg, Germany, 2003; Volume 3. [Google Scholar]
  16. Xie, G.; Liu, C.-X.; Leng, Y.; Zheng, D.; Li, S.-C. Ecological assets valuation of the Tibetan Plateau. J. Nat. Resour. 2003, 18, 189–196. [Google Scholar] [CrossRef]
  17. Xie, G.; Lu, C.; Xiao, Y.; Chen, C. Expert Knowledge Based Valuation Method of Ecosystem Services in China. J. Nat. Resour. 2008, 23, 911–919. [Google Scholar] [CrossRef]
  18. Bai, Y.; Ouyang, Z.; Zheng, H.; Xu, W.; Jiang, B.; Fang, Y. Evaluation of the forest ecosystem services in Haihe River Basin, China. Acta Ecol. Sin. 2011, 31, 2029–2039. [Google Scholar]
  19. Jinchang, L.I.; Wenli, W.; Guangyin, H.U.; Zhenhai, W.E.I. Impacts of land use and cover changes on ecosystem service value in Zoige Plateau. Acta Ecol. Sin. 2011, 31, 3451–3459. [Google Scholar]
  20. Tu, X.; Long, H. Spatial patterns and dynamic evolution of ecosystem service values in Poyang Lake Region from 2000 to 2010. Resour. Sci. 2015, 37, 2451–2460. [Google Scholar]
  21. Li, T.; Gan, D.; Yang, Z.; Wang, K.; Qi, Z.; Li, H.; Chen, X. Spatial-temporal evolvement of ecosystem service value of Dongting Lake area influenced by changes of land use. Chin. J. Appl. Ecol. 2016, 27, 3787–3796. [Google Scholar]
  22. Yao, X.; Zeng, J.; Li, W. Spatial correlation characteristics of urbanization and land ecosystem service value in Wuhan Urban Agglomeration. Trans. Chin. Soc. Agric. Eng. 2015, 31, 249–256. [Google Scholar]
  23. Chen, J.; Luo, H.; Hu, L.; Li, Q.; Jiang, W. Correlation Between Social Economic Development and Ecosystem Service Value-A Case of Chongqing Metropolitan Area. Res. Soil Water Conserv. 2017, 24, 330–336. [Google Scholar]
  24. Yang, W.P.; Zhang, Z.Y.; Luo, P.P.; Wang, Y.J. Temporal and spatial evolution and influencing factors of urban ecological total factor productivity in the Yellow River basin under strong sustainable development. Sci. Prog. 2023, 106, 00368504231152742. [Google Scholar] [CrossRef]
  25. Han, X.; Yu, J.; Zhao, X.; Wang, J. Spatiotemporal evolution of ecosystem service values in an area dominated by vegetation restoration: Quantification and mechanisms. Ecol. Indic. 2021, 131, 108191. [Google Scholar] [CrossRef]
  26. Xing, L.; Xue, M.G.; Wang, X.Y. Spatial correction of ecosystem service value and the evaluation of eco-efficiency: A case for China’s provincial level. Ecol. Indic. 2018, 95, 841–850. [Google Scholar] [CrossRef]
  27. Xing, L.; Hu, M.S.; Wang, Y. Integrating ecosystem services value and uncertainty into regional ecological risk assessment: A case study of Hubei Province, Central China. Sci. Total Environ. 2020, 740, 140126. [Google Scholar] [CrossRef] [PubMed]
  28. Lindenmayer, D.B.; Franklin, J.F. Managing Stand Structure as Part of Ecologically Sustainable Forest Management in Australian Mountain Ash Forests: Manejo de la Estructura como Parte del Manejo Ecológicamente Sustentable de los Bosques de Fresno de Montaña en Australia. Conserv. Biol. 1997, 11, 1053–1068. [Google Scholar] [CrossRef]
  29. Foley, J.A.; DeFries, R.; Asner, G.P.; Barford, C.; Bonan, G.; Carpenter, S.R.; Chapin, F.S.; Coe, M.T.; Daily, G.C.; Gibbs, H.K. Global consequences of land use. Science 2005, 309, 570–574. [Google Scholar] [CrossRef] [Green Version]
  30. Crespin, S.J.; Simonetti, J.A. Loss of ecosystem services and the decapitalization of nature in El Salvador. Ecosyst. Serv. 2016, 17, 5–13. [Google Scholar] [CrossRef]
  31. Kavhu, B.; Mashimbye, Z.E.; Luvuno, L. Climate-Based Regionalization and Inclusion of Spectral Indices for Enhancing Transboundary Land-Use/Cover Classification Using Deep Learning and Machine Learning. Remote Sens. 2021, 13, 5054. [Google Scholar] [CrossRef]
  32. Kavhu, B.; Mashimbye, Z.E.; Luvuno, L. Characterising social-ecological drivers of landuse/cover change in a complex transboundary basin using singular or ensemble machine learning. Remote Sens. Appl.-Soc. Environ. 2022, 27, 100773. [Google Scholar] [CrossRef]
  33. Li, F.; Zhang, S.W.; Yang, J.C.; Bu, K.; Wang, Q.; Tang, J.M.; Chang, L.P. The effects of population density changes on ecosystem services value: A case study in Western Jilin, China. Ecol. Indic. 2016, 61, 328–337. [Google Scholar] [CrossRef]
  34. Aziz, T. Changes in land use and ecosystem services values in Pakistan, 1950–2050. Environ. Dev. 2021, 37, 100576. [Google Scholar] [CrossRef]
  35. Wang, S.T.; Luo, P.P.; Xu, C.Y.; Zhu, W.; Cao, Z.; Ly, S. Reconstruction of Historical Land Use and Urban Flood Simulation in Xi’an, Shannxi, China. Remote Sens. 2022, 14, 6067. [Google Scholar] [CrossRef]
  36. Li, Q.; Li, W.J.; Wang, S.; Wang, J.F. Assessing heterogeneity of trade-offs/synergies and values among ecosystem services in Beijing-Tianjin-Hebei urban agglomeration. Ecol. Indic. 2022, 140, 109026. [Google Scholar] [CrossRef]
  37. Li, J.W.; Dong, S.C.; Li, Y.; Wang, Y.S.; Li, Z.H.; Li, F.J. Effects of land use change on ecosystem services in the China-Mongolia-Russia economic corridor. J. Clean. Prod. 2022, 360, 132175. [Google Scholar] [CrossRef]
  38. Li, B.W.; Yang, Z.F.; Cai, Y.P.; Xie, Y.L.; Guo, H.J.; Wang, Y.Y.; Zhang, P.; Li, B.; Jia, Q.P.; Huang, Y.P.; et al. Prediction and valuation of ecosystem service based on land use/land cover change: A case study of the Pearl River Delta. Ecol. Eng. 2022, 179, 106612. [Google Scholar] [CrossRef]
  39. Xie, L.; Wang, H.W.; Liu, S.H. The ecosystem service values simulation and driving force analysis based on land use/land cover: A case study in inland rivers in arid areas of the Aksu River Basin, China. Ecol. Indic. 2022, 138, 108828. [Google Scholar] [CrossRef]
  40. Zhang, F.; Yushanjiang, A.; Jing, Y.Q. Assessing and predicting changes of the ecosystem service values based on land use/cover change in Ebinur Lake Wetland National Nature Reserve, Xinjiang, China. Sci. Total Environ. 2019, 656, 1133–1144. [Google Scholar] [CrossRef]
  41. Liu, Y.B.; Hou, X.Y.; Li, X.W.; Song, B.Y.; Wang, C. Assessing and predicting changes in ecosystem service values based on land use/cover change in the Bohai Rim coastal zone. Ecol. Indic. 2020, 56, 106004, Corrigendum in Ecol. Indic. 2020, 117, 106657. [Google Scholar] [CrossRef]
  42. Liu, X.; Sun, T.; Feng, Q. Dynamic spatial spillover effect of urbanization on environmental pollution in China considering the inertia characteristics of environmental pollution. Sustain. Cities Soc. 2020, 53, 101903. [Google Scholar] [CrossRef]
  43. Qian, Y.; Dong, Z.; Yan, Y.; Tang, L. Ecological risk assessment models for simulating impacts of land use and landscape pattern on ecosystem services. Sci. Total Environ. 2022, 833, 155218. [Google Scholar] [CrossRef] [PubMed]
  44. Huang, C.; Zhao, D.; Deng, L. Landscape pattern simulation for ecosystem service value regulation of Three Gorges Reservoir Area, China. Environ. Impact Assess. Rev. 2022, 95, 106798. [Google Scholar] [CrossRef]
  45. Zhu, H.; Li, X. Discussion on the Index Method of Regional Land Use Change. Acta Geogr. Sin. 2003, 58, 643–650. [Google Scholar]
  46. Han, Z.; Song, W.; Deng, X.Z. Responses of Ecosystem Service to Land Use Change in Qinghai Province. Energies 2016, 9, 303. [Google Scholar] [CrossRef] [Green Version]
  47. Wu, J. Thirty years of Landscape Ecology (1987–2017): Retrospects and prospects. Landsc. Ecol. 2017, 32, 2225–2239. [Google Scholar] [CrossRef] [Green Version]
  48. Wang, X.; Bao, Y. Study on the methods of land use dynamic change research. Prog. Geogr. 1999, 18, 81–87. [Google Scholar]
  49. Tian, Y.; Xu, D.; Song, J.; Guo, J.; You, X.; Jiang, Y. Impacts of land use changes on ecosystem services at different elevations in an ecological function area, northern China. Ecol. Indic. 2022, 140, 109003. [Google Scholar] [CrossRef]
  50. Wang, J.; Liu, W.; Luo, G.; Li, Z.J.; Zhao, C.; Zhang, H.R.; Zhu, M.Z.; Xu, Q.; Wang, X.Q.; Zhao, C.M.; et al. Synergistic effect of well-defined dual sites boosting the oxygen reduction reaction. Energy Environ. Sci. 2018, 11, 3375–3379. [Google Scholar] [CrossRef]
  51. Anselin, L. Local indicators of spatial association—LISA. Geogr. Anal. 1995, 27, 93–115. [Google Scholar] [CrossRef]
  52. Xiao, R.; Lin, M.; Fei, X.F.; Li, Y.S.; Zhang, Z.H.; Meng, Q.X. Exploring the interactive coercing relationship between urbanization and ecosystem service value in the Shanghai-Hangzhou Bay Metropolitan Region. J. Clean. Prod. 2020, 253, 119803. [Google Scholar] [CrossRef]
  53. Anselin, L. A test for spatial autocorrelation in seemingly unrelated regressions. Econ. Lett. 1988, 28, 335–341. [Google Scholar] [CrossRef]
  54. Gao, X.; Shen, J.Q.; He, W.J.; Zhao, X.; Li, Z.C.; Hu, W.F.; Wang, J.Z.; Ren, Y.J.; Zhang, X. Spatial-temporal analysis of ecosystem services value and research on ecological compensation in Taihu Lake Basin of Jiangsu Province in China from 2005 to 2018. J. Clean. Prod. 2021, 317, 128241. [Google Scholar] [CrossRef]
  55. Qin, J.X.; Duan, W.L.; Chen, Y.N.; Dukhovny, V.A.; Sorokin, D.; Li, Y.P.; Wang, X.X. Comprehensive evaluation and sustainable development of water-energy-food-ecology systems in Central Asia. Renew. Sustain. Energy Rev. 2022, 157, 112061. [Google Scholar] [CrossRef]
  56. Hu, Y.A.; Duan, W.L.; Chen, Y.N.; Zou, S.; Kayumba, P.M.; Qin, J.X. Exploring the changes and driving forces of water footprint in Central Asia: A global trade assessment. J. Clean. Prod. 2022, 375, 134062. [Google Scholar] [CrossRef]
  57. Luo, P.P.; Zheng, Y.; Wang, Y.Y.; Zhang, S.P.; Yu, W.Q.; Zhu, X.; Huo, A.D.; Wang, Z.H.; He, B.; Nover, D. Comparative Assessment of Sponge City Constructing in Public Awareness, Xi’an, China. Sustainability 2022, 14, 11653. [Google Scholar] [CrossRef]
  58. Qiao, Q.; Zhen, Z.L.; Liu, L.M.; Luo, P.P. The Construction of Ecological Security Pattern under Rapid Urbanization in the Loess Plateau: A Case Study of Taiyuan City. Remote Sens. 2023, 15, 1523. [Google Scholar] [CrossRef]
  59. Shiferaw, H.; Bewket, W.; Alamirew, T.; Zeleke, G.; Teketay, D.; Bekele, K.; Schaffner, U.; Eckert, S. Implications of land use/land cover dynamics and Prosopis invasion on ecosystem service values in Afar Region, Ethiopia. Sci. Total Environ. 2019, 675, 354–366. [Google Scholar] [CrossRef] [PubMed]
  60. Qiu, L.; Pan, Y.; Zhu, J.; Amable, G.S.; Xu, B. Integrated analysis of urbanization-triggered land use change trajectory and implications for ecological land management: A case study in Fuyang, China. Sci. Total Environ. 2019, 660, 209–217. [Google Scholar] [CrossRef]
  61. Luo, P.; Luo, M.; Li, F.; Qi, X.; Huo, A.; Wang, Z.; He, B.; Takara, K.; Nover, D. Urban flood numerical simulation: Research, methods and future perspectives. Environ. Model. Softw. 2022, 2022, 105478. [Google Scholar] [CrossRef]
  62. Duan, W.L.; Zou, S.; Christidis, N.; Schaller, N.; Chen, Y.N.; Sahu, N.; Li, Z.; Fang, G.H.; Zhou, B.T. Changes in temporal inequality of precipitation extremes over China due to anthropogenic forcings. NPJ Clim. Atmos. Sci. 2022, 5, 33. [Google Scholar] [CrossRef]
  63. Cao, Z.; Zhu, W.; Luo, P.P.; Wang, S.T.; Tang, Z.M.; Zhang, Y.Z.; Guo, B. Spatially Non-Stationary Relationships between Changing Environment and Water Yield Services in Watersheds of China’s Climate Transition Zones. Remote Sens. 2022, 14, 5078. [Google Scholar] [CrossRef]
  64. Deng, H.J.; Pepin, N.C.; Chen, Y.N.; Guo, B.; Zhang, S.H.; Zhang, Y.Q.; Chen, X.W.; Gao, L.; Meibing, L.; Ying, C. Dynamics of Diurnal Precipitation Differences and Their Spatial Variations in China. J. Appl. Meteorol. Climatol. 2022, 61, 1015–1027. [Google Scholar] [CrossRef]
  65. Lin, L.G.; Wei, X.D.; Luo, P.P.; Wang, S.N.; Kong, D.H.; Yang, J. Ecological Security Patterns at Different Spatial Scales on the Loess Plateau. Remote Sens. 2023, 15, 1011. [Google Scholar] [CrossRef]
  66. Zha, X.B.; Luo, P.P.; Zhu, W.; Wang, S.T.; Lyu, J.Q.; Zhou, M.M.; Huo, A.D.; Wang, Z.H. A bibliometric analysis of the research on Sponge City: Current situation and future development direction. Ecohydrology 2021, 14, e2328. [Google Scholar] [CrossRef]
  67. Wang, Z.; Luo, P.P.; Zha, X.B.; Xu, C.Y.; Kang, S.X.; Zhou, M.M.; Nover, D.; Wang, Y.H. Overview assessment of risk evaluation and treatment technologies for heavy metal pollution of water and soil. J. Clean. Prod. 2022, 379, 134043. [Google Scholar] [CrossRef]
  68. Wang, T.F.; Gong, Z.W. Evaluation and analysis of water conservation function of ecosystem in Shaanxi Province in China based on “Grain for Green” Projects. Environ. Sci. Pollut. Res. 2022, 29, 83878–83896. [Google Scholar] [CrossRef] [PubMed]
  69. Shifaw, E.; Sha, J.; Li, X.; Bao, Z.; Zhou, Z. An insight into land-cover changes and their impacts on ecosystem services before and after the implementation of a comprehensive experimental zone plan in Pingtan island, China. Land Use Policy 2019, 82, 631–642. [Google Scholar] [CrossRef]
  70. Maimaiti, B.; Chen, S.S.; Kasimu, A.; Mamat, A.; Aierken, N.; Chen, Q.L. Coupling and Coordination Relationships between Urban Expansion and Ecosystem Service Value in Kashgar City. Remote Sens. 2022, 14, 2557. [Google Scholar] [CrossRef]
  71. Liu, Y.; Song, W.; Deng, X. Understanding the spatiotemporal variation of urban land expansion in oasis cities by integrating remote sensing and multi-dimensional DPSIR-based indicators. Ecol. Indic. 2019, 96, 23–37. [Google Scholar] [CrossRef]
  72. Lambin, E.F.; Meyfroidt, P. Global land use change, economic globalization, and the looming land scarcity. Proc. Natl. Acad. Sci. USA 2011, 108, 3465–3472. [Google Scholar] [CrossRef] [PubMed] [Green Version]
  73. Liu, N.N.; Liu, C.Z.; Xia, Y.F.; Da, B.W. Examining the coordination between urbanization and eco-environment using coupling and spatial analyses: A case study in China. Ecol. Indic. 2018, 93, 1163–1175. [Google Scholar] [CrossRef]
  74. Wang, Y.; Li, X.M.; Zhang, Q.; Li, J.F.; Zhou, X.W. Projections of future land use changes: Multiple scenarios -based impacts analysis on ecosystem services for Wuhan city, China. Ecol. Indic. 2018, 94, 430–445. [Google Scholar] [CrossRef]
  75. Bryan, B.A.; Ye, Y.; Connor, J.D. Land-use change impacts on ecosystem services value: Incorporating the scarcity effects of supply and demand dynamics. Ecosyst. Serv. 2018, 32, 144–157. [Google Scholar] [CrossRef]
  76. Zhu, X.; Zhang, J.; Cheng, M.; Xu, Q. A Study on Transfer of Ecosystem Service Values in Mining Cities by Meta-analysis. J. Nat. Resour. 2017, 32, 434–448. [Google Scholar]
Figure 1. Location of Shenmu City.
Remotesensing 15 03136 g001
Figure 2. The structure of the present study.
Remotesensing 15 03136 g002
Figure 3. Spatial pattern of land use in Shenmu City from 2000 to 2020.
Remotesensing 15 03136 g003
Figure 4. The area and proportion of each land class in Shenmu City from 2000 to 2020.
Remotesensing 15 03136 g004
Figure 5. The changes and rates of change in the area of each land class in Shenmu City from 2000 to 2020.
Remotesensing 15 03136 g005
Figure 6. Shenmu City Natural Landform Division.
Remotesensing 15 03136 g006
Figure 7. Land use transfer matrix Sankey map of Shenmu City for 2000–2020 (hm2). (a) 2020–2010, (b) 2010–2020, (c) 2000–2020.
Remotesensing 15 03136 g007
Figure 8. ESV changes of different land use types.
Remotesensing 15 03136 g008
Figure 9. The change in ESV in Shenmu city from 2000 to 2020.
Remotesensing 15 03136 g009
Figure 10. ESV distribution in administrative areas of Shenmu City.
Remotesensing 15 03136 g010
Figure 11. The change in ESV of different ESF indexes.
Remotesensing 15 03136 g011
Figure 12. Changes of ESV values of different ESF indexes.
Remotesensing 15 03136 g012
Figure 13. Local indicators of spatial association (LISA) cluster maps between average ESV and Land Use Intensity in Shenmu City from 2000 to 2020.
Remotesensing 15 03136 g013
Figure 14. Spatial distribution of coupling coordination between ESV and LUCC in Shenmu City.
Remotesensing 15 03136 g014
Figure 15. Temporal variation of CCD between multi-year ESV and land use intensity in Shenmu City.
Remotesensing 15 03136 g015
Table 1. Shenmu City natural landform classification table.
Primary ClassificationSecondary ClassificationMain LocationArea Share
Desert Beach areaDesert AreaBeach areaWestern, Northwestern51.3%
Loess Hilly areaYellow earth and beam areaShagai Huangtu Liang Mao DistrictCentral, East, South, North37.6%
Canyon hilly areaN/ANorthwest–Southeast line11.1%
Table 2. Equivalent coefficient table of ESV for Shenmu City.
Second CategoryArable LandWoodlandGrasslandWaterUnused Land
Food production0.850.250.230.660.01
Raw material production0.40.580.340.370.03
Water supply0.020.30.195.440.02
Gas regulation0.671.911.211.340.11
Climate regulation0.365.713.192.950.1
Environmental purification0.11.671.054.580.31
Hydrological regulation0.273.742.3463.240.21
Soil conservation1.032.321.471.620.13
Maintaining nutrient circulation0.120.180.110.130.01
Biodiversity0.132.121.345.210.12
Aesthetic landscape0.060.930.593.310.05
Table 3. Ecosystem services value (ESV) per unit area after correction in Shenmu City. [unit: CNY/(hm2·a)].
Second CategoryArable LandWoodlandGrasslandWaterUnused Land
Food production1072.73318.66294.47826.6312.62
Raw material production504.81731.98433.3460.6437.86
Water supply25.24378.61239.796865.4625.24
Gas regulation845.562407.331522.851684.82138.82
Climate regulation454.337203.064025.893716.69126.2
Environmental purification126.22110.751329.345773.8391.23
Hydrological regulation340.754713.72948.9579,804.71265.03
Soil conservation1299.892931.071855.192044.49164.06
Maintaining nutrient circulation151.44224.01143.03157.7512.62
Biodiversity164.062669.21686.926575.2151.44
Aesthetic landscape75.721170.54744.64177.3363.1
Table 4. Analysis of the dynamic degree of land use area change in Shenmu City from 2000 to 2020 (hm2).
YearProjectArable LandWoodlandGrasslandWaterConstruction LandUnused Land
2000–2005Change in area−12,877.42159.97403.7−398.21036.32675.7
Dynamic degree−1.2%1.8%0.4%−0.4%11.5%0.7%
2005–2010Change in area−9044.7917.67957.9−1259.75627.3−4198.2
Dynamic degree−0.9%0.7%0.4%−1.4%39.7%−1%
2010–2015Change in area−696.2−244.4−4924.4−276.75952.4189.3
Dynamic degree−0.1%−0.2%−0.2%−0.3%14.1%0.1%
2015–2020Change in area−3167.8−486.2−10,186.91221.214,978.4−2358.7
Dynamic degree−0.3%−0.4%−0.5%1.5%20.8%−0.6%
2000–2020Change in area−25,786.22346.8250.3−713.327,594.4−3691.9
Dynamic degree−0.6%0.5%0.01%−0.2%76.8%−0.2%
Table 5. Land use intensity from 2000 to 2020.
Township Land Use Intensity by YearChange in Land Use Intensity
2000 2005 2010 2015 2020 2000–20052005–20102010–20152015–20202000–2020
Binhe New Area230.87 229.69 232.51 241.49 244.81 −1.18 2.82 8.98 3.32 13.95
Xisha Subdistrict199.82 199.07 206.24 212.65 216.09 −0.76 7.17 6.41 3.44 16.27
Linzhou Subdistrict266.28 273.40 289.72 289.43 283.69 7.13 16.32 −0.29 −5.74 17.41
Yingbin Road Subdistrict234.11 231.33 231.19 231.39 231.87 −2.78 −0.13 0.20 0.47 −2.24
Yongxing Subdistrict234.02 226.10 222.85 223.26 226.15 −7.92 −3.25 0.41 2.89 −7.87
Xigou Subdistrict212.96 212.28 216.75 221.82 236.61 −0.67 4.47 5.07 14.79 23.65
Gaojiabao Town225.55 222.19 223.08 225.06 226.65 −3.37 0.90 1.98 1.59 1.10
Dianta Town233.40 228.62 228.77 228.76 231.11 −4.78 0.15 0.00 2.35 −2.29
Sunjiacha Town231.97 230.48 234.70 239.15 247.52 −1.48 4.22 4.45 8.37 15.55
Daliuta Town207.74 206.90 210.58 213.71 223.83 −0.84 3.68 3.12 10.12 16.09
Huashiya Town251.56 247.38 242.80 242.77 242.75 −4.18 −4.58 −0.03 −0.02 −8.81
Zhongji Town247.00 244.09 242.68 242.88 245.89 −2.90 −1.41 0.20 3.01 −1.11
Hejiachuan Town237.31 234.66 231.60 231.57 231.02 −2.64 −3.06 −0.04 −0.54 −6.28
Erlin Rabbit Town194.33 194.57 196.32 197.31 197.39 0.25 1.75 0.99 0.08 3.07
Wanzhen Town243.76 241.96 234.63 234.57 234.20 −1.80 −7.33 −0.06 −0.37 −9.56
Dabaodang Town186.78 187.55 189.72 189.19 211.17 0.78 2.17 −0.53 21.98 24.39
Mazhen Town226.08 224.32 224.86 224.78 224.24 −1.76 0.54 −0.08 −0.54 −1.83
Langanbao Town230.98 226.34 224.30 224.25 224.03 −4.64 −2.04 −0.05 −0.22 −6.95
Shamao Town231.56 230.32 230.17 230.14 229.87 −1.23 −0.16 −0.03 −0.27 −1.69
Jinjie Town173.55 174.60 177.49 179.48 180.24 1.05 2.89 1.99 0.77 6.69
Shenmu217.65 215.84 216.70 218.18 222.08 −1.80 0.86 1.47 3.90 4.43
Table 6. Multi-year land class ESV changes in Shenmu City.
YearProjectArable LandWoodlandGrasslandWaterConstruction LandUnused LandTotal
2000 ESV/108 CNY10.665.8962.5520.350.001.14100.59
Percentage/%10.60%5.85%62.18%20.23%0.00%1.14%100.00%
2005 ESV/108 CNY10.016.4263.6819.910.001.18101.19
Percentage/%9.89%6.35%62.93%19.67%0.00%1.17%100.00%
2010ESV/108 CNY9.556.6564.8918.490.001.12100.71
Percentage/%9.48%6.61%64.43%18.36%0.00%1.11%100.00%
2015ESV/108 CNY9.516.5964.1418.180.001.1299.55
Percentage/%9.56%6.62%64.43%18.27%0.00%1.13%100.00%
2020ESV/108 CNY9.356.4762.5919.550.001.0999.06
Percentage/%9.44%6.53%63.18%19.74%0.00%1.10%100.00%
2000–2005Value Change/108 CNY−0.650.531.13−0.440.000.040.60
Growth rate/%−6.10%8.99%1.80%−2.16%0.00%3.51%0.60%
2005–2010Value Change/108 CNY−0.460.231.21−1.420.00−0.06−0.49
Growth rate/%−4.60%3.58%1.90%−7.13%0.00%−5.08%−0.48%
2010–2015Value Change/108 CNY−0.04−0.06−0.75−0.310.000.00−1.15
Growth rate/%−0.42%−0.90%−1.16%−1.68%0.00%0%−1.15%
2015–2020Value Change/108 CNY−0.16−0.12−1.551.370.00−0.03−0.50
Growth rate/%−1.68%−1.82%−2.42%7.54%0.00%−2.68%−0.50%
2000–2020Value Change/108 CNY−1.310.580.04−0.80.00−0.05−1.53
Growth rate/%−12.29%9.85%0.06%−3.93%0.00%−4.39%−1.52%
Table 7. Table of sensitivity indices of ESV in Shenmu City from 2000 to 2020.
Land TypeValue FactorESV (Million CNY)CS
2000200520102015202020002005201020152020
Arable landVC + 50%15.9915.0114.3214.2714.030.110.100.090.100.09
VC − 50%5.335.004.774.764.68
Wood
land
VC + 50%8.839.649.989.899.710.060.060.070.070.07
VC − 50%2.943.213.333.303.24
Grass
land
VC + 50%93.8295.5197.3396.2193.880.620.630.640.640.63
VC − 50%31.2731.8432.4432.0731.29
WaterVC + 50%30.5329.8627.7427.2829.330.200.200.180.180.20
VC − 50%10.189.959.259.099.78
Unused landVC + 50%1.711.771.681.691.640.010.010.010.010.01
VC − 50%0.570.590.560.560.55
Disclaimer/Publisher’s Note: The statements, opinions and data contained in all publications are solely those of the individual author(s) and contributor(s) and not of MDPI and/or the editor(s). MDPI and/or the editor(s) disclaim responsibility for any injury to people or property resulting from any ideas, methods, instructions or products referred to in the content.

