Article

DInSAR Data Reveal an Intriguing Contemporaneous Onset of Deep Deflation below Vesuvio and the Ongoing Campi Flegrei Uplift

by
Antonella Amoruso
* and
Luca Crescentini
Department of Physics, University of Salerno, 84084 Fisciano, Italy
*
Author to whom correspondence should be addressed.
Remote Sens. 2023, 15(12), 3038; https://doi.org/10.3390/rs15123038
Submission received: 22 April 2023 / Revised: 8 June 2023 / Accepted: 8 June 2023 / Published: 10 June 2023

Abstract

:
Campi Flegrei and Vesuvio volcanoes are only about 25 km apart, located on opposite sides of the densely inhabited area of Naples (Italy). Since neighbouring volcanoes may influence each other’s activity, it is of great interest to identify signs of any mutual interaction between Campi Flegrei and Vesuvio, or at least note coincidences in their recent deformation dynamics. After a large uplift, Campi Flegrei was generally subsiding from 1985 to 2001, while it has been uplifting—probably driven by deep magma inflation—at an accelerating rate since then. Here, we analysed the ground displacement in the whole Vesuvian area and its surroundings around the early 2000s using 1993–2010 ERS/ENVISAT ascending- and descending-orbit line-of-sight displacements obtained through the Small BAseline Subset Differential Synthetic Aperture Radar Interferometry technique. Although ground deformation is slow—a few millimetres per year—Empirical Orthogonal Function analysis shows a sudden trend change around 2001. Pre-2001 velocity maps confirm previously published results: subsidence mainly occurred inside the caldera rim—probably because of the sliding and compaction of young incoherent materials—and in a few spots around 10 km from the summital crater; eastward displacement occurred in a lobe east of Vesuvio, and westward displacement occurred in a lobe west of Vesuvio, as in the case of the spreading of the volcanic edifice and/or extensional tectonics. We attribute the subsidence spots to the previous high local number of new buildings per year. Post-2002 velocity maps provide evidence of a very different scenario: general subsidence in the whole Vesuvian area, westward displacement in a lobe east of Vesuvio, and eastward displacement in a lobe west of Vesuvio. This last arrangement of the ground displacement field is made even clearer by subtracting the post-2002 velocity from the pre-2001 value. The results of our analyses are consistent with the deflation of a deep pressurised source. Additionally, Vesuvio’s deep seismicity decreased at the beginning of 2002. The coincidence between the transition from deflation to inflation at Campi Flegrei and the onset of deflation below Vesuvio may suggest the possible transfer of magma and/or magmatic fluids between the two plumbing systems.

Graphical Abstract

1. Introduction

More than one hundred years of observations of active volcanoes show that pre-eruptive stages are usually accompanied by seismicity, geochemical variations, and ground deformation—i.e., unrest. Unrest can also end without an eruption; the possibility of having eruptive or non-eruptive unrest may depend on the response to the passage of seismic waves and deformation induced by earthquakes and/or the activity of adjacent volcanoes, which may interact through stress variations caused by pressure and/or permeability changes and/or magmatic connections, e.g., because of dykes and/or a common magmatic system at depth and/or direct fluid transfer (e.g., [1]).
Short- and long-term interactions among neighbouring volcanoes have only recently been considered, with some examples reported in the literature. In this section, we summarise three well-known examples of short- and long-term volcanic interactions; then, we briefly describe Campi Flegrei and Vesuvio volcanoes; lastly, we report the main results of this work.
On a short timescale, temporally correlated activity occurred at Mauna Loa and Kilauea volcanoes (Hawaii) in 2002. This correlation has been ascribed to a shared pulse of magma or, alternatively, the arrival of a pulse of magma that entered Mauna Loa’s plumbing system. According to the latter ascription, the magma pulse could have slightly perturbed Kilauea’s already-overpressurised adjacent shallow magma system, increasing its pressure and triggering the effusive event [2]. However, Mauna Loa and Kilauea had anti-correlated activities over the past century, possibly due to competition for the magma supply [3].
Both correlated and anti-correlated volcanic activities were found in Japan at Aira—associated with Sakurajima—and Kirishima—about 20 km from Aira—between 2009 and 2013, around the 2011 Kirishima eruption [4]. Both volcanoes inflated before the lava extrusion phase; Aira deflated during the eruption and stopped deflating almost concomitantly with the Kirishima replenishment phase. Interaction between the two volcanoes has been ascribed to a hydraulic connection between their plumbing systems, fed by a common deep reservoir located in the mantle [4].
In the longer term, anti-correlated eruptive histories occurred at the nearby Bolsena and Latera calderas (Italy). Much of Bolsena’s subsidence broadly coincided with activity at Latera (west rim of Bolsena); moreover, the similar compositions of the erupted magmas suggest the existence of a common magmatic reservoir [5].
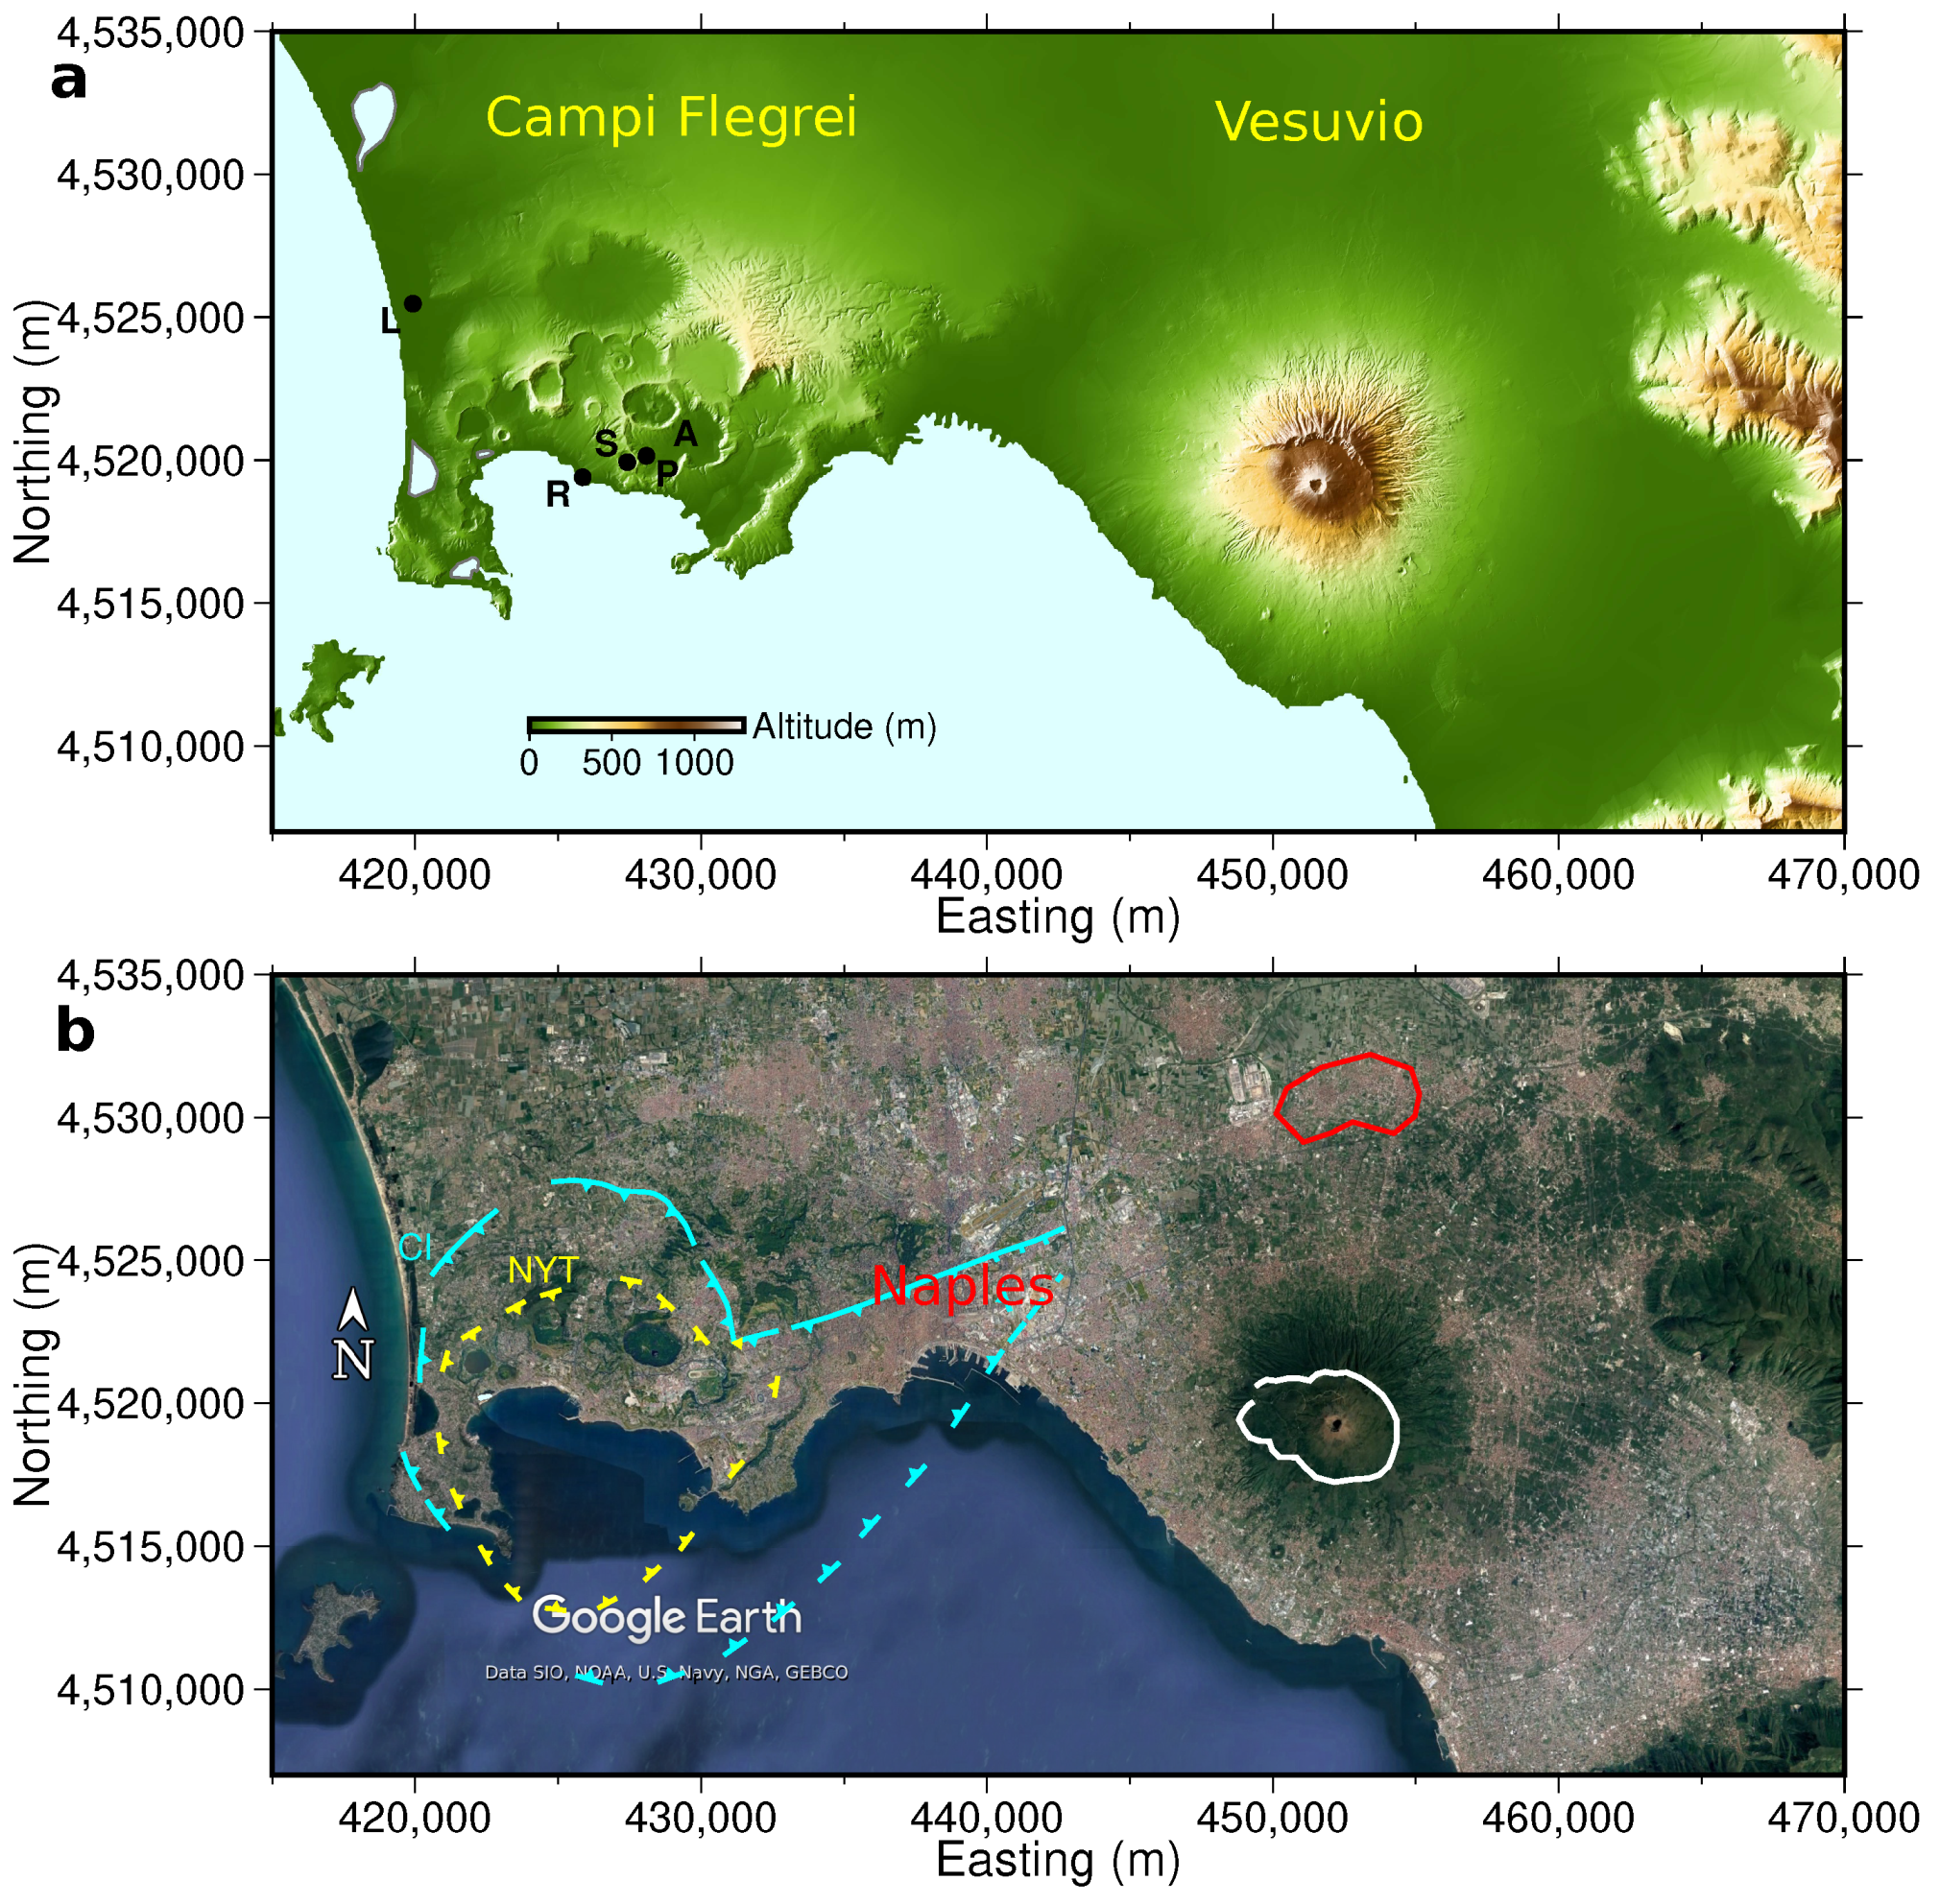
Despite this encouraging evidence, reported volcano interactions are still limited, and a general framework for understanding these processes is lacking. However, as these interactions may determine the eruption of at least one of the volcanoes, their definition and interpretation may affect eruption forecasting. The knowledge of volcano interactions may significantly benefit from additional observations, such as those reported in this work related to Campi Flegrei and Vesuvio, Italy. Campi Flegrei and Vesuvio are an iconic pair of active and high-risk volcanoes. They are located approximately 25 km apart inside a highly populated metropolitan area, which includes the city of Naples (Figure 1a,b). Thus, it is of great importance to identify signs of any possible interaction between these two volcanoes and recognise indications of changes in hazards associated with even one of them.
Campi Flegrei’s and Vesuvio’s volcanic histories are intriguing, complex, and much studied, and there is a large amount of literature on the anatomies of the two volcanic systems. To frame the analyses performed in this work and our results, it is essential to summarise, albeit partially, the main characteristics of the behaviours of Campi Flegrei and Vesuvio during recent decades and the related available data, paying special attention to deformation data. This is especially important as regards Vesuvio, since Campi Flegrei caldera has recently received much more attention because of its ongoing uplift (e.g., [6] and references therein).
In brief, Campi Flegrei, west of Naples, consists of a caldera formed before 15 ka (e.g., [7,8]). Several tens of eruptions (at least 60) and the resurgence of the caldera centre— i.e., long-term floor uplift—have occurred since then; the caldera-wide uplift has been largest near Rione Terra (R in Figure 1a). The last eruption occurred in 1538 AD, after about 3 ka of quiescence, with more than 1 ka of subsidence since Roman times, and after a period of increasing seismicity and uplift from about 1400 to 1536; the eruption was followed by deflation [9]. Ground deformation episodes that occurred during the last century have been measured by precise levelling surveys initiated in 1905 [10]. More recently, 3-D ground deformation has been obtained by continuous Global Positioning System (cGPS) observations provided by the Neapolitan Volcanoes Continuous GPS (NeVoCGPS) network; the oldest stations started operating in 2000 [11]. Since the 1990s, differential synthetic aperture radar interferometry (DInSar) data from ERS/Envisat and other missions’ imagery have also been available. Four main unrest episodes occurred between 1950 and 1952, between 1969 and 1972, between 1982 and 1984, and between 2005 and the present, with maximum uplifts of about 0.7 m, 1.7 m, 1.8 m, and more than 1 m at the time of writing, respectively (e.g., [10,
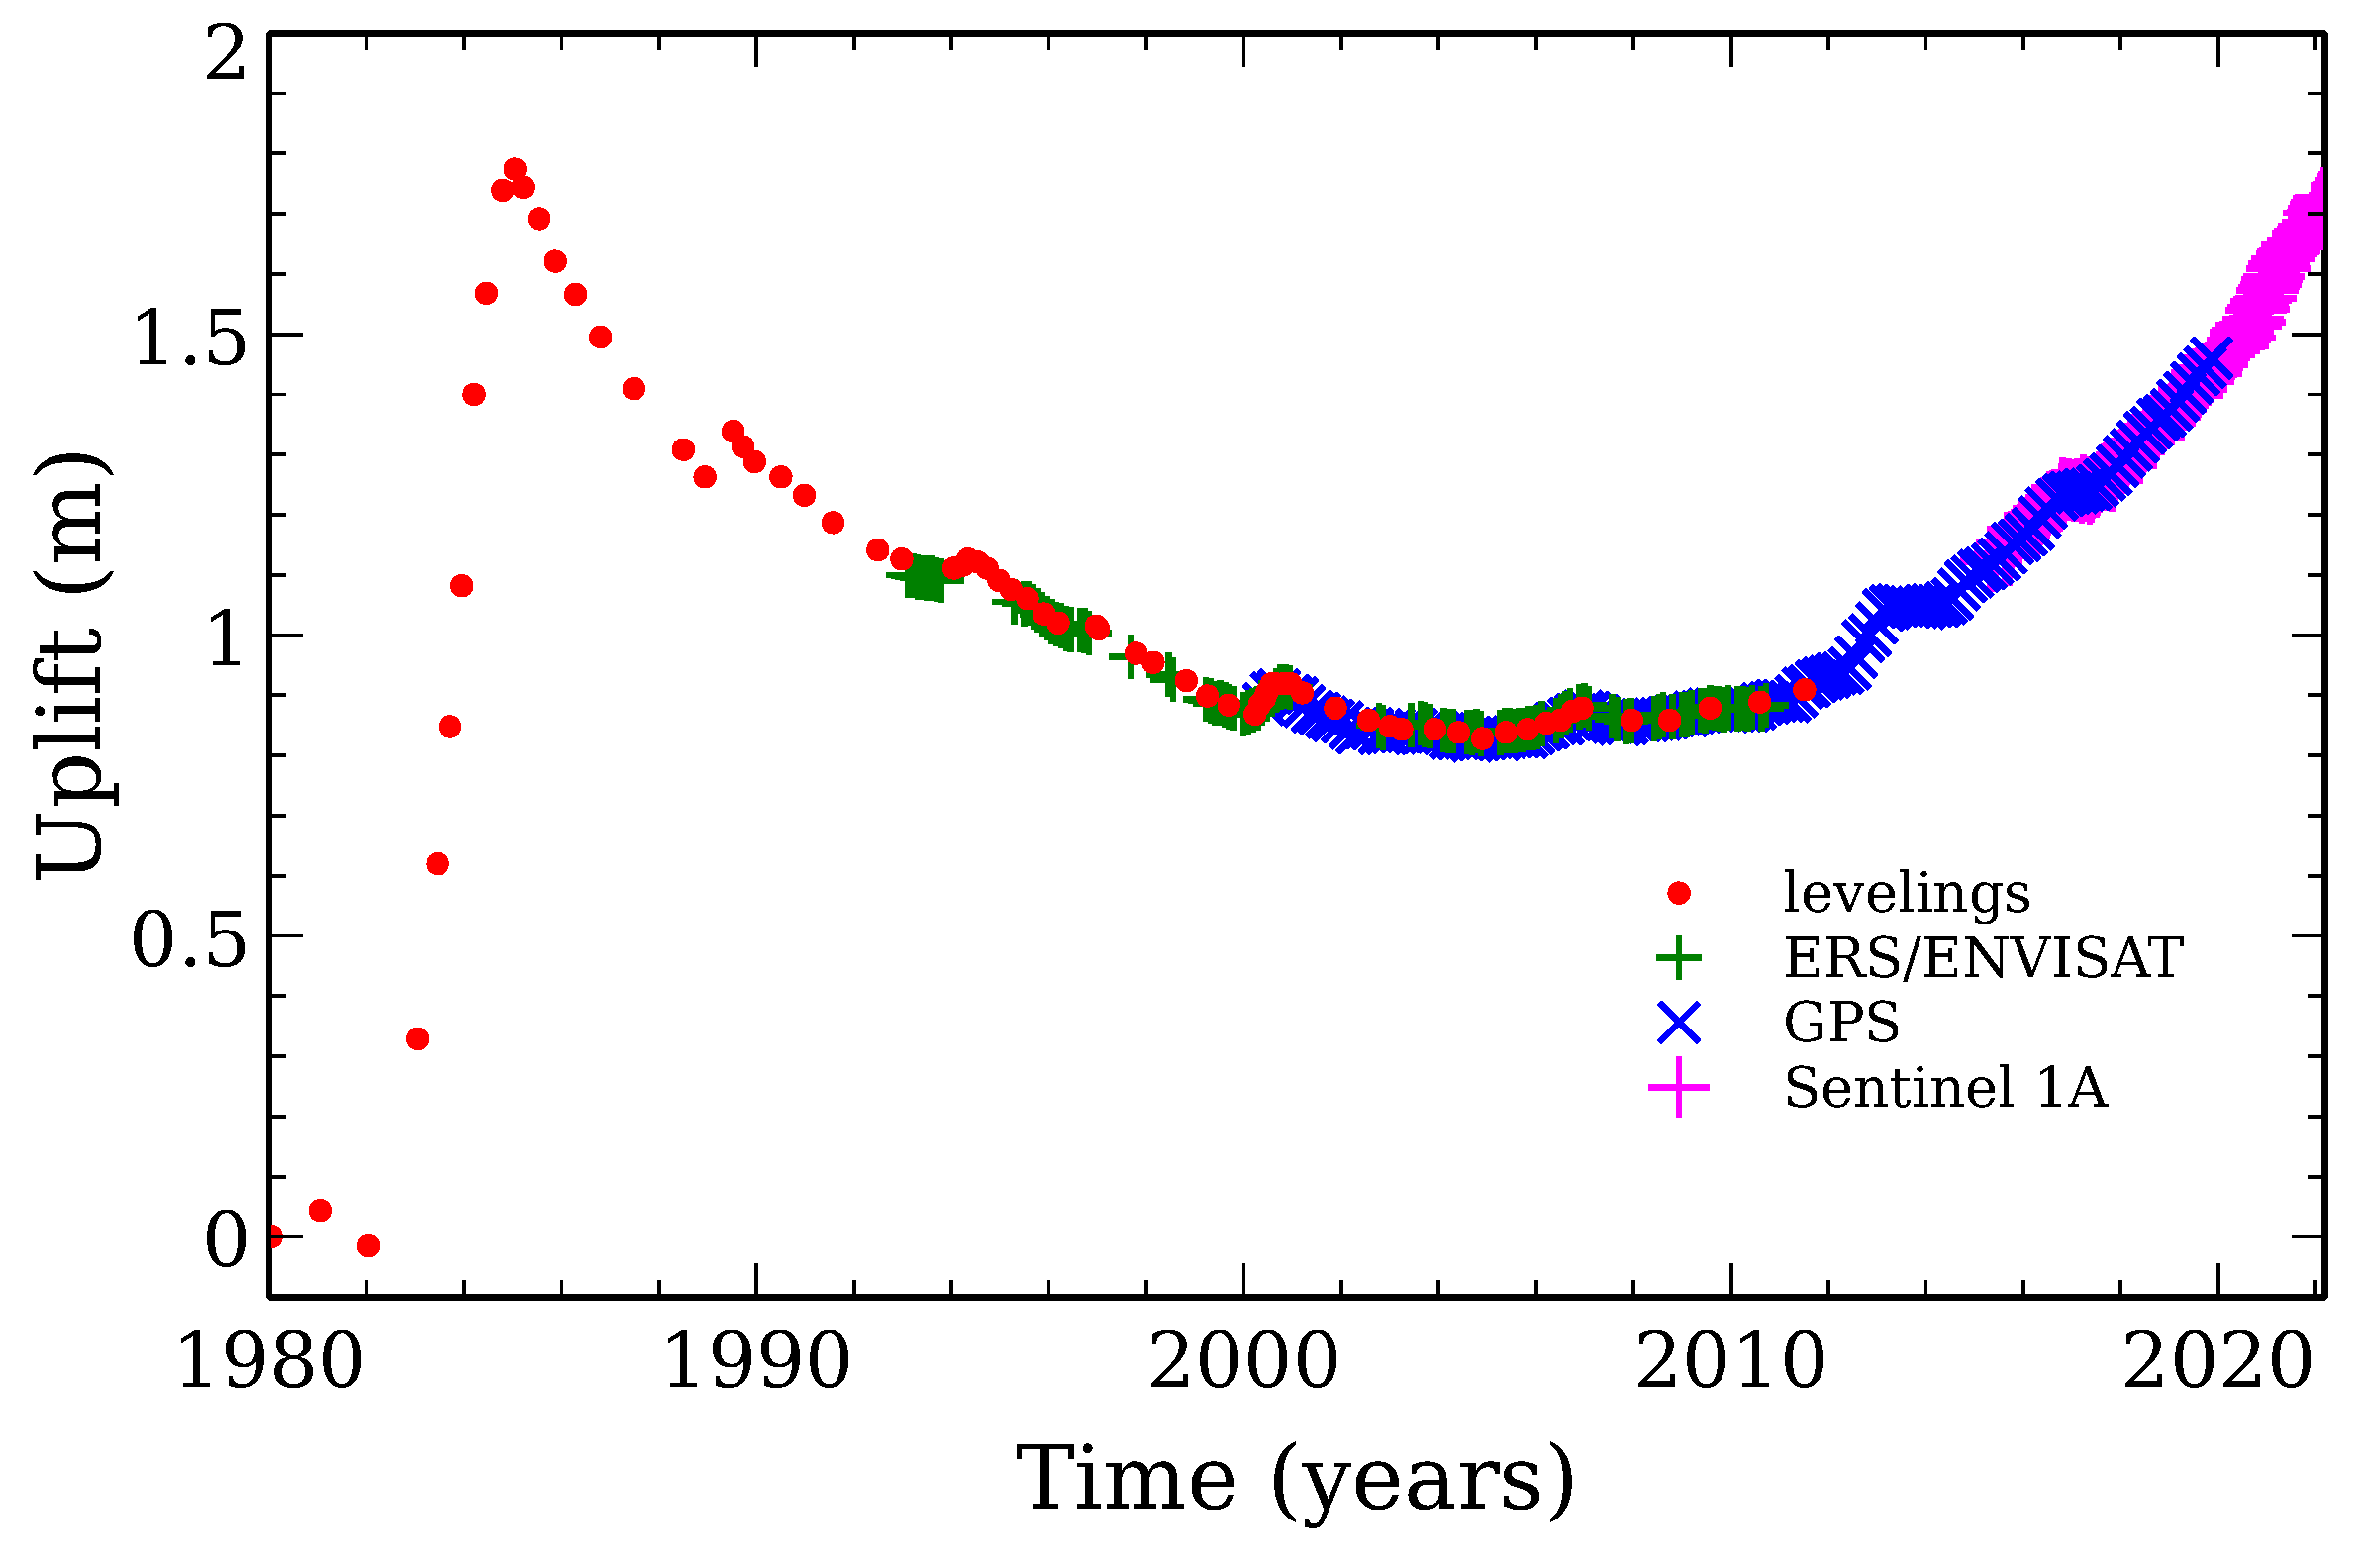
12]); 1985–2002 was characterised by long-lasting decreasing-rate subsidence overlapped by a few short (several months) uplift phases—usually known as “mini uplifts”—also culminating in the caldera centre. Figure 2 shows ground level changes at Rione Terra—located in the area of maximum vertical displacement and indicated by R in Figure 1a—from 1980 to 2022.
Figure 1. Map of Campi Flegrei and Vesuvio volcanoes, UTM WGS84 33N coordinates. (a) Topography; colours indicate altitudes [13]. Black dots and labels: L, LICO cGPS station, here used as a reference for comparing DInSAR and cGPS displacements; R, Rione Terra, in the area of maximum vertical movement of Campi Flegrei; S, Solfatara crater; P, Pisciarelli fumaroles; A, Agnano plain. (b) Satellite image (map data: Google, ©2022 Landsat/Copernicus) showing the densely inhabited urban area of Naples. Cyan and yellow discontinuous lines with triangles indicate the borders of the Campanian Ignimbrite (CI, about 39 ka) and Neapolitan Yellow Tuff (NYT, about 15 ka) caldera collapses, respectively (adapted from [14]). The white curve indicates the Mt Somma caldera rim. The red polygon encloses the area that is used here as reference for the analysis of DInSAR data.
Remotesensing 15 03038 g001
There is wide agreement that the 1982–1984 unrest episode resulted from the emplacement of a sill-like magmatic intrusion at about 3.5 km depth offshore Rione Terra, although the hydrothermal system may have also played an important role (e.g., [15,16,17,18,19,20]). The causative process (intrusion of magma and/or magmatic fluids or instability of the hydrothermal system) for post-1985 unrest episodes is still debated (e.g., [20,21]). The dynamics of the sill-like source centred offshore Rione Terra is consistent with the majority of the caldera-scale deformation during both inflation and deflation periods since 1980; almost all the residual deformation is confined to the area of the Solfatara fumarolic field (S in Figure 1a; e.g., [6,15]) and connected to the very shallow hydrothermal system. The feeding system of magma and/or magmatic fluids consists of a main storage reservoir at about 8–9 km depth containing 80–90% melt, interacting with shallow (mainly 2–4 km deep) reservoirs and recharged by a deeper source (e.g., [22,23,24,25]).
Ground deformation at Campi Flegrei has been—and still is—accompanied by seismicity. As for the main unrest episode that occurred between 1982 and 1984, seismicity started in 1982, reached significant magnitudes in 1983, was very intense during 1984, and waned at the end of the same year. Epicentres were scattered within the whole caldera, although two clusters could be identified, with the major one in an area between Rione Terra and the Agnano plain (A in Figure 1a) and the minor one at sea; the hypocentre depth distribution exhibits a maximum between 1 and 3 km, with only a few events occurring down to 7 km [26]. Few events and swarms occurred between 1985 and 2000, coevally with mini-uplifts. After 2000, the seismic rate slightly increased; however, earthquakes were still rare and occurred in low-magnitude swarms until 2014, when the events became more frequent and were often higher in magnitude (e.g., [26,27]). Until 2011, the earthquake depth distribution was similar to that between 1982 and 1984 [26], but with no significant events deeper than 4 km. After 2014, seismicity became shallower (usually < 2 km), except for the main swarms [27]. The onset of microseismicity is, at least in part, ascribed to hot fluid injections from depths (e.g., [19]), regulated by a rigid caprock [28] that acts as a barrier to magmatic fluids coming from the shallow reservoir and/or the deep magma chamber.
Vesuvio (Figure 1)—or, more precisely, Somma-Vesuvio—is a stratovolcano with a summit caldera (Mt Somma) and a recent cone (Vesuvio) resulting from several Plinian eruptions, with the last one occurring in 79 AD (e.g., [29]). Sub-Plinian eruptions occurred in 472 and 1631 AD. The latter was followed by semi-persistent activity that lasted until 1944; the quiescence duration correlates with the eruption size at the beginning of an eruptive period [30]. An approximately 4 km deep magma reservoir fed eruptions in the last 2000 years (e.g., [31,32]), although there is currently no evidence of stored melt [33].
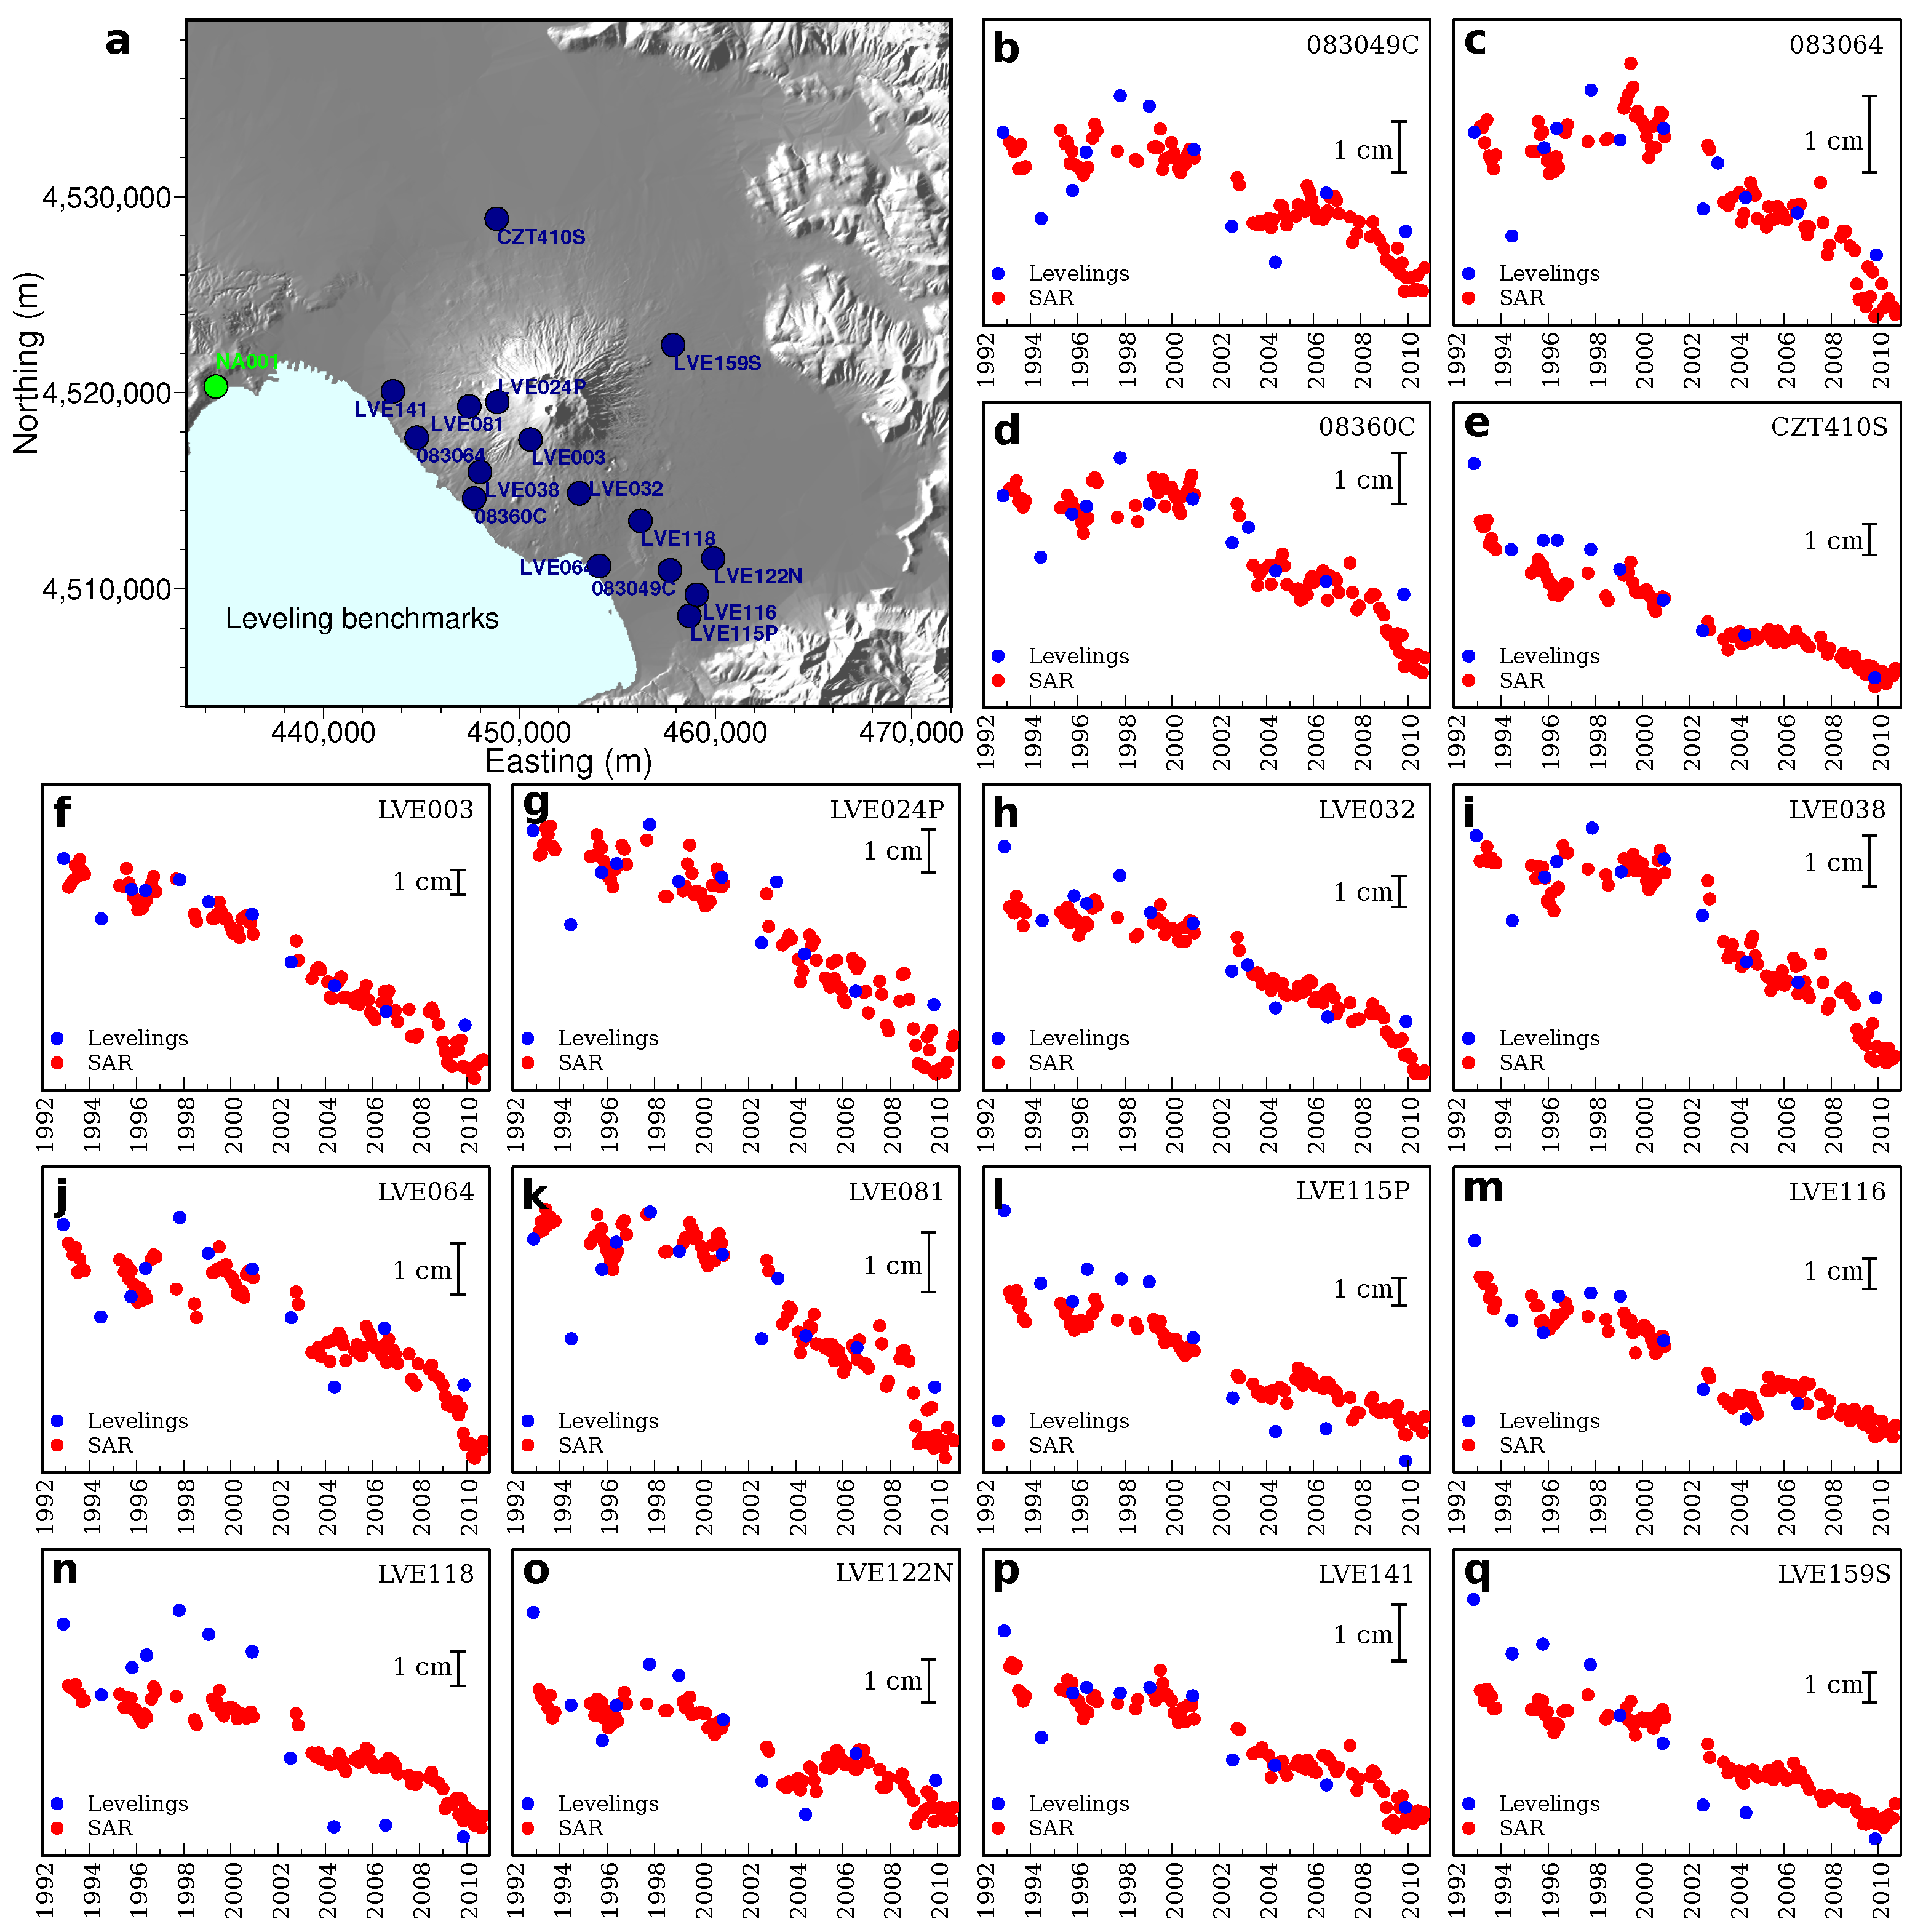
Levelling surveys at Somma-Vesuvio were initiated at the beginning of the 1900s, but unfortunately, most of the few benchmarks of the early network were lost. The levelling network was subsequently expanded; however, until 1985, it still consisted of a few benchmarks placed in a poor configuration, which prevented geodetic surveyors from performing a rigorous adjustment process and robust quantitative analyses [34]. The analysis of 1986–2009 data shows strong subsidence—up to −1.5 cm/year—inside the caldera rim, probably because of the sliding and compaction of young incoherent materials [34].
As for DInSAR data, we are not aware of any studies comparing deformation patterns related to different time periods. Published works discuss the mean ground displacement rates (velocities) during the periods 1992–2000 [35], 1992–2003 [36], and 1992–2010 [37]. The approximate vertical displacement (see Section 2.1) time series from 2003 to 2013—two measurement points inside the caldera rim and a third point around 5 km west of the Vesuvio summit—are shown in [38]. DInSAR displacement rates confirmed subsidence within the caldera rim and showed subsidence spots at a discontinuous “girdle” about 10 km from the summit [35,36,37]. The mean 1992–2003 velocities also show the relative subsidence of the E and SE sectors of the Vesuvian area relative to the NW and W sectors and an eastward component ascribed to large-scale extension [36], while the mean 1992–2010 velocities show the subsidence of the S-SW flank as well as uplift W-NW and a few kilometres SE of the volcanic edifice [37]. Velocities are on the order of a few mm/year, apart from inside the caldera rim. Subsidence spots were ascribed to the loading of volcanic and sedimentary units at the contact between volcanic and non-volcanic rocks [35]. The overall deformation pattern of the Vesuvian area and the presence of an offshore arc-shaped ridge, formed by the folding and cutting of recent strata by minor thrust faults, were ascribed to the volcano’s gravitational spreading on its ductile sedimentary substratum [36]. However, it was recently suggested that the deformation of Somma-Vesuvio is also partly caused by sagging—i.e., the flexure of a brittle layer into an underlying low-viscosity ductile layer—based on the mean 1992–2010 ground velocity, analogue experiments, and numerical modelling [37].
Since 2001, 3-D ground deformation has also been obtained by cGPS data provided by the NeVoCGPS network—nine stations, three of which started operating in 2001; station displacements are given with respect to six stations located outside the Neapolitan volcanic area [11]. cGPS observations confirm the strong subsidence inside the caldera rim and indicate the general subsidence of the Vesuvian area with no clear pattern; horizontal velocities are not consistent with the spreading of the volcano edifice (see also [39]).
Seismicity has been recorded with modern instrumentation since the beginning of the 1970s; the network has been progressively improved in the subsequent decades. Since the last eruption in 1944, intense seismicity was recorded during the periods 1978–1980, 1989–1990, 1995–1996, and 2018; a major seismic crisis occurred between 1999 and 2000, lasting until the beginning of 2002 (e.g., [27,40,41,42,43]). Seismicity is concentrated close to the Vesuvio crater axis, within a radial distance of less then 2 km. Two main seismogenic volumes have been identified: one with hypocentres located at depth below the crater and clustered mostly between 1 and 6 km below sea level, and another one with hypocentres clustered above sea level and located within the volcanic edifice. Deep magmatic fluids were probably involved in at least the 1999–2000 crisis (e.g., [27] and references therein). Deep microseismicity and magmatic fluid injections are most likely due to the dynamics of a large sill-like magma chamber at about 8 km depth—presently containing about 10% melt [44,45,46]—which also supplied magma to the approximately 4 km deep magma reservoir feeding eruptions over the past two millennia.
Since 2002, deep seismicity significantly decreased, and its absolute minimum occurred in 2005 (e.g., [43,47,48]). From 2008, after a slight increase, deep seismicity continued to decrease, whereas shallow earthquakes were increasingly recorded [27]. The time–depth distribution from 1999 to 2012 shows that seismic strain was mostly released by the deeper volume until 2002 and within the shallower volume since then (e.g., [43]). More recent seismicity consists of many hundreds of low-magnitude, mostly shallow earthquakes per year, mainly located in the crater area and sometimes occurring as low-energy swarms; since 2018, an increase in the number of earthquakes per year has been recorded (e.g., [27,48]).
Magmatic volatiles are actively transported by groundwater flowing along the main faults and fractures. Groundwater samples collected in the southern and western sectors and in the eastern and northern sectors of the volcano are chemically different: in the southern and western sectors, the contributions of deep fluids are more evident, while in the eastern and northern ones, shallow meteoric fluids dominate (e.g., [47]). A fumarolic field covers the rim and the inner flanks of the Vesuvio crater, and diffuse soil CO2 emissions come from some sectors of the cone [49]. The temperature of the groundwater and fumarolic field emissions suggest that the activity of the hydrothermal system decreased from 1998 to 2010, with the exception of a few periods [47]. The CO2 soil flux, equilibrium P C O 2 , and CO2/CH4 fumarolic ratio culminated in 2002 at the end of the 1999–2001 seismic crisis, indicating a coeval increase in the relative amount of magmatic fluids and in the Vesuvio activity (e.g., [49]); other changes have been ascribed to the effects of permeability variations accompanying seismogenic (mainly tectonic) processes (e.g., [48]).
The existence of possible links between Campi Flegrei and Vesuvio is suggested by the presence of a wide low-velocity layer—interpreted as an extended magmatic body recharged by a deeper source—at about 8 km depth beneath Campi Flegrei and Vesuvio (e.g., [23,44]) and the similarity in the petrological features of the deposits from the two volcanoes (e.g., [50,51,52]). The analysis of 1992–2008 DInSAR time series related to Rione Terra (Figure 1a) and the Vesuvio summit cone area suggested correlated activity during the 2001 and 2006 mini-uplifts, superimposed on prominent long-term subsidence [53]. However, uplift subsequently affecting Campi Flegrei was not accompanied by correlated changes at Vesuvio, and synchronicity appears to be in opposition to the historical records showing that pronounced subsidence periods at Campi Flegrei are associated with eruptions of Vesuvio and vice versa [53].
Campi Flegrei’s and Vesuvio’s deformation histories in recent decades are of great interest; the turn of the 2000s was quite important for the Campi Flegrei dynamics, so in this work, we searched for changes in Vesuvio’s behaviour between the late 1990s and early 2000s. We analysed ground displacement in the Vesuvian area and its surroundings during the period 1993–2010 using ERS/ENVISAT imagery. Empirical Orthogonal Function (EOF) analysis revealed a sudden large-scale displacement rate change around 2001; the pattern of the second EOF mode and the differences between pre-2001 and post-2002 velocity maps are fully consistent with the deflation of a deep pressurised source. The coincidence between the transition from deflation to inflation at Campi Flegrei and the onset of deflation at Vesuvio may suggest the possible transfer of magma and/or magmatic fluids between the two plumbing systems. Our results help define Vesuvio’s present deformation style and may be of primary importance in identifying and properly assessing any possible reactivation processes.

2. Materials and Methods

2.1. SAR Data and Analysis

We used ground displacement time series obtained from ERS-ENVISAT ([54,55]) SAR images through the Small BAseline Subset (SBAS) DInSAR technique [56]. The time series were provided to us—and other researchers—by the Istituto per il Rilevamento Elettromagnetico dell’Ambiente del Consiglio Nazionale delle Ricerche (IREA-CNR), Naples, Italy. They have already been used in the past for studying ground deformation at Campi Flegrei and Vesuvio (e.g., [6,15,37]).
The LOS time series include 138 ascending-orbit images from January 1993 to September 2010 and 155 descending-orbit images from June 1992 to September 2010 (Figure 3). The incidence angle (i.e., the angle between the LOS direction and the vertical) in the study area ranges from 21.6° (westernmost border) to 24.9° (easternmost border) for the ascending orbit and 22.8° (westernmost border) to 19.5° (easternmost border) for the descending orbit. The azimuthal angle (i.e., the angle between the satellite flight direction and north, positive clockwise) is about −12° for the ascending orbit and 192° for the descending orbit. The temporal interferometric coherence of the time series is larger than 0.55 for the ascending orbit and 0.5 for the descending orbit. The accuracy is approximately ±0.5 cm [57]. LOS displacement data are irregularly located, with spacing of approximately 50 to 80 m in covered areas. To decrease the amount of data and noise, we estimated the time series of LOS displacements on a regular (150 m × 150 m) grid by computing a median value for every non-empty block in the grid.
Because of the satellite’s polar orbit, the cosine of the angle between the LOS direction and north is small. The contribution of the northward ground displacement to the LOS displacement is often neglected, enabling us to estimate approximate upward and eastward displacements from ascending-orbit and descending-orbit SAR data. As an example, Figure 4a–d show synthetic ground displacements (ascending-orbit LOS, descending-orbit LOS, and upward and eastward components, respectively) from a very small (point) pressurised spherical cavity embedded in a homogeneous elastic half-space (Mogi source, [58]). We computed LOS displacements assuming that the incidence and azimuthal angles are 23.9° and −12° for the ascending orbit and 20.5° and 192° for the descending orbit. Figure 4e,f show approximate upward and eastward displacements estimated from the synthetic LOS displacements. The approximate eastward displacements (Figure 4f) were found to be practically indistinguishable from the exact ones (Figure 4d); the approximate upward displacements (Figure 4e) are very similar to the exact ones (Figure 4c), although the contour lines are shifted southward.
To estimate the approximate upward and eastward displacements from the DInSAR time series, we select ascending- and descending-orbit SAR acquisitions whose lag is shorter than 1 week (Figure 3). Although the approximate upward and eastward displacements are inexact, in what follows, we map them too, in addition to LOS displacements, to make the visual interpretation of the deformation field easier.
DInSAR displacements are not absolute and must be referenced to a reference pixel or group of pixels. We referenced DInSAR displacements to a median value inside a high-coherence area located around 11 km north of Vesuvio (Figure 1b) in order to emphasise lateral asymmetries. The displacement time series are in very good agreement with levelling [34] and cGPS [11] data (Figure 5 and Figure 6).

2.2. EOF Analysis

Empirical Orthogonal Function (EOF) analysis (also called principal component analysis (PCA) or factor analysis; e.g., [59]) decomposes a space–time field into mutually orthogonal spatial patterns and associated temporal evolutions and is commonly used to detect spatial and temporal changes in climatic modes. Unfortunately, there is no universally accepted terminology: here, we use the terms “EOF” or “EOF coefficients” for spatial patterns and “Expansion Coefficients” (ECs) for the EOF temporal evolutions. We normalised EOFs to the unit L2-norm. EOF analysis was previously applied to Campi Flegrei for denoising DInSAR data [60] and detecting signs of the ongoing deep magma inflation [6].
For a time series of n t displacement maps, each consisting of n p spatial locations, data values can be spatially or temporally organised in an n t × n p matrix or an n p × n t matrix, respectively. Following [6], we organised the data spatially, consider ascending- and descending-orbit LOS displacements “coeval” when lag acquisitions were shorter than 1 week, and arranged two data matrices X L O S and X a p p ; X L O S consists of ascending- and descending-orbit LOS displacements, and X a p p consists of approximate upward and eastward displacements. Thus, n p is the sum of the number of ascending- and descending-orbit pixels ( n a and n d , respectively) for X L O S , and twice the number n c of pixels that are common to the ascending and descending orbits for X a p p . At each time, we separately removed the mean from the ascending- and descending-LOS displacements in X L O S —or from the approximate upward and eastward displacements X a p p —so as to have the time series of zero-mean “relative” displacements. For the sake of simplicity, we still call these new matrices X L O S and X a p p and use X when referring to a generic spatially organised data matrix.
We calculated the EOFs and ECs of X using singular value decomposition (SVD). We decomposed X as X = U D V T using the svd() function in the Octave programming tool. Matrices U and V are orthonormal, i.e., U U T = U T U = I and V V T = V T V = I ; D contains the singular values and is diagonal (i.e., all entries whose column number is different from the row number are zero); I is the identity matrix; and superscript T denotes a transpose. Squared singular values are also the eigenvalues of the covariance matrix S = X T X . The columns of V give uncorrelated spatial patterns, and columns of U D give related temporal evolutions; each column of V and U D represents a mode. The displacement at pixel j and time t i related to mode m is given by ( U D ) i m V j m ; thus, if V j m > 0 , then the displacement at pixel j follows the same temporal evolution as the mode, while if V j m < 0 , then the displacement at pixel j follows the opposite temporal evolution. EOFs, i.e., the columns of V, are given in descending order of the singular values, which means in descending order of importance. An empirical rule states that the typical error of the eigenvalue λ k is λ k ( 2 / n ) , where n is the number of statistically independent samples; EOFs are significant when the spacing between neighbouring eigenvalues is larger than the eigenvalue error [59]. We estimated n through the autocorrelation function [61]. Generally speaking, the mathematical properties of EOFs imply that each component may not have individual—dynamical, kinematic, or statistical—meaning independent of other EOF modes; however, the careful inspection of spatial patterns, temporal evolutions, and singular values may allow us to discern possible mode contamination.

2.3. Inversion of the Spatial Pattern of the Second EOF Mode

We tested the consistency of the second EOF mode coefficients with the ground displacements caused by a simple deflating source model, i.e., the depressurisation of a very small (point) spheroidal cavity embedded in a homogeneous elastic half-space whose Poisson’s ratio is 0.25. Ground displacements were computed following [15]. The spheroid symmetry axis was kept vertical; the source position, polar-to-equatorial axis ratio, and potency are free parameters in the best-fit procedure. Since the EOF coefficients’ mean is null because of the construction of the data matrix, we also shifted modelled displacements accordingly. We minimised the absolute deviation of residuals to reduce the effects of outliers; minimisation was carried out by adaptive simulated annealing [62].

3. Results

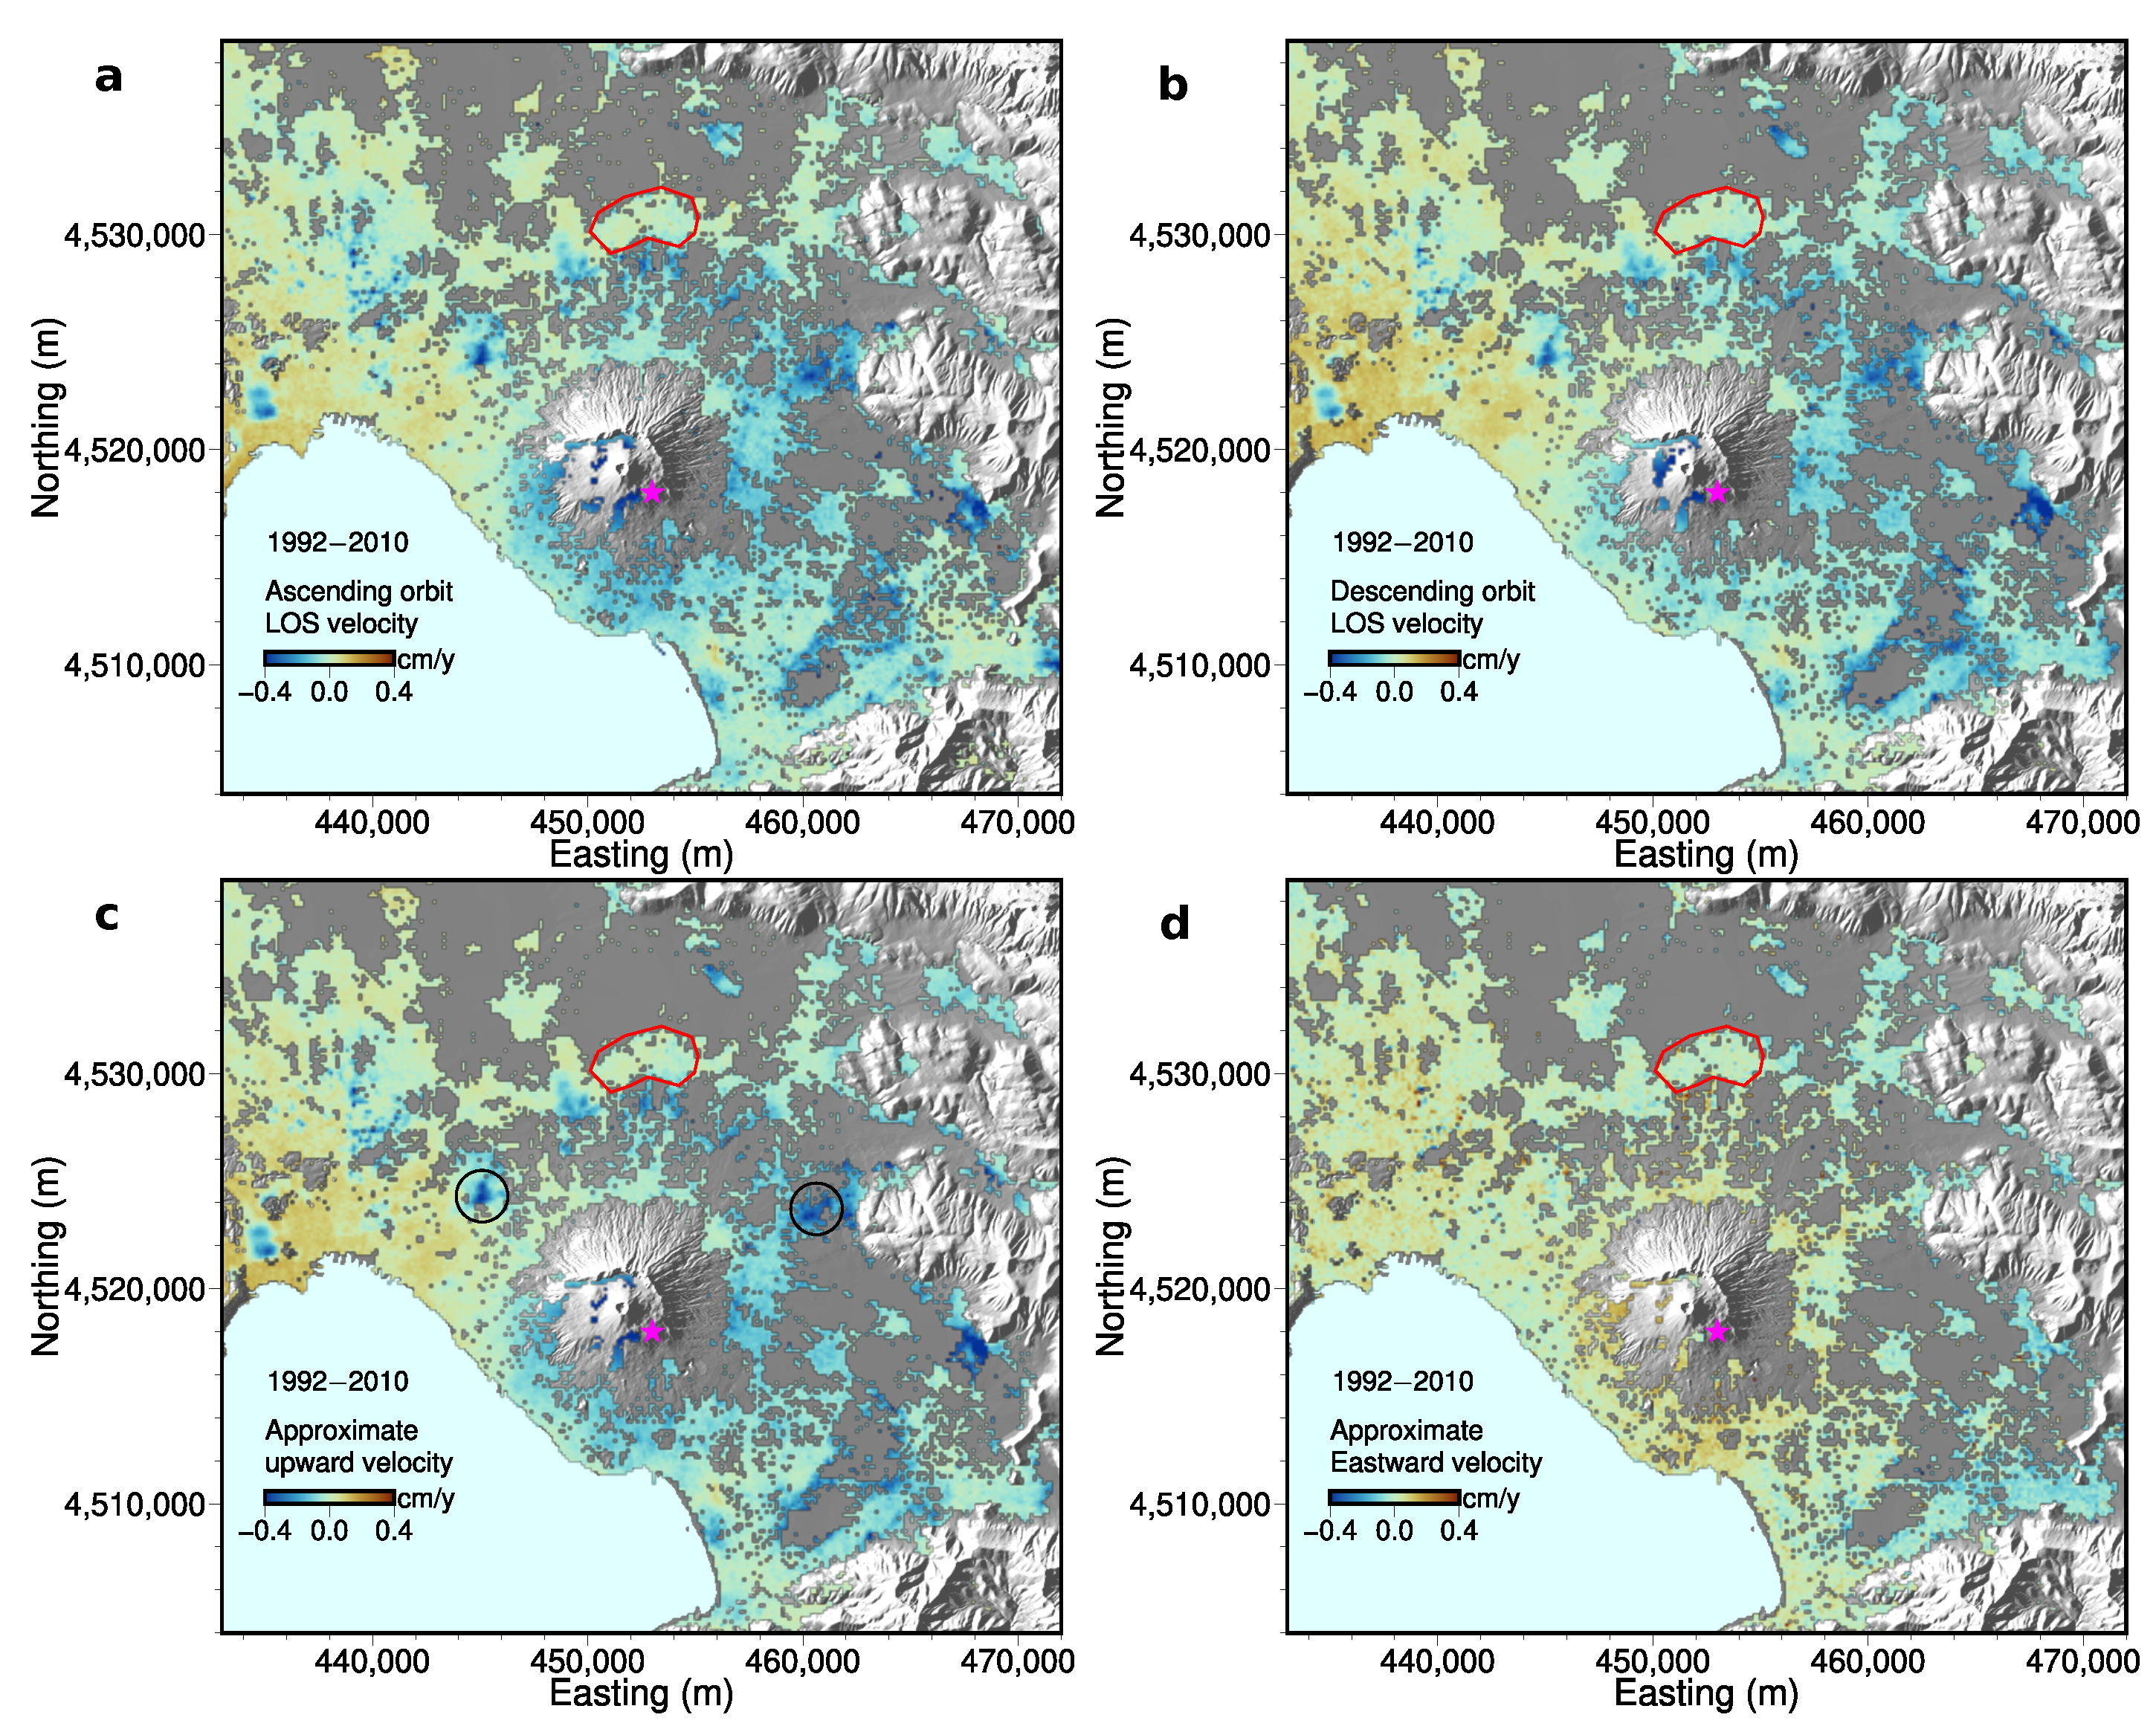
Figure 7a,b show maps of the LOS (ascending and descending orbits) and approximate upward and eastward mean displacement rates (velocities) in the Vesuvian area for the period 1993–2010. The LOS velocity maps are similar to Figure 3 in [37], apart from a uniform velocity translation due to a different reference area. As already pointed out by others, the most evident features are the occurrence of subsidence at the summit and S-SW flank of the volcanic edifice [37], subsidence spots along a discontinuous “girdle” about 10 km from the Vesuvio summit, and the occurrence of uplift W-NW and S-SE of the volcanic edifice [35,36,37].
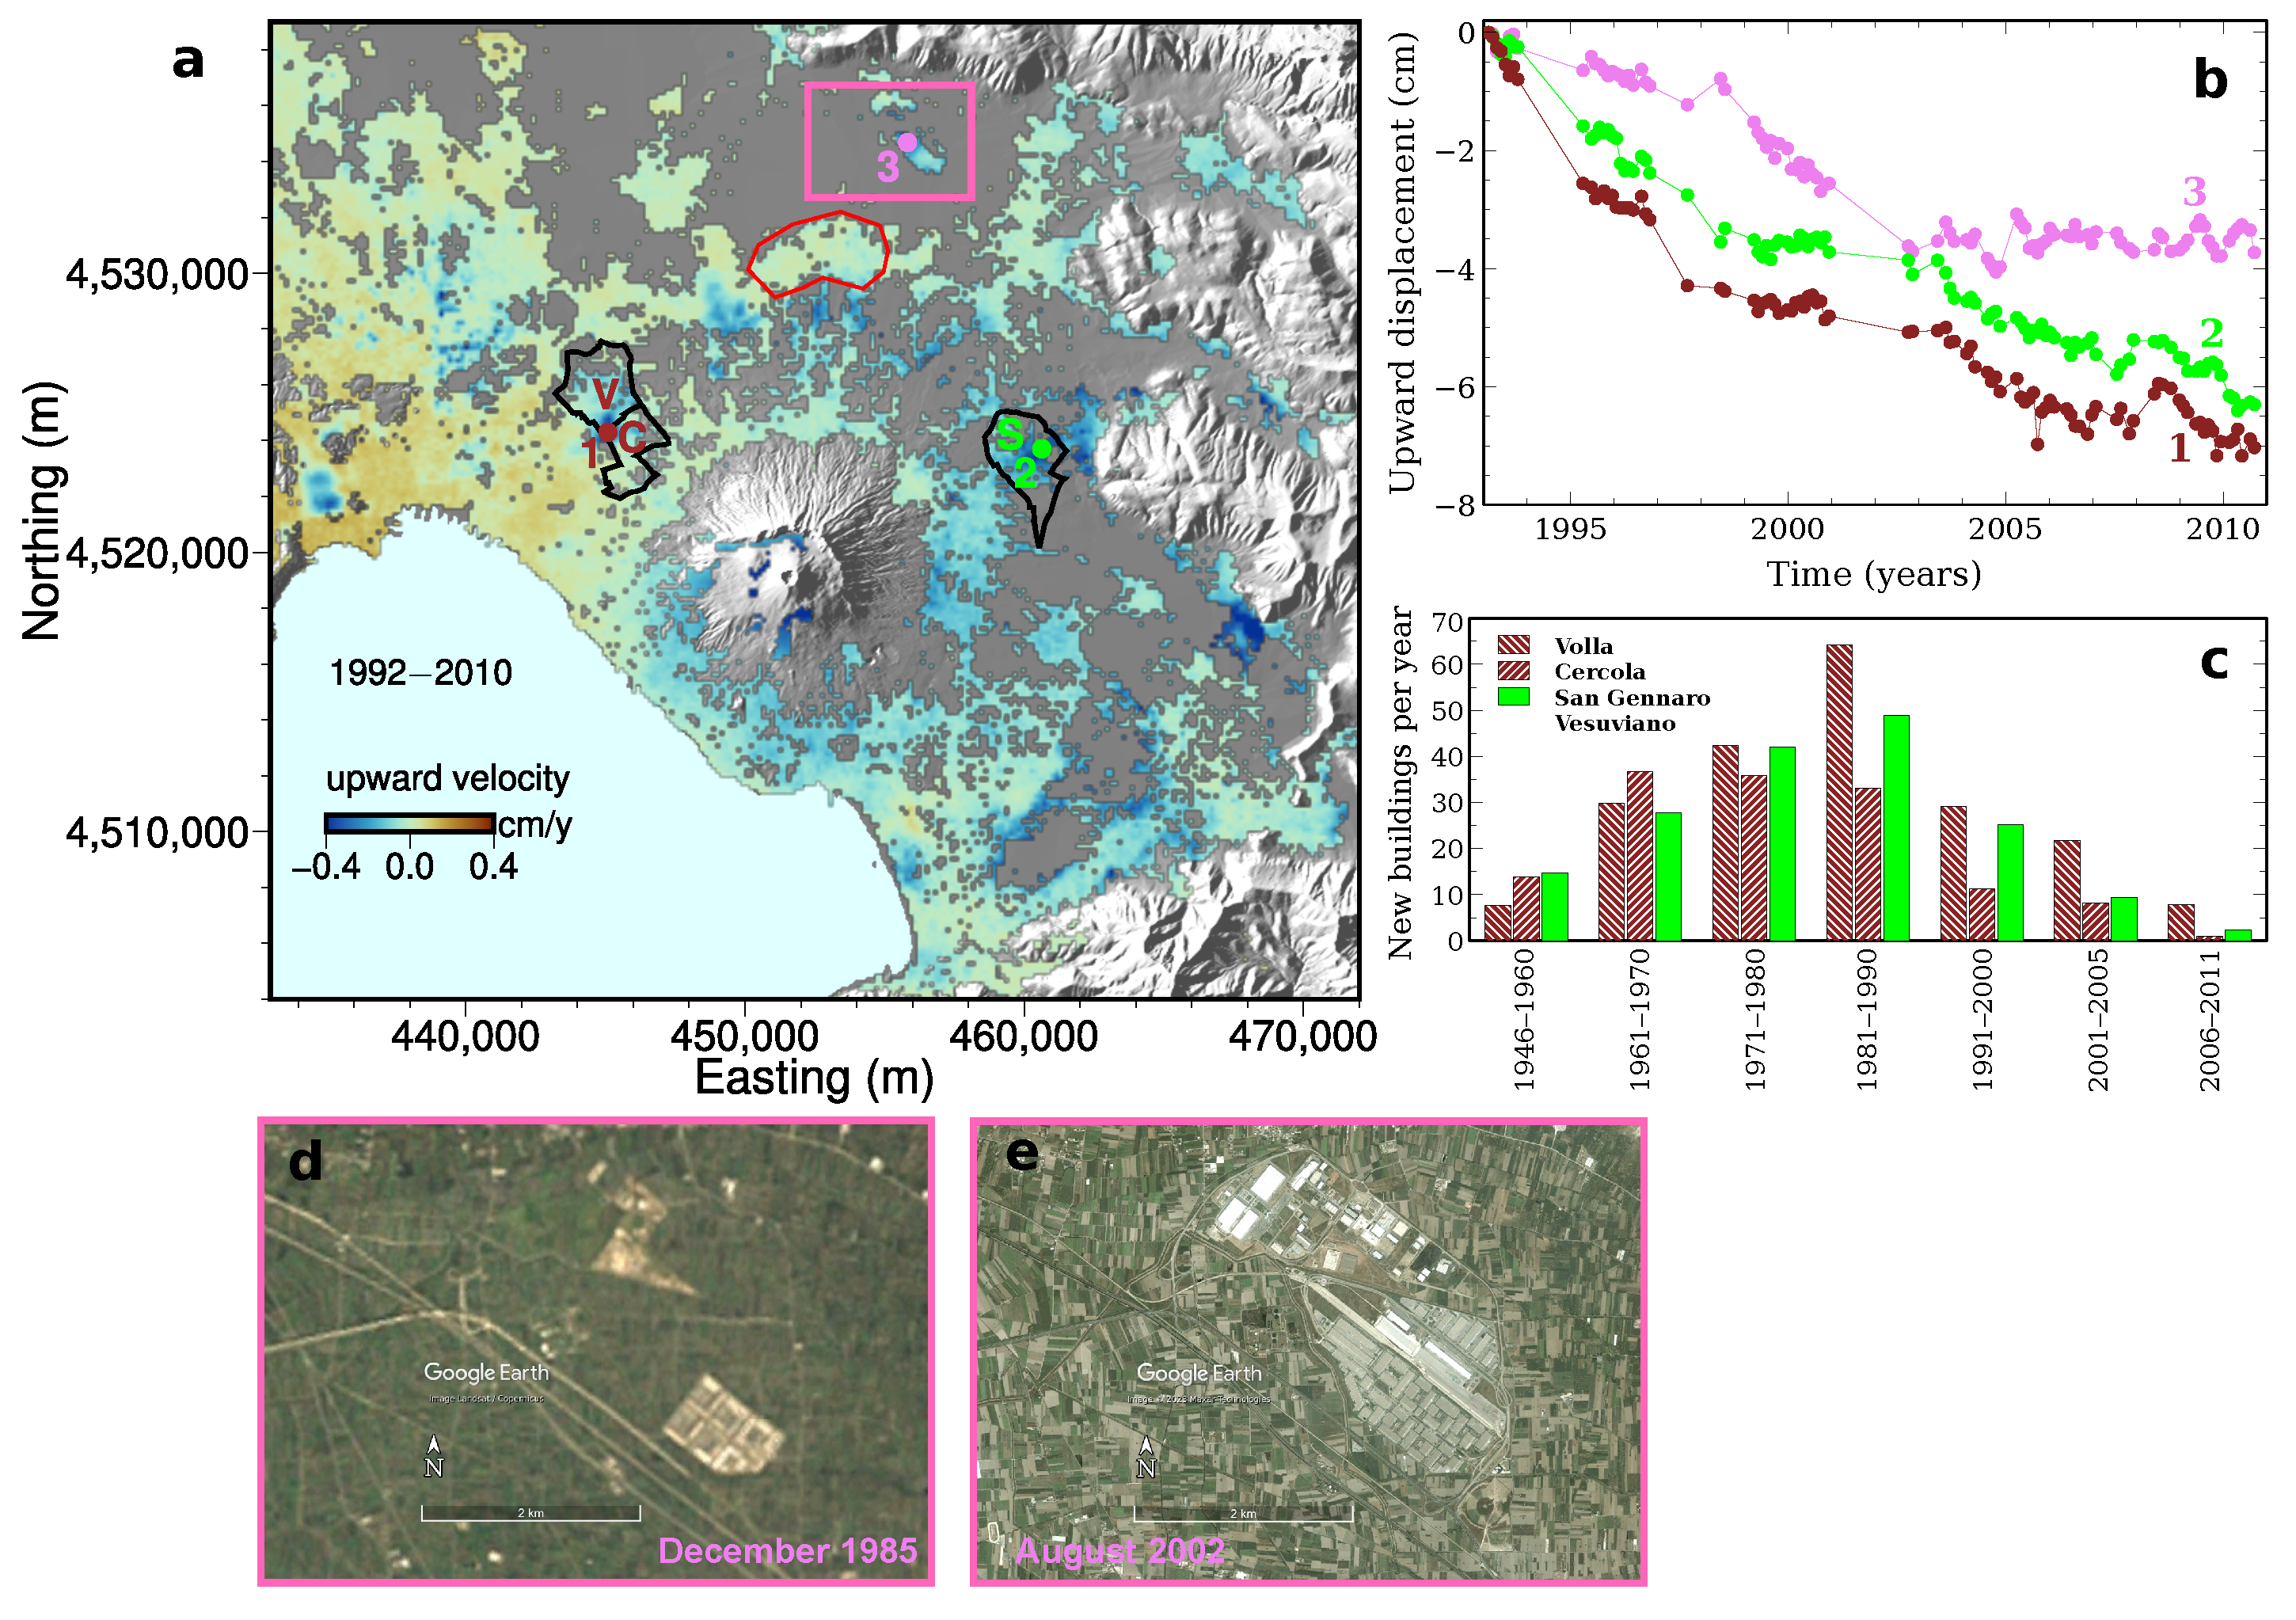
A closer look at the two most prominent subsidence spots is provided in Figure 8. The subsidence rate decreased over time (Figure 8b); intriguingly, the local urbanisation rate—here defined as the number of new buildings per year in the municipalities where the spots are located—also decreased from the early 1990s compared to previous decades (Figure 8c). In this respect, a third deformation spot—which is located about 5 km north of the “girdle”—is particularly instructive: the subsidence rate is not constant (Figure 8b), and satellite images acquired in December 1985 (Figure 8c) and August 2002 (Figure 8d) show the construction of an industrial area during that time interval.
To identify possible common modes in the ground displacement field, we applied an EOF analysis to the 1992–2010 DInSAR displacement time series inside two circular regions 15 km and 9 km in radius, centred on the magenta star in Figure 7; the radii of the two circular regions were chosen in order to exclude the westernmost part of the region shown in Figure 7, where Campi Flegrei dynamics may contribute to the horizontal movements, and include (15 km radius) or exclude (9 km radius) the “girdle” of discontinuous strong subsidence. In both regions, the data are arranged into two different matrices: X L O S , containing ascending- and descending-orbit LOS displacements, and X a p p , containing approximate upward and eastward displacements. Thus, the total number of EOF analyses is four. The ECs and eigenvalues of the first modes are shown in Figure 9. There is practically no difference between the results obtained by analysing X L O S and X a p p : only the first two modes are statistically significant; the EC of the first mode follows a quasi-linear trend, and the EC of the second mode exhibits a sudden slope change between pre-2001 and post-2002 data.
Figure 10a–d show the spatial patterns of the second EOF mode when the radius of the analysed circular region is 9 km. When the radius of the analysed circular region is 15 km, the spatial patterns of the second EOF mode—not shown here for brevity—are very similar to those in Figure 10a–d inside the first 9 km from the centre. Bluish colours imply a mean velocity change from positive to negative values around 2002, because the displacement time series related to a selected EOF mode is given by the EOF coefficient at the pixel times the mode EC.
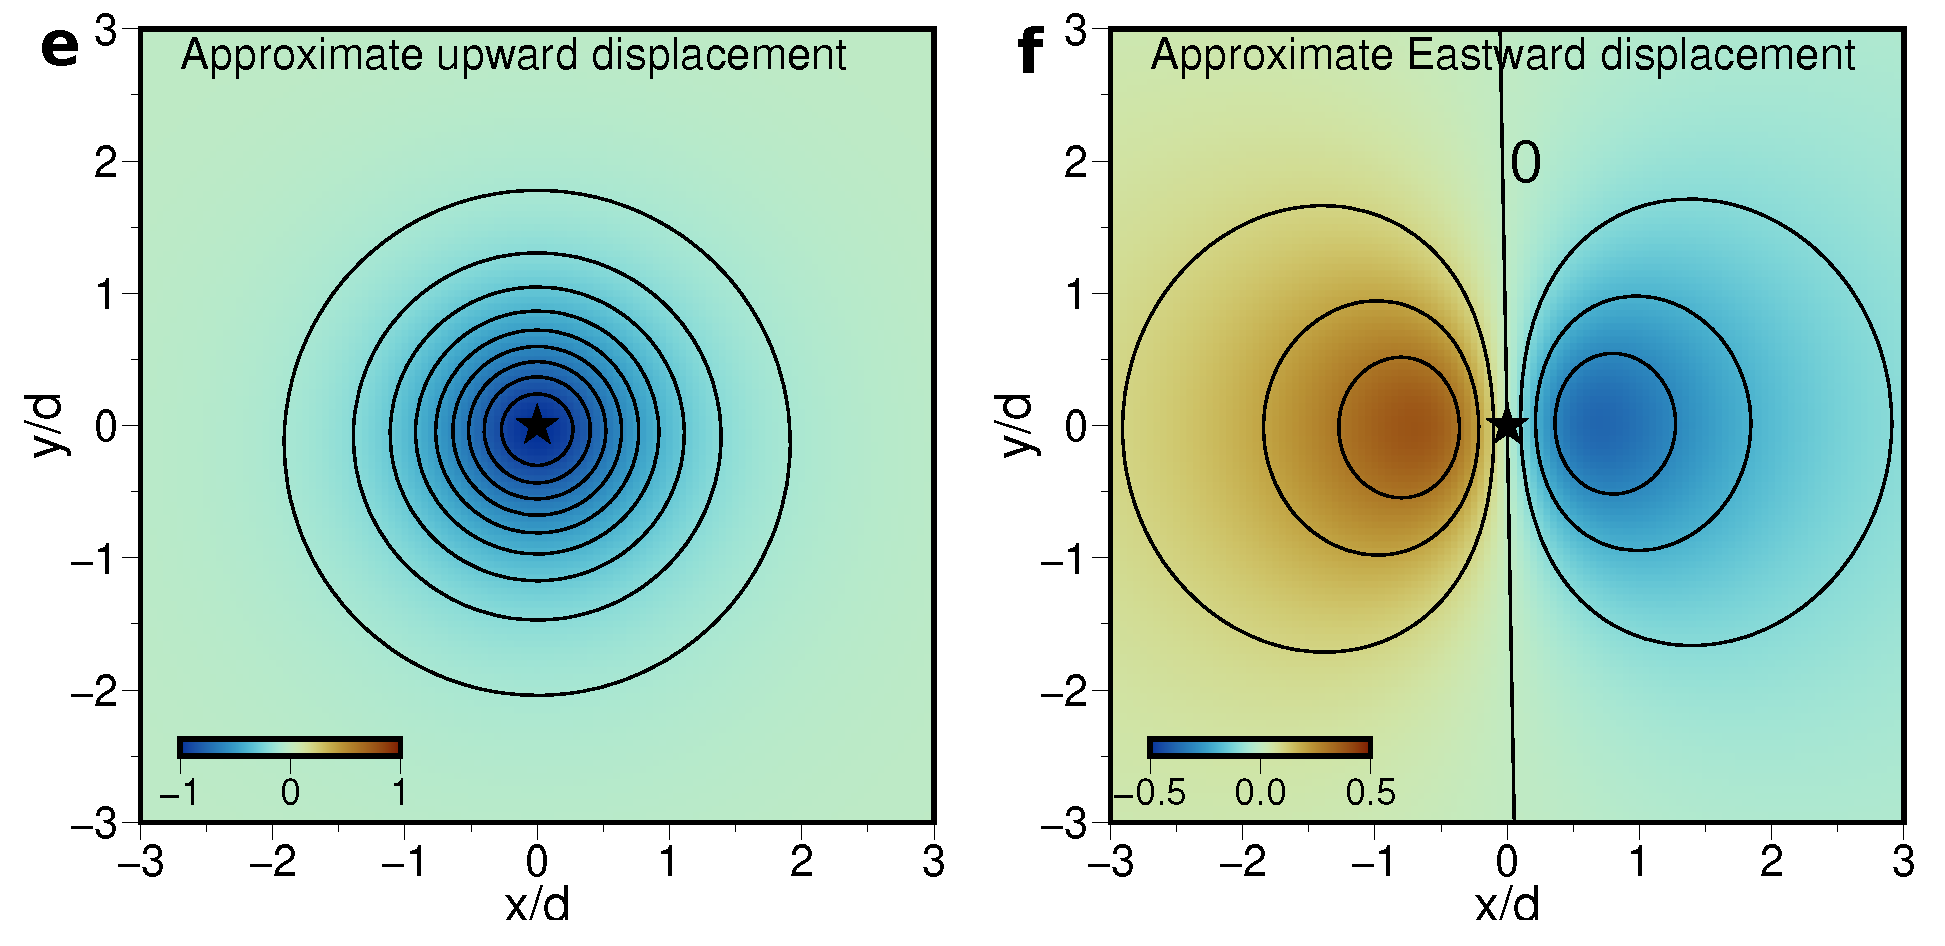
The spatial patterns of the second EOF mode closely resemble the displacement patterns for a deep (several kilometres) deflating pressurised cavity (Figure 4a,b,e,f). We have inverted the EOF coefficients in Figure 10a,b (ascending- and descending-orbit LOS displacements) for the best-fit parameters of a very small (point) pressurised spheroidal cavity embedded in a homogeneous elastic half-space (Section 2.3). Pixels around the Vesuvio cone have been excluded because of the local sliding and compaction of young incoherent materials [34]. Figure 10e,f show modelled ascending- and descending-orbit LOS displacements when the source depth is 7300 m and the polar-to-equatorial radius is 1.1. The position of the source surface projection and polar-to-equatorial radius are well constrained by the inversion; the depth uncertainty is a few hundred metres.
Figure 9 and Figure 10 indicate that the years before 2001 and those after 2002 may be characterised by different ground dynamics. To test this hypothesis, we simply computed and compared pre-2001 and post-2002 pixel-wise mean velocities. Before 2001 (Figure 11a,c and Figure 12a,c), no noticeable pattern is apparent in the Vesuvian area as in the approximate upward velocity (Figure 12a), apart from strong subsidence close to the summital crater and in various spots along a quasi-circular ring around Vesuvio—i.e., the “girdle” in [35,36]. The approximate eastward velocity is characterised by westward motion west of Vesuvio and eastward motion east of Vesuvio (Figure 12c); the two side lobes might be related to the spreading of the volcanic edifice on its ductile sedimentary substratum, although the west lobe extends farther than expected to the west, possibly because of the strong subsidence of the Campi Flegrei caldera. We do not ascribe the eastward velocity pattern to regional extension [36] just because of the lobed shape.
Post-2002 velocity maps (Figure 11b,d and Figure 12b,d) show very different features, which are easily interpretable when looking at the approximate upward and eastward velocity components. After 2002, the strong subsidence spots are less evident than before 2001, and the whole Vesuvian area was clearly subsiding (Figure 12b); the two side lobes in Figure 12d are consistent with the deflation of a pressurised cavity. Post-2002, upward and horizontal cGPS velocities are also consistent with the deflation of a pressurised cavity (Figure 12b,d).
The difference between post-2002 and pre-2001 velocities is shown in Figure 13. The “girdle” subsidence spots are characterised by positive values (Figure 13c), thus confirming the subsidence rate decrease (Figure 8). Maps related to the approximate upward and eastward velocities (Figure 13c,d) are consistent with subsidence due to deep deflation (see Figure 4), although the west lobe extends farther than expected to the west, as in the case before 2001 and probably for the same reasons.

4. Discussion

In this work, we used and analysed multi-year DInSAR ground displacement time series related to the Vesuvian area. The SAR phase may be affected by tropospheric effects; however, while seasonal oscillations were successfully removed from the time series of DInSAR displacements from ENVISAT/RADARSAT imagery at Vesuvio by utilising surface weather and radiosonde data, the trends were practically unaffected by the atmospheric correction [38].
The second EOF mode shows a clear change between 2001 and 2002; its spatial pattern is consistent with a quasi-spherical deflating cavity embedded in a homogeneous elastic half-space at about 7300 m depth beneath the Vesuvio summit (Figure 10a,b,e,f). The actual source depth is probably larger because of the “focusing effect” related to shallow soft materials [15].
The main features of the pre-2001 ground velocity field (Figure 11a,c and Figure 12a,c) were already pointed out in [35,36]: strong subsidence occurs inside the caldera ring close to the summital crater and in various spots along a quasi-circular “girdle” at about 10 km around Vesuvio; the approximate eastward velocity is consistent with the spreading of the volcanic edifice, with some possible contributions from regional extensional tectonics and/or the strong Campi Flegrei subsidence. The summital crater subsidence is probably caused by the sliding and compaction of young incoherent materials [34]. As for the subsidence spots, a possible link to water table changes has been rejected, and they have been ascribed to the loading of volcanic and sedimentary units at the contact between volcanic and non-volcanic rocks [35]. However, the spot subsidence rate decreased over time (Figure 8b), and spots are located in areas where faster and faster urbanisation occurred from the 1960s to the 1990s, when the rate of the construction of new buildings rapidly decreased (Figure 8c). Thus, we believe that the spot subsidence might be ascribed to the loading of buildings at the contact between volcanic and non-volcanic rocks. Groundwater could actually contribute to the differences between the pre-2001 upward velocities in the southern and western sectors in comparison with the eastern and northern sectors (Figure 12c), because groundwater circulation differs in the two areas [47].
If the pre-2001 ground velocity field is mainly due to the spreading of the volcanic edifice onto its sedimentary substratum and/or to the regional tectonics, we are thinking of long-lasting processes—thousands of years. Thus, the post-2002 ground velocity field, which differs substantially from the pre-2001 one, probably includes the previously acting processes and a new phenomenon that began around 2001–2002. Taking the difference between the post-2002 and pre-2001 ground velocity fields could highlight the characteristics of this new phenomenon (Figure 13), except for the areas of decreasing local subsidence induced by human activity (reddish areas in Figure 13c) and the possible transient contribution of the Campi Flegrei dynamics to the horizontal movements in the westernmost region. The ground deformation around Vesuvio is consistent with the deflation of a several-kilometres-deep pressurised cavity (Figure 4) but also with volcano sagging into an underlying low-viscosity ductile layer, to which part of the 1992–2010 ground velocity field was attributed by [37]. Analogue experiments show a possible transition from spreading-dominated to sagging-dominated behaviour after cone emplacement [39]. However, sagging is also a long-lasting process, and the sudden onset of the post-2002 phenomenon makes sagging unlikely.
The hypothesis of the deflation of a several-kilometres-deep pressurised cavity is also supported by the significant decrease in Vesuvio seismicity at depths larger than about 3 km since around 2002 [27,43]. Deep magmatic fluids were probably involved in at least the 1999–2000 seismic crisis (e.g., [27] and references therein). A coeval increase in the ascent of magmatic fluids is suggested by the time series of CO2 soil flux, equilibrium P C O 2 , and the CO2/CH4 fumarolic ratio [49]. In addition, the groundwater temperature and fumarolic emissions suggest that the activity of the hydrothermal system generally decreased from 1998 to 2010 [47,49]. As already mentioned in Section 1, deep microseismicity and magmatic fluid injections are most likely due to the dynamics of a large sill-like magma reservoir at about 8 km depth, presently containing about 10% melt [44,45,46], which also supplied magma to the approximately 4 km deep magma reservoir feeding eruptions over the past two millennia.
The coeval onset of deflation below Vesuvio (this work) and inflation below Campi Flegrei [6] seems consistent with the observation that historically pronounced subsidence periods at Campi Flegrei are associated with eruptions of Vesuvio and vice versa [53]. However, 1992–2008 DInSAR time series show two mini-uplifts at the Vesuvio summital area in 2001 and 2006 [53], i.e., when two mini-uplifts were also recorded at Campi Flegrei (Figure 2). This apparent inconsistency—previously identified in [53]—could be linked to the somewhat different nature of the synchronous mini-uplifts compared to the post-2002 uplift of Campi Flegrei and the subsidence of the Vesuvian area. The ground deformation pattern of the 2001 and 2006 Campi Flegrei mini-uplifts was the same as that of the post-1985 subsidence [15], and both the subsidence and the mini-uplifts were due to an approximately 3.5 km deep source. The coeval Vesuvio mini-uplifts affected the summital area and were probably caused by a shallow—around 2 km deep—source [53]. Thus, the Campi Flegrei and Vesuvio deep reservoirs were not involved in the mini-uplifts. On the contrary, the ongoing Campi Flegrei uplift is probably driven by the inflation of a 8 km deep reservoir [6]. As for the post-2002 deflation below Vesuvio, a several-kilometres-deep deformation source is suggested by the pattern of the second EOF mode, as well as the large extension of the affected area and the apparent southward shift of the approximate upward velocity change pattern compared to the approximate eastward velocity change pattern (see Figure 4a,b,e,f and Figure 13c,d). In view of the above, an anti-correlation between the deformation signals of Campi Flegrei and Vesuvio seems to exist only when the observed deformation in both volcanoes is connected to the deep reservoirs, suggesting a connection/interaction between the deep reservoirs of Campi Flegrei and Vesuvio.
Unfortunately, in the Vesuvian area, the deformation rate is small (a few mm/yr), the central part of the deforming area is poorly covered by data, and three-dimensional rheological parameters are poorly known, particularly those at depth. A reliable inversion of the pattern of the second EOF mode and/or the difference between post-2002 and pre-2001 ground velocities for the best-fit deformation source is out of the scope of this work. Our simple modelling of the second EOF mode for ascending- and descending-orbit LOS displacements suggest depressurisation deeper than 7000 m. Ground displacement time series from GPS do not show clear changes in velocity over time [11], suggesting that deflation below Vesuvio continues. In the near future, we aim to extend our analysis to DInSAR ground displacement times series after 2010 using Sentinel-1 and—if made available—TerraSar-X imagery. Such an extension could improve the signal-to-noise ratio and enlarge the area covered by data, hopefully clarifying whether there has been an increase in the Vesuvio deflation rate corresponding to the Campi Flegrei uplift acceleration since 2010.

5. Conclusions

The active Campi Flegrei and Vesuvio volcanoes are located about 25 km apart inside a highly populated metropolitan area, which includes the city of Naples; the most recent eruptions occurred in 1538 and 1944, respectively. After a large uplift, Campi Flegrei was generally subsiding from 1985 to 2001, while it has been uplifting at an accelerating rate since then, probably driven by deep magma inflation. To search for possible interactions between Campi Flegrei and Vesuvio, we analysed Vesuvio dynamics during the period 1992–2010 using DInSAR data from ERS-ENVISAT imagery.
Previous works computed and analysed the mean ground velocity field in the Vesuvian area during the periods 1992–2000 [35], 1992–2003 [36], and 1992–2010 [37], without looking for temporal variations. Here, we show that the second mode of an Empirical Orthogonal Function analysis of the displacement time series indicates a sudden change in trend—i.e., mean velocity—between pre-2001 and post-2002 data. Its spatial pattern is in agreement with what is expected from a quasi-spherical deflating cavity embedded in a homogeneous elastic half-space at approximately 7300 m depth beneath the Vesuvio summit. The actual source depth is probably larger because of the “focusing effect” related to shallow soft materials [15].
The pre-2001 ground velocity field confirms strong subsidence—up to 5 mm/y—occurring inside the caldera ring close to the summital crater and in various spots along a quasi-circular “girdle” at about 10 km around Vesuvio. The subsidence rate in the spots decreased over time between 1992 and 2010. The approximate eastward velocity is characterised by eastward displacement in a lobe east of Vesuvio and by westward displacement in a lobe west of Vesuvio; this is consistent with the spreading of the volcanic edifice on its ductile sedimentary substratum and/or extensional tectonics—as suggested by [36] based on 1992–2003 mean ground velocities—with some possible contribution in the westernmost part from the strong Campi Flegrei subsidence. In contrast to prior works, we ascribe the subsidence spots to previous rapid urbanisation, not a load of volcanic and sedimentary units at the contact between volcanic and non-volcanic rocks—as suggested by [35] based on 1992–2000 mean ground velocities—because the subsidence rate decreased over time between 1992 and 2010; moreover, we do not ascribe the eastward velocity field to regional extension—as suggested by [36]—because of the lobed pattern.
Post-2002 velocity maps show general subsidence in the whole Vesuvian area, westward displacement in a lobe east of Vesuvio, and eastward displacement in a lobe west of Vesuvio. Thus, it probably includes both spreading and a new phenomenon that began around 2001–2002. The second EOF mode and the difference between post-2002 and pre-2001 ground velocities demonstrate a ground deformation field that is fully consistent with the deflation of a several-kilometres-deep pressurised cavity. Deep deflation is also in agreement with Vesuvio seismic and geochemical data. We do not invoke volcano sagging into a low-viscosity underlying ductile layer—as suggested by [37] based on mean 1992–2010 ground velocities—because of the sudden onset of post-2002 subsidence.
The coincidence between the transition from deflation to inflation at Campi Flegrei and the onset of deflation at Vesuvio may suggest the possible transfer of magma and/or magmatic fluids between the two plumbing systems. What drives the inflation of CF and how does that relate to the coincidental deflation of Vesuvio in terms of fluid mechanics? Maybe a degassing–depressurisation mechanism (e.g., [64]) is involved; however, we think that answering this question requires more data, not only geodetic: data from experimental petrology, geochemistry, seismology, etc., covering a long period of time, would also be needed. In the near future, we aim to extend our analysis to ground displacement times series after 2010 using Sentinel-1 and, if made available, TerraSar-X imagery, obtain more reliable characteristics of the deflating source, and hopefully clarify whether there has been an increase in the Vesuvio deflation rate corresponding to the Campi Flegrei uplift acceleration occurring since 2010.

Author Contributions

Conceptualisation, A.A. and L.C.; methodology, A.A. and L.C.; software, A.A. and L.C.; formal analysis, A.A. and L.C.; investigation, A.A.; writing—original draft preparation, A.A.; writing—review and editing, A.A. and L.C.; visualisation, A.A. and L.C.; supervision, A.A. All authors have read and agreed to the published version of the manuscript.

Funding

This research was funded by the University of Salerno, grant number 300391FRB20AMORU.

Data Availability Statement

Figures were produced using the open–source software GMT v. 6.3.0 (https://www.generic-mapping-tools.org/, accessed on 7 June 2023), Veusz v. 3.6.2 (https://veusz.github.io/, accessed on 7 June 2023), and Inkscape v. 1.1.2 (https://inkscape.org/, accessed on 7 June 2023). ERS-ENVISAT ground displacement time series were taken from [15]. Levelling data were obtained from the plots in [34]. GPS data are from [11]. TINITALY/01 DEM can be downloaded from http://tinitaly.pi.ingv.it/ (accessed on 7 June 2023). Historical urbanisation data can be downloaded from http://dati-censimentopopolazione.istat.it/ (accessed on 7 June 2023).

Acknowledgments

We thank R. Lanari (IREA-CNR, Napoli, Italy) for providing the DInSAR LOS ground displacement time series and V. Acocella for very helpful discussions. We are also grateful to the authors and maintainers of the open-source software used in this work.

Conflicts of Interest

The authors declare no conflict of interest. The funders had no role in the design of the study; in the collection, analyses, or interpretation of data; in the writing of the manuscript; or in the decision to publish the results.

Abbreviations

The following abbreviations are used in this manuscript:
SARsynthetic aperture radar
SBASSmall BAseline Subset
DInSARdifferential synthetic aperture radar interferometry
LOSline of sight
DEMdigital elevation model
GPSGlobal Positioning System
NeVoCGPSNeapolitan Volcanoes Continuous GPS network
EOFempirical orthogonal functions
ECExpansion Coefficients
PCAprincipal component analysis
SVDsingular value decomposition

References

  1. Biggs, J.; Robertson, E.; Cashman, K. The lateral extent of volcanic interactions during unrest and eruption. Nat. Geosci. 2016, 9, 308–311. [Google Scholar] [CrossRef] [Green Version]
  2. Miklius, A.; Cervelli, P. Interaction between Kilauea and Mauna Loa. Nature 2003, 421, 229. [Google Scholar] [CrossRef] [PubMed] [Green Version]
  3. Gonnermann, H.M.; Foster, J.H.; Poland, M.; Wolfe, C.J.; Brooks, B.A.; Miklius, A. Coupling at Mauna Loa and Kilauea by stress transfer in an asthenospheric melt layer. Nat. Geosci. 2012, 5, 826–829. [Google Scholar] [CrossRef]
  4. Brothelande, E.; Amelung, F.; Yunjun, Z.; Wdowinski, S. Geodetic evidence for interconnectivity between Aira and Kirishima magmatic systems, Japan. Sci. Rep. 2018, 8, 9811. [Google Scholar] [CrossRef] [Green Version]
  5. Acocella, V.; Palladino, D.; Cioni, R.; Russo, P.; Simei, S. Caldera structure, amount of collapse, and erupted volumes: The case of Bolsena caldera, Italy. GSA Bull. 2012, 124, 1562–1576. [Google Scholar] [CrossRef]
  6. Amoruso, A.; Crescentini, L. Clues of Ongoing Deep Magma Inflation at Campi Flegrei Caldera (Italy) from Empirical Orthogonal Function Analysis of SAR Data. Remote Sens. 2022, 14, 5698. [Google Scholar] [CrossRef]
  7. Di Vito, M.A.; Isaia, R.; Orsi, G.; Southon, J.; de Vita, S.; D’Antonio, M.; Pappalardo, L.; Piochi, M. Volcanism and deformation since 12000 years at the Campi Flegrei caldera (Italy). J. Volcanol. Geotherm. Res. 1999, 91, 221–246. [Google Scholar] [CrossRef]
  8. Smith, V.C.; Isaia, R.; Pearce, N. Tephrostratigraphy and glass compositions of post-15 kyr Campi Flegrei eruptions: Implications for eruption history and chronostratigraphic markers. Quat. Sci. Rev. 2011, 30, 3638–3660. [Google Scholar] [CrossRef]
  9. Guidoboni, E.; Ciuccarelli, C. The Campi Flegrei caldera: Historical revision and new data on seismic crises, bradyseisms, the Monte Nuovo eruption and ensuing earthquakes (twelfth century 1582 ad). Bull. Volcanol. 2011, 73, 655–677. [Google Scholar] [CrossRef]
  10. Del Gaudio, C.; Aquino, I.; Ricciardi, G.P.; Ricco, C.; Scandone, R. Unrest episodes at Campi Flegrei: A reconstruction of vertical ground movements during 1905–2009. J. Volcanol. Geotherm. Res. 2010, 185, 48–56. [Google Scholar] [CrossRef]
  11. De Martino, P.; Dolce, M.; Brandi, G.; Scarpato, G.; Tammaro, U. The Ground Deformation History of the Neapolitan Volcanic Area (Campi Flegrei Caldera, Somma–Vesuvius Volcano, and Ischia Island) from 20 Years of Continuous GPS Observations (2000–2019). Remote Sens. 2021, 13, 2725. [Google Scholar] [CrossRef]
  12. Rosi, M.; Acocella, V.; Cioni, R.; Bianco, F.; Costa, A.; De Martino, P.; Giordano, G.; Inguaggiato, S. Defining the Pre-Eruptive States of Active Volcanoes for Improving Eruption Forecasting. Front. Earth Sci. 2022, 10, 795700. [Google Scholar] [CrossRef]
  13. TINITALY, 10 m-Cell Size Grid. Available online: http://tinitaly.pi.ingv.it/Download_Area2.html (accessed on 17 August 2022).
  14. Orsi, G.; Civetta, L.; Del Gaudio, C.; de Vita, S.; Di Vito, M.; Isaia, R.; Petrazzuoli, S.; Ricciardi, G.; Ricco, C. Short-term ground deformations and seismicity in the resurgent Campi Flegrei caldera Italy: An example of active block-resurgence in a densely populated area. J. Volcanol. Geotherm. Res. 1999, 91, 415–451. [Google Scholar] [CrossRef]
  15. Amoruso, A.; Crescentini, L.; Sabbetta, I. Paired deformation sources of the Campi Flegrei caldera (Italy) required by recent (1980–2010) deformation history. J. Geophys. Res. Solid Earth 2014, 119, 858–879. [Google Scholar] [CrossRef]
  16. Amoruso, A.; Crescentini, L.; Sabbetta, I.; De Martino, P.; Obrizzo, F.; Tammaro, U. (Clues to the cause of the 2011–2013 Campi Flegrei caldera unrest, Italy, from continuous GPS data. Geophys. Res. Lett. 2014, 41, 3081–3088. [Google Scholar] [CrossRef]
  17. Amoruso, A.; Crescentini, L.; D’Antonio, M.; Acocella, V. Thermally-assisted magma emplacement explains restless calderas. Sci. Rep. 2017, 7, 7948. [Google Scholar] [CrossRef] [PubMed] [Green Version]
  18. De Siena, L.; Amoruso, A.; Pezzo, E.D.; Wakeford, Z.; Castellano, M.; Crescentini, L. Space-weighted seismic attenuation mapping of the aseismic source of Campi Flegrei 1983–1984 unrest. Geophys. Res. Lett. 2017, 44, 1740–1748. [Google Scholar] [CrossRef] [Green Version]
  19. De Siena, L.; Chiodini, G.; Vilardo, G.; Del Pezzo, E.; Castellano, M.; Colombelli, S.; Tisato, N.; Ventura, G. Source and dynamics of a volcanic caldera unrest: Campi Flegrei, 1983–1984. Sci. Rep. 2017, 7, 8099. [Google Scholar] [CrossRef] [Green Version]
  20. Troise, C.; De Natale, G.; Schiavone, R.; Somma, R.; Moretti, R. The Campi Flegrei caldera unrest: Discriminating magma intrusions from hydrothermal effects and implications for possible evolution. Earth Sci. Rev. 2019, 188, 108–122. [Google Scholar] [CrossRef]
  21. D’Auria, L.; Pepe, S.; Castaldo, R.; Giudicepietro, F.; Macedonio, G.; Ricciolino, P.; Tizzani, P.; Casu, F.; Lanari, R.; Manzo, M.; et al. Magma injection beneath the urban area of Naples: A new mechanism for the 2012–2013 volcanic unrest at Campi Flegrei caldera. Sci. Rep. 2015, 5, 13100. [Google Scholar] [CrossRef] [Green Version]
  22. Buono, G.; Paonita, A.; Pappalardo, L.; Caliro, S.; Tramelli, A.; Chiodini, G. New insights into the recent magma dynamics under Campi Flegrei caldera (Italy) from petrological and geochemical evidence. J. Geophys. Res. Solid Earth 2022, 127, e2021JB023773. [Google Scholar] [CrossRef]
  23. Zollo, A.; Maercklin, N.; Vassallo, M.; Dello Iacono, D.; Virieux, J.; Gasparini, P. Seismic reflections reveal a massive melt layer feeding Campi Flegrei caldera. Geophys. Res. Lett. 2008, 35, L12306. [Google Scholar] [CrossRef] [Green Version]
  24. Fedi, M.; Cella, F.; D’Antonio, M.; Florio, G.; Paoletti, V.; Morra, V. Gravity modeling finds a large magma body in the deep crust below the Gulf of Naples, Italy. Sci. Rep. 2018, 8, 8229. [Google Scholar] [CrossRef]
  25. Petrelli, M.; López, M.A.; Pisello, A.; Perugini, D. Pre-eruptive dynamics at the Campi Flegrei Caldera: From evidence of magma mixing to timescales estimates. Earth Planets Space 2023, 75, 19. [Google Scholar] [CrossRef]
  26. D’Auria, L.; Giudicepietro, F.; Aquino, I.; Borriello, G.; Del Gaudio, C.; Lo Bascio, D.; Martini, M.; Ricciardi, G.P.; Ricciolino, P.; Ricco, C. Repeated fluid-transfer episodes as a mechanism for the recent dynamics of Campi Flegrei caldera (1989–2010). J. Geophys. Res. 2011, 116, B04313. [Google Scholar] [CrossRef]
  27. Giudicepietro, F.; Ricciolino, P.; Bianco, F.; Caliro, S.; Cubellis, E.; D’Auria, L.; De Cesare, W.; De Martino, P.; Esposito, A.M.; Galluzzo, D.; et al. Campi Flegrei, Vesuvius and Ischia Seismicity in the Context of the Neapolitan Volcanic Area. Front. Earth Sci. 2021, 9, 662113. [Google Scholar] [CrossRef]
  28. Vanorio, T.; Kanitpanyacharoen, W. Rock physics of fibrous rocks akin to Roman concrete explains uplifts at Campi Flegrei Caldera. Science 2015, 349, 617–621. [Google Scholar] [CrossRef]
  29. Cioni, R.; Santacroce, R.; Sbrana, A. Pyroclastic deposits as a guide for reconstructing the multi-stage evolution of the Somma-Vesuvius caldera. Bull. Volcanol. 1999, 60, 207–222. [Google Scholar] [CrossRef]
  30. Cioni, R.; Bertagnini, A.; Santacroce, R.; Andronico, D. Explosive activity and eruption scenarios at Somma-Vesuvius (Italy): Towards a new classification scheme. J. Volcanol. Geotherm. Res. 2008, 178, 331–346. [Google Scholar] [CrossRef]
  31. Scaillet, B.; Cioni, R.; Pichavant, M. Upward migration of Vesuvius magma chamber over the past 20,000 years. Nature 2008, 455, 216–219. [Google Scholar] [CrossRef] [Green Version]
  32. Balcone-Boissard, H.; Boudon, G.; Cioni, R.; Webster, J.D.; Zdanowicz, G.; Orsi, G.; Civetta, L. Chlorine as a geobarometer for alkaline magmas: Evidence from a systematic study of the eruptions of Mount Somma-Vesuvius. Sci. Rep. 2016, 6, 21726. [Google Scholar] [CrossRef] [PubMed] [Green Version]
  33. Di Stefano, R.; Chiarabba, C. Active source tomography at Mt. Vesuvius: Constraints for the magmatic system. J. Geophys. Res. 2002, 107, 2278. [Google Scholar] [CrossRef]
  34. Pingue, F.; Bottiglieri, M.; Godano, C.; Obrizzo, F.; Tammaro, U.; Esposito, T.; Serio, C. Spatial and temporal distribution of vertical ground movements at Mt. Vesuvius in the period 1973–2009. Ann. Geophys. 2013, 56, S0451-18. [Google Scholar] [CrossRef]
  35. Lanari, R.; De Natale, G.; Berardino, P.; Sansosti, E.; Ricciardi, G.P.; Borgstrom, S.; Capuano, P.; Pingue, F.; Troise, C. Evidence for a peculiar style of ground deformation inferred at Vesuvius volcano. Geophys. Res. Lett. 2002, 29, 1292. [Google Scholar] [CrossRef]
  36. Borgia, A.; Tizzani, P.; Solaro, G.; Manzo, M.; Casu, F.; Luongo, G.; Pepe, A.; Berardino, P.; Fornaro, G.; Sansosti, E.; et al. Volcanic spreading of Vesuvius, a new paradigm for interpreting its volcanic activity. Geophys. Res. Lett. 2005, 32, L03303. [Google Scholar] [CrossRef]
  37. De Matteo, A.; Massa, B.; Castaldo, R.; D’Auria, L.; James, M.R.; Lane, S.J.; Pepe, S.; Tizzani, P. An integrated modeling approach for analyzing the deformation style of active volcanoes: Somma-Vesuvius case study. J. Geophys. Res. Solid Earth 2022, 127, e2021JB022338. [Google Scholar] [CrossRef]
  38. Samsonov, S.V.; Trishchenko, A.P.; Tiampo, K.; González, P.J.; Zhang, Y.; Fernández, J. Removal of systematic seasonal atmospheric signal from interferometric synthetic aperture radar ground deformation time series. Geophys. Res. Lett. 2014, 41, 6123–6130. [Google Scholar] [CrossRef] [Green Version]
  39. Holohan, E.P.; Poppe, S.; Delcamp, A.; Byrne, P.K.; Walter, T.R.; van Wyk de Vries, B.; Kervyn, M. Transition from volcano-sagging to volcano-spreading. Earth Planet. Sci. Lett. 2023, 604, 118012. [Google Scholar] [CrossRef]
  40. De Natale, G.; Petrazzuoli, S.M.; Troise, C.; Pingue, F.; Capuano, P. Internal stress field at Mount Vesuvius- A model for background seismicity at a central volcano. J. Geophys. Res. 2000, 105, 16207–16214. [Google Scholar] [CrossRef]
  41. Zollo, A.; Marzocchi, W.; Capuano, P.; Lomax, A.; Iannaccone, G. Space and time behaviour of seismic activity and Mt. Vesuvius volcano, Southern Italy. Bull. Seismol. Soc. Am. 2002, 92, 625–640. [Google Scholar] [CrossRef]
  42. Scarpa, R.; Tronca, F.; Bianco, F.; Del Pezzo, E. High resolution velocity structure beneath Mount Vesuvius from seismic array data. Geophys. Res. Lett. 2002, 29, 2040. [Google Scholar] [CrossRef]
  43. D’Auria, L.; Esposito, A.M.; Lo Bascio, D.; Ricciolino, P.; Giudicepietro, F.; Martini, M.; Caputo, T.; De Cesare, W.; Orazi, M.; Peluso, R.; et al. Vesuvius: Inference on seismogenic processes. Ann. Geophys. 2013, 56, S0442. [Google Scholar] [CrossRef]
  44. Auger, E.; Gasparini, P.; Virieux, J.; Zollo, A. Seismic Evidence of an Extended Magmatic Sill under Mt. Vesuvius. Science 2001, 294, 1510–1512. [Google Scholar] [CrossRef]
  45. Zollo, A.; Gasparini, P.; Virieux, J.; le Meur, H.; De Natale, G.; Biella, G.; Boschi, E.; Capuano, P.; De Franco, R.; Dell’Aversana, P.; et al. Seismic Evidence for a Low-Velocity Zone in the Upper Crust Beneath Mount Vesuvius. Science 1996, 274, 592–594. [Google Scholar] [CrossRef]
  46. Nunziata, C.; Natale, M.; Luongo, G.; Panza, G.F. Magma reservoir at Mt. Vesuvius: Size of the hot, partially molten, crust material detected deeper than 8 km. Earth Planet. Sci. Lett. 2006, 242, 51–57. [Google Scholar] [CrossRef]
  47. Federico, C.; Madonia, P.; Cusano, P.; Petrosino, S. Groundwater geochemistry of the Mt. Vesuvius area: Implications for volcano surveillance and relationship with hydrological and seismic signals. Ann. Geophys. 2013, 56, S0447. [Google Scholar] [CrossRef]
  48. Ricco, C.; Petrosino, S.; Aquino, I.; Cusano, P.; Madonia, P. Tracking the recent dynamics of Mt. Vesuvius from joint investigations of ground deformation, seismicity and geofluid circulation. Sci. Rep. 2021, 11, 965. [Google Scholar] [CrossRef]
  49. Caliro, S.; Chiodini, G.; Avino, R.; Minopoli, C.; Bocchino, B. Long time-series of chemical and isotopic compositions of Vesuvius fumaroles: Evidence for deep and shallow processes. Ann. Geophys. 2011, 54, 137–149. [Google Scholar] [CrossRef]
  50. Pappalardo, L.; Mastrolorenzo, G. Rapid Differentiation in a Sill-like Magma Reservoir: A Case Study from the Campi Flegrei Caldera. Sci. Rep. 2012, 2, 712. [Google Scholar] [CrossRef] [Green Version]
  51. Esposito, A.M.; Alaia, G.; Giudicepietro, F.; Pappalardo, L.; D’Antonio, M. Unsupervised Geochemical Analysis of the Eruptive Products of Ischia, Vesuvius and Campi Flegrei. In Progresses in Artificial Intelligence and Neural Systems. Smart Innovation, Systems and Technologies; Esposito, A., Faundez-Zanuy, M., Morabito, F., Pasero, E., Eds.; Springer: Singapore, 2020; Volume 189, pp. 175–184. [Google Scholar] [CrossRef]
  52. Esposito, A.M.; De Bernardo, A.; Ferrara, S.; Giudicepietro, F.; Pappalardo, L. SOM-Based Analysis of Volcanic Rocks: An Application to Somma–Vesuvius and Campi Flegrei Volcanoes (Italy). In Neural Approaches to Dynamics of Signal Exchanges. Smart Innovation, Systems and Technologies; Esposito, A., Faundez-Zanuy, M., Morabito, F., Pasero, E., Eds.; Springer: Singapore, 2020; Volume 151, pp. 55–60. [Google Scholar] [CrossRef]
  53. Walter, T.R.; Shirzaei, M.; Manconi, A.; Solaro, G.; Pepe, A.; Manzo, M.; Sansosti, E. Possible coupling of Campi Flegrei and Vesuvius as revealed by InSAR time series, correlation analysis and time dependent modeling. J. Volcanol. Geotherm. Res. 2014, 280, 104–110. [Google Scholar] [CrossRef]
  54. Ers Mission Description. Available online: Https://earth.esa.int/eogateway/missions/ers (accessed on 17 March 2023).
  55. Envisat Mission Description. Available online: Https://earth.esa.int/eogateway/missions/envisat (accessed on 17 March 2023).
  56. Berardino, P.; Fornaro, G.; Lanari, R.; Sansosti, E. A New Algorithm for Surface Deformation Monitoring Based on Small Baseline Differential SAR Interferograms. IEEE Trans. Geosci. Remote Sens. 2002, 40, 2375–2383. [Google Scholar] [CrossRef] [Green Version]
  57. Casu, F.; Manzo, M.; Lanari, R. A quantitative assessment of the SBAS algorithm performance for surface deformation retrieval from DInSAR data. Remote Sens. Environ. 2006, 102, 195–210. [Google Scholar] [CrossRef]
  58. Mogi, K. Relations between the eruptions of various volcanoes and the deformations of the ground surface around them. Bull. Earthq. Res. Inst. Univ. Tokyo 1958, 36, 99–134. [Google Scholar]
  59. Navarra, A.; Simoncini, V. A Guide to Empirical Orthogonal Functions for Climate Data Analysis; Springer: Dordrecht, The Nederlands, 2010; p. 151. ISBN 978-90-481-3701-5. [Google Scholar]
  60. Tiampo, K.F.; González, P.J.; Samsonov, S.; Fernández, J.; Camacho, A. Principal component analysis of MSBAS DInSAR time series from Campi Flegrei, Italy. J. Volcanol. Geotherm. Res. 2017, 344, 139–153. [Google Scholar] [CrossRef] [Green Version]
  61. Thiiébaux, H.J.; Zwiers, F.W. The interpretation and estimation of effective sample sizes. J. Clim. Appl. Meteorol. 1984, 23, 800–811. [Google Scholar] [CrossRef]
  62. Ingber, L. Simulated annealing: Practice versus theory. Math. Comput. Modell. 1993, 18, 29–57. [Google Scholar] [CrossRef] [Green Version]
  63. ISTAT. Available online: http://dati-censimentopopolazione.istat.it/ (accessed on 17 April 2023).
  64. Girona, T.; Costa, F.; Newhall, C.; Taisne, B. On depressurization of volcanic magma reservoirs by passive degassing. J. Geophys. Res. Solid Earth 2014, 119, 8667–8687. [Google Scholar] [CrossRef]
Figure 2. Ground level changes at Rione Terra (R in Figure 1a)—i.e., in the area of maximum vertical displacement—from 1980 to 2022. Red dots, levelling data [15]. Green and magenta pluses, approximate median vertical displacement (Section 2.1) inside a 200 m radius circular area from ERS/ENVISAT and Sentinel-1A images, respectively. Blue crosses, GPS vertical displacement [11].
Remotesensing 15 03038 g002
Figure 3. Times of displacement data. Red and blue circles, acquisition dates of the ascending- and descending-orbit images and times of the corresponding LOS displacements. Green circles, times of the computed approximate eastward and upward displacements.
Remotesensing 15 03038 g003
Figure 4. Synthetic ground displacements caused by the deflation of a very small (point) pressurised spherical cavity (Mogi source) embedded in a homogeneous elastic half-space whose Poisson’s ratio is 0.25. LOS incidence and azimuthal angles are 23.9° and −12°, respectively, for the ascending orbit and 20.5° and 192° for the descending orbit. Displacements are divided by the absolute value of the vertical displacement at (0,0), thus making all the plots independent of the source volume change. Coordinates (x, y) are normalised by the source depth d, thus making all the plots independent of the source depth. The contour interval is 0.1. The black star in (0,0) indicates the source centre. (a) Ascending-orbit LOS displacement. (b) Descending-orbit LOS displacement. (c) Upward displacement. (d) Eastward displacement; northward displacement can be obtained after rotating the map by 90° in the anticlockwise direction. (e) Approximate upward displacement estimated from (a,b). (f) Approximate eastward displacement estimated from (a,b). Approximate upward displacements (e) are very similar to the exact synthetic ones (c), but contour lines are shifted southward (i.e., toward negative y). The approximate eastward displacement map (f) is practically indistinguishable from the exact synthetic eastward displacements (d).
Remotesensing 15 03038 g004aRemotesensing 15 03038 g004b
Figure 5. Comparison of levelling data [34] and ERS/ENVISAT approximate upward displacements. First, we referenced DInSAR LOS displacements to their median value within a circular area, 250 m in radius, centred on the NA001 reference levelling benchmark (green dot in (a)). Then, we obtained the time series of the DInSAR approximate upward displacements by combining LOS displacements as if northward ground displacement did not contribute and computing the median values within circular areas, 250 m in radius, centred on the levelling benchmarks. (a) Blue dots and labels, levelling benchmarks whose altitude time series are plotted with respect to NA001 in [34]. (bq) Blue dots, levelling data; red dots, DInSAR approximate upward displacements. Levelling data errors are lower than ± 2.5 × L mm, where L is the length in kilometres of each levelling section. The vertical bar corresponds to 1 cm vertical displacement.
Remotesensing 15 03038 g005
Figure 6. Comparison of cGPS [11] and ERS/ENVISAT DInSAR displacements. First, we referenced DInSAR displacements to the median value within a circular area, 500 m in radius, centred on the LICO GPS station (L in Figure 1); LICO is far from Campi Flegrei and Vesuvio and has a small almost-constant velocity with respect to six stations located outside the Neapolitan volcanic area, whose velocities are expected to reflect the regional tectonic motion [11]. Then, we added the LICO GPS linear trends—0.05 cm/year and −0.12 cm/year along the ascending- and descending-orbit LOS directions, respectively—to each DInSAR displacement time series, obtained by computing the median values within circular areas, 500 m in radius, centred on the cGPS stations. (a) Blue dots and labels, cGPS Vesuvio stations that are located in areas covered by SAR data and started operating before 2006 [11]. (bm) Blue dots, daily cGPS displacements projected along DInSAR LOS directions; red dots, DInSAR displacements. The vertical bar corresponds to 1 cm displacement.
Remotesensing 15 03038 g006
Figure 7. Mean displacement rate from SAR data between 1992 and 2010. (a) Ascending orbit, LOS direction. (b) Descending orbit, LOS direction. (c) Approximate upward displacement obtained by combining LOS displacements as if northward ground displacement did not contribute. (d) Approximate eastward displacement obtained by combining LOS displacements as if northward ground displacement did not contribute. Each velocity component is referenced to its median value inside the area enclosed by the red polygon. Magenta stars in (ad) give the centre of the circular areas used for the EOF analyses. The two black circles in (c) indicate the two most prominent subsidence spots around Vesuvio (see also Figure 8). No significant feature is visible in (d) close to those two subsidence spots.
Remotesensing 15 03038 g007
Figure 8. Rate of construction of new buildings in the most prominent subsidence spots around Vesuvio. (a) Same as Figure 7c; in addition, dark red and light green dots as well as labels “1” and “2” indicate the two subsidence spots bounded by the black circles in Figure 7c; the magenta dot and label “3” indicate an additional further-north subsidence spot. Black polygons surround the municipalities of Volla (V), Cercola (C), and San Gennaro Vesuviano (S). The magenta rectangle encloses the area zoomed in (d,e). (b) Approximate mean upward displacements within the three circular areas, 500 m in radius, centred on the three dots—dark red, light green, and magenta—in (a). (c) Urbanisation rates (number of new buildings per year) at Volla, Cercola, and San Gennaro Vesuviano during different time periods (data from the Italian National Institute for Statistics [63]). (d) December 1985 satellite image of the area enclosed by the magenta rectangle in (a) (map data: Google, ©2022 Landsat/Copernicus). (e) August 2002 satellite image of the area enclosed by the magenta rectangle in (a) (map data: Google, ©2022 Landsat/Copernicus).
Remotesensing 15 03038 g008
Figure 9. Expansion Coefficients (ECs) and eigenvalues for the first EOF modes. The EOF analysis of the 1992–2010 displacement time series was carried out inside a circular area of radius R centred on the magenta star in Figure 7. The error bars in the eigenvalue plots give uncertainties. (a,b) Joint EOF analysis of ascending and descending LOS displacements, R = 15,000 m. (c,d) Joint EOF analysis of ascending and descending LOS displacements, R = 9000 m. (e,f) Joint EOF analysis of approximate upward and eastward displacements, R = 15,000 m. (g,h) Joint EOF analysis of approximate upward and eastward displacements, R = 9000 m. Green-framed insets in (b,d,f,h) zoom out the y-axis to show the lack of significance for modes higher than 2.
Remotesensing 15 03038 g009
Figure 10. Maps of the second mode EOF coefficients. The EOF analysis of the 1992–2010 displacement time series was carried out inside a circular area, 9000 m in radius, centred on the magenta star in Figure 7, in order to exclude the “girdle” of discontinuous strong subsidence approximately 10 km from the Vesuvio summit. (a) EOF coefficients for the ascending-orbit LOS displacements, obtained from the joint EOF analysis of ascending and descending LOS displacements; (b) EOF coefficients for the descending-orbit LOS displacements, obtained from the joint EOF analysis of ascending and descending LOS displacements; (c) EOF coefficients for the approximate upward displacements, obtained from the joint EOF analysis of approximate upward and eastward LOS displacements; (d) EOF coefficients for the approximate eastward displacements, obtained from the joint EOF analysis of approximate upward and eastward LOS displacements. (e,f) Computed ascending- and descending-orbit LOS displacements caused by the depressurisation of a very small (point) spheroidal cavity embedded in a homogeneous elastic half-space whose Poisson’s ratio is 0.25; source depth is 7300 m; polar-to-equatorial radius is 1.1; the magenta square gives the source position.
Remotesensing 15 03038 g010
Figure 11. Mean ground LOS velocities from pre-2001 and post-2002 SAR data. Each velocity component is referenced to its median value inside the area enclosed by the red polygon. (a,c) Pre-2001 velocity. (b,d) Post-2002 velocity. (a,b) Ascending orbit. (c,d) Descending orbit.
Remotesensing 15 03038 g011
Figure 12. Approximate mean upward and eastward ground velocities from pre-2001 and post-2002 SAR data. Each velocity component is referenced to its median value inside the area enclosed by the red polygon. (a,c) Pre-2001 velocity. (b,d) Post-2002 velocity. (a,b) Approximate upward displacement. (c,d) Approximate eastward displacement. Green arrows in (b,d) give post-2002 upward and horizontal cGPS velocities, respectively, with respect to six stations located outside the Neapolitan volcanic area [11]; TERZ velocity seems somewhat anomalous.
Remotesensing 15 03038 g012
Figure 13. Difference between post-2002 and pre-2001 mean velocities. Each velocity component is referenced to its median value inside the area enclosed by the red polygon. (a) Ascending orbit, LOS direction. (b) Descending orbit, LOS direction. (c) Approximate upward displacement. (d) Approximate eastward displacement.
Remotesensing 15 03038 g013
Disclaimer/Publisher’s Note: The statements, opinions and data contained in all publications are solely those of the individual author(s) and contributor(s) and not of MDPI and/or the editor(s). MDPI and/or the editor(s) disclaim responsibility for any injury to people or property resulting from any ideas, methods, instructions or products referred to in the content.

