

Insights into the Magmatic Feeding System of the 2021 Eruption at Cumbre Vieja (La Palma, Canary Islands) Inferred from Gravity Data Modeling
 , , , , , ,
  and
and
Abstract
:1. Introduction
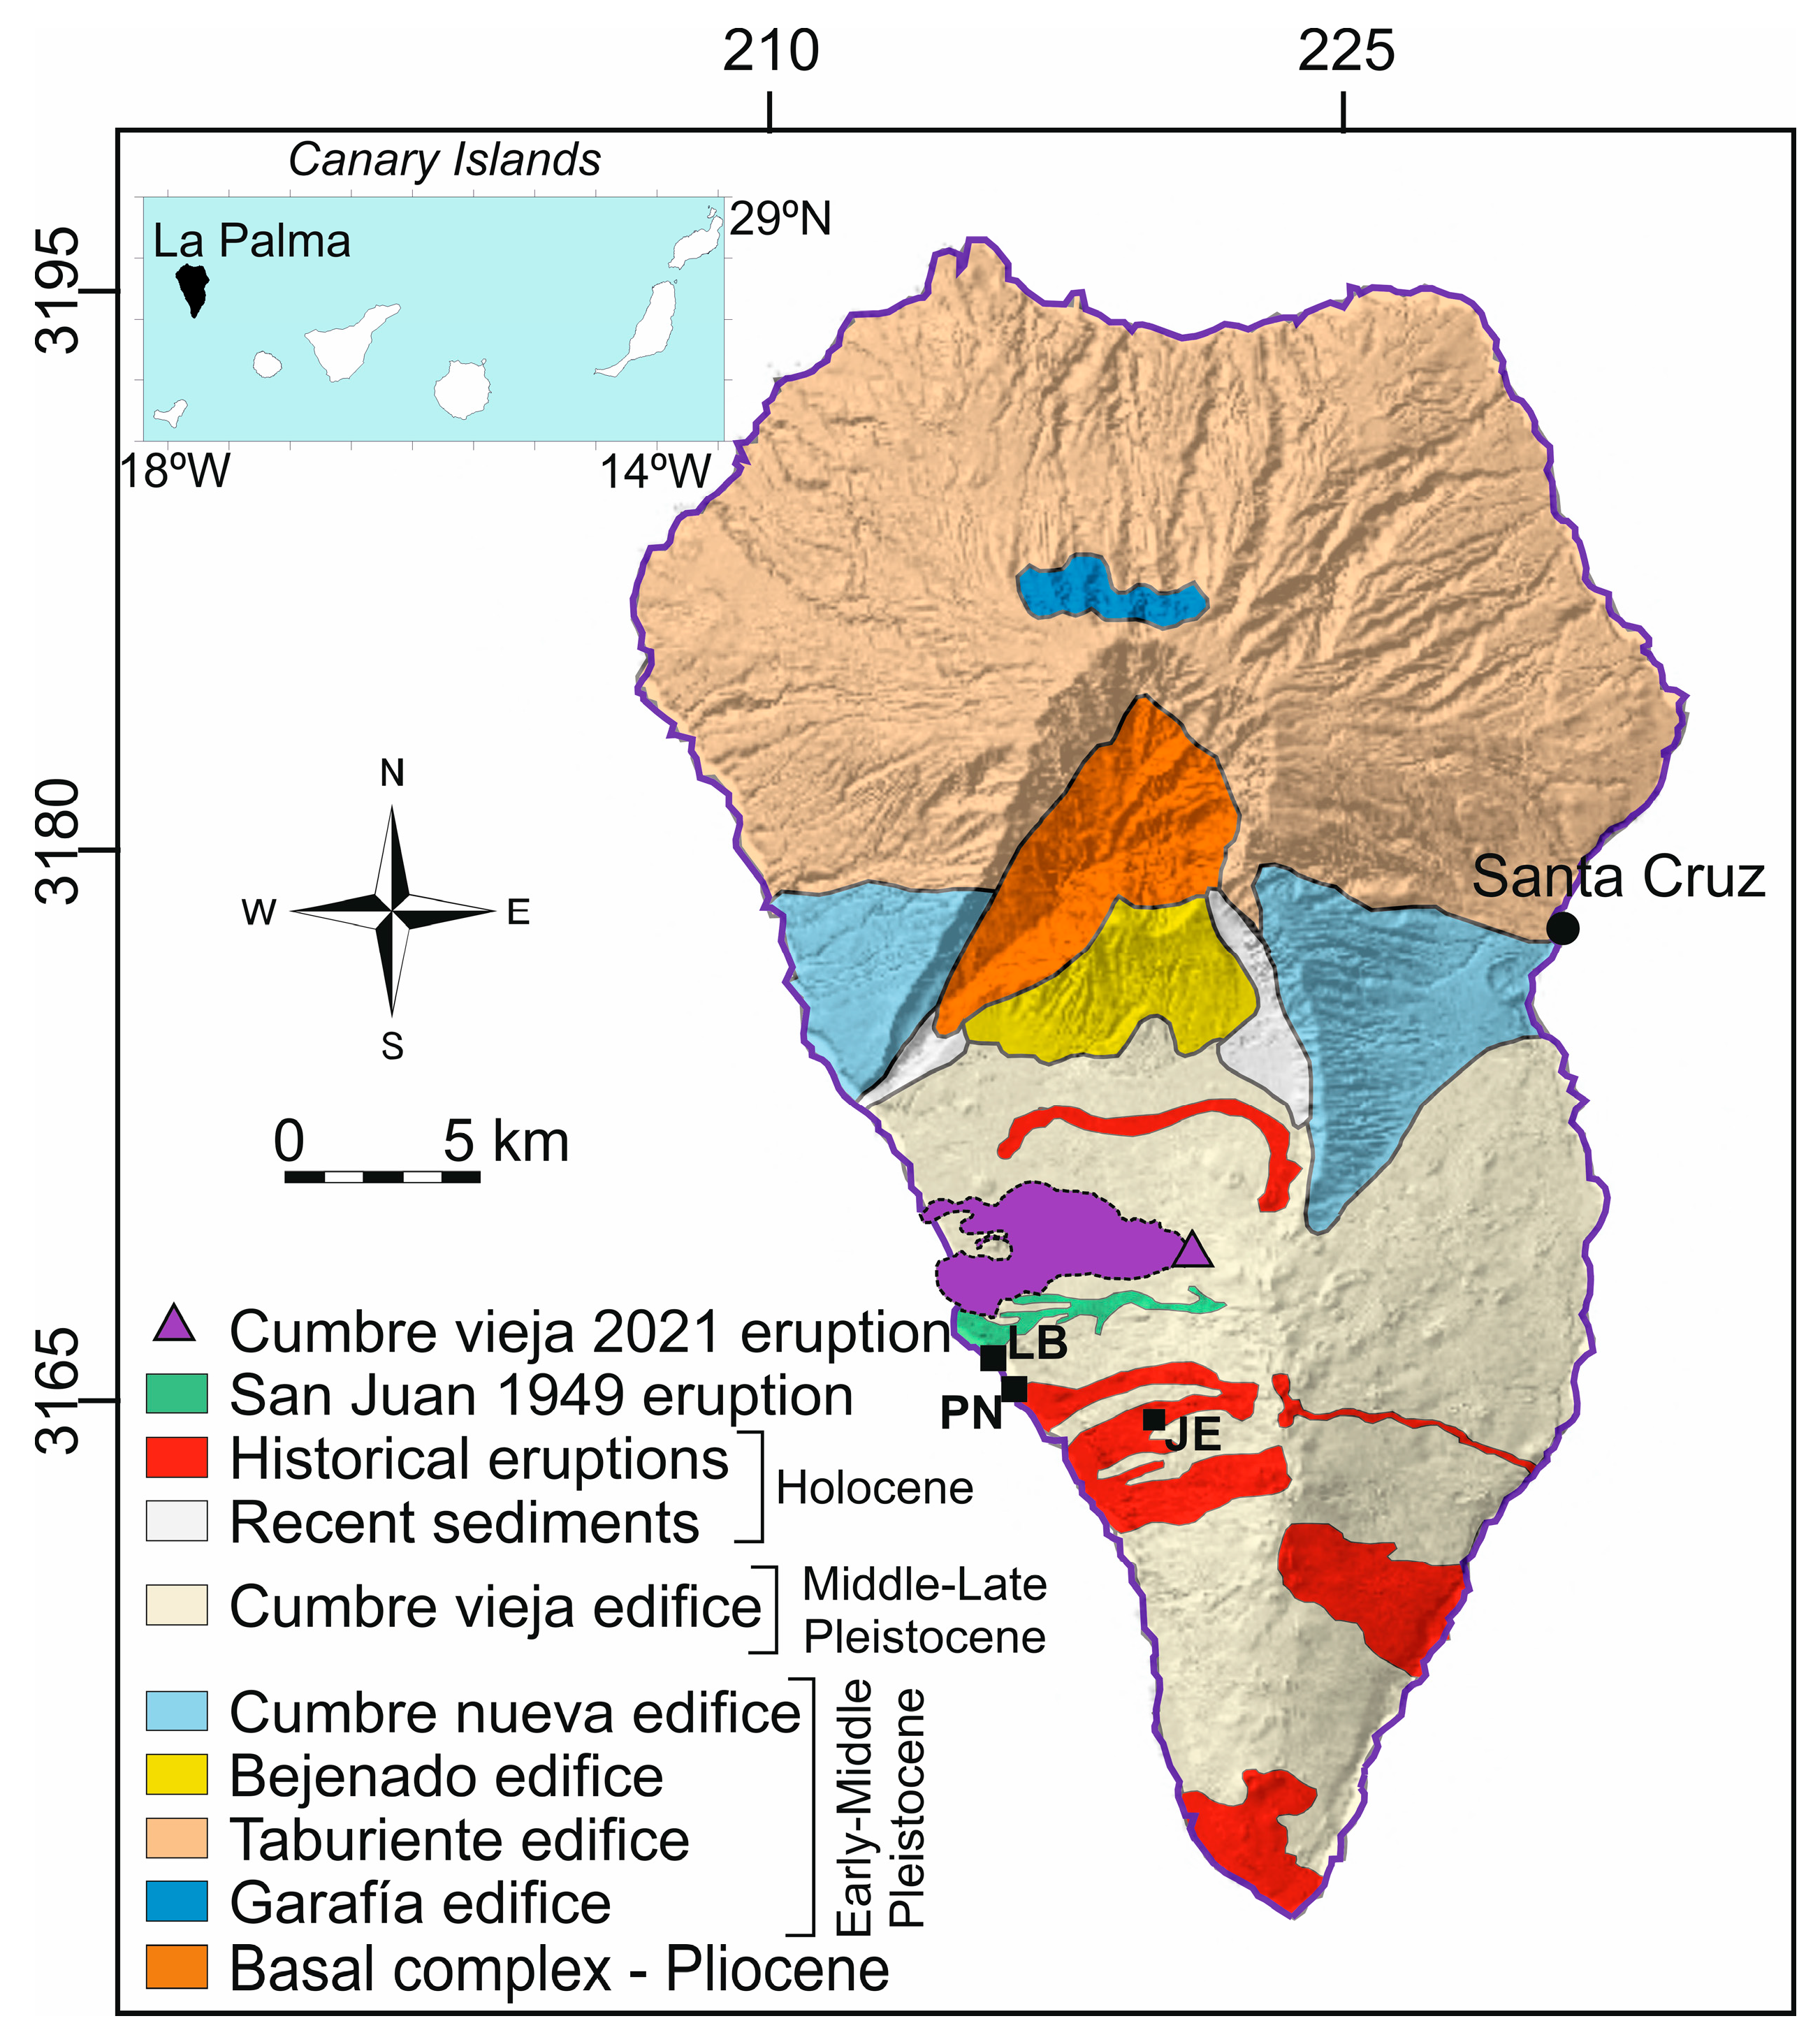
2. The 2021 Volcanic Eruption in La Palma
3. Data and Methods
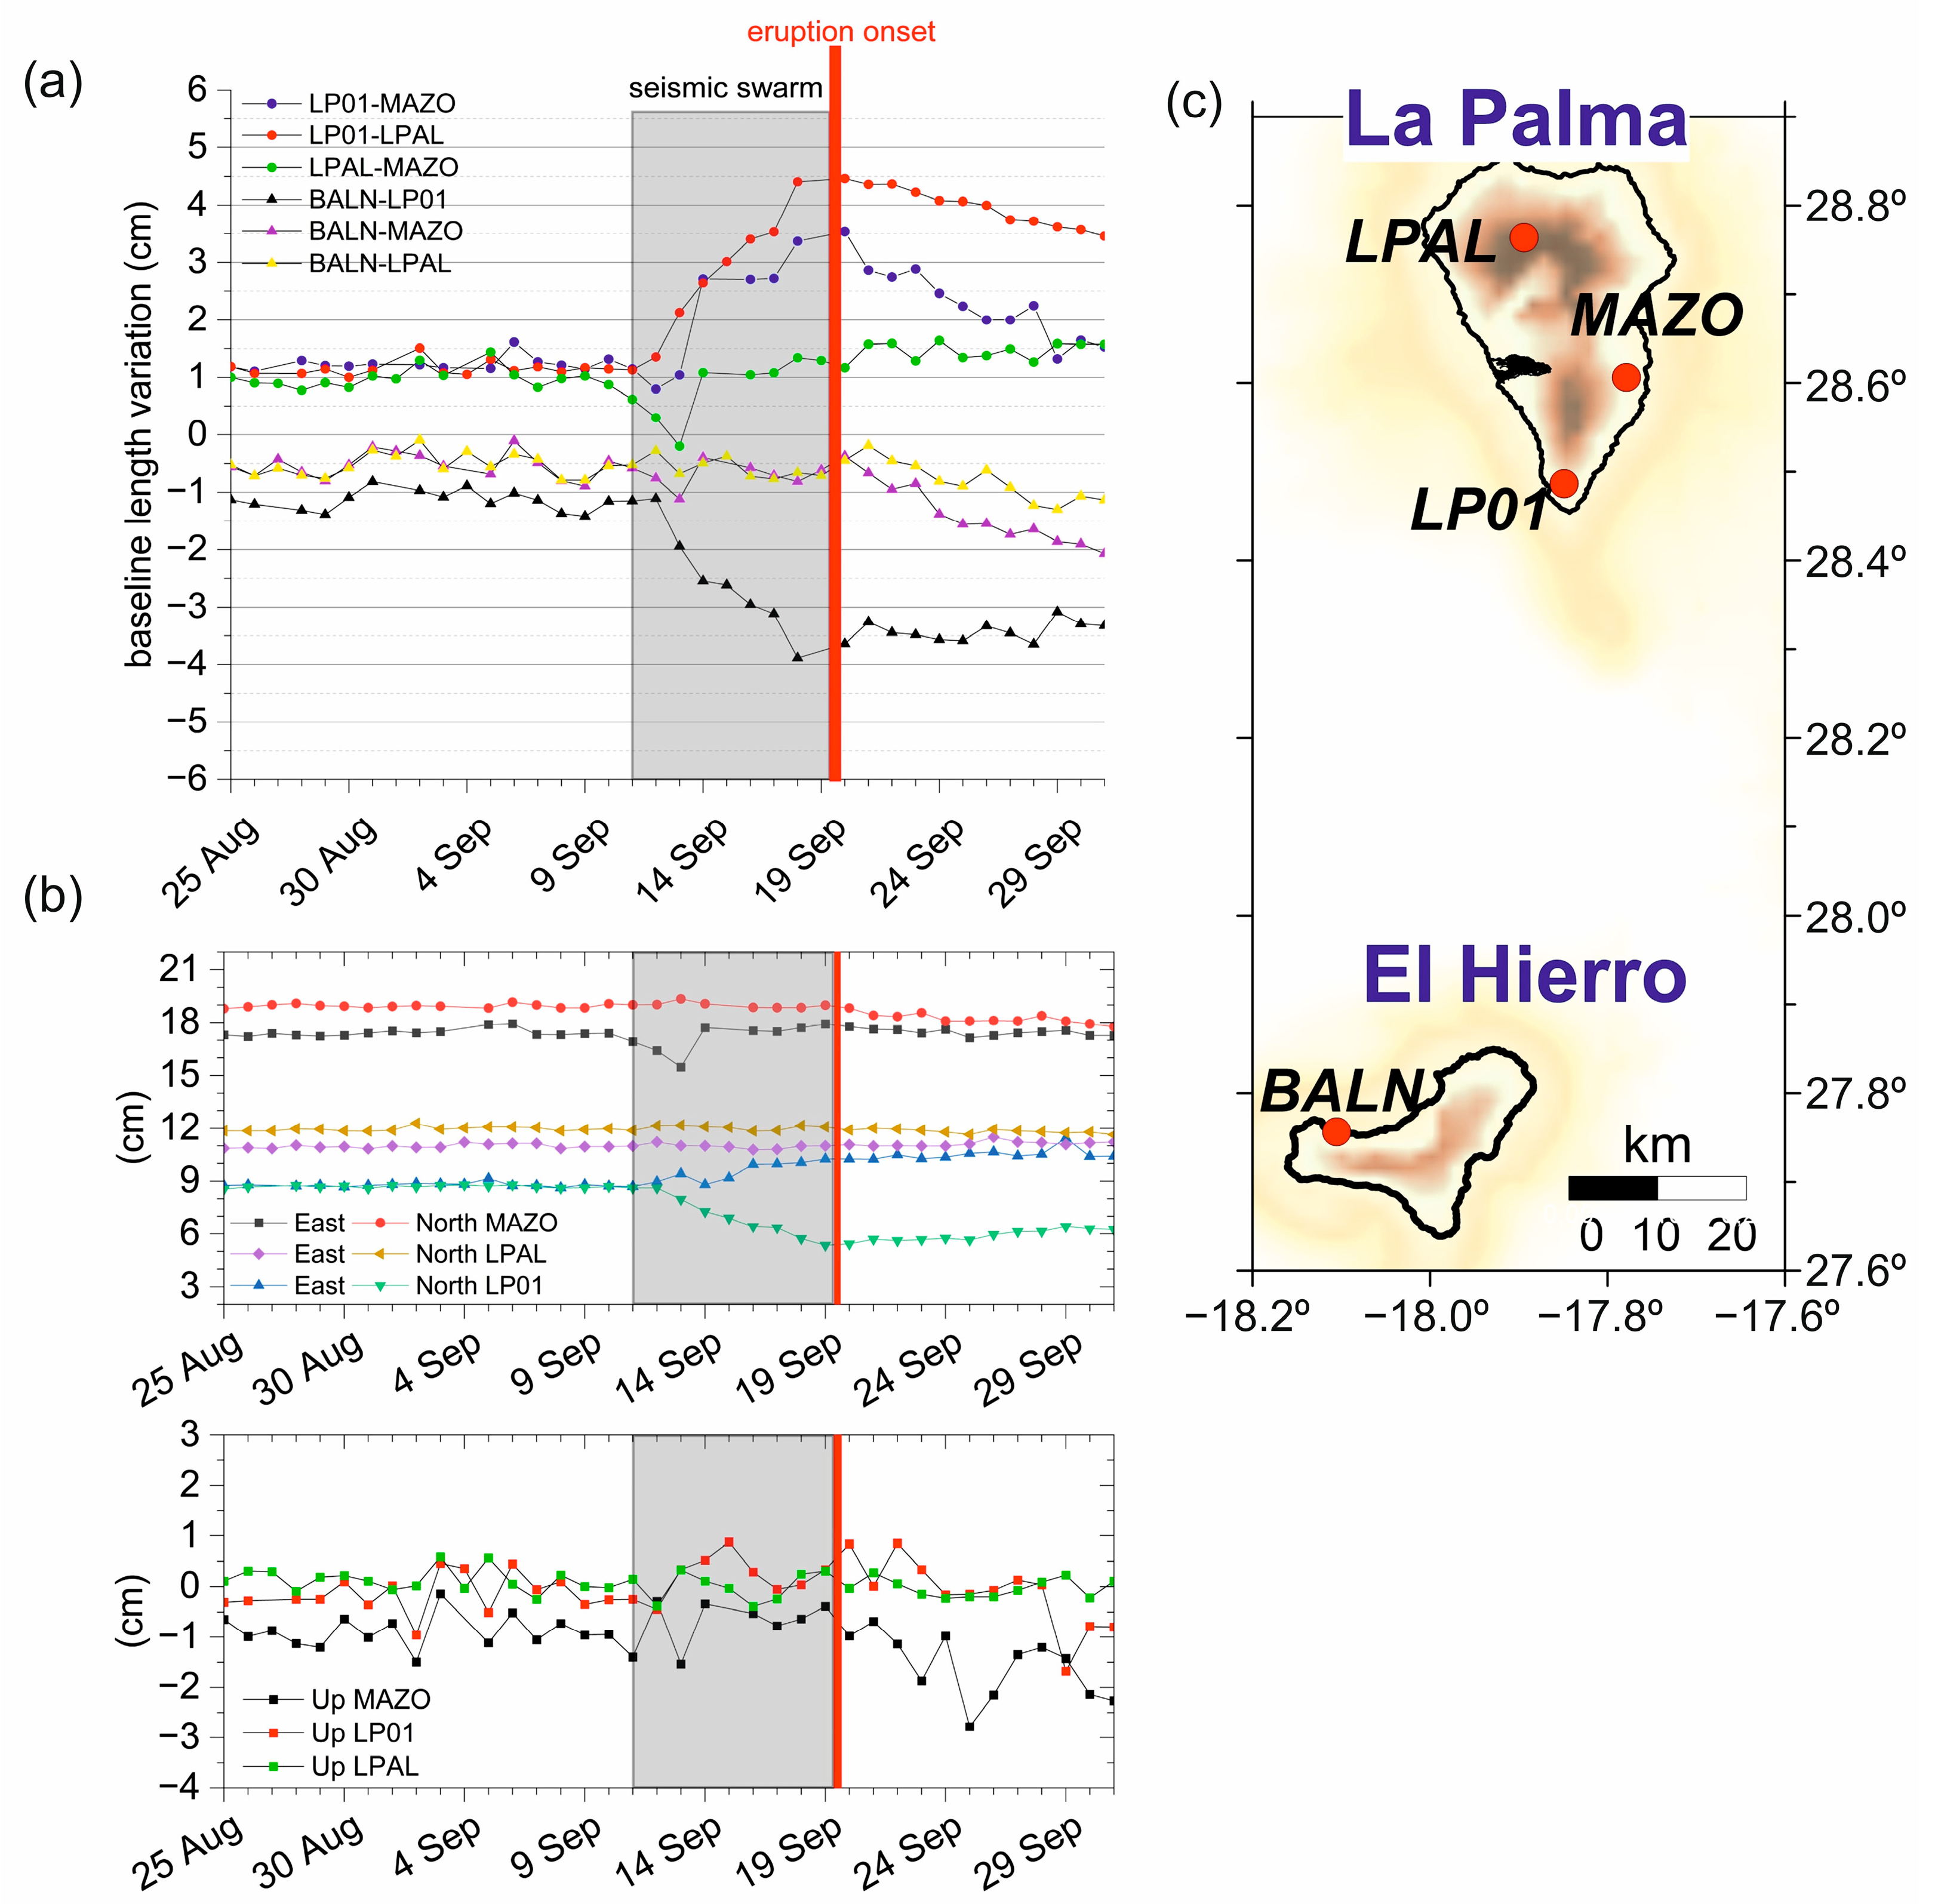
3.1. GNSS Data
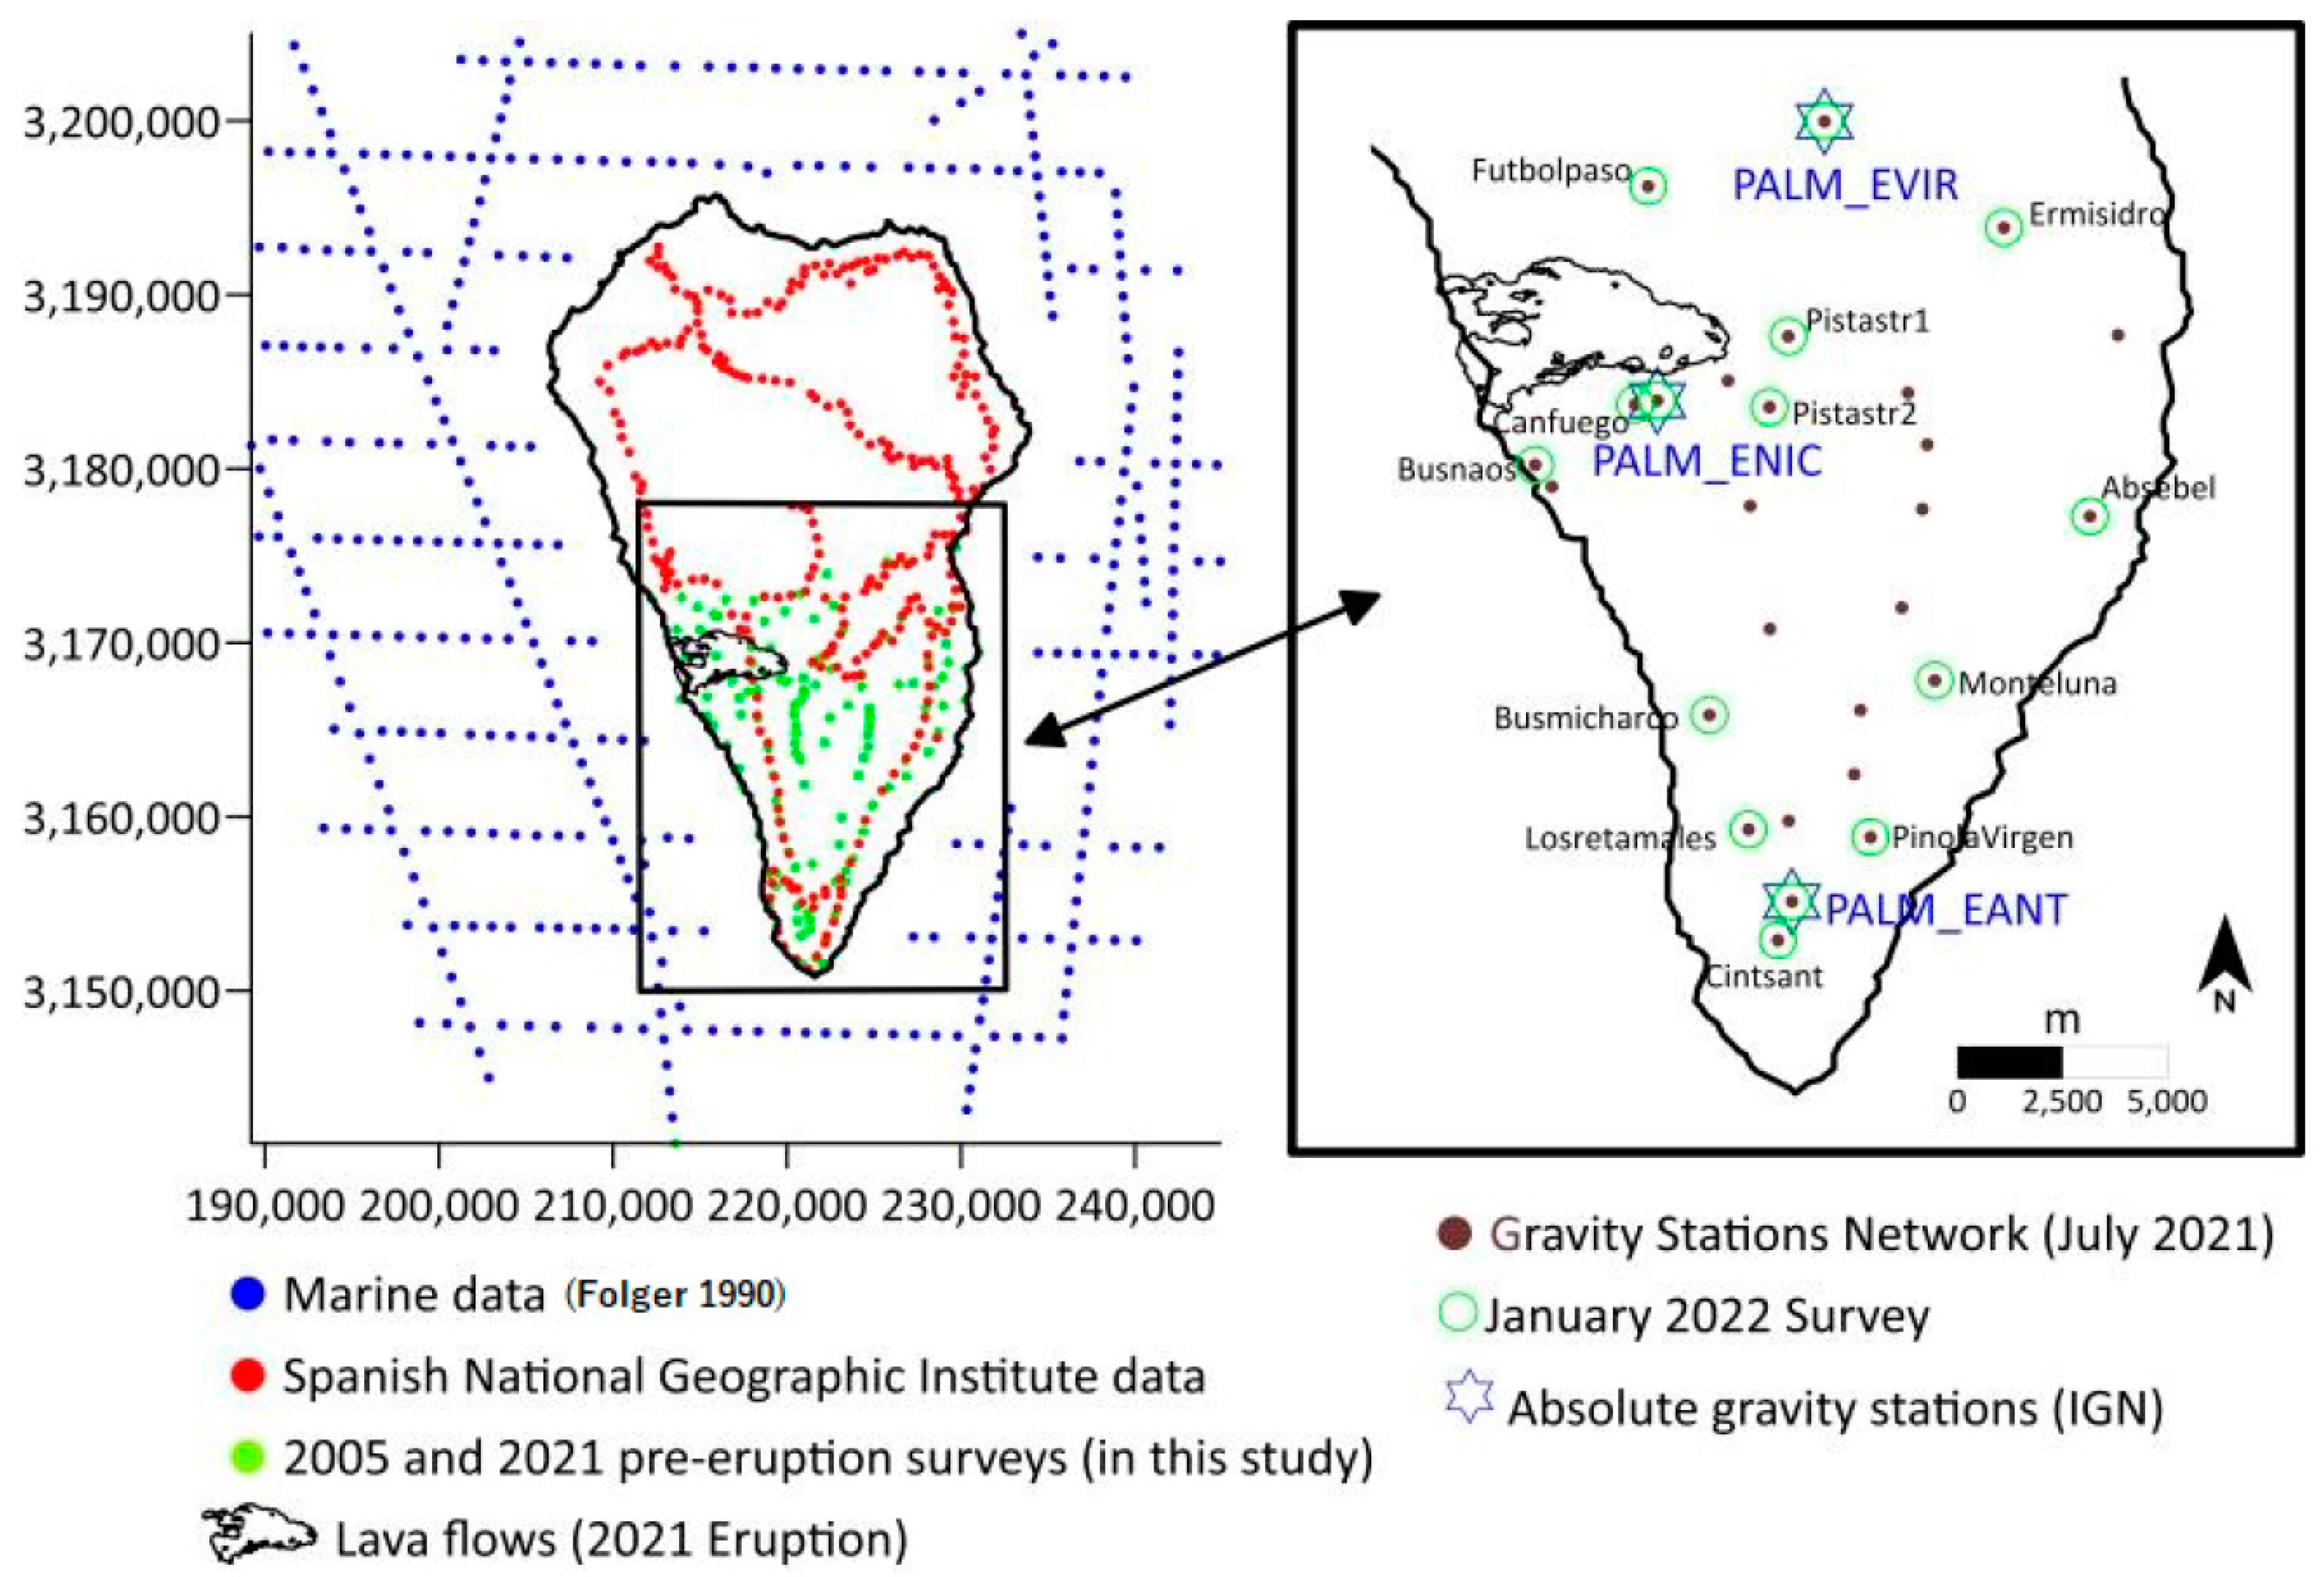
3.2. Gravity Data Collection

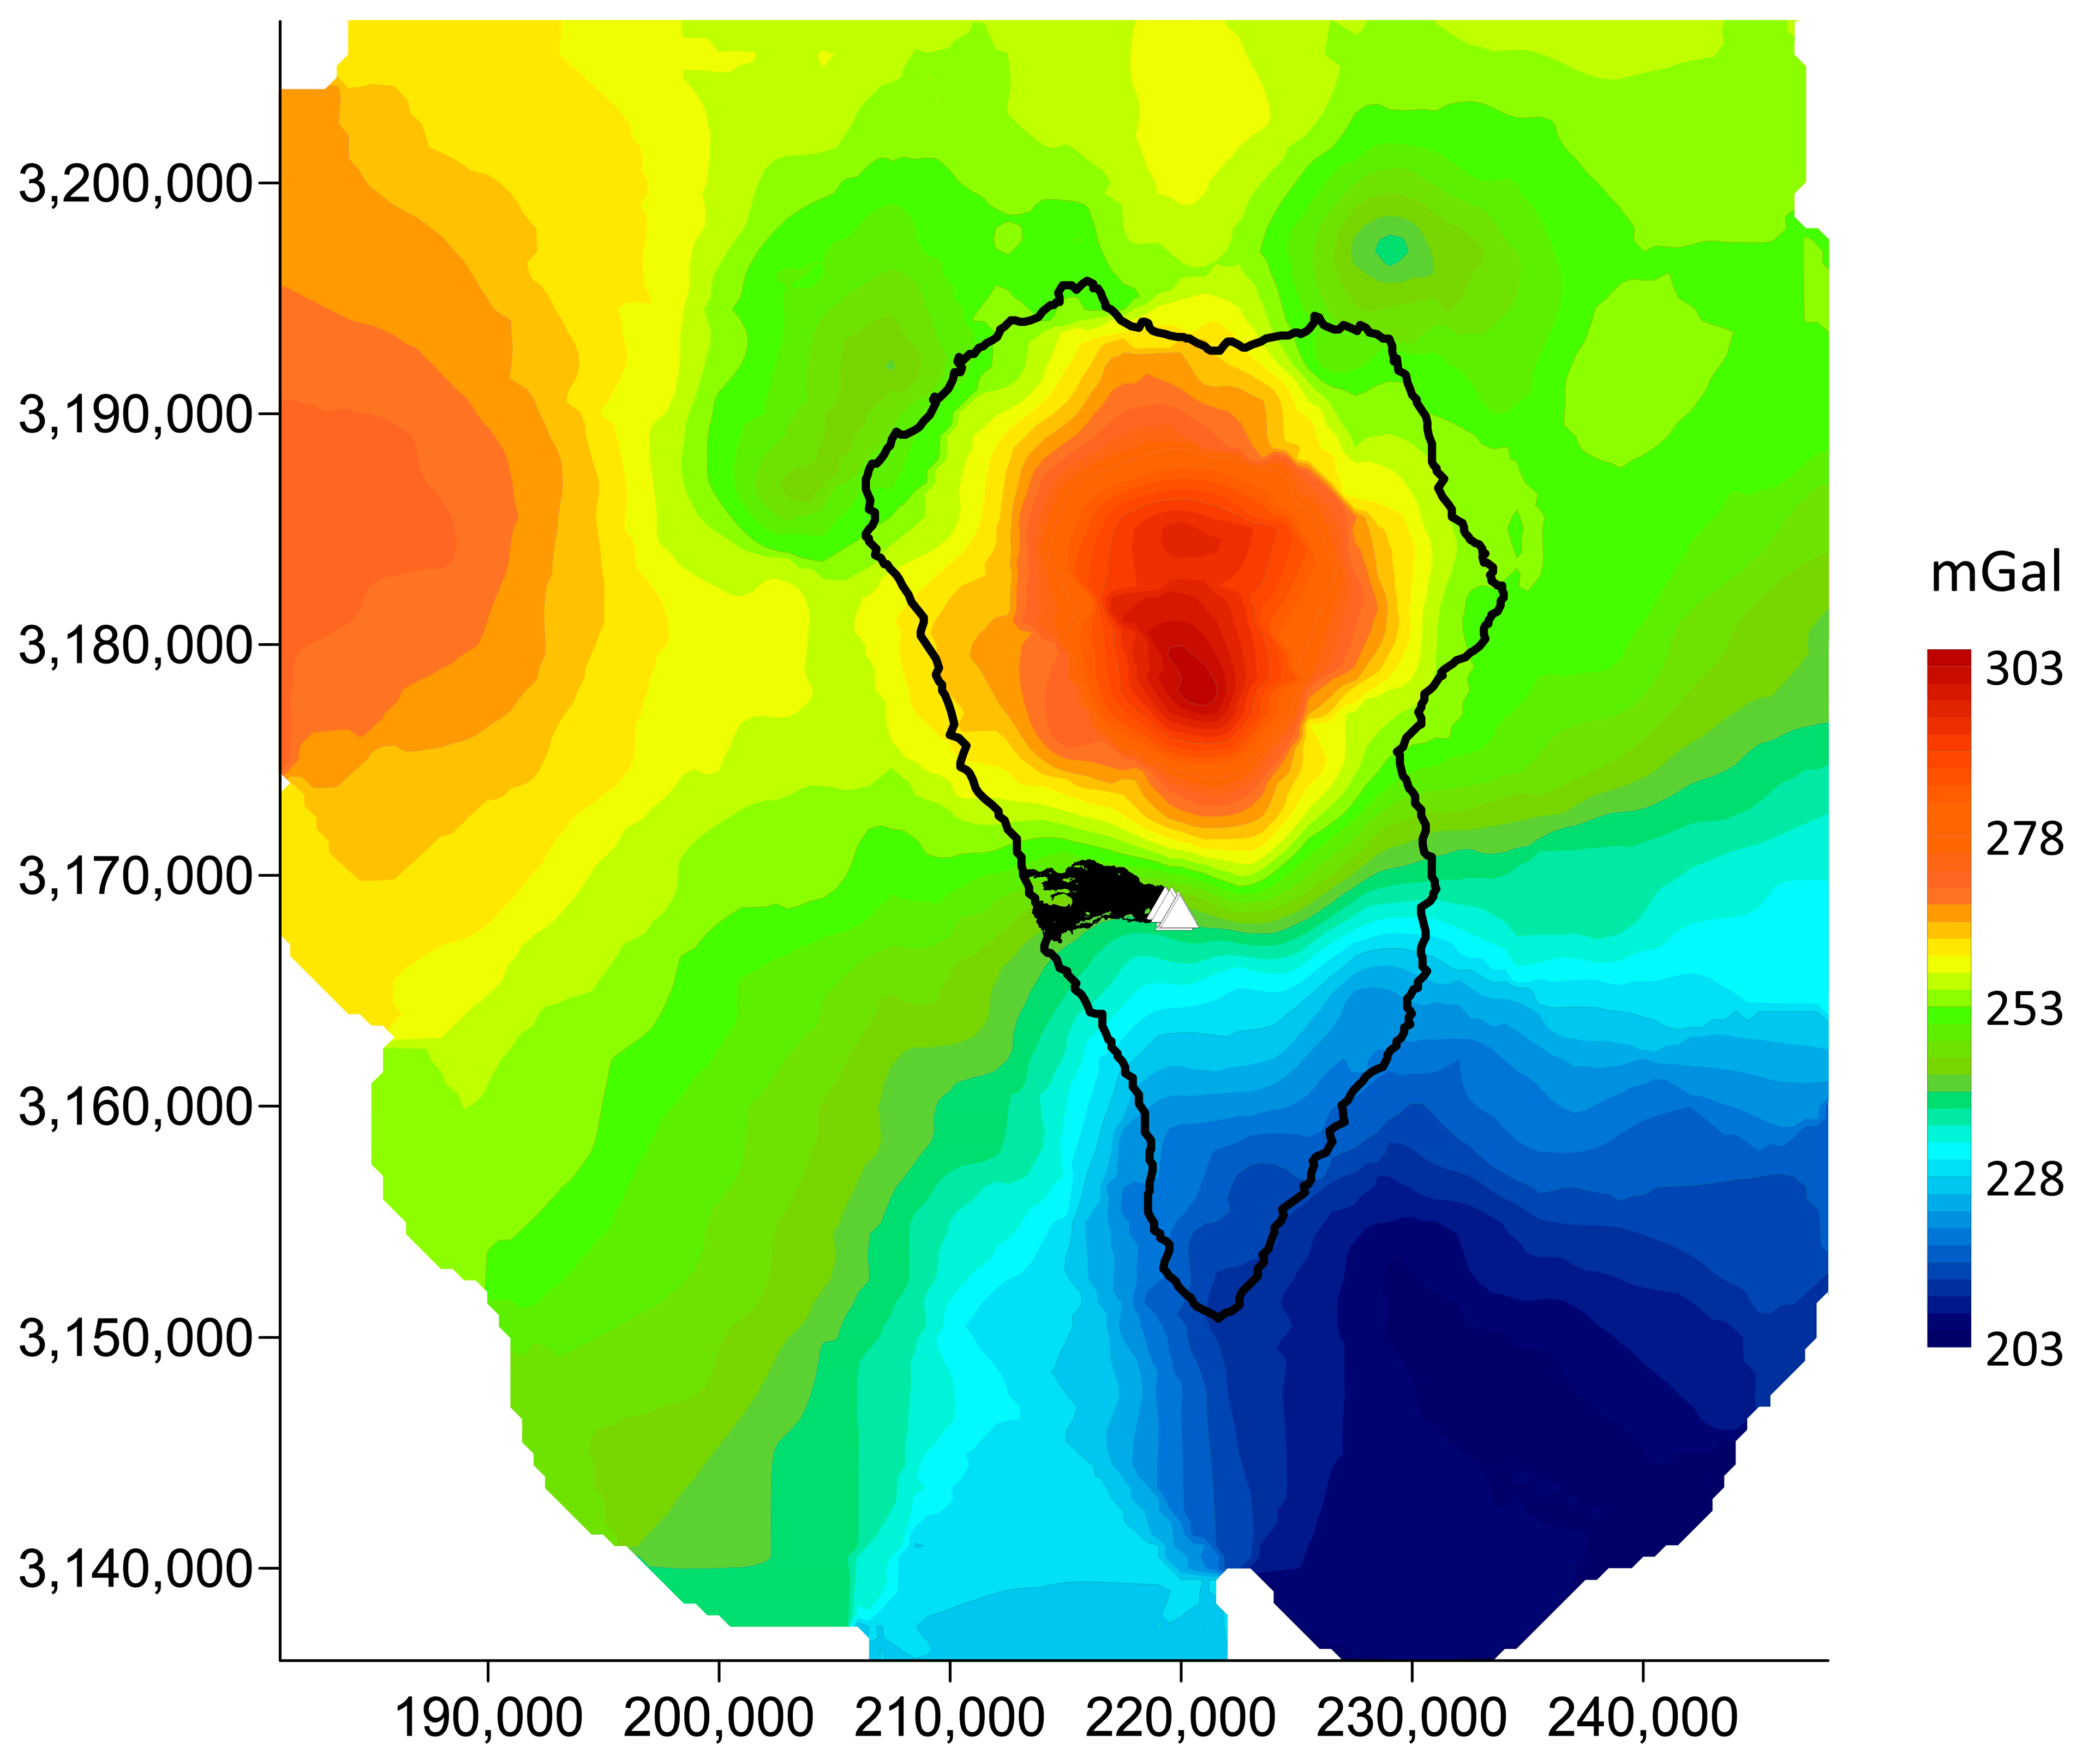
3.3. Bouguer Anomaly Map. Analysis of Gravity Anomalies and Inversion Algorithm
3.4. Gravity Changes between July 2021 and January 2022
3.5. Modeling of the Magmatic Plumbing System
4. Results
4.1. Gravity Inversion Model for the Area of Cumbre Vieja Volcano
4.2. Geometry of the Crustal Magma Plumbing System for the 2021 Eruption
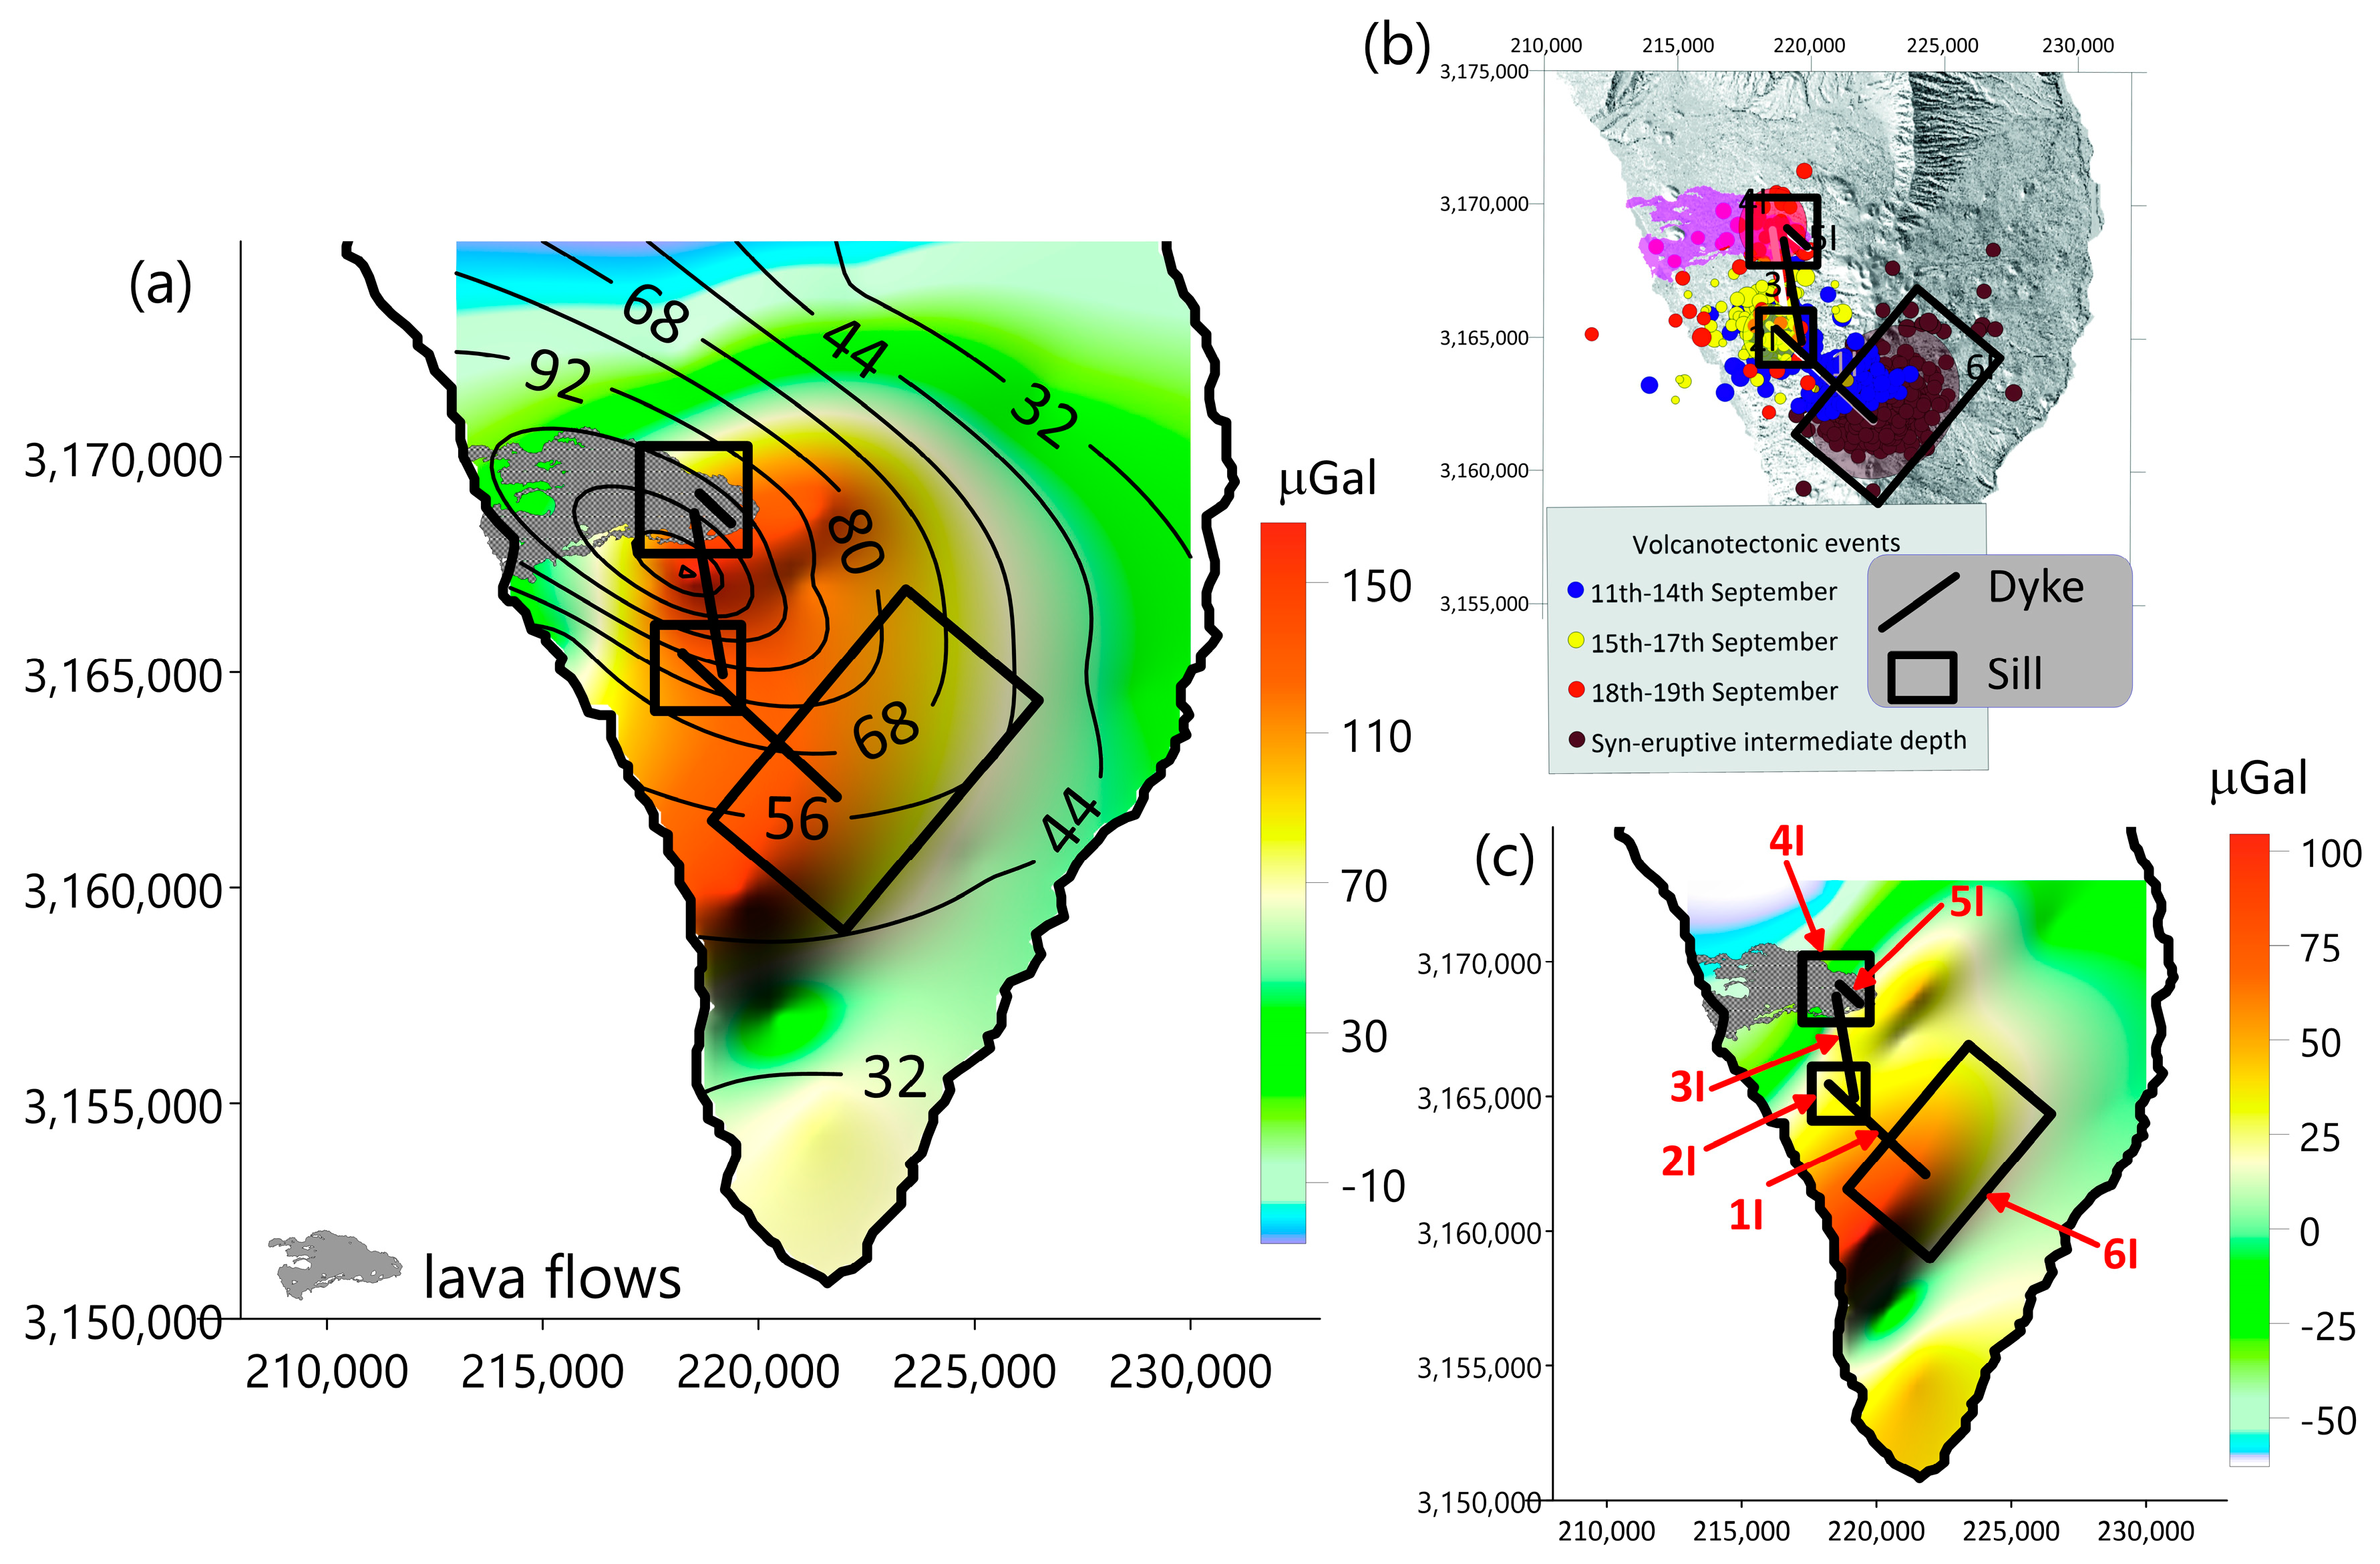
4.2.1. Initial Model from Seismic Data
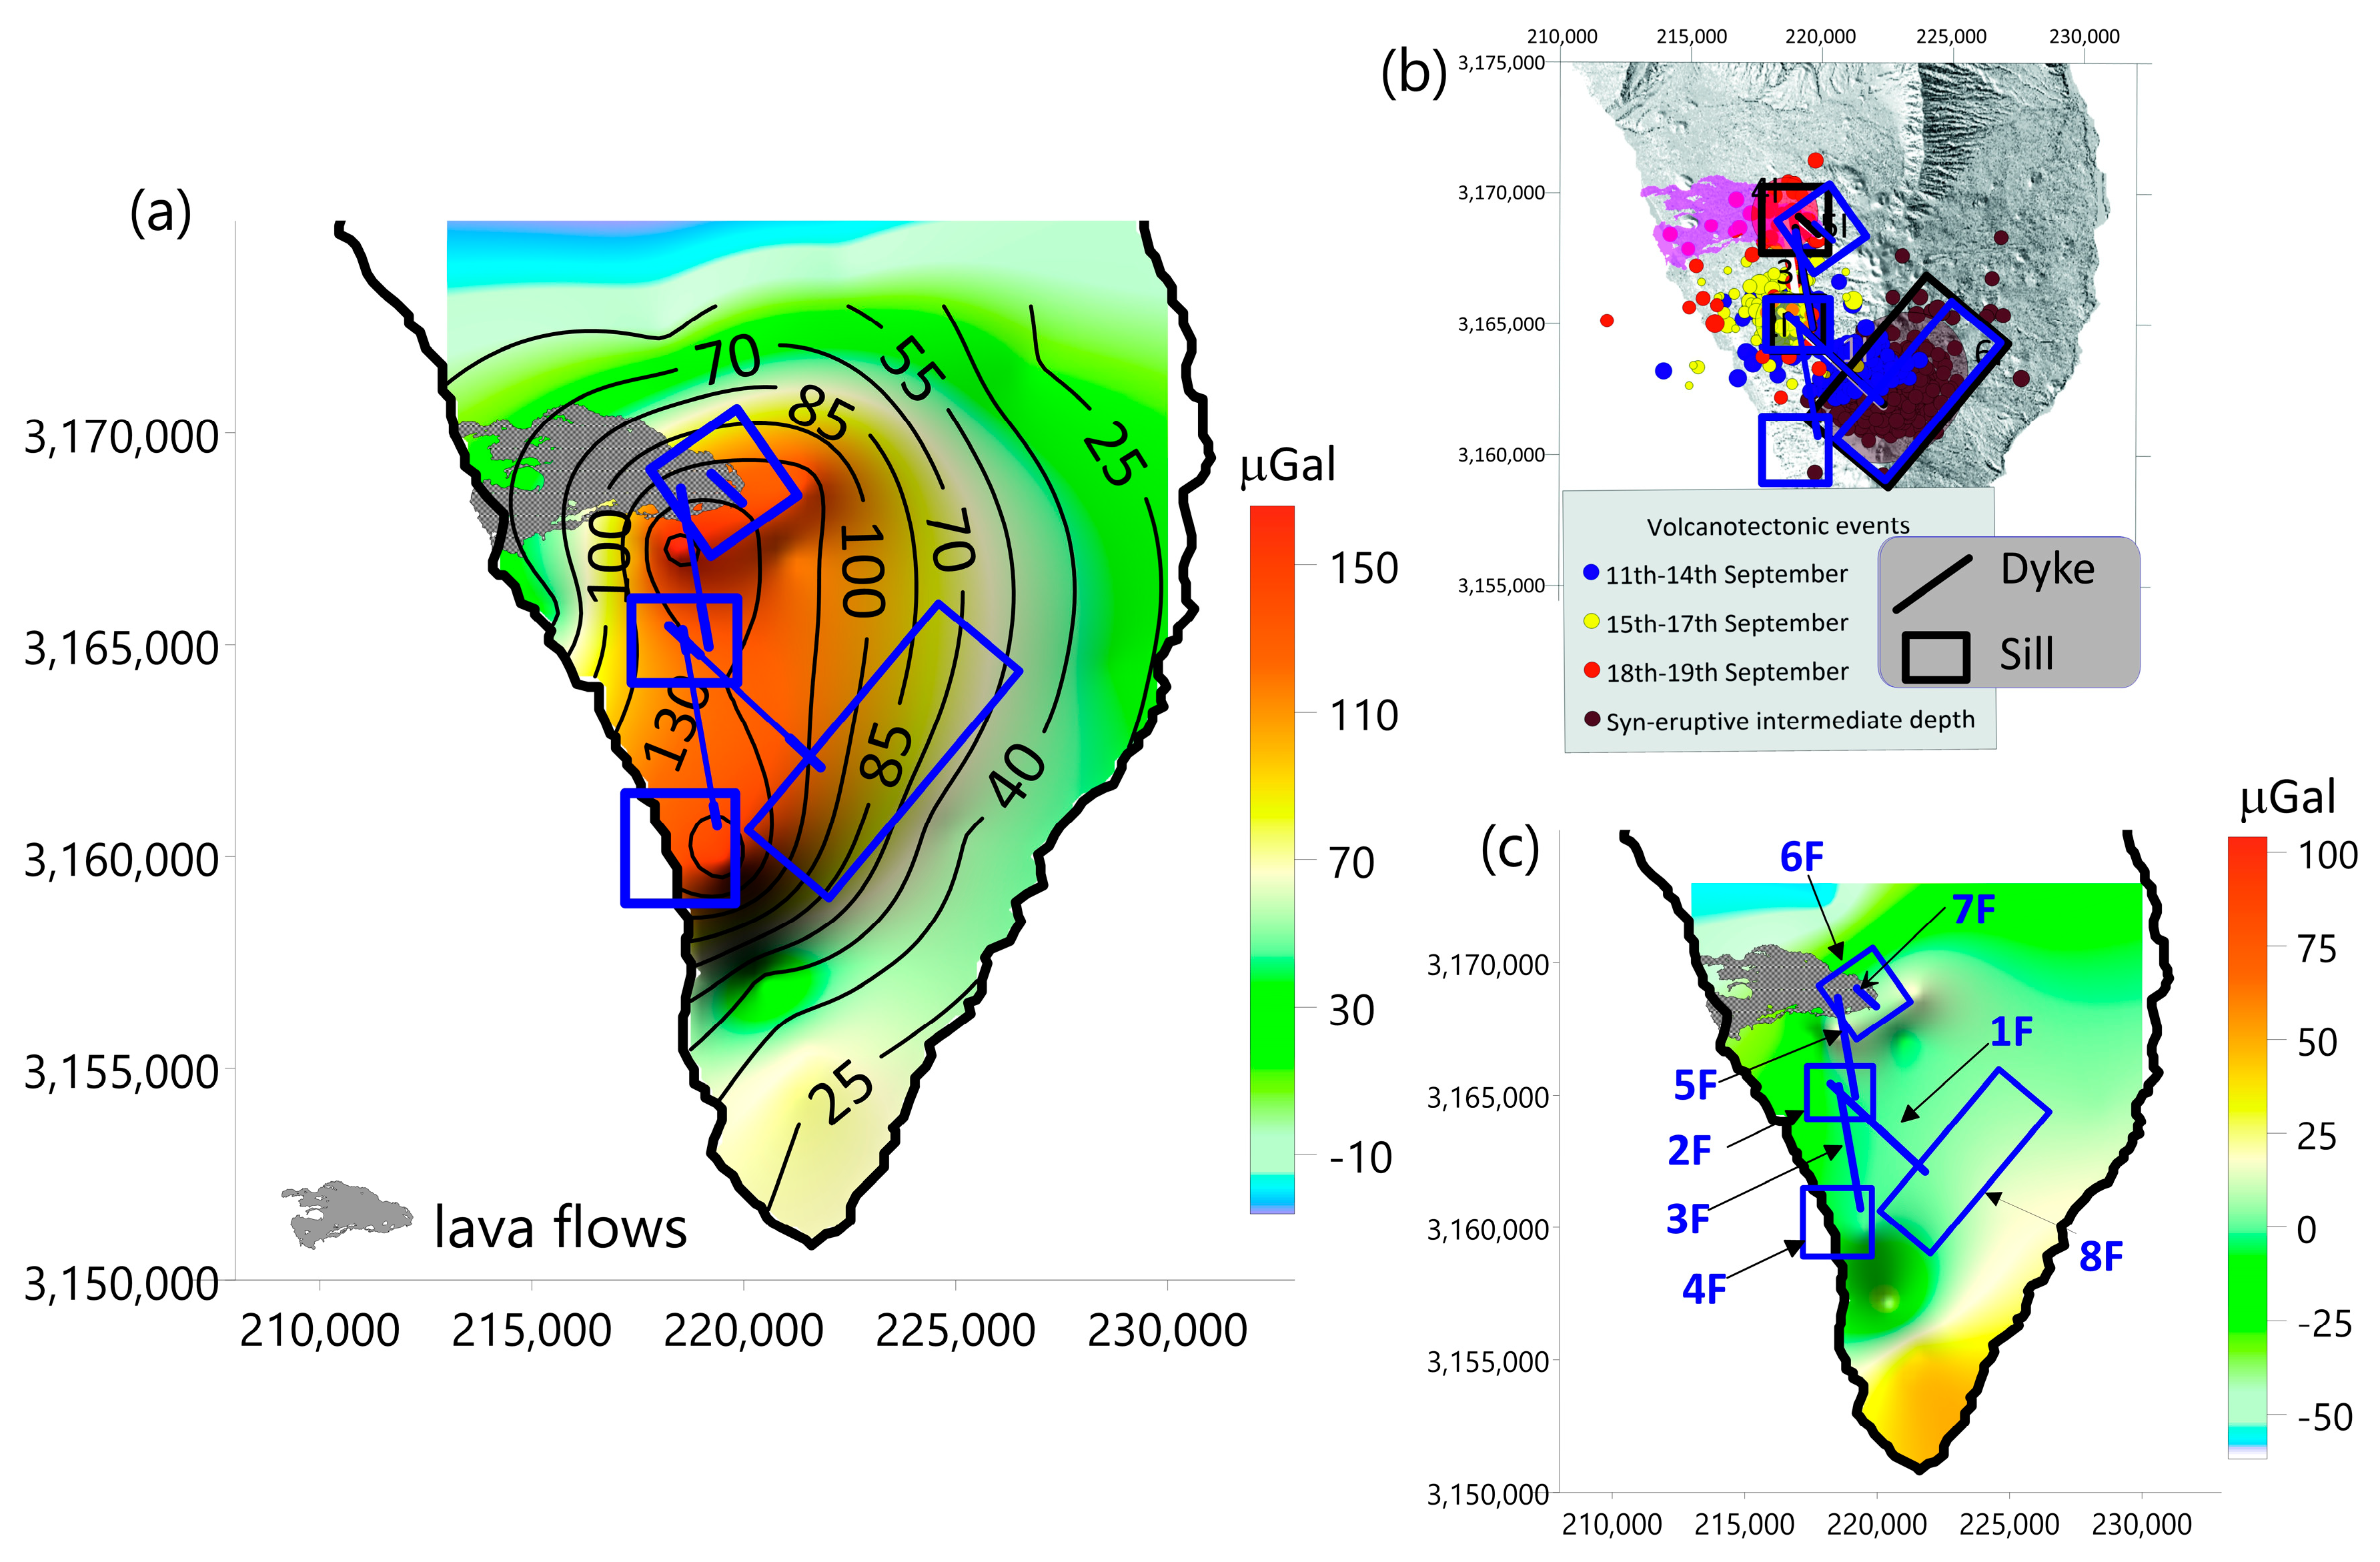
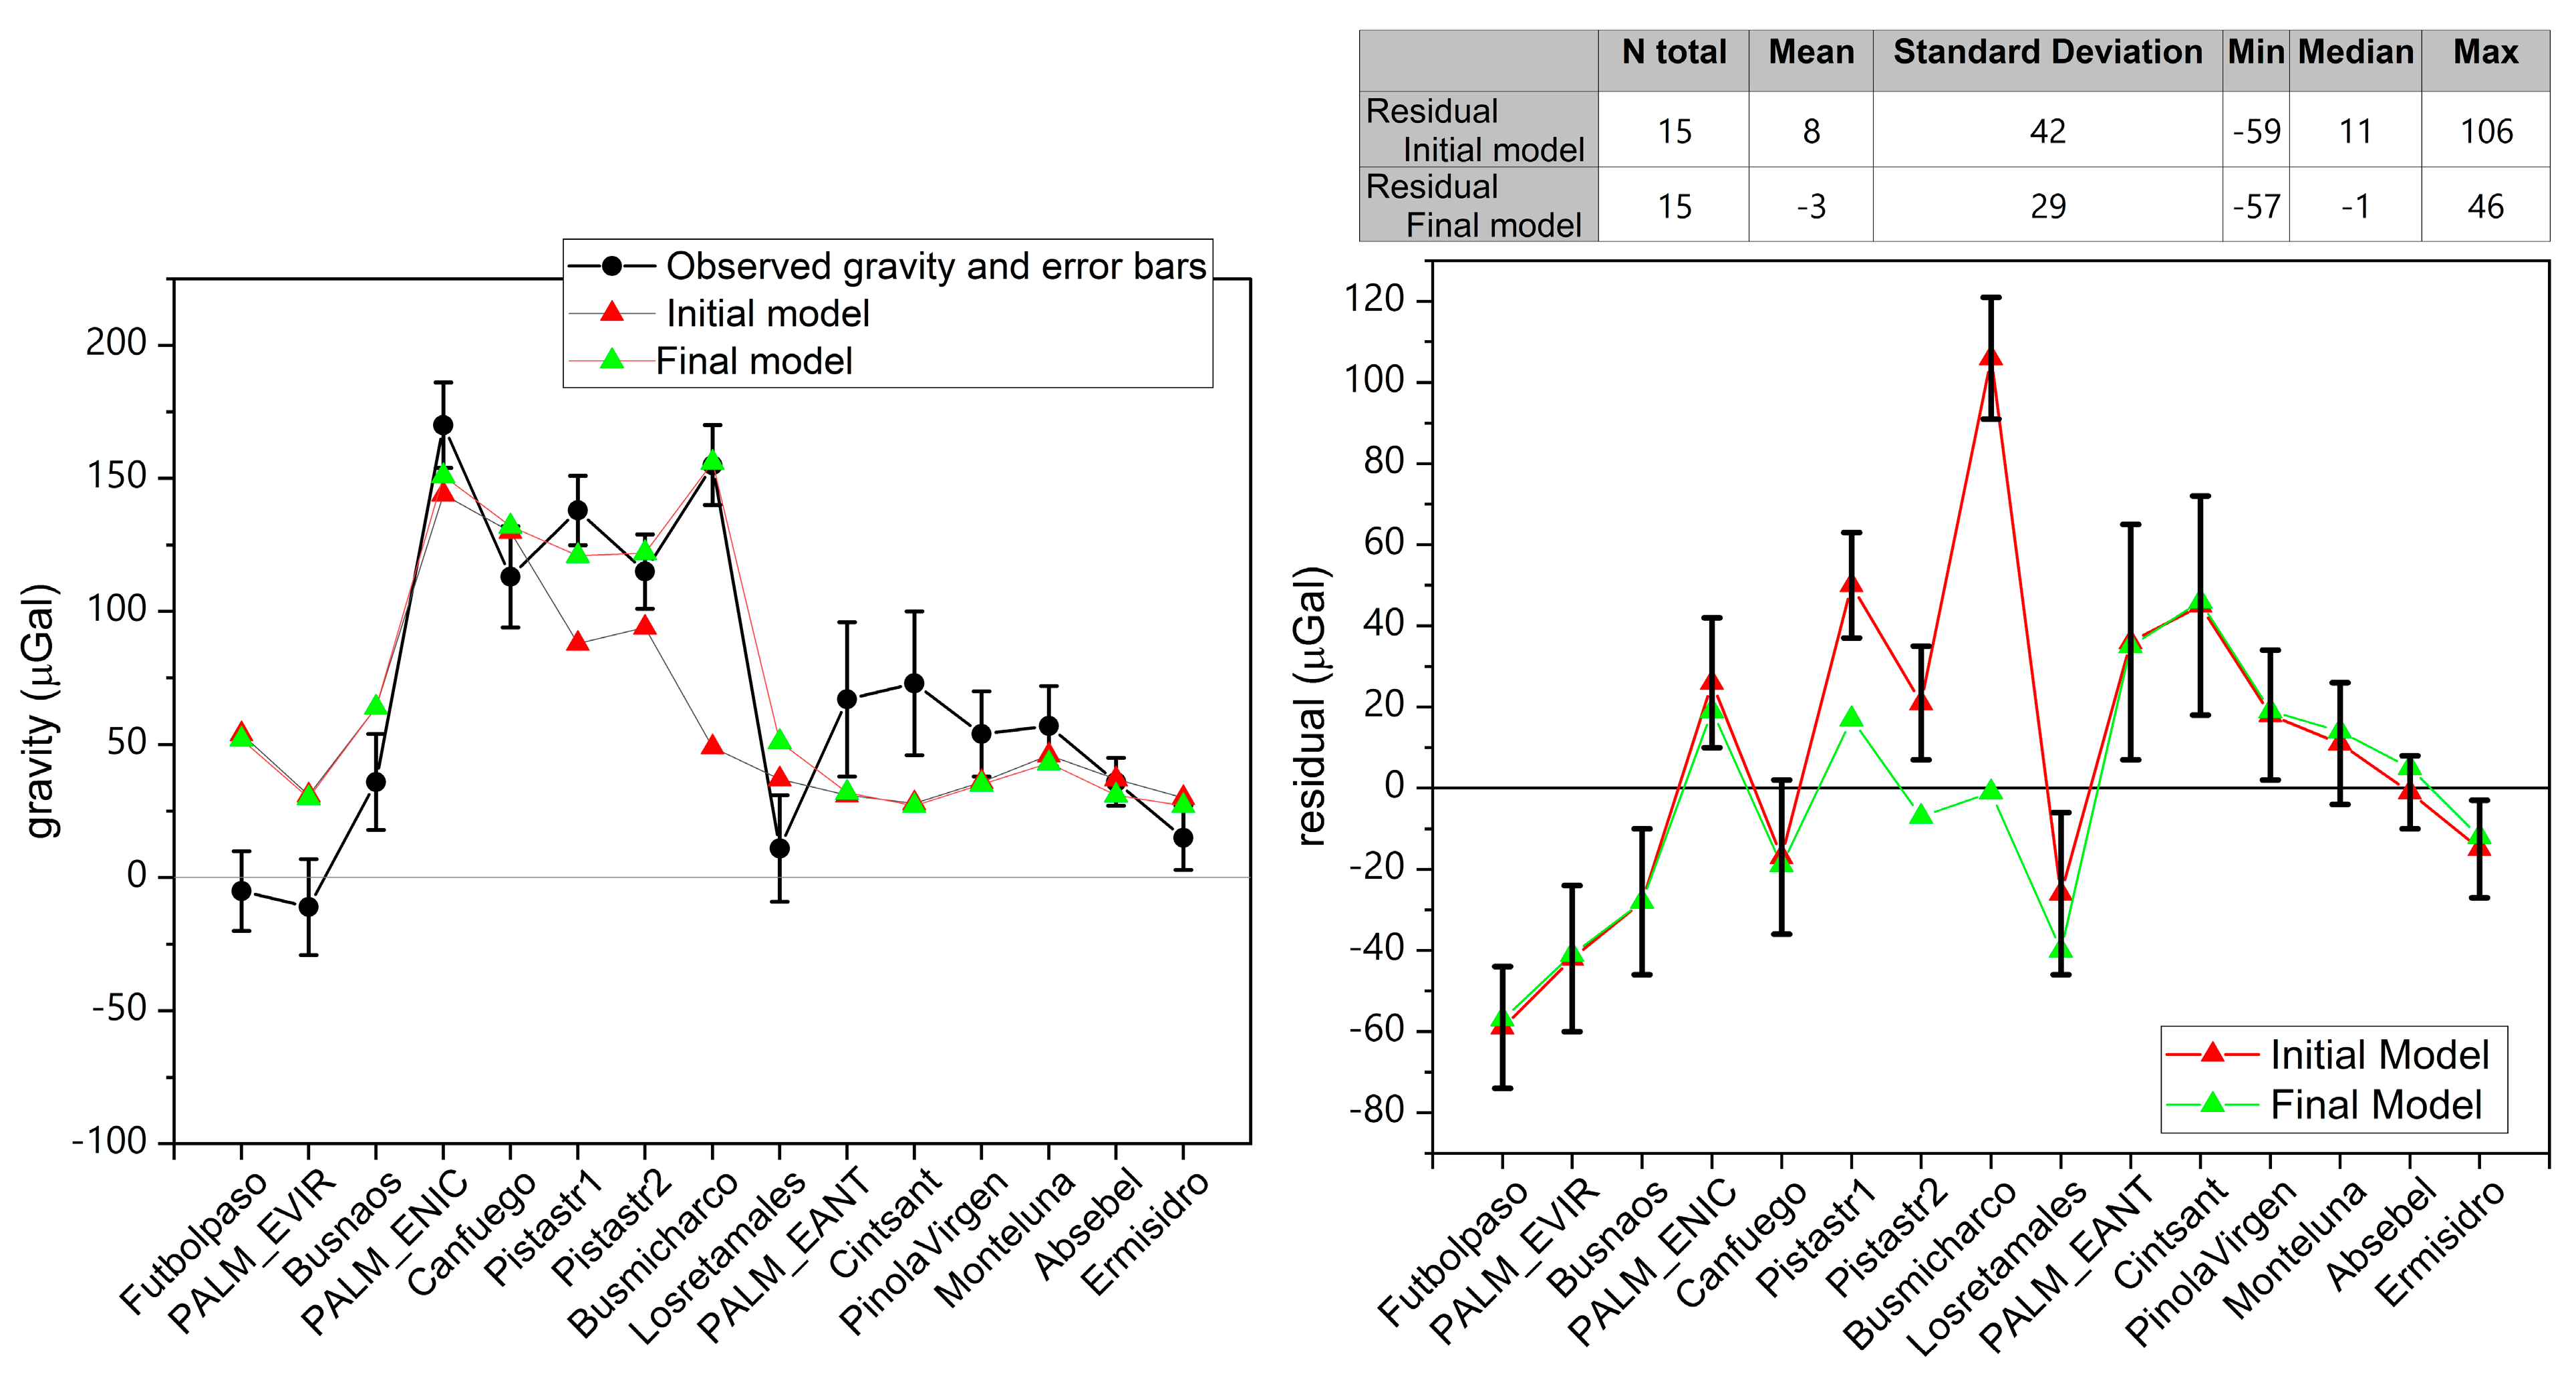
4.2.2. Forward Modeling Using Gravity Data
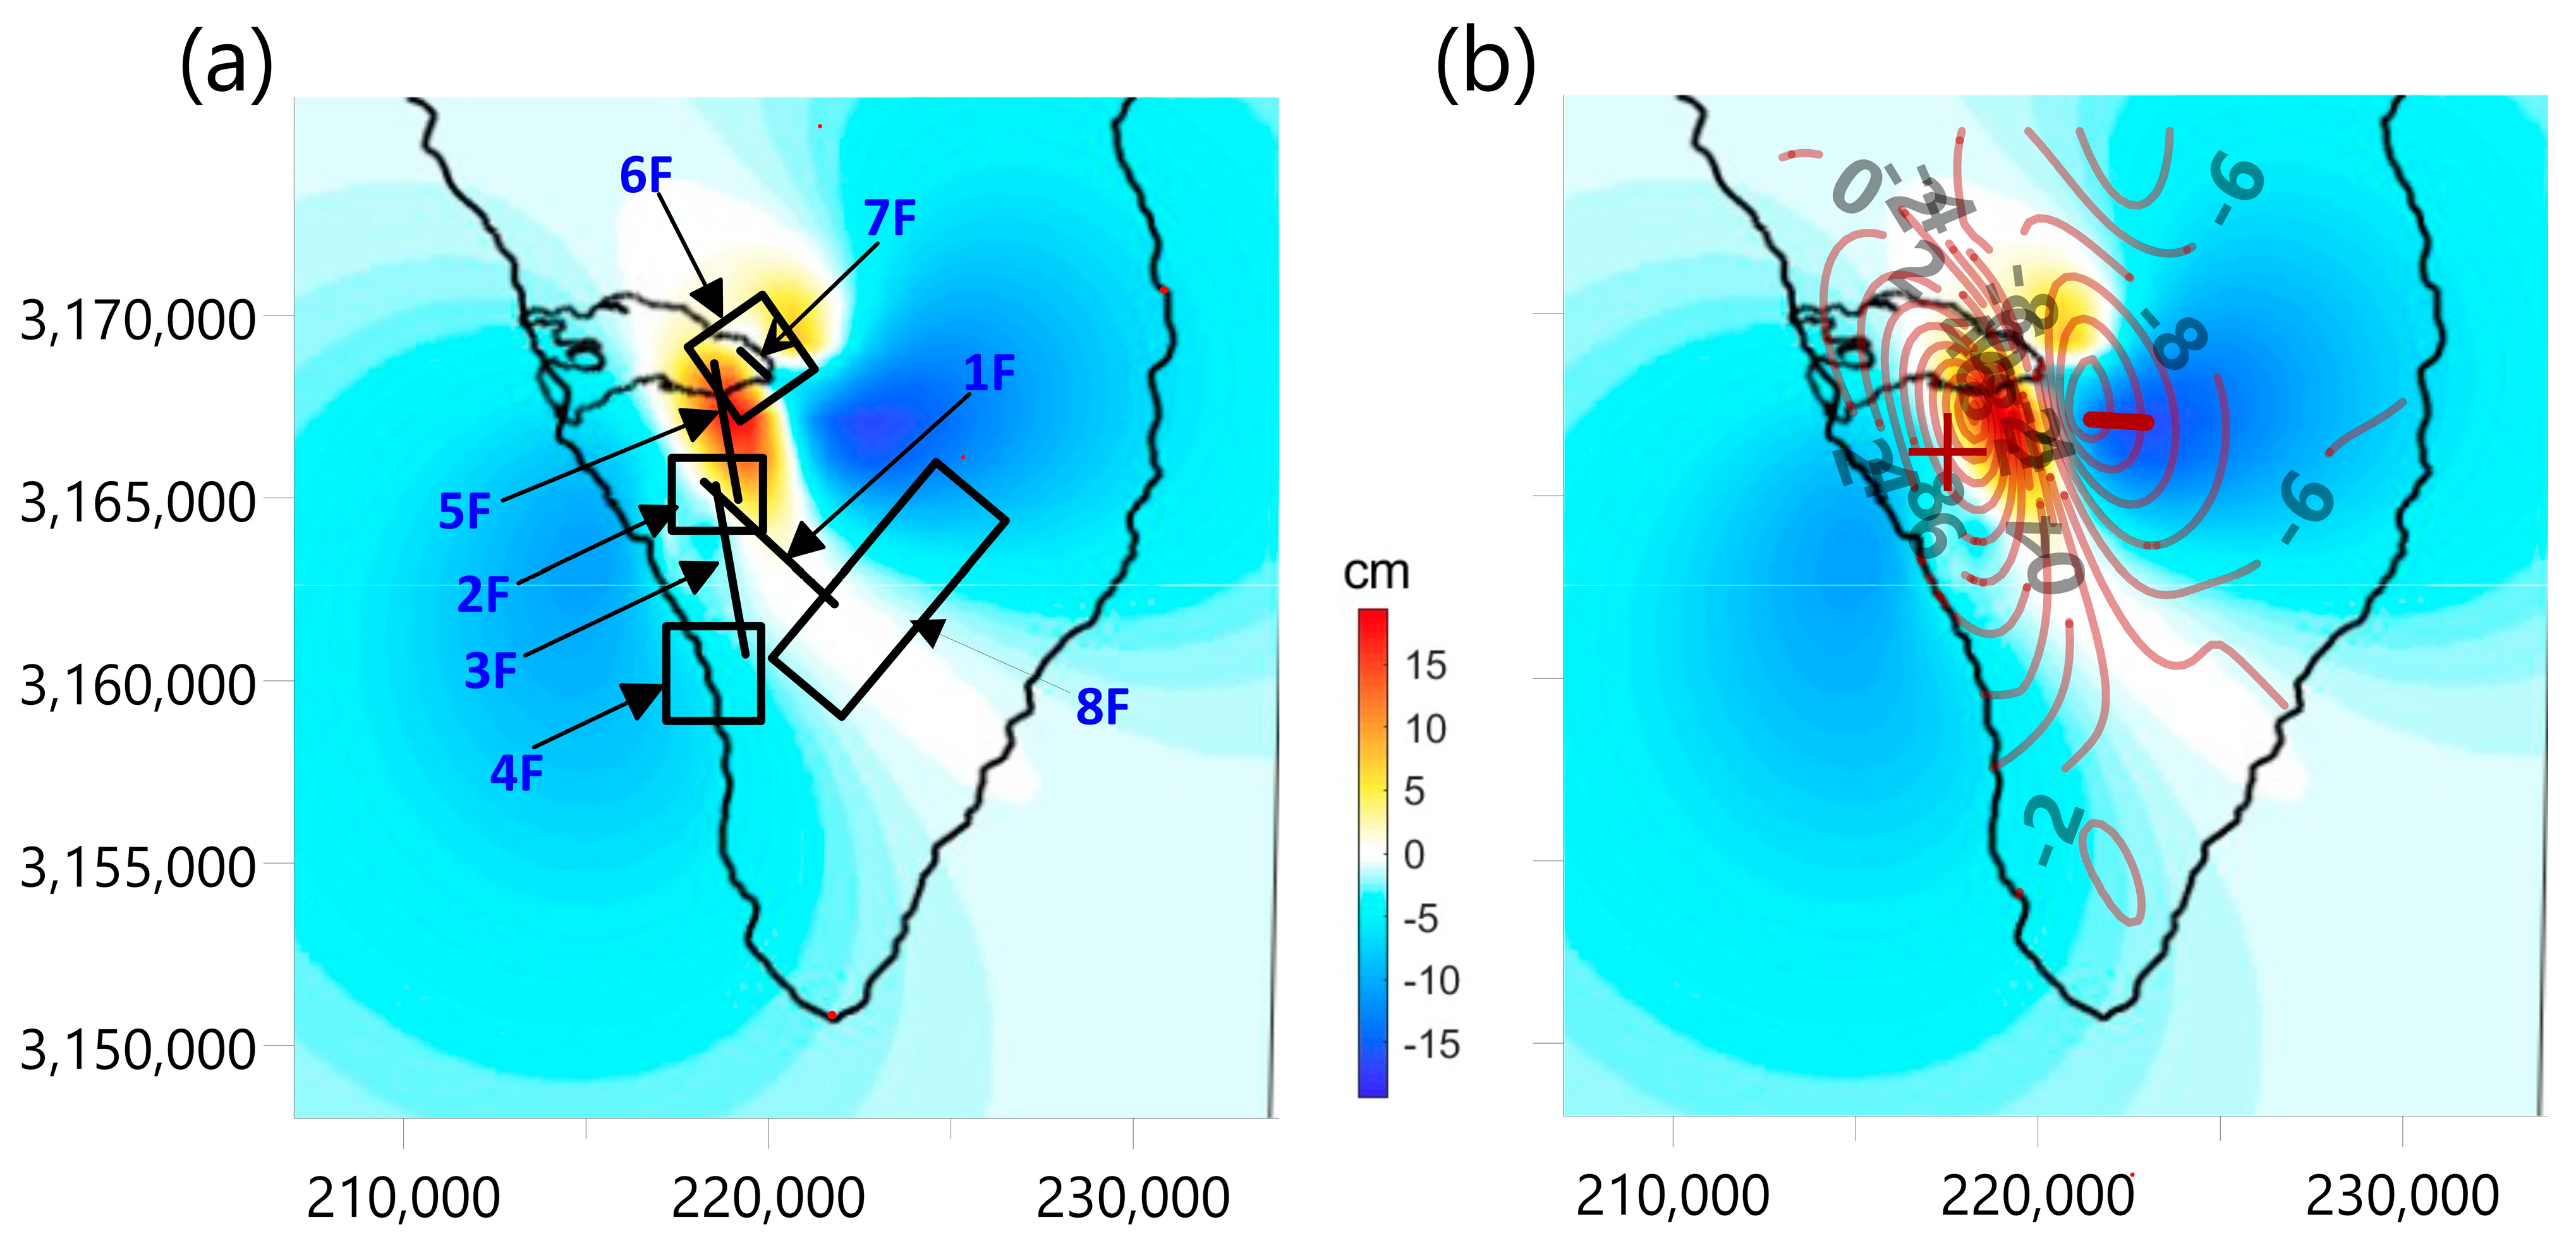
4.3. Surface Displacements from July 2021 to January 2022
5. Discussion
6. Conclusions
Supplementary Materials
Author Contributions
Funding
Data Availability Statement
Conflicts of Interest
References
- Vajda, P. Recent developments and trends in Volcano Gravimetry. In Updates in Volcanology—From Volcano Modelling to Volcano Geology; Németh, K., Ed.; Intech: London, UK, 2016; pp. 81–103. eISBN 978-953-51-2623-2; ISBN 978-953-51-2622-5. [Google Scholar] [CrossRef] [Green Version]
- Rymer, H.; Locke, C.A.; Brenes, J.; Williams-Jones, G. Magma plumbing processes for persistent activity at Poas volcano, Costa Rica. Geophys. Res. Lett. 2005, 32, L08307. [Google Scholar] [CrossRef] [Green Version]
- Fedi, M.; D’Antonio, M.; Florio, G.; Paoletti, V.; Morra, V. Gravity modeling finds a large magma body in the deep crust below the Gulf of Naples, Italy. Sci. Rep. (UK) 2018, 8, 1–19. [Google Scholar] [CrossRef]
- Kauahikaua, J.; Hildenbrand, T.; Webring, M. Deep magmatic structures of Hawaiian volcanoes, imaged by three-dimensional gravity models. Geology 2000, 28, 883–886. [Google Scholar] [CrossRef]
- Rollin, P.J.; Cassidy, J.; Locke, C.A.; Rymer, H. Evolution of the magmatic plumbing system at Mt Etna: New evidence from gravity and magnetic data. Terra Nova 2002, 12, 193–198. [Google Scholar] [CrossRef]
- Blanco-Montenegro, I.; Montesinos, F.G.; Nicolosi, I.; Arnoso, J.; Chiappini, M. Three-Dimensional MagneticModels of La Gomera (Canary Islands): Insights Into the Early Evolution of an Ocean Island Volcano. Geochem. Geophys. Geosyst. 2020, 21, e2019GC008787. [Google Scholar] [CrossRef] [Green Version]
- Montesinos, F.; Arnoso, J.; Gomez-Ortiz, D.; Benavent, M.; Blanco-Montenegro, I.; Velez, E.; Crespo, T.; Gorbatikov, A.; Stepanova, M. Imaging the Volcanic Structures Beneath Gran Canaria Island Using New Gravity Data. J. Geophys. Res. Solid Earth 2022, 127, e2022JB024863. [Google Scholar] [CrossRef]
- Mohamed, A.; Al Deep, M.; Abdelrahman, K.; Abdelrady, A. Geometry of the Magma Chamber and Curie Point Depth Beneath Hawaii Island: Inferences From Magnetic and Gravity Dat. Front. Earth Sci. 2022, 10, 847984. [Google Scholar] [CrossRef]
- Maghfira, P.; Utami, P.; Niasari, S. Heat flow and gravity anomalies in some presumed hidden geothermal prospects in Java. IOP Conf. Ser. Earth Environ. Sci. 2022, 1071, 012025. [Google Scholar] [CrossRef]
- Gailler, L.; Labazuy, P.; Dumont, Q.; Froger, J.L.; Peltier, A.; Finizola, A.; Cayol, V.; Chaput, M.; Régis, E.; The SlideVolc ERT Team. Volcano-magnetic signal reveals rapid evolution of the inner structure of Piton de la Fournaise. J. Geophys. Res. Solid Earth 2023, 128, e2022JB025290. [Google Scholar] [CrossRef]
- Krastel, S.; Schmincke, H.U. Crustal structure of northern Gran Canaria, Canary Islands, deduced from active seismic tomography. J. Volcanol. Geoth. Res. 2002, 115, 153–177. [Google Scholar] [CrossRef]
- Carracedo, J.C.; Rodriguez-Badiola, E.; Guillou, H.; Nuez Pestana, J.D.L.; Pérez Torrado, F.J. Geology and volcanology of La Palma and El Hierro, Western Canaries. Estud. Geol.-Madr. 2001, 57, 175–273. [Google Scholar]
- Ancochea, E.; Hernán, F.; Cendrero, A.; Cantagrel, J.M.; Fúster, J.; Ibarrola, E.; Coello, J. Constructive and destructive episodes in the building of a young Oceanic Island, La Palma, Canary Islands, and genesis of the Caldera de Taburiente. J. Volcanol. Geoth. Res. 1994, 60, 243–262. [Google Scholar] [CrossRef]
- Klügel, A.; Hansteen, T.H.; Galipp, K. Magma storage and underplating beneath Cumbre Vieja volcano, La Palma (Canary Islands). Earth Planet Sci. Lett. 2005, 236, 211–226. [Google Scholar] [CrossRef]
- Fernández, J.; Escayo, J.; Hu, Z.; Camacho, A.G.; Samsonov, S.V.; Prieto, J.F.; Tiampo, K.F.; Palano, M.; Mallorquí, J.J.; Ancochea, E. Detection of volcanic unrest onset in La Palma, Canary Islands, evolution and implications. Sci. Rep. 2021, 11, 1–15. [Google Scholar] [CrossRef]
- Montesinos, F.G.; Arnoso, J.; Vieira, R. Using a genetic algorithm for 3-D inversion of gravity data in Fuerteventura (Canary Islands). Int. J. Earth Sci. 2005, 94, 301–316. [Google Scholar] [CrossRef]
- D’Auria, L.; Koulakov, I.; Prudencio, J.; Cabrera-Pérez, I.; Ibáñez, J.; Martinez, J.; Garcia-Hernandez, R.; Martínez van Dorth, D.; Hernandez, G.; Przeor, M.; et al. Rapid magma ascent beneath LaPalma revealed by seismic tomography. Sci. Rep. 2022, 12, 17654. [Google Scholar] [CrossRef] [PubMed]
- Di Paolo, F.; Ledo, J.; Ślęzak, K.; van Dorth, D.M.; Cabrera-Pérez, I.; Pérez, N.M. La Palma island (Spain) geothermal system revealed by 3D magnetotelluric data inversion. Sci. Rep. (UK) 2020, 10, 18181. [Google Scholar] [CrossRef]
- Lozano, G.; García, J.C.; Lorenzo, C.; Hernández, M.; Cabrera, A.; Díaz, E.; Camuñas, C.; Mediato, J.F.; López, J.; Pérez, R.; et al. (URGE-IGME Team). Mapa de Evolución de la Lava Entre el 24-11-2021 y el 14-12-2021. Available online: https://info.igme.es/eventos/la-palma/delimitacion-lava/211214_Evolucion-lava.pdf (accessed on 14 December 2021).
- Albert, H.; Costa, F.; Martí, J. Years to weeks of seismic unrest and magmatic intrusions precede monogenetic eruptions. Geology 2016, 44, 211–214. [Google Scholar] [CrossRef] [Green Version]
- Moss, J.L.; McGuire, W.J.; Page, D. Ground deformation monitoring of a potential landslide at La Palma, Canary Islands. J. Volcanol. Geotherm. Res. 1999, 94, 251–265. [Google Scholar] [CrossRef]
- Perlock, P.A.; Gonzalez, P.J.; Tiampo, K.F.; Rodriguez-Velasco, G.; Fernandez, J. Time evolution of deformation using Time Series of differential interferograms: Application to La Palma Island (Canary Islands). Pure Appl. Geophys. 2008, 165, 1531–1554. [Google Scholar] [CrossRef]
- Prieto, J.F.; Gonzalez, P.J.; Seco, A.; Rodriguez-Velasco, G.; Tunini, L.; Perlock, P.A.; Arjona, A.; Aparicio, A.; Camacho, A.G.; Rundle, J.B.; et al. Geodetic and structural research in La Palma, Canary Islands, Spain: 1992–2007 results. Pure Appl. Geophys. 2009, 166, 1461–1484. [Google Scholar] [CrossRef]
- Arjona, A.; Monells, D.; Fernández, J.; Duque, S.; Mallorqui, J. Deformation analysis employing the Coherent Pixel Technique and ENVISAT and ERS images in Canary Islands. In Proceedings of the Workshop Fringe 2009, Frascati, Italy, 30 November–4 December 2009; European Space Agency: Paris, France, 2010; p. 8. [Google Scholar]
- González, P.J.; Tiampo, K.F.; Camacho, A.G.; Fernández, J. Shallow flank deformation at Cumbre Vieja volcano (Canary Islands): Implications on the stability of steep-sided volcano flanks at oceanic islands. Earth Planet Sci. Lett. 2010, 297, 545–557. [Google Scholar] [CrossRef]
- Escayo, J.; Fernández, J.; Prieto, J.F.; Camacho, A.G.; Palano, M.; Aparicio, A.; Rodríguez-Velasco, G.; Ancochea, E. Geodetic Study of the 2006–2010 Ground Deformation in La Palma (Canary Islands): Observational Results. Remote Sens. 2020, 12, 2566. [Google Scholar] [CrossRef]
- Padrón, E.; Pérez, N.M.; Rodríguez, F.; Melián, G.; Hernández, P.A.; Sumino, H.; Padilla, G.; Barrancos, J.; Dionis, S.; Notsu, K.; et al. Dynamics of diffuse carbon dioxide emissions from Cumbre Vieja volcano, La Palma, Canary Islands. Bull. Volcanol. 2015, 77, 28. [Google Scholar] [CrossRef]
- Padrón, E.; Pérez, N.M.; Hernández, P.A.; Sumino, H.; Melian, G.V.; Alonso, M.; Rodríguez, F.; Asensio-Ramos, M.; D’Auria, L. Early precursory changes in the 3He/4He ratio prior to the 2021 Tajogaite eruption at Cumbre Vieja volcano, La Palma, Canary Islands. Geophys. Res. Lett. 2022, 49, e2022GL099992. [Google Scholar] [CrossRef]
- Torres-González, P.A.; Luengo-Oroz, N.; Lamolda, H.; D’Alessandro, W.; Albert, H.; Iribarren, I.; Moure-García, D.; Soler, V. Unrest signals after 46 years of quiescence at Cumbre Vieja, La Palma, Canary Islands. J. Volcanol. Geoth. Res. 2020, 392, 106757. [Google Scholar] [CrossRef]
- Fernández, J.; Escayo, J.; Camacho, A.G.; Palano, M.; Prieto, J.F.; Hu, Z.; Samsonov, S.V.; Tiampo, K.F.; Ancochea, E. Shallow magmatic intrusion evolution below La Palma before and during the 2021 eruption. Sci. Rep. (UK) 2022, 12, 20257. [Google Scholar] [CrossRef] [PubMed]
- De Luca, C.; Valerio, E.; Giudicepietro, F.; Macedonio, G.; Casu, F.; Lanari, R. Pre- and co-eruptive analysis of the September 2021 eruption at Cumbre Vieja volcano (La Palma, Canary Islands) through DInSAR measurements and analytical modeling. Geophys. Res. Lett. 2022, 49, e2021GL097293. [Google Scholar] [CrossRef]
- Hernández, P.A.; Padrón, E.; Melián, G.V.; Pérez, N.M.; Padilla, G.; Asensio-Ramos, M.; Di Nardo, D.; Barrancos, J.; Pacheco, J.M.; Smit, M. Gas hazard assessment at Puerto Naos and La Bombilla inhabited areas, Cumbre Vieja volcano, La Palma, Canary Islands. In Proceedings of the EGU General Assembly Conference, Vienna, Austria, 23–27 May 2022; p. EGU22-7705. [Google Scholar] [CrossRef]
- Arnoso, J.; Riccardi, U.; Tammaro, U.; Benavent, M.; Montesinos, F.G.; Vélez, E. 2D strain rate and ground deformation modelling from continuous and survey mode GNSS data in El Hierro, Canary Islands. In Proceedings of the 5th Joint International Symposium on Deformation Monitoring (JISDM), Valencia, Spain, 20–22 June 2022. [Google Scholar] [CrossRef]
- Zumbergue, J.F.; Heflin, M.; Jefferson, D.C.; Watkins, M.; Webb, F. Precise Point Positioning for the Efficient And Robust Analysis of GPS Data from Large Networks. J. Geophys. Res. 1997, 102, 5005–5017. [Google Scholar] [CrossRef] [Green Version]
- Arnoso, J.; Benavent, M.; Bos, M.S.; Montesinos, F.G.; Vieira, R. Verifying the body tide at the Canary Islands using tidal gravimetry observations. J. Geodyn. 2011, 51, 358–365. [Google Scholar] [CrossRef]
- Folger, D.W.; McCullough, J.R.; Irwin, B.J.; Dodd, J.E.; Strahle, W.J.; Polloni, C.F.; Bouse, R.M. Map showing free-air gravity anomalies around the Canary Islands, Spain. In Miscellaneous Field Studies Map; MF-2098-B; United States Geological Survey: Resteon, VA, USA, 1990. [Google Scholar]
- Morelli, C.; Gantar, C.; Honkasalo, T.; McConnell, R.K.; Tanner, I.G.; Szabo, B.; Uotila, U.; Whalen, C.T. The International Gravity Standardisation Net 1971 (IGSN71); International Association of Geodesy: Paris, France, 1974. [Google Scholar]
- Kane, M.F. A comprehensive system of terrain corrections using a digital computer. Geophysics 1962, XXVII, 455–462. [Google Scholar] [CrossRef]
- Nagy, D. The Gravitational Attraction of a Right Rectangular Prism. Geophysics 1966, 31, 362–371. [Google Scholar] [CrossRef]
- Camacho, A.G.; Fernández, J.; González, P.J.; Rundle, J.B.; Prieto, J.F.; Arjona, A. Structural results for La Palma Island using 3-D gravity inversion. J. Geophys. Res. Solid Earth 2009, 114, B05411. [Google Scholar] [CrossRef] [Green Version]
- Aparicio, S.S.; Martí, J.; Montesinos, F.G.; Gómez, A.B.; de Pablo, J.P.; Fernández, P.V.; García-Maroto, M.C. Gravimetric study of the shallow basaltic plumbing system of Tenerife, Canary Islands. Phys. Earth Planet Inter. 2019, 297, 106319. [Google Scholar] [CrossRef]
- Barzaghi, R.; Sansò, F. Remarks on the inverse gravimetric problem. Geophys. J. R. Astronom. Soc. 1986, 92, 505–511. [Google Scholar]
- Moritz, H. Advanced Physical Geodesy, 2nd ed.; University of Michigan: Dearborn, MI, USA; Wichmann: Karlsruhe, Germany, 1989; 500p. [Google Scholar]
- Syberg, F.J.R. Potential field continuation between general surfaces. Geophys. Prospect. 1972, 20, 267–282. [Google Scholar] [CrossRef]
- Ye, S.; Canales, J.P.; Rihm, R.; Dañobeitia, J.J.; Gallart, J. A crustal transect trough in the northern and northeastern part of the volcanic edifice of Gran Canaria, Canary Islands. J. Geodyn. 1999, 28, 3–26. [Google Scholar] [CrossRef]
- De Zeeuw-van Dalfsen, E.; Rymer, H.; Sigmundsson, F.; Sturkell, E. Net gravity decreases at Askja volcano, Iceland: Constraints on processes responsible for continuous caldera deflation, 1988-2003. J. Volcanol. Geotherm. Res. 2005, 139, 227–239. [Google Scholar] [CrossRef]
- Zahorec, P.; Vajda, P.; Papco, J.; Sainz-Maza, S.; Pablo, J. Prediction of vertical gradient of gravity and its significance for volcano monitoring—Example from Teide volcano. Contrib. Geophys. Geod. 2016, 46, 203–220. [Google Scholar] [CrossRef] [Green Version]
- Del Fresno, C.; Cesca, S.; Klügel, A.; Domínguez Cerdeña, I.; Díaz-Suárez, E.A.; Dahm, T.; García-Cañada, L.; Meletlidis, S.; Milkereit, C.; Valenzuela-Malebrán, C.; et al. Magmatic plumbing and dynamic evolution of the 2021 La Palma eruption. Nat. Commun. 2023, 14, 358. [Google Scholar] [CrossRef] [PubMed]
- Gudmundsson, A. Rock Fractures in Geological Processes; Cambridge University Press: Cambridge, UK, 2011; 578p. [Google Scholar]
- Gudmundsson, A. Volcanotectonics; Cambridge University Press: Cambridge, UK, 2020; 586p. [Google Scholar]
- Hjelt, S.E. The gravity anomaly of a dipping prism. Geoexploration 1974, 12, 29–39. [Google Scholar] [CrossRef]
- González de Vallejo, L.; Hijazo Ramiro, T.; Ferrer Gijón, M. Engineering geological properties of the volcanic rocks and soils of the Canary Islands. Soils Rocks 2008, 31, 3–13. [Google Scholar] [CrossRef]
- Rodríguez-Losada, J.A.; Hernández-Gutiérrez, L.E.; Olalla, C.; Perucho, A.; Serrano, A.; Eff-Darwich, A. Geomechanical param-eters of intact rocks and rock masses from the Canary Islands: Implications on their flank stability. J. Volcanol. Geotherm. Res. 2009, 182, 67–75. [Google Scholar] [CrossRef]
- Lodge, A.; Nippress, S.E.J.; Rietbrock, A.; García-Yeguas, A.; Ibáñez, J.M. Evidence for magmatic underplating and partial melt beneath the Canary Islands derived using teleseismic receiver functions. Phys. Earth Planet. Inter. 2012, 212–213, 44–54. [Google Scholar] [CrossRef]
- Sanz-Mangas, D.; Galindo, I.; Pérez-López, R.; García-Davalillo, J.C.; Sánchez, N.; Rodríguez Pascua, M.A.; Perucha, M.A. Distal magmatic pulse injections at La Palma eruption 2021. In Proceedings of the Asamblea Hispano Portuguesa de Geodesia y Geofísica, Toledo, Spain, 28 November–1 December 2022. [Google Scholar]
- Galindo, I.; Gudmundsson, A. Basaltic feeder-dikes in rift zones: Geometry, emplacement, and effusion rates. Nat. Hazards Earth Syst. Sci. 2012, 12, 3683–3700. [Google Scholar] [CrossRef] [Green Version]
- Becerril, L.; Galindo, I.; Gudmundsson, A.; Morales, J.M. Depth of origin of magma in eruptions. Sci. Rep. 2013, 3, 2762. [Google Scholar] [CrossRef] [Green Version]
- Dzurisin, D. Volcano Deformation: New Geodetic Monitoring Techniques; Springer Science & Business Media: Berlin, Germany, 2006. [Google Scholar] [CrossRef]
- Toda, S.; Stein, R.S.; Sevilgen, V.; Lin, J. Coulomb 3.3 Graphic-rich deformation and stress-change software for earthquake, tectonic, and volcano research and teaching—User guide. US Geol. Surv. Open-File Rep. 2011, 1060, 63. [Google Scholar]
- Okada, Y. Internal deformation due to shear and tensile faults in a half-space. Bull. Seismol. Soc. Am. 1992, 82, 1018–1040. [Google Scholar] [CrossRef]
- Magee, C.; Stevenson, C.; Ebmeier, S.K.; Keir, D.; Hammond, J.; Gottsmann, J.H.; Whaler, K.A.; Schofield, N.; Jackson, C.; Petronis, M.S.; et al. Magma Plumbing Systems: A Geophysical Perspective. J. Petrol. 2018, 59, 217–1251. [Google Scholar] [CrossRef] [Green Version]
- White, R.; McCausland, W. Volcano-tectonic earthquakes: A new tool for estimating intrusive volumes and forecasting eruptions. J. Volcanol. Geotherm. Res. 2016, 309, 139–155. [Google Scholar] [CrossRef] [Green Version]
- Battaglia, M.; Roberts, C.; Segall, P. Magma intrusion beneath Long Valley caldera confirmed by temporal changes in gravity. Science 1999, 285, 2119–2122. [Google Scholar] [CrossRef] [PubMed] [Green Version]
- Rymer, H.; Brown, G.C. Gravity fields and the interpretation of volcanic structures: Geological discrimination and temporal evolution. J. Volcanol. Geotherm. Res. 1986, 27, 229–254. [Google Scholar] [CrossRef]
- Mogi, K. Relations between the eruptions of various volcanoes and the deformations of the ground surface around them. Bull. Earthquake Res. Inst. 1958, 36, 99–134. [Google Scholar]
- Davis, P.M. Surface deformation due to inflation of an arbitrarily oriented triaxial ellipsoidal cavity in an elastic half-space, with reference to Kilauea volcano, Hawaii. J. Geophys. Res. Solid Earth 1986, 91, 7429–7438. [Google Scholar] [CrossRef]
- Yang, X.; Davis, P.M.; Dieterich, J.H. Deformation from inflation of a dipping finite prolate spheroid in an elastic half-space as a model for volcanic stressing. J. Geophys. Res. Solid Earth 1988, 7, 934249. [Google Scholar] [CrossRef]
- Fialko, Y.; Simons, M.; Khazan, Y. Finite source modeling of magmatic unrest in Socorro, New Mexico, and Long Valley, California. Geophys. J. Int. 2001, 146, 191–200. [Google Scholar] [CrossRef] [Green Version]
- Hartley, M.; Maclennan, J. Magmatic Densities Control Erupted Volumes in Icelandic Volcanic Systems. Front. Earth Sci. 2018, 6, 29. [Google Scholar] [CrossRef] [Green Version]
- Glazner, A.F.; Ussler, W. Trapping of magma at midcrustal density discontinuities. Geophys. Res. Lett. 1988, 15, 673–675. [Google Scholar] [CrossRef]
- Sainz-Maza, S.; Arnoso, J.; Montesinos, F.; Marti, J. Volcanic signatures in time gravity variations during the volcanic unrest on El Hierro (Canary Islands). J. Geophys. Res. Solid Earth 2014, 119, 5033–5051. [Google Scholar] [CrossRef] [Green Version]
- Marti, J.; Villaseñor, A.; Geyer, A.; Lopez, C.; Tryggvason, A. Stress barriers controlling lateral migration of magma revealed by seismic tomography. Sci. Rep. (UK) 2017, 7, 40757. [Google Scholar] [CrossRef] [Green Version]
- Miyakawa, A.; Sumita, T.; Okubo, Y.; Okuwaki, R.; Otsubo, M.; Uesawa, S.; Yagi, Y. Volcanic magma reservoir imaged as a low-density body beneath Aso volcano that terminated the 2016 Kumamoto earthquake rupture. Earth Planets Space 2016, 68, 1–9. [Google Scholar] [CrossRef] [Green Version]
- Gottsmann, J.; Camacho, A.G.; Marti, J.; Wooller, L.; Fernandez, J.; García, A.; Rymer, H. Shallow structure beneath the Central Volcanic Complex of Tenerife from new gravity data: Implications for its evolution and recent reactivation. Phys. Earth Planet Int. 2008, 168, 212–230. [Google Scholar] [CrossRef] [Green Version]
- Sainz-Maza, S.; Montesinos, F.; Marti, J.; Arnoso, J.; Calvo, M.; Borreguero, A. Structural interpretation of El Hierro (Canary Islands) rifts system from gravity inversion modelling. Tectonophysics 2017, 712, 72–81. [Google Scholar] [CrossRef] [Green Version]
- Maccaferri, F.; Bonafede, M.; Rivalta, E. A numerical model of dike propagation in layered elastic media. Geophys. J. Int. 2010, 180, 1107–1123. [Google Scholar] [CrossRef]
- Longpré, M.A. Reactivation of Cumbre Vieja volcano. Science 2021, 374, 1197–1198. [Google Scholar] [CrossRef]
- Day, J.M.D.; Troll, V.R.; Aulinas, A.; Deegan, F.M.; Geiger, H.; Carracedo, J.C.; Pinto, G.G.; Perez-Torrado, F.J. Mantle source characteristics and magmatic processes during the 2021 La Palma eruption. Earth Planet Sci. Lett. 2022, 597, 117793. [Google Scholar] [CrossRef]
- Klügel, A.; Hansteen, T.H.; Schmincke, H. Rates of magma ascent and depths of magma reservoirs beneath La Palma (Canary Islands). Terra Nova 2003, 9, 117–121. [Google Scholar] [CrossRef]
- Gudmundsson, A. Emplacement and arrest of sheets and dikes in central volcanoes. J. Volcanol. Geotherm. Res. 2002, 116, 279–298. [Google Scholar] [CrossRef]
- Barker, A.K.; Troll, V.R.; Carracedo, J.C.; Nicholls, P.A. The magma plumbing system for the 1971 Teneguía eruption on La Palma, Canary Islands. Contrib. Mineral. Petrol. 2015, 170, 1–21. [Google Scholar] [CrossRef]
- Klügel, A.; Schmincke, H.U.; White, J.D.L.; Hoernle, K.A. Chronology and volcanology of the 1949 multi-vent rift-zone eruption on La Palma (Canary Islands). J. Volcanol. Geotherm. Res. 1999, 94, 267–282. [Google Scholar] [CrossRef]
- Klügel, A.; Hoernle, K.A.; Schmincke, H.U.; White, J.D.L. The chemically zoned 1949 eruption on La Palma (Canary Islands): Petrologic evolution and magma supply dynamics of a rift-zone eruption. J. Geophys. Res. Solid Earth 2000, 105, 5997–6016. [Google Scholar] [CrossRef] [Green Version]
- Nettleton, L.L. Determination of density for reduction of gravimeter observations. Geophysics 1939, 4, 176–183. [Google Scholar] [CrossRef]
- Camacho, A.G.; Montesinos, F.G.; Vieira, R.; Arnoso, J. Modelling of crustal anomalies of Lanzarote (Canary Islands) in light of gravity data. Geophys. J. Int. 2001, 147, 403–414. [Google Scholar] [CrossRef] [Green Version]
- Camacho, A.; Montesinos, F.; Vieira, R. A 3-D gravity inversion by means of growing bodies. Geophysics 2000, 65, 95–101. [Google Scholar] [CrossRef]
- Montesinos, F.G.; Arnoso, J.; Benavent, M.; Vieira, R. The crustal structure of El Hierro (Canary Islands) from 3-D gravity inversion. J. Volcanol. Geotherm. Res. 2006, 150, 283–299. [Google Scholar] [CrossRef]
- Montesinos, F.; Arnoso, J.; Vieira, R.; Benavent, M. Subsurface geometry and structural evolution of La Gomera island based on gravity data. J. Volcanol. Geotherm. Res. 2011, 199, 105–117. [Google Scholar] [CrossRef]
- Spector, A.; Grant, F.S. Statistical methods for interpreting aeromagnetic data. Geophysics 1970, 35, 293–302. [Google Scholar] [CrossRef]
- Ranero, C.R.; Torne, M.; Banda, E. Gravity and multichannel seismic reflection constraints on the lithospheric structure of the Canary Swell. Mar. Geophys. Res. 1995, 17, 519–534. [Google Scholar] [CrossRef]
- Murase, T.; McBirney, A. Properties of Some Common Igneous Rocks and Their Melts at High Temperatures. GSA Bull. 1973, 84, 3563–3592. [Google Scholar] [CrossRef]
- Haimson, B.C.; Rummel, F. Hydrofracturing stress measurements in the Iceland research drilling project drill hole at Reydarfjordur, Iceland. J. Geophys. Res. Solid Earth 1982, 87, 6631–6649. [Google Scholar] [CrossRef]
- Schultz, C.R.A. Limits on strength and deformation properties of jointed basaltic rock masses. Rock Mech. Rock Eng. 1995, 28, 1–15. [Google Scholar] [CrossRef]
- IGN. Noticias e Informe Mensual de Vigilancia Volcánica. Available online: https://www.ign.es/web/resources/volcanologia/html/CA_noticias_2021.html#20211225 (accessed on 12 September 2021).


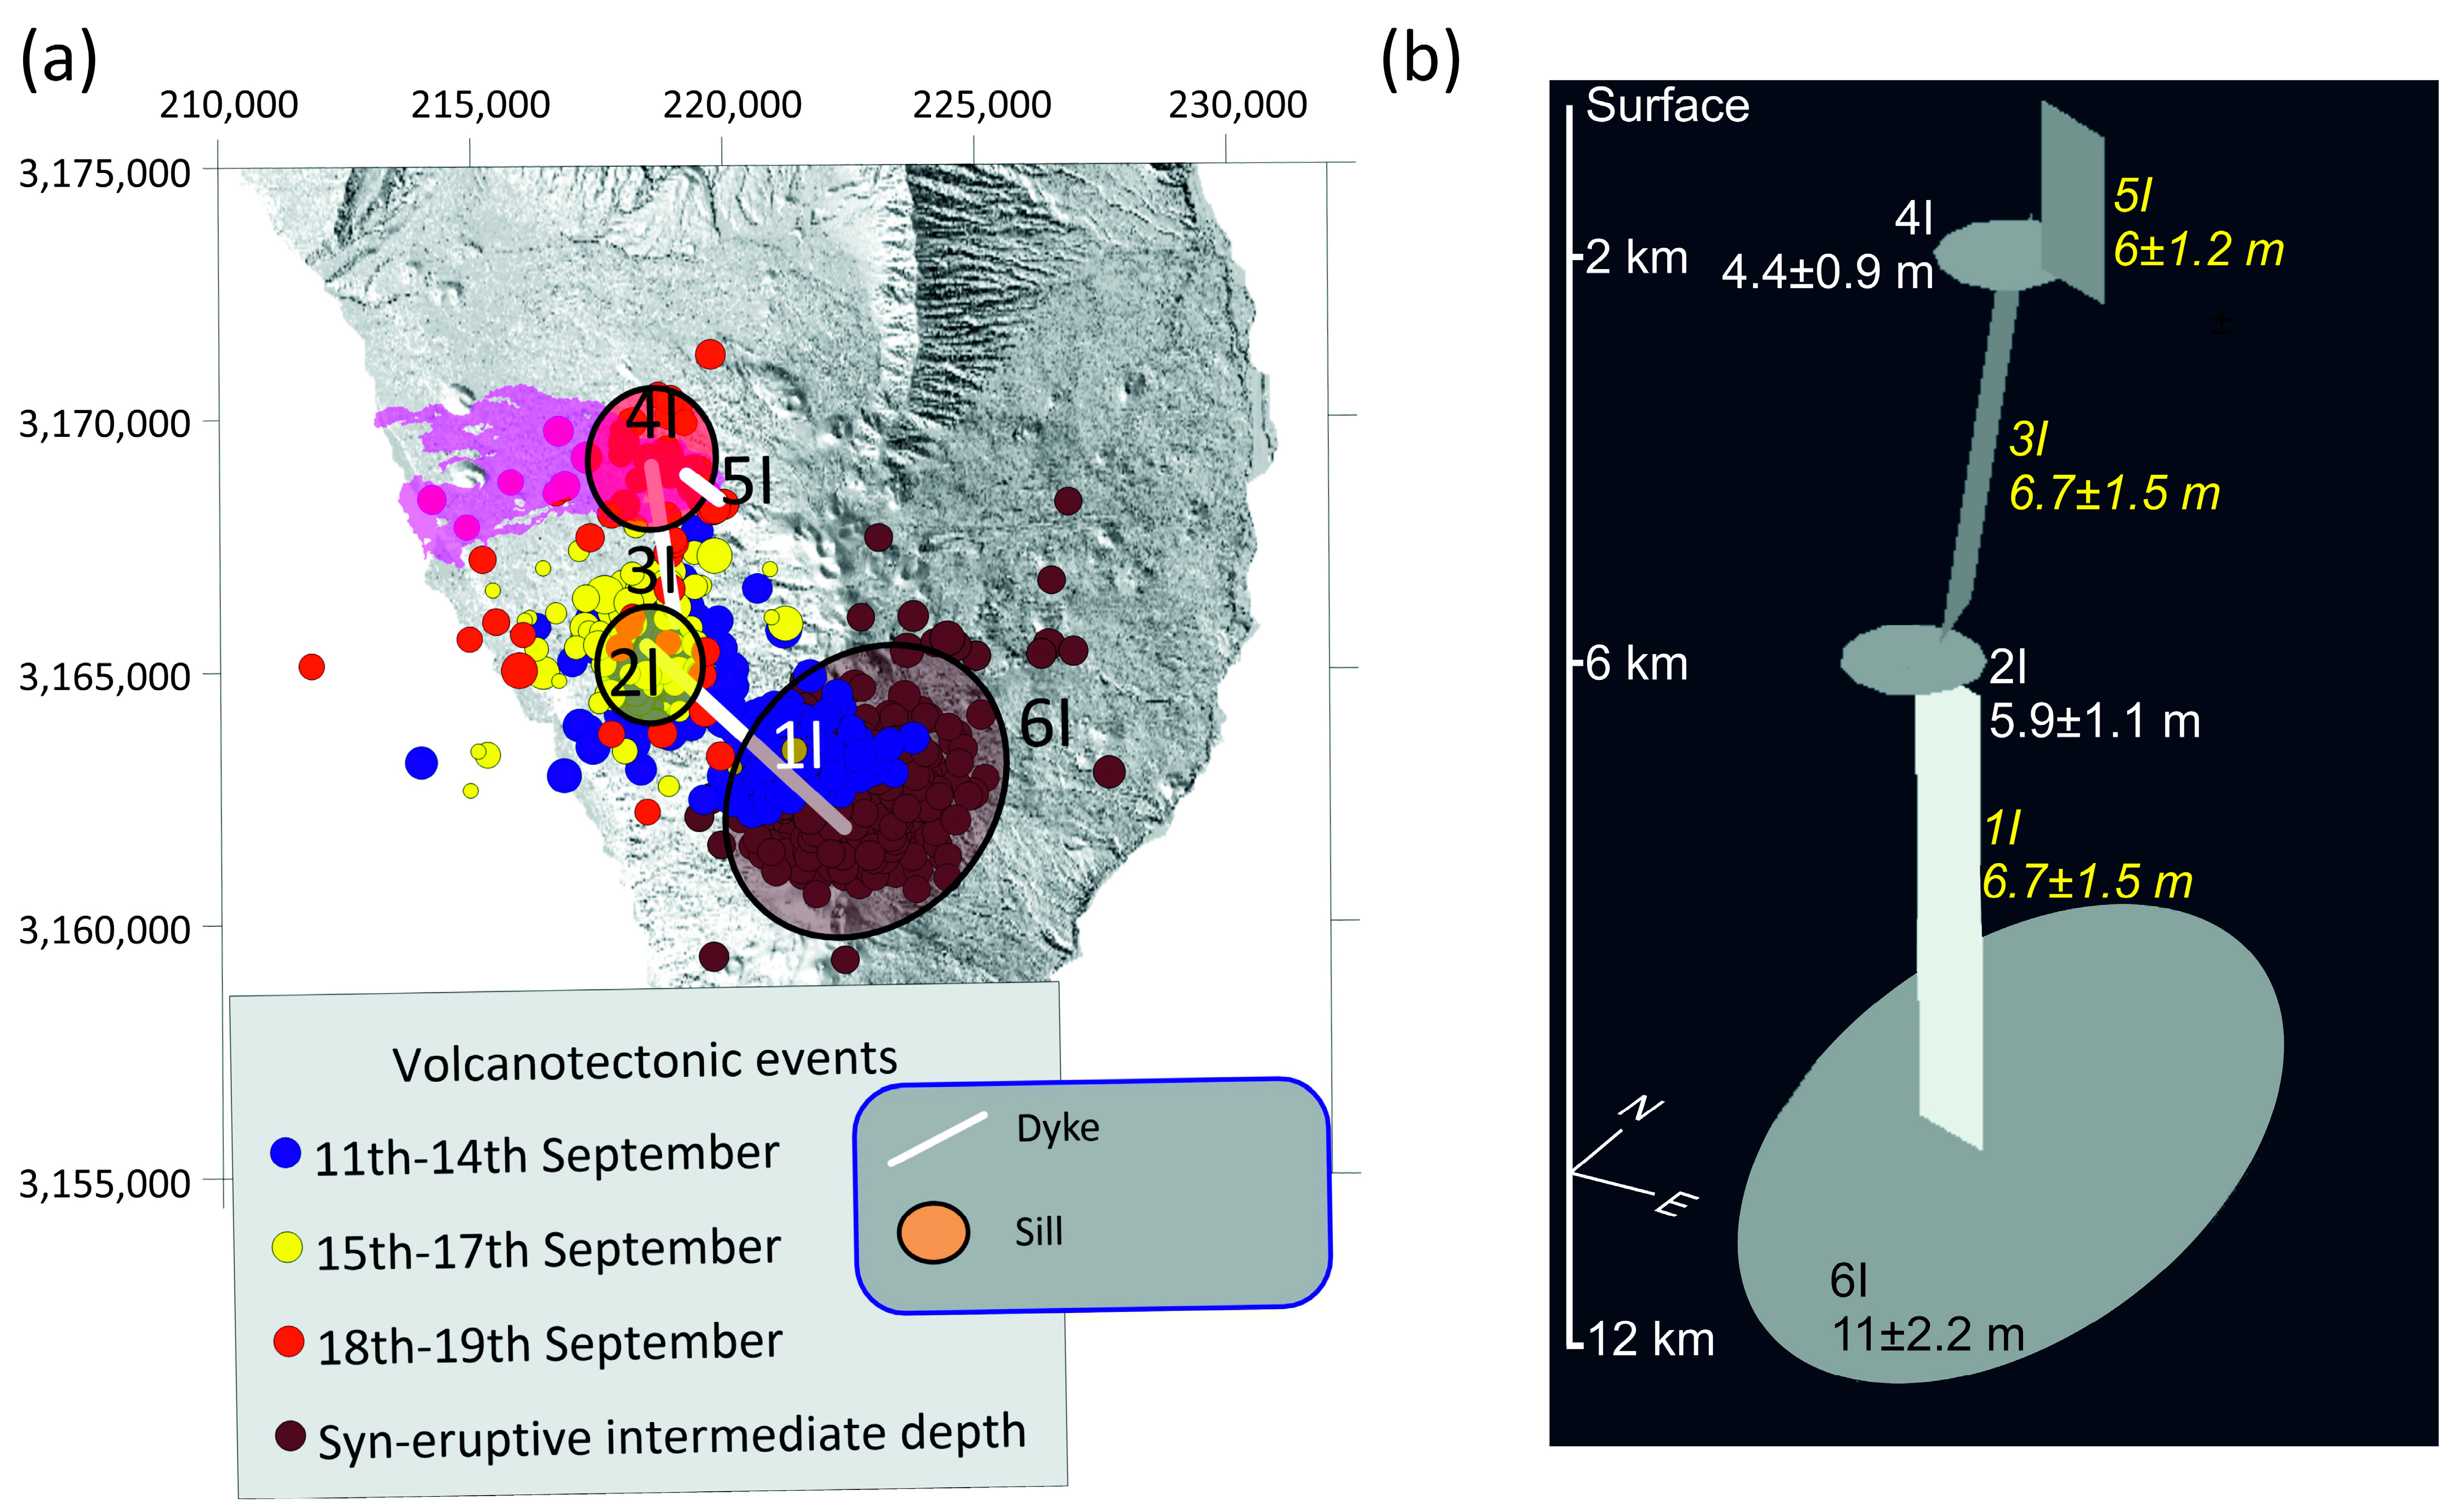
| Element | Date | Center Coordinates | Cross-Sectional Area/Radius (m2/m) | Depth (m) | Thickness (m) | Dip Angle | Azimuth (North) | |
|---|---|---|---|---|---|---|---|---|
| E-UTM | N-UTM | |||||||
| 1I-Dike | 11–14 September | 218,600 | 3,165,100 | 1000 × 6.7 | (−12,000, −6000) | 40° | 133° | |
| 2I-Sill | 15–17 September | 218,600 | 3,165,100 | 1000 | −6000 | 5.9 | ||
| 3I-Dike | 18–19 September | 218,600 | 3,168,200 | 1000 × 6.7 | (−6000, −2000) | 55° | 170° | |
| 4I-Sill | 19 September | 218,500 | 3,169,000 | 1700 | −2000 | 4.4 | ||
| 5I-Eruptive fissure | 19 September | 219,000 | 3,168,800 | 1000 × 6 | (−2000, 1100) | 90° | 133° | |
| 6I-Sill | Eruptive period | 222,700 | 3,162,950 | 2800 | −12,000 | 11 | ||
| Number | Element | Center Coordinates | dx (m) | dy (m) | Top (m) | Bottom (m) | Dip Angle | Azimuth | |
|---|---|---|---|---|---|---|---|---|---|
| E-UTM | N-UTM | ||||||||
| 1I | Dike | 218,600 | 3,165,100 | 1000 | 6.7 | −6000 | −12,000 | 40° | 133° |
| 2I | Sill | 218,600 | 3,165,100 | 2000 | 2000 | −5994 | −6000 | 0° | 0° |
| 3I | Dike | 218,600 | 3,168,200 | 1000 | 6.7 | −2000 | −6000 | 55° | 170° |
| 4I | Sill | 218,500 | 3,169,000 | 2500 | 2500 | −1996 | −2000 | 0° | 0° |
| 5I | Eruptive fissure | 219,000 | 3,168,800 | 1000 | 6 | 1100 | −2000 | 90° | 133° |
| 6I | Sill | 222,700 | 3,162,950 | 7000 | 4000 | −11,989 | −12,000 | 0° | 40° |
| Number | Element | Center Coordinates | dx (m) | dy (m) | Top (m) | Bottom (m) | Dip Angle | Azimuth (North) | |
|---|---|---|---|---|---|---|---|---|---|
| E-UTM | N-UTM | ||||||||
| 1F | Dike | 218,600 | 3,165,100 | 1000 | 7 | −6000 | −12,000 | 57° | 133° |
| 2F | Sill | 218,600 | 3,165,100 | 2500 | 2000 | −5994 | −6000 | 0° | 90° |
| 3F | Dike | 218,600 | 3,165,100 | 500 | 2.5 | −1000 | −6000 | 50° | 170° |
| 4F | Sill | 218,500 | 3,160,200 | 2600 | 2600 | −995 | −1000 | 0° | 0° |
| 5F | Dike | 218,600 | 3,168,200 | 1000 | 7 | −2000 | −6000 | 55° | 170° |
| 6F | sill | 219,529 | 3,168,835 | 2500 | 2500 | −1994 | −2000 | 0° | 145° |
| 7F | Eruptive fissure | 219,600 | 3,168,700 | 1000 | 6 | 1100 | −2000 | 90° | 133° |
| 8F | Sill | 223,300 | 3,162,500 | 7000 | 2500 | −11,988 | −12,000 | 0° | 40° |
Disclaimer/Publisher’s Note: The statements, opinions and data contained in all publications are solely those of the individual author(s) and contributor(s) and not of MDPI and/or the editor(s). MDPI and/or the editor(s) disclaim responsibility for any injury to people or property resulting from any ideas, methods, instructions or products referred to in the content. |
© 2023 by the authors. Licensee MDPI, Basel, Switzerland. This article is an open access article distributed under the terms and conditions of the Creative Commons Attribution (CC BY) license (https://creativecommons.org/licenses/by/4.0/).
Share and Cite
Montesinos, F.G.; Sainz-Maza, S.; Gómez-Ortiz, D.; Arnoso, J.; Blanco-Montenegro, I.; Benavent, M.; Vélez, E.; Sánchez, N.; Martín-Crespo, T. Insights into the Magmatic Feeding System of the 2021 Eruption at Cumbre Vieja (La Palma, Canary Islands) Inferred from Gravity Data Modeling. Remote Sens. 2023, 15, 1936. https://doi.org/10.3390/rs15071936
Montesinos FG, Sainz-Maza S, Gómez-Ortiz D, Arnoso J, Blanco-Montenegro I, Benavent M, Vélez E, Sánchez N, Martín-Crespo T. Insights into the Magmatic Feeding System of the 2021 Eruption at Cumbre Vieja (La Palma, Canary Islands) Inferred from Gravity Data Modeling. Remote Sensing. 2023; 15(7):1936. https://doi.org/10.3390/rs15071936
Chicago/Turabian StyleMontesinos, Fuensanta G., Sergio Sainz-Maza, David Gómez-Ortiz, José Arnoso, Isabel Blanco-Montenegro, Maite Benavent, Emilio Vélez, Nieves Sánchez, and Tomás Martín-Crespo. 2023. "Insights into the Magmatic Feeding System of the 2021 Eruption at Cumbre Vieja (La Palma, Canary Islands) Inferred from Gravity Data Modeling" Remote Sensing 15, no. 7: 1936. https://doi.org/10.3390/rs15071936