Article

Validation of FY-4A Temperature Profiles by Radiosonde Observations in Taklimakan Desert in China

1
Institute of Desert Meteorology, China Meteorological Administration, Urumqi 830002, China
2
National Observation and Research Station of Desert Meteorology, Taklimakan Desert of Xinjiang, Urumqi 830002, China
3
Taklimakan Desert Meteorology Field Experiment Station of China Meteorological Administration, Urumqi 830002, China
4
Xinjiang Key Laboratory of Desert Meteorology and Sandstorm, Urumqi 830002, China
5
State Key Laboratory of Numerical Modeling for Atmospheric Sciences and Geophysical Fluid Dynamics, Institute of Atmospheric Physics, Chinese Academy of Sciences, Beijing 100029, China
6
College of Earth and Planetary Sciences, University of Chinese Academy of Sciences, Beijing 100049, China
*
Author to whom correspondence should be addressed.
Remote Sens. 2023, 15(11), 2925; https://doi.org/10.3390/rs15112925
Submission received: 14 April 2023 / Revised: 23 May 2023 / Accepted: 2 June 2023 / Published: 3 June 2023

Abstract

:
The atmospheric temperature profiles (ATPs) retrieved through the geostationary Interferometric Infrared Sounder (GIIRS) onboard the FY-4A satellite (GIIRS/FY-4A) can effectively fill the gap of the scarce conventional sounding data in the Taklimakan Desert (TD), the second largest desert in the world, with an area of 330,000 square kilometers. In this study, we take the experimental radiosonde observations (RAOB) from one RAOB station in the hinterland of TD and seven conventional radiosondes in the oasis region around the desert as the true values and analyze the bias distribution characteristics of GIIRS/FY-4A ATPs with quality control (QC) flags 0 or 1 for this region. In addition, a bias comparison is made with GIIRS/FY-4A ATPs, and the fifth generation ECMWF atmospheric reanalysis of the global climate (ERA5) ATPs. The results show that (1) Missing measurements in GIIRS/FY-4A ATPs are the most frequent in the near-surface layer, accounting for more than 80% of all the retrieved grid points. The averaged total proportion of GIIRS/FY-4A ATPs with QC marks 0 or 1 is about 33.06%. (2) The root mean square error (RMSE) of GIIRS/FY-4A ATPs is less than 3 K, smaller than that of ERA5 ATPs. The RMSE of ERA5 ATPs can exceed 10 K in the desert hinterland. The absolute mean biases of GIIRS/FY-4A ATPs and ERA5 ATPs are, respectively, smaller than 3 K and 2 K, the former being slightly larger. The correlation coefficients of GIIRS/FY-4A ATPs with ERA5 ATPs and RAOB ATPs are higher than 0.98 and 0.99, respectively, and the correlation between GIIRS/FY-4A ATPs and RAOB ATPs is inferior to the latter. (3) The overall atmospheric temperature retrieved by GIIRS/FY-4A is 0.08 K higher than the temperature of RAOB, on average, while the overall temperature from ERA5 is 0.13 K lower than that of RAOB, indicating that the temperature profile obtained by integrating GIIRS/FY-4A ATPs and ERA5 ATPs may be much closer to RAOB ATPs. (4) The probability density of the GIIRS/FY-4A ATP biases in the TD region generally follows the Gaussian distribution so that it can be effectively assimilated in the 3-D variational assimilation modules. The probability density distribution characteristics of the GIIRS/FY-4A ATP biases in the desert hinterland and oasis are not much different. However, due to the fusion analysis of the relatively rich multi-source conventional observation data from the oasis stations, the probability density of ERA5 ATPs biases at the oasis stations is nearer to Gaussian distribution than that of the GIIRS/FY-4A ATPs. In the desert hinterland, where conventional observation is not enough, the probability density distributions of the ATPs biases from ERA5 and GIIRS/FY-4A are alike. Therefore, the GIIRS FY4A can contribute to a more accurate estimation of ERA5 ATPs in the TD region.

1. Introduction

As one of the thermodynamic parameters of the atmosphere, atmospheric temperature plays an important role in improving numerical simulation prediction and climate prediction [1]. In recent years, heavy rains in and around Taklimakan Desert (TD) have become more frequent than ever before [2]. Accurate and timely weather forecasts are crucial for people to respond disastrous weather because localized, severe storms with tens of millimeters of rain in a matter of hours can cause flash floods or mudslides on the slopes of the Tianshan and Kunlun Mountains near the Taklimakan Desert, and result in heavy casualties and economic loss [3]. Atmospheric temperature profiles (ATPs) can help explain the generation and development of extreme weather [4]. Since conventional meteorological observations in TD and its adjacent areas are very limited [5], high-resolution satellite remote sensing can effectively fill this gap of conventional observations in the region.
Satellite data occupy a large proportion of the Earth’s meteorological observations and are widely used in the operation and research of Numerical Weather Prediction (NWP) in the world [6,7,8,9,10]. Among satellite-based observation instruments, the infrared detector makes a great contribution to the forecast [7,8,9]. In the vision of the Global Observation System 2025, the World Meteorological Organization points out that the future global observation system should have at least 6 geostationary satellites and 3 polar-orbiting satellites. Both are to be equipped with an advanced hyperspectral infrared detector [11,12].
A hyperspectral infrared sounder has thousands of channels and high-spectral resolution, and it can accurately measure the vertical structure information of atmospheric temperature and humidity [13]. The existing hyperspectral atmospheric infrared sounder mainly includes (1) the Atmospheric Infrared Sounder (AIRS) mounted on the EOS-AQUA of the United States [14], which has 2378 infrared sounding channels with a spectral range of 650–2760 cm−1; (2) the Infrared Atmospheric Sounder Interferometer (IASI) mounted on the MeTOP-A/B/C of Europe has 8461 infrared detection channels with a spectral range of 645–2760 cm−1 [15]; and (3) the Cross-Track Infrared Sounder (CrIS) carried by the Suomi-NPP of the United States has 1305 channels in the range of 650–2550 cm−1, divided into three bands of long wave, medium wave and short wave, whose spectral ranges are 650–1095 cm−1, 1210–1750 cm−1 and 2155–2550 cm−1, respectively [16]. China has two in-orbit infrared hyperspectral sounding instruments: One is the high-spectral-resolution infrared atmospheric sounder (HIRAS) carried by the FY-3D, which contains 2275 channels. The other one is the interferometric atmospheric vertical detector GIIRS carried by the FY-4A satellite, carrying 1650 channels, and has two bands: long wave and medium wave, whose spectral ranges are 700–1130 cm−1 and 1650–2250 cm−1, respectively [17]. Almost all infrared instruments, except for GIIRS, are mounted on polar-orbiting satellites, and they have been widely used in global and regional numerical weather forecasting models at major operational centers. The assimilation of the measurements from infrared instruments on polar-orbiting satellites has significantly improved short- and medium-term numerical weather predictions [18,19,20]. Some other studies also found that the assimilating radiation value of the water vapor absorption band of GIIRS/FY-4A in the convective-scale regional model could adjust the horizontal and vertical distributions of water vapor in the model, especially in the boundary layer, thus having a positive effect in predicting severe storms, such as deep convection and tornadoes [21]. GIIRS mounted on geostationary satellites can provide time-continuous atmospheric detection information with high spectral resolution, and has broad application prospects in the monitoring, warning and forecasting of high-impact weather.
The accuracy of satellite data is the key factor in guaranteeing the smooth progress of scientific research and operations [11]. Before the data is used, it is necessary to master the retrieval accuracy of the data, in order to select the appropriate data for application. Scholars from China and other countries have done some research on GIIRS/FY-4A radiometric correction and quality evaluation. A retrieval atmospheric parameter model was established by using the artificial neural network method based on brightness temperature data obtained through the forward calculation of the atmospheric radiative transfer model. It was found that the retrieval accuracy of the atmospheric temperature profile based on this model was better in the troposphere than in the stratosphere. Furthermore, relative to the temperature data of the Infrared Atmospheric Sounding Interferometer (IASI), the quality of the GIIRS-retrieved temperature profile products below 500 hPa is better; however, for altitudes above 500 hPa, it is still inferior to that of the IASI-retrieved products [22]. Through evaluating the accuracy of the GIIRS/FY-4A temperature and humidity retrievals under conditions of cloudless and different cloud types by using global sounding data and Sunflower-8 satellite cloud classification products, the RMSE of GIIRS/FY-4A retrievals was found to be 2.1 K with clouds and 3.7 K without clouds. Different cloud types have different influences on the GIIRS retrievals, so the influence of clouds on detector retrieval should be considered when infrared detection is carried out [23]. The retrieval accuracy of GIIRS/FY-4A ATPs was studied during the Shanghai typhoon season while relying on the radiosonde data. The retrieval accuracy of the GIIRS/FY-4A ATPs was the highest when there was no cloud, with RMSE being only 1.74 K. In addition, the retrieval effect of the GIIRS/FY-4A ATPs in the middle and upper troposphere was closest to that of the radiosonde data. GIIRS/FY4A can also monitor the development of disastrous weather and the fine changes in atmospheric chemistry [24]. At present, most studies on GIIRS/FY-4A focus on instrument performance [25,26,27,28] and channel selection [
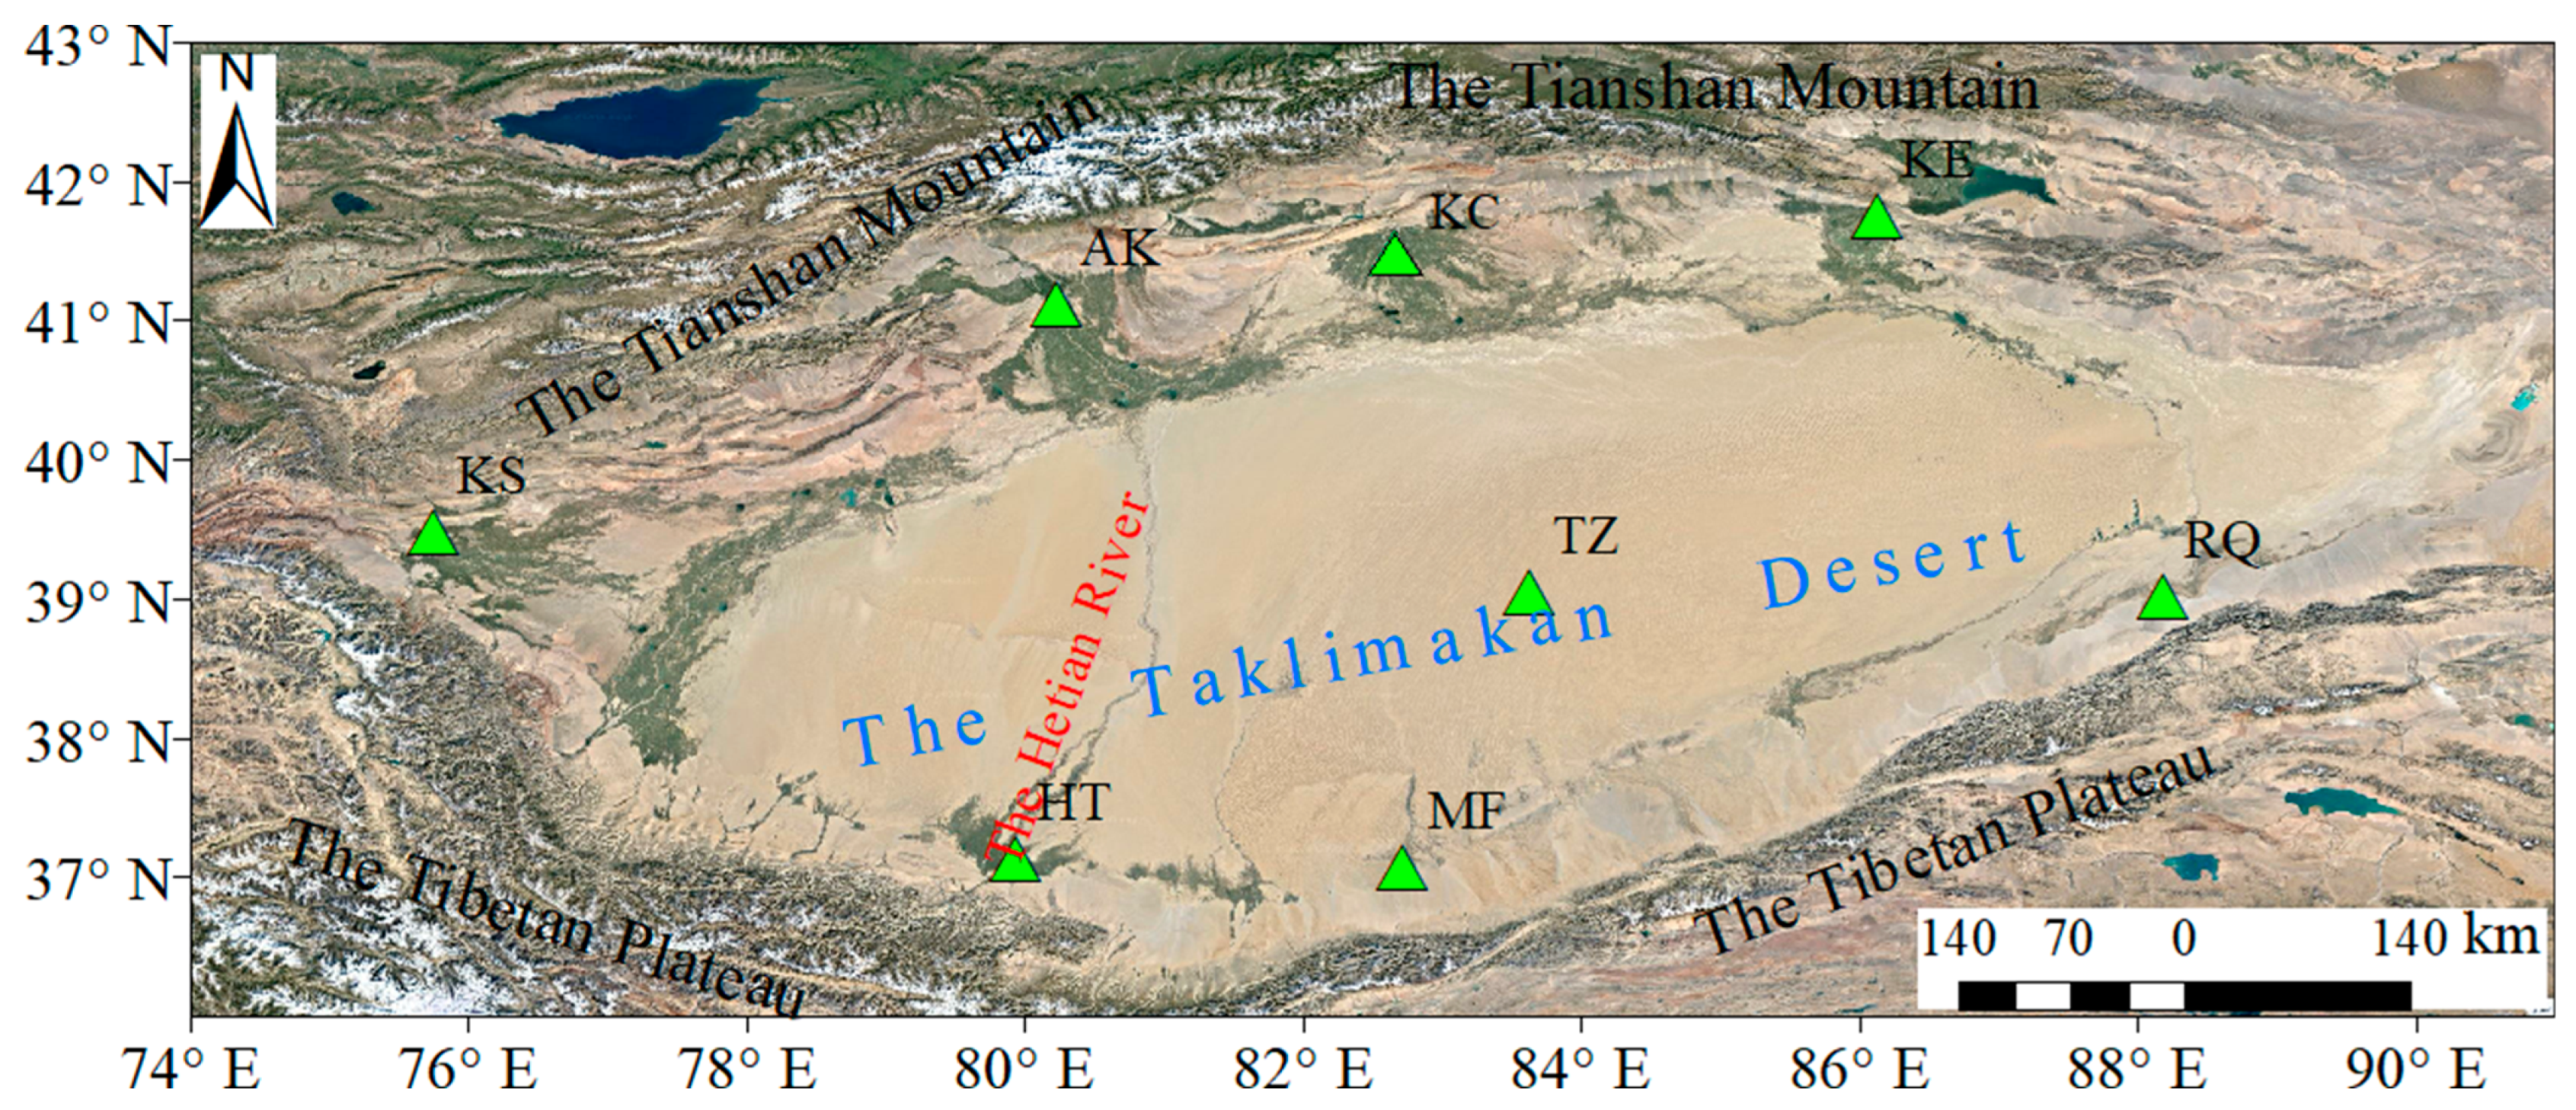
29], but there are few studies on its applicability in desert regions. In this paper, the GIIRS/FY-4A ATPs were compared with those of RAOBs, including seven routine sounding observations in oases around the Taklimakan Desert and one from a field experiment in July 2021 in the center of the desert [30]. The precision differences were also compared between the GIIRS/FY-4A ATPs and ERA5 ATPs, as well as between the desert and oasis.
The chapter arrangement of this paper is as follows: Section 2 will briefly introduce all kinds of observation data involved in this study and the authenticity test method of the FY-4A GIIRS temperature profile. In Section 3, the bias characteristics of GIIRS/FY-4A ATPs over TD are analyzed in detail. Conclusions are given in Section 4.

2. Materials and Methods

2.1. GIIRS/FY-4A ATPs

GIIRS/FY-4A detects infrared radiation in different spectral segments through a Michelson interference spectroscopy, so as to obtain the vertical distribution of atmospheric temperature and humidity, and to provide basic data for numerical weather prediction. At present, the regional detection target of GIIRS is mainly clear sky, and the scanning zone is mainly China (Figure 1). The working modes of GIIRS mainly include China region, full disk, region, solar avoidance, calibration, and pointing modes, which can be flexibly arranged according to ground commands [17]. GIIRS has time resolution 2 h and spatial resolution 16 km, with 1650 channels in the spectral range. Multi-frequency observation can be carried out in target weather. GIIRS/FY-4A ATPs are stored in a Netcdf format, having 101 layers vertically from 0.005 to 1100 hPa. It contains latitude and longitude information, pressure layer, temperature, and temperature QC and cloud detection data. The GIIRS/FY-4A ATPs are processed by the retrieval algorithm based on the radiance data from GIIRS onboard the FY-4A.
All the GIIRS/FY-4A ATPs’ data are divided into four categories: The measurements with QC flag equal to 0 are regarded as perfect observations, i.e., this category of dataset is the best; the measurements with QC flag equal to 1 are regarded as good observations, i.e., this category of dataset is generally acceptable; QC flag 2 is “bad”, i.e., the data is poor; QC flag 3 is labelled “Do not use”, i.e., the data is not available [23]. In this paper, invalid values of the system and GIIRS data with QC of more than or equal to 2 are excluded during the precision assessment.
To quantitatively investigate the influence of the different QC steps upon the remaining amount of the GIIRS/FY-4A ATPs in TD, the percentage of the GIIRS/FY-4A ATPs with different QC flags are compared (Figure 2). After filtering out the system’s invalid values, the maximum percentage of the effective GIIRS/FY-4A ATPs out of all grid numbers in and around TD (black line in Figure 2) is 96.11%, which appears above 100 hPa. It decreases with the altitude and reaches its minimum, 27.01%, near the ground. The unavailable ATPs take up the majority of all the GIIRS/FY-4A ATPs’ grid data within the target region, with the maximum percentage reaching 95.56% at the top of atmospheric layer. This high proportion decreases as the altitude decreases, with its minimum, 1.92%, near the land surface. Compared with the percentage profiles of effective retrievals and unavailable retrievals referred to above, the percentages of the bad, good and perfect retrievals are rather smaller, with their maxima being 24.89%, 14.59% and 49.12% above 200 hPa, their minima being equal to 0 near the ground, and their mean values being 11.38%, 6.24% and 26.32%, respectively.
Since only those GIIRS/FY-4A ATPs with QC flags equal to 0 or 1 are perfect or good [30], this part of the measurements is then further used in the accuracy evaluation of the GIIRS/FY-4A ATPs in TD. Further calculations show that the maximum percentage of the GIIRS/FY-4A ATPs with QC flags equal to 0 or 1 out of all the grid numbers in and around TD can reach up to 62.65% of all the retrieved grid points in the 101 layers on average, with its mean percentage being 33.06% (Table 1). This indicates that more than 64% of the GIIRS/FY-4A ATPs cannot be used in the evaluation in this study. This part of the GIIRS/FY-4A ATPs with QC flags equal to 2 or 3 has been filtered out due to their poor quality, and the ATPs with QC flags equal to 0 and 1 are kept in all the following sections. All the GIIRS/FY-4A ATPs referred to in the following parts represent those GIIRS/FY-4A ATPs with QC flags equal to 0 or 1.

2.2. RAOB ATPs

In this study, sounding datasets from seven routine sounding stations in the oasis around TD and a field experimental sounding station in the hinterland of TD are selected for comparative analysis (Figure 3, Table 1). This RAOB data can display radar azimuth and elevation values, and have the ability to view temperature, pressure, humidity curves and spherical coordinate curves in seconds during the release process. The time of the conventional RAOB is confined to July 2017 to be consistent with the duration of the field experiment. All the height ranges of these RAOB ATPs are, from land surface to altitude, over 25,000 m, on average. The vertical resolution of RAOB ATPs is 10 m.
Figure 3 shows the geophysical distribution of the RAOB stations, among which the field experimental sounding station (TZ) is situated in the hinterland of the Taklimakan Desert. The experimental radiosonde is equipped with a GPS sounding system and radiation detection system, which are to observe the meteorological elements such as air temperature, humidity, air pressure, wind direction, wind speed, etc. [31].
The green triangles indicate the geolocations of the 8 RAOB stations, with their names marked nearby. The names of TD (blue words), the Hetian River across TD (red words), and the mountains around TD (black words) are also given in their proper positions in this figure. As the topography and the land surface category are the two main influence factors for the quality of retrievals from satellite radiance [6], the altitudes and the land-use category of the eight selected RAOB stations are listed in Table 2, together with their exact geographical locations. It can be seen from the table that the altitudes of the eight stations are in the range of 888.3 m to 1409.3 m, of which the MF station has the highest topography, followed by the HT station. As for the land-use category, only the TZ station is located at a sheer desert site, while the three stations RQ, MF and HT are near a small-area oasis, and the other four stations (KE, KC, AK and KS) are inside a large-area oasis around TD.

2.3. ERA5 ATPs

ERA5 is the fifth-generation European Centre for Medium-Range Weather Forecasts (ECMWF) atmospheric reanalysis of the global climate. Reanalysis combines model data with observations from across the world into a globally complete and consistent dataset. ERA5 replaces its predecessor, the ERA-Interim reanalysis. ERA5 provides the reanalysis data of 0.25-degree resolution per hour and 37 levels vertically; the pressure of these 37 levels are 1 hPa, 2 hPa, 3 hPa, 5 hPa, 7 hPa, 10 hPa, 20 hPa, 30 hPa, 50 hPa, 70 hPa, 100 hPa, 125 hPa, 150 hPa, 175 hPa, 200 hPa, 225 hPa, 250 hPa, 300 hPa, 350 hPa, 400 hPa, 450 hPa, 500 hPa, 550 hPa, 600 hPa, 650 hPa, 700 hPa, 750 hPa, 775 hPa, 800 hPa, 825 hPa, 850 hPa, 875 hPa, 900 hPa, 925 hPa, 950 hPa, 975 hPa and 1000 hPa, respectively. Monthly reanalysis data are also available. However, there is no daily reanalysis data, so if users need daily reanalysis data, they need to download the hourly data for 24 h and then obtain the daily mean value by calculation, which can be used as the daily ERA5 datasets. The hourly ERA5 provides reanalysis values for each hour for over 56 reanalysis parameters, and air temperature is one of them. The ERA5 ATPs used in this study are available at https://cds.climate.copernicus.eu/cdsapp#!/dataset/reanalysis-era5-pressure-levels?tab=overview (accessed on 19 April 2022).

2.4. Methodology

In order to effectively and accurately evaluate the accuracy of the GIIRS ATPs in TD (76.0–91.0°E, 36.0–42.0°N) (Figure 3), it is necessary to match the temporal and spatial positions as well as the atmospheric vertical pressure layer of the data with that of the RAOB ATPs. The GIIRS ATPs with the smallest time interval from RAOB ATPs are selected for time matching, and the GIIRS ATPs with a horizontal distance within ±0.2° in latitude and longitude is selected for spatial information matching. To accurately assess the data quality of the GIIRS ATPs in the 101 barometric layers, the nearest neighbor point matching method is adopted to interpolate the barometric information of the RAOB ATPs to the 101 barometric layers consistent with the GIIRS ATPs’ data. It is worth mentioning that a lot of temperature data above 200 hPa are missing, and as the altitude of the selected stations range from 888.3 m to 1409.3 m, 850 hPa is considered the lowest level of the Tarim Basin where the TD is located, which is also necessary for a statistical comparison to grasp the main feature of temperature there. Similarly, since the ERA5 ATPs have only 37 vertical layers, the selected RAOB ATPs are also interpolated to the fixed 37 levels of the ERA5 ATPs to calculate the BIAS, RMSE and correlation between the ERA5 and RAOB ATPs.
The GIIRS/FY-4A ATPs are compared with the RAOB ATPs. Then the correlation coefficient, RMSE and BIAS are computed to provide a quantitative explanation. The BIAS here is defined as follows:
M B = 1 N n = 1 N f r r n
while that of RMSE is:
R M S E = 1 N n = 1 N f r r n 2 1 2
where the r and n indicate the retrieval and sounding time, and f r and r n represent the retrieved temperature and sounding temperature, respectively.
The correlation coefficients between the GIIRS/FY4A ATPs (or ERA5) and RAOB ATPs are calculated using the following equation:
C O R R = i = 1 n x i x ¯ y i y ¯ i = 1 n x i x ¯ 2 i = 1 n y i y ¯ 2
where the r is for the ordinal number of the ATPs, x i and y i for the ATPs of GIIRS/FY4A ATPs (or ERA5) and RAOB ATPs, x ¯ and y ¯ for the average of all x i and y i , respectively.
To further investigate the probability density distribution of the bias of both the ERA5 and GIIRS/FY-4A ATPs, the probability density histograms with Gaussian probability density function (PDF) curves fitted for their bias over all the eight stations are calculated, respectively. The Gaussian function used here is as follows:
y = y 0 + A e x p 0.5 x x c w 2
where the x c indicates the mean value of all the biases, w is the standard deviation, y0 is the minimum value of y and A is the top value of the PDF curve, which is equal to x c w 2 π .
To objectively judge whether the ERA5 ATPs and GIIRS/FY-4A ATPs follow the same pattern of probability distribution as the RAOB ATPs, their quantile-quantile plots (QQ-plot) are also given. The QQ-plot is a scatterplot that compares two sets of data, and it can actually be used to compare any two data sets to check for a relationship. It works with the data plotted from each data set on a different axis. If the distribution of the data is the same, the result will be a straight line.

3. Results

3.1. Vertical Distribution Features of RAOB ATPs in TD
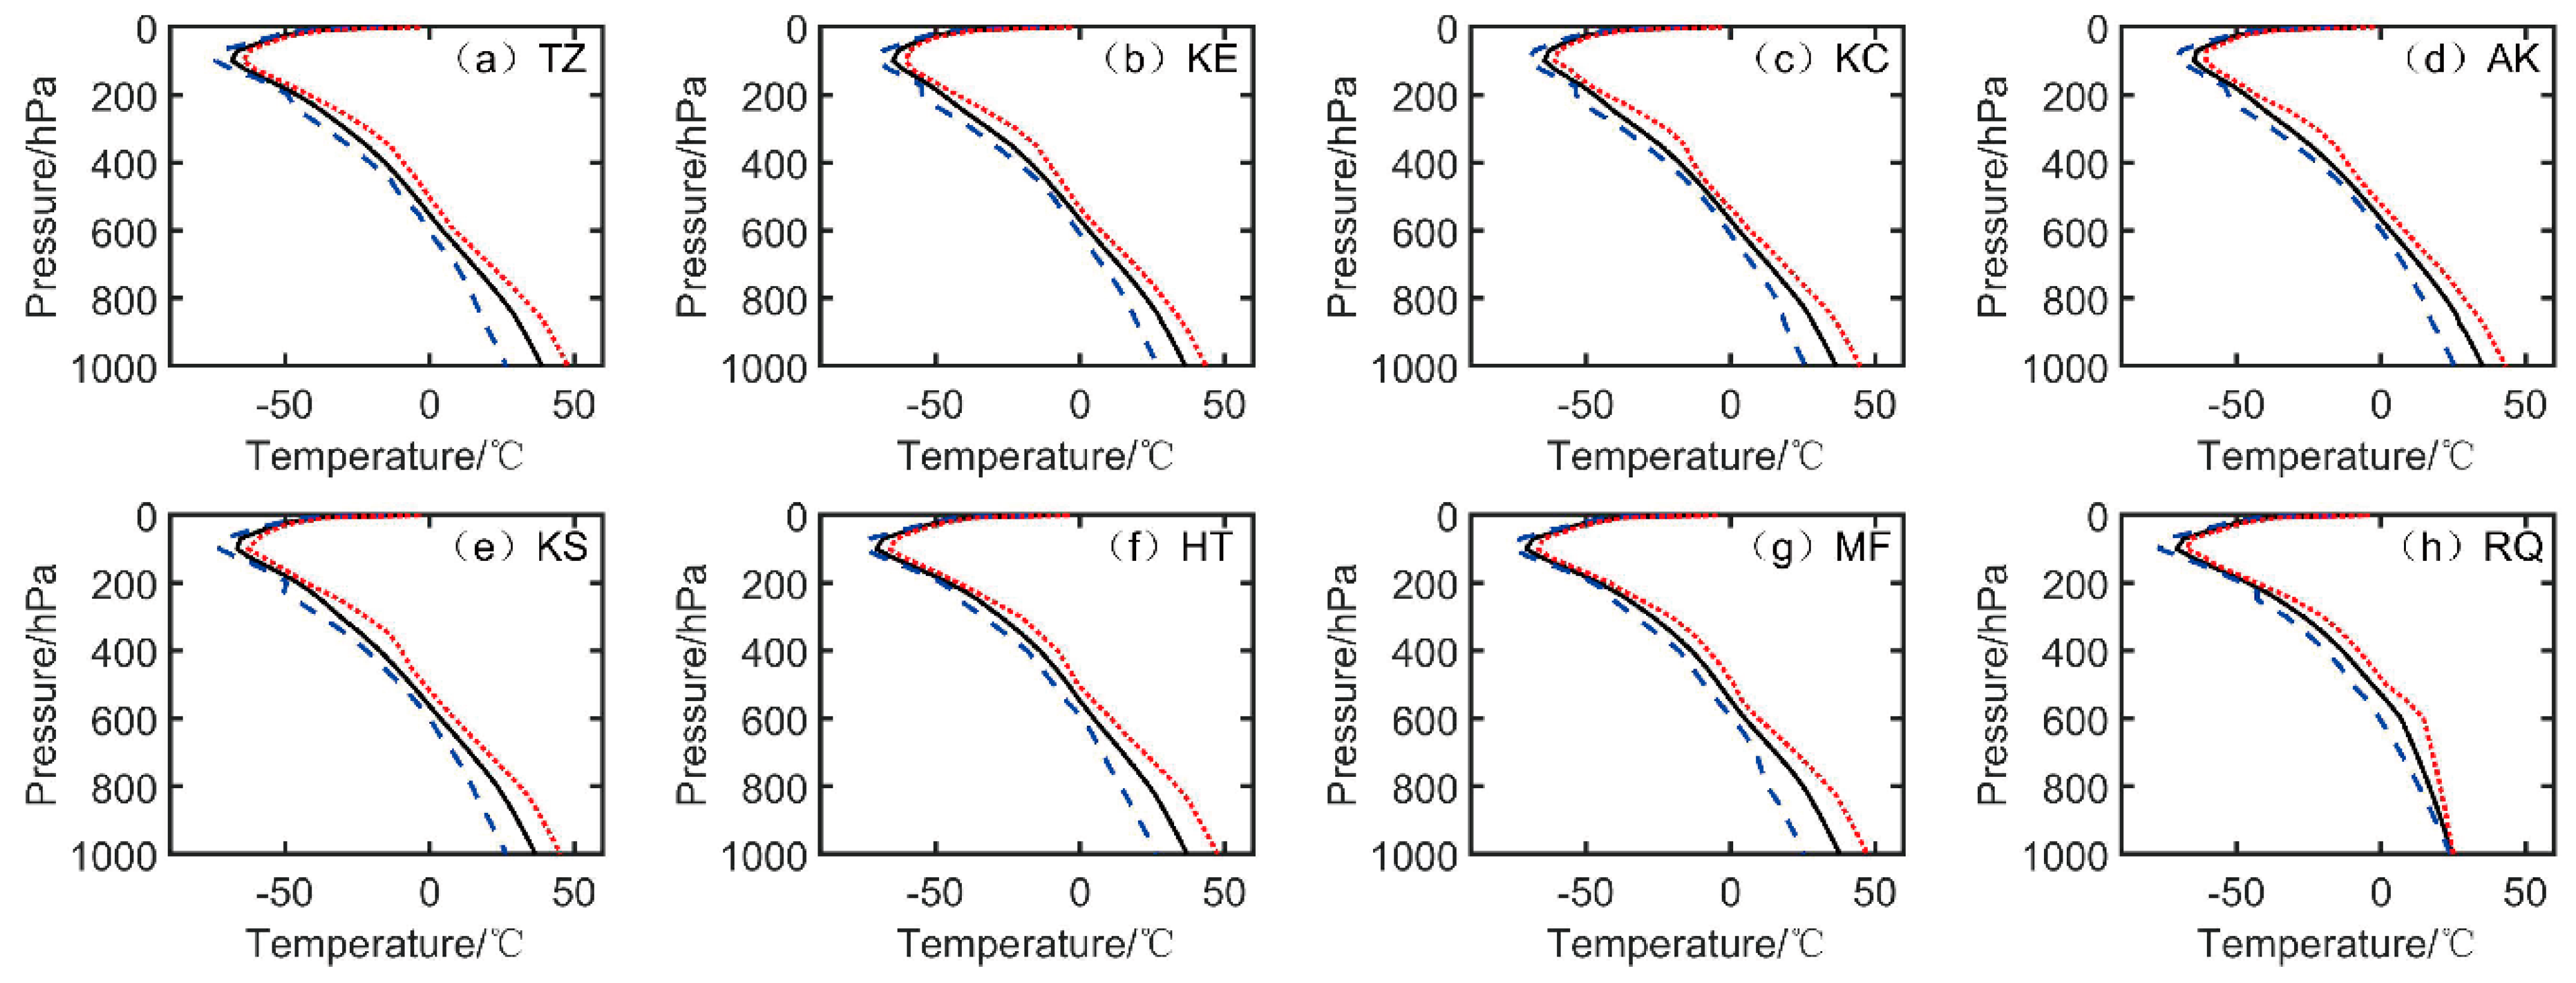
As shown in 
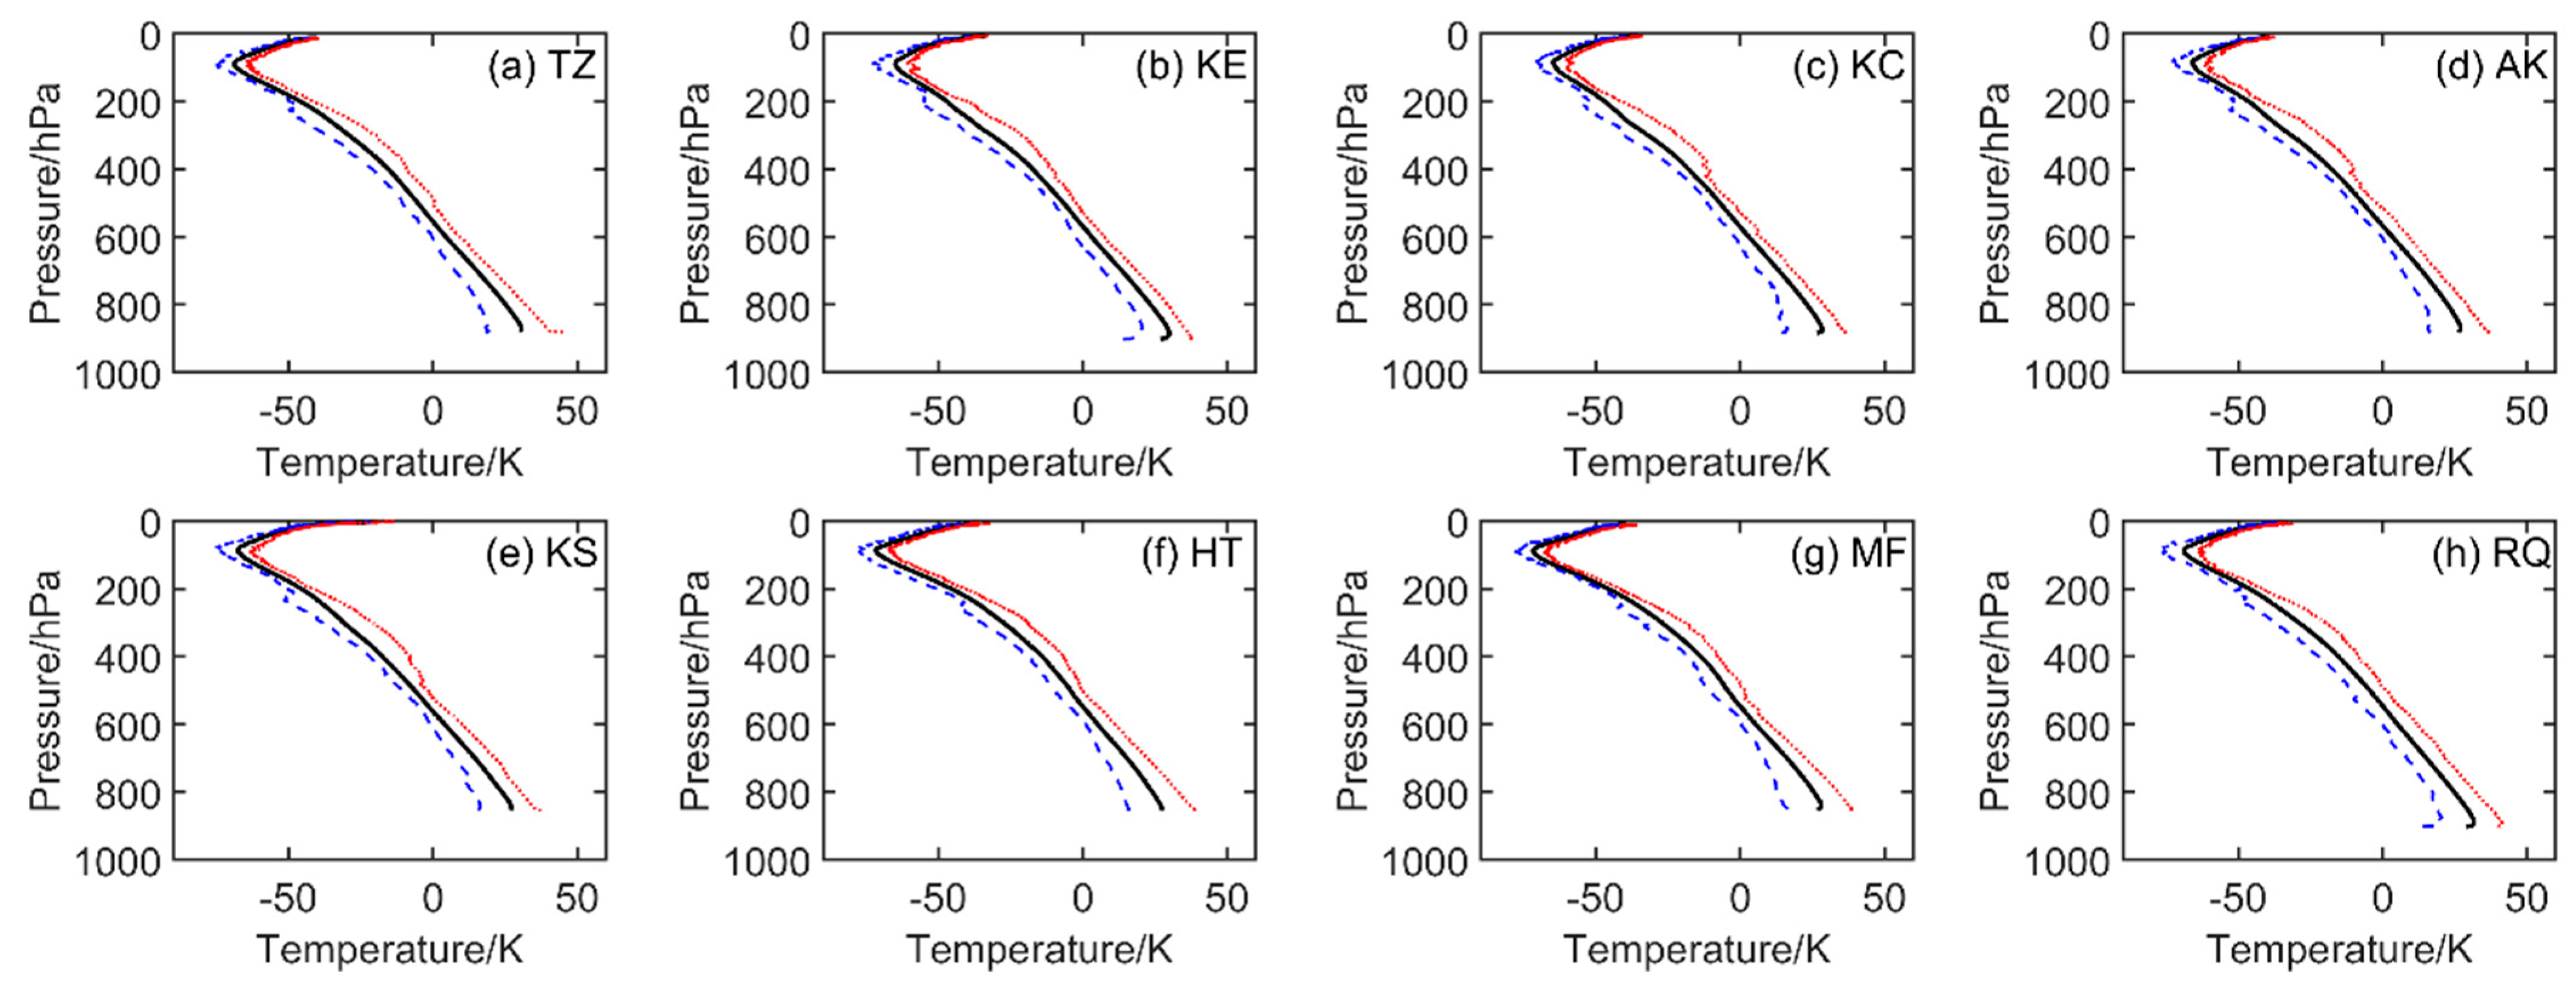
Figure 4, despite the different land-use category and topographic conditions, the discrepancies among all the ATPs over these eight stations are not very obvious in general. However, some minor differences are found in the lower atmospheric layers, especially in the near-ground layers below 800 hPa.
First, the maximum air temperature appears at near-ground layers at all of the eight stations, ranging from 36.7 °C at KC station to 45.0 °C at TZ station. A shallow thermal inversion layer is formed below 30 m above surface height, and then the air temperature decreases with the rising altitude, getting down to the minimum values near the altitude of 100 hPa. The minimum temperature ranges from −79 °C at KS station to −76.8 °C at KC station. Then the temperature increases again until the top layer of the RAOB measurements.
Second, the land–surface conditions have some impact upon the RAOB temperature measurements. For instance, a relatively higher temperature and the largest decreasing rate could be detected in the layers below 800 hPa at TZ station, where the soil type of its ground surface is sheer sand, and thus the actual maximum temperature in the near-ground layers at noon are rather high. The maximum air temperature at TZ station is approximately 45.0 °C at an altitude of 10 m, followed by that at RQ station, 41.5 °C. A sharp decrease in temperature below 30 m in altitude could only be detected at TZ station, and no similar phenomenon was presented by the RAOB ATPs at the other seven oasis stations. Meanwhile, there is a relatively lower minimum atmospheric temperature at altitude 10 m at KE station. The observation surroundings of KE are an oasis with abundant plants relative to other stations. Such a phenomenon clearly indicates the effect of the land–surface soil category on the near-ground temperature, but such an influence is rather limited at the altitude of the near-ground temperature, normally below the height of 30 m in general. In addition, there is a sharp increasing tendency of a minimum air temperature below 30 m at RQ station.
Finally, the changing ranges of air temperature in the lower troposphere below 700 hPa are relatively larger than that in the higher layer above 700 hPa. The maximum biases between the maximum and minimum temperatures at the eight stations all appear in the near-ground layers, with their overall temperature peak bias 27.0 °C appearing at TZ station, followed by 26.7 °C at RQ station, while the minimum temperature bias 21.6 °C is seen at AK station. This indicates that the land-use category not only affects the air temperature in the near-ground atmospheric layers, but also induces a discrepancy in the variation range of temperature, and that the variation range of air temperature in the near-ground layers in the hinterland of the TD desert is larger than that in the oasis region.

3.2. Vertical Distribution Features of ERA5 ATPs in TD

The vertical atmospheric thermodynamic structure presented by ERA5 is similar to that of RAOB, but an obvious discrepancy in the temperature variation range still exists between the two, especially in the lower troposphere (Figure 5). The ERA5 ATPs in all the atmospheric layers from 0 hPa to 1000 hPa are showed in Figure 5. The ERA5 ATPs under actual ground surface are to be removed according to the RAOB ATPs in the calculation process of the mean bias (MB), RMSE and correlations in Section 3.4 and Section 3.5, since the lowest altitude of the RAOB ATPs is the real terrain height of each station.
The monthly averaged ERA5 ATPs in July 2021 for the eight stations in TD shows that the maximum air temperature appears in the near-ground layers. Meanwhile, the ERA5 ATPs fail to reflect the shallow temperature inversion layer below the 30 m altitude presented in the RAOB ATPs. The minimum temperature appears near 100 hPa in the ERA5 ATPs.

3.3. Vertical Distribution Features of GIIRS/FY-4A ATPs in TD

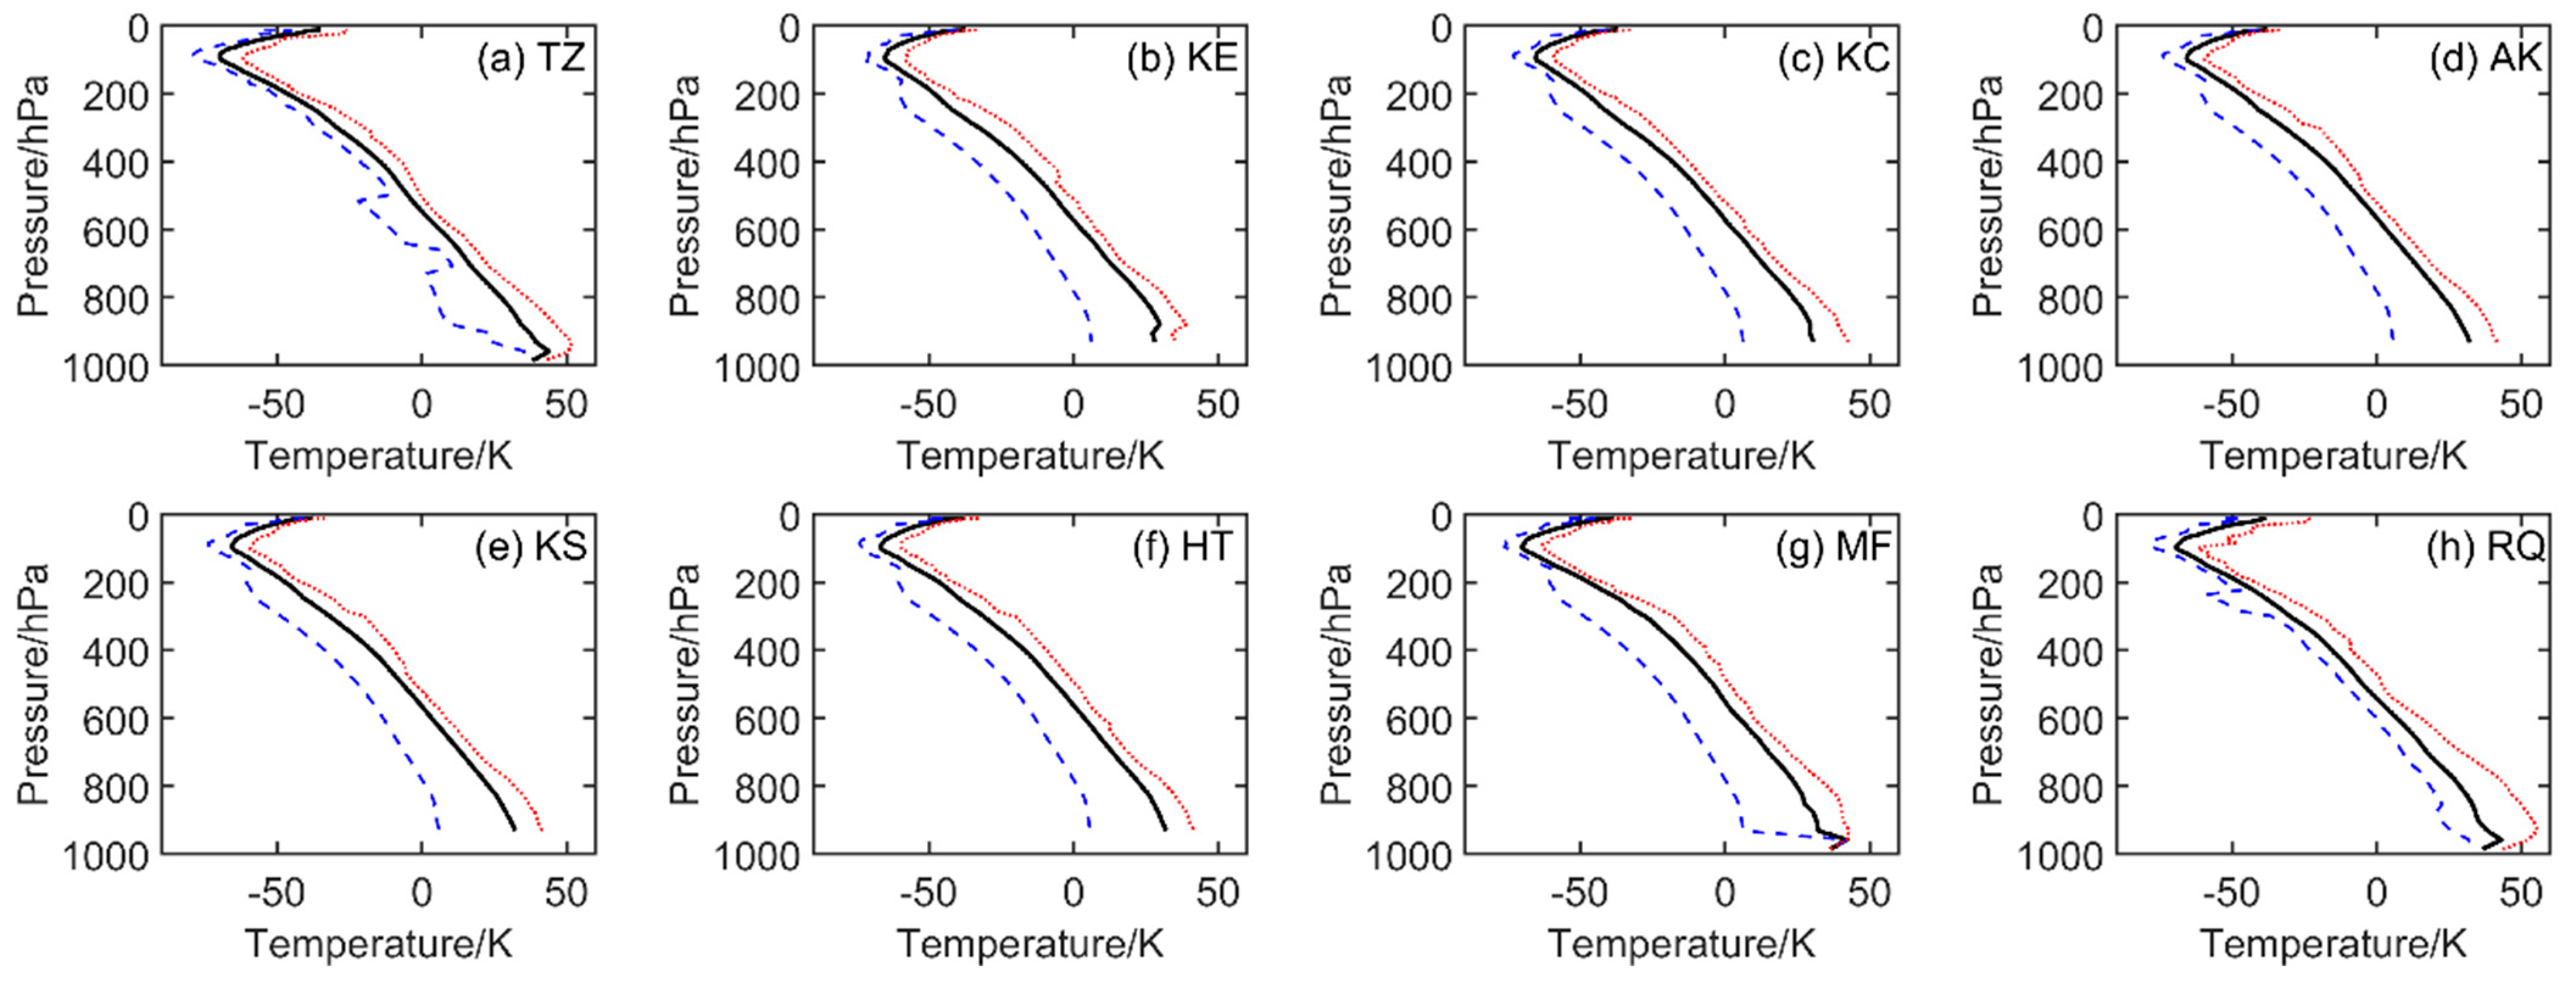
Relative to the RAOB ATPs, the ATP retrievals from GIIRS/FY-4A are rather different (Figure 6). The overall variation tendency of air temperature from the GIIRS/FY-4A ATPs with varying altitude is similar with that of the RAOB ATPs, but the variation amplitude of the GIIRS/FY-4A ATPs is much larger, especially in the lower layers. The maximum air temperature from the GIIRS/FY-4A ATPs ranges from 55.5 °C at RQ station to 39.0 °C at KE station in the near-ground layers, while the minimum air temperature of the GIIRS/FY-4A ATPs alters from −61.9 °C at TZ station again to −58.0 °C at KE station around 100 hPa. Due to the discrepancy in the topography of the eight RAOB stations, the effective GIIRS/FY-4A comparison could only be conducted in the altitudes between 11 and 931 hPa, that is, from level 11 to level 95 of the 101 layers in the retrieved atmospheric temperature profiles. At 931 hPa, the largest varying amplitude of temperature is 36.5 °C,at KC station, while the smallest is 27.1 °C, at TZ station. From this level to the level with the air pressure around 200 hPa, almost all the smallest variation ranges appear over the TZ in the hinterland of TD and the RQ, which is the oasis station with the relatively smallest oasis area. At 11 hPa, the largest varying range is 28.8 °C, at TZ station, and the smallest is 6.2 °C, at KE station.
Second, there is a relatively more obvious temperature inversion layer over stations TZ, KE and RQ relative to the RAOB ATPs. Such an inversion only exists at the lowest two layers, i.e., level 97 to level 96 of the GIIRS/FY-4A ATPs, with the air pressure varying from 986.1 hPa to 958.6 hPa. The temperature inversion and its varying range seem to be correlated to the air temperature rather than to the altitude above each individual station in the temperature retrievals, which is not as reasonable as that from RAOB.
Furthermore, the largest decreasing rate of the maximum temperature (dotted red lines in Figure 4) detected in the layers below 800 hPa at TZ station in RAOB cannot be seen in the retrieved ATPs there (dotted red lines in Figure 6), and the maximum temperature appears at RQ station instead of TZ station.

3.4. Biases and RMSE

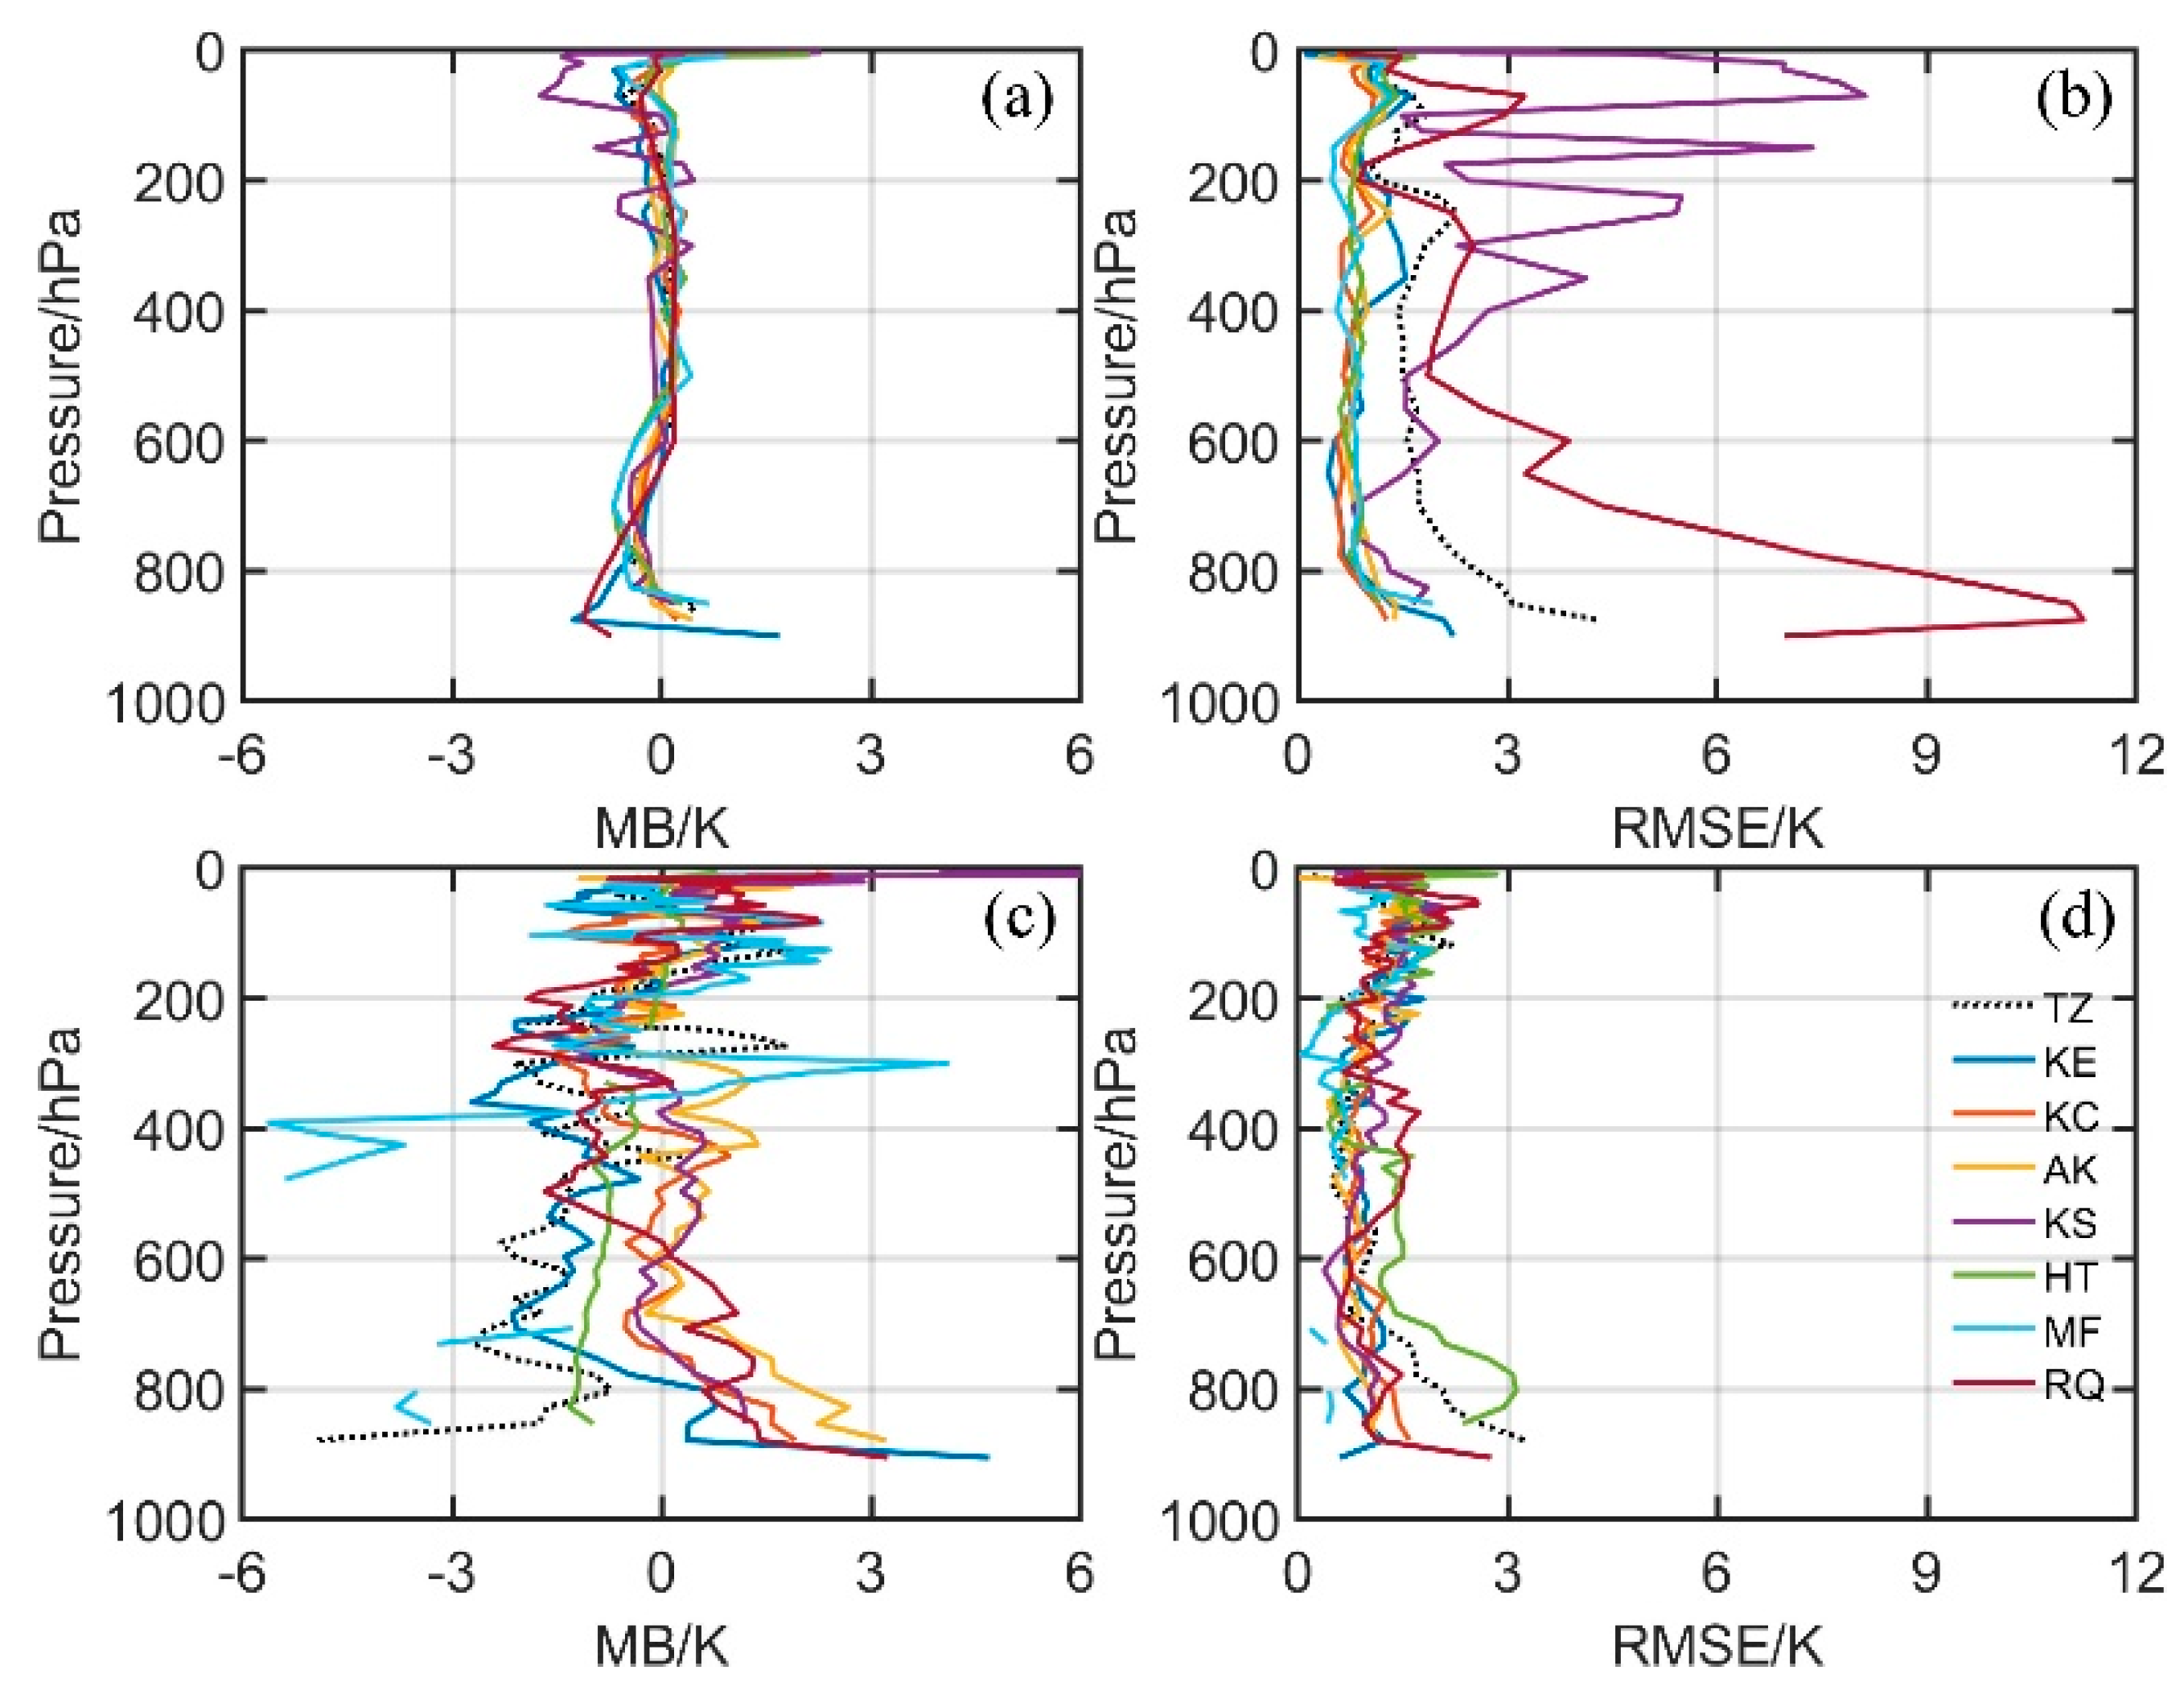
To quantitatively analyze the discrepancy of the ATPs between RAOB and GIIRS/FY4A, and further compare it with that of ERA5, the monthly averaged bias and RMSE of GIIRS/FY4A and ERA5 are calculated respectively (Figure 7).
The absolute values of mean biases of the ERA5 ATPs (Figure 7a) are generally smaller than 2 K for all the eight stations. The maximum temperature appears near the ground. Most of the mean bias values are less than 1 K in the middle layers between 800 hPa and 200 hPa. The monthly averaged RMSE of the ERA5 ATPs (Figure 7b) are generally within 3 K, except for that in the upper layers over KS station and that in the lower layers over RQ station. The maximum RMSE is about 11 K near land surface at RQ station, and it is 8 K at around 100 hPa at KS station.
Compared with the ERA5 ATPs, the absolute values of the mean bias of the GIIRS/FY-4A ATPs (Figure 7) are larger, but the RMSEs are smaller. Most of the biases of the GIIRS/FY-4A ATPs are less than 3 K, and their RMSEs are smaller than 3 K. The maximum bias and RMSE of the GIIRS/FY-4A ATPs both appear near the ground. It should be noted that both of the maximum absolute values of the negative bias and the maximum RMSE are at TZ station in the hinterland of TD, which implies that the land surface emissivity and temperature of the sheer-desert underlying surface have a significantly negative impact on the retrieval quality of the GIIRS/FY-4A ATPs.
In summary, the majority of the GIIRS/FY-4A ATPs with QC flags equal to 0 or 1 are reliable in TD, with the most preferable performance at the TZ station in the TD hinterland where the land–surface category is sheer desert, with the topography being relatively flatter and far from the mountains around the TD.

3.5. Correlation

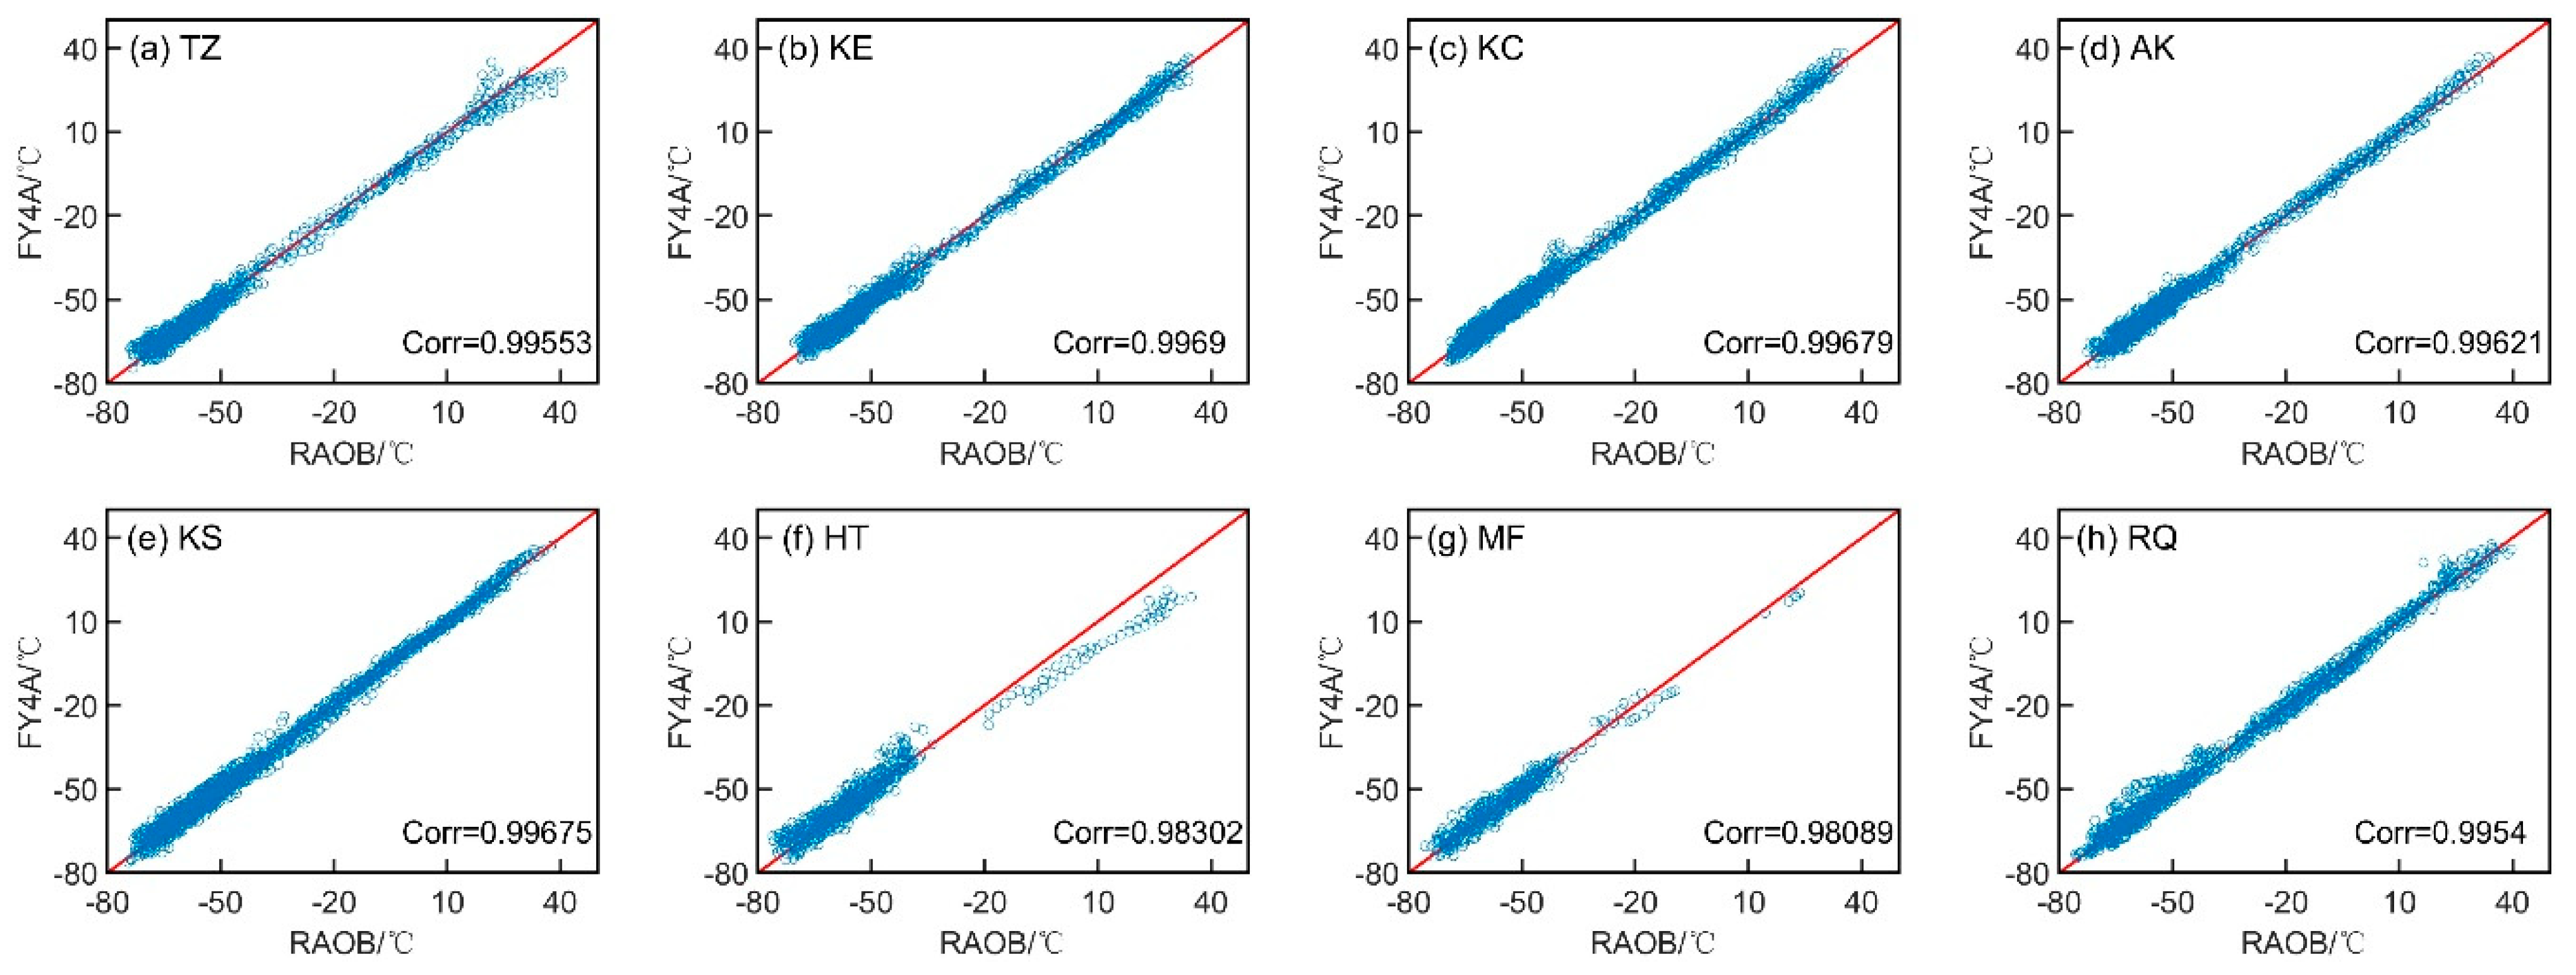
Having analyzed the biases and RMSEs of the GIIRS/FY-4A ATPs and ERA5 ATPs, we further investigate their correlations with the RAOB ATPs in the entire observed atmospheric layers.
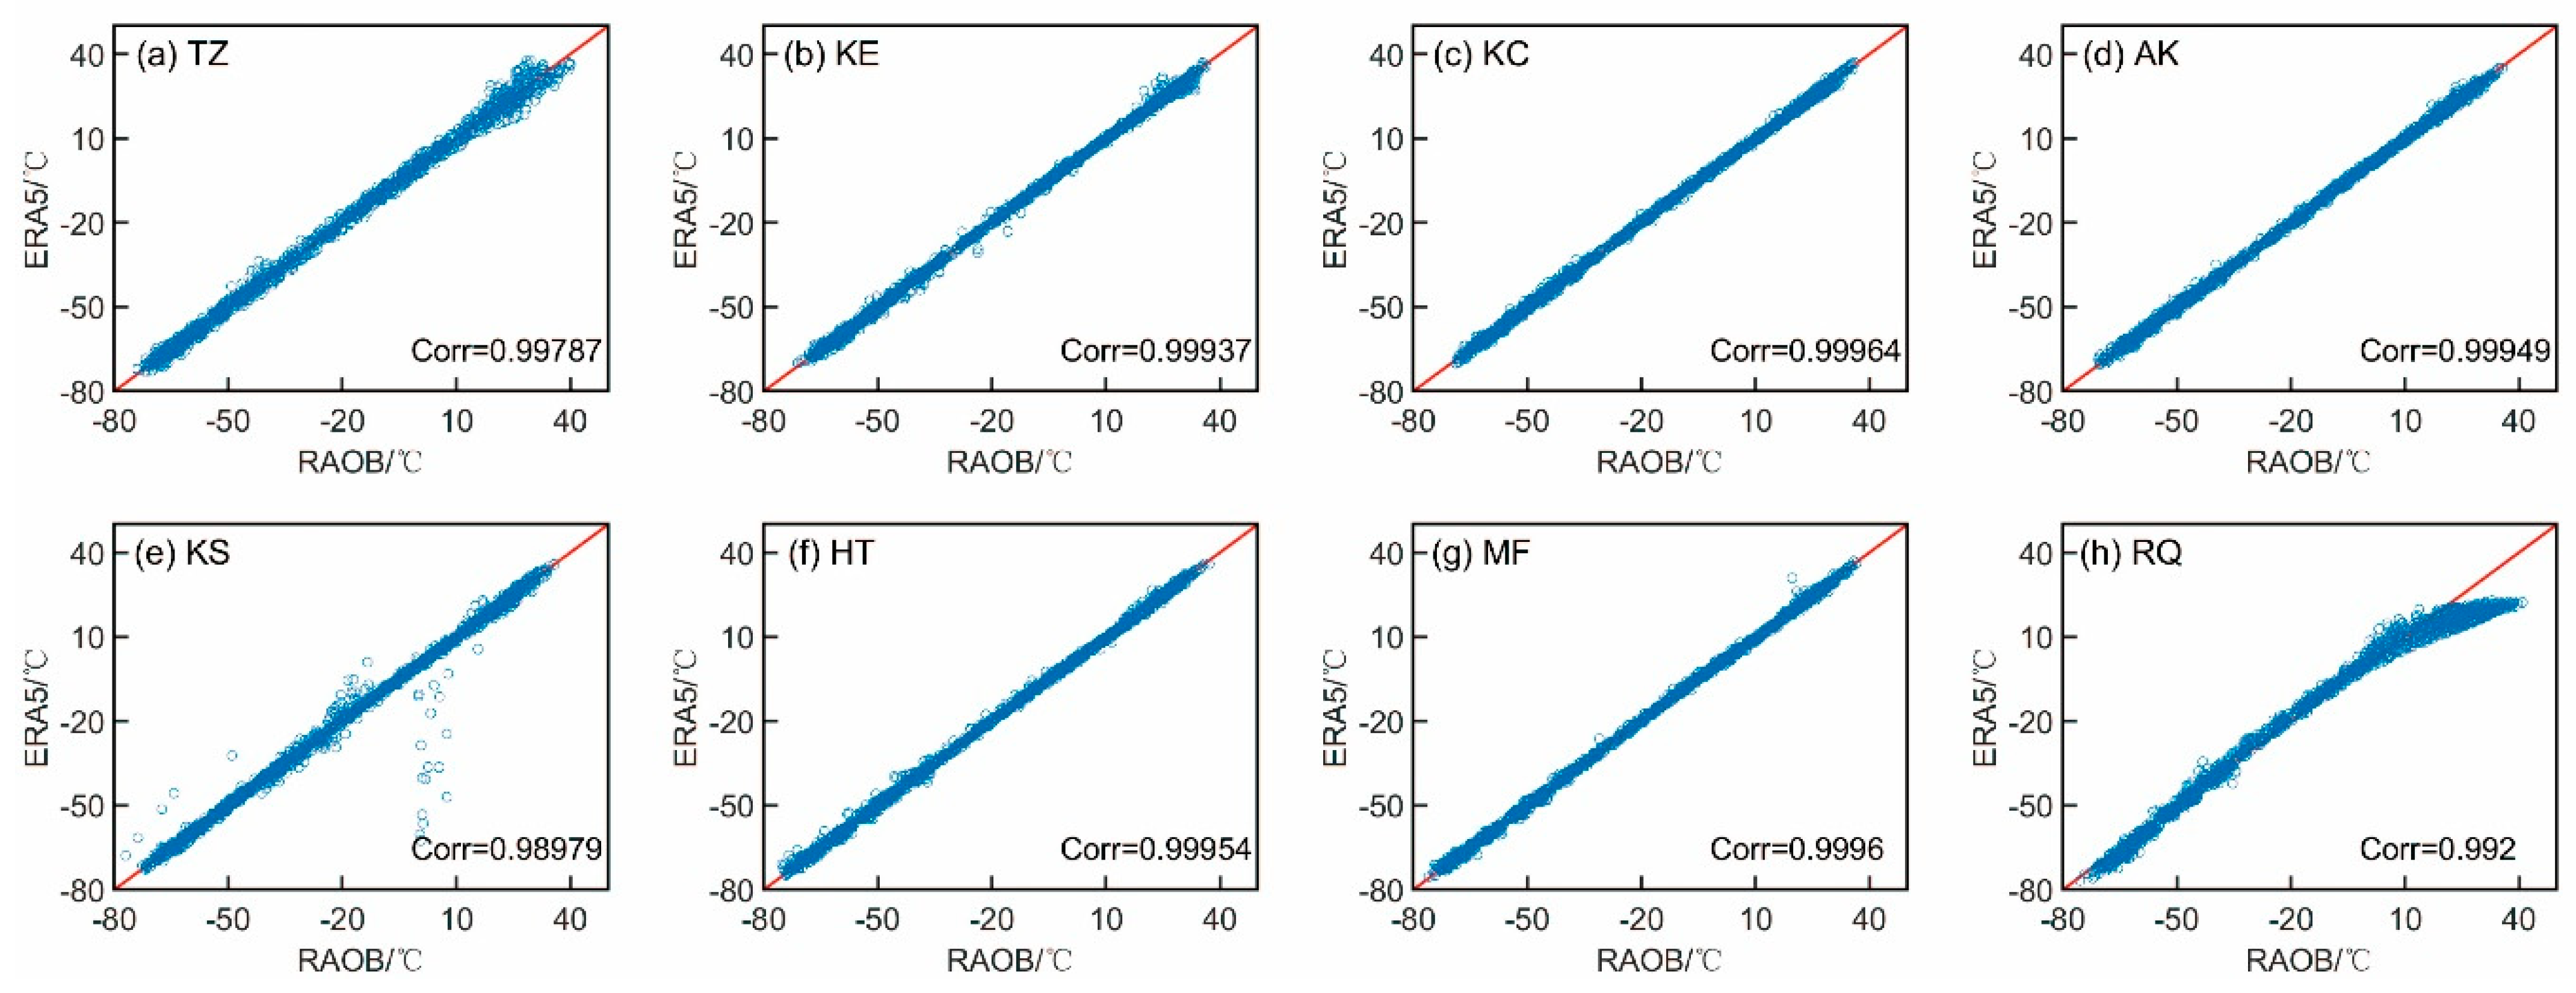
Relative to the correlation coefficients between the ERA5 ATPs and RAOB ATPs (Figure 8), the correlation coefficients between the GIIRS/FY-4A and RAOB ATPs (Figure 9) are slightly smaller, except for that at RQ and KS stations. The correlation coefficient between the ERA5 ATPs and RAOB ATPs at RQ station is 0.992 (Figure 8h), but the correlation coefficient value increases to 0.9954 between the GIIRS/FY-4A ATPs and RAOB ATPs (Figure 9h). This is because ERA5 severely underestimates the temperature in the lower troposphere at RQ station, as shown in Figure 7a,b. The oasis area around RQ station is small, surrounded by a large desert. Such a situation has been better considered in the retrieval process of the GIIRS/FY-4A ATPs than in the construction of ERA5 reanalysis data. Meanwhile, ERA5 also underestimates the air temperature in the upper troposphere at KS station, which is indicated by the purple lines in Figure 7a,b. In addition, the largest increment of correlation coefficients from GIIRS/FY-4A to ERA5 appears at HT and MF stations, which means that the quality of the ERA5 ATPs is obviously better than the GIIRS/FY-4A ATPs at these two stations, especially in the lower levels.
All the correlation coefficients between the GIIRS/FY-4A ATPs and RAOB ATPs (Figure 9) for the eight stations have passed 0.98, indicating that the GIIRS/FY-4A ATPs are highly correlated with the RAOB ATPs, and thus are acceptable in the further possible use of the GIIRS/FY-4A ATPs in synoptic diagnosis or data assimilation in Numerical Weather Prediction (NWP). The largest correlation coefficient is found at HT station, while the minimum is at MF station. Due to the similarity of the land-use category at TZ station and RQ station, the correlation coefficients between the GIIRS/FY-4A ATPs and RAOB ATPs at the two stations are smaller on the whole (Figure 8a,h). However, the GIIRS/FY-4A ATPs and RAOB ATPs at TZ stations show a large difference in their correlation coefficient in the lower layers with an air temperature higher than 20 °C, reflecting the impact of the sheer desert surface category on the retrieval quality of the GIIRS/FY-4A ATPs (Figure 9a). Meanwhile, the great impact of topography on the retrieval process of the GIIRS/FY-4A ATPs could also be seen from the relatively smaller correlation coefficient between the GIIRS/FY-4A ATPs and RAOB ATPs at HT and MF stations, for the two stations are at the southern slope of the Tianshan Mountains and the northern slope of the Kunlun Mountains, where the terrain gradient is larger than that of the other six stations. (Figure 9f,h).
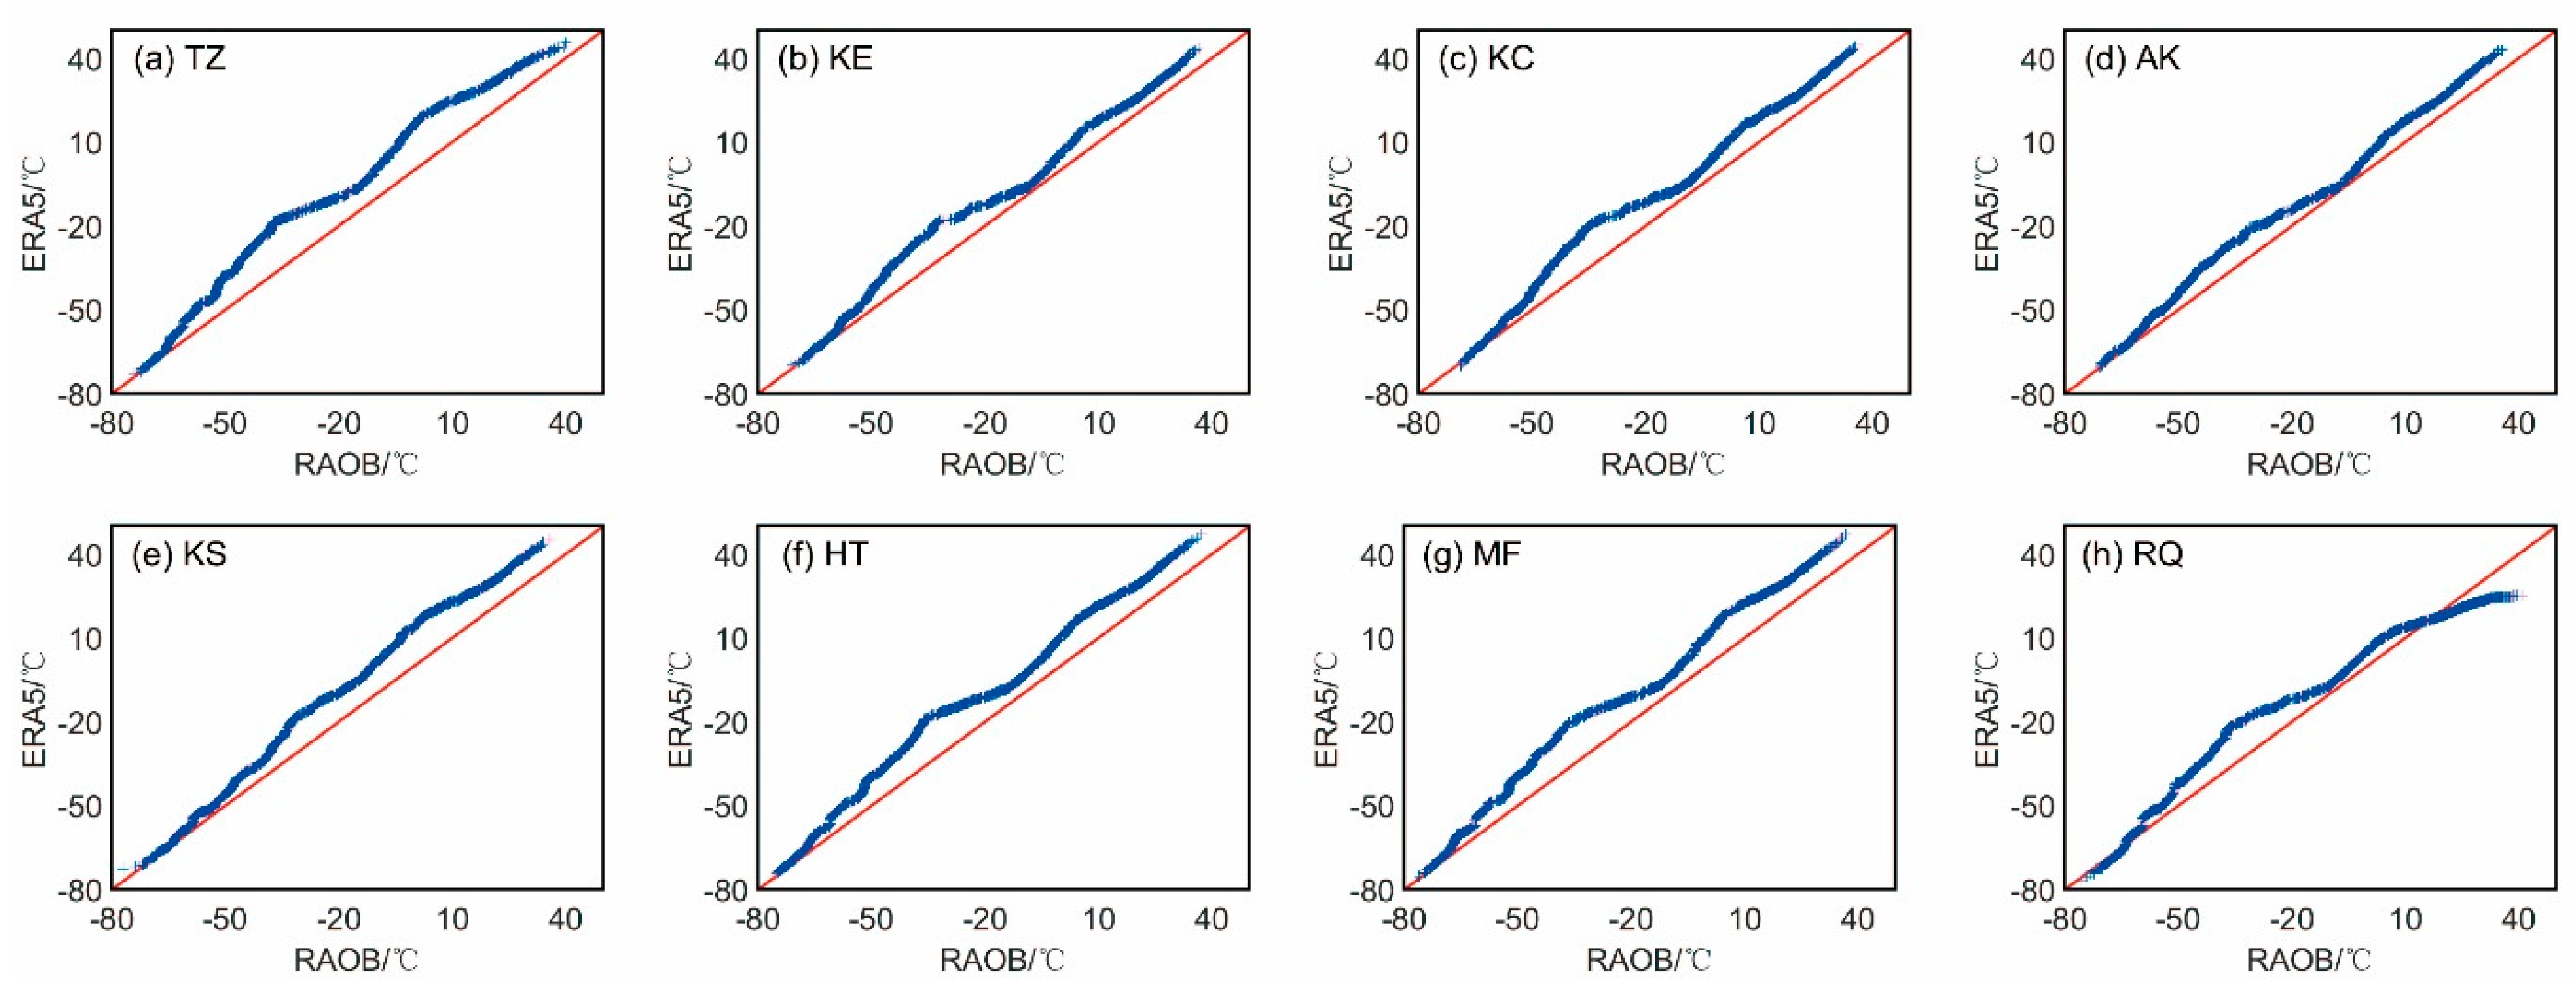
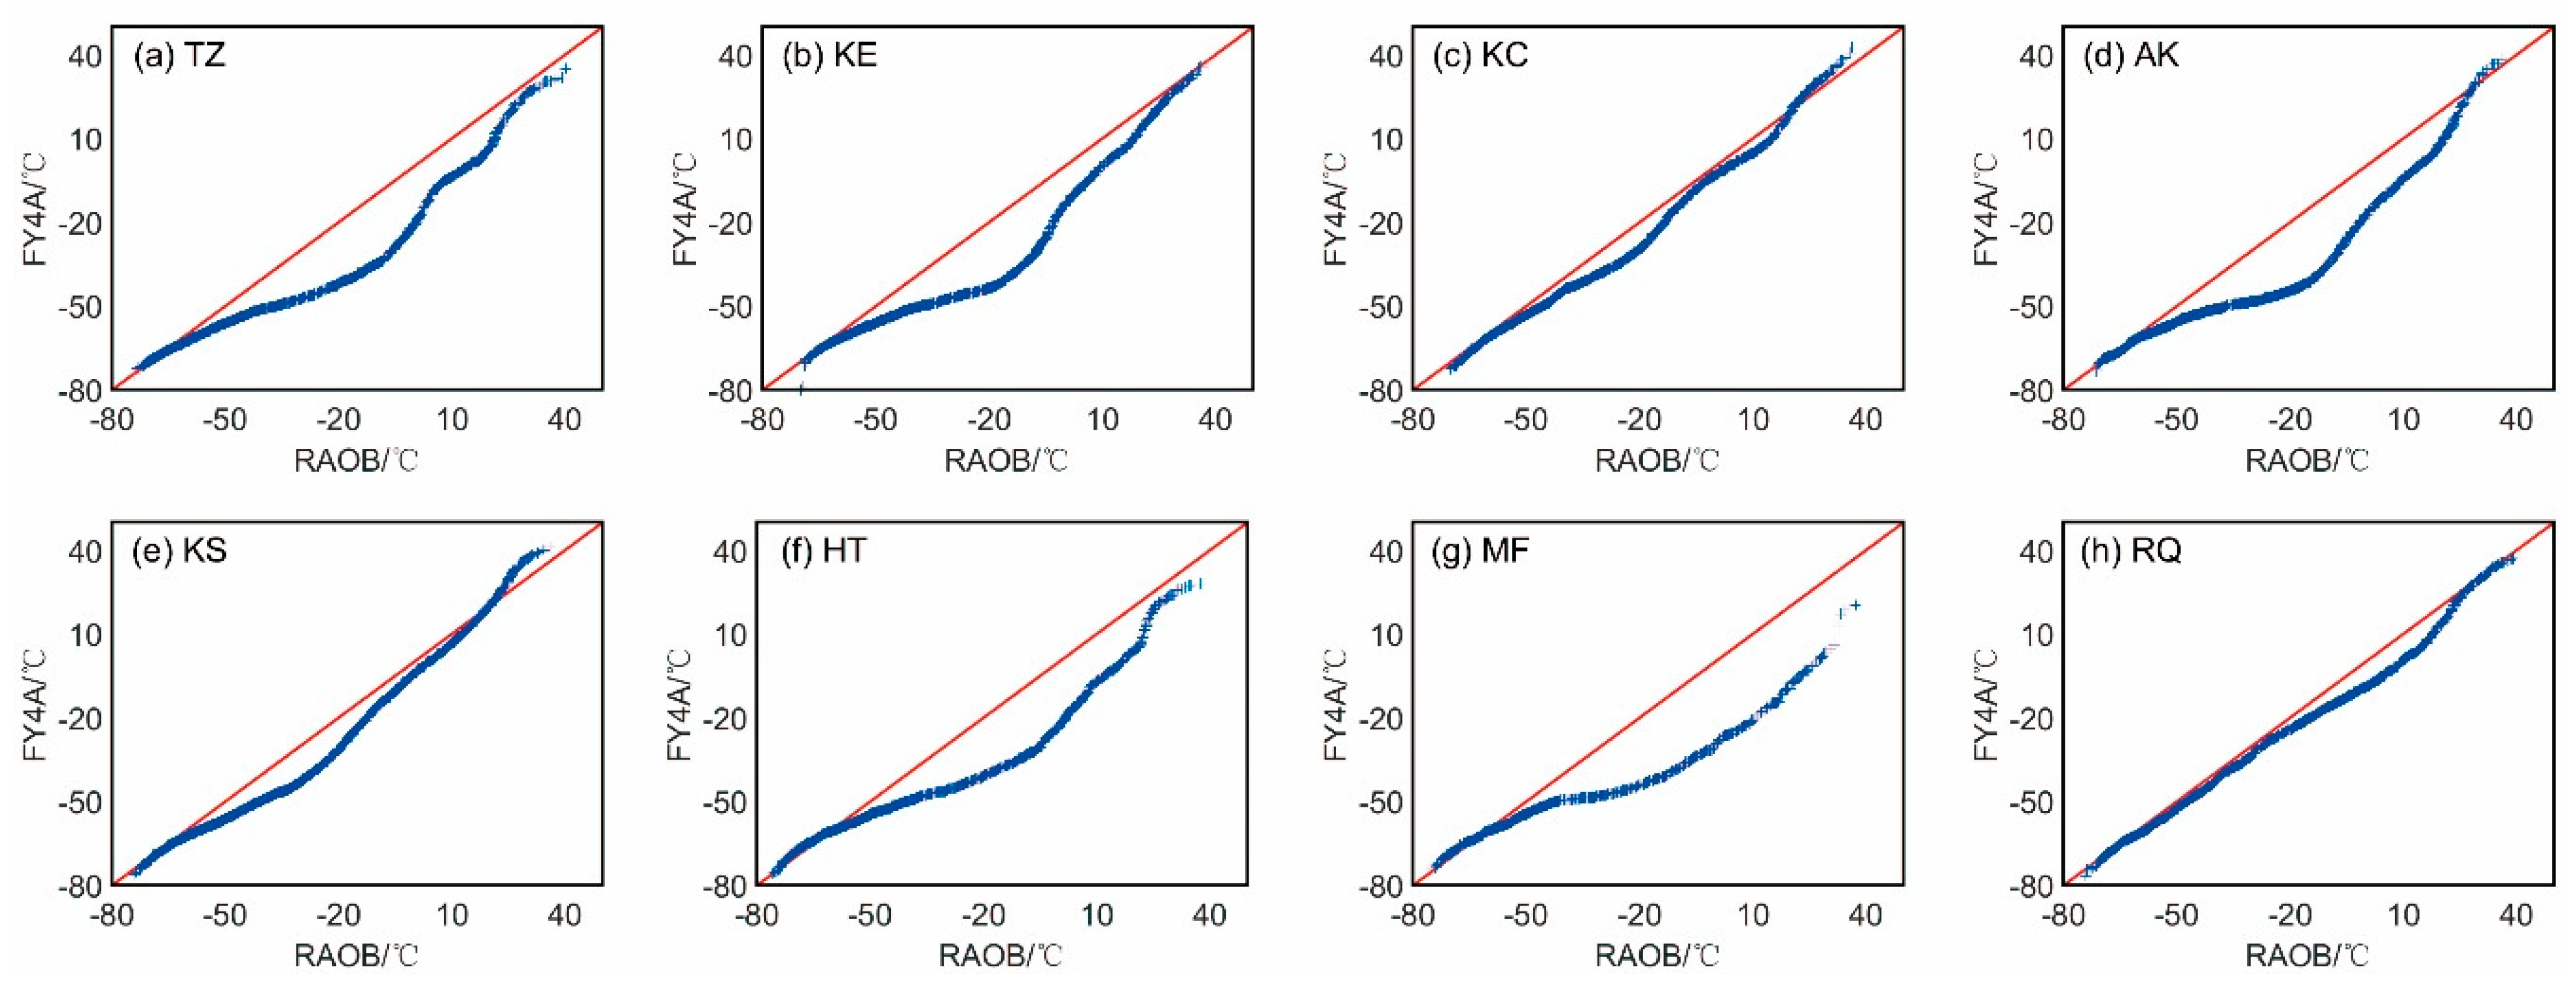
In order to judge whether the ERA5 ATPs and GIIRS/FY-4A ATPs follow the same pattern of probability distribution with the RAOB ATPs, the Quantile-Quantile (QQ) plots of them over the eight stations are provided below, with Figure 10 for the QQ plot between the ERA5 ATPs and RAOB ATPs, and Figure 11 for the GIIRS/FY-4A and RAOB ATPs. The air temperature from ERA5 is generally higher than the RAOB temperature, while the FY4A-retrieved temperatures are generally lower than RAOB temperature. Meanwhile, relative to the FY4A ATPs, the distribution of the ERA5 ATPs is more similar to that of RAOB ATPs. The largest discrepancy between the GIIRS/FY-4A and RAOB ATPs appears at MF station, while their smallest similarity is at RQ station.

3.6. Probability Distribution Function (PDF) of ATP Biases
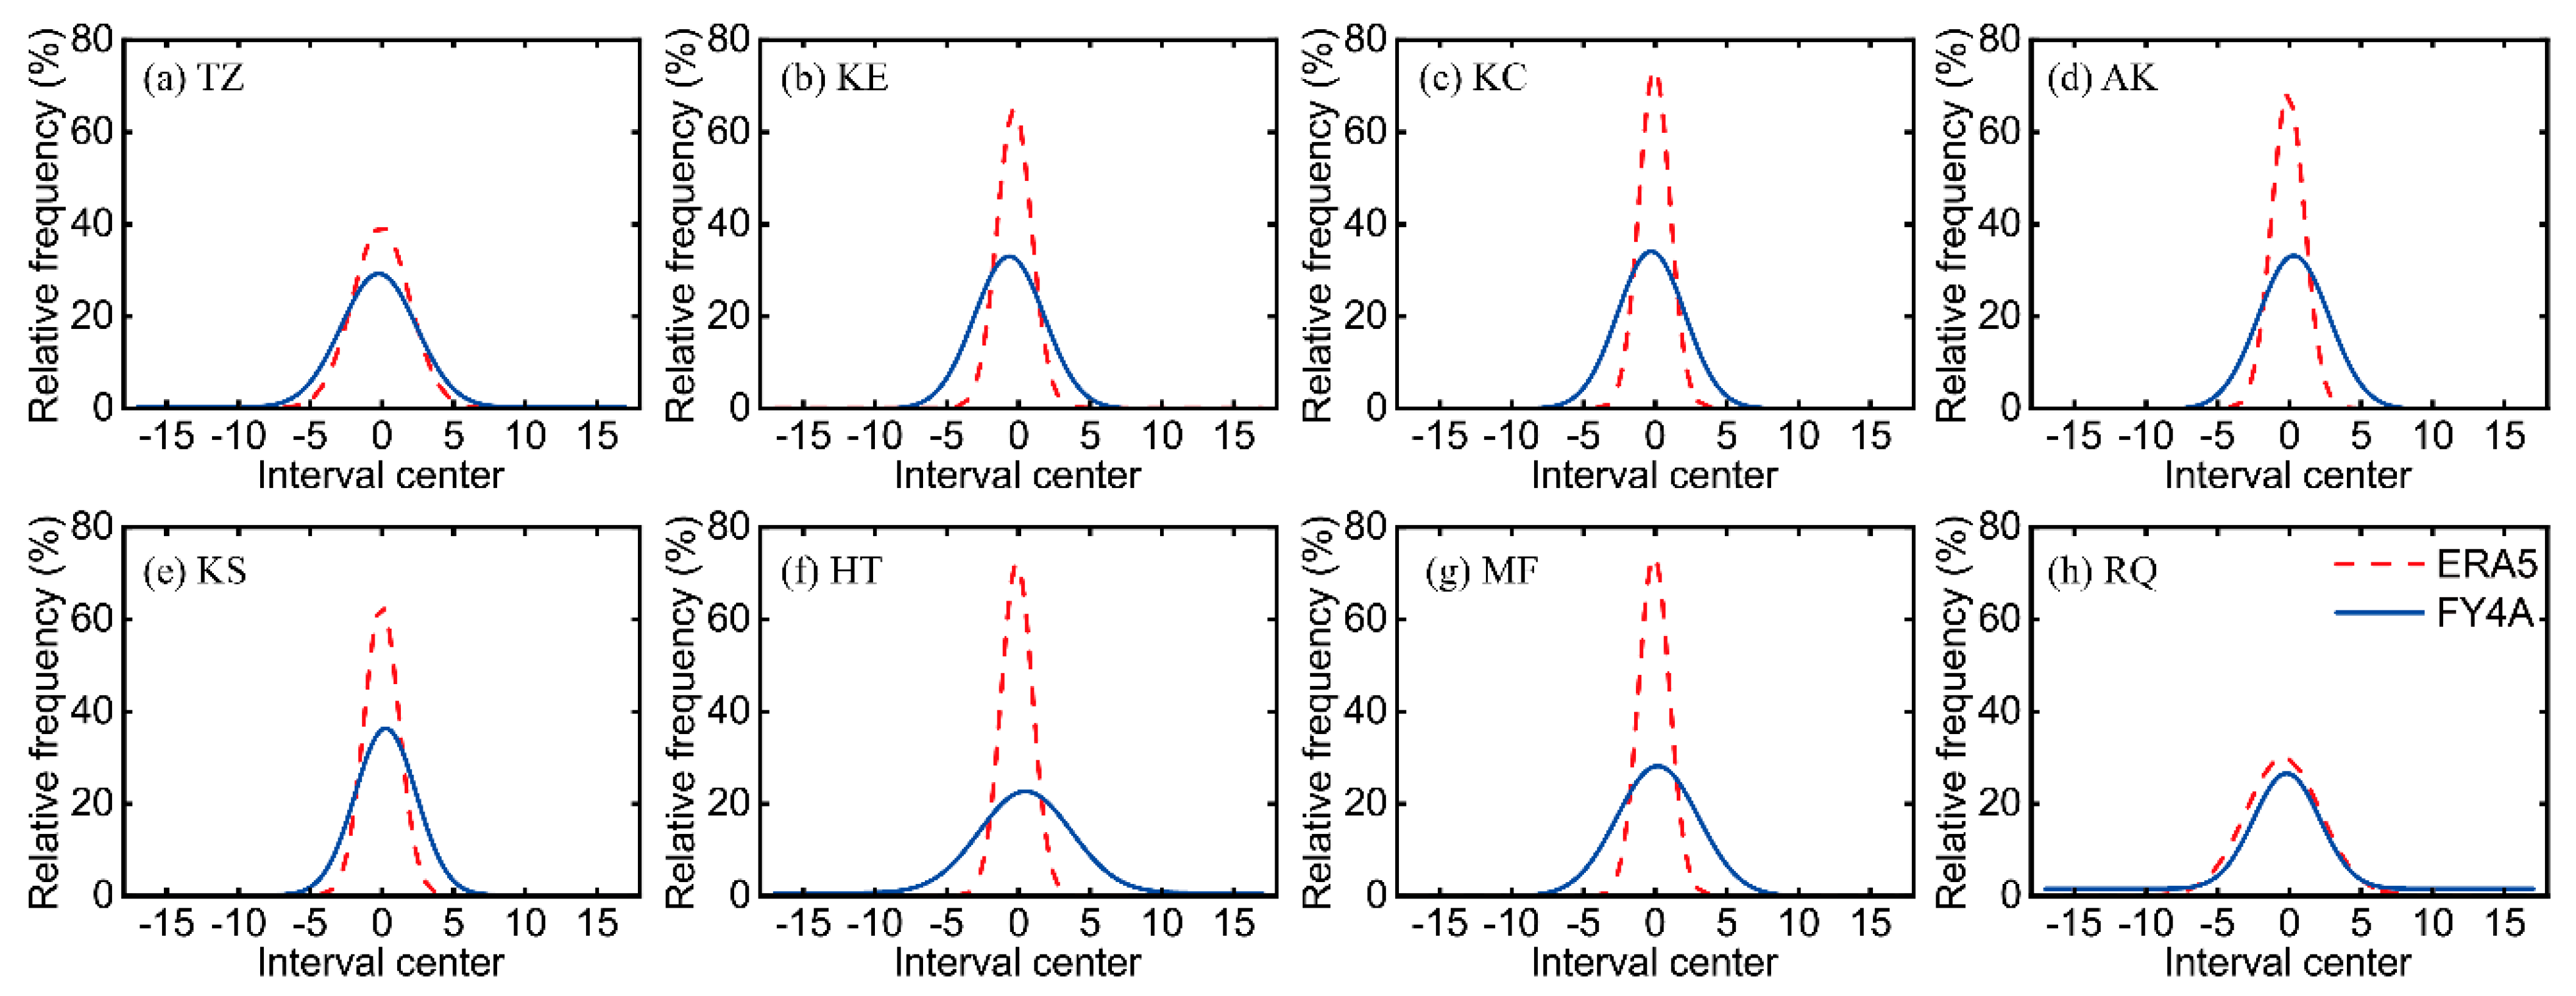
As is shown in Figure 12 and Table 3, there are three major discrepancies in bias PDF between ERA5 and FY4A. The first one is the variation range of Xc. The Xc of the ERA5 bias PDF ranges from −0.429 to −0.016, and all of the biases of ERA5 are negative values, with the average of their absolute values being 0.142. The Xc of GIIRS/FY-4A ATPs bias PDF ranges from −0.645 to 0.478, and only four out of eight biases of GIIRS/FY-4A ATPs are negative, with the average of their absolute values being 0.319, which is larger than that of the ERA5 ATPs. The second difference lies in the maximum value of the PDF curves. The maximum value of ERA5 bias PDF ranges from 29.888 to 73.726, and the average value is 60.562; the A of the GIIRS/FY-4A ATPs bias PDF ranges from 22.068 to 36.179, with an average of 30.134, much smaller than that of the ERA5 ATPs. Meanwhile, the maximum value of the GIIRS/FY-4A ATPs bias PDF remains almost all the same at the eight stations, but the peak value of the ERA5 ATPs bias PDF changes from the desert station (TZ) and the small-area oasis station (RQ) to the other oasis stations. The top values of the ERA5 ATPs bias PDF at TZ and RQ stations are similar to that of the GIIRS/FY-4A ATPs bias PDF, but much larger at the other six oasis stations. The third difference is that the Confidence of Determination (COD) of the GIIRS/FY-4A ATPs bias PDF is slightly smaller than that of ERA5 generally. The mean COD of the GIIRS/FY-4A ATPs bias PDF is 0.986, and that of ERA5 is 0.997.
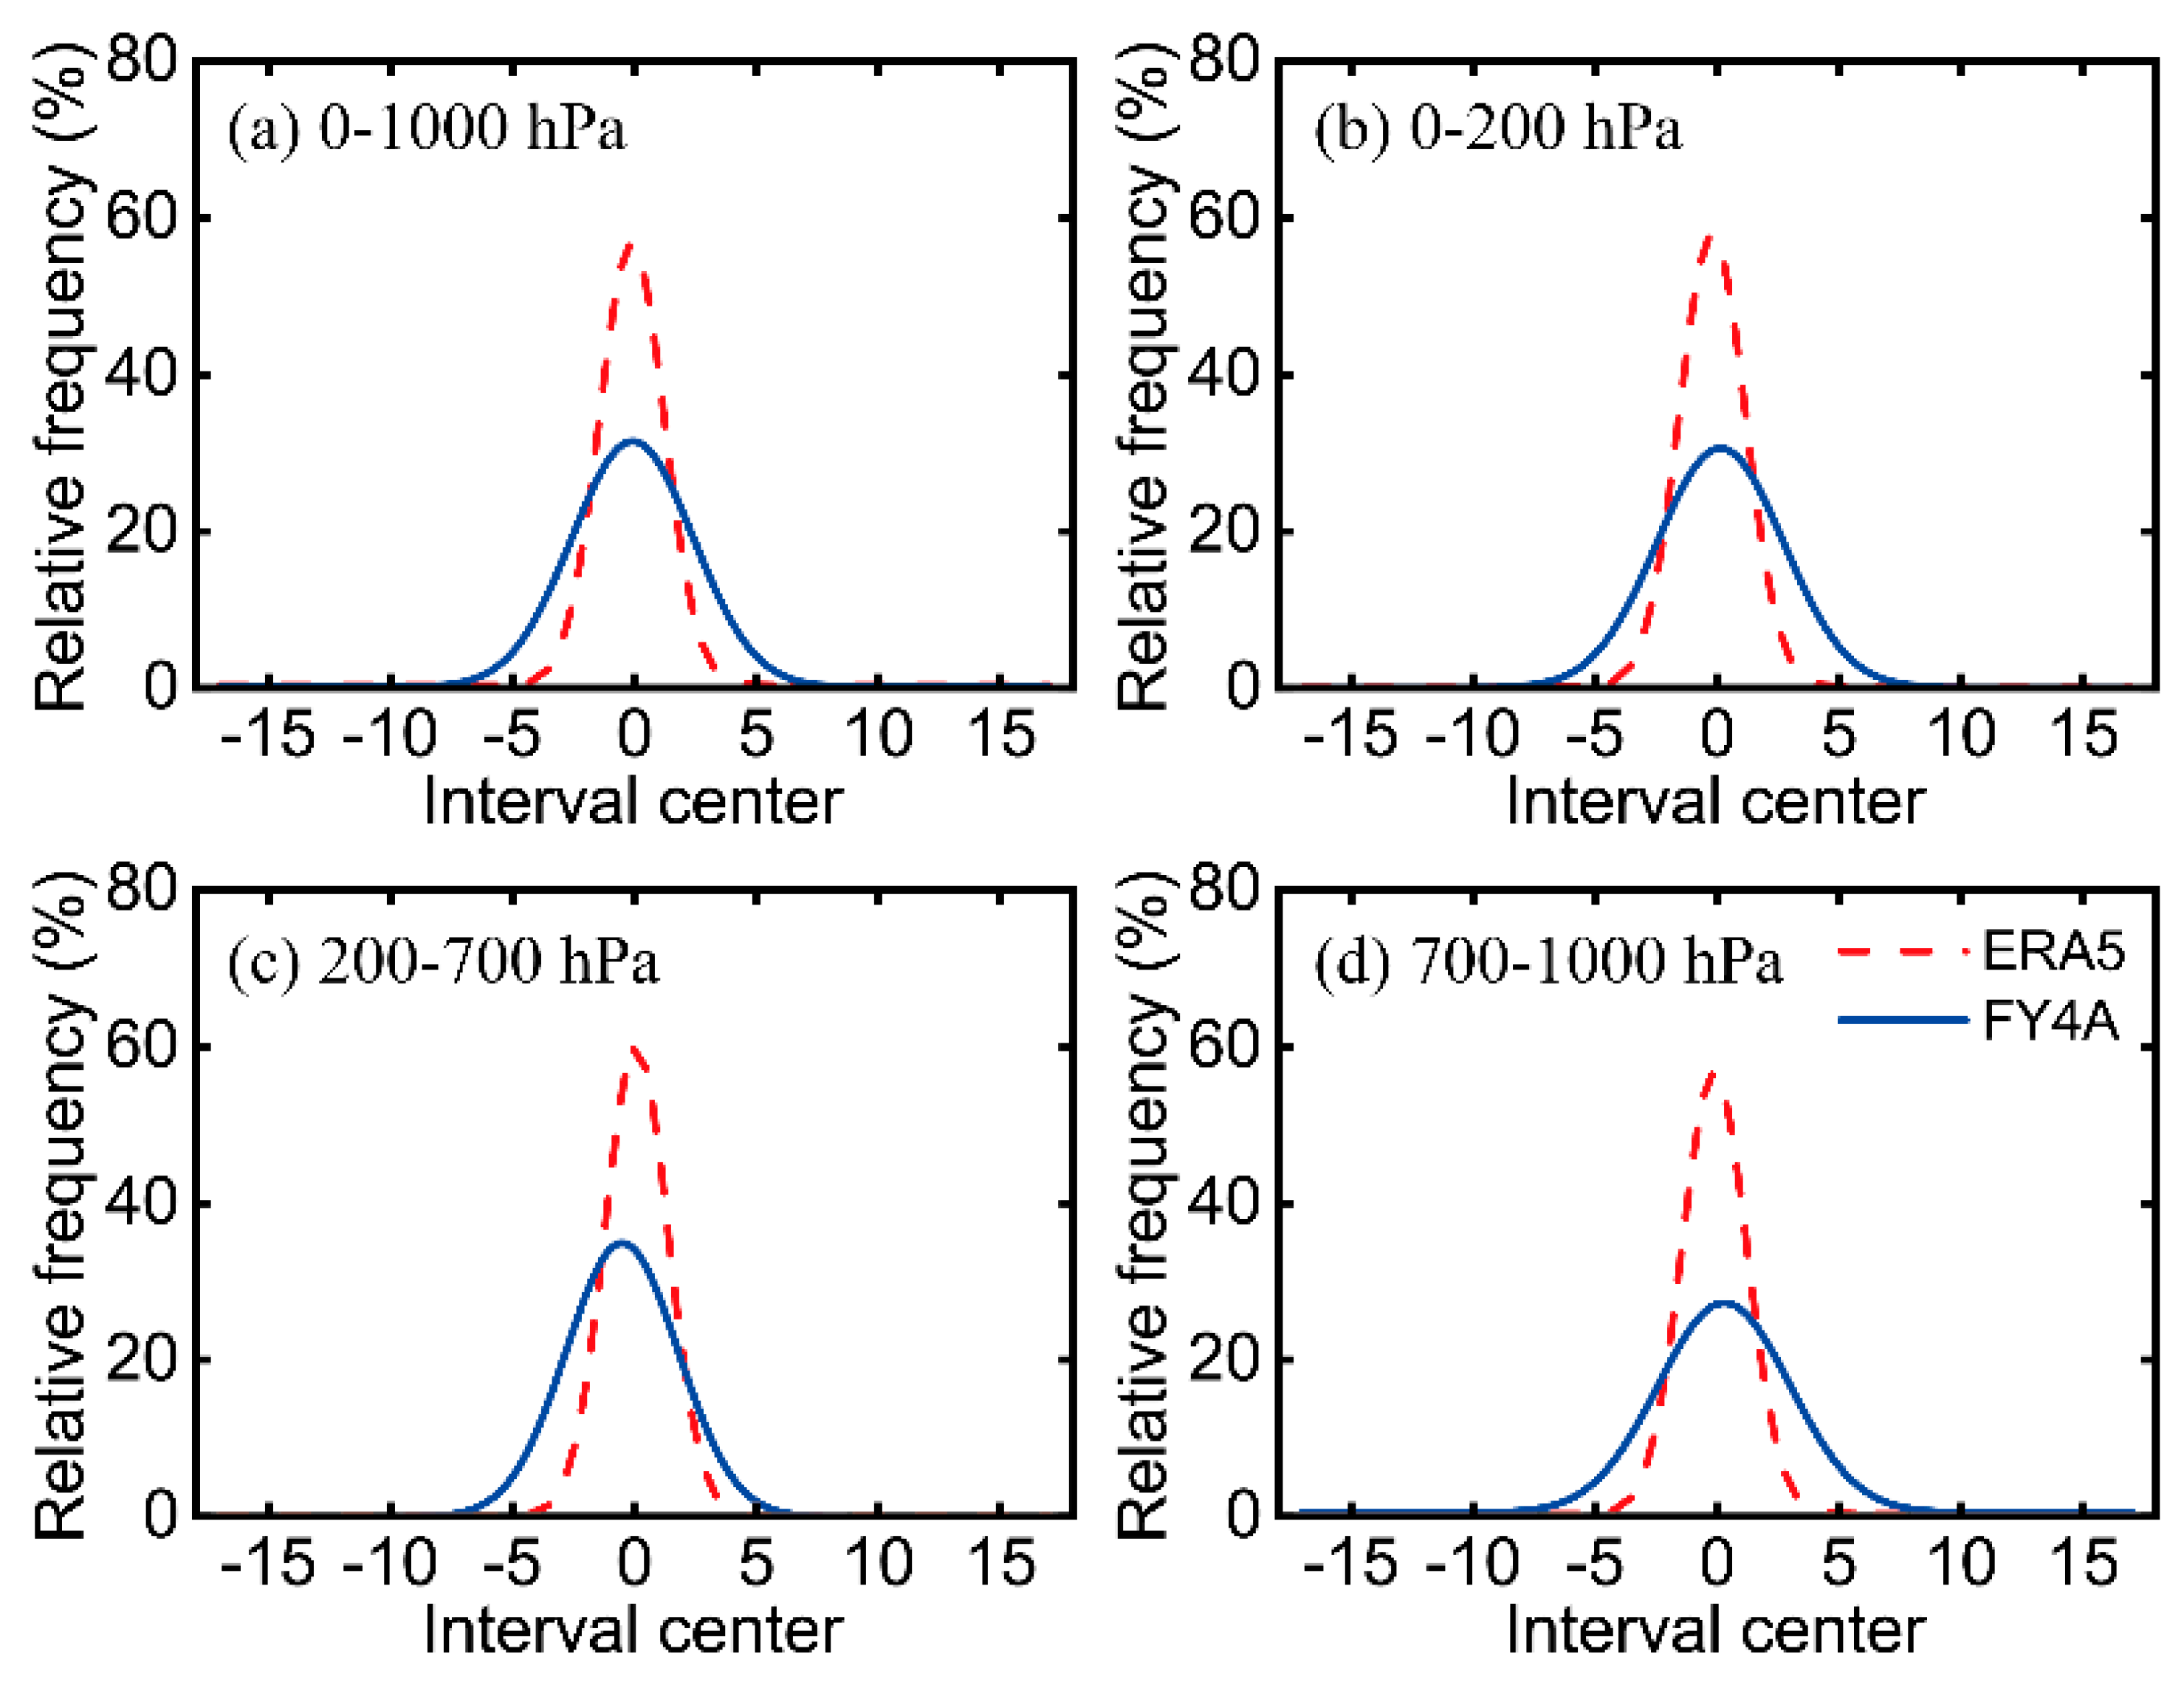
The bias PDFs at all the eight stations are also compared among the lower (1000–700 hPa), middle (700–200 hPa) and higher (200–0 hPa) layers (Figure 13). The values of Xc of the GIIRS/FY-4A ATPs bias PDF for the whole atmospheric layer, the upper layers above 200 hPa, the middle layers and the lower layers below 700 hPa are 0.062 K, −0.08089 K, −0.50806 K and 0.28811 K, respectively; and, accordingly, the COD values are 0.99582, 0.99063, 0.99827 and 0.98999, respectively. The PDF distribution of the GIIRS/FY-4A ATP bias values in the whole atmospheric layer is thus better than those in the lower, middle and higher layers. The values of Xc of the ERA5 ATPs bias PDF for the whole atmospheric layer, the upper layers, the middle layers and the lower layers are −0.11391 K, −0.20009 K, 0.0743 K and −0.11391 K, respectively; and the COD values are 0.99947, 0.99958, 0.99924 and 0.99947, respectively. Thus, the PDF distribution of the ERA5 ATP bias values in the lower troposphere are worse than those of the whole, middle and higher layers.
Generally, almost all the PDF distributions of the GIIRS/FY-4A and ERA5 ATP biases follow the Gaussian distribution. At the sheer desert station in the hinterland of TD and the small-area oasis station RQ, the PDFs of the GIIRS/FY-4A and ERA5 ATPs bias are similar to each other. Conventional observations are rather rare near TZ station in the hinterland of the TD and RQ stations in small-area oases surrounded by a large desert, and the ERA5 ATPs thus do not perform better in these regions than the GIIRS/FY-4A ATPS. From this perspective, the GIIRS/FY-4A ATPS are rather credible and valuable in filling the big gap of conventional measurement in desert regions, and they could thus contribute to more accurate estimates of ERA5 in the TD region.

4. Conclusions

It is difficult to determine the exact vertical distribution situation of atmospheric temperature based on limited conventional observations in the Taklimakan Desert (TD). At present, the geostationary Interferometric Infrared Sounder (GIIRS) onboard the FY-4A satellite can effectively eliminate this gap, and a bias analysis of the GIIRS/FY4A ATPs should be the first step before its application in the local synoptic diagnosis or its further assimilation in the regional NWP system. In this study, the ATPs from seven conventional RAOB stations in an oasis region around TD and a field experimental RAOB site in the hinterland of TD in July 2021 have been taken as the true values to quantitatively validate the bias distribution characteristics of the GIIRS/FY-4A ATPs in TD. The bias features of the ERA5 ATPs in the Taklimakan Desert have been analyzed synchronously and also compared with the biases of the GIIRS/FY-4A ATPs for the purpose of objectively evaluating the reliability of the GIIRS/FY-4A ATPs. The conclusions drawn from the analysis are summarized as follows:
(1)
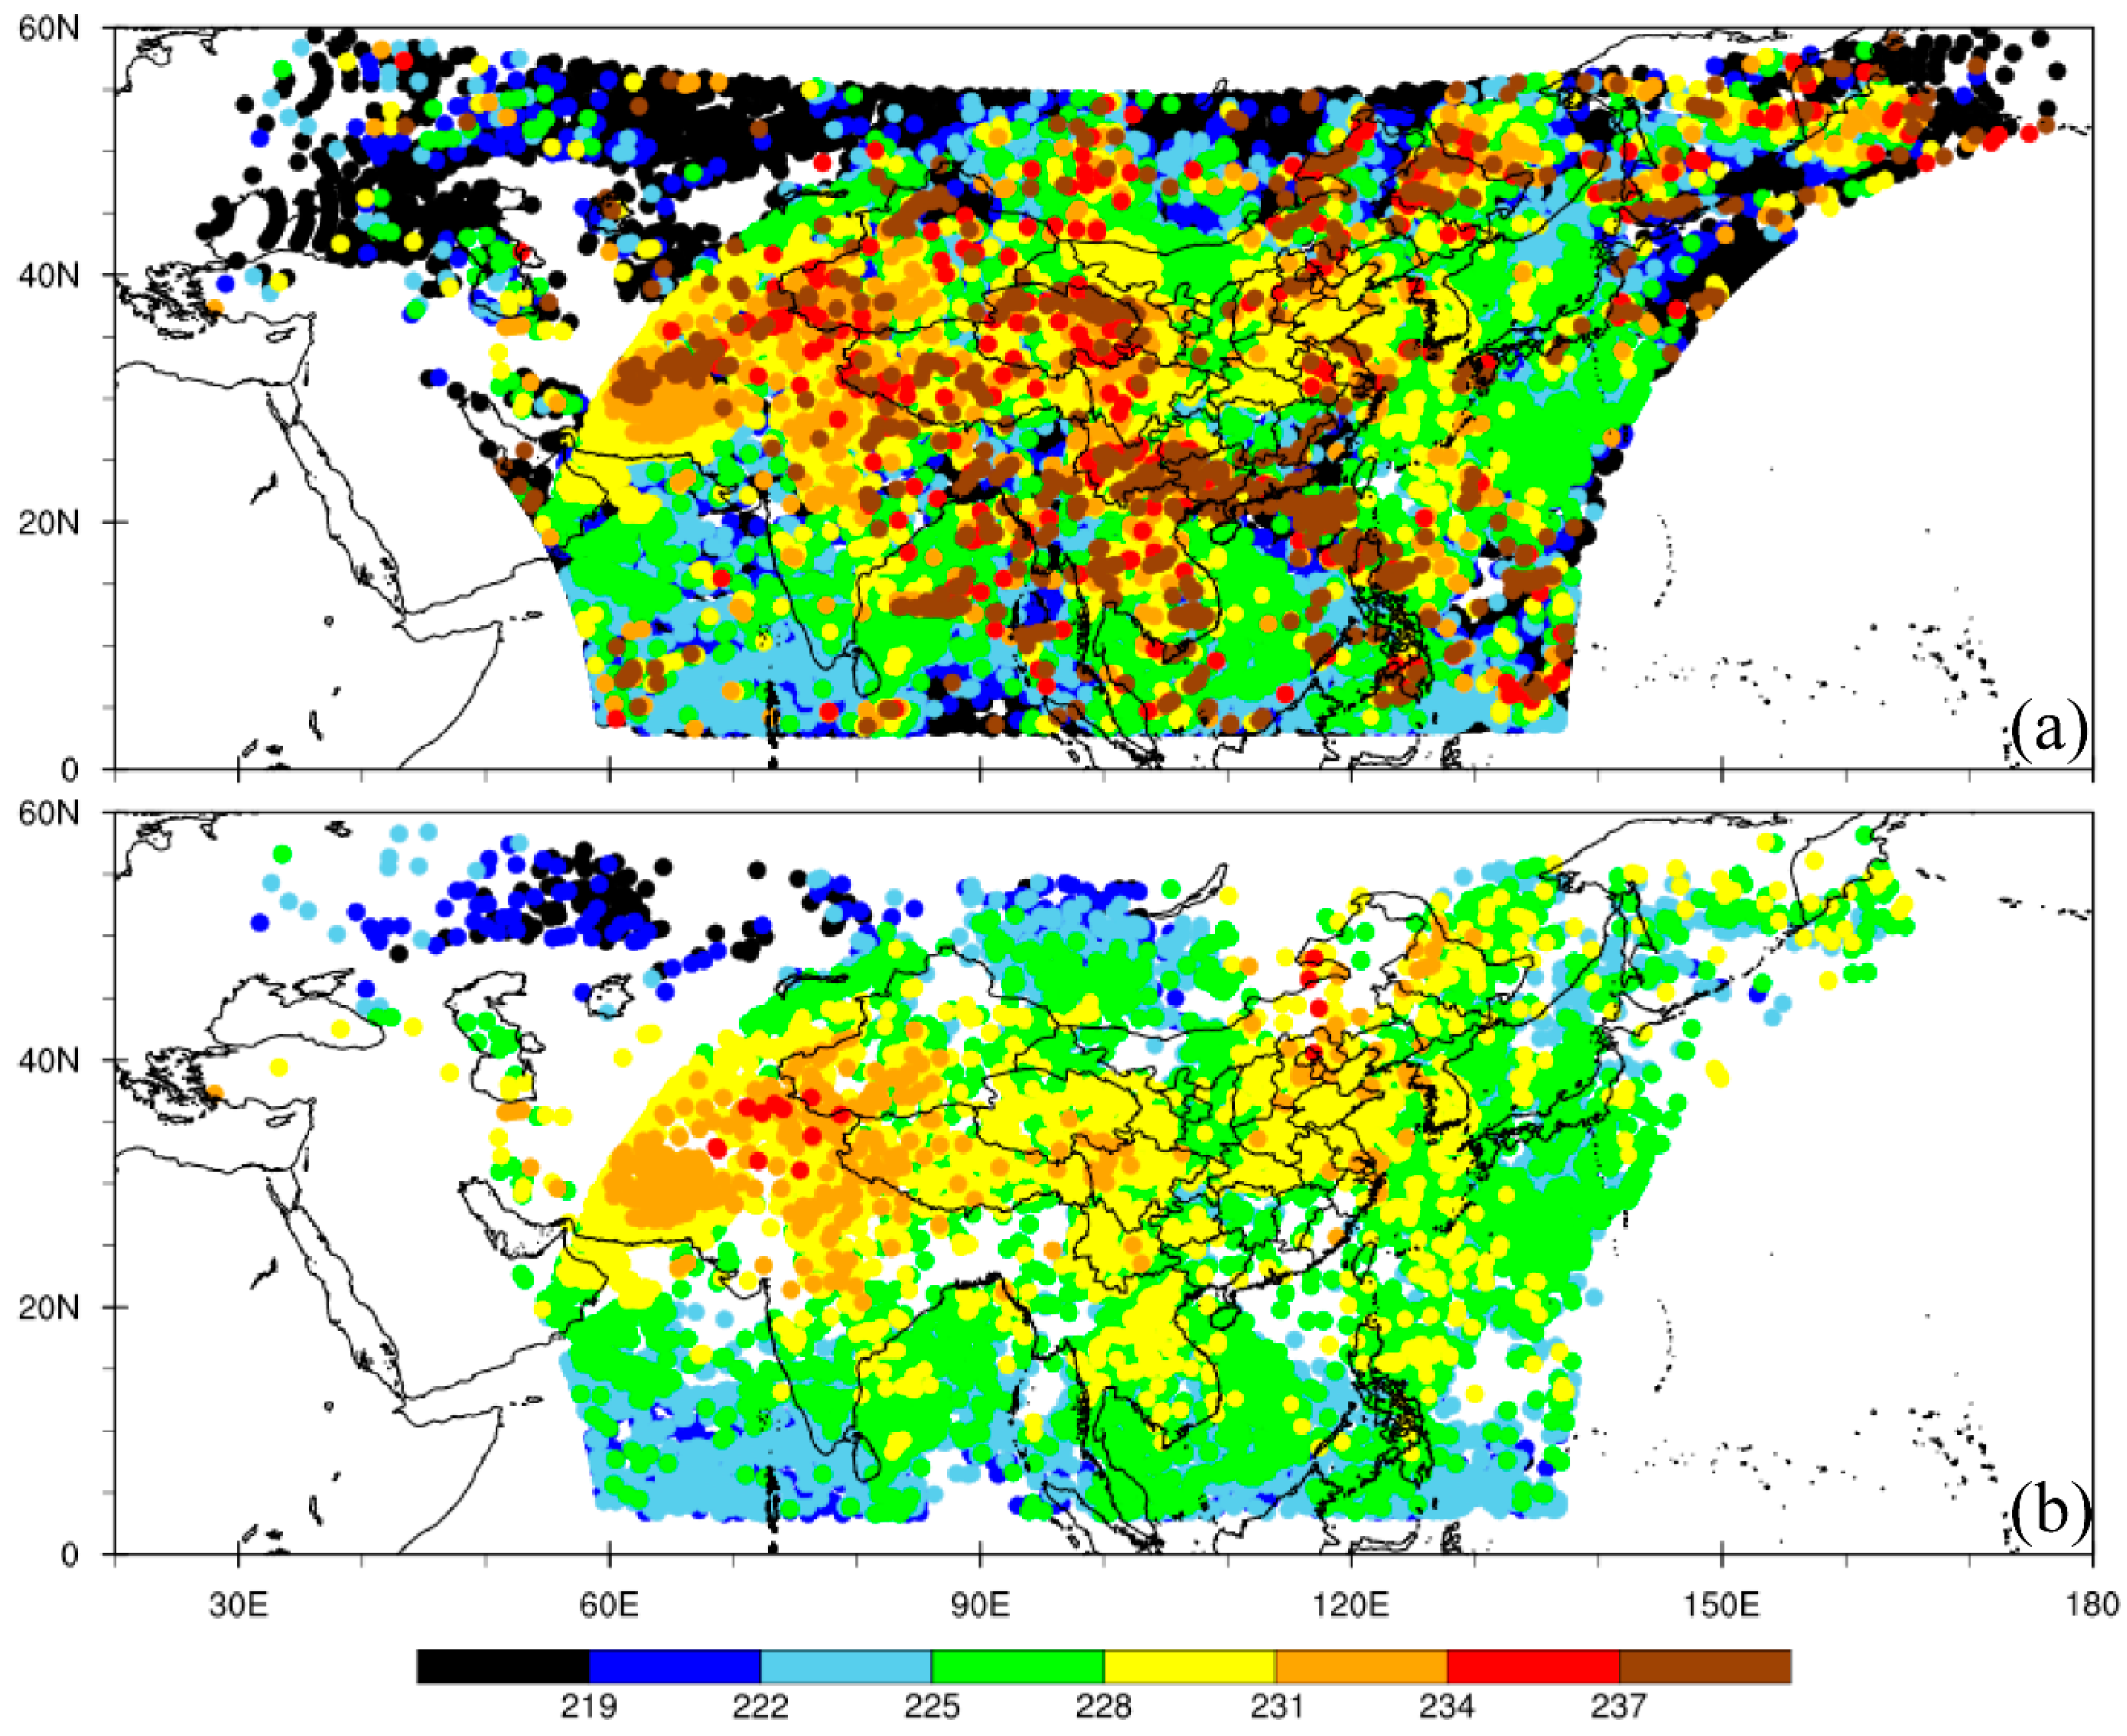
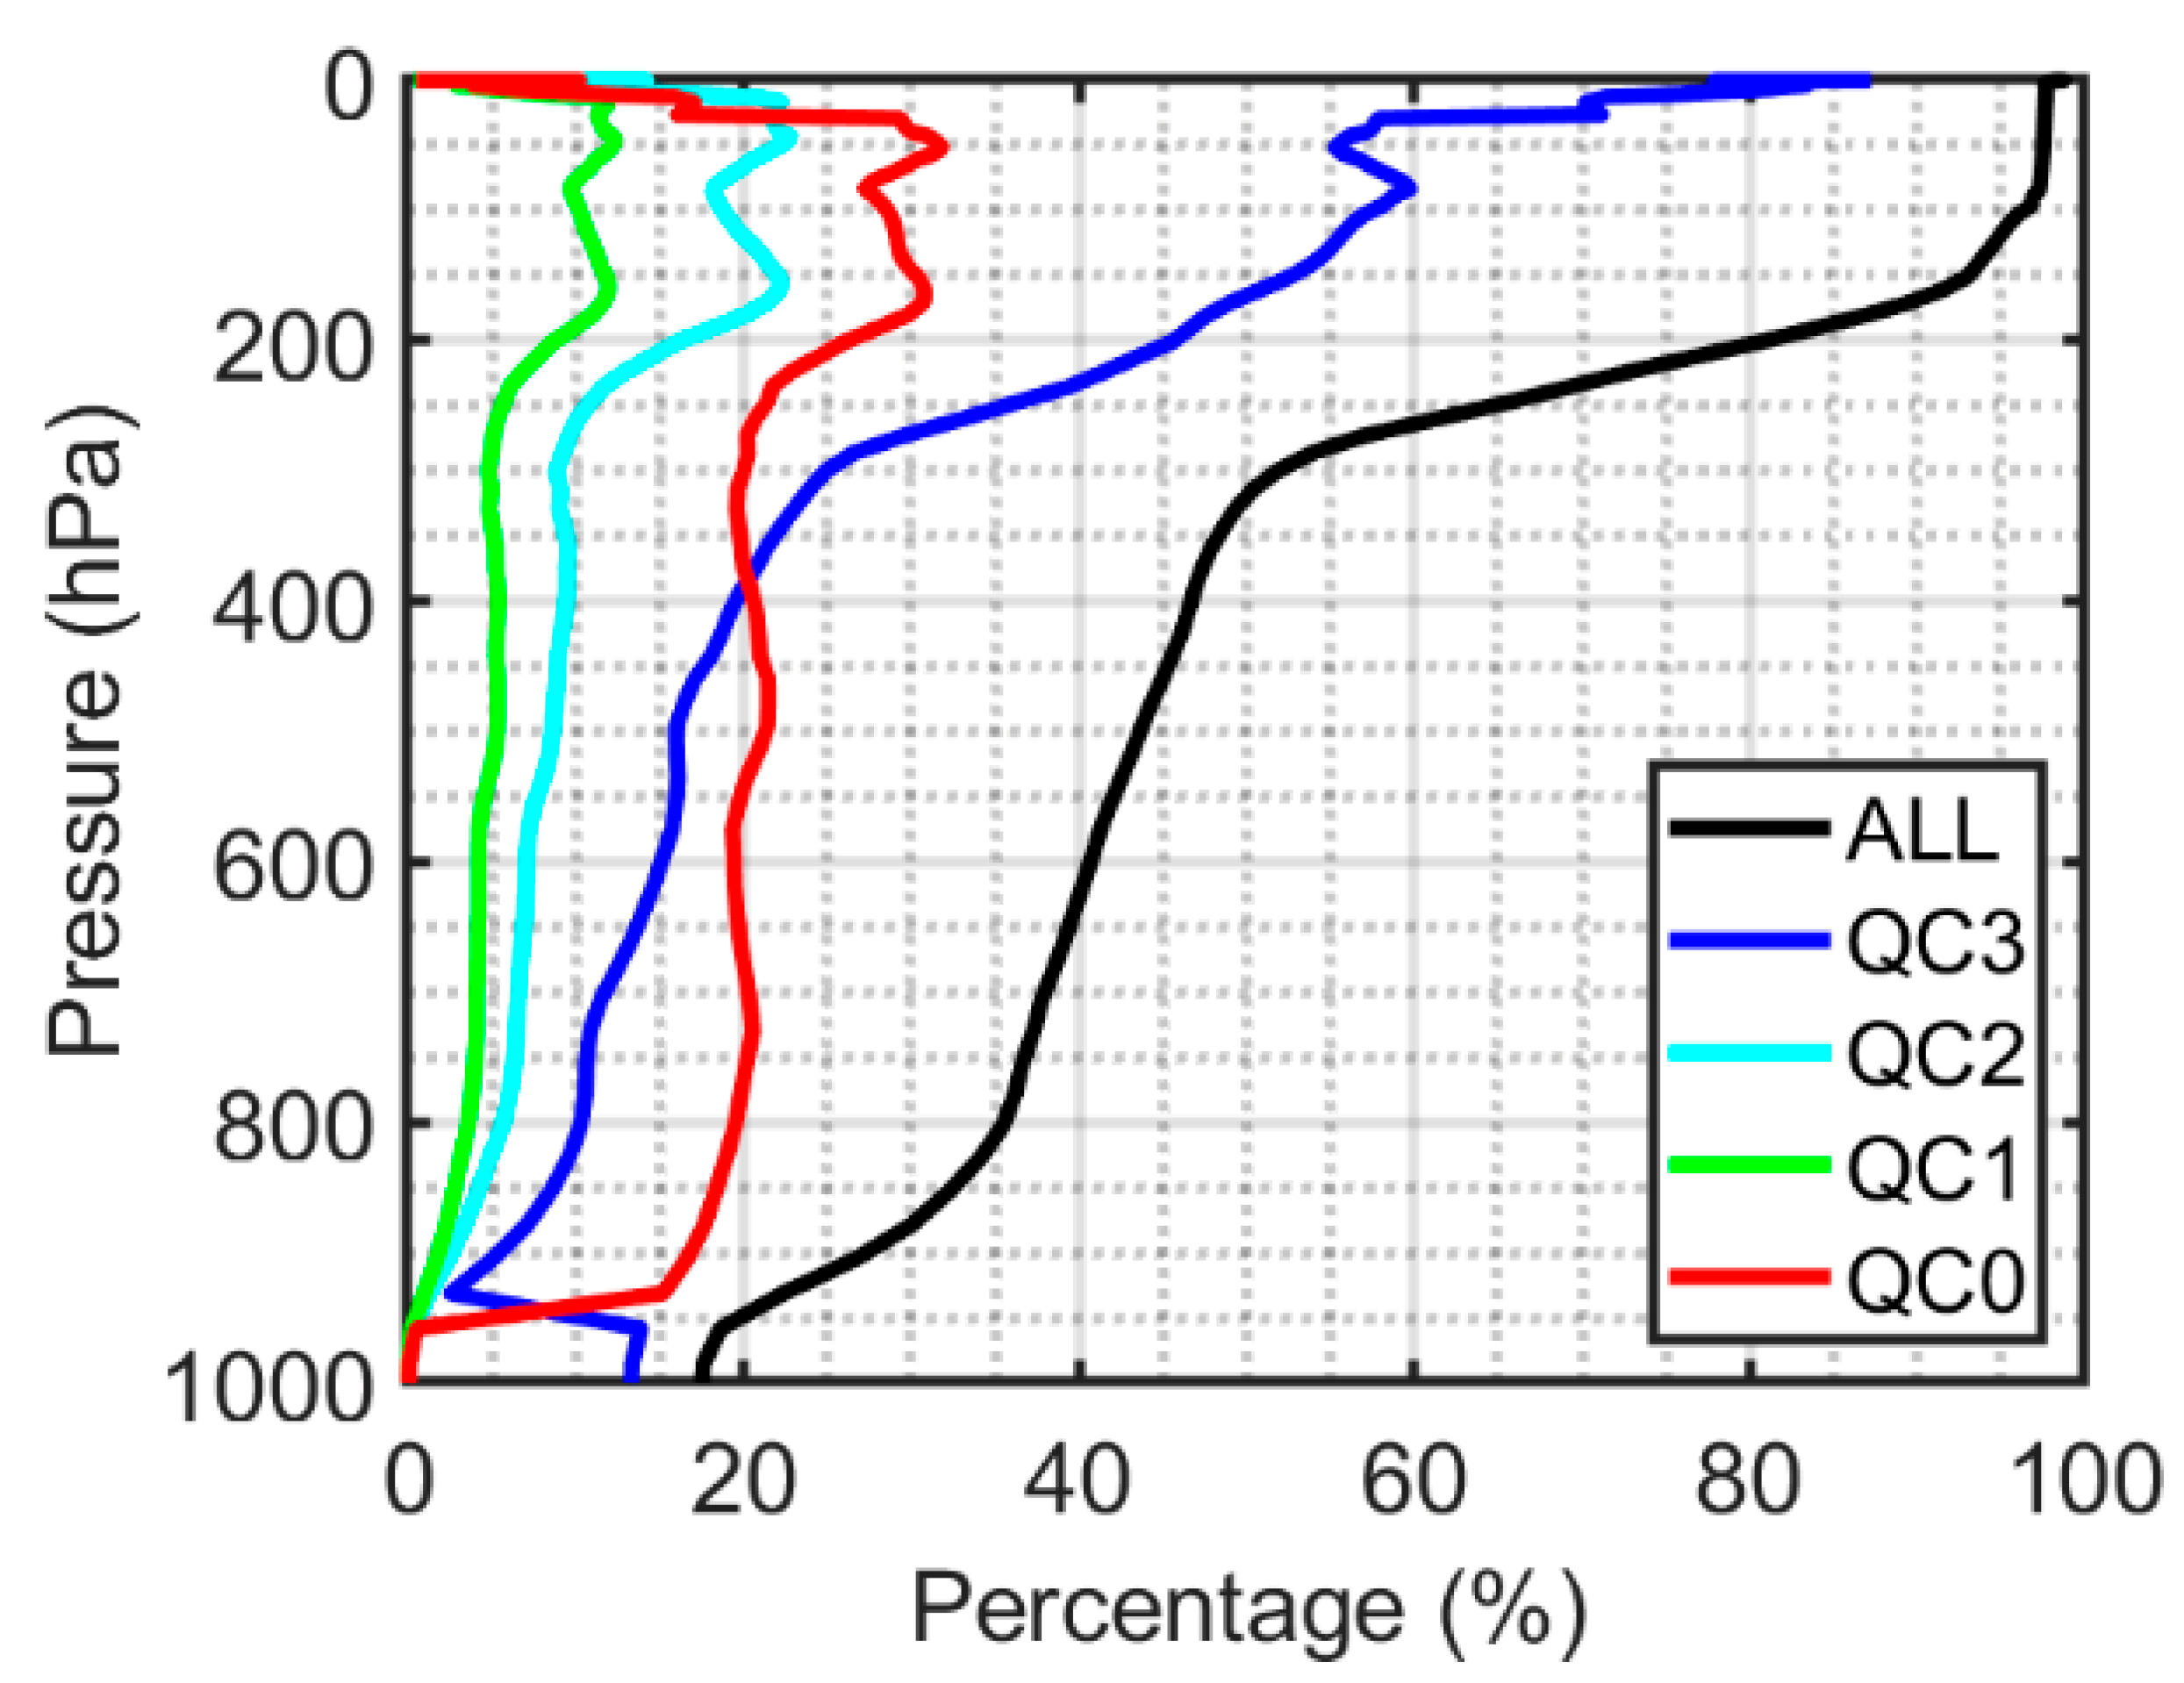
The averaged percentage of the effective GIIRS/FY-4A temperature retrievals out of all the grid numbers in and around TD is 71.94%. The maximum percentage of the GIIRS/FY-4A ATPs with QC flags equal to 0 or 1 out of all the grid numbers in and around TD can reach up to 62.65% of all the retrieved grid points in the 101 layers on average, with its mean percentage being 33.06%.
(2)
The RMSE of the GIIRS/FY-4A ATPs are generally smaller than that of the ERA5 ATPs, which are within 3 K and 11 K, respectively. The smallest bias and RMSE of the GIIRS/FY-4A ATPs appear near the TZ station in the hinterland of TD.
(3)
Relative to the correlation coefficients between the ERA5 ATPs and RAOB ATPs, the correlation coefficients between the GIIRS/FY-4A ATPs and RAOB ATPs are slightly smaller in general. Meanwhile, the air temperature from GIIRS/FY-4A is generally higher than that from RAOB, while the air temperature from ERA5 is generally lower than that from RAOB.
(4)
Almost all the PDF distributions of the GIIRS/FY-4A and ERA5 ATPs bias obey a nearly Gaussian distribution, with the latter better than the former in most of the oasis stations. The bias PDF distributions of both the GIIRS/FY-4A ATPs and ERA5 ATPs are more consistent with each other at the sheer desert or small-area oasis stations than at the large-area oasis station.
Due to the time range of the experimental field measurements, the time period of evaluation of the GIIRS/FY-4A ATPs is limited to July 2021. During this summer, the land surface emissivity (LSE) is rather different from that during the winter. The discrepancy of LSE in different seasons may induce differences in the retrieval quality of the GIIRS/FY-4A ATPs. Therefore, the conclusions drawn in this study could only represent the situation during the summer, rather than during any other seasons. The authors will evaluate the precision of the GIIRS/FY-4A ATPs in the winter in the future once radiosonde observations in the hinterland of TD are available. Meanwhile, with the discrepancy of temporal and spatial resolution, the RAOB ATPs need to be interpolated to be consistent with the GIIRS/FY-4A and ERA5 ATPs. Different interpolation methods would bring about minor differences between the interpolation results, and this point is worthy of further research. All in all, the results of this study can serve as a basis for the merging of the GIIRS/FY-4A ATPs and ERA5 ATPs in desert regions so as to recognize the real atmospheric structure for synoptic analysis or weather prediction.

Author Contributions

Conceptualization and investigation: J.L., A.M. and Y.M.; data analysis: Y.M. and L.X.; project guidance: J.L. and A.M.; interpretation: Y.M. and A.A.; All the authors contributed to the discussion and interpretation of the manuscript. All authors have read and agreed to the published version of the manuscript.

Funding

This research was funded by the Xinjiang Natural Science Foundation (Grant No. 2022D01A369), National Natural Science Foundation of China (Grant No. 41830968), the Scientific and Technological Innovation Team (Tianshan Innovation Team) project (Grant No. 2022TSYCTD0007), the Fengyun Application Pioneering Project (FY-APP), the S&T Development Fund of IDM (KJFZ202311) and the Flexible Talents Introducing Project of Xinjiang (Grant No. 2021-49).

Data Availability Statement

The Radiosonde datasets and the FY-4A ATPs analyzed during the current study are available from the first author on reasonable request.

Acknowledgments

The authors thank Qing He in the Xinjiang Meteorological Service for conducting the RAOB field experiments. Thanks are also extended to members of the Xinjiang Key Laboratory of Desert Meteorology and Sandstorm, including Wen Huo and Fan Yang for their support and many contributions to the project.

Conflicts of Interest

The authors declare no conflict of interest.

References

  1. Cintineo, R.M.; Otkin, J.A.; Jones, T.A.; Koch, S.; Stensrud, D.J. Assimilation of Synthetic GOES-R ABI Infrared Brightness Temperatures and WSR-88D Radar Observations in a High-Resolution OSSE. Mon. Weather. Rev. 2016, 144, 3159. [Google Scholar] [CrossRef]
  2. Yang, F.; Huang, J.; Zhou, C.; Yang, X.; Ali, M.; Li, C.; Pan, H.; Huo, W.; Yu, H.; Liu, X.; et al. Taklimakan desert carbon-sink decreases under climate change. Sci. Bull. 2020, 65, 431–433. [Google Scholar] [CrossRef]
  3. Huo, W.; Zhi, X.; Hu, S.; Cai, W.; Yang, F.; Zhou, C.; MamtiMin, A.; He, Q.; Pan, H.; Song, M.; et al. Refined assessment of potential evapotranspiration in the Tarim Basin. Front. Earth Sci. 2022, 10, 2296–6463. [Google Scholar] [CrossRef]
  4. Li, J.; Wang, P.; Han, H.; Li, J.; Zheng, J. On the Assimilation of Satellite Sounder Data in Cloudy Skies in Numerical Weather Prediction Models. J. Meteorol. Res. 2016, 30, 169–182. [Google Scholar] [CrossRef]
  5. Zhao, H.; Ma, X.; Jia, G.; Mi, Z.; Ji, H. Synergistic Retrieval of Temperature and Humidity Profiles from Space-Based and Ground-Based Infrared Sounders Using an Optimal Estimation Method. Remote Sens. 2022, 14, 5256. [Google Scholar] [CrossRef]
  6. Liu, Z.Q.; Barker, D.M. Radiance Assimilation in WRF-Var: Implementation and Initial Results. Presented at the 7th WRF Users Workshop, Boulder, CO, USA, 19–22 June 2006; Available online: https://www.researchgate.net/publication/228868507 (accessed on 24 July 2022).
  7. Szyndel, M.D.E.; Kelly, G.; Thépaut, J.N. Evaluation of potential benefit of assimilation of SEVIRI water vapour radiance data from Meteosat-8 into global numerical weather prediction analyses. Atmos. Sci. Lett. 2005, 6, 105–111. [Google Scholar] [CrossRef]
  8. Honda, T.; Kotsuki, S.; Lien, G.Y.; Maejima, Y.; Okamoto, K.; Miyoshi, T. Assimilation of Himawari-8 All-Sky Radiances Every 10 Minutes: Impact on Precipitation and Flood Risk Prediction. J. Geophys. Res. Atmos. 2018, 123, 965–976. [Google Scholar] [CrossRef] [Green Version]
  9. Honda, T.; Miyoshi, T.; Lien, G.; Nishizawa, S.; Yoshida, R.; Adachi, S.A.; Terasaki, K.; Okamoto, K.; Tomita, H.; Bessho, K. Assimilating All-Sky Himawari-8 Satellite Infrared Radiances: A Case of Typhoon Soudelor (2015). Mon. Weather Rev. 2018, 146, 213–229. [Google Scholar] [CrossRef]
  10. Jones, T.A.; Wang, X.; Skinner, P.; Johnson, A.; Wang, Y. Assimilation of GOES-13 Imager Clear-Sky Water Vapor (6.5 µm) Radiances into a Warn-on-Forecast System. Mon. Weather. Rev. 2018, 146, 1077–1107. [Google Scholar] [CrossRef]
  11. Eyre, J. The WMO Vision for Global Observing Systems in 2025: To What Extent Will It Be Met by Space Agencies’ Plans. In Proceedings of the ECMWF Annual Seminar, Reading, UK, 8–12 September 2014; Available online: https://www.ecmwf.int/sites/default/files/elibrary/2015/9328-wmo-vision-global-observing-systems-2025-what-extent-will-it-be-met-space-agencies-plans.pdf (accessed on 24 July 2022).
  12. Smith, W.L., Sr.; Revercomb, H.; Bingham, G.; Larar, A.; Huang, H.; Zhou, D.; Li, J.; Liu, X.; Kireev, S. Technical Note: Evolution, current capabilities, and future advance in satellite nadir viewing ultra-spectral IR sounding of the lower atmosphere. Atmos. Chem. Phys. 2009, 9, 5563–5574. [Google Scholar] [CrossRef] [Green Version]
  13. Goldberg, M.D.; Kilcoyne, H.; Cikanek, H.; Mehta, A. Joint Polar Satellite System: The United States next generation civilian polar-orbiting environmental satellite system. J. Geophys. Res. Atmos. 2013, 118, 13463–13475. [Google Scholar] [CrossRef]
  14. McNally, A.P.; Watts, P.D.; Smith, J.A.; Engelen, R.; Kelly, G.A.; Thépaut, J.N.; Matricardi, M. The assimilation of AIRS radiance data at ECMWF. Q. J. Roy. Meteor. Soc. 2006, 132, 935–957. [Google Scholar] [CrossRef] [Green Version]
  15. Collard, A.D. Selection of IASI channels for use in numerical weather prediction. Q. J. Roy. Meteor. Soc. 2007, 133, 1977–1991. [Google Scholar] [CrossRef]
  16. Gong, X.; Li, Z.; Li, J.; Moeller, C.C.; Wang, W. Monitoring the VIIRS Sensor Data Records Reflective Solar Band Calibrations Using DCC With Collocated CrIS Measurements. J. Geophys. Res. Atmos. 2019, 124, 8688–8706. [Google Scholar] [CrossRef] [Green Version]
  17. Yang, J.; Zhang, Z.; Wei, C.; Lu, F.; Guo, Q. Introducing the New Generation of Chinese Geostationary Weather Satellites, Fengyun-4. Bull. Am. Meteorol. Soc. 2017, 98, 1637–1658. [Google Scholar] [CrossRef]
  18. Le Marshall, J.; Jung, J.; Derber, J.; Chahine, M.; Treadon, R.; Lord, S.J.; Goldberg, M.; Wolf, W.; Liu, H.C.; Joiner, J.; et al. Improving Global Analysis and Forecasting with AIRS. Bull. Am. Meteorol. Soc. 2006, 87, 891–895. [Google Scholar] [CrossRef] [Green Version]
  19. Schmit, T.J.; Li, J.; Ackerman, S.A.; Gurka, J.J. High-Spectral- and High-Temporal-Resolution Infrared Measurements from Geostationary Orbit. J. Atmos. Ocean. Tech. 2009, 26, 2273–2292. [Google Scholar] [CrossRef] [Green Version]
  20. Menzel, W.P.; Schmit, T.J.; Zhang, P.; Li, J. Satellite-Based Atmospheric Infrared Sounder Development and Applications. Bull. Am. Meteorol. Soc. 2018, 99, 583–604. [Google Scholar] [CrossRef]
  21. Di, D. Research on Data Assimilation of FY-4 Hyperspectral Infrared Detector. Ph.D. Thesis, Chinese Academy of Meteorological Sciences, Beijing, China, 2019. [Google Scholar]
  22. Zhou, A. Experimental Study on Retrieving Atmospheric Temperature and Humidity Profiles Based on FY-4 Hyperspectral Infrared Simulation Data. Ph.D. Thesis, Chinese Academy of Meteorological Sciences, Beijing, China, 2017. [Google Scholar]
  23. Huang, Y.; Liu, Q.; He, M.; Chen, Y.; Zhao, B.; Xia, W.; Liu, T. Research on Inversion Precision of Temperature-Profile of GIIRS/FY-4A Satellite in Shanghai Typhoon Season Based on Radiosonde Data. Infrared 2020, 40, 28–38. [Google Scholar]
  24. He, M.; Wang, D.; Ding, W.; Wan, Y.; Chen, Y.; Zhang, Y. A Validation of Fengyun4A Temperature and Humidity Profile Products by Radiosonde Observations. Remote Sens. 2019, 11, 2039. [Google Scholar] [CrossRef] [Green Version]
  25. Di, D.; Li, J.; Han, W.; Bai, W.; Wu, C.; Menzel, W.P. Enhancing the Fast Radiative Transfer Model for FengYun-4 GIIRS by Using Local Training Profiles. J. Geophys. Res. Atmos. 2018, 123, 12–583. [Google Scholar] [CrossRef]
  26. Liu, J.; Xu, L.; Chen, W.; Wang, B.; Gong, X.; Deng, Z.; Li, Y.; Di, D. Bias Characteristics and Bias Correction of GIIRS Sounder onboard FY-4A Satellite for Data Assimilation. Chin. J. Atmos. Sci. 2022, 46, 275–292. [Google Scholar] [CrossRef]
  27. Yin, R.; Han, W.; Wang, H.; Wang, J. Impacts of FY-4A GIIRS Water Vapor Channels Data Assimilation on the Forecast of “21·7” Extreme Rainstorm in Henan, China with CMA-MESO. Remote Sens. 2022, 14, 5710. [Google Scholar] [CrossRef]
  28. Zhang, L.; Niu, Z.; Weng, F.; Dong, P.; Huang, W.; Zhu, J. Impacts of Direct Assimilation of the FY-4A/GIIRS Long-Wave Temperature Sounding Channel Data on Forecasting Typhoon In-Fa (2021). Remote Sens. 2023, 15, 355. [Google Scholar] [CrossRef]
  29. Yin, R.; Han, W.; Gao, Z.; Wang, G. A study on longwave infrared channel selection based on estimates of background errors and observation errors in the detection area of FY-4A. Acta Meteorol. Sin. 2019, 77, 898–910. [Google Scholar] [CrossRef]
  30. Gao, Y.; Mao, D.; Wang, X.; Qin, D. Evaluation of FY-4A Temperature Profile Products and Application to Winter Precipitation Type Diagnosis in Southern China. Remote Sens. 2022, 14, 2363. [Google Scholar] [CrossRef]
  31. Ma, Y.; Li, R.; Zhang, M.; Wang, M.; Mamtimin, A. Validation of AIRS-Retrieved atmospheric temperature data over the Taklimakan Desert. Sci. Cold Arid. Reg. 2020, 12, 242–251. [Google Scholar] [CrossRef]
Figure 1. Spatial distribution of all GIIRS/FY-4A ATPs (a) and those with QC flags equal to 0 or 1 (b) during 08:00–09:40 UTC on 31 July 2021.
Remotesensing 15 02925 g001
Figure 2. The monthly averaged percentage of GIIRS/FY-4A ATPs in July 2021 (black line) with different QC flags out of all grid numbers in and around TD. The percentages of retrievals with QC_Flag = 3, QC_Flag = 2, QC_Flag = 1, and QC_Flag = 0 are represented by the blue line, cyan line, green line and red line, respectively.
Remotesensing 15 02925 g002
Figure 3. Spatial distribution of the RAOB stations in and around the Taklimakan Desert.
Remotesensing 15 02925 g003
Figure 4. Monthly averaged atmospheric temperature profiles from RAOB for the eight stations in TD in July 2021. The black, blue and red lines indicate the mean, minimum and maximum, respectively. The station name of each subplot is given in the upper-right corner of each subplot.
Remotesensing 15 02925 g004
Figure 5. Monthly averaged atmospheric temperature profiles from ERA5 for the eight stations in TD in July 2021. The black, blue and red lines indicate the mean, minimum and maximum, respectively. The station name of each subplot is given in the upper-right corner of each subplot.
Remotesensing 15 02925 g005
Figure 6. Monthly averaged atmospheric temperature profiles from GIIRS/FY-4A for the eight stations in TD in July 2021. The black, blue and red lines indicate the mean, minimum and maximum, respectively. The station name of each subplot is given in the upper-right corner of each subplot.
Remotesensing 15 02925 g006
Figure 7. The MB (a,c) and RMSE (b,d) of ERA5 GIIRS/FY-4A ATPs (a,b) and GIIRS/FY-4A ATPs (c,d).
Remotesensing 15 02925 g007
Figure 8. The scatterplots of ERA5 ATPs and RAOB ATPs. The station name of each subplot is given in the upper-left corner of each subplot. The blue hollow circles stand for the air temperatures of both ERA5 and RAOB ATPs, with their correlation coefficients (Corr in the plot) available in the lower-right corner of each subplot. The red solid line is the function plot of y = x, which is plotted as the reference to compare the temperatures of ERA5 and RAOB.
Remotesensing 15 02925 g008
Figure 9. The scatterplots of GIIRS/FY-4A ATPs and RAOB ATPs. The station name of each subplot is given in the upper-left corner of each subplot. The blue hollow circles stand for the air temperatures of both GIIRS/FY-4A and RAOB ATPs, with their correlation coefficients (Corr in the plot) available in the lower-right corner of each subplot. The red solid line is the function plot of y = x, which is plotted as the reference to compare the temperatures of GIIRS/FY-4A and RAOB.
Remotesensing 15 02925 g009
Figure 10. The QQ plots of ERA5 ATPs and RAOB ATPs at each selected station. The station name of each subplot is given in the upper left corner of each subplot. The plus shaped blue point shows the median value of both ERA5 and RAOB temperatures. The red solid line is the function plot of y = x, which is plotted as the reference to compare the temperature of ERA5 and RAOB.
Remotesensing 15 02925 g010
Figure 11. The QQ plots of GIIRS/FY-4A ATPs and RAOB ATPs at each selected station. The station name of each sub-plot is given in the upper-left corner of each subplot. The plus shaped blue point shows the median value of both GIIRS/FY-4A and RAOB temperatures. The red solid line is the function plot of y = x, which is plotted as the reference to compare the temperature of GIIRS/FY-4A and RAOB.
Remotesensing 15 02925 g011
Figure 12. Bias PDFs of ERA5 ATPs and GIIRS/FY-4A ATPs at each station, with atmospheric pressure layer from 0 hPa to 1000 hPa. The station name of each subplot is given in the upper-left corner of each subplot. The red dashed lines stand for the PDF curves of ERA5 ATPs, and the blue solid lines stand for the PDF curves of GIIRS/FY4A ATPs.
Remotesensing 15 02925 g012
Figure 13. Bias PDFs of ERA5 ATPS and GIIRS/FY-4A ATPS in different layers of all eight stations. The subplot (a) indicates the PDF curves of both ERA5 ATPs and GIIRS/FY-4A ATPs at pressure layers from 0 hPa to 1000 hPa, while (b) is for 0 to 200 hPa, (c) for 200 to 700 hPa, and (d) for 700 to 1000 hPa. The red dashed lines stand for the PDF curves of ERA5 ATPs, and the blue solid lines for the PDF curves of GIIRS/FY4A ATPs.
Remotesensing 15 02925 g013
Table 1. Maxima, minima and mean percentage of GIIRS/FY-4A ATPs with different QC flags.
PercentageAvailableQC_Flag = 3QC_Flag = 2QC_Flag = 1QC_Flag = 0QC_Flag = 0 or 1
maxima96.11%95.56%24.89%14.59%49.12%62.65%
minima27.01%1.92%0000
mean72.98%46.16%11.38%6.24%26.82%33.06%
Table 2. Geolocation and altitudes of RAOB stations.
RAOB StationsStation IDLocationAltitude (m)Land-Use Category
TZ51747(83.63°E, 39.04°N)1099.0desert
KE51656(86.13°E, 41.75°N)931.5oasis
KC51644(83.07°E, 41.72°N)1081.9oasis
AK51628(80.23°E, 41.12°N)1103.8oasis
KS51709(75.75°E, 39.48°N)1288.7oasis
HT51828(79.93°E, 37.13°N)1374.5oasis
MF51839(82.72°E, 37.07°N)1409.3oasis
RQ51777(88.18°E, 39.01°N)888.3Oasis (small square)
Table 3. Xc and COD of bias of both the ERA5 and GIIRS/FY-4A ATPs bias PDF at eight stations.
ERA5FY4A
TZKEKCAKKSHTMFRQTZKEKCAKKSHTMFRQ
Xc−0.057 −0.295 −0.052 −0.086 −0.016 −0.117 −0.084 −0.429 −0.217 −0.645 −0.279 0.307 0.270 0.478 0.173 −0.184
A39.438 64.761 73.726 68.093 62.748 72.146 73.700 29.888 29.011 33.099 34.108 33.331 36.179 22.068 28.229 25.050
COD0.996 1.000 1.000 1.000 1.000 0.999 1.000 0.983 0.995 0.994 0.984 0.994 0.998 0.962 0.998 0.959
Disclaimer/Publisher’s Note: The statements, opinions and data contained in all publications are solely those of the individual author(s) and contributor(s) and not of MDPI and/or the editor(s). MDPI and/or the editor(s) disclaim responsibility for any injury to people or property resulting from any ideas, methods, instructions or products referred to in the content.

