
Comparison of Ground-Based, Unmanned Aerial Vehicles and Satellite Remote Sensing Technologies for Monitoring Pasture Biomass on Dairy Farms

 ,
,
Abstract
: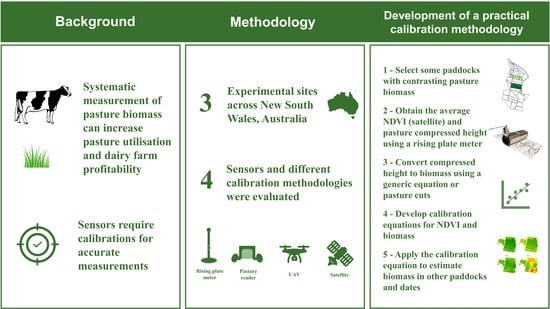
1. Introduction
2. Materials and Methods
2.1. Experiment 1 (E1)
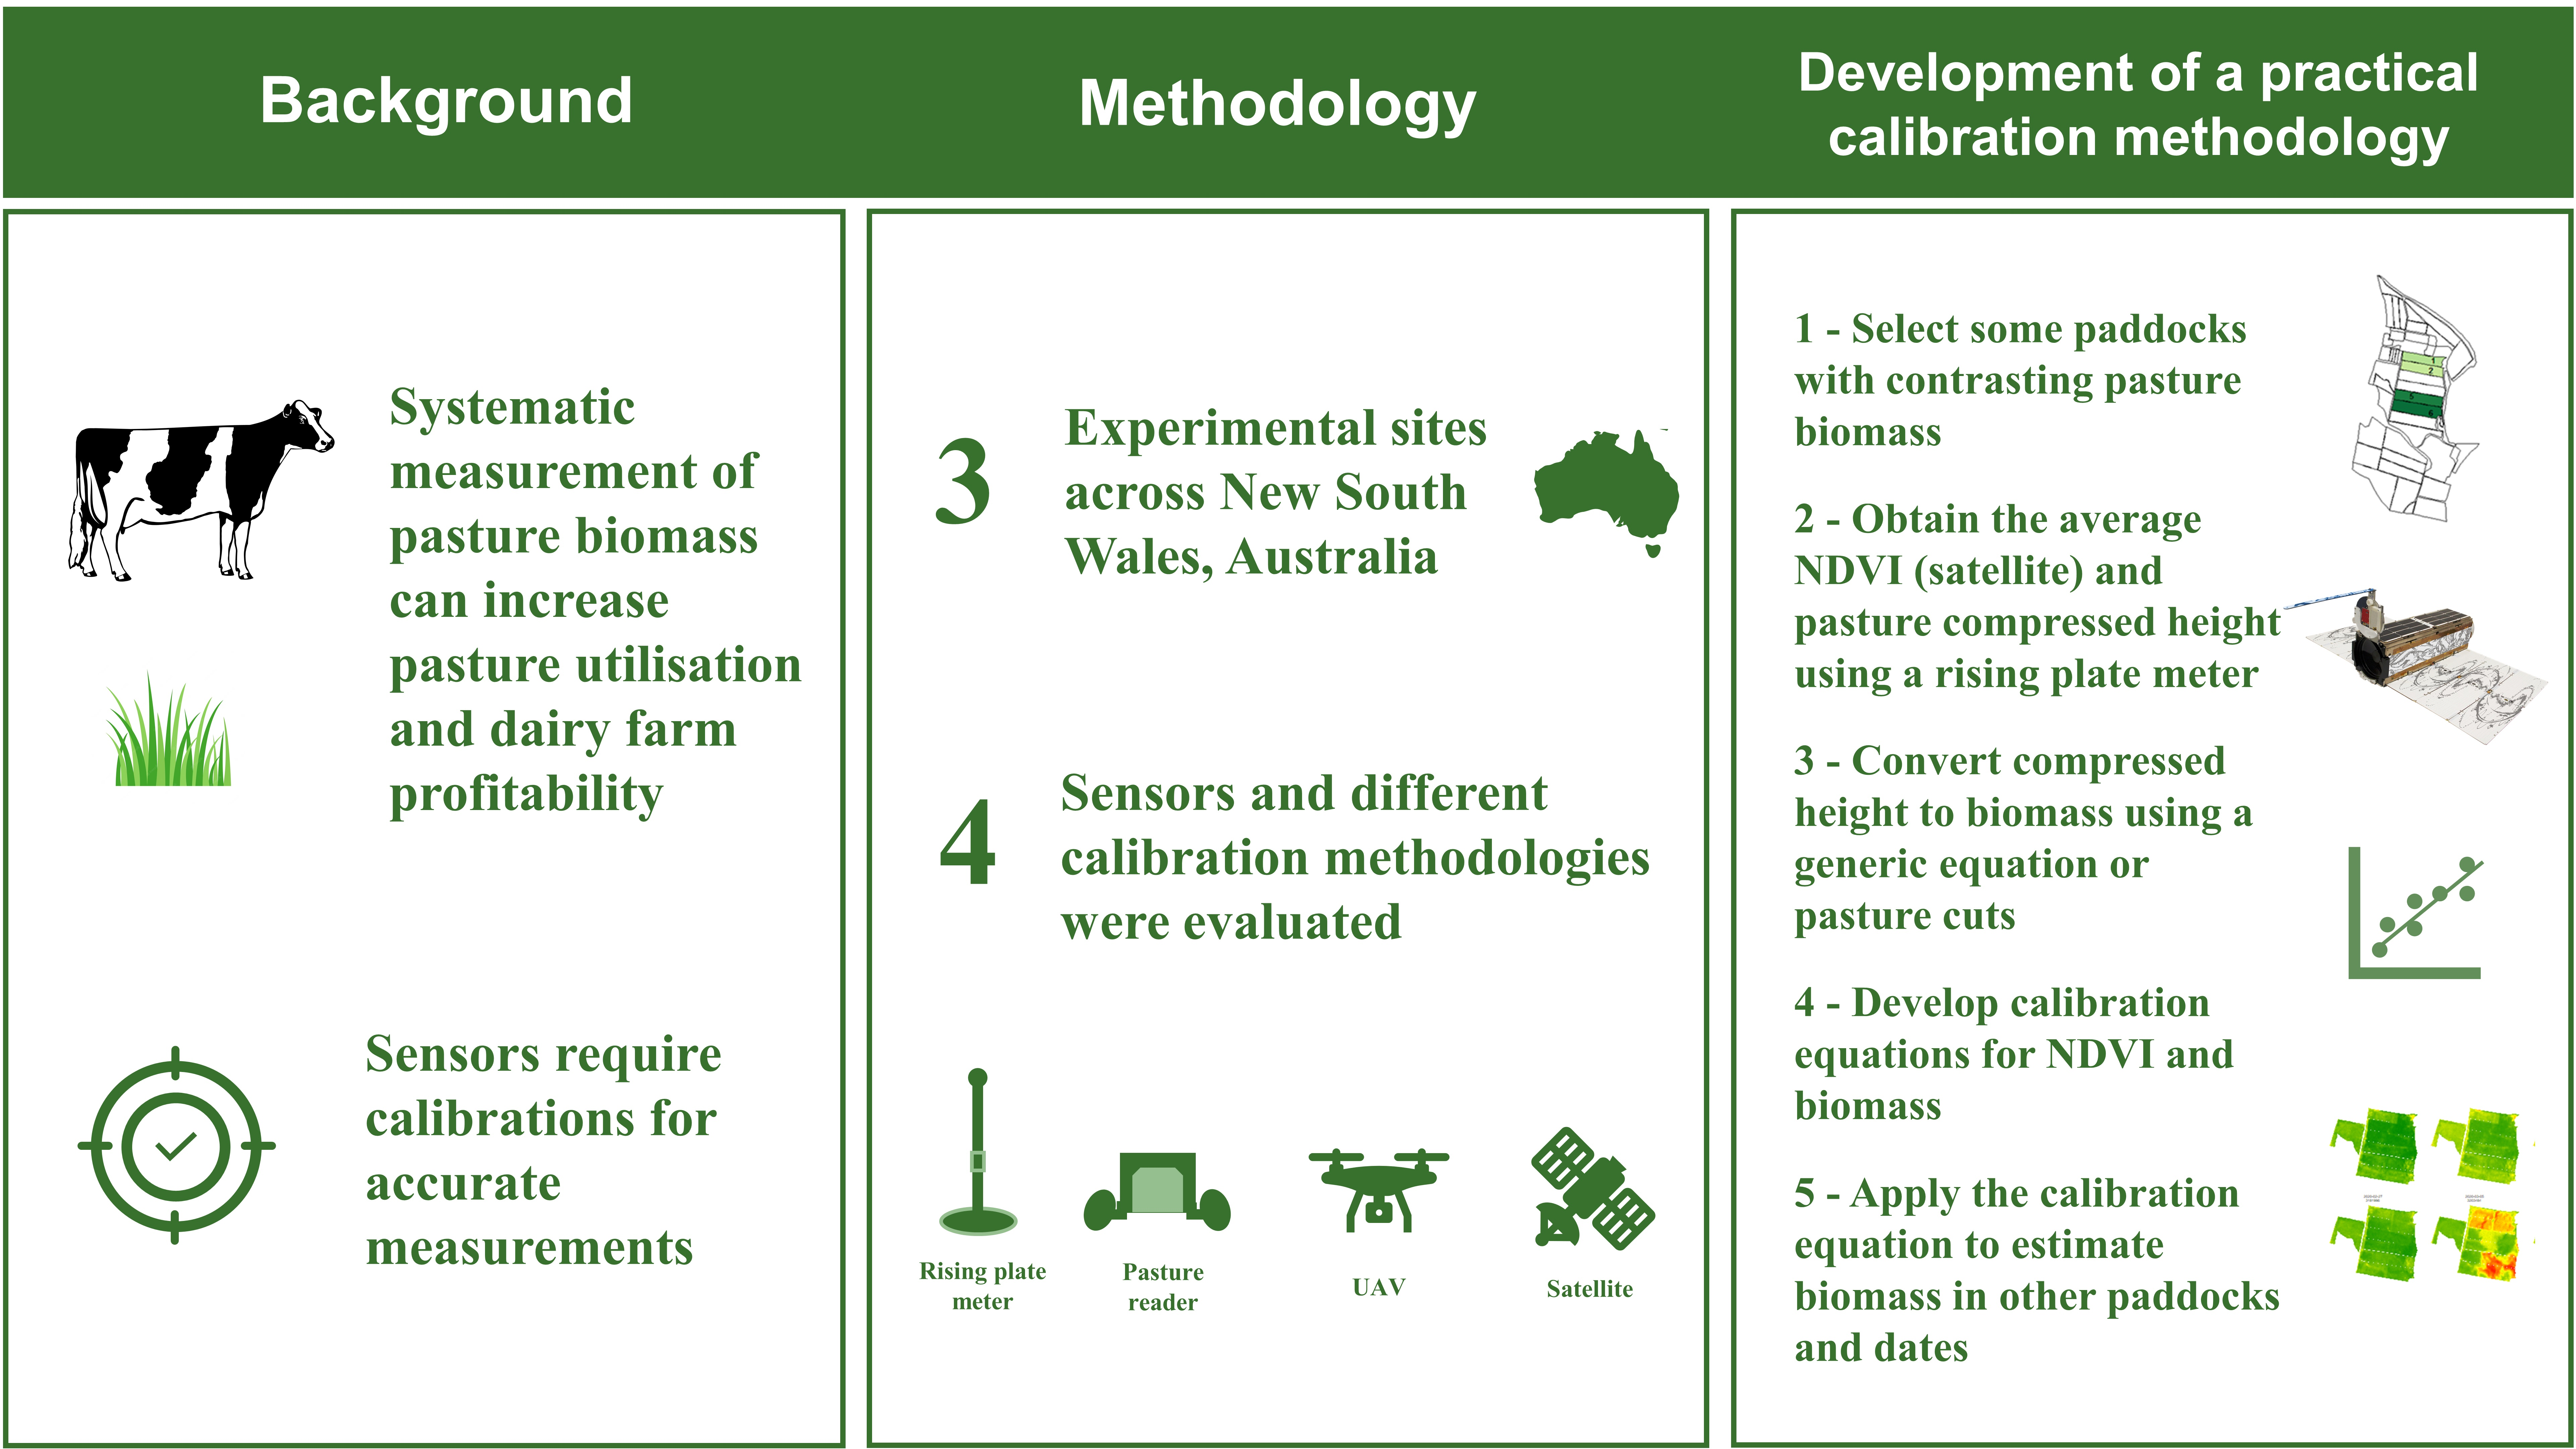
2.1.1. Site and Experimental Design
2.1.2. Data Collection
2.1.3. Data Processing and Statistical Analysis
2.2. Experiment 2 (E2)
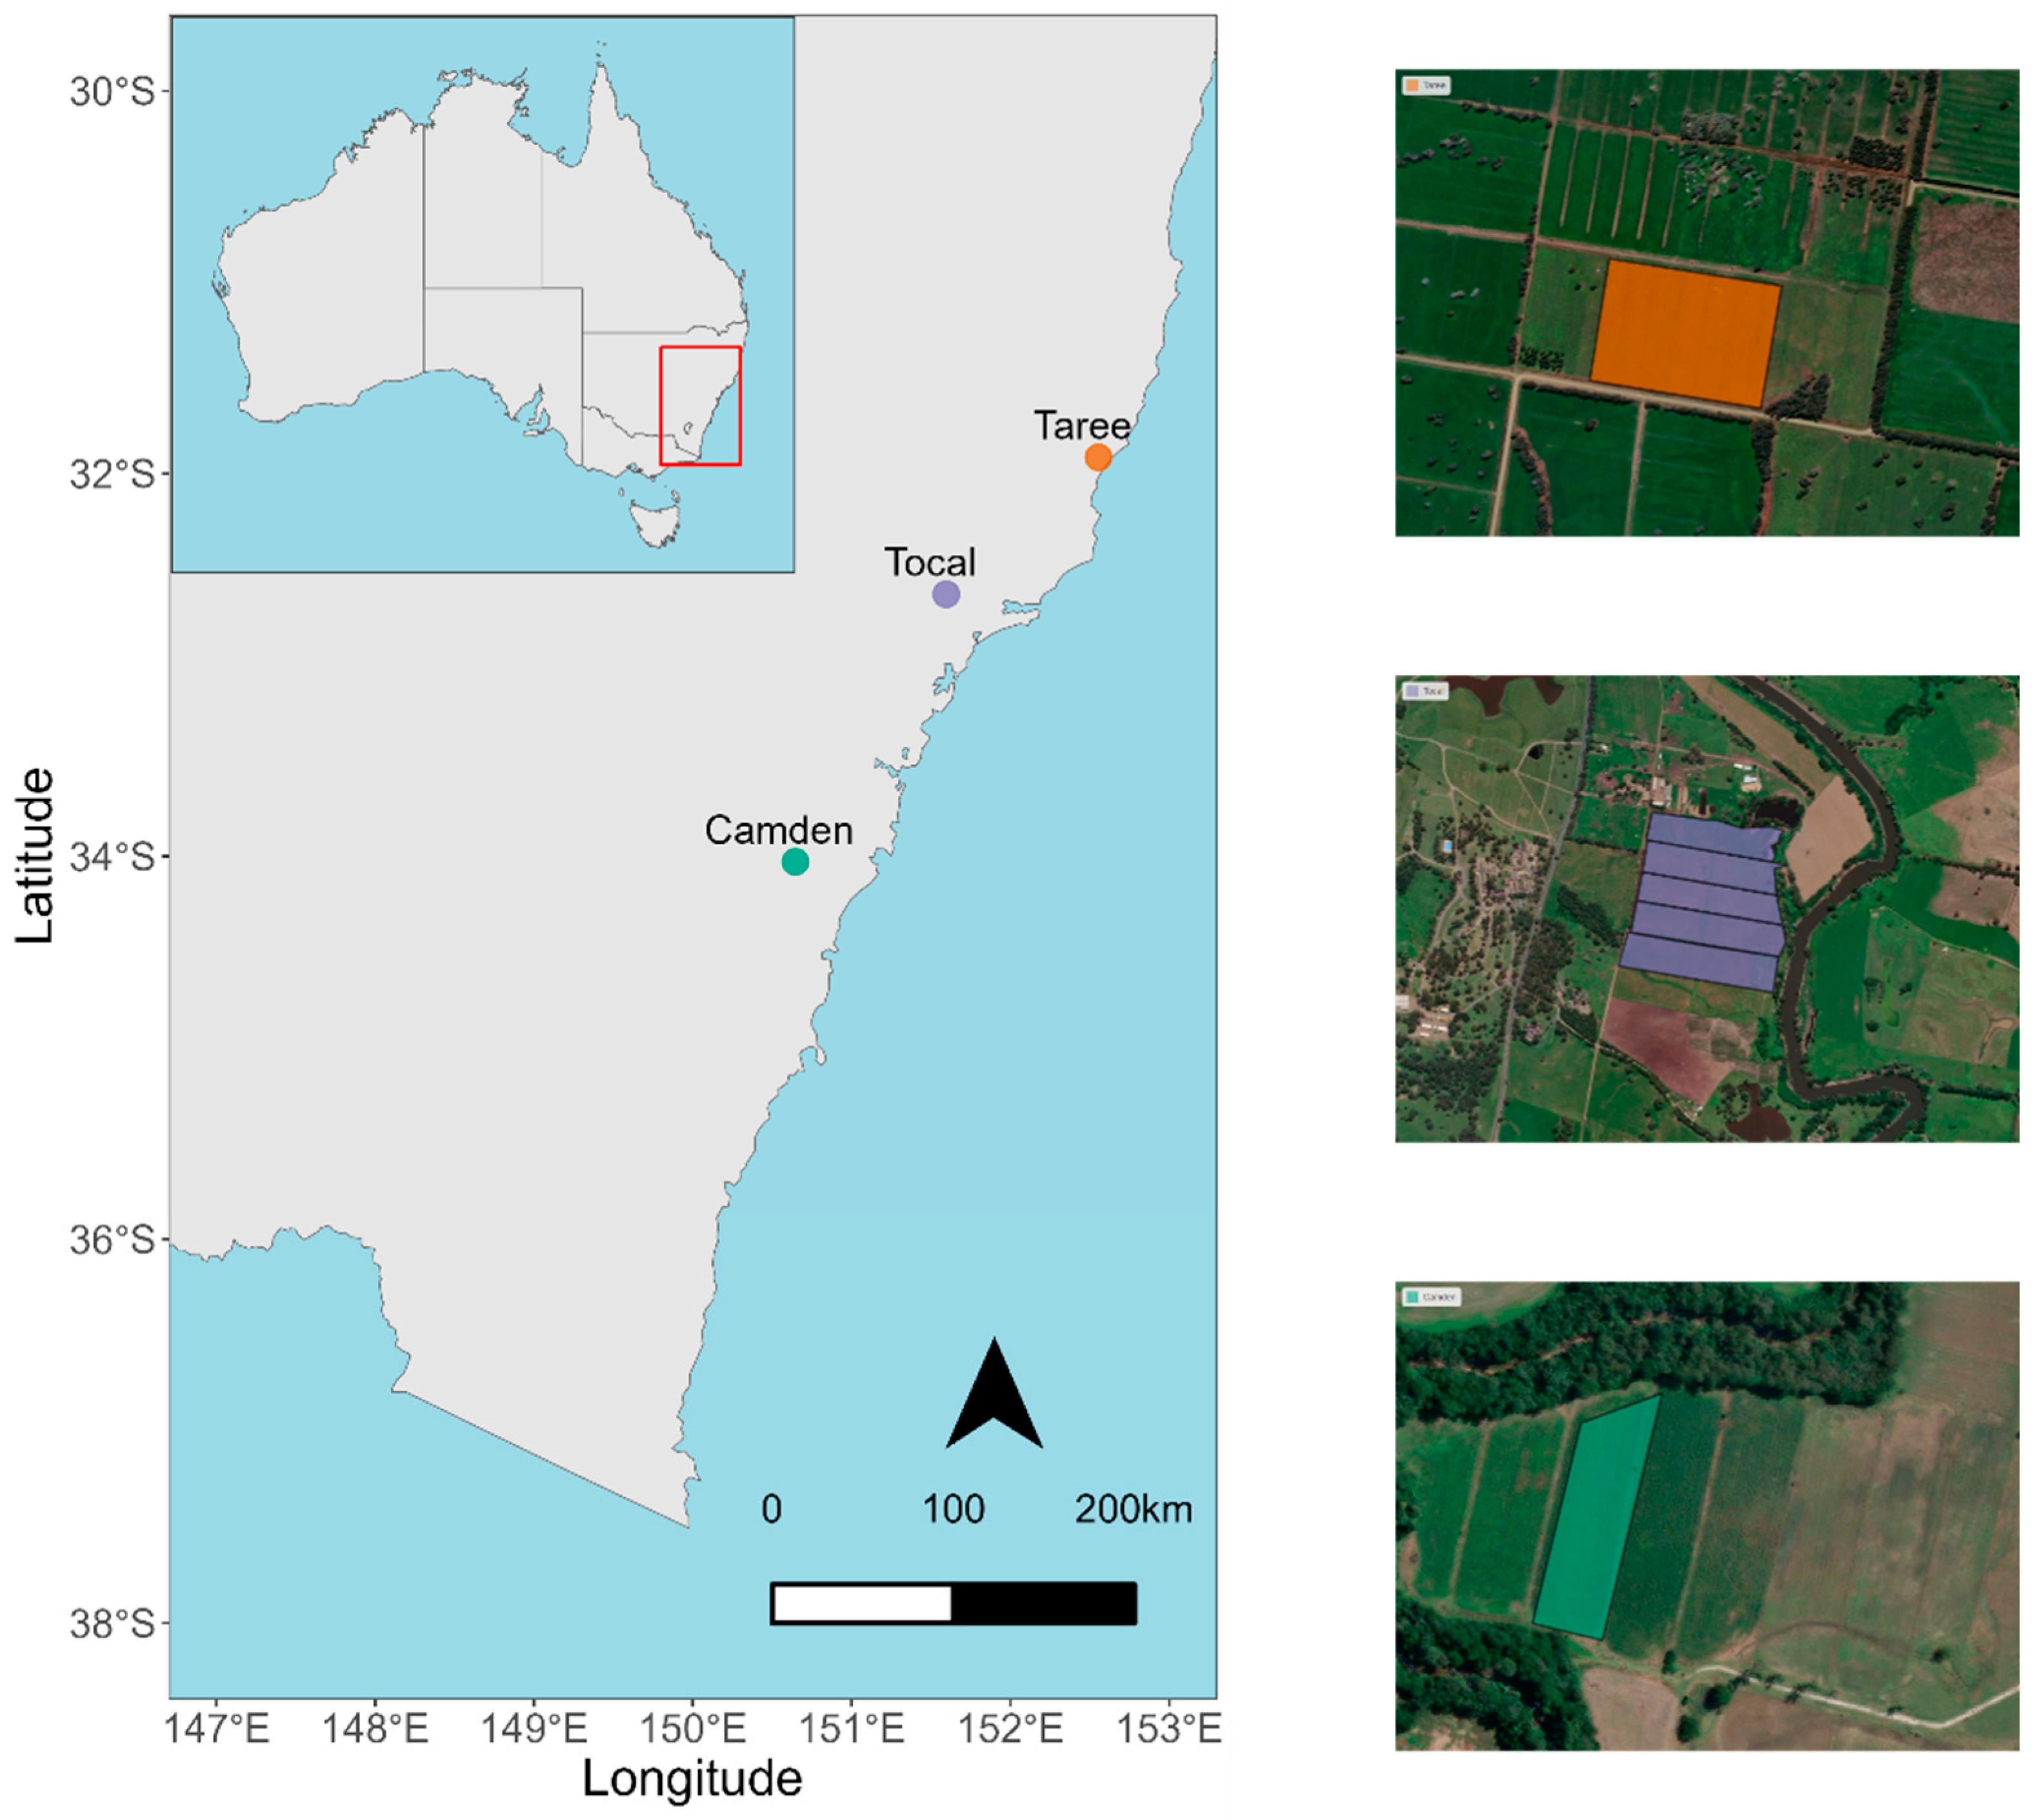
2.2.1. Site and Experimental Design
2.2.2. Data Collection
2.2.3. Data Processing and Statistical Analysis
2.3. Experiment 3 (E3)
2.3.1. Site and Experimental Design
2.3.2. Data Collection
2.3.3. Data Processing and Statistical Analysis
3. Results
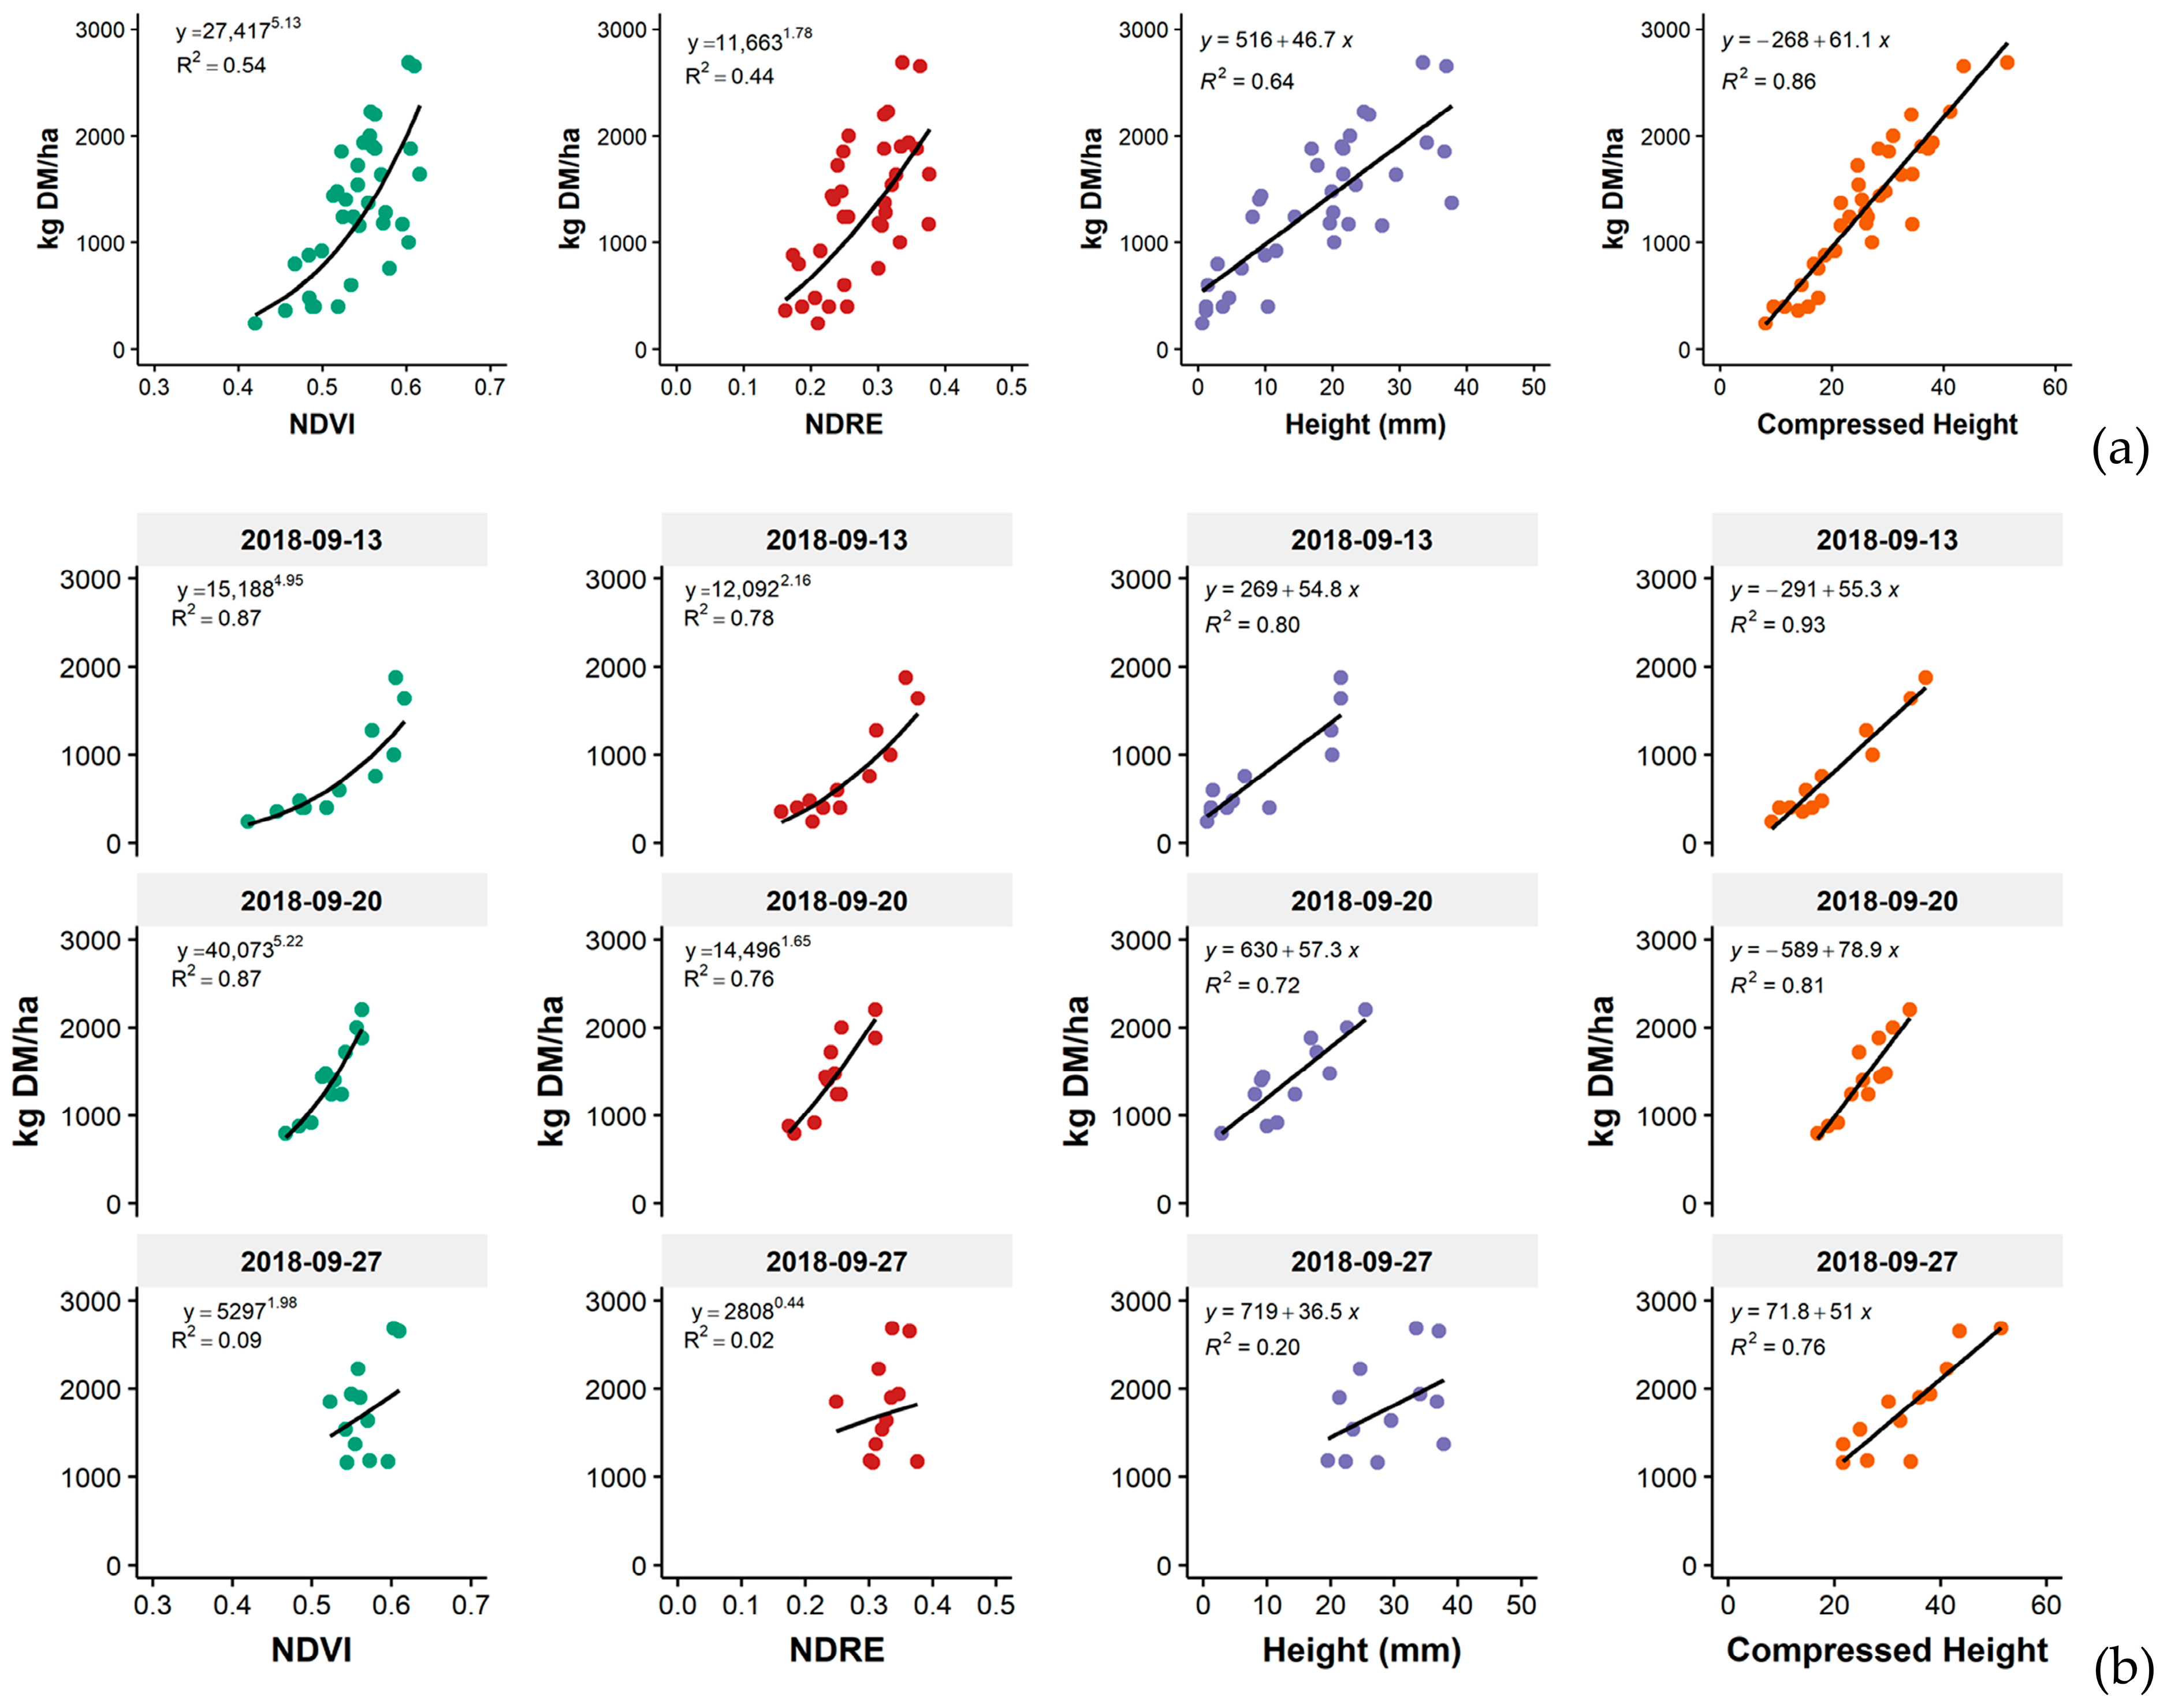
3.1. Experiment 1
3.2. Experiment 2
3.2.1. Calibrations
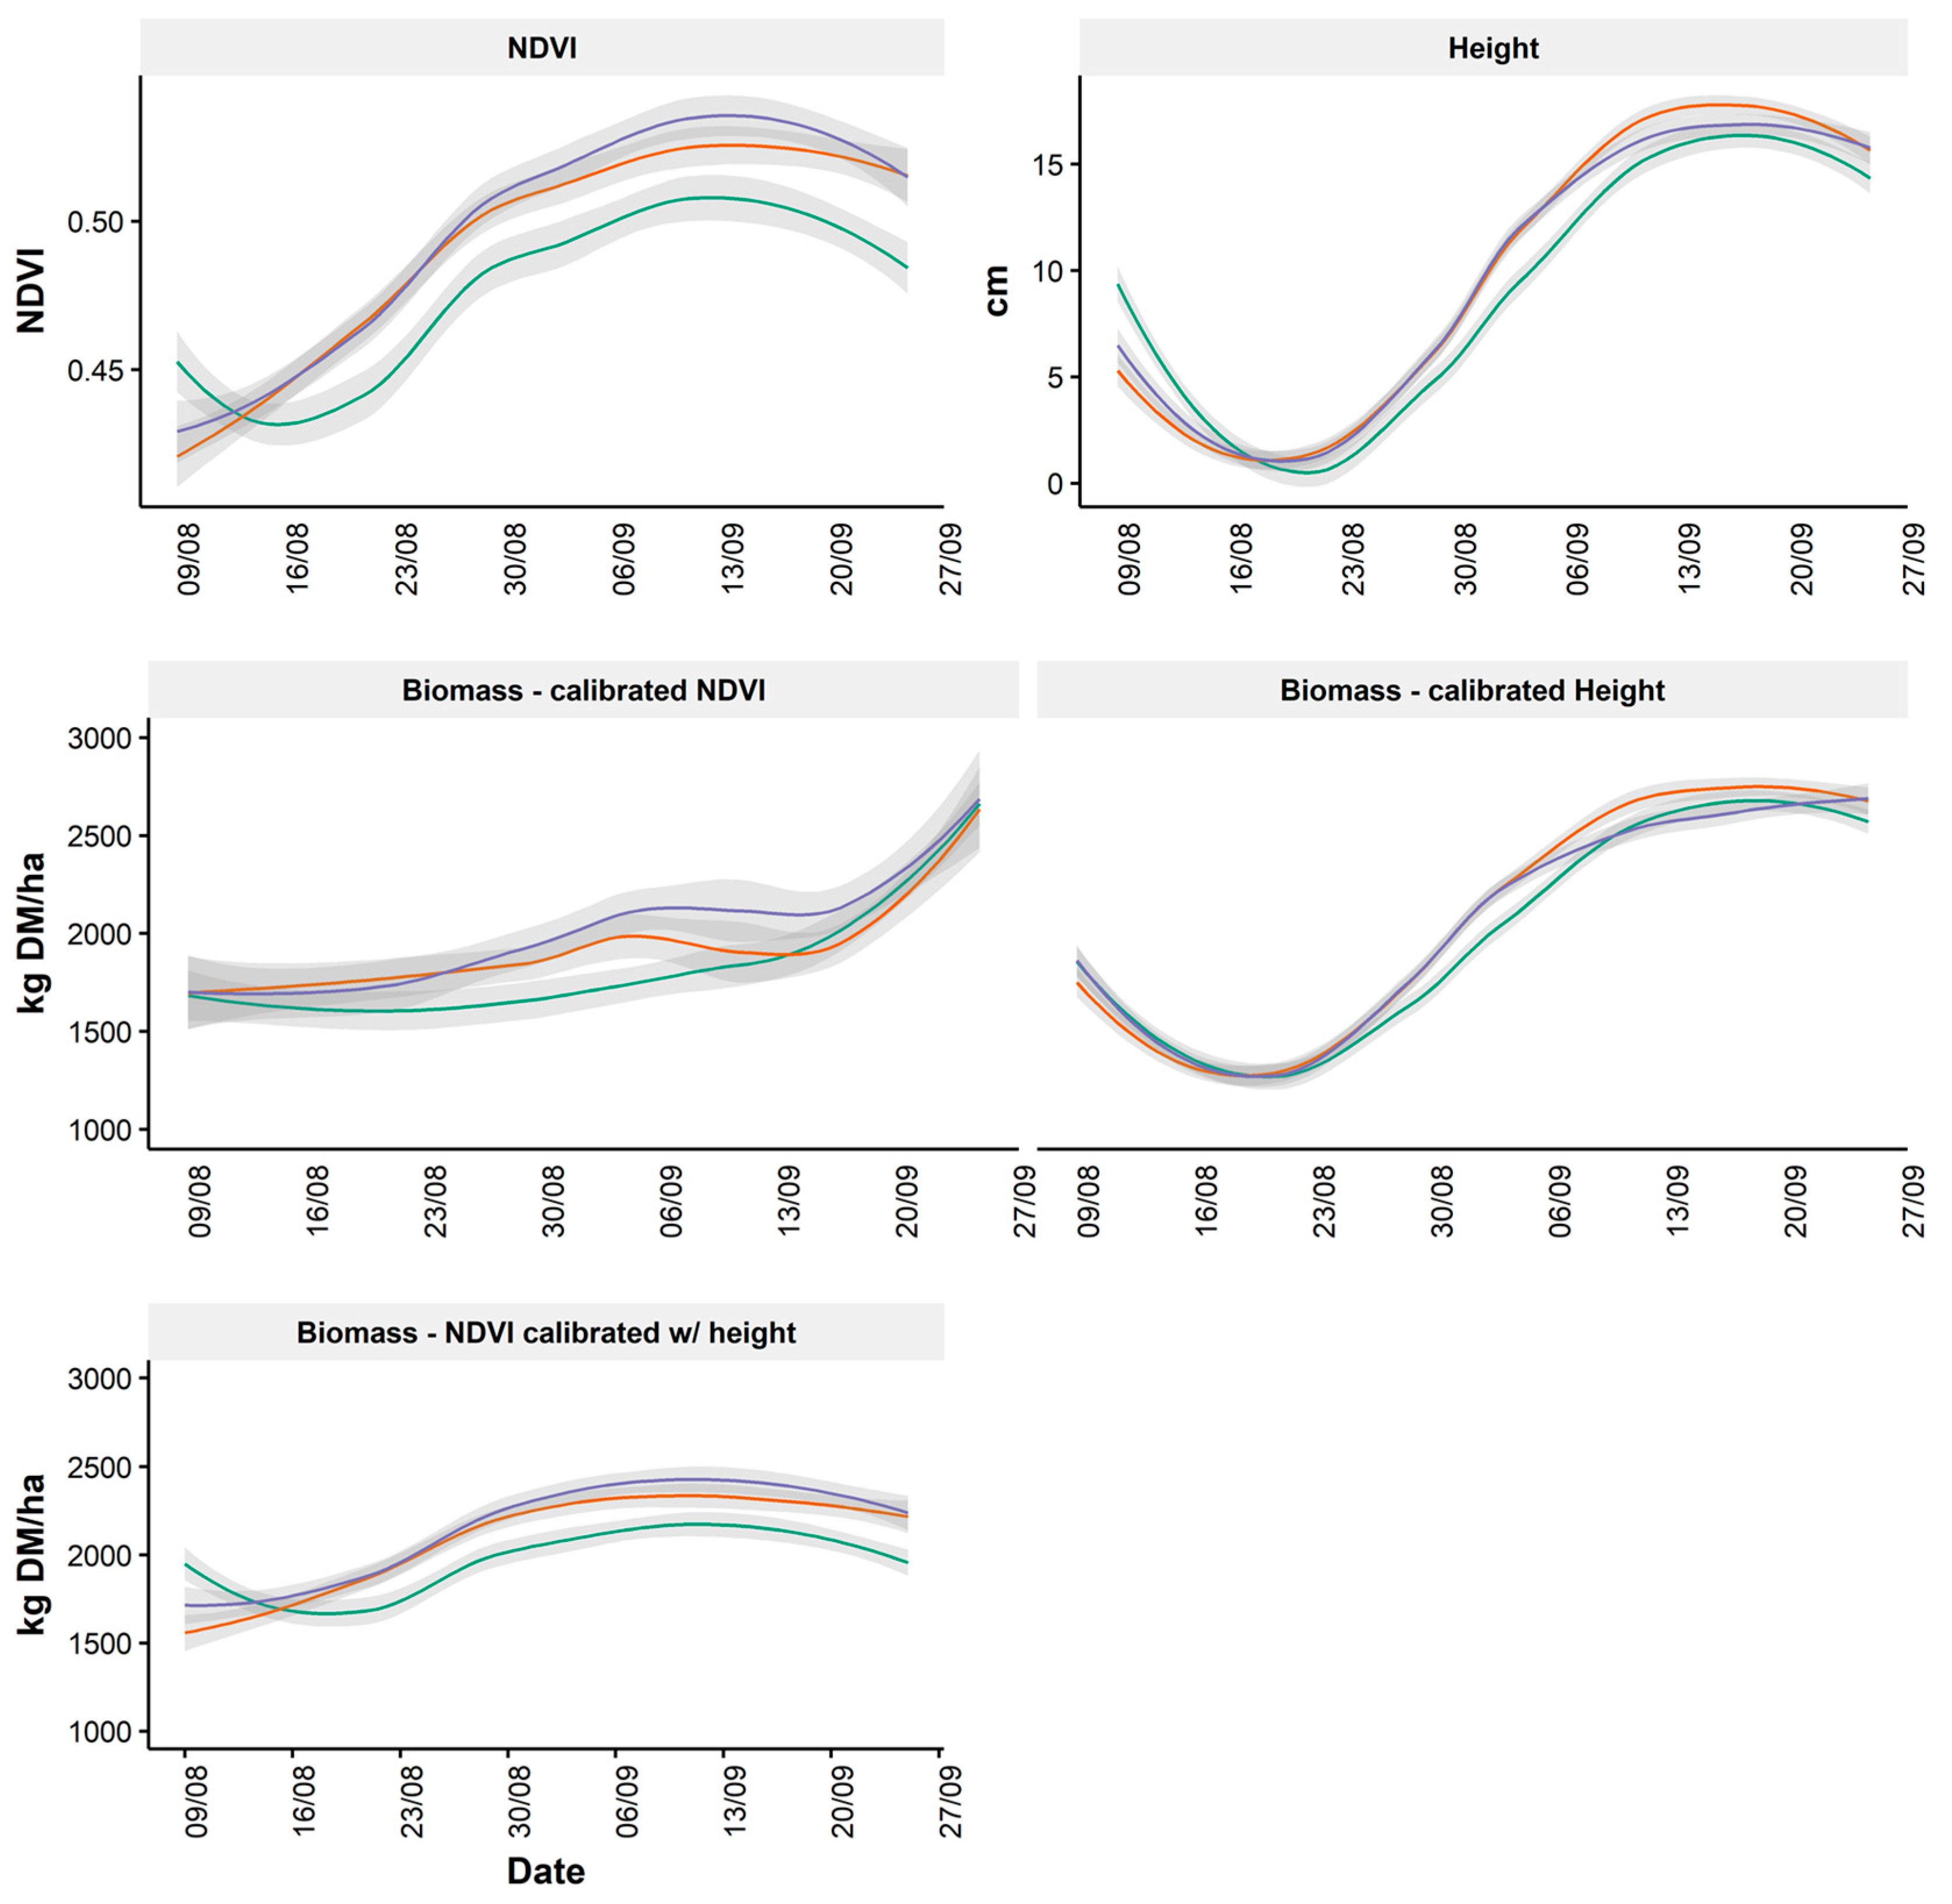
3.2.2. Variability between Treatments
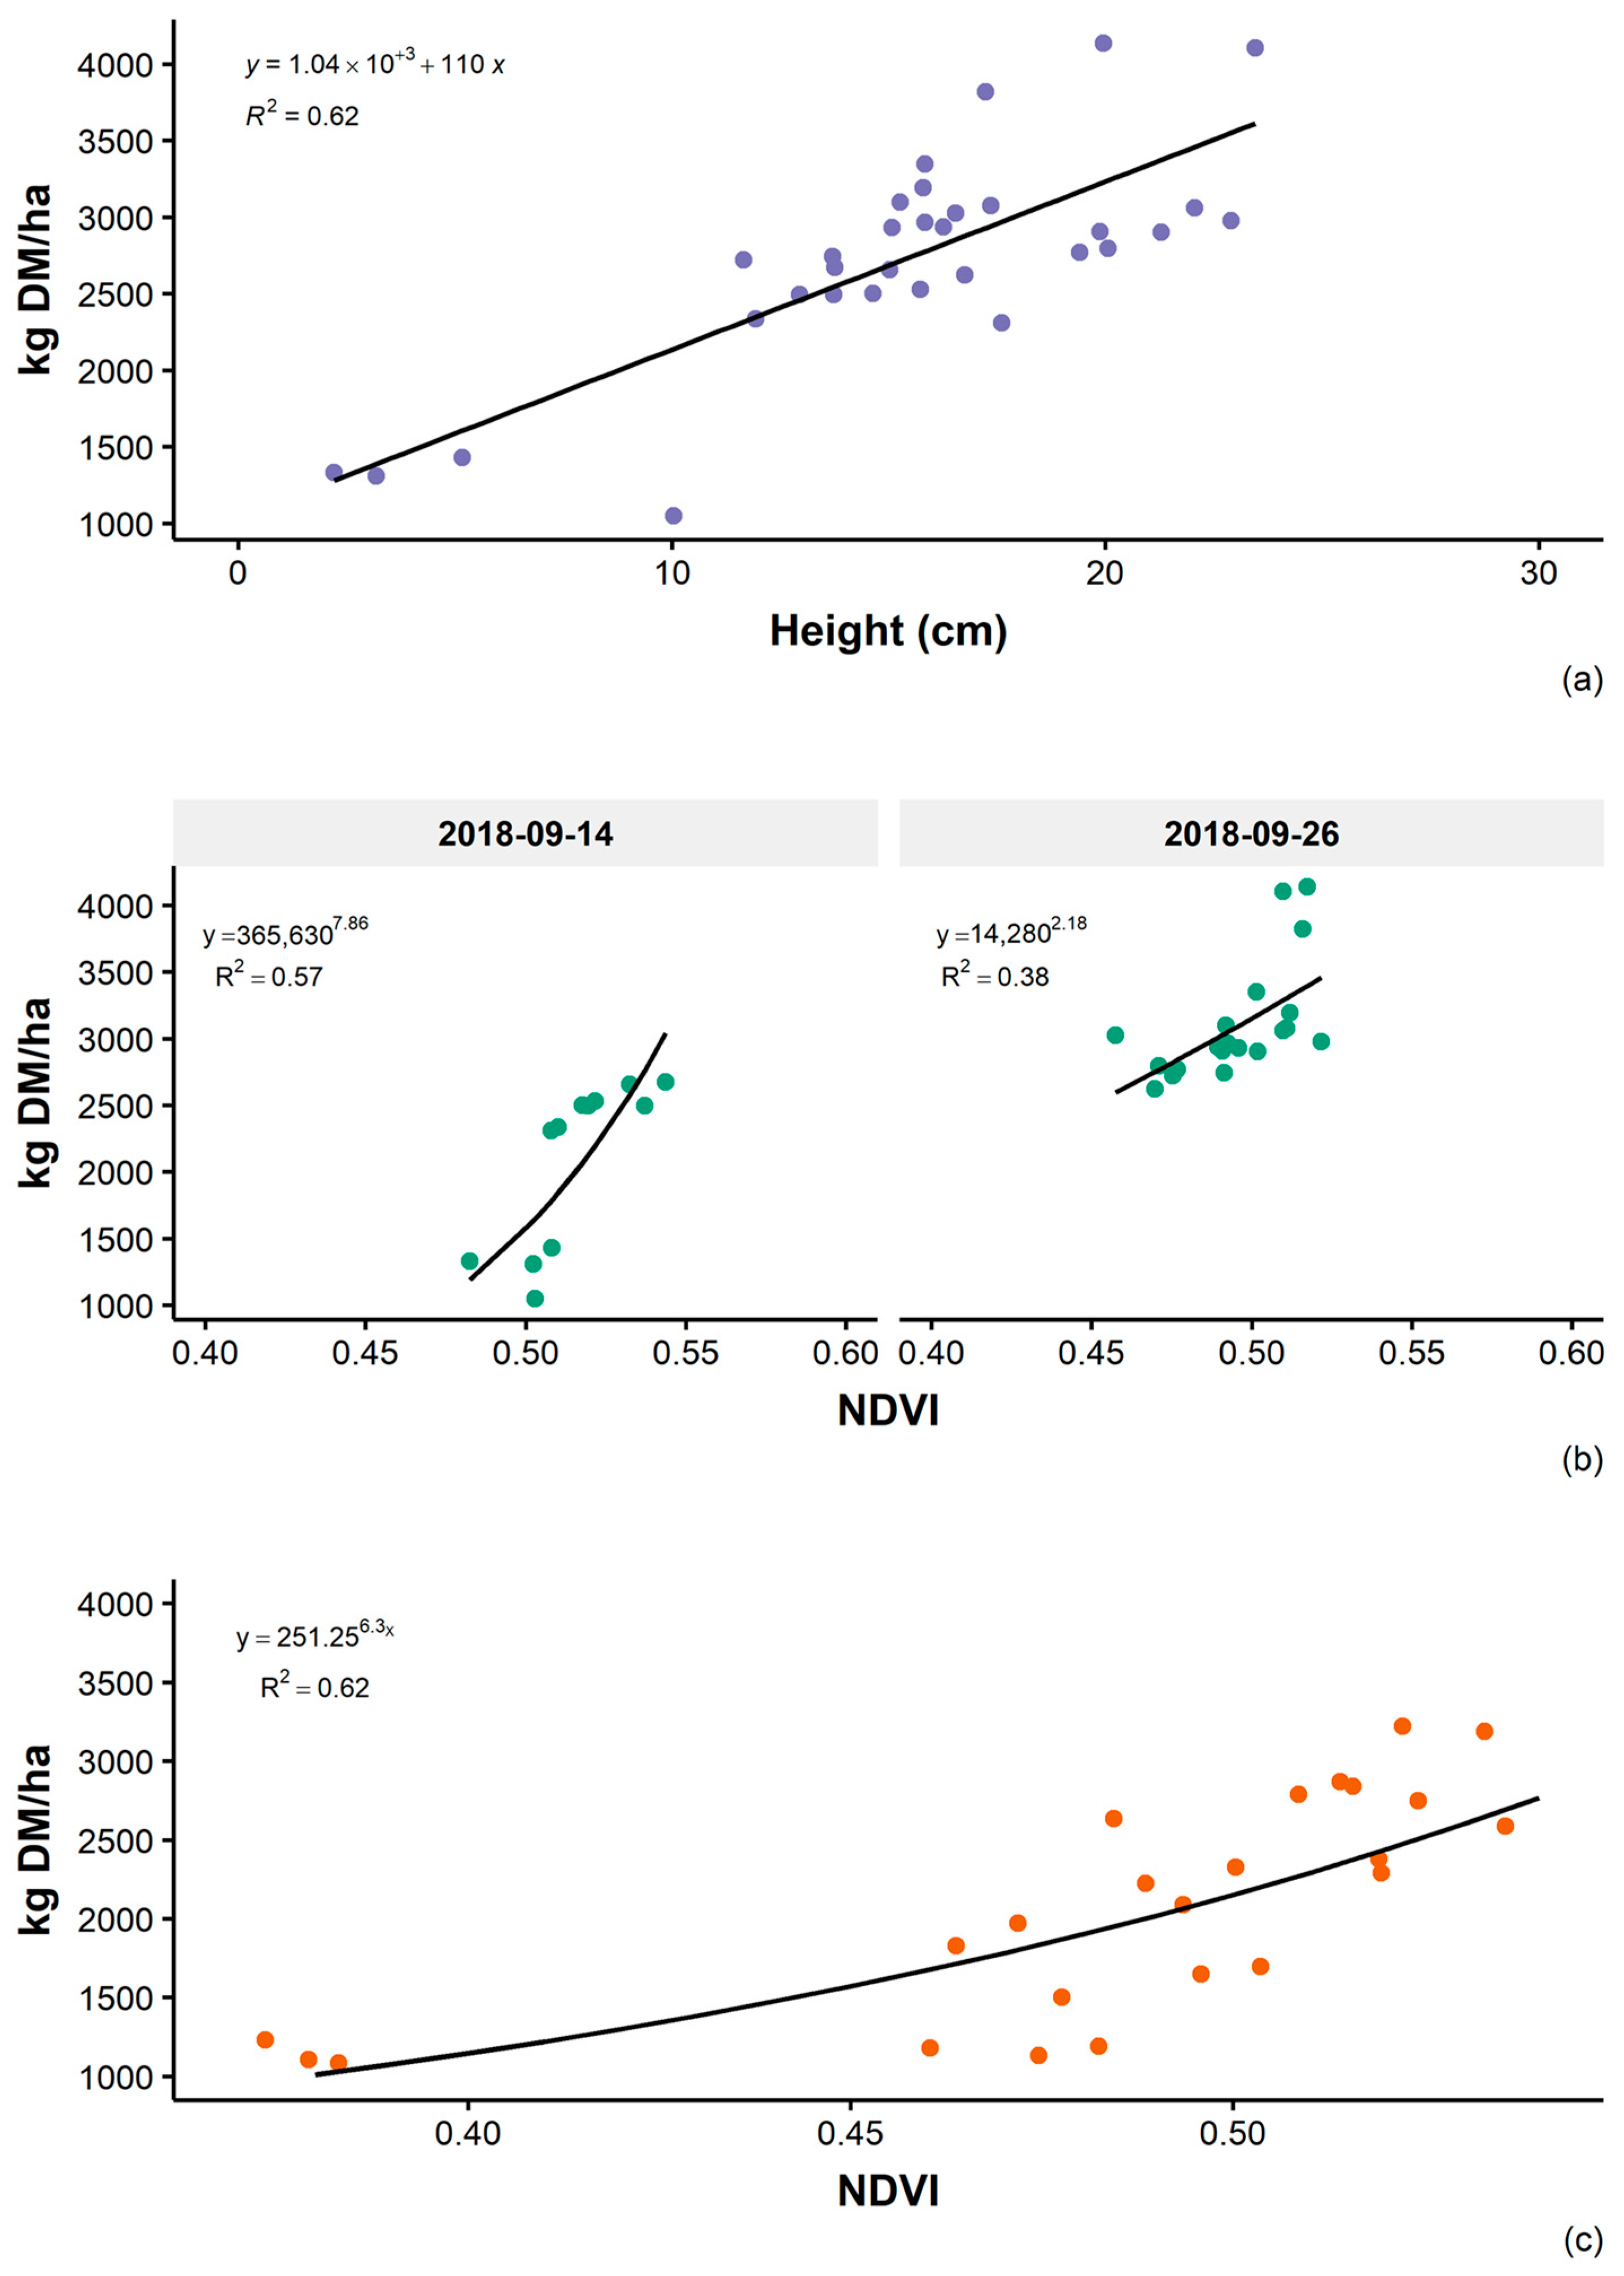
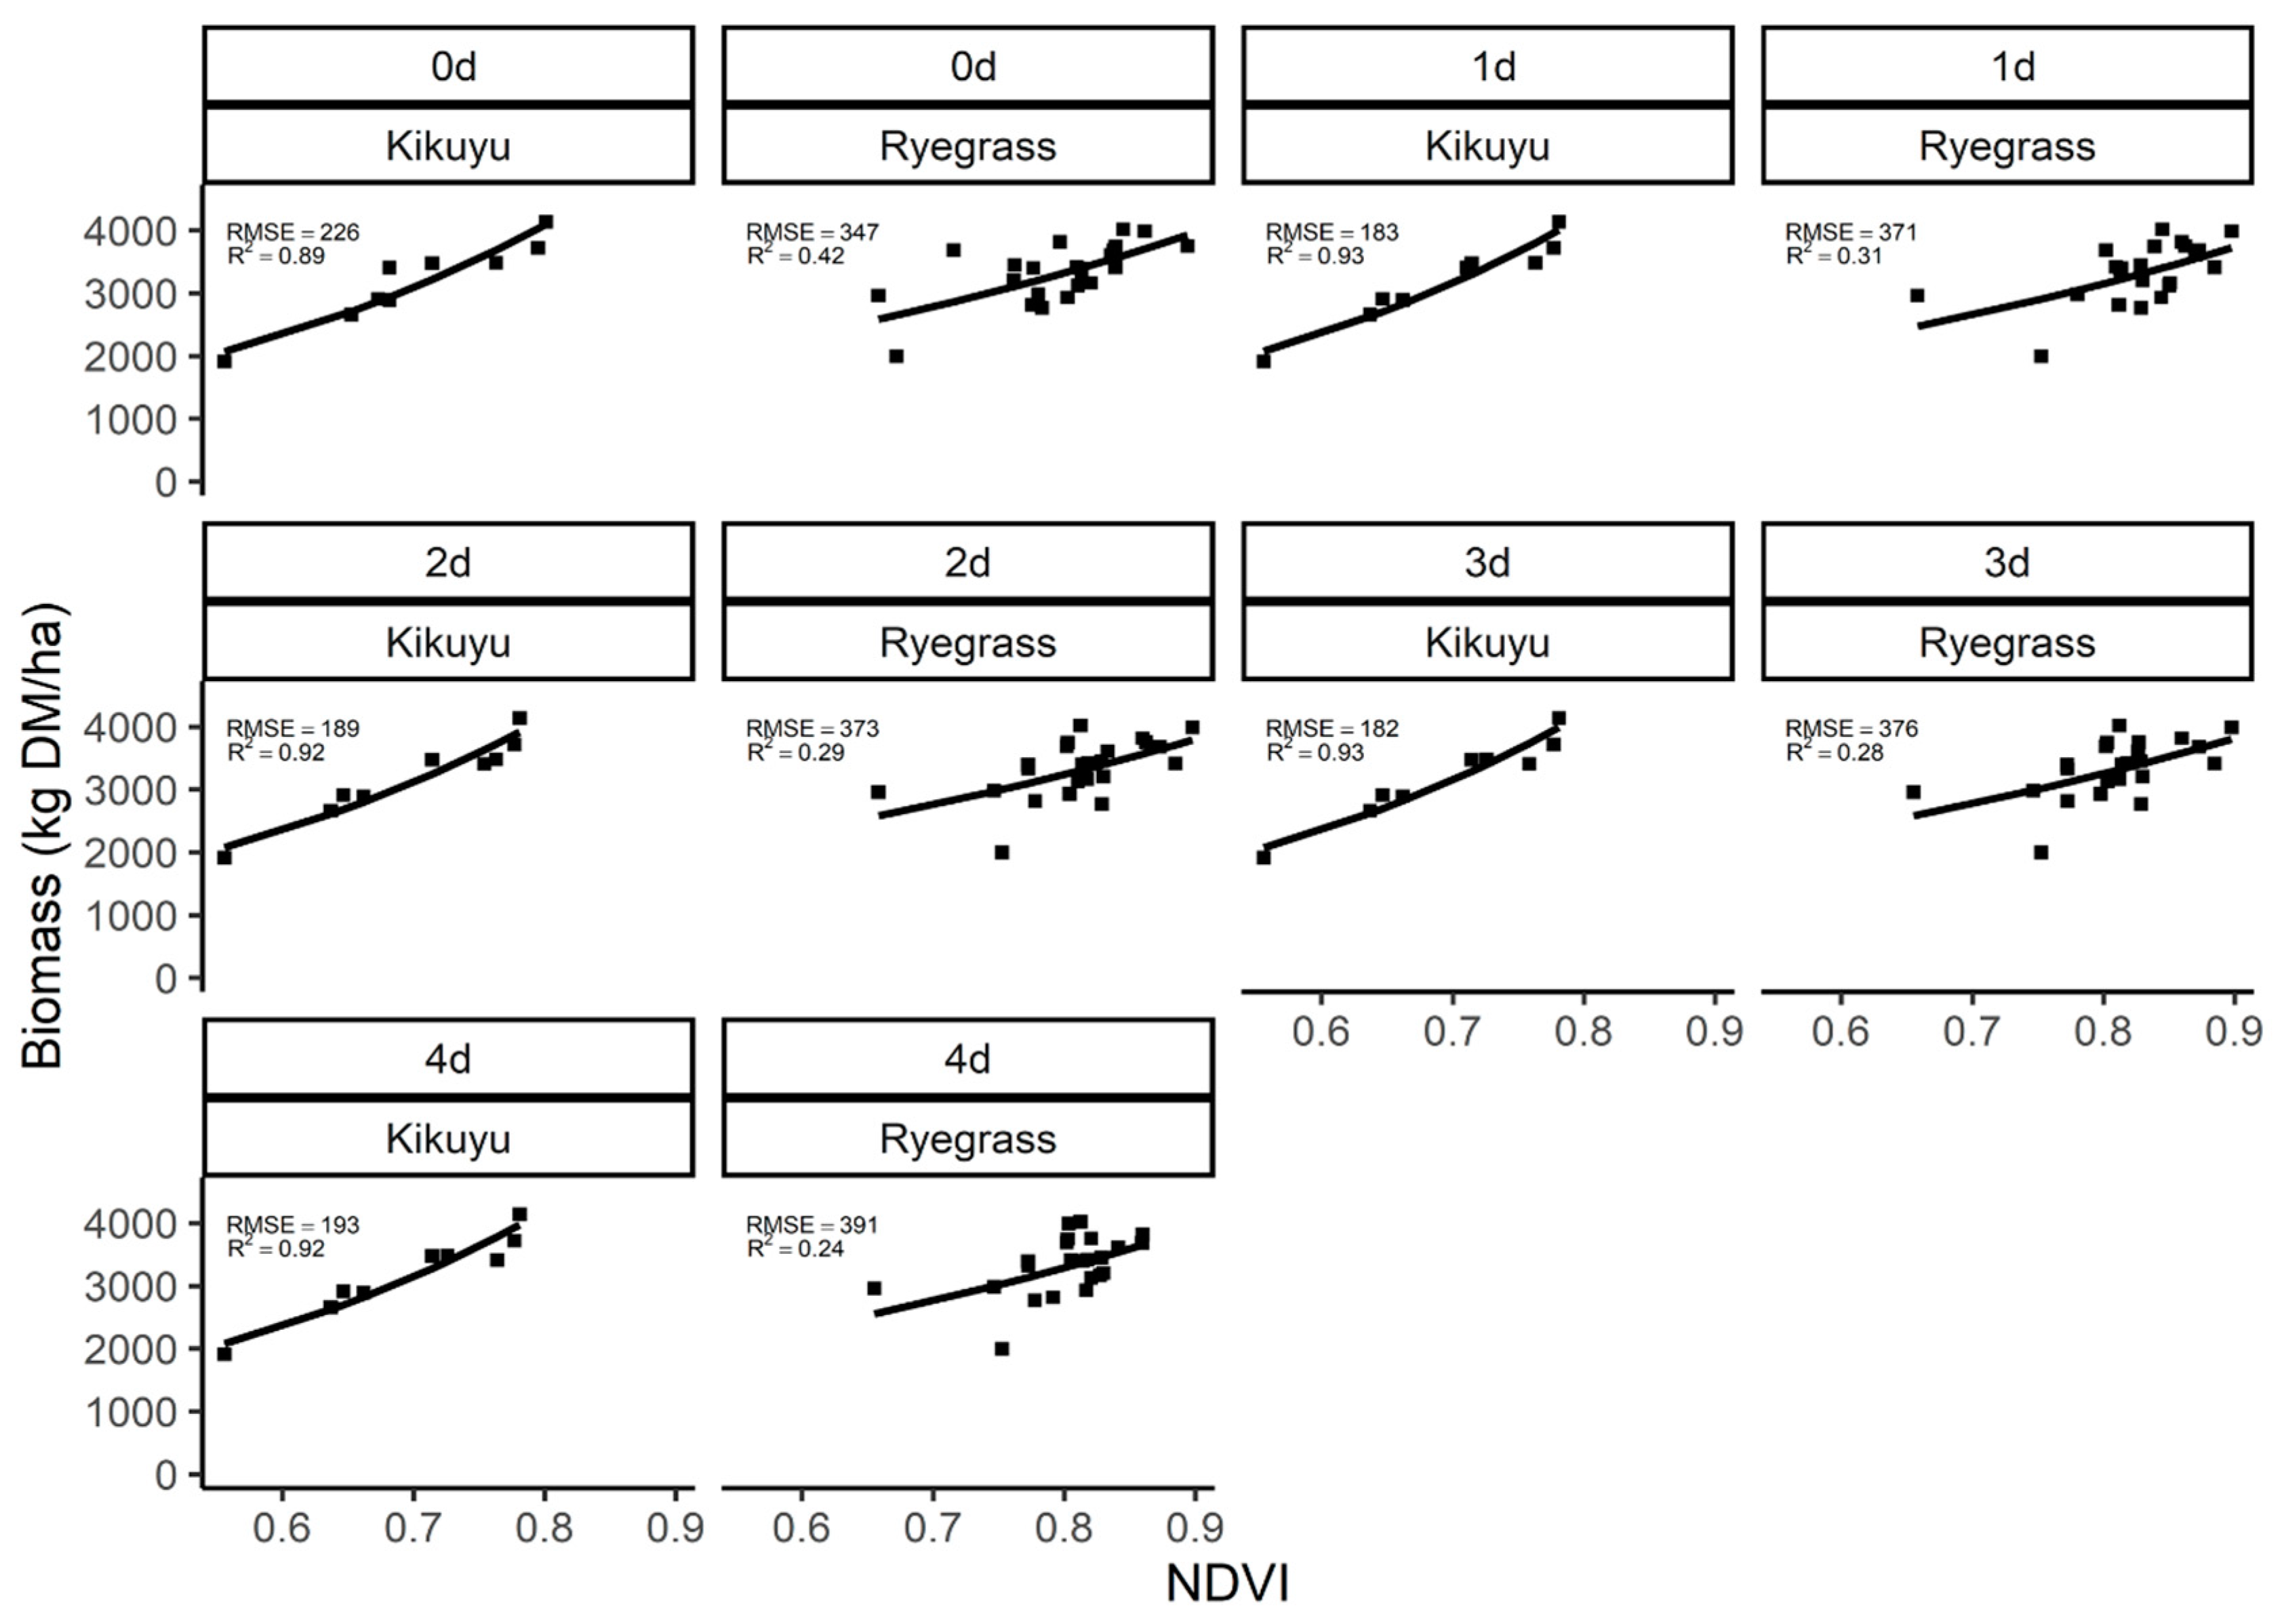
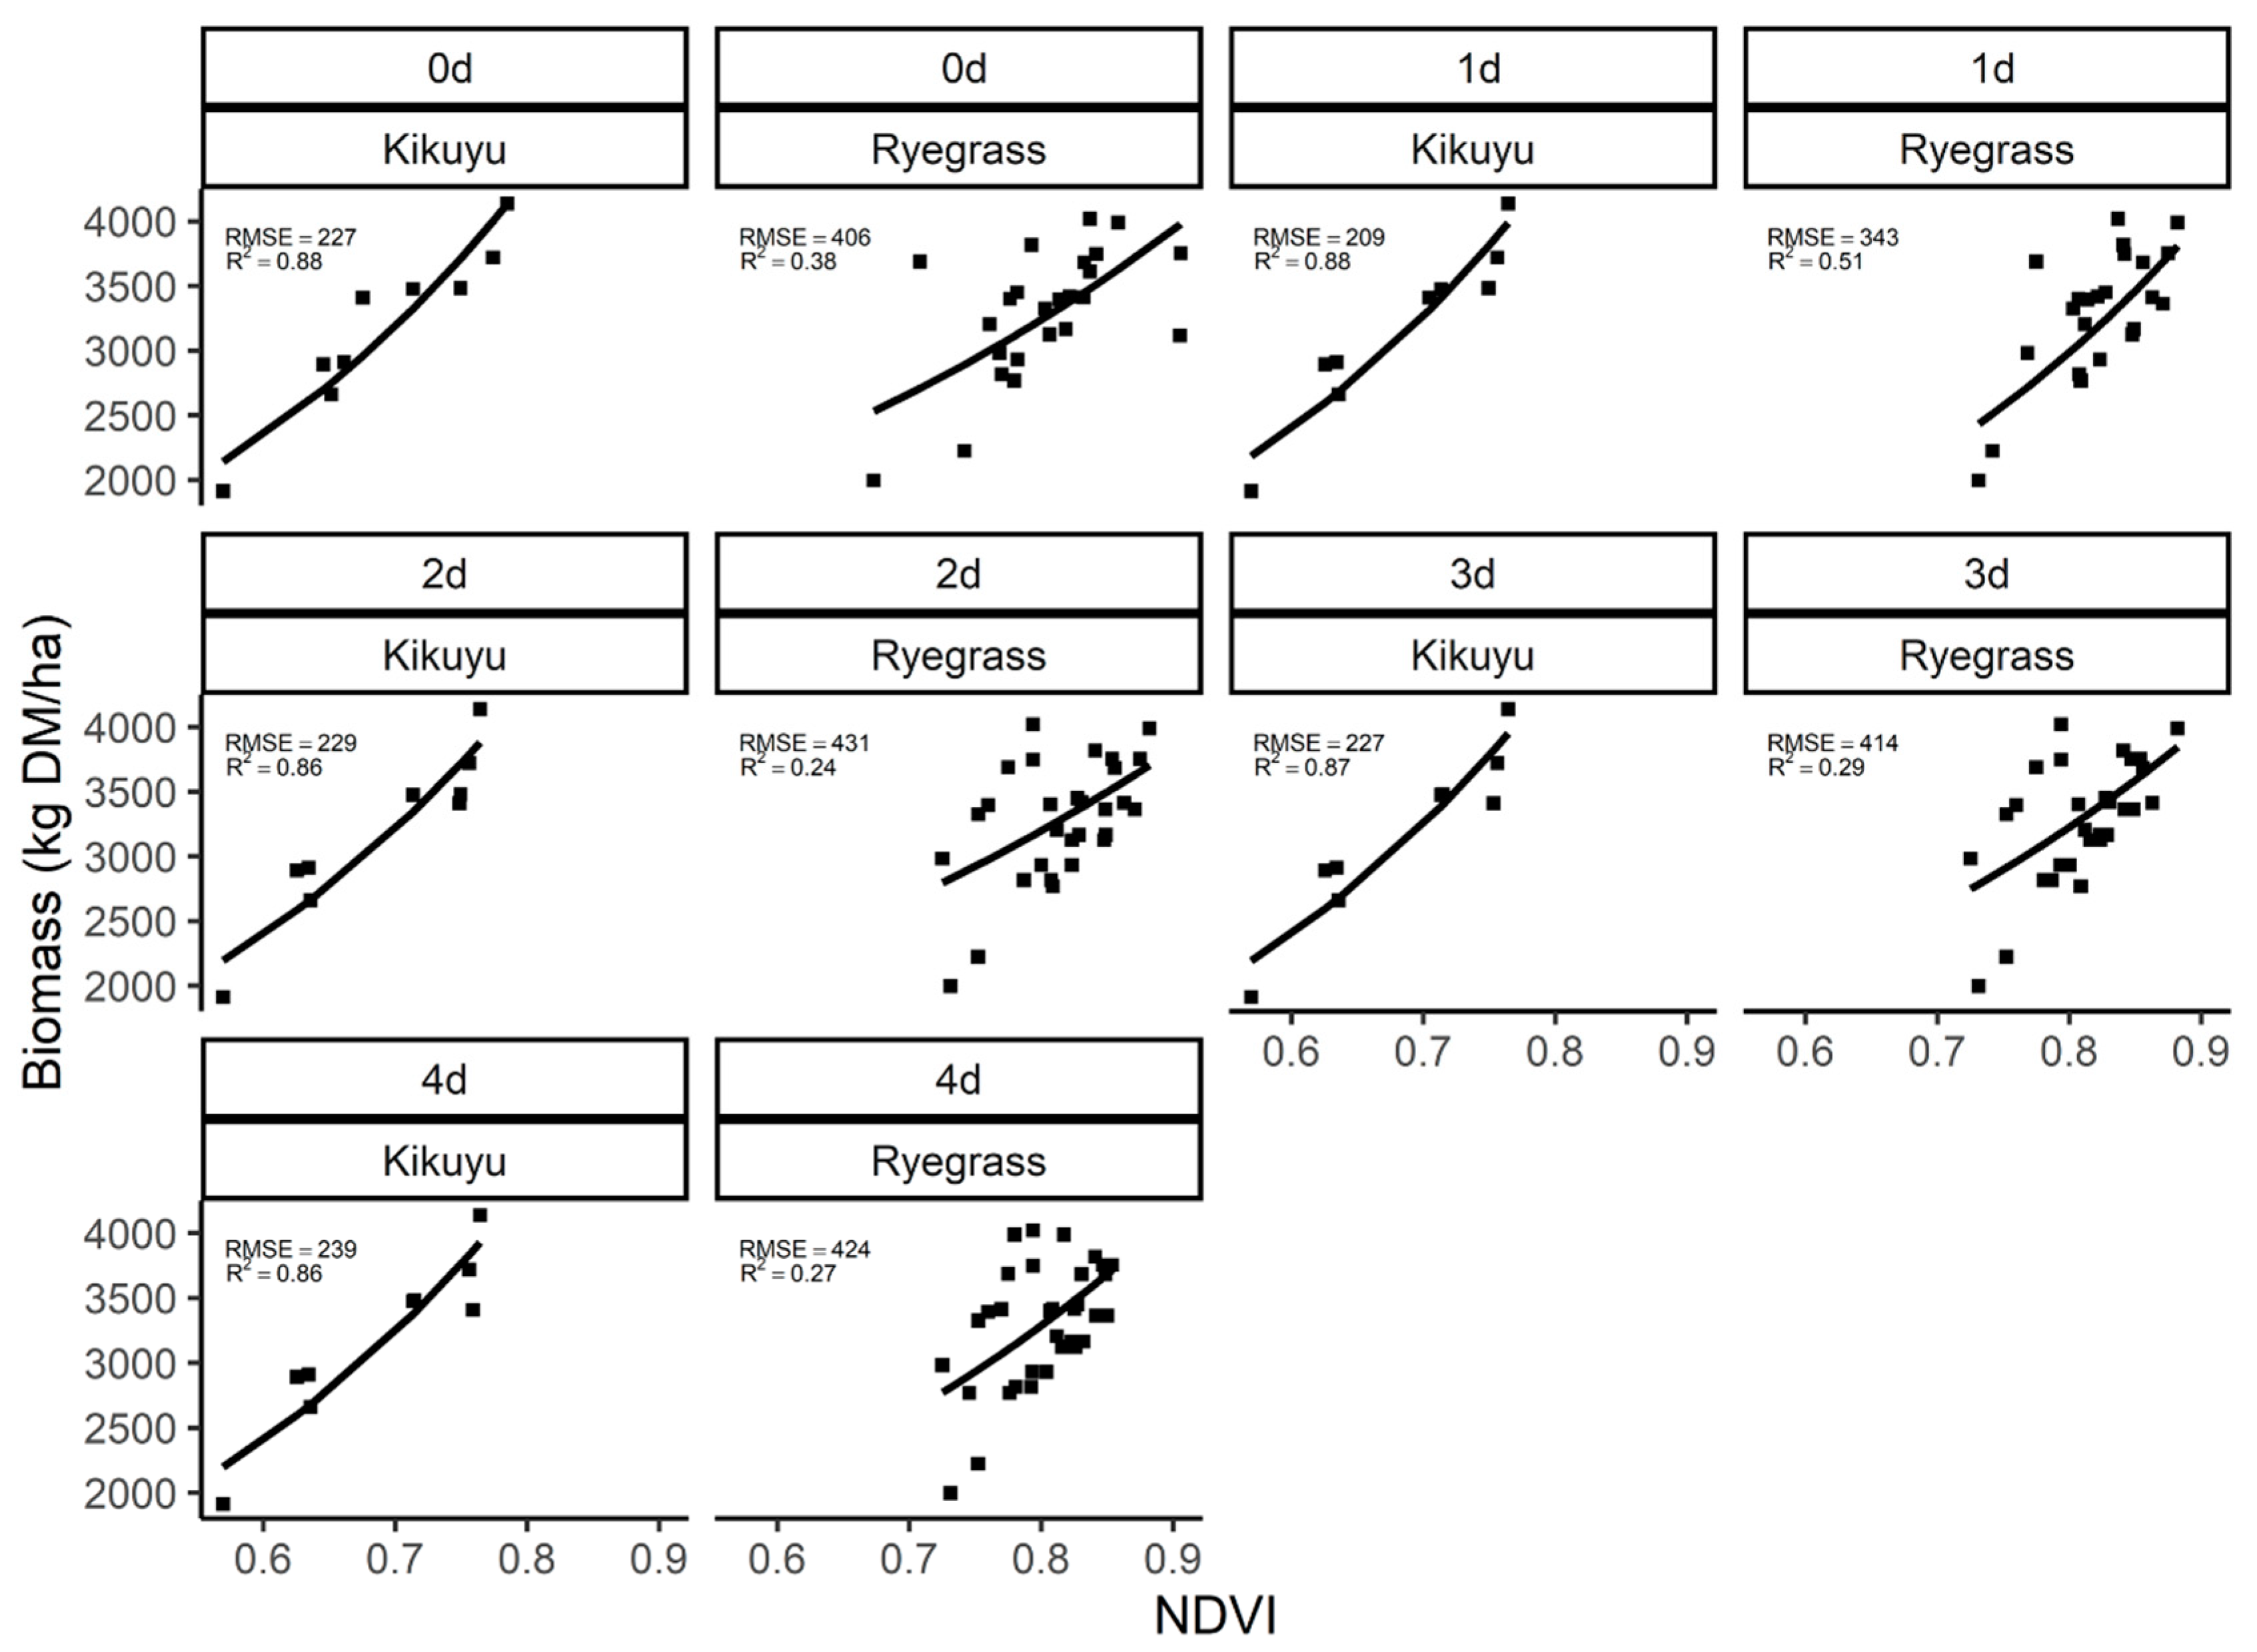
3.3. Experiment 3
4. Discussion
5. Conclusions
Author Contributions
Funding
Data Availability Statement
Acknowledgments
Conflicts of Interest
References
- Beca, D. Key Determinants of Profit for Pasture-based Dairy Farms. Australas. Agribus. Perspect. 2020, 23, 16. [Google Scholar]
- Neal, M.; Roche, J.R. Profitable and resilient pasture-based dairy farm businesses in New Zealand. Anim. Prod. Sci. 2020, 60, 169–174. [Google Scholar] [CrossRef]
- Hanrahan, L.; McHugh, N.; Hennessy, T.; Moran, B.; Kearney, R.; Wallace, M.; Shalloo, L. Factors associated with profitability in pasture-based systems of milk production. J. Dairy Sci. 2018, 101, 5474–5485. [Google Scholar] [CrossRef]
- Gargiulo, J.I.; Lyons, N.A.; Kempton, K.; Armstrong, D.A.; Garcia, S.C. Physical and economic comparison of pasture-based automatic and conventional milking systems. J. Dairy Sci. 2020, 103, 8231–8240. [Google Scholar] [CrossRef] [PubMed]
- Fariña, S.R.; Garcia, S.C.; Fulkerson, W.J.; Barchia, I.M. Pasture-based dairy farm systems increasing milk production through stocking rate or milk yield per cow: Pasture and animal responses. Grass Forage Sci. 2011, 66, 316–332. [Google Scholar] [CrossRef]
- Fariña, S.R.; Garcia, S.C.; Fulkerson, W.J. A complementary forage system whole-farm study: Forage utilisation and milk production. Anim. Prod. Sci. 2011, 51, 460–470. [Google Scholar] [CrossRef]
- García, S.C.; Islam, M.R.; Clark, C.E.F.; Martin, P.M. Kikuyu-based pasture for dairy production: A review. Crop Pasture Sci. 2014, 65, 787–797. [Google Scholar] [CrossRef]
- Dela Rue, B.; Eastwood, C.R.; Edwards, J.P. DairyNZ Milking Practices and Technology Use Survey 2018. DairyNZ. 2018, p. 12. Available online: https://www.dairynz.co.nz/media/5790113/inside_dairy_september_2018_web_v2.pdf (accessed on 13 April 2023).
- Gargiulo, J.I.; Eastwood, C.R.; Garcia, S.C.; Lyons, N.A. Dairy farmers with larger herd sizes adopt more precision dairy technologies. J. Dairy Sci. 2018, 101, 5466–5473. [Google Scholar] [CrossRef]
- Martin, R.C.; Astatkie, T.; Cooper, J.M.; Fredeen, A.H. A Comparison of Methods Used to Determine Biomass on Naturalized Swards. J. Agron. Crop Sci. 2005, 191, 152–160. [Google Scholar] [CrossRef]
- Rennie, G.; King, W.; Puha, M.; Dalley, D.; Dynes, R.; Upsdell, M. Calibration of the C-DAX Rapid Pasturemeter and the rising plate meter for kikuyu-based Northland dairy pastures. N. Z. Grassl. Assoc. 2009, 71, 49–55. [Google Scholar] [CrossRef]
- L’Huillier, P.; Thomson, N. Estimation of herbage mass in ryegrass/white clover dairy pastures. Proc. N. Z. Grassl. Assoc. 1988, 49, 117–122. [Google Scholar] [CrossRef]
- Hall, A.; Turner, L.; Irvine, L.; Kilpatrick, S. Pasture management and extension on Tasmanian dairy farms-who measures up? Rural. Ext. Innov. Syst. J. 2017, 13, 32. [Google Scholar]
- Romera, A.; Beukes, P.; Clark, D.; Clark, C.; Tait, A. Pasture growth model to assist management on dairy farms: Testing the concept with farmers. Grassl. Sci. 2013, 59, 20–29. [Google Scholar] [CrossRef]
- Gargiulo, J.; Clark, C.; Lyons, N.; de Veyrac, G.; Beale, P.; Garcia, S. Spatial and Temporal Pasture Biomass Estimation Integrating Electronic Plate Meter, Planet CubeSats and Sentinel-2 Satellite Data. Remote Sens. 2020, 12, 3222. [Google Scholar] [CrossRef]
- Yule, I.; Lawrence, H.; Murray, R. Pasture yield measurement with the C-Dax pasture meter. In Proceedings of the 10th International Conference on Precision Agriculture (ICPA), Denver, CO, USA, 18–21 July 2010. [Google Scholar]
- Insua, J.R.; Utsumi, S.A.; Basso, B. Estimation of spatial and temporal variability of pasture growth and digestibility in grazing rotations coupling unmanned aerial vehicle (UAV) with crop simulation models. PLoS ONE 2019, 14, e0212773. [Google Scholar] [CrossRef] [PubMed]
- Bazzo, C.O.G.; Kamali, B.; Hütt, C.; Bareth, G.; Gaiser, T. A Review of Estimation Methods for Aboveground Biomass in Grasslands Using UAV. Remote Sens. 2023, 15, 639. [Google Scholar] [CrossRef]
- Hardin, P.J.; Jensen, R.R. Small-Scale Unmanned Aerial Vehicles in Environmental Remote Sensing: Challenges and Opportunities. GIScience Remote Sens. 2011, 48, 99–111. [Google Scholar] [CrossRef]
- Tsouros, D.C.; Bibi, S.; Sarigiannidis, P.G. A Review on UAV-Based Applications for Precision Agriculture. Information 2019, 10, 349. [Google Scholar] [CrossRef]
- Ali, I.; Cawkwell, F.; Dwyer, E.; Barrett, B.; Green, S. Satellite remote sensing of grasslands: From observation to management. J. Plant Ecol. 2016, 9, 649–671. [Google Scholar] [CrossRef]
- Eastwood, C.; Kenny, S. Art or science?: Heuristic versus data driven grazing management on dairy farms. Ext. Farming Syst. J. 2009, 5, 95. [Google Scholar]
- Aquilani, C.; Confessore, A.; Bozzi, R.; Sirtori, F.; Pugliese, C. Review: Precision Livestock Farming technologies in pasture-based livestock systems. Animal 2022, 16, 100429. [Google Scholar] [CrossRef] [PubMed]
- Murphy, D.J.; O’ Brien, B.; Murphy, M.D. Development of a grass measurement optimisation tool to efficiently measure herbage mass on grazed pastures. Comput. Electron. Agric. 2020, 178, 105799. [Google Scholar] [CrossRef]
- Lawson, A.R.; Giri, K.; Thomson, A.L.; Karunaratne, S.B.; Smith, K.F.; Jacobs, J.L.; Morse-McNabb, E.M. Multi-site calibration and validation of a wide-angle ultrasonic sensor and precise GPS to estimate pasture mass at the paddock scale. Comput. Electron. Agric. 2022, 195, 106786. [Google Scholar] [CrossRef]
- Andersson, K.; Trotter, M.; Robson, A.; Schneider, D.; Frizell, L.; Saint, A.; Lamb, D.; Blore, C. Estimating pasture biomass with active optical sensors. Adv. Anim. Biosci. 2017, 8, 754–757. [Google Scholar] [CrossRef]
- McSweeney, D.; Coughlan, N.E.; Cuthbert, R.N.; Halton, P.; Ivanov, S. Micro-sonic sensor technology enables enhanced grass height measurement by a Rising Plate Meter. Inf. Process. Agric. 2019, 6, 279–284. [Google Scholar] [CrossRef]
- Flynn, E.S. Using NDVI as a Pasture Management Tool; University of Kentucky: Lexington, KY, USA, 2006. [Google Scholar]
- Tucker, C.J. Red and photographic infrared linear combinations for monitoring vegetation. Remote Sens. Environ. 1979, 8, 127–150. [Google Scholar] [CrossRef]
- Fitzgerald, G.; Rodriguez, D.; Christensen, L.; Belford, R.; Sadras, V.; Clarke, T. Spectral and thermal sensing for nitrogen and water status in rainfed and irrigated wheat environments. Precis. Agric. 2006, 7, 233–248. [Google Scholar] [CrossRef]
- Planet Team. Planet Application Program Interface: In Space for Life on Earth; Planet Labs: San Francisco, CA, USA, 2017; Available online: https://api.planet.com (accessed on 5 March 2020).
- Roy, D.P.; Huang, H.; Houborg, R.; Martins, V.S. A global analysis of the temporal availability of PlanetScope high spatial resolution multi-spectral imagery. Remote Sens. Environ. 2021, 264, 112586. [Google Scholar] [CrossRef]
- C-Dax. Pasture Meter Operation Manual. Available online: https://irp.cdn-website.com/82ad83c0/files/uploaded/2400-6640-6%20PM%20PLUS-Manual.pdf (accessed on 10 April 2021).
- Stombaugh, T. Satellite-based Positioning Systems for Precision Agriculture. In Precision Agriculture Basics; Wiley: Hoboken, NJ, USA, 2018; pp. 25–35. [Google Scholar]
- Flynn, E.S.; Dougherty, C.T.; Wendroth, O. Assessment of Pasture Biomass with the Normalized Difference Vegetation Index from Active Ground-Based Sensors. Agron. J. 2008, 100, 114–121. [Google Scholar] [CrossRef]
- Litherland, A.; Webby, R.; Fraser, T.; Matthew, C.; McCleod, K.; Walcroft, J.; Bryant, J.; Devantier, B.; Hoogendoorn, C.; Moss, R.; et al. Indirect measurement of pasture mass and pasture growth rate on sheep and beef pastures. N. Z. Grassl. Assoc. 2008, 70, 137–144. [Google Scholar] [CrossRef]
- Di Bella, C.M.; Paruelo, J.M.; Becerra, J.E.; Bacour, C.; Baret, F. Effect of senescent leaves on NDVI-based estimates of fAPAR: Experimental and modelling evidences. Int. J. Remote Sens. 2004, 25, 5415–5427. [Google Scholar] [CrossRef]
- Beukes, P.; McCarthy, S.; Wims, C.; Gregorini, P.; Romera, A. Regular estimates of herbage mass can improve profitability of pasture-based dairy systems. Anim. Prod. Sci. 2018, 59, 359–367. [Google Scholar] [CrossRef]
- Murphy, D.J.; O’ Brien, B.; Hennessy, D.; Hurley, M.; Murphy, M.D. Evaluation of the precision of the rising plate meter for measuring compressed sward height on heterogeneous grassland swards. Precis. Agric. 2021, 22, 922–946. [Google Scholar] [CrossRef]
- Pettorelli, N.; Vik, J.O.; Mysterud, A.; Gaillard, J.-M.; Tucker, C.J.; Stenseth, N.C. Using the satellite-derived NDVI to assess ecological responses to environmental change. Trends Ecol. Evol. 2005, 20, 503–510. [Google Scholar] [CrossRef] [PubMed]
- De Rosa, D.; Basso, B.; Fasiolo, M.; Friedl, J.; Fulkerson, B.; Grace, P.R.; Rowlings, D.W. Predicting pasture biomass using a statistical model and machine learning algorithm implemented with remotely sensed imagery. Comput. Electron. Agric. 2021, 180, 105880. [Google Scholar] [CrossRef]
- Sibanda, M.; Mutanga, O.; Rouget, M. Examining the potential of Sentinel-2 MSI spectral resolution in quantifying above ground biomass across different fertilizer treatments. ISPRS J. Photogramm. Remote Sens. 2015, 110, 55–65. [Google Scholar] [CrossRef]
- Clevers, J.G.P.W.; Gitelson, A.A. Remote estimation of crop and grass chlorophyll and nitrogen content using red-edge bands on Sentinel-2 and -3. Int. J. Appl. Earth Obs. Geoinf. 2013, 23, 344–351. [Google Scholar] [CrossRef]
- Chabalala, Y.; Adam, E.; Oumar, Z.; Ramoelo, A. Exploiting the capabilities of Sentinel-2 and RapidEye for predicting grass nitrogen across different grass communities in a protected area. Appl. Geomat. 2020, 12, 379–395. [Google Scholar] [CrossRef]
- Schaefer, M.T.; Lamb, D.W. A Combination of Plant NDVI and LiDAR Measurements Improve the Estimation of Pasture Biomass in Tall Fescue (Festuca arundinacea var. Fletcher). Remote Sens. 2016, 8, 109. [Google Scholar] [CrossRef]
- Vorobiova, N.; Chernov, A. Curve fitting of MODIS NDVI time series in the task of early crops identification by satellite images. Procedia Eng. 2017, 201, 184–195. [Google Scholar] [CrossRef]
- Berger, A.; Ettlin, G.; Quincke, C.; Rodríguez-Bocca, P. Predicting the Normalized Difference Vegetation Index (NDVI) by training a crop growth model with historical data. Comput. Electron. Agric. 2019, 161, 305–311. [Google Scholar] [CrossRef]
- Asher, M.; Raedts, P.; Harrison, M.; Hills, J.; Rawnsley, R. Estimating pasture biomass with Planet Labs CubeSats. In Proceedings of the 2018 Australasian Dairy Science Symposium, Palmerston North, New Zealand, 21–23 November 2018; pp. 196–198. [Google Scholar]
- Chen, Y.; Guerschman, J.; Shendryk, Y.; Henry, D.; Harrison, M.T. Estimating Pasture Biomass Using Sentinel-2 Imagery and Machine Learning. Remote Sens. 2021, 13, 603. [Google Scholar] [CrossRef]
- Fulkerson, W.; Slack, K. Estimating mass of temperate and tropical pastures in the subtropics. Aust. J. Exp. Agric. 1993, 33, 865–869. [Google Scholar] [CrossRef]
- Mata, G.; Clark, D.; Edirisinghe, A.; Waugh, D.; Minneé, E.; Gherardi, S. Predicting accurate paddock-average pasture cover in Waikato dairy farms using satellite images. N. Z. Grassl. Assoc. 2007, 69, 23–28. [Google Scholar] [CrossRef]
- Obermeyer, K.; Komainda, M.; Kayser, M.; Isselstein, J. Exploring the potential of rising plate meter techniques to analyse ecosystem services from multi-species grasslands. Crop Pasture Sci. 2022, 74, 378–391. [Google Scholar]
- Murphy, D.J.; Murphy, M.D.; O’Brien, B.; O’Donovan, M. A Review of Precision Technologies for Optimising Pasture Measurement on Irish Grassland. Agriculture 2021, 11, 600. [Google Scholar] [CrossRef]
- Nguyen, P.T.; Shi, F.; Wang, J.; Badenhorst, P.E.; Spangenberg, G.C.; Smith, K.F.; Daetwyler, H.D. Within and combined season prediction models for perennial ryegrass biomass yield using ground- and air-based sensor data. Front. Plant Sci. 2022, 13, 950720. [Google Scholar] [CrossRef]
- Gargiulo, J.I. Investigations Into the Applications and Impacts of Automation in Pasture-based Dairy Systems. Ph.D. Thesis, The University of Sydney, Sydney, NSW, Australia, 2021. Available online: https://hdl.handle.net/2123/27216 (accessed on 2 February 2023).


| Experiment 1 (E1) | Experiment 2 (E2) | Experiment 3 (E3) | |
|---|---|---|---|
| Key objectives of the experiment | Calibration methodology | Calibration methodology | Calibration methodology |
| Paddock variability evalu-ation | |||
| Platforms and Sensors used 1 | RPM, Automatic PR, UAV 2 | Automatic PR, UAV | C-Dax PR, SAT |
| Reflectance indices evaluated | NDVI, NDRE | NDVI | NDVI |
| Specific questions addressed | Which of the above tools provides more accurate estimates of above-ground pasture biomass at a particular point (i.e., quadrat sites where the pasture was cut and weighted)? | Which of the above tools provides more accurate estimates of above-ground pasture biomass over a given area (i.e., transect)? Can this method be used to estimate inter (and intra) paddock variability? | What are the differences in accuracy between calibration scale (transect or paddock) and pasture species for satellite-based measurements? What are the differences between using images acquired on the same date as the ground measurements versus an average of images available up to +/− 4 days? |
| Duration of the experiment | Short-term (3 weeks) | Medium-term (8 weeks) | Long-term (1 year) |
| Location | Camden (NSW) | Taree (NSW) | Tocal (NSW) |
| Pasture type | Annual ryegrass | Annual ryegrass | Annual ryegrass-Kikuyu |
| Calibration type 3 | Direct | Direct–Indirect | Indirect |
| Calibration Scale 4 | Quadrat | Transect | Transect–Paddock |
| Experiment | Species | Calibration Type 1 | Calibration Scale 2 | Labour Requirement | R2 | |||
|---|---|---|---|---|---|---|---|---|
| RPM | PR | UAV | SAT | |||||
| 1 | Ryegrass | Direct | Quadrat | High | 0.86 | 0.64 | 0.54 | |
| 2 | Ryegrass | Direct | Transect | High | 0.62 | 0.47 † | ||
| Ryegrass | Indirect | Transect | Medium | 0.62 | ||||
| 3 | Ryegrass/Kikuyu | Indirect | Transect | Medium | 0.65 * | |||
| Ryegrass/Kikuyu | Paddock | Low | 0.63 * | |||||
Disclaimer/Publisher’s Note: The statements, opinions and data contained in all publications are solely those of the individual author(s) and contributor(s) and not of MDPI and/or the editor(s). MDPI and/or the editor(s) disclaim responsibility for any injury to people or property resulting from any ideas, methods, instructions or products referred to in the content. |
© 2023 by the authors. Licensee MDPI, Basel, Switzerland. This article is an open access article distributed under the terms and conditions of the Creative Commons Attribution (CC BY) license (https://creativecommons.org/licenses/by/4.0/).
Share and Cite
Gargiulo, J.I.; Lyons, N.A.; Masia, F.; Beale, P.; Insua, J.R.; Correa-Luna, M.; Garcia, S.C. Comparison of Ground-Based, Unmanned Aerial Vehicles and Satellite Remote Sensing Technologies for Monitoring Pasture Biomass on Dairy Farms. Remote Sens. 2023, 15, 2752. https://doi.org/10.3390/rs15112752
Gargiulo JI, Lyons NA, Masia F, Beale P, Insua JR, Correa-Luna M, Garcia SC. Comparison of Ground-Based, Unmanned Aerial Vehicles and Satellite Remote Sensing Technologies for Monitoring Pasture Biomass on Dairy Farms. Remote Sensing. 2023; 15(11):2752. https://doi.org/10.3390/rs15112752
Chicago/Turabian StyleGargiulo, Juan I., Nicolas A. Lyons, Fernando Masia, Peter Beale, Juan R. Insua, Martin Correa-Luna, and Sergio C. Garcia. 2023. "Comparison of Ground-Based, Unmanned Aerial Vehicles and Satellite Remote Sensing Technologies for Monitoring Pasture Biomass on Dairy Farms" Remote Sensing 15, no. 11: 2752. https://doi.org/10.3390/rs15112752