Technical Note

The Formation of an Ice-Contact Proglacial Lake and Its Impact on Glacier Change: A Case Study of the Tanymas Lake and Fedchenko Glacier

1
Shaanxi Key Laboratory of Earth Surface System and Environmental Carrying Capacity, College of Urban and Environmental Sciences, Northwest University, Xi’an 710127, China
2
Institute of Earth Surface System and Hazards, College of Urban and Environmental Sciences, Northwest University, Xi’an 710127, China
3
Institute of Tibetan Plateau Research, Chinese Academy of Sciences, Beijing 100101, China
*
Author to whom correspondence should be addressed.
Remote Sens. 2023, 15(11), 2745; https://doi.org/10.3390/rs15112745
Submission received: 27 February 2023 / Revised: 17 May 2023 / Accepted: 22 May 2023 / Published: 25 May 2023
(This article belongs to the Special Issue Remote Sensing for Surface Water Monitoring)

Abstract

:
Lake-terminating glaciers have some peculiar behaviors compared to land-terminating glaciers, but in-depth observation is still limited regarding their formation, which is crucial for understanding the glacier–lake interaction. Here, the long-term evolutions of Tanymas Lake and the Fedchenko Glacier were investigated based on Landsat images, Google Earth imagery, KH-9 images, glacier surface elevation and velocity change datasets, and meteorological records. The results indicate that Tanymas Lake is both an ice-contact proglacial lake and an ice-dammed lake. It covered an area of 1.10 km2 in September 2022, and it is one of the largest glacial lakes in Pamir and even in HMA. The initial basin of Tanymas Lake is a moraine depression in Tanymas Pass, and the blocked dam is the Tanymas-5 Glacier and its terminal moraine. Tanymas Lake was in an embryonic stage before August 2005, in a formation and expansion stage from August 2005 to September 2018, and in a new expansion stage after September 2018. In this process, the Tanymas terminus of the Fedchenko Glacier also transformed from a land terminus to a partial lake terminus, and then to a complete lake terminus. The formation of Tanymas Lake is associated with the accumulation of glacial meltwater and the blockage of drainage, while the slow expansion of Tanymas Lake is related to the cold climate and slight glacier mass loss of Central Pamir. In the coming decades, with the accelerated mass loss of the Tanymas terminus of the Fedchenko Glacier, the area, depth, and water storage of Tanymas Lake will continue to increase, accompanied by the growing GLOF risk.

Graphical Abstract

1. Introduction

As a special glacier type, lake-terminating glaciers usually show some peculiar behaviors compared to land-terminating glaciers, including the more rapid retreat and thinning combined with the acceleration of ice flow [1,2,3]. These phenomena are mainly related to the interactions of lake-terminating glaciers and ice-contact proglacial lakes and lead to more glacier mass loss [4,5,6]. In High Mountain Asia (HMA), most lake-terminating glaciers have exacerbated the overall mass loss of the mountain glaciers to varying degrees [1,7,8,9,10]. In the interactions of lake-terminating glaciers and ice-contact proglacial lakes, the glacier dominates the glaciation process and the glacial lake evolution [4]. The basin of an ice-contact proglacial lake is generated by glaciation, the water volume is mainly recharged by the glacier meltwater, and the sedimentary material in the lake is transported by the glacier movement [11]. Meanwhile, there are profound impacts of the ice-contact proglacial lake on glacier dynamics due to the massive differences in thermal properties between ice and water [3]. The rapid retreat and mass loss of most lake-terminating glaciers are accompanied by the expansion of ice-contact proglacial lakes, which reflects the fact that glacier ice calving occurs by submerged ice melt [12,13]. Across the greater Himalayas between 2000 and 2020, the expansion of proglacial lakes has resulted in an underestimated 6.5 ± 2.1% in glacier mass loss [1].
The expansion of proglacial lakes is often accompanied by the accentuation of the hazard risk of glacial lake outburst flood (GLOF), especially for ice-dammed proglacial lakes [14]. Moraine or ice dams of the glacial lakes are susceptible to failure via overtopping and piping trigger mechanisms [15]. When the meltwater of the glacier suddenly increases, or there is an ice–snow avalanche and even glacier surging, the blocked dam may collapse and trigger a GLOF [16]. For some proglacial lakes, such as the Merzbacher Lake in the Tianshan Mountains and the Kyagar Lake in the Chinese Karakoram, the GLOFs are even characterized by regularity, because they are the results of the continuous collapse and reconstruction of the positive feedback processes between the glacier and glacial lake [17,18].
The interactions of the ice-contact proglacial lake and the lake-terminating glacier have been well understood and numerically modeled in HMA. However, most of this knowledge is based on the fact that both the ice-contact proglacial lake and lake terminus are developed in a relatively warm climate, especially in the Himalayas [1,10,11,12,13], and the analysis of their formation and evolution in different climates settings remains limited. The Fedchenko Glacier in Central Pamir is one of the most famous and largest mountain glaciers in the world [19]. An emerging ice-contact proglacial lake and ice-dammed lake, Tanymas Lake has undergone important changes in the Tanymas Pass of the upper Fedchenko Glacier since 2000 [19], thus providing a valuable opportunity to observe the formation process, mechanisms, and impacts of a proglacial lake in a cold climate in depth. Therefore, taking the combination of the Tanymas Lake and the Fedchenko Glacier as a study case, the objectives of this study were as follows: (1) to investigate the formation and evolution process of a glacial lake in a cold climate; (2) to evaluate the interactions of the Fedchenko Glacier and Tanymas Lake; and (3) to explore the future change and GLOF risk of Tanymas Lake.

2. Study Area

The Fedchenko Glacier is located at the middle reaches of the Akademiya Nauk Range in Central Pamir, covering an area of 712 km2, with a length of 75.3 km and a total volume of 123.4 km3 [20,21]. As the upper ice mass overflows at the Tanymas Pass, the Fedchenko Glacier has two glacier termini: the downstream Fedchenko terminus and the upstream Tanymas terminus [19]. The Tanymas Lake formed at the frontal of the Tanymas terminus, its initial basin is a moraine depression, and the blocked dam is the Tanymas-5 Glacier and its terminal moraine (Figure 1), so it is both an ice-contact proglacial lake and an ice-dammed lake.
Tanymas Lake covered an area of 1.10 km2 in September 2022 with the water level at 4907 m a.s.l., with a maximum SE-NW length of 1.26 km and a maximum SW-NE width of 1.15 km. According to the recent multi-temporal glacial lake inventories [22,23], it is one of the largest glacial lakes in Pamir, and even larger than ~99% of the glacial lakes in HMA. Tanymas Lake is recharged by the meltwater from the Fedchenko Glacier, the G072369E38769N Glacier, the partial Tanymas-5 Glacier, and some small hanging glaciers. Among them, the Fedchenko Glacier plays a dominant role in the variation of Tanymas Lake. The outlet of Tanymas Lake is located on the eastern shore, so the overflowing lake water mixes with the meltwater of the Tanymas-5 Glacier and flows eastward to become the source of the Tanymas River. In addition, the Tanymas terminus of the Fedchenko Glacier, with abundant crevasses, stretches into the lake in the southeastern corner, resulting in lots of ice floes of various sizes floating on the Tanymas Lake which derived from the ice calving, and the largest ice floes are even bigger than 0.03 km2.

3. Data and Methods

3.1. Data

3.1.1. Landsat Images

In this study, we used Landsat images for the delineation of lake and glacier outlines and the extraction of glacier surface velocity [22]. The Landsat L1T images were corrected and orthorectified by the United States Geological Survey (USGS) and showed a horizontal bias of less than one pixel [23]. There is seasonal variation in the area of the glacial lake, and the long-term observation records of Gorbunov meteorological station indicate the annual maximum air temperature of the study area was in August [24]. Therefore, we selected the Landsat images acquired in August or September with minimum snow and cloud cover to obtain the largest area of Tanymas Lake in a year. As shown in Table 1, we used 21 Landsat images which were available from the USGS Earth Explorer (https://earthexplorer.usgs.gov/, accessed on 10 November 2022). The spatial resolution of the TM sensor is 30 m, and the ETM+/OLI sensor is 15 m after image sharpening by Gram-Schmidt Pan Sharpening Tool in ENVI software.

3.1.2. Google Earth Imagery and KH-9 Image

Benefiting from the high spatial resolution (meters or better) and free access, Google Earth imagery is widely used in surface features interpretation, including glaciology [25]. We can better observe the details of a glacier and lake, such as ice cliffs, crevasses, floes, and outlets on the time series images in Google Earth, which facilitates the lake outline delineation. Based on the declassified Keyhole (KH) series images, we can observe the state of the Fedchenko Glacier and Tanymas Lake in the 1960s–1980s, which is irreplaceable by other satellites [26]. In this study, a KH-9 image generated on 20 August 1980, was used to analyze the formation process of the Tanymas Lake, which was downloaded from the USGS Earth Explorer under the number DZB1216-500273L008001.

3.1.3. SRTM DEM

In this study, we used the SRTM (Shuttle Radar Topography Mission) DEM generated in 2000 to calculate the glacier elevation, aspect, slope, etc., and generated contour lines and slope distribution maps. The SRTM DEM has a spatial resolution of 30 m and can be available from the USGS Earth Explorer too [27].

3.1.4. Glacier Surface Elevation and Velocity Change Datasets

In this study, the glacier surface elevation changes were obtained from the Datasets of Elevation Changes in High Mountain Asia from 2000 to 2016 shared by Brun et al. [28]. They applied a fully automated program to compute the glacier surface elevation change and their uncertainty based on ASTER-derived DEM and geodetic methods [29]. The datasets have a spatial resolution of 30 m and can be freely obtained from the PANGAEA (https://doi.pangaea.de/10.1594/PANGAEA.876545, accessed on 20 November 2022).
The Inter-Mission Time Series of Land Ice Velocity and Elevation (ITS_LIVE, https://its-live.jpl.nasa.gov/, accessed on 25 November 2022) project provides global glacier surface velocity at an annual temporal resolution [30]. The datasets are derived from Landsat TM/ETM+/OLI images using the autoRIFT (autonomous repeat image feature tracking) processing chain described in Gardner et al. [31] and Lei et al. [32]. As the Landsat sensors upgraded, the uncertainties of the ITS_LIVE datasets were reduced from 10 m·a−1 in 1985–1999 (TM) to 2 m·a−1 in 1999–2013 (ETM+), and then to 0.5 m·a−1 after 2013 (OLI) [29]. The spatial resolution for the single-year data in the dataset is 120 m, and 240 m for the synthetic data from 1985 to 2018. Here, the datasets were employed to analyze a long-term distribution and variation of glacier surface velocity.

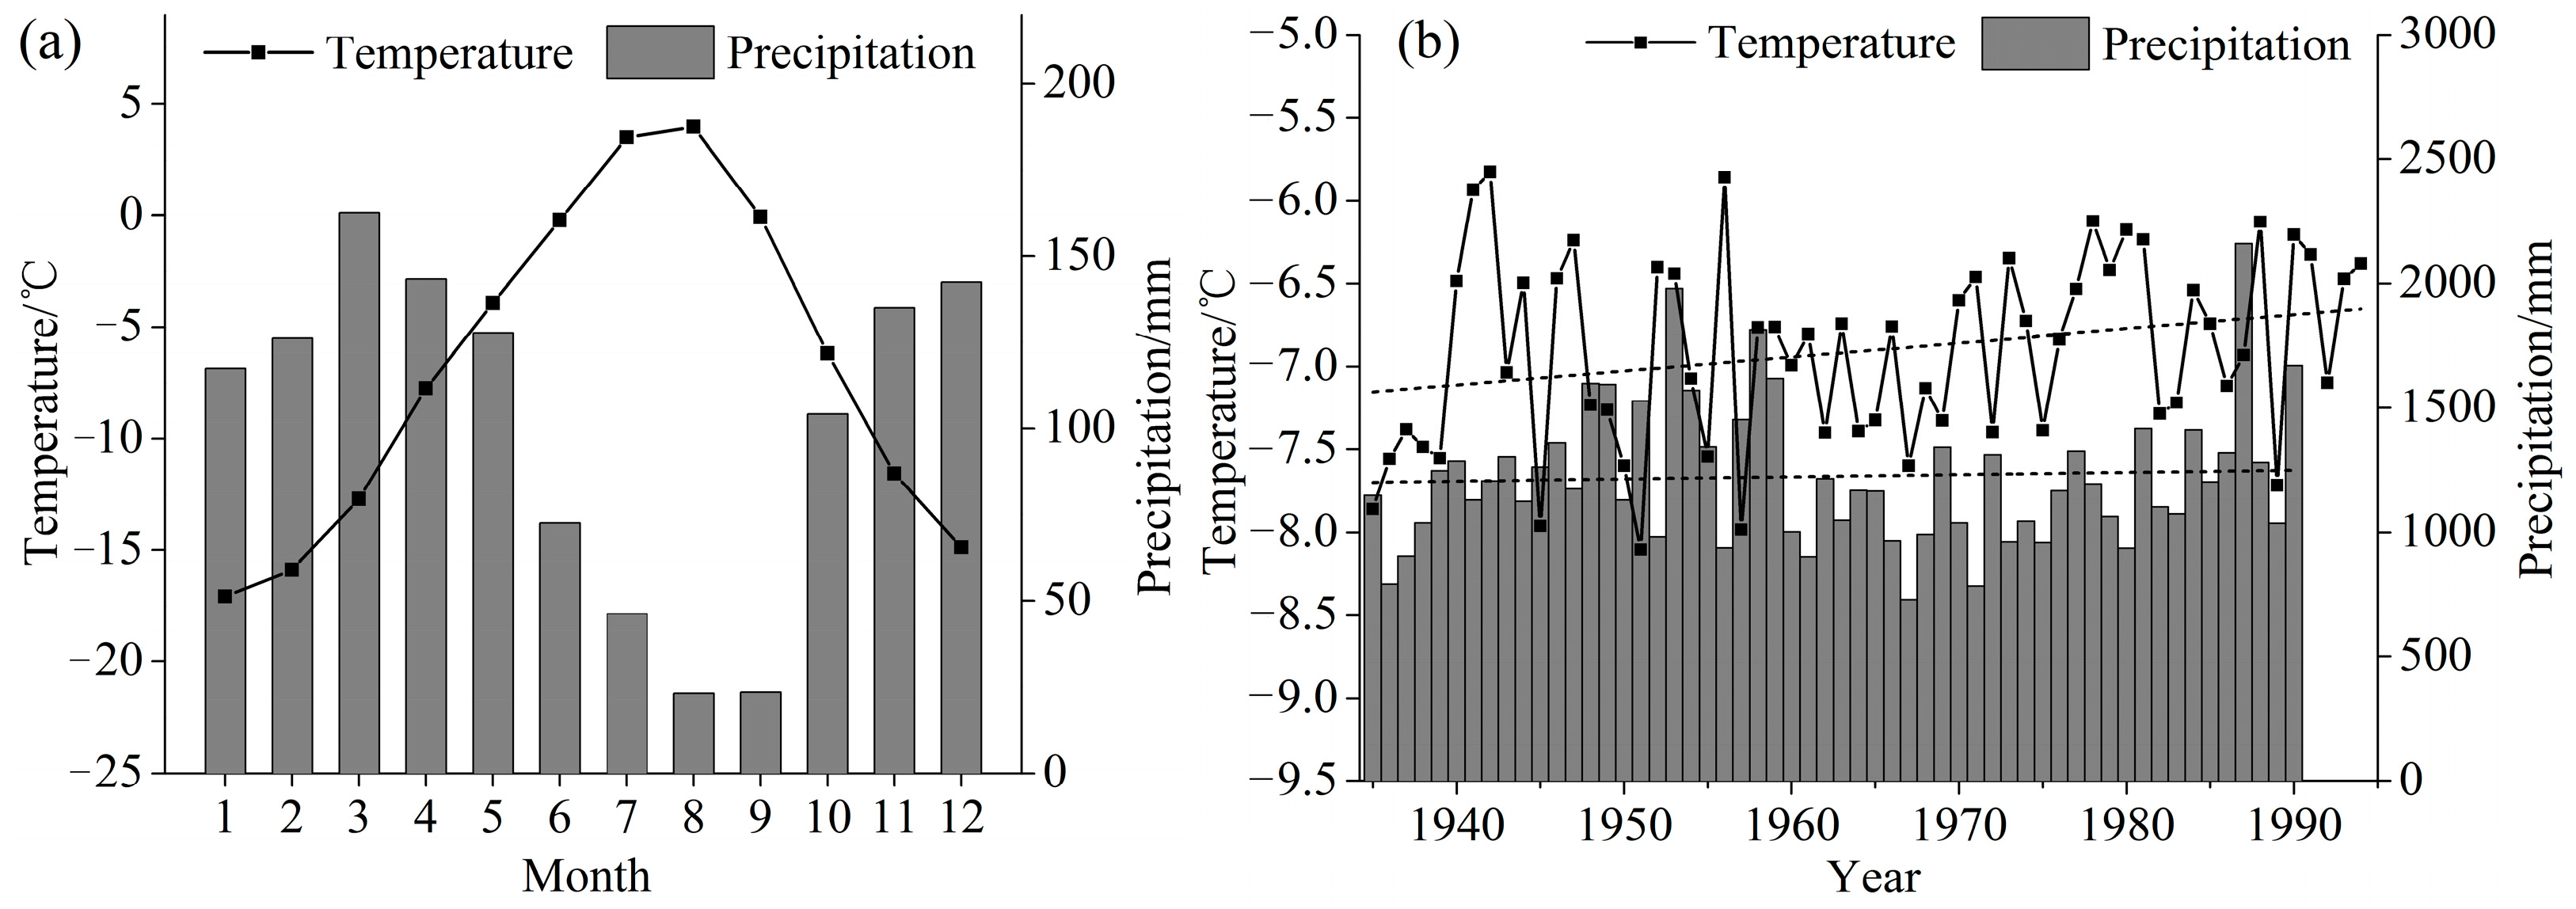
3.1.5. Meteorological Data

The Fedchenko Glacier has a long history of glaciological and meteorological observation. In 1935, the Gorbunov station at the middle reaches of the glacier at 4170 m a.s.l. was established as a base for continuous meteorological observations and glaciological investigations [33]. Unfortunately, the station was closed after 1994, but its observation records of nearly 50 years still reveal the basic climate characteristics of the study area. The meteorological data of Gorbunov station come from the Central Asia Temperature and Precipitation Data of the National Snow and Ice Data Center (NSIDC, https://nsidc.org/data/G02174, accessed on 25 November 2022).

3.2. Methods

3.2.1. Tanymas Lake Outlines Delineation

Since the surface of Tanymas Lake is mixed with ice floes, glacier debris, and exposed rock, resulting in poor automatic identification, we employed manual delineation for its outlines [22,23]. In the false-color composite images (bands 6, 2, and 3 as RGB for Landsat), there are visible color and texture differences between the glacier, lake, and bare rock [34]. Therefore, outlining the Tanymas Lake with pixel-level accuracy can be carried out directly [22]. The exposed rock on the eastern Tanymas Lake will be considered a part of the lake when submerged by water in August or September and otherwise will be excluded. To display the glacier–lake interaction, the outlines of surrounding glaciers were also manually delineated [20].
Lake mapping uncertainty originates from the transitional color changes in the false-color composite images and is dependent on the spatial resolution of the imagery [21]. Hence, in this study, the uncertainty of lake outline delineation (EA) was estimated by creating a buffer of a half-pixel for the Landsat images [2,21,22]:
EA = L · λ/2
where L is the length of Tanymas Lake outlines and λ is the spatial resolution of Landsat images. The calculation results indicate that in this study, the uncertainties in the Tanymas Lake area based on Landsat TM and ETM+/OLI images are ~7.0% and ~4.0%, respectively.

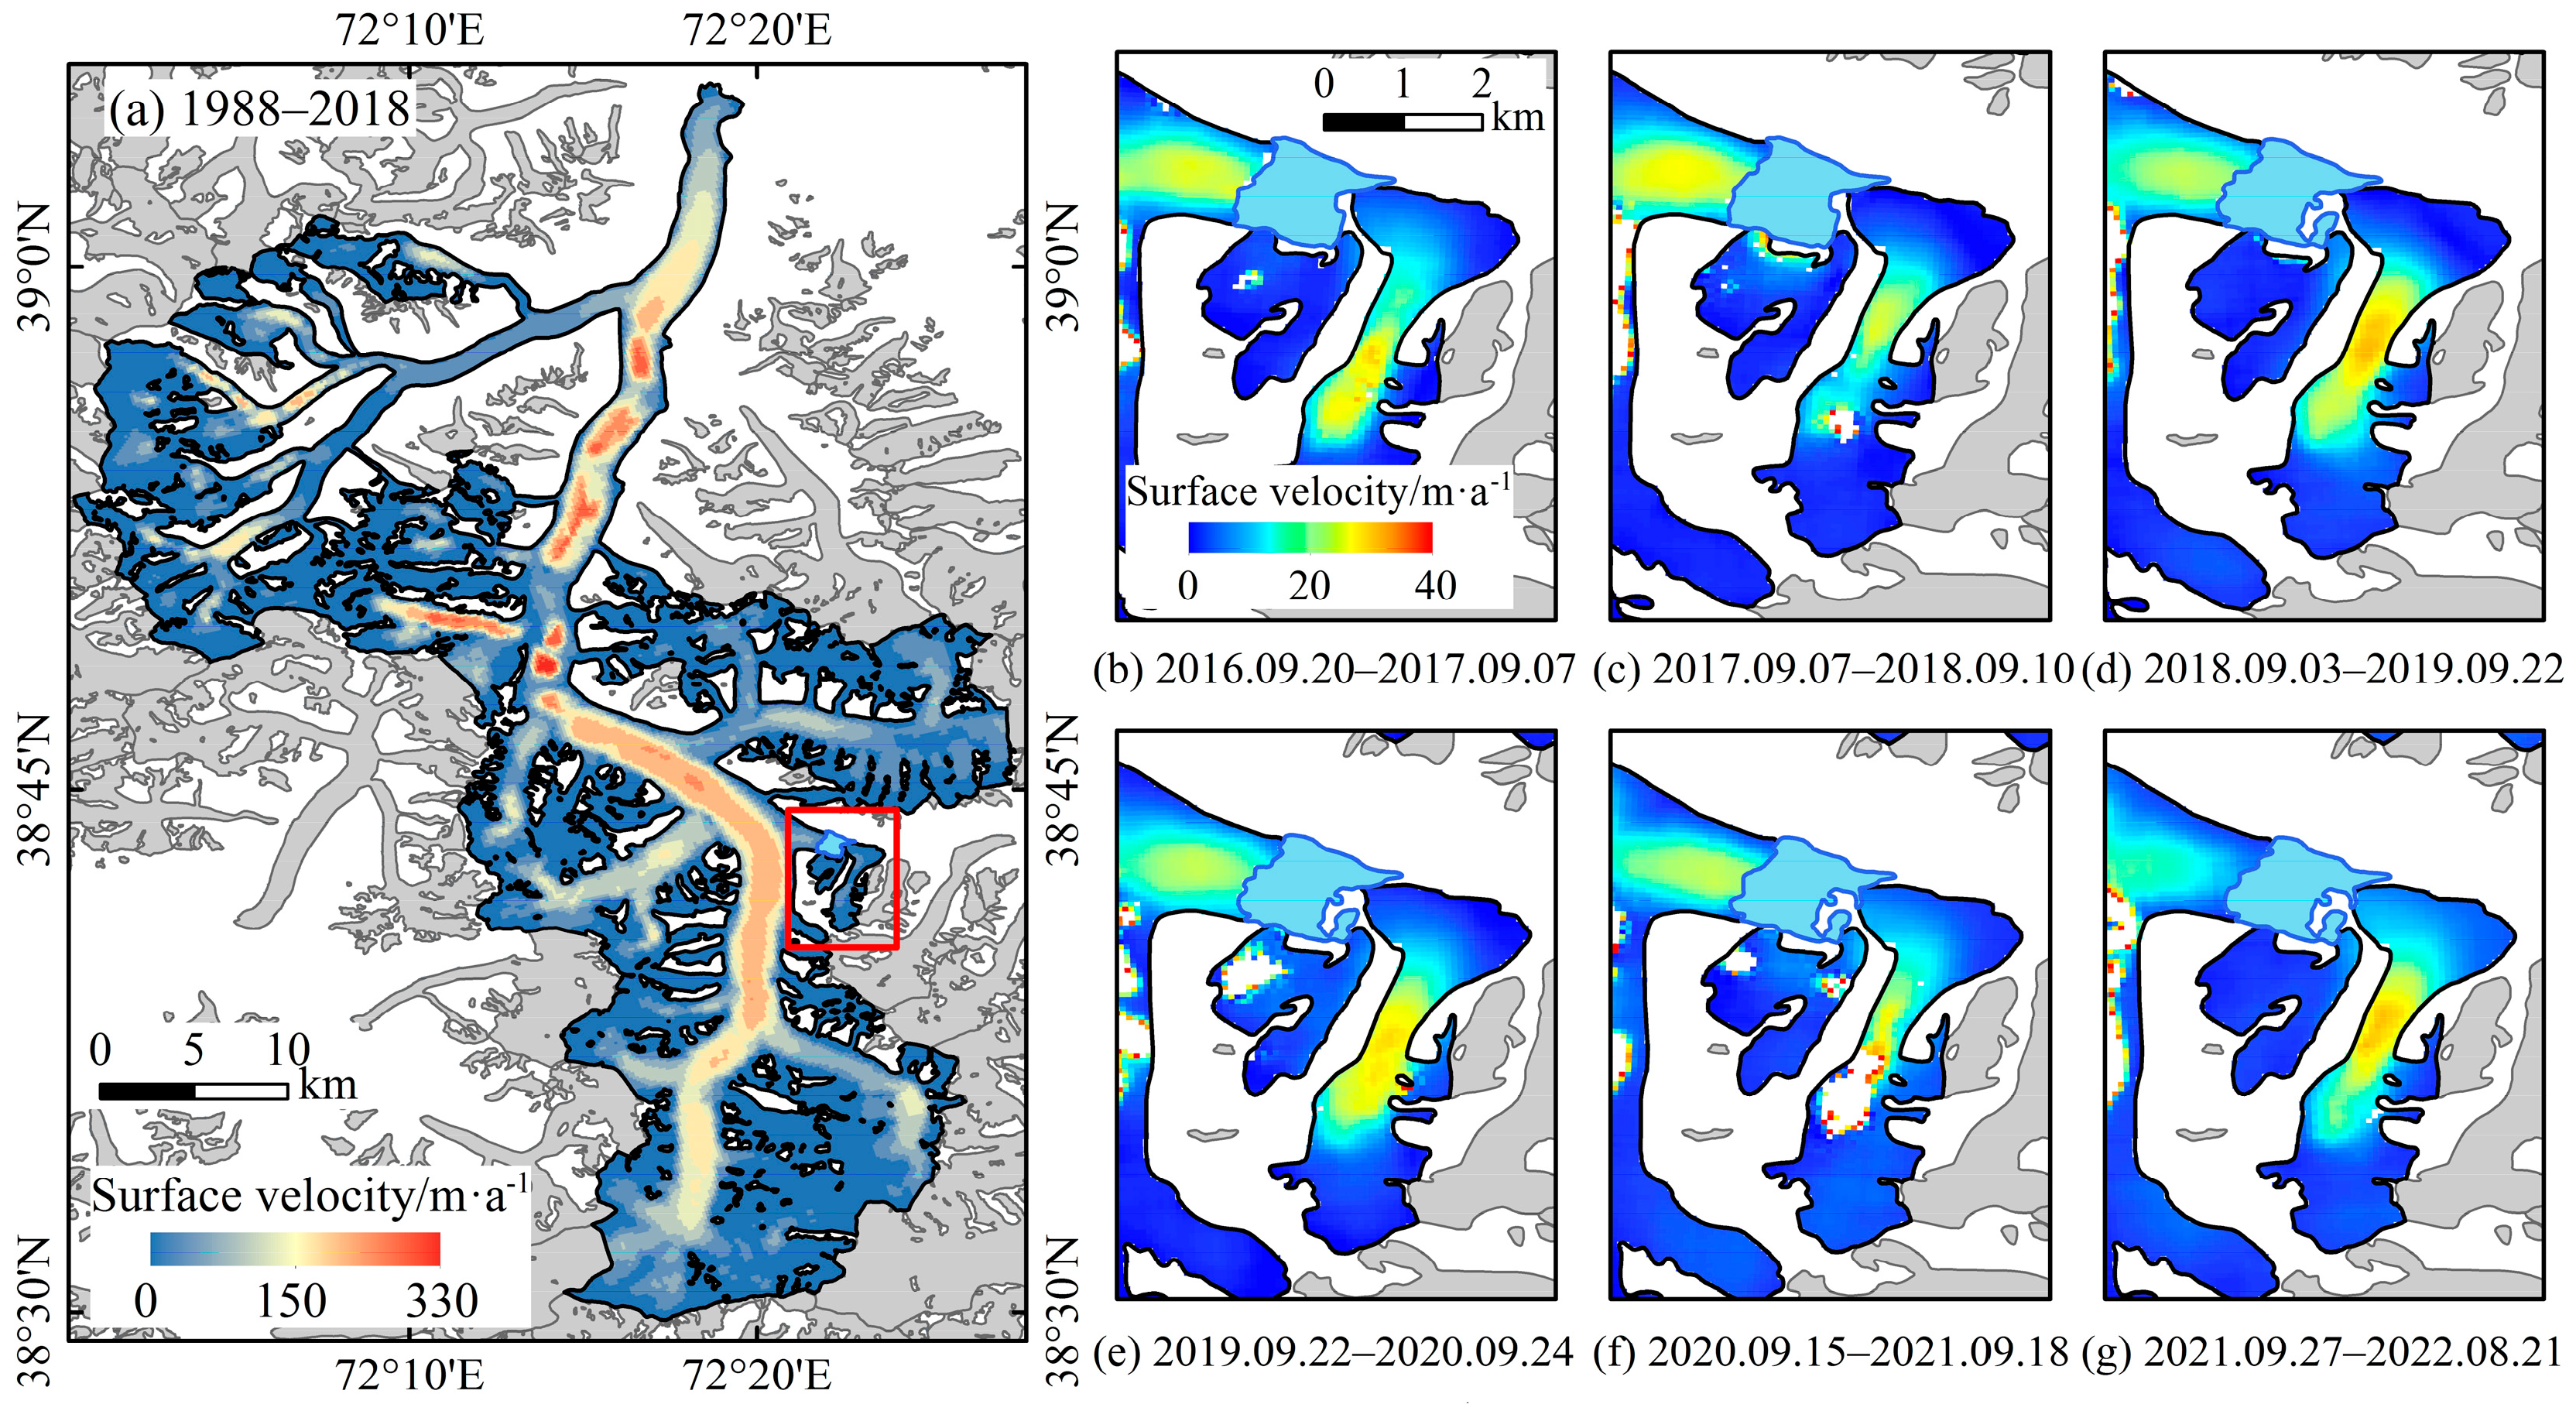
3.2.2. Extraction Glacier Surface Velocity

Glacier surface velocity in recent years was extracted by the COSI-Corr (Co-registration of Optically Sensed Images and Correlation) tool in ENVI Classic. The COSI-Corr enables the cross-correlation feature tracking method based on the optical satellite, and its reliability has been proven by field measurements [35,36]. To avoid the adverse effects of different sensors and spatial resolution, we extracted glacier surface velocity from 2013 to 2022 by the band 8 images of Landsat OLI. To achieve this, we selected the frequency correlator engine with the reference window size set to 64 × 64, the search window size set to 32 × 32, and the step size 4 × 4, respectively. Three fields were generated by the tool, including two horizontal ground offset fields in E-W (DX) and N-S (DY) directions, and a signal–noise ratio (SNR) field. The horizontal displacement (D) of an individual pixel was calculated by combing DX and DY with an SNR threshold of >0.9 using [33]:
D = D X 2 + D Y 2
Finally, the average glacier surface velocity was calculated by D and its time span.
The uncertainty of glacier surface velocity (EV) was estimated by the residual horizontal displacement in non-glacier areas using [2]:
S E = S T D V / n
E V = M E D 2 + S E 2
where STDV is the standard deviation of horizontal displacement, n is the number of pixels after decorrelation processing, and MED is the mean horizontal displacement. In the calculation, 1000 m was chosen as the decorrelation length [37]. The calculation results show that the uncertainty of glacier surface velocity is mostly less than 2.5 m·a−1 with only a few years slightly larger.

4. Results

4.1. Evolution of the Tanymas Lake

Formation and Expansion

Results from the historic field investigation and remote sensing measurement indicate that Tanymas Lake has a long evolutionary history [21,38,39]. As seen in Figure 2, the formation and expansion of Tanymas Lake can be divided into three phases:
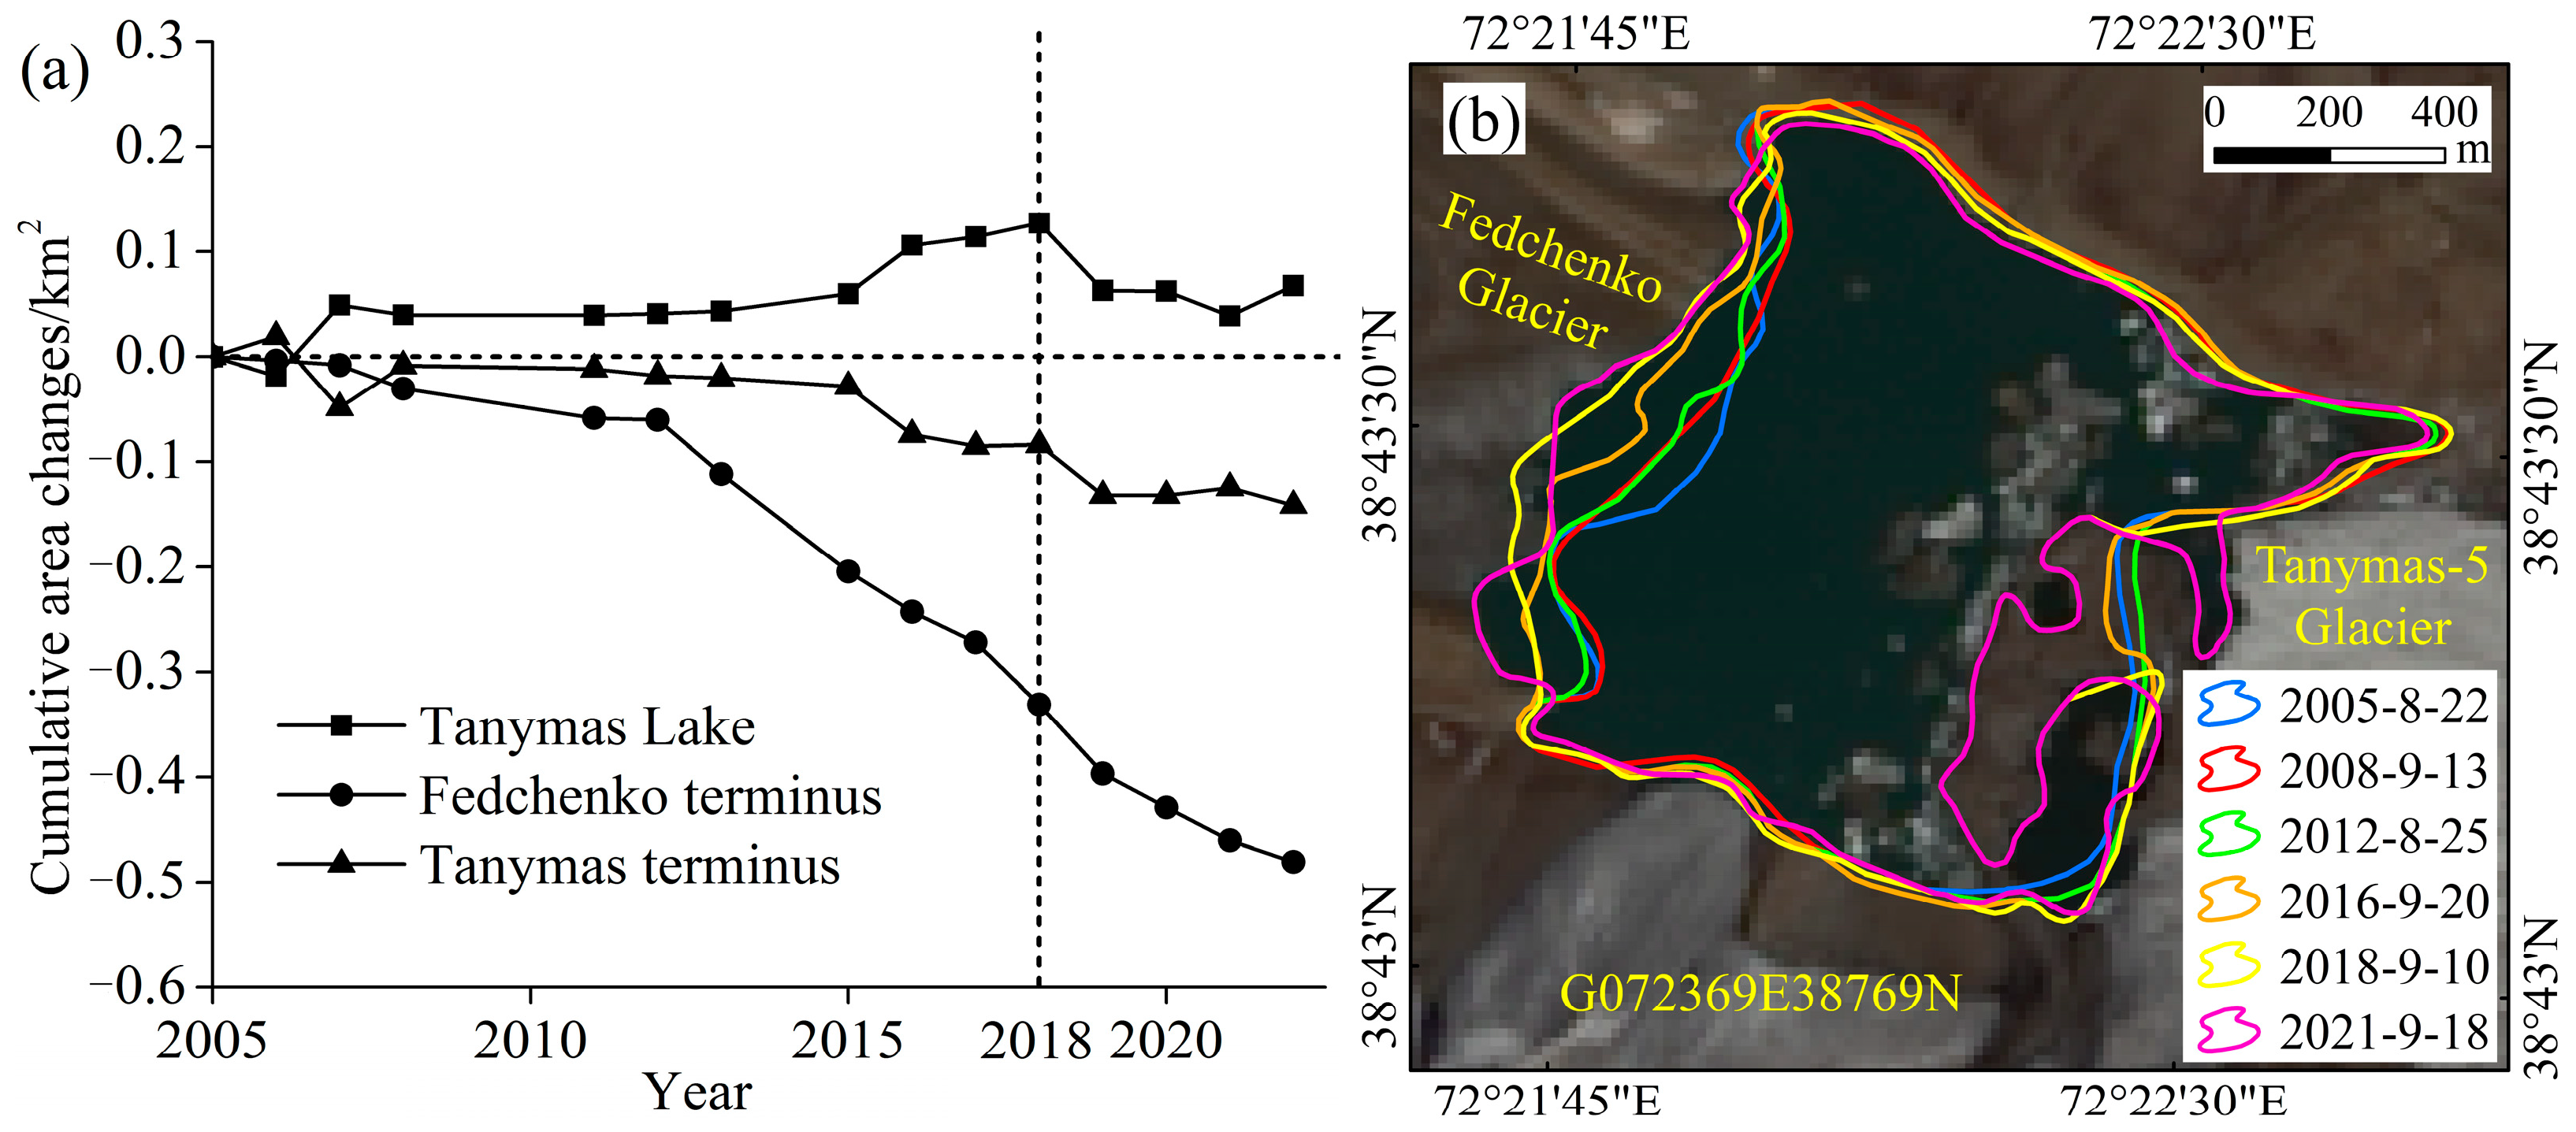
  • Before August 2005: Tanymas Lake was in an embryonic stage. In the first complete investigation of the Fedchenko Glacier in 1928, explorers discovered the existence of the Tanymas terminus of the upper Fedchenko Glacier and demonstrated its drainage [38]. As the Tanymas-5 Glacier blocked drainage, meltwater from the Fedchenko and other glaciers gradually accumulated to form some small ponds, which were the prototype of Tanymas Lake. Historical topographic maps (1928 and 1958), the Soviet Union Glacier Inventory, KH-9 images, and Landsat images indicate that these ponds slowly expanded and merged before 2005, eventually forming a group of small glacial lakes (Figure 2a–c). At the same time, the Tanymas terminus of the Fedchenko Glacier gradually came into contact with the water and began to transform into a lake terminus.
  • August 2005 to September 2018: Tanymas Lake was in a formation and expansion stage. In late August 2005 (Figure 2d,e), an ice body with an area of ~0.05 km2 broke away from the middle Tanymas terminus of the Fedchenko Glacier, resulting in the complete integration of the original small glacial lakes and the formal formation of the unified Tanymas Lake. Meanwhile, the Tanymas terminus became a complete lake terminus. Tanymas Lake had an area of 1.03 km2 in August 2005, but it still expanded as the surrounding glacier’s recession and ice calved. As shown in the Google Earth image on 12 October 2007, a large number of giant ice floes broke away from the glacier terminus and floated on the western lake, with the largest ice floe covering an area of over 0.03 km2 (Figure 2f). By the end of August 2018 (Figure 2g,h), Tanymas Lake reached its largest size since 2005, with an area of 1.16 km2.
  • After September 2018: Tanymas Lake was in a new expansion stage. The bedrock shorelines on the northern lake are not affected by the glacier dynamics directly, so they can effectively indicate the water level of Tanymas Lake. As shown in Figure 2h, the shorelines on the northern lake retreated, and the rock on the eastern lake was fully exposed from August 18 to September 10 in 2018, proving that the water level had depressed, and thus the lake area shrunk to 1.09 km2. Since then, the lake water level was basically stable, but the lake area rebounded due to the recession of the surrounding glaciers (Figure 2i) and had rebounded to 1.11 km2 by September 2022.

4.2. Interactions of Glacier and Glacial Lake

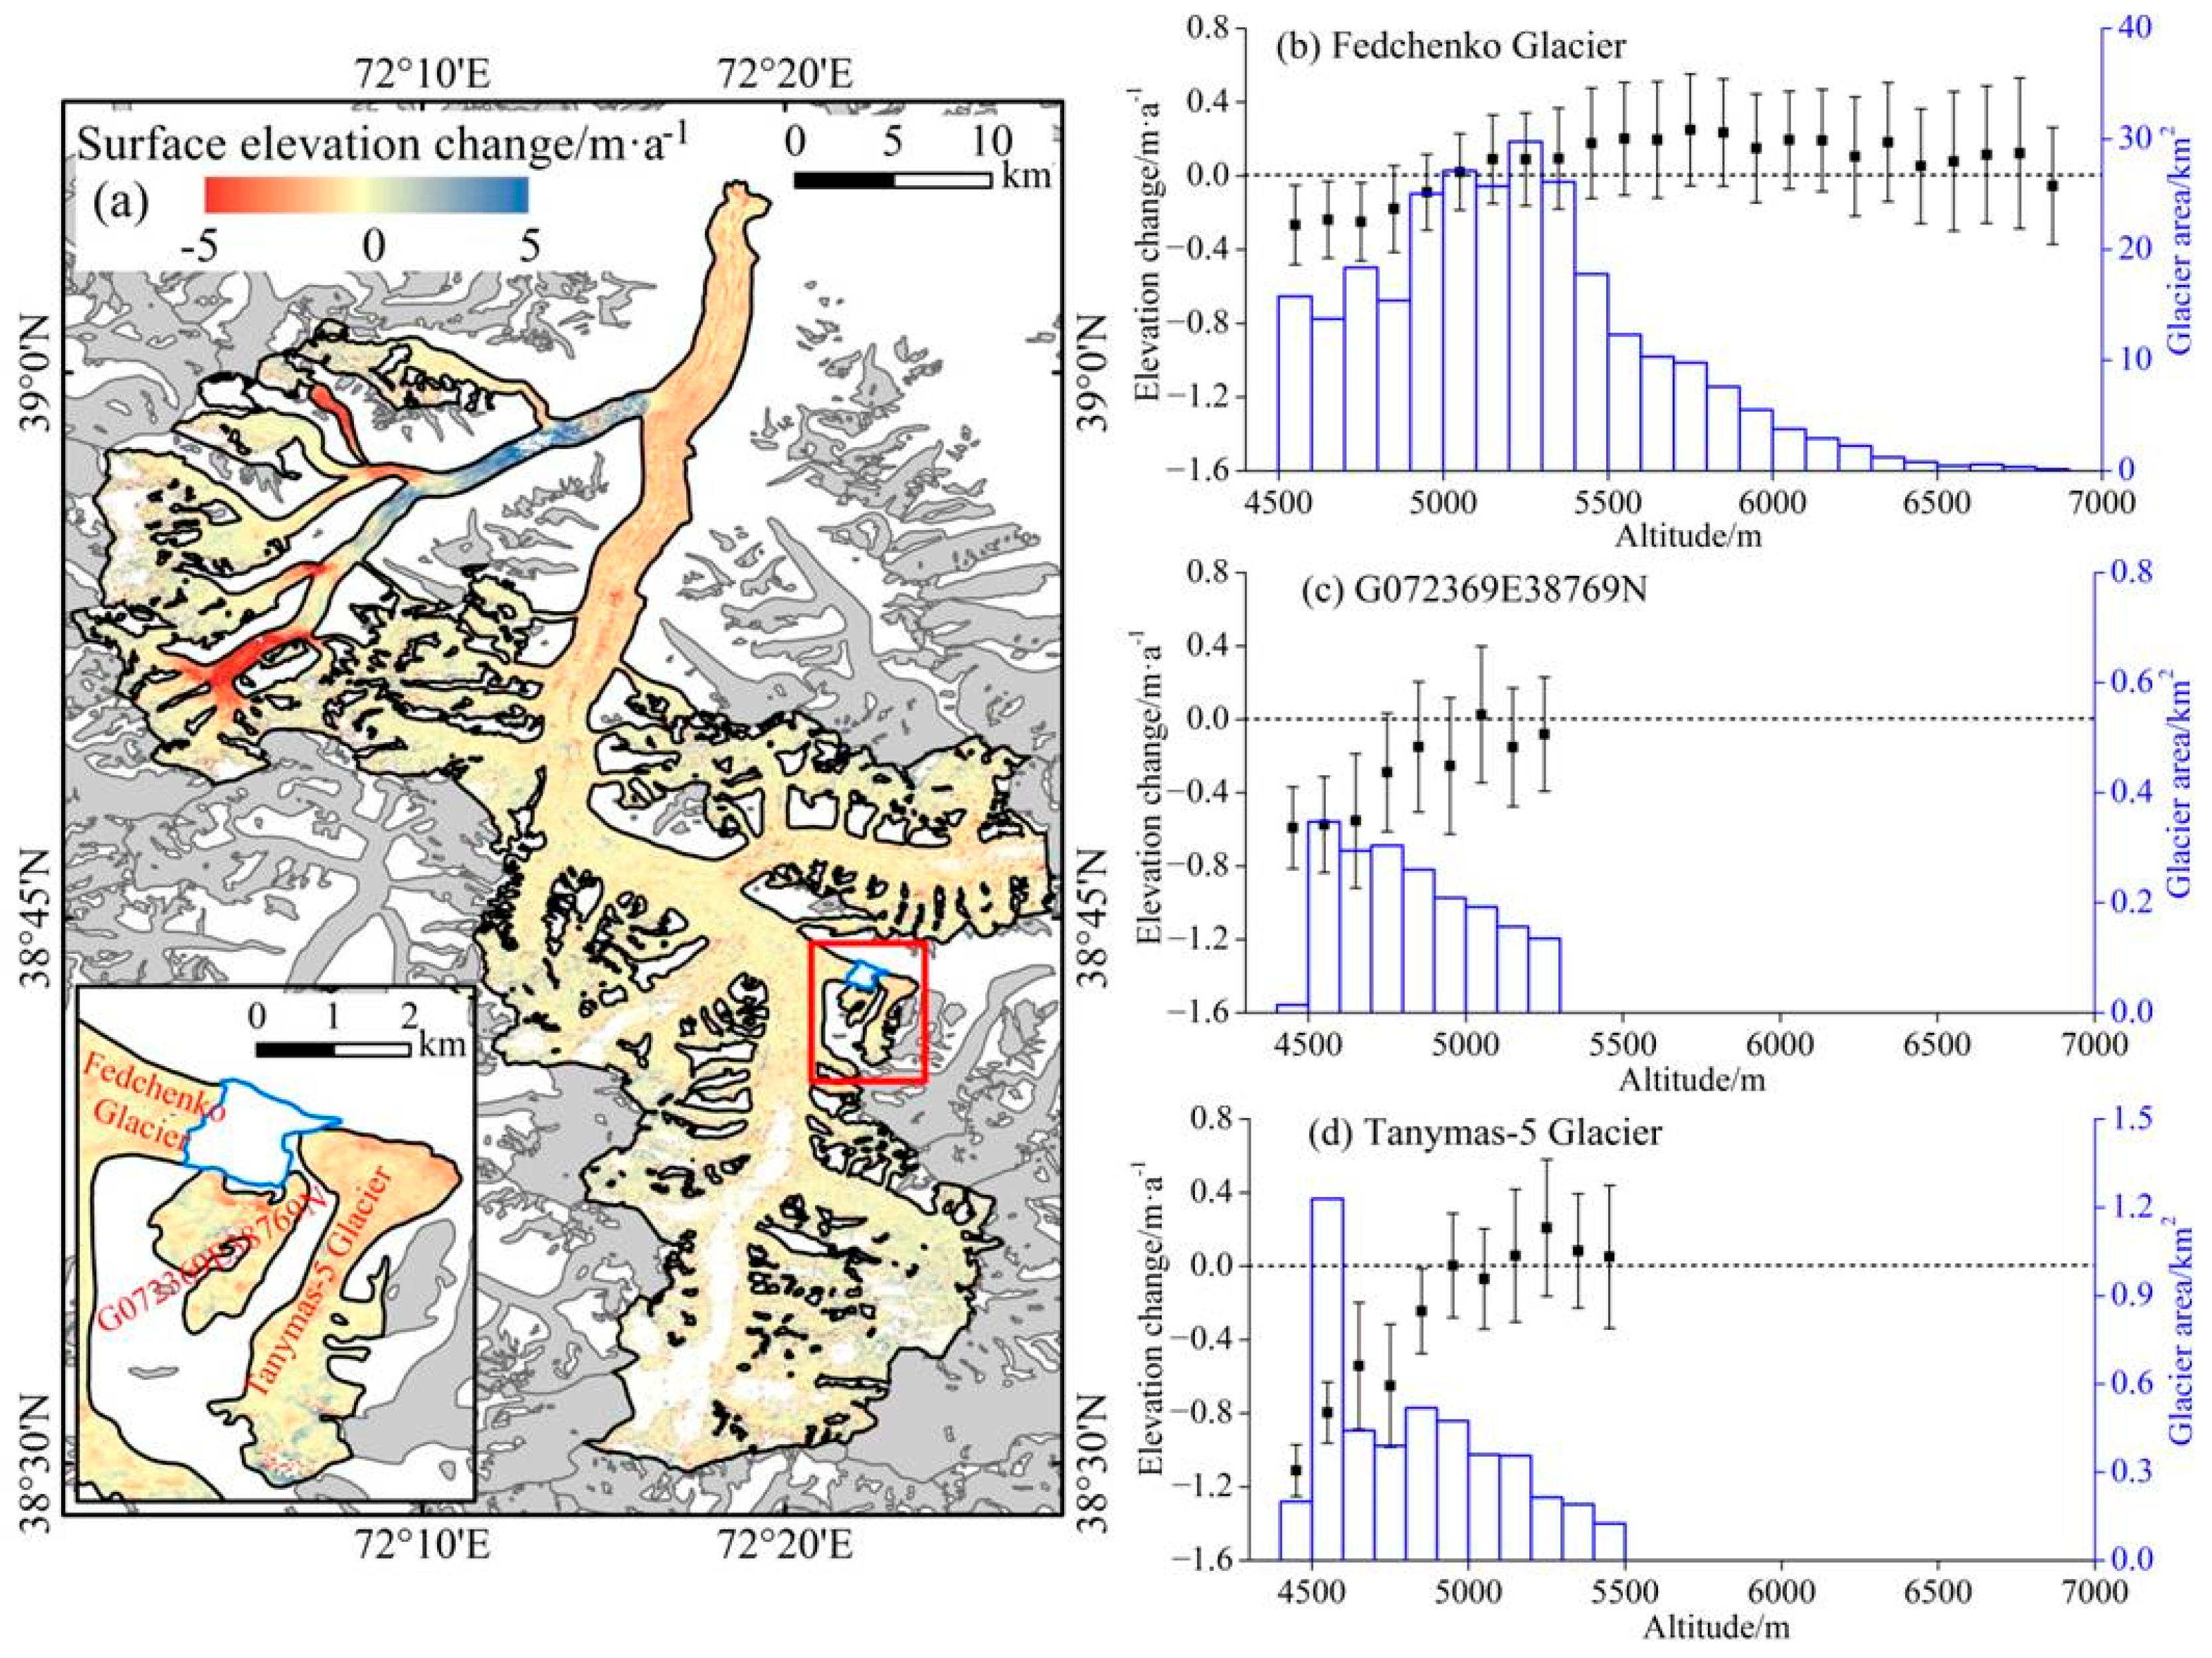
4.2.1. Glacial Impact on Tanymas Lake

In the interaction of glaciers and glacial lakes, glaciation shapes the glacial lake basin through erosion, transport, deposition, and ablation [4]. The release of glacier meltwater provides material recharge for the glacial lake. The structure and elevation of the moraine or ice dam determine the maximum water level and drainage datum of the dammed lake [40].
The morphology and composition of the Tanymas Lake basin are complicated, with the western edge eroded by the Tanymas terminus of the Fedchenko Glacier and the eastern edge deposited by the terminal moraine of the Tanymas-5 Glacier. Due to the depression landforms in a mountain pass, the initial basin of Tanymas Lake is limited in depth. According to the rough estimation of SRTM and the northern shorelines of Tanymas Lake, the maximum depth in the initial lake basin of Tanymas Lake is only ~10 m, so the water storage is also limited. However, with the accelerated disintegration and recession of the Tanymas terminus, its glacier bedrock is gradually transforming into a part of the ice-contact proglacial lake basin, resulting in an expansion of the lake basin.
The water storage of Tanymas Lake is derived from the meltwater from surrounding glaciers, mainly including the Fedchenko Glacier, the G072369E38769N Glacier, and the Tanymas-5 Glacier. However, in fact, as the Tanymas-5 Glacier is a piedmont glacier and the outlet of the Tanymas Lake is located at the western edge of the Tanymas-5 Glacier terminus (Figure 2i), most of the meltwater from this glacier does not flow into the Tanymas Lake. As shown in Figure 3, there are two different patterns of water recharge from these glaciers. From the mid-1970s to 2000 and then to 2016, the surface elevation of the Fedchenko Glacier remained stable or even slightly increased in most of the area above Tanymas Lake (4500 m a.s.l.) and only decreased in the areas below the equilibrium line (ELA, ~4800 m), which is consistent with the results of historic field observations and remote sensing monitoring in recent years [21,41,42]. Combined with the accelerated calving of the Tanymas terminus after 2005, it can be seen that the water recharge of the Fedchenko Glacier to Tanymas Lake is dominated by the ice floes into the lake directly. Conversely, the surface elevation of G072369E38769N and Tanymas-5 Glacier has decreased significantly since 2000, so their water recharge for the lake is dominated by thinning.
According to the formation and evolution process, the Tanymas Lake is both an ice-contact proglacial lake and an ice-dammed lake [43]. Therefore, although the Fedchenko and other glaciers provide water recharge and space for expansion, the maximum water level and drainage datum of Tanymas Lake are determined by the Tanymas-5 Glacier, which formed the blocking dam. The most intuitive manifestation is that the accelerated melting and calving of the surrounding glaciers in recent years have provided more meltwater recharge to the lake, while the thinning and retreat of Tanymas-5 Glacier still suppress the rise of the water level (Figure 2h). Therefore, the water level of Tanymas Lake has reached or approached the upper limit. However, it does not mean there are also clear upper limits to the area and volume of the Tanymas Lake because the accelerated disintegration and recession of the Tanymas terminus of the Fedchenko Glacier will provide sufficient power and space for its expansion.

4.2.2. Impact of Tanymas Lake on Glaciers

The ice-contact proglacial lake also has profound impacts on the lake-terminating glaciers, including controlling ice flow, regulating the thermal ablation process, and promoting ice calving [2]. Similar to the Merzbacher Lake and Inylchek Glacier in the Tianshan Mountains, the ice bodies of Tanymas terminus can calve into Tanymas Lake directly along the tensile cracks generated by glacier ice flow [18]. Therefore, the most direct and critical impact of the Tanymas Lake on the Fedchenko Glacier is to promote the recession and ice calving of the Tanymas terminus. Moreover, the recessions of the glacier terminus are abrupt and uneven, but on average, the Tanymas terminus of the Fedchenko Glacier has retreated ~10 m·a−1 since 2005.
The Fedchenko Glacier shrank by 3.02 km2 from 1928 to 2005, with an average of 0.04 km2·a−1, which mainly resulted from the downstream Fedchenko terminus recession [19]. After 2005, with the formation and expansion of Tanymas Lake, the continuous recession of the Tanymas terminus began to have an increasing impact on the whole glacier area change. Figure 4 indicates the interaction of the area change of Tanymas Lake and the Tanymas terminus after 2005, with the lake expansion accompanied by the glacier terminus retreat. However, while the Tanymas terminus continued to retreat after 2018, the expansion of Tanymas Lake began to slow down, largely influenced by the exposed rock on the eastern edge of the lake. Therefore, the shrinking area of the Tanymas terminus is not equivalent to the expansion area of Tanymas Lake but is larger than the latter. Overall, from 2005 to 2022, the upstream Tanymas terminus and the downstream Fedchenko terminus contributed 0.14 km2 (22.8%) and 0.48 km2 (77.2%) in glacier area loss, respectively, showing that the formation and expansion of Tanymas Lake accelerated the area shrinkage of the Fedchenko Glacier.
The lubrication, albedo difference, and phase transition of the water in the ice-contact proglacial lake could accelerate the glacier ice flow, thus aggravating the mass loss of the lake-terminating glaciers [12]. Before 2005, the Fedchenko Glacier recharged Tanymas Lake mainly by the meltwater derived from the slowly melting and thinning, while it changed into broken ice and ice floes as the ice-contact proglacial lake and lake terminus completely formed, with a much higher efficiency in mass transport and loss than the former. However, the ITS_LIVE datasets and the COSI-Corr results show that the surface velocity of glaciers around Tanymas Lake had no remarkable change since 1985, including the period from 2013 to 2022 (Figure 5). These calculations are in general agreement with the results of historic field measurements, and together they indicate that there is almost no long-term trend of change in flow velocity of the upper Fedchenko Glacier over the last half century, although there are large interannual fluctuations [21,44]. Therefore, the glacier surface elevation and velocity change suggested that the interactions of the Fedchenko Glacier and Tanymas Lake are not equal due to the huge difference in the size of the two. The contribution of the glacier terminus retreat to the glacial lake expansion is relatively stronger because a slight change in the Fedchenko Glacier would significantly impact Tanymas Lake, while the impact of Tanymas Lake on the Fedchenko Glacier is just limited to the frontal of the Tanymas terminus.
In summary, the current Tanymas Lake can only promote the retreat and ice calving for the Tanymas terminus of the Fedchenko Glacier, which just accelerates the glacier area and mass loss but has almost no impact on the ice flow. The main reasons for this situation are twofold. Firstly, as a new combination of a lake terminus and an ice-contact proglacial lake, the interaction of Tanymas Lake and the Tanymas terminus is in an early stage. Secondly, Tanymas Lake was formed at the Tanymas Pass on the east side of the upper Fedchenko Glacier. This unique location limits the interaction of Tanymas Lake and the Fedchenko Glacier to the Tanymas terminus, rather than the entire glacier. However, although the impact of Tanymas Lake on the entire Fedchenko Glacier is limited, its formation is at least a landmark event for the Tanymas terminus, which laid the foundation for the further development of glacier–lake interaction in the future.

5. Discussions

5.1. Mechanism of the Tanymas Lake Formation and Evolution

The formation and evolution of a glacial lake are constrained by the glaciation landforms and the release and convergence of glacial meltwater [36]. For the formation of Tanymas Lake, the glacial erosion and accretion at the Tanymas Pass provided the topographic conditions, and the meltwater from the Fedchenko and other glaciers provided the material conditions. The meteorological records of Gorbunov station from 1935 to 1994 (Figure 6) show that the air temperature of the upper Fedchenko Glacier is only higher than 0 °C in summer, while the precipitation is concentrated in winter and spring [45]. Therefore, at high altitudes with a cold climate, the formation and evolution of Tanymas Lake have taken a long time, and it is a process of quantitative change gradually leading to qualitative change [43].
The Section 4 illustrates the cold climate and slight glacier mass loss at the high altitude of the Tanymas Pass, and thus the formation of the Tanymas Lake is associated with the accumulation of glacial meltwater and the blockage of drainage. In the summer of each year, the glaciers around the Tanymas Pass briefly melt and drain. As the water storage in the depressions increased, the contact range between the glacier ice and the water body expanded, which further promoted the melting and calving of the glacier terminus and the accumulation of meltwater under the ice–water interactions [46]. In this process, as shown in Figure 2, the Tanymas Lake transformed from a waterlogged depression to a group of small glacial lakes, and then to a large ice-contact proglacial lake and ice-dammed lake. Meanwhile, the Tanymas terminus of the Fedchenko Glacier transformed from a land terminus to a partial lake terminus, and then to a complete lake terminus. In addition, they demonstrate that Tanymas Lake did not suddenly form in August 2005, as a large glacial lake cannot appear out of thin air. However, the breakup of the Tanymas terminus in August 2005 is still a landmark event that resulted in the complete integration of the original small lakes, i.e., the formal formation of a unified Tanymas Lake. Meanwhile, the decrease in the water level of Tanymas Lake in September 2018 is another landmark event, which means that the lake water level has reached the upper limit. Therefore, the focus of future lake expansion will be the lake terminus side, which may lead to enhanced interaction between Tanymas Lake and the Fedchenko Glacier.

5.2. Lake Change and GLOF Risk

To evaluate the glacial lake changes in different climate settings, we compared the area changes of Tanymas Lake with other ice-contact lakes (including ice-contact proglacial lakes and ice-dammed lakes) in HMA based on the recent multi-temporal glacial lake inventory by Wang et al. [22]. As shown in Figure 7, in the last three decades, among 350 ice-contact lakes (>0.1 km2) in HMA, most of the lakes (280) have expanded to varying degrees, and a few lakes (70) shrunk, and for Tanymas Lake, there was only a slight area expansion rate of ~1%·a−1. The main driver for the expansion of ice-contact lakes is the increased glacier mass loss and meltwater [1], so the spatial pattern of ice-contact proglacial lake change in HMA is largely consistent with the spatial pattern of glacier mass change [28,41,42]. The area expansion rate of the ice-contact lake is faster in the Himalayas and southeastern Tibet, and lower in Pamir, Tianshan Mountains, and Central Tibetan Plateau [14,22]. However, we must also note that even in the Himalayas, there are significant variations in the area changes of ice-contact lakes, with some lakes expanding weakly or even shrinking, mainly due to the higher altitudes and the limited water storage of the lake basin. Thus, the slow expansion of Tanymas Lake is mainly related to the cold climate and slight glacier mass loss of the Central Pamir.
Tanymas Lake has expanded slowly since it was fully formed in 2005, but it has become one of the largest glacial lakes in Pamir and even in HMA. As the accelerated melting and calving of the lake terminus, the lake basin of Tanymas Lake is expanding upstream [46]. Therefore, although the water level of Tanymas Lake has reached its upper limit, it is expected that the area, depth, and water storage of the glacial lake will continue to expand in the future. Fortunately, given that the glaciers around Tanymas Lake have had no surging events so far and have gentle slopes [25,47,48], there is little possibility of GLOF triggered by sudden events such as the glacier surging or ice–snow avalanche. In fact, for the Tanymas Valley in Central Pamir, there would be almost no devastating damage with the sparse population even if a GLOF occurred. However, in the coming decades, the water storage of Tanymas Lake will continue to expand with the warming climate, while the ice dam is shrinking, thinning, and gradually destabilizing [42,49]. Therefore, similar to the Merzbacher, Kyagar, Longbasaba Lakes, etc., in HMA, continuous remote sensing and field observations of Tanymas Lake should be carried out in the future to deal with the growing GLOF risk.

6. Conclusions

This study investigated the long-term evolutions of the Tanymas Lake and the Fedchenko Glacier in Central Pamir, which provides a valuable opportunity to observe the glacier–lake interactions in cold climate settings. The results indicate that Tanymas Lake is both an ice-contact proglacial lake and an ice-dammed lake, it covered an area of 1.10 km2 in September 2022 and is one of the largest glacial lakes in Pamir and even in HMA. The glaciation and glacier meltwater provided the topographic and material conditions for its formation, respectively. Tanymas Lake was in an embryonic stage before August 2005, in a formation and expansion stage from August 2005 to September 2018, and in a new expansion stage after September 2018. In this process, the Tanymas terminus of the Fedchenko Glacier also transformed from a land terminus to a partial lake terminus, and then to a complete lake terminus.
In the glacier–lake interactions, the Fedchenko Glacier provided the water recharge and space for the Tanymas Lake expansion, while the Tanymas Lake promoted the recession and ice calving of the Fedchenko Glacier. Compared to most ice-contact lakes in HMA, Tanymas Lake has had a relatively slow expansion rate due to the cold climate and slight glacier mass loss of Central Pamir. In the coming decades, with the accelerated mass loss of the Tanymas terminus of the Fedchenko Glacier, the area, depth, and water storage of Tanymas Lake will continue to increase, accompanied by the growing GLOF risk.

Author Contributions

Conceptualization, Z.L. and N.W.; methodology, Z.L. and J.C.; software, Z.L. and J.C.; validation, Q.Z.; formal analysis, Z.L., N.W. and J.C.; investigation, Z.L., N.W. and J.C.; resources, Z.L. and J.C.; data curation, Z.L., N.W. and J.C.; writing—original draft preparation, Z.L., J.C. and Q.Z.; writing—review and editing, Z.L., N.W., J.C. and Q.Z.; visualization, Z.L. and J.C.; supervision, Q.Z.; project administration, N.W.; funding acquisition, N.W. All authors have read and agreed to the published version of the manuscript.

Funding

This research was funded by the Second Tibetan Plateau Scientific Expedition and Research Program (2019QZKK020102) and the National Natural Science Foundation of China (42130516).

Data Availability Statement

Not applicable.

Acknowledgments

The authors are very grateful to the United States Geological Survey (USGS), for providing the Landsat images, KH-9 image, and SRTM DEM (https://earthexplorer.usgs.gov/ accessed on 10 November 2022), the National Aeronautics and Space Administration (NASA), for providing the ITS_LIVE datasets (https://its-live.jpl.nasa.gov/, accessed on 25 November 2022), and the National Snow and Ice Data Center (NSIDC), for providing the Central Asia Temperature and Precipitation Data (https://nsidc.org/data/G02174, accessed on 25 November 2022). The author also expresses special gratitude to The Pamir Archive created by Markus Hauser (http://www.pamir-adventure.com/pamirmountains/, accessed on 23 April 2023) and the Silk Road Adventure Website (https://silkadv.com/en, accessed on 23 April 2023) for sharing early maps and travelogues of the Central Pamir.

Conflicts of Interest

The authors declare no conflict of interest.

References

  1. Zhang, G.Q.; Bolch, T.; Yao, T.D.; Rounce, D.R.; Chen, W.F.; Veh, G.; King, O.; Allen, S.K.; Wang, M.M.; Wang, W.C. Underestimated mass loss from lake-terminating glaciers in the greater Himalaya. Nat. Geosci. 2023, 16, 333–338. [Google Scholar] [CrossRef]
  2. Sutherland, J.L.; Carrivick, J.L.; Gandy, N.; Shulmeister, J.; Quincey, D.J.; Cornford, S.L. Proglacial lakes control glacier geometry and behavior during recession. Geophys. Res. Lett. 2020, 47, e2020GL088865. [Google Scholar] [CrossRef]
  3. Carrivick, J.L.; Tweed, F.S. Proglacial lakes: Character, behaviour and geological importance. Quaternary. Sci. Rev. 2013, 78, 34–52. [Google Scholar] [CrossRef]
  4. Liu, Q.; Mayer, C.; Wang, X.; Nie, Y.; Wu, K.P.; Wei, J.F.; Liu, S.Y. Interannual flow dynamics driven by frontal retreat of a lake-terminating glacier in the Chinese Central Himalaya. Earth Planet Sc. Lett. 2020, 546, 116450. [Google Scholar] [CrossRef]
  5. King, O.; Bhattacharya, A.; Bhambri, R.; Bolch, T. Glacial lakes exacerbate Himalayan glacier mass loss. Sci. Rep. 2019, 9, 18145. [Google Scholar] [CrossRef] [PubMed]
  6. King, O.; Dehecp, A.; Quincey, D.; Carrivick, J. Contrasting geometric and dynamic evolution of lake and land-terminating glaciers in the central Himalaya. Glob. Planet. Chang. 2018, 167, 46–60. [Google Scholar] [CrossRef]
  7. Brun, F.; Wagnon, P.; Berthier, E.; Jomelli, V.; Maharjan, S.B.; Shrestha, F.; <monospace> </monospace>Kraaijenbrink, P.D.A. Heterogeneous influence of glacier morphology on the mass balance variability in High Mountain Asia. J. Geophys. Res.-Earth Surf. 2019, 124, 1331–1345. [Google Scholar] [CrossRef]
  8. Song, C.Q.; Sheng, Y.W.; Wang, J.D.; Ke, L.H.; Madson, A.; Nie, Y. Heterogeneous glacial lake changes and links of lake expansions to the rapid thinning of adjacent glacier termini in the Himalayas. Geomorphology 2017, 280, 30–308. [Google Scholar] [CrossRef]
  9. Immerzeel, W.W.; Kraaijenbrink, P.D.A.; Shea, J.M.; Shrestha, A.B.; Pellicciotti, F.; Bierkens, M.F.P.; and de Jong, S.M. High-resolution monitoring of Himalayan glacier dynamics using unmanned aerial vehicles. Remote Sens. Environ. 2014, 150, 93–103. [Google Scholar] [CrossRef]
  10. Zhang, G.Q.; Bolch, T.; Allen, S.; Linsbauer, A.; Chen, W.F.; Wang, W.C. Glacial lake evolution and glacier-lake interactions in the Poiqu River basin, central Himalaya, 1964-2017. J. Glaciol. 2019, 65, 347–365. [Google Scholar] [CrossRef]
  11. Haritashya, U.; Kargel, J.; Shugar, D.; Leonard, G.; Strattman, K.; Watson, C.; Shean, D.; Harrison, S.; Mandli, K.; Regmi, D. Evolution and controls of large glacial lakes in the Nepal Himalaya. Remote Sens. 2018, 10, 798. [Google Scholar] [CrossRef]
  12. Sakai, A.; Nishimura, K.; Kadota, T.; Takeuchi, N. Onset of calving at supraglacial lakes on debris-covered glaciers of the Nepal Himalaya. J. Glaciol. 2009, 55, 909–917. [Google Scholar] [CrossRef]
  13. Watson, C.S.; Kargel, J.S.; Shugar, D.H.; Haritashya, U.K.; Schiassi, E.; Furfaro, R. Mass loss from calving in Himalayan proglacial lakes. Front. Earth Sci. 2020, 7, 00342. [Google Scholar] [CrossRef]
  14. Compagno, L.; Huss, M.; Zekollari, H.; Miles, E.S.; Farinotti, D. Future growth and decline of high mountain Asia’s ice-dammed lakes and associated risk. Commun. Earth Environ. 2022, 3, 191. [Google Scholar] [CrossRef]
  15. Wei, J.F.; Liu, S.Y.; Wang, X.; Zhang, Y.; Jiang, Z.L.; Wu, K.P.; Zhang, Z.; Zhang, T. Longbasaba Glacier recession and contribution to its proglacial lake volume between 1988 and 2018. J. Glaciol. 2021, 67, 473–484. [Google Scholar] [CrossRef]
  16. Veh, G.; Lützow, N.; Tamm, J.; Luna, L.V.; Hugonnet, R.; Vogel, K.; Geertsema, M.; Clague, J.J.; Korup, O. Less extreme and earlier outbursts of ice-dammed lakes since 1900. Nature 2023, 614, 701–707. [Google Scholar] [CrossRef] [PubMed]
  17. Yin, B.L.; Zeng, J.; Zhang, Y.L.; Huai, B.J.; Wang, Y.T. Recent Kyagar glacier lake outburst flood frequency in Chinese Karakoram unprecedented over the last two centuries. Nat. Hazards 2019, 95, 877–881. [Google Scholar] [CrossRef]
  18. ShuangGuan, D.H.; Ding, Y.J.; Liu, S.Y.; Xie, Z.C.; Pieczonka, T.; Xu, J.L.; Moldobekov, B. Quick release of internal water storage in a glacier leads to underestimation of the hazard potential of glacial lake outburst floods from Lake Merzbacher in Central Tian Shan Mountains. Geophys. Res. Lett. 2017, 44, 9786–9795. [Google Scholar] [CrossRef]
  19. Lambrecht, A.; Mayer, C.; Wendt, A.; Floricioiu, D.; Volksen, C. Elevation change of Fedchenko Glacier, Pamir Mountains, from GNSS field measurements and TanDEM-X elevation models, with a focus on the upper glacier. J. Glaciol. 2018, 64, 637–648. [Google Scholar] [CrossRef]
  20. Li, Z.J.; Wang, N.L.; Chen, A.A.; Liang, Q.; Yang, D.Q. Slight change of glaciers in the Pamir over the period 2000-2017. Arct. Antarct. Alp. Res. 2022, 54, 13–24. [Google Scholar] [CrossRef]
  21. Lambrecht, A.; Mayer, C.; Alzen, V.; Floricioiu, D.; Surazakov, A. The evolution of Fedchenko glacier in the Pamir, Tajikistan, during the past eight decades. J. Glaciol. 2014, 60, 233–244. [Google Scholar] [CrossRef]
  22. Wang, X.; Guo, X.Y.; Yang, C.D.; Liu, Q.H.; Wei, J.F.; Zhang, Y.; Liu, S.Y.; Zhang, Y.L.; Jiang, Z.L.; Tang, Z.G. Glacial lake inventory of high-mountain Asia in 1990 and 2018 derived from Landsat images. Earth Syst. Sci. Data 2020, 12, 2169–2182. [Google Scholar] [CrossRef]
  23. Chen, F.; Zhang, M.M.; Guo, H.D.; Allen, S.; Kargel, J.S.; Haritashya, U.K.; Watson, C.S. Annual 30 m dataset for glacial lakes in High Mountain Asia from 2008 to 2017. Earth Syst. Sci. Data 2021, 13, 741–766. [Google Scholar] [CrossRef]
  24. Zhou, Y.S.; Li, Z.W.; Li, J.; Zhao, R.; Ding, X.L. Geodetic glacier mass balance (1975–1999) in the central Pamir using the SRTM DEM and KH-9 imagery. J. Glaciol. 2019, 65, 309–320. [Google Scholar] [CrossRef]
  25. Goerlich, F.; Bolch, T.; Paul, F. More dynamic than expected: An updated survey of surging glacier in the Pamir. Earth Syst. Sci. Data 2020, 12, 3161–3176. [Google Scholar] [CrossRef]
  26. Molg, N.; Bolch, T.; Rastner, P.; Strozzi, T.; Paul, F. A consistent glacier inventory for Karakoram and Pamir derived from Landsat data: Distribution of debris cover and mapping challenges. Earth Syst. Sci. Data 2018, 10, 1807–1827. [Google Scholar] [CrossRef]
  27. USGS. Shuttle Radar Topography Mission 1 Arc-Second Global; USGS: Reston, VA, USA, 2018. [Google Scholar] [CrossRef]
  28. Brun, F.; Berthier, E.; Wagnon, P.; Kääb, A.; Treichler, D. A spatially resolved estimate of High Mountain Asia glacier mass balances from 2000 to 2016. Nat. Geosci. 2017, 10, 668–673. [Google Scholar] [CrossRef]
  29. Nuth, C.; Kääb, A. Co-registration and bias corrections of satellite elevation data sets for quantifying glacier thickness change. Cryosphere 2011, 5, 271–290. [Google Scholar] [CrossRef]
  30. Dehecq, A.; Gourmelen, N.; Gardner, A.S.; Brun, F.; Goldberg, D.; Nienow, P.W.; Berthier, E.; Vincent, C.; Wagnon, P.; Trouve, E. Twenty-first century glacier slowdown driven by mass loss in High Mountain Asia. Nat. Geosci. 2019, 12, 22–27. [Google Scholar] [CrossRef]
  31. Gardner, A.S.; Moholdt, G.; Scambos, T.; Fahnstock, M.; Ligtenberg, S.; Broeke, M.; Nilsson, J. Increased West Antarctic and unchanged East Antarctic ice discharge over the last 7 years. Cryosphere 2018, 12, 521–547. [Google Scholar] [CrossRef]
  32. Lei, Y.; Gardner, A.S.; Agram, P. Autonomous repeat image feature tracking (autoRIFT) and its application for tracking ice displacement. Remote Sens. 2021, 13, 749. [Google Scholar] [CrossRef]
  33. Lambrecht, A.; Mayer, C.; Bohleber, P.; Aizen, V. High altitude accumulation and preserved climate information in the western Pamir, observations from the Fedchenko Glacier accumulation basin. J. Glaciol. 2020, 66, 219–230. [Google Scholar] [CrossRef]
  34. Nuimura, T.; Sakai, A.; Taniguchi, K.; Nagai, H.; Lamsal, D.; Tsutaki, S.; Kozawa, A.; Hoshina, Y.; Takenaka, S.; Omiya, S.; et al. The GAMDAM glacier inventory: A quality-controlled inventory of Asian glaciers. Cryosphere 2015, 8, 849–864. [Google Scholar] [CrossRef]
  35. Bai, C.B.; Wang, F.T.; Wang, L.; Xun, C.H.; Yue, X.Y.; Yang, S.J.; Wang, P.Y.; Bi, Y.Q.; Wei, H.N. Dynamic monitoring of debris-covered glacier surface velocity and ice thickness of Mt.Tomur, Tian Shan, China. Remote Sens. 2023, 15, 150. [Google Scholar] [CrossRef]
  36. Quincey, D.J.; Glasser, N.F.; Cook, S.J.; Luckman, A. Heterogeneity in Karakoram glacier surges. J. Geophys. Res. Earth Surf. 2015, 120, 1288–1300. [Google Scholar] [CrossRef]
  37. Bolch, T.; Pieczonka, T.; Benn, D.I. Multi-decadal mass loss of glaciers in the Everest area (Nepal Himalaya) derived from stereo imagery. Cryosphere 2011, 5, 349–358. [Google Scholar] [CrossRef]
  38. Silk Road Adventures. History of Tanymas Valley. 2021. Available online: https://silkadv.com/en/content/history-tanymas-valley (accessed on 23 April 2023).
  39. Markus, H. The Pamir Archive: A world of information. In Pamirs at the Crossroads-Changing Challenges and Perspectives (Berlin Geographical Papers 45); Freie Universität Berlin: Berlin, Germany, 2016. [Google Scholar]
  40. Miles, E.S.; Watson, C.S.; Brun, F.; Berthier, E.; Esteves, M.; Quincey, D.J.; Miles, K.E.; Hubbard, B.; Wagnon, P. Glacial and geomorphic effects of a supraglacial lake drainage and outburst event, Everest region, Nepal Himalaya. Cryosphere 2018, 12, 3891–3905. [Google Scholar] [CrossRef]
  41. Shean, D.E.; Bhushan, S.; Montesano, P.; Rounce, D.R.; Arendt, A.; Osmanoglu, B. A systematic, regional assessment of High Mountain Asia glacier mass balance. Front. Earth Sci. 2020, 7, 00363. [Google Scholar] [CrossRef]
  42. Hugonnet, R.; McNabb, R.; Berthier, E.; Menounos, B.; Nuth, C.; Girod, L.; Farinotti, D.; Huss, M.; Dussaillant, I.; Brun, F.; et al. Accelerated global glacier mass loss in the early twenty-first century. Nature 2021, 592, 726–731. [Google Scholar] [CrossRef]
  43. Yao, X.J.; Liu, S.Y.; Han, L.; Sun, M.P. Definition and classification systems of glacial lake for inventory and hazards study. Acta Geogr. Sin. 2017, 72, 1173–1183. [Google Scholar] [CrossRef]
  44. Yan, S.Y.; Liu, G.; Wang, Y.J.; Ruan, Z.X. Accurate determination of glacier surface velocity fields with a DEM-Assisted Pixel-Tracking Technique from SAR imagery. Remote Sens. 2015, 7, 10898–10916. [Google Scholar] [CrossRef]
  45. Aizen, V.B.; Mayewski, P.A.; Aizen, E.M.; Joswiak, D.R.; Surazakov, A.B.; Kaspari, S.; Grigholm, B.; Keachler, M.; Handley, M.; Finaev, A. Stable-isotope and trace element time series from Fedchenko glacier (Pamirs) snow/firn cores. J. Glaciol. 2009, 190, 275–291. [Google Scholar] [CrossRef]
  46. Yao, X.J.; Liu, S.Y.; Sun, M.P.; Wei, J.F.; Guo, W.Q. Volume calculation and analysis of the changes in moraine-dammed lakes in the north Himalaya: A case study of Longbasaba lake. J. Glaciol. 2012, 58, 753–760. [Google Scholar] [CrossRef]
  47. Kotlyakov, V.M.; Osipova, G.B.; Tsvetkov, D.G. Monitoring surging glaciers of the Pamirs, central Asia, from space. Ann. Glaciol. 2008, 48, 125–134. [Google Scholar] [CrossRef]
  48. Guillet, G.; King, O.; Lv, M.L.; Ghuffar, S.; Benn, D.; Quincey, D.; Bolch, T. A regionally resolved inventory of High Mountain Asia surge-type glaciers, derived from a multi-factor remote sensing approach. Cryosphere 2022, 16, 603–623. [Google Scholar] [CrossRef]
  49. Carrivick, J.L.; Tweed, F.S. A global assessment of the societal impacts of glacier outburst floods. Glob. Planet Chang. 2016, 144, 1–16. [Google Scholar] [CrossRef]
Figure 1. The geographic location of the Fedchenko Glacier and Tanymas Lake.
Remotesensing 15 02745 g001
Figure 2. The formation and expansion of Tanymas Lake. The (a) was derived from the KH-9 image, (be,g,h) were derived from the Landsat images, and (f,i) were derived from the Google Earth imagery. The green arrows in (d,e,f) indicate the ice broke off in August 2005.
Remotesensing 15 02745 g002
Figure 3. (a) Glacier-wide annual ice thinning rates between 2000 and 2016. The altitudinal distribution of the mean surface elevation change and glacier area for the Fedchenko (above 4500 m a.s.l.) (b), G072369E38769N (c), and Tanymas-5 Glaciers (d). Note the different scales of the glacier area in (bd).
Remotesensing 15 02745 g003
Figure 4. (a) Cumulative area changes of the Tanymas Lake, the Fedchenko terminus, and the Tanymas terminus; (b) the area variations of Tanymas Lake after 2005.
Remotesensing 15 02745 g004
Figure 5. (a) Glacier-wide average surface velocity between 1985 and 2018 derived from ITS_LIVE datasets; (bg) the calculation results of glacier surface velocity of the COSI-Corr tool.
Remotesensing 15 02745 g005
Figure 6. Mean monthly (a) and annual (b) air temperature and precipitation at Gorbunov station from 1935 to 1994.
Remotesensing 15 02745 g006
Figure 7. The area changes of ice-contact lakes (>0.1 km2) in HMA from 1990 to 2018. The polygon data of ice-contact lakes and glacier regions derived from Wang et al. [22] and The Randolph Glacier Inventory version 6.0, respectively.
Remotesensing 15 02745 g007
Table 1. List of the Landsat images used in this study.
Image IDDate of AcquisitionResolution/m
LT51510331994244ISP001 September 199430
LT51510331997252ISP019 September 199730
LE71510332000237SGS0024 August 200015
LE71510332005218PFS006 August 200515
LE71510332005234PFS0022 August 200515
LE71510332006237PFS0025 August 200615
LE71510332006253PFS0110 September 200615
LE71510332007256PFS0113 September 200715
LT51520332008226KHC0013 August 200830
LT51520332011250KHC007 September 201130
LE71510332012238PFS0025 August 201215
LC81520332013255LGN0112 September 201315
LC81520332015229LGN0117 August 201515
LC81520332016264LGN0020 September 201615
LC81520332017250LGN007 September 201715
LC81510332018230LGN0018 August 201815
LC81520332018253LGN0010 September 201815
LC81510332019265LGN0022 September 201915
LC81520332020259LGN0015 September 202015
LC81520332021261LGN0018 September 202115
LC81510332022257LGN0014 September 202215
Disclaimer/Publisher’s Note: The statements, opinions and data contained in all publications are solely those of the individual author(s) and contributor(s) and not of MDPI and/or the editor(s). MDPI and/or the editor(s) disclaim responsibility for any injury to people or property resulting from any ideas, methods, instructions or products referred to in the content.

