Article

Research on the Monitoring Ability of Fengyun-Based Quantitative Precipitation Estimates for Capturing Heavy Precipitation: A Case Study of the “7·20” Rainstorm in Henan Province, China

1
State Key Laboratory of Hydrology-Water Resources and Hydraulic Engineering, Hohai University, Nanjing 210098, China
2
School of Earth Sciences and Engineering, Hohai University, Nanjing 211100, China
3
College of Civil Engineering, Nanjing Forestry University, Nanjing 210037, China
*
Author to whom correspondence should be addressed.
These authors contributed equally to this work.
Remote Sens. 2023, 15(11), 2726; https://doi.org/10.3390/rs15112726
Submission received: 21 March 2023 / Revised: 16 May 2023 / Accepted: 22 May 2023 / Published: 24 May 2023
(This article belongs to the Special Issue Remote Sensing of Extreme Weather Events: Monitoring and Modeling)

Abstract

:
One of the important tasks of the Chinese geostationary and meteorological satellite Fengyun-2 (FY2) series is to provide quantitative precipitation estimates (QPE) with high spatiotemporal resolutions for East Asia. To analyze the monitoring capabilities of FY2-based QPEs in extreme rainfall events, this study comprehensively evaluated and compared the performances of FY-2G and FY-2H QPEs for the “7.20” rainstorm in Henan province, China from 17 July 2021 to 22 July 2021. Three continuous metrics and three categorical metrics were adopted to assess the accuracies of FY-2G and FY-2H QPEs, referenced by gauge observations from 116 meteorological stations. The results show that the FY-2G QPE has lower BIAS (−9.64% for FY-2G, −46.22% for FY-2H) and RMSE (5.83 mm/h for FY-2G, 8.4 mm/h for FY-2H) and higher CC (0.57 for FY-2G, 0.24 for FY-2H) than FY-2H QPE in this rainstorm event. Moreover, the FY-2G QPE is not only more consistent with the ground reference with respect to the rainfall amount, but also has higher detecting capability in the “7.20” rainstorm event when compared with the FY-2H QPE. The FY-2G QPE presented a higher capability to correctly capture the precipitation event for the “7.20” rainstorm because of higher POD (probability of detection) and CSI (critical success index) relative to FY-2H QPE, especially in complex topography. From the spatial distribution of precipitation amount, the FY-2G QPE captured the rainstorm center of extreme precipitation more accurately relative to the latest FY-2H product. On the other hand, the previous generation of FY-2G QPE was closer to the continuous rainfall process and precipitation duration with ground observations than the latest FY-2H QPE. Therefore, the precipitation retrieval algorithm of FY-2H QPE still had room to improve. It is necessary to introduce error correction algorithms, especially in complex topography for rainstorm events.

1. Introduction

Precipitation plays an essential role in the global water cycle [1,2,3]. Currently, extreme precipitation events occur frequently because of the warming of the global climate and the strengthening of ground evapotranspiration, such as floods, snowstorms, rainstorms, and typhoons [4,5]. Extreme precipitation events with short duration and heavy rainfall have a huge impact on social-economic development, ecological systems, human activities, and building facilities, particularly in the rainy summer months [6]. China is one of the countries that suffer from the most extreme climate disasters over the globe, so it is essential to accurately estimate, forecast, and analyze extreme precipitation events [5].
Over the past decades, more and more scholars have carried out research to monitor extreme precipitation events by using ground observation data [7,8,9]. For instance, Westra et al. [9] adopt the global ground observation dataset to measure the annual maximum daily precipitation temporal trends from 1900 to 2009, and the investigations suggest that two-thirds of ground observation stations present an increasing tendency. Ground observation could genuinely reveal real-time rainfall at gauge pixels by directly measuring the precipitation. However, meteorological stations are unevenly distributed across the Chinese mainland, with dense stations primarily concentrated in central and eastern China, while sparse stations cover western China [10]. Therefore, those point-based rain gauges cannot provide spatially continuous precipitation data, and it is still challenging to monitor extreme precipitation events over vast regions that are poorly gauged.
Benefitting from the development of satellite-borne sensors and precipitation retrieval techniques, satellite-based remote sensing offers a complementary perspective compared to ground-based rain gauges, by providing spatially continuous and temporally complete precipitation estimates with high quality on a global scale [11,12,13]. To date, many scholars have explored the performance and monitoring capability of satellite-based precipitation estimates in extreme precipitation events [14,15,16,17,18,19,20]. From some studies, Prakash et al. [21] comprehensively examined the detection capabilities of satellite-based precipitation estimates in India, and the research showed that the Integrated Multi-satellitE Retrievals for Global Precipitation Measurement (IMERG) has significant improvements in terms of capturing heavy rainfall compared to the Tropical Rainfall Measuring Mission (TRMM) Multi-satellite Precipitation Analysis (TMPA). Omranian et al. [22] investigated and analyzed the spatiotemporal performance of IMERG-Final for precipitation monitoring during hurricane events, and the findings indicate that the general performance of IMERG-Final is satisfactory in detecting the spatial variability for this heavy rainfall event. Talchabhadel et al. [23] evaluated the performance of different satellite rainfall products in capturing extreme precipitation events in the West Rapti River (WRR) basin of Nepal in August 2014. Aiming at the Beijing extreme heavy rainfall event of 21 July 2012, Huang et al. [24] reported the performance of the TMPA precipitation products (3B42RT and 3B42V7) in this extreme precipitation event. Their study manifests that two products could capture the spatiotemporal pattern of precipitation, while they underestimated the precipitation of the heavy rainfall event. Chen et al. [25] adopted the China Gauge-based Daily Precipitation Analysis (CGDPA) as a ground reference to investigate the performance and error characteristic of the TMPA 3B42 in extreme precipitation event over Chinese mainland, and the results indicated that extreme rainfall estimation values of TMPA 3B42 have a high consistency with CGDPA. Qi et al. [26] systematically assessed the detection capability of six near-real-time satellite-based precipitation estimates for super typhoon Lekima, which included IMERG, Global Satellite Mapping of Precipitation (GSMaP), and Climate Prediction Center morphing technique (CMORPH). Their results showed that IMERG-Late and CMORPH-RT outperformed other satellite precipitation products, particularly under higher rain rates [26].
However, besides the above-mentioned products, China has also independently developed satellite-based precipitation estimates. Among them, the Fengyun-2 (FY2) series satellite quantitative precipitation estimates (QPE) could be acquired in real-time (delay time is less than 1 h), so they are able to meet the real-time requirements for extreme precipitation monitoring. Furthermore, to our knowledge, there are some studies that only focus on evaluating the performance of Fengyun-based QPEs on different spatial scales [27,28,29]. However, studies investigating the spatiotemporal pattern, error characteristics, and detection capability of FY2-based QPEs for monitoring extreme precipitation are seldom found.
The aim of this study is to investigate the error characteristics of the FY2-based QPEs in the heavy rain event “7·20” over the Henan province. For that purpose, two mainstream Chinese satellite precipitation products (FY-2G and FY-2H) are adopted. This study is expected to offer a better understanding of FY2-based QPEs in terms of detection capability and monitoring ability for the heavy precipitation event, which will provide the impetus for the development of Chinese satellite precipitation data and corresponding applications.

2. Study Area, Datasets and Methods

2.1. Study Area

Our study focuses on the area within Henan province, which is located in Central China at 31°23′N–36°22′N and 110°21′E–116°39′E, with a total area of 167,000 km2. The Henan belongs to the continental monsoon climate in the transition from northern subtropics to the warm temperate zone, with the warm temperate zone in northern Henan and the subtropics in southern Henan. The distribution of precipitation is uneven in Henan province, with more rainfall in the southern and western mountains than in other regions, and about 50% of the annual rainfall is mainly concentrated in summer [30]. Figure 1a,b display the distribution of topography in eastern China and Henan province, respectively. It can be seen from Figure 1a,b that the Henan province has a diverse topography, with the terrain being high in the west and low in the east. The north, west, and south Henan sides are semi-circularly distributed along the provincial boundary by Taihang Mountain, Funiu Mountain, Tongbai Mountain, and Dabie Mountain. The middle and east Henan comprise the Huang-Huai-Hai alluvial plain, and southwest Henan is the Southwest Basin. In Figure 1b, number identifiers I–IV represent the Haihe river, Yellow river, Yangtze river, and Huaihe river basins, respectively. Furthermore, Figure 1c shows the spatial distribution of meteorological stations over the Henan province.
Since 17 July 2021, continuous heavy rainfall has occurred in most parts of Henan province, which is causing enormous harm to society, economy, and personnel. According to reports and records from the Meteorology Bureau, the heavy rainfall in Henan province mainly suffered the influence of the typhoon “fireworks”. Under the guidance of the western Pacific subtropical high pressure and the continental high pressure, a large amount of water vapor was continuously transported from the sea to the land by the easterly wind, and then gathered into rain in Henan province. After the easterly airflow encounters complex terrain (Taihang Mountains and Funiu Mountains) in Henan province, the center of heavy rainfall is mainly distributed in the western and northwestern Henan, resulting in prolonged periods of precipitation [31]. Therefore, accurate estimation, prediction, and analysis for extreme precipitation events are crucial missions.

2.2. Satellite Precipitation Estimates

The FY2 meteorological satellite is the first-generation geostationary-orbiting meteorological satellite developed by China. Among them, the G star in FY2 (FY-2G) is the second satellite in the FY2 series (batch 03), which was successfully launched on 31 December 2014. It has been positioned over the equator at 99.2 degrees east longitude since 16 April 2018, and provides observation services. H star in FY2 (FY-2H) is the last satellite in the FY2 series (batch 03). It was successfully launched on 5 June 2018, positioned at 79 degrees east longitude, and, for the first time for Chinese geostationary meteorological satellites, could reach a third of the Earth’s areas continued observations from Oceania to Central Africa.
Both FY-2G and FY-2H are equipped with the stretched Visible and Infrared Spin Scan Radiometer (VISSR), which could provide cloud top temperature (CTT), land surface temperature (LST), QPE, outgoing longwave radiation (OLR), precipitation index (PRI), and other meteorological element data. Among them, the QPE mainly includes precipitation products of 1-h, 3-h, 6-h, and 24-h. In this study, two hourly satellite-based precipitation datasets (FY-2G and FY-2H) with spatial resolution of 0.1° were adopted. It is noted that the FY-2G and FY-2H have the same temporal scale and spatial resolution (the “9210” format is 0.1° and the nominal format is 5 km), while they have differences in the numerical range and spatial distribution. After registration, the FY2-based QPEs can be downloaded from the National Satellite Meteorological Center (NSMC) Data Service website (http://satellite.nsmc.org.cn/PortalSite/Data/Satellite.aspx, accessed on 1 July 2022).

2.3. Ground Reference

Two satellite precipitation products are evaluated against one ground-based rain gauge data in our study. This study selected the newly-released Hourly Data From Surface Meteorological Stations in China developed by the National Meteorological Information Center (NMIC) of the China Meteorological Administration (CMA) as reference data. Among them, the real-time station data has undergone quality control. The actual rate of each element data exceeds 99.9%, and the correct rate of the data is close to 100%. The dataset can be downloaded after registration with the NMIC. This paper selects the observed precipitation data driven from 116 meteorological stations in Henan province, and Figure 1c presents the spatial map of the meteorological station locations.

2.4. Methods

To quantitatively compare the performance of FY2-based QPEs in this extreme precipitation event, three continuous metrics and three categorical metrics were adopted in this study. The correlation coefficient (CC) describes the agreement between satellite precipitation data and ground observation. The root mean square error (RMSE) measures the average error magnitude and dispersion of satellite precipitation data and ground observation. The relative bias (BIAS) can reflect the degree of systematic deviation in the satellite precipitation product. In addition, this study adopted three categorical metrics to describe the detection capabilities of FY2-based QPEs, including the probability of detection (POD), false alarm rate (FAR), and critical success index (CSI). In this study, 0.2 mm/h was used as the rain/no-rain discriminant threshold as suggested by many previous studies. The formulas and perfect values of these metrics are listed in Table 1 [10,29]. The concept of hit precipitation, missed precipitation, and false precipitation of satellite data against ground observation was plotted in Figure 2 [32]. To easily analyze the temporal variation of FY2-based QPEs capturing the precipitation in this rainstorm event, the Coordinated Universal Time (UTC) of FY2-based QPEs and ground observations are rematched to Chinese Standard Time (CST) in this study.

3. Results

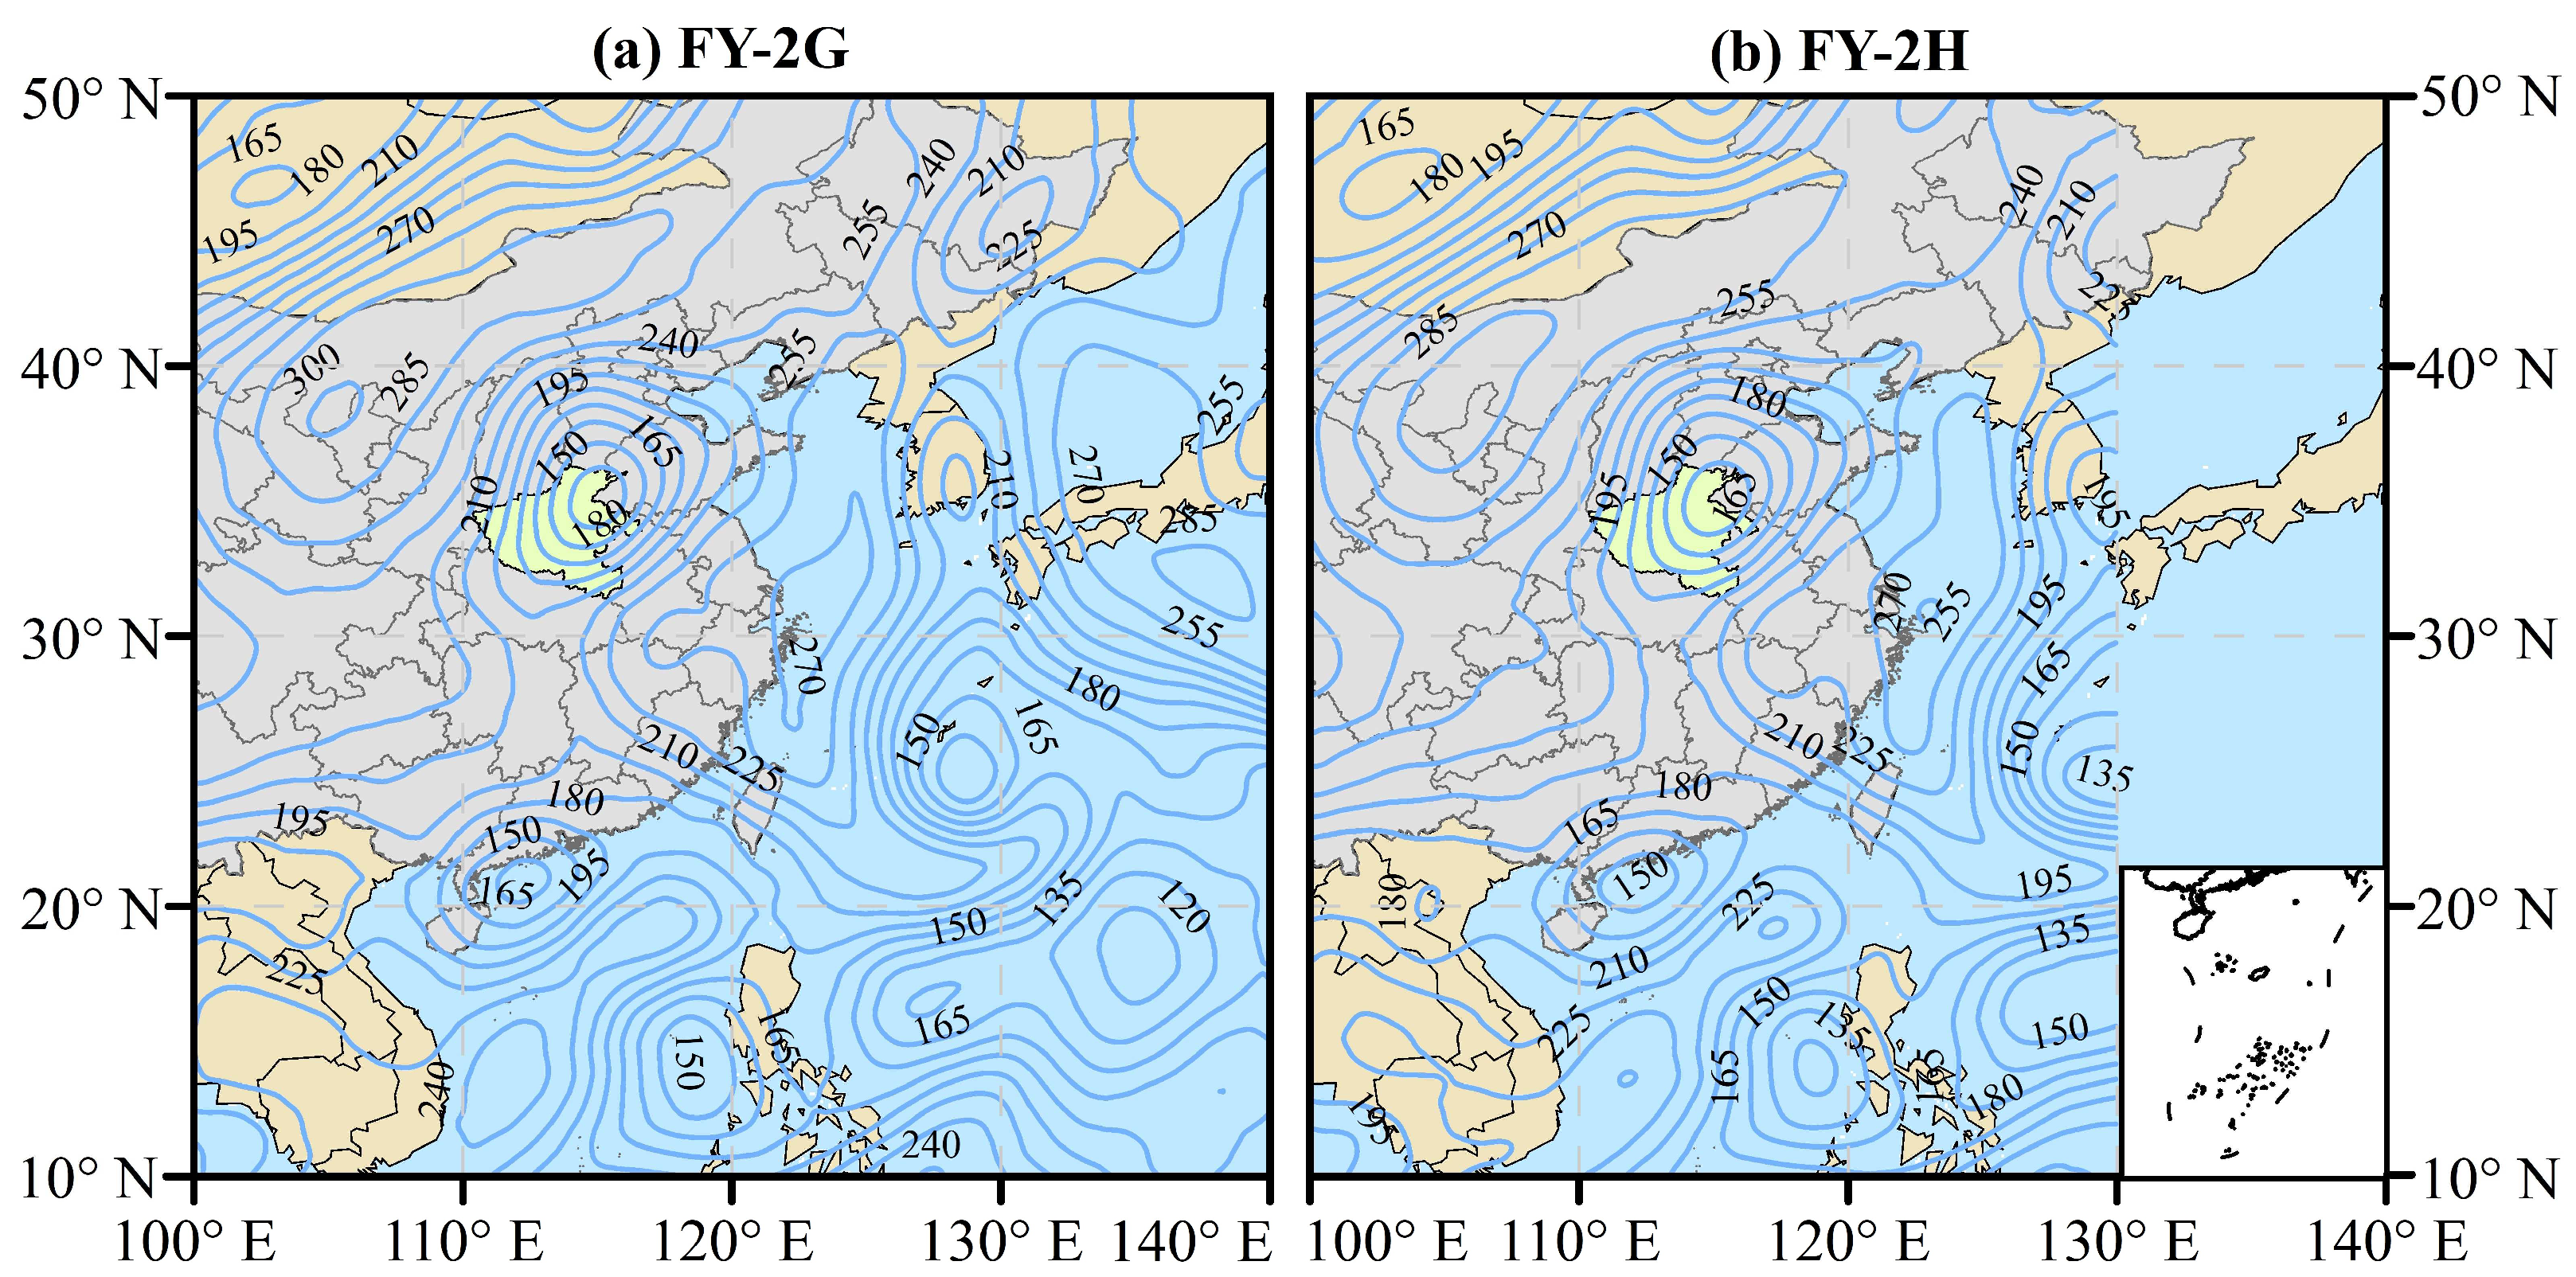
3.1. OLR and Moisture Transport

The OLR refers to the electromagnetic wave energy density of all wavelengths radiated from the top of the Earth’s atmosphere into space, measured in W/m2 [33]. It can reflect the climate and cloud cover conditions of the observed area and has a wide range of applications in meteorological research [33]. In general, the band of low values in the daily average OLR field is a good indicator of the path forecast for typhoons [34,35].
Figure 3 shows the spatial distribution of OLR derived from FY-2G and FY-2H over the eastern Asia on 20 July 2021. It is worth to note that the two FY2-based OLRs don’t fully cover the Chinese mainland, with the latitude band of two FY2-based OLRs below 50°N, while the longitude band of FY-2H OLR is below 130°E. From Figure 3, the two sets of FY2-based OLR products exhibit similar spatial characteristics. The OLR high-value areas on the eastern side of Chinese mainland reflect the boundary range of the subtropical high-pressure system, while the high-value areas on the western side reflect the boundary range of the continental high-pressure system. In addition, Liang et al. [36] pointed out that the OLR low-value area can reflect the moisture transport during a wide-ranging rainfall period. Taking Figure 3a as an example, we can clearly see that there are lower OLR values on the northeastern Hainan province and the eastern Taiwan province in southern China, in agreement with the locations of typhoons “Chapaka” and “Fireworks,” respectively. The moisture carried by typhoon “Fireworks” reached the northern part of Henan province along the edge of the subtropical high-pressure system, while the moisture transported by typhoon “Chapaka” moved northward to the northern part of Henan province. Therefore, under the combined influence of these two typhoons, it resulted in heavy rainfall in Henan province.

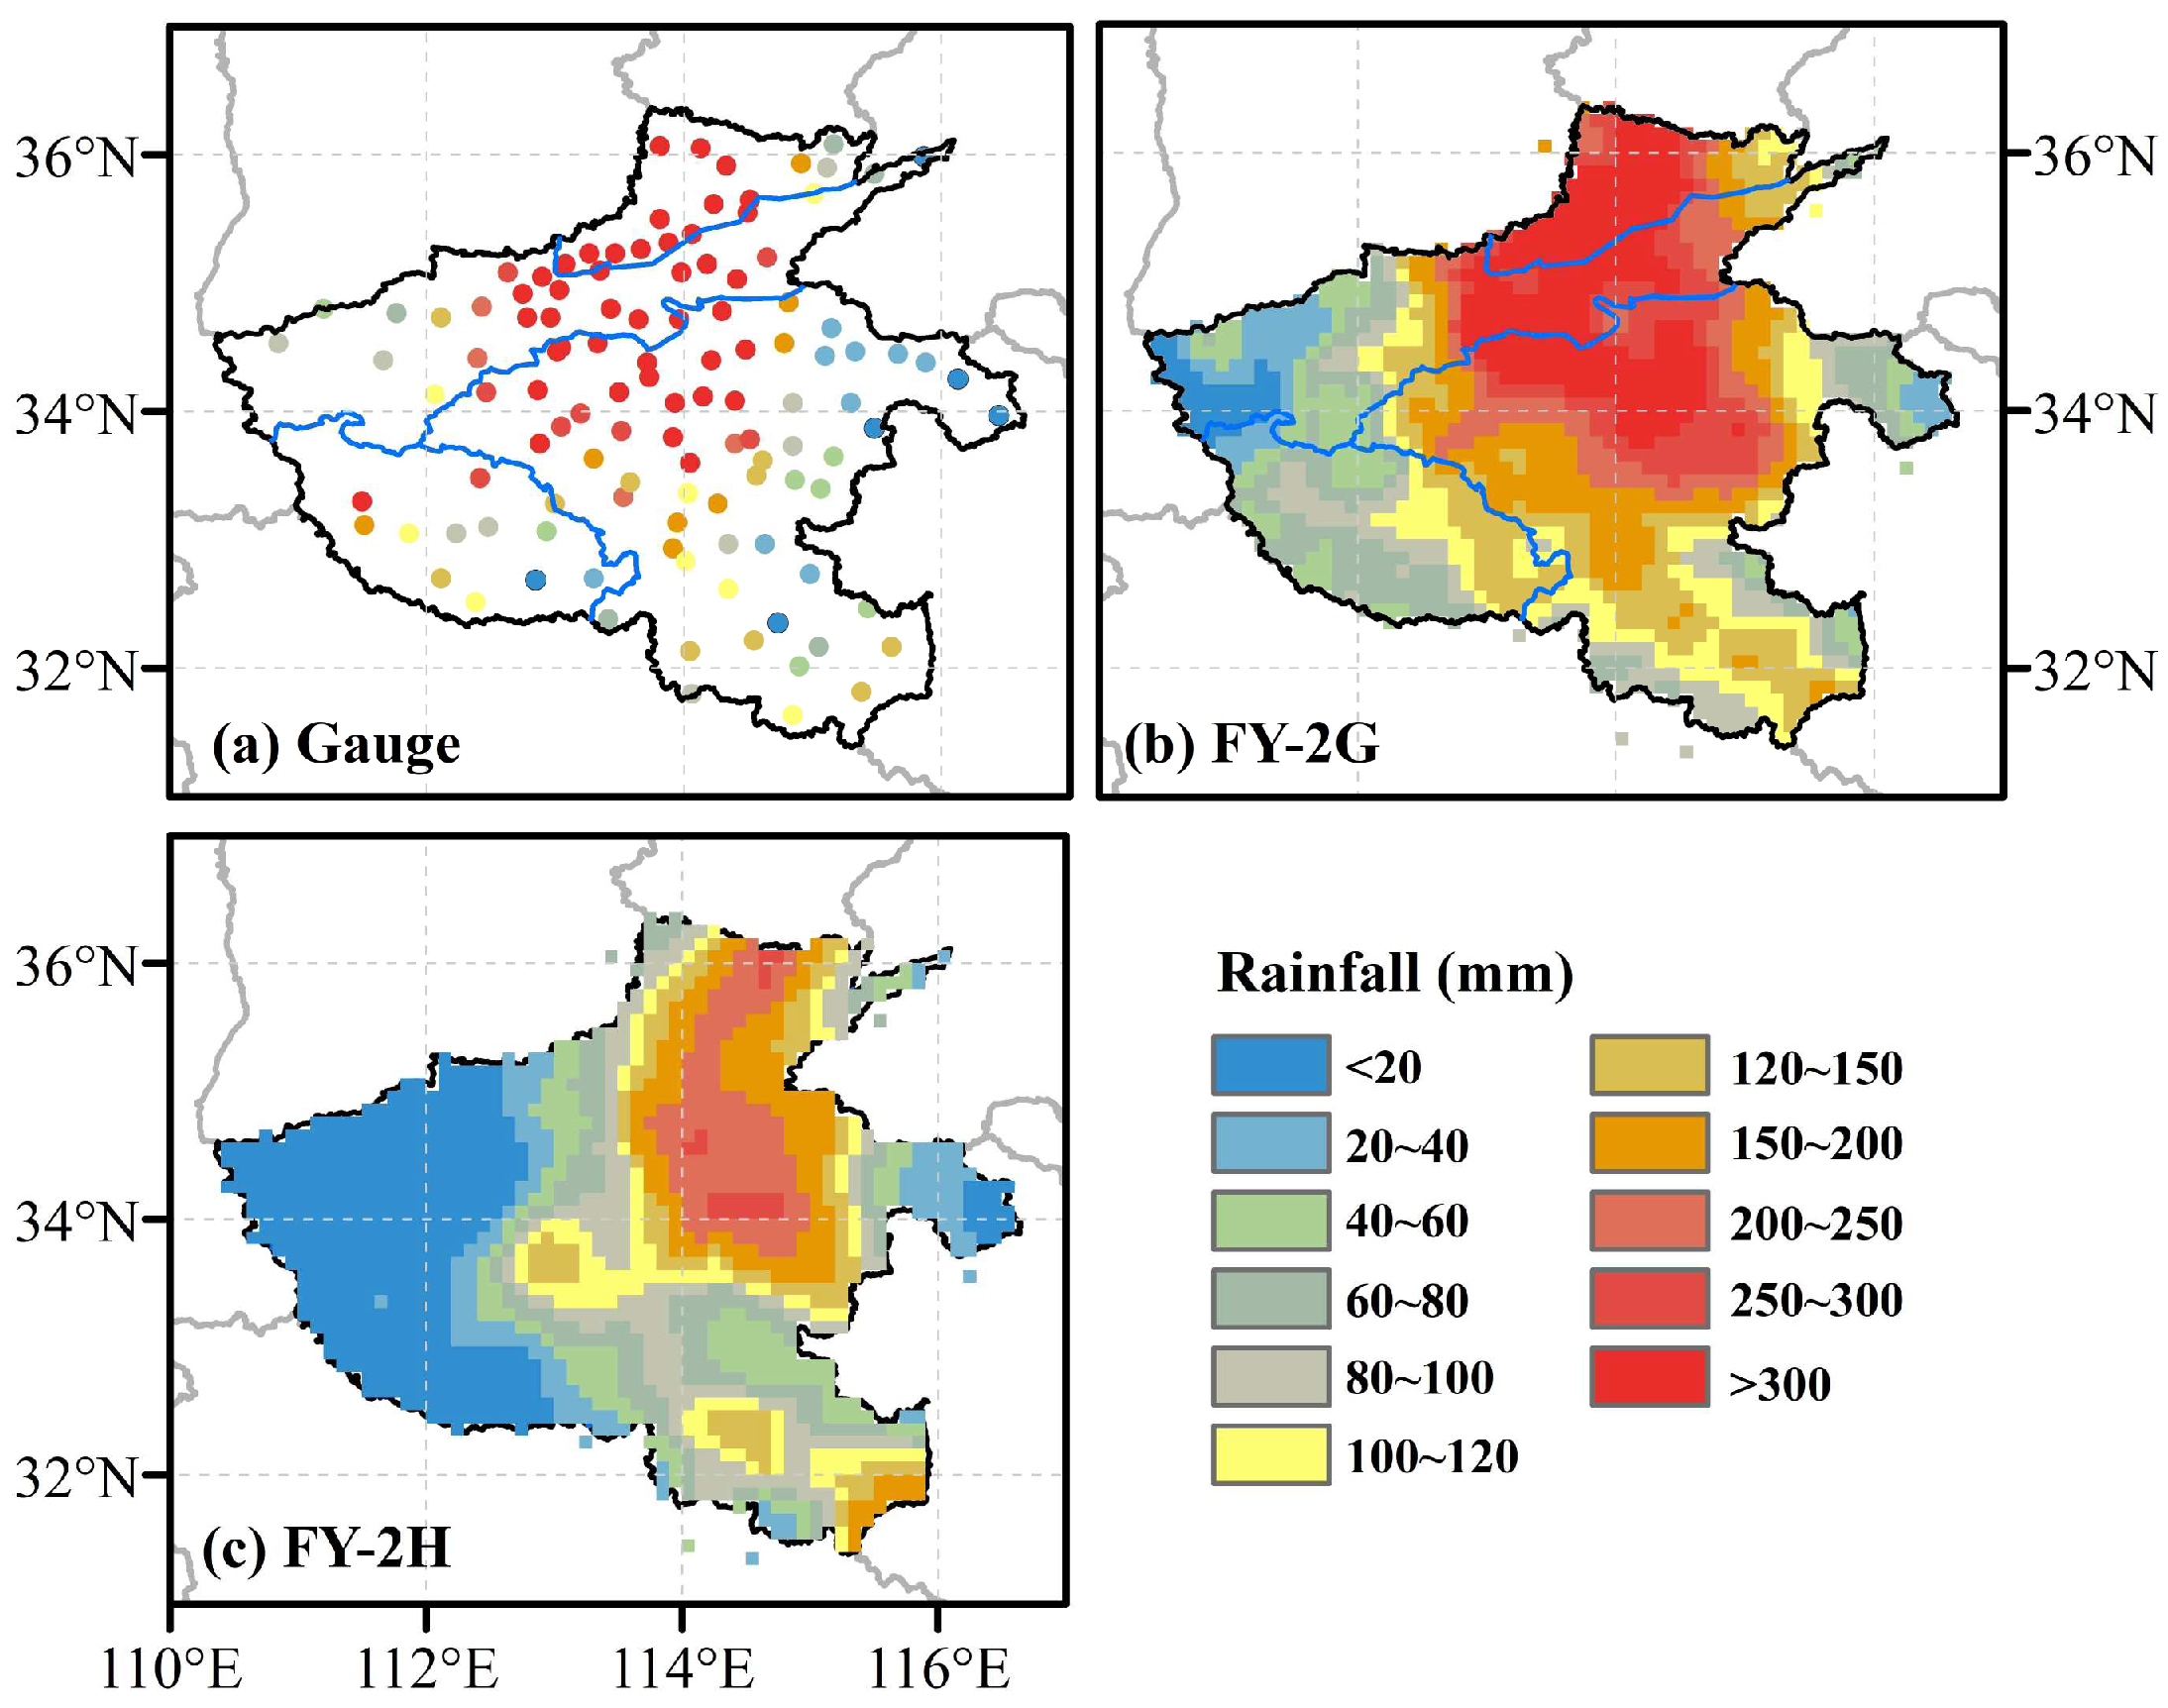
3.2. Spatial Pattern of Precipitation

Figure 4 shows the spatial distribution of hourly accumulated precipitation over the Henan province derived from FY-2G and FY-2H QPEs, as well as ground observations during 17–22 July 2021. Overall, the FY-2H QPE failed to accurately capture the spatial characteristics of precipitation for this strong rainy event over the Henan province when compared with the FY-2G QPE. Specifically, from the rainfall distribution of ground observation (Figure 4a), we found that the central and northern parts of the Henan province have heavy rainfall, and its cumulative rainfall exceeds 300 mm. Zhengzhou city and Xinxiang city have large amounts of rainfall, which gradually weakened in the surrounding areas. On the other hand, the distribution of hourly accumulated precipitation of FY-2G QPE is more consistent with ground observations than FY-2H QPE, while the FY-2H QPE significantly underestimated the precipitation amount of the rainstorm center in the “7.20” rainstorm event.
Figure 5 shows the spatial distribution of hourly maximum rain rate over the Henan province derived from two FY2-based QPEs and ground observations during 17–22 July 2021. For ground observations, the highest values of hourly maximum rain rate from rain gauges are mainly concentrated in northern parts of Henan province. In general, the hourly maximum rainfall of the two FY2-based QPEs are lower than the ground observation. Compared to FY-2H QPE, the spatial distribution of hourly maximum rainfall derived from FY-2G QPE is closer to ground observation. However, the highest value of FY-2H QPE in terms of hourly maximum rainfall is mainly distributed in the eastern part of Henan province, which did not accurately detect the rainstorm center of this event. This is consistent with the spatial distribution of its accumulated rainfall. On the other hand, the hourly maximum rain rates of FY-2G and FY-2H QPEs indicate that they generally underestimate the rainfall amount. This is possibly due to the precipitation retrievals of FY2-based QPEs, which are indirect, and the link between CTT information derived from IR instruments and precipitation is often weak, which leads IR-based sensors to provide crude precipitation estimates [37]. Hence, precipitation estimates derived from purely IR retrievals produce large errors and are prone to underestimating the precipitation of rainstorm event [24,38,39,40]. With respect to the intercomparison between FY-2G and FY-2H QPEs, the FY-2H QPE has poor performance with lower hourly maximum rain rate values compared to ground observations in western Henan.
In this study, we assume that if no precipitation occurs within two consecutive hours after the occurrence of a precipitation event, the precipitation process is determined to be over [41]. The precipitation duration of a specific rainfall event is the duration from the beginning to the end of this precipitation event. Figure 6 shows the spatial distribution of precipitation duration over the Henan province derived from two FY2-based QPEs and ground observations during 17–22 July 2021. Figure 6a indicates the average precipitation duration of the “7·20” rainstorm event in the north and central of Henan province beyond 10 h. It suggests that the precipitation duration also is one of the destructive factors in severely affected areas, except for the maximum rainfall. It is noted that FY-2G and FY-2H QPEs have different spatial patterns in terms of the precipitation duration. From Figure 6b,c, the biggest difference between FY-2G and FY-2H QPEs is mainly distributed in the central, western, and southwest of Henan province. In addition, the maximum value of the rainfall duration from FY-2G QPE is still distributed in the rainstorm center with highest cumulative rainfall values. The distribution of FY-2G QPE precipitation duration is significantly longer than that of FY-2H QPE and is more consistent with the ground observations, especially in western Henan with complex terrain, suggesting that FY-2H QPE performs worse than FY-2G QPE in capturing the precipitation in complex topography.

3.3. Extreme Precipitation Monitoring

Since rainstorms are short-duration heavy rainfall events, the detection capability is a crucial evaluation metric to assess performances of satellite precipitation estimates. Figure 7 portrays the time series of hourly average rainfall for two FY2-based QPEs and ground observations from 00:00 on 17 July 2021, to 23:00 on 22 July 2021. In general, FY-2G QPE was more consistent with ground observations than FY-2H QPE. From ground observations, the mean hourly precipitation of the “7.20” rainstorm event presents a gradual increasing and then decreasing trend. The ground observation data demonstrated a significant ascending trend from the 49th hour to the 96th hour, with highest rainfall amounts from 20 July to the early morning of 21 July. The FY-2G QPE captured the precipitation process with times close to ground observations compared to the FY-2H QPE. As for satellite data, the duration trend of hourly average rainfall of FY2G QPE is consistent with the ground observations, but the precipitation amount from the 1st to the 24th hour and 113th to 144th hour was slightly overestimated. FY-2H QPE had significant underestimation against the baseline, especially during 44th to 93th hours. It indicates that FY-2G QPE could capture the rainstorm process and temporal characteristic of the “7.20” event compared to FY-2H QPE. From temporal results, the precipitation retrieval algorithm of FY-2H QPE still has room to capture the process of the heavy precipitation event at an hourly scale.
Figure 8 shows the time series of hourly accumulated precipitation between two FY2-based QPEs and ground observations from 0:00 on 17 July 2021 to 23:00 on 22 July 2021, in Henan province. With respect to the intercomparison between FY-2G and FY-2H QPEs in terms of hourly accumulated precipitation, the FY-2G QPE showed higher CC (0.9977 for FY-2G, 0.9833 for FY-2H), lower BIAS (25.31% for FY-2G, −26.24% for FY-2H), and lower RMSE (28.99 mm for FY-2G, 41.01 mm for FY-2H) than FY-2H QPE. From Figure 7, the FY-2H QPE severely underestimated the precipitation amount of the “7.20” rainstorm, also suggesting that FY-2H QPE failed to accurately estimate the hourly rainfall in this extreme precipitation event. Moreover, although the hourly accumulated rainfall of FY-2G QPE is closer to the ground observations, we found that the FY-2G QPE slightly overestimated the precipitation. From the above results, we speculate that different sub-satellite points longitude and satellite-borne device versions may result in continuous metrics between their QPE and ground observations having significant differences.

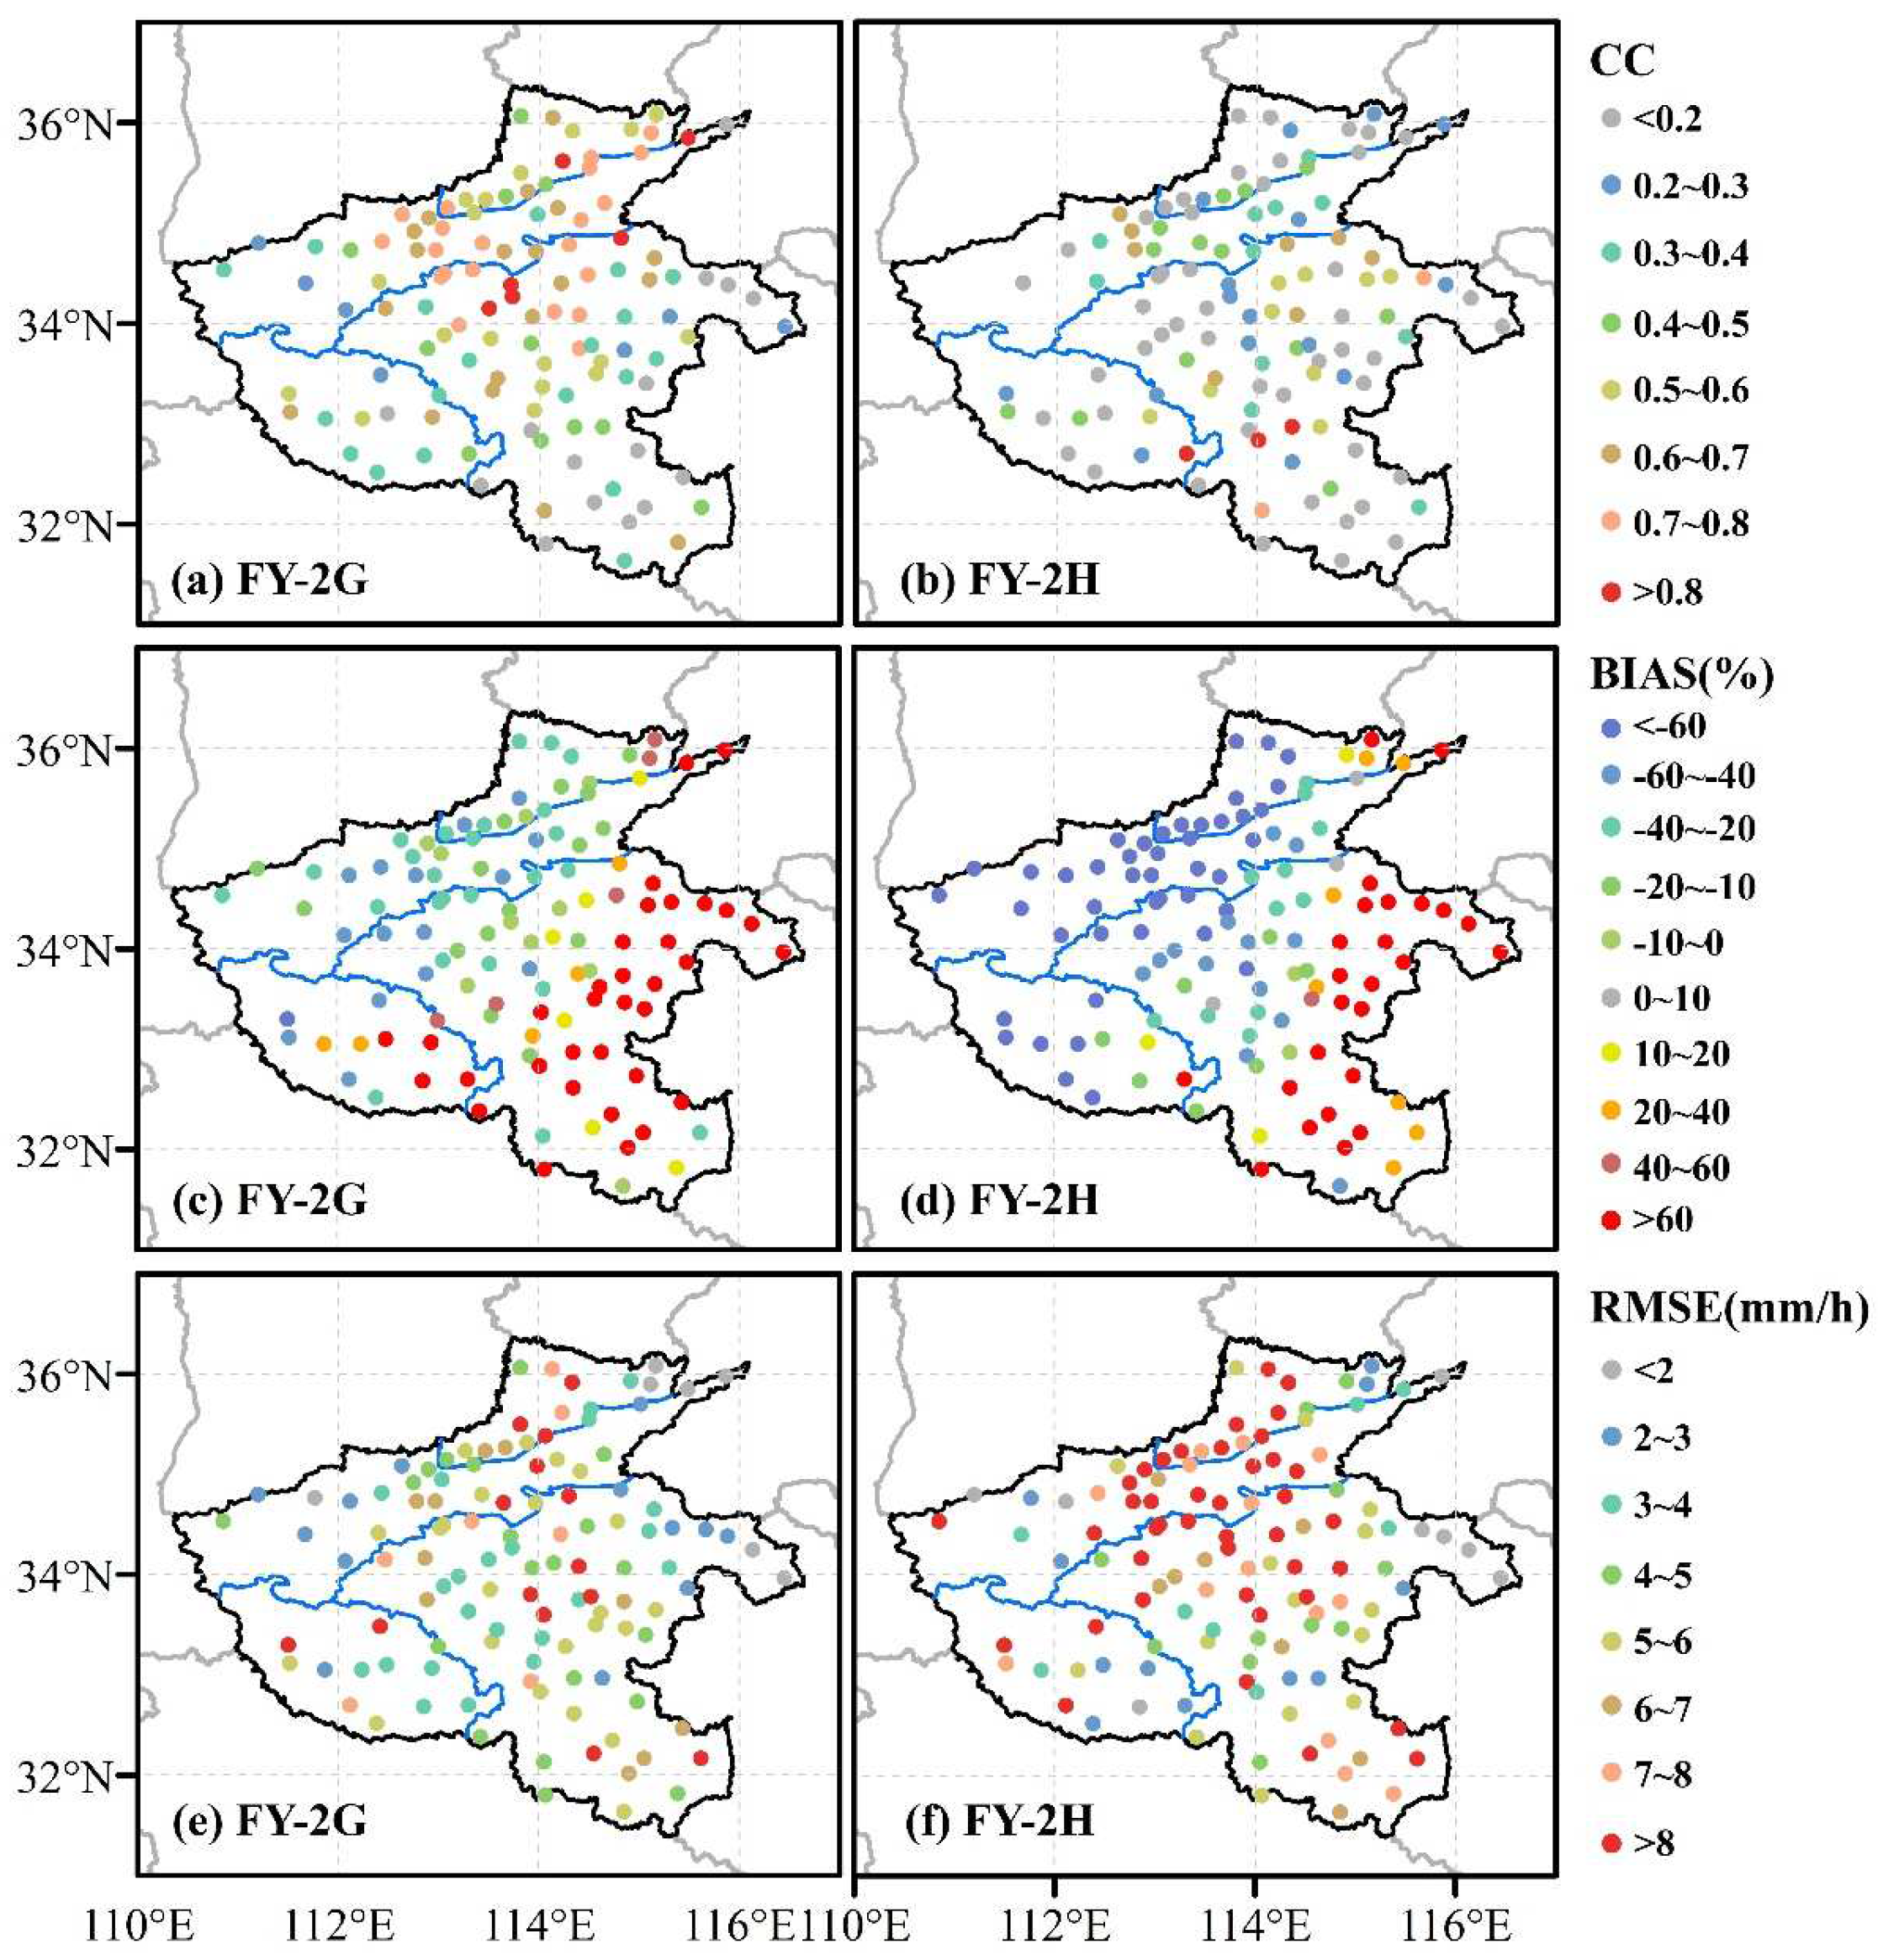
3.4. Statistical Performance

Figure 9 displays the spatial distributions of POD, FAR, and CSI derived from FY-2G and FY-2H QPEs against the ground observations. In this study, a threshold of 0.2 mm/h is adopted to distinguish the rainy and no-rain event at hourly scale. Compared to the FY-2H QPE, the FY-2G QPE exhibited a better performance with POD values (≥0.8) at most gauges, particularly over the Huaihe River Basin and eastern Yangtze River Basin. It indicates that FY-2H QPE failed to accurately detect the rainstorm center areas of the “7.20” rainstorm event relative to FY-2G QPE. In addition, FY-2H QPE has significantly lower POD values in western Henan than in other regions, demonstrating that the complex topography could affect the detecting accuracy of the FY2-based QPEs. As for the FAR, the FAR values of FY-2G and FY-2H QPEs have similar spatial patterns over Henan province. In addition, we found that FY2-based QPEs have a higher FAR value in the east of Henan province than in other areas. This is because the rainstorm mainly occurred in central and northern Henan province, while less rainfall occurred in eastern Henan province, resulting in higher FAR values of FY2-based QPEs in the corresponding region. For a comprehensive assessment metric of POD and FAR, FY-2G QPE gains the higher CSI values than FY-2H QPE at most gauges, even in areas with complex topography, suggesting that the precipitation retrieval algorithm of FY-2H QPE still has room for topography correction.
To analyze the error distribution characteristics of FY-2G and FY-2H QPEs, the spatial maps of the temporal continuous metrics (i.e., CC, BIAS, and RMSE) for the FY-2G and the FY-2H QPEs in Henan province are plotted in Figure 10. In contrast with FY-2H QPE, FY-2G QPE shows better performances with higher CC and lower BIAS and RMSE values. In terms of CC, the FY-2G QPE notably outperforms the FY-2H with CC values higher than 0.3 at most gauges, especially in Haihe River Basin, eastern Yellow River Basin, and north Huaihe River Basin. As for BIAS, both FY-2G and FY-2H QPEs underestimate the precipitation amount in Haihe River Basin, the eastern Yellow River Basin, and the Huaihe River Basin. This means that both FY2-based QPEs tend to underestimate the precipitation in the rainstorm center for the “7.20” rainstorm event in Henan province. Furthermore, FY-2H QPE exhibits more severe underestimations than FY-2G QPE, particularly for the western Henan. We speculate that the sub-satellite point (orbit) positions of satellite-borne sensors from FY-2G are closer to the Chinese mainland than FY-2H, and precipitation estimates derived from purely IR retrievals easily understate the geographic rains over complex topography [37,42]. In the case of RMSE, two FY-2 based QPEs have different spatial patterns, while the RMSE values of the FY-2G QPE are significantly smaller than those of the FY-2H QPE.

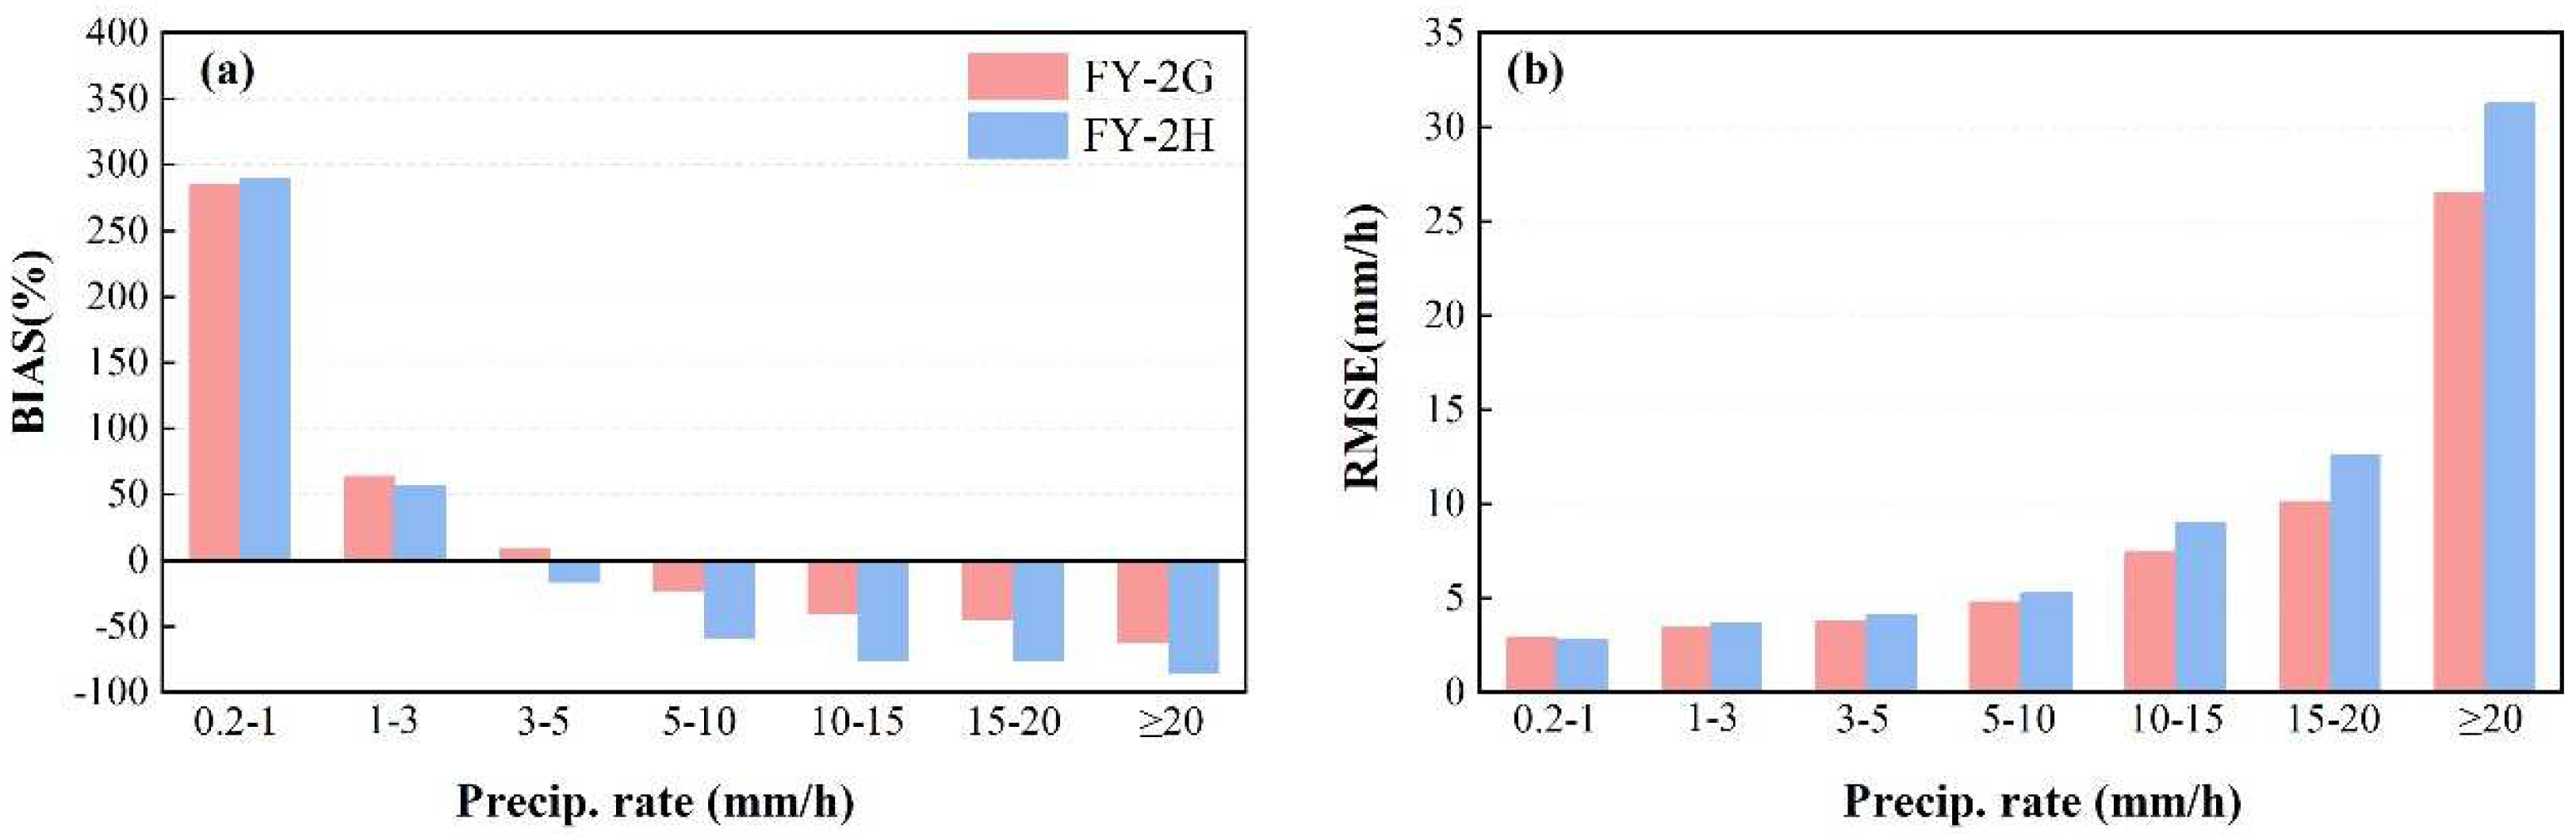
3.5. Error Characteristics under Different Rain Rate

The categorical statistical metrics for FY-2G and FY-2H QPEs under the different precipitation intensity ranges are plotted in Figure 11. Generally, the FY-2G QPE notably outperforms FY-2H QPE in terms of the detecting capability, which is already manifested in their statistical performance. The FY-2G QPE has higher POD values than FY-2H QPE at all rain rate ranges. This implies that the FY-2H QPE does not improve the ability for capturing the rainy events relative to the FY-2G QPE. From Figure 4 and Figure 6, the FY-2H QPE significantly underestimated the rainfall amount and the average precipitation duration than ground observations and FY-2G QPE, which may be because the FY-2H QPE has lower POD values than that of FY-2G QPE. Although FY-2H QPE alleviates the FAR values under low rain intensities (1–10 mm/h) relative to FY-2G QPE, it has higher FAR values than FY-2G QPE at high rainy rates (>10 mm/h). The higher (lower) CSI values of FY-2G (FY-2H) QPE are mainly attributed to its higher (lower) POD values. The conclusion could be drawn from the results described above that FY-2G QPE has better performance for capturing rainy events than FY-2H QPE across the spectrum of rain rate ranges.
To further evaluate the consistency of FY-2G and FY-2H QPEs with ground observations across different rainfall intensities, the continuous metrics were calculated at different precipitation rates in Figure 12. FY-2G QPE exhibits a higher agreement with ground observations at most precipitation rate ranges than FY-2H QPE, with lower BIAS and RMSE values. Although FY-2H QPE slightly reduced the BIAS values relative to the FY-2G at the low rain-rate range of 1–3 mm/h, FY-2G QPE still showed lower BIAS values than the FY-2G QPE beyond the rain rate of 3 mm/h, which is consistent with the severe underestimations of FY-2H QPE over western and north Henan in Figure 10. This could be attributed to the significant low POD values of FY-2H QPE at all rain-rate ranges (Figure 11). In terms of RMSE, the FY-2H QPE showed slightly lower RMSE values than FY-2G QPE below the rain rates of 1 mm/h, but it does not outperform FY-2G QPE beyond such rain-rate threshold.

3.6. Overall Performance

To assess the overall performance of different QPEs, the scatter diagrams of two FY2-based QPEs and ground observation were plotted in Figure 13. For CC, the FY-2G QPE showed a higher CC value than FY-2H QPE (0.57 for FY-2G, 0.24 for FY-2H) in the “7.20” heavy rainfall event. However, both FY-2G and FY-2H QPEs have negative BIAS values (−9.64% for FY-2G and −46.22% for FY-2H), indicating that they tend to underestimate the rainfall amount of the extreme precipitation event, especially for FY-2H QPE. It is consistent with the spatial pattern of hourly accumulated precipitation and hourly maximum rain rate, as well as the corresponding precipitation duration. In addition, the FY-2G QPE has a lower overall RMSE value than FY-2H QPE. Although the FY-2H has an improvement in satellite-borne devices compared to FY-2G, its QPE generally has poorer performance than the previous generation product of FY-2G QPE, which suggests that the precipitation retrieval algorithms of FY-2H QPE still need to be improved for heavy rainfall events.

4. Discussion

According to the results demonstrated above, this study found that two FY2-based QPEs underestimate the precipitation for “7·20” heavy precipitation event in Henan province. This is possibly due to the fact that the FY2-based satellite-borne sensors mainly measure the information of cloud tops, and the estimated precipitation derived from IR instruments was prone to underestimate the precipitation of this event [27,40,43]. The principle of precipitation retrieval algorithms for the FY2-based QPEs is briefly summarized as follows [29,33]. Firstly, the FY2 satellite adopts the VISSR to measure the infrared brightness temperature of the cloud top in the observation area, and the gradient of cloud top temperature is calculated using statistical analysis methods, which is used as an auxiliary factor for the precipitation regression analysis. Then, the relationship between the cloud top temperature gradient and the precipitation intensity is established to estimate precipitation. Finally, the ground observation is adopted to calibrate the estimated FY2-based satellite precipitation data. We speculate that their performance differences in this extreme rainfall event may be related to their satellite-borne sensors, the location of sub-satellite point, and sensor attitude.
From the algorithm mentioned above, both FY-2G and FY-2H QPEs are equipped with VISSR devices. In practice, they do not merge and interpolate any microwave estimates, which undoubtedly increases the uncertainty of land precipitation retrieval. Furthermore, as the indirect approach of measurement precipitation, satellite-based precipitation estimates inevitably contain some errors at different temporal and spatial scales, such as systematic biases and random errors [44]. On the other hand, with the increase of precipitation intensities, the overall trend of the cloud top temperature gradient is rising slowly, then slowing down, and finally becomes gradually stable, which caused some uncertainty in the FY2-based QPEs under different rainfall intensities.
Figure 14 shows the variation of three categorical metrics for the FY2-based QPEs with changes of elevation ranges. Generally, in this rainstorm event, FY-2G outperformed FY-2H across the most elevation range in Henan province, with the higher POD and CSI values. From the distribution of POD, FY-2G and FY-2H QPEs exhibited similar decreasing trends as altitude increases. This indicates that the two FY2-based QPEs have poorer detection capabilities in complex terrain areas than in flat terrain areas. As for FAR, FY-2G QPE had slightly higher FAR values than FY-2H when the elevation was below 0.3 km, and FY-2H QPE had significantly higher FAR values with the elevation exceeding 0.3 km for this event. Overall, FY-2H QPE did not display significant improvement in FAR relative to FY-2G QPE. In terms of comprehensive indicators, except for elevation ranges below 0.05 km, FY-2G QPE had higher CSI values than FY-2H QPE, and the advantage of FY-2G QPE was more pronounced in higher terrain areas relative to FY-2H QPE. It indicates that in this extreme rainfall event, FY-2G QPE had better monitoring capabilities in complex terrain areas than FY-2H QPE, this is consistent with their spatial distribution.
This could be attributed to the major reason: western Henan province mainly contains mountains and hills, and orographic rain is often occurred in these areas. FY2-based QPEs are estimated by adopting CTT and precipitation intensities from IR-based datasets to calculate rainfall information. However, rainfall characteristics of orographic rain could not accord with the hypothesis of this precipitation retrieval algorithm [12]. In other words, precipitation of IR-based CTT retrievals cannot detect warm orographic rain, which leads to underestimation of orographic rains over complex topography [37]. Therefore, FY2-based QPEs have low accuracy for this heavy precipitation brought by typhoons and orographic rain in complex-terrain areas. Furthermore, the FY2-based QPEs have higher detection capability in high rainfall intensity ranges than in low rainfall intensity ranges. This could be attributed to the simplistic approach adopted by the infrared-based precipitation retrieval, which relies on the principle that “colder clouds are more likely to generate precipitation [45].” In simpler terms, clouds with lower temperatures are more likely to yield heavy rainfall, which makes the infrared-based retrieval method have a greater ability to detect high-intensity rain events. However, for light rain events, such retrieval approach has a relatively poor relationship between precipitation rates and cloud temperature [46].
Figure 15 shows the distribution of the two continuous metrics for FY2-based QPEs with changes of elevation ranges. In terms of BIAS, the FY-2G QPE has higher BIAS values than FY-2H in the elevation range below 0.05 km, which may be due to the fact that FY-2G QPE has higher FAR values in this range. When the elevation exceeds 0.05 km, the FY-2 QPEs underestimated the precipitation in this rainstorm event, and underestimation of FY-2H QPE was the more severe relative to FY-2G QPE. Regarding to RMSE, FY-2G QPE has lower RMSE values than FY-2H throughout the entire terrain distribution ranges. In summary, in this extreme rainfall event, FY-2H QPE performed poorly in elevation distribution compared to FY-2G.
A possible reason for FY-2G QPE outperforming FY-2H QPE is that the orbit positions of FY-2G are closer to the Chinese mainland. The sub-satellite point of FY-2H over the Indian Ocean is 79°E, enabling China’s geostationary meteorological satellites for the first time to continuously observe one-third of the Earth from Oceania to Central Africa. While the sub-satellite point of FY-2G is above the equator at 99.5°E, the observation center of FY-2G is much closer to Chinese mainland than FY-2H. This results in their rainfall estimate values having an obvious difference due to IR-based remote sensing data from the different orbit positions. In addition, the difference in design, calibration, sensor attitude, and service life of the sensors carried by FY-2G and FY-2H could also be why they have different accuracy.
In general, as a high-resolution satellite precipitation dataset independently developed by China, the FY-2G QPE outperforms FY-2H QPE in this “7·20” extreme precipitation event. Because the satellite data of a short temporal period and a small spatial area were adopted in this study, it is difficult to evaluate the overall performances of FY-2G and FY-2H QPEs in Chinese mainland during a relative long period. In the future, data developers need to modify rainfall retrieval algorithms considering microwave and other data sources to reduce the rainfall errors.

5. Conclusions

In this study, the performances of two Chinese FY2-based (FY-2G and FY-2H) QPEs were systematically investigated in the “7·20” heavy rainfall event, using ground observations from 116 rain gauges as reference over the Henan province. This study adopts three continuous metrics and three categorical metrics to compare the performances of FY2-based QPEs, from the perspectives of the spatial pattern of precipitation, temporal precipitation monitoring, spatial performance with statistical indicators, precipitation intensity distribution, and overall metrics. The main conclusions of this study were drawn as follows:
  • We found that both FY-2G and FY-2H QPEs significantly underestimate the precipitation amount for the “7.20” event: FY-2G with a BIAS value of ~−9.64%, and FY-2H with a BIAS value of ~−46.22%. FY-2H QPE exhibits more severe underestimations than FY-2G QPE for this rainstorm event over Henan province. This is possibly because the FY2-based satellite-borne sensors mainly measure the information of cloud tops, and the link between CTT information derived from IR instruments and precipitation is often weak. It leads to IR-based sensors providing crude precipitation estimates, and those estimated QPEs were prone to underestimating the precipitation of this rainstorm event.
  • FY-2G QPE show higher temporal and spatial consistency with ground observations than the latest FY-2H QPE. Compared to FY-2H QPE, the accumulated rainfall and maximum precipitation rate of the FY-2G QPE are closer to the ground observations. The rainfall duration of FY-2H QPE was significantly lower than that of FY-2G QPE and ground observation, suggesting that FY-2H QPE precipitation retrieval algorithm still has significant room for improvement in capturing extreme rainfall at the hourly scale.
  • The FY2-based QPEs exhibit significantly lower POD values in western Henan province, especially for FY-2H QPE. This can be attributed to the limitations of IR-based CTT retrievals, which have poor detecting capability in warm orographic rain events, resulting in underestimations of FY2-based QPEs associated with orographic rain events in complex topography regions. Additionally, although FY2-based QPEs merged ground observations, the improvement in detection capability is limited by the sparse station coverage in complicated terrain regions.

Author Contributions

Conceptualization, H.W.; methodology, H.W.; software, H.W.; validation, H.W. and Z.S.; formal analysis, H.W.; resources, H.W.; writing—original draft preparation, H.W.; writing—review and editing, B.Y., H.W. and Z.S.; visualization, H.W.; funding acquisition, B.Y. and H.W. All authors have read and agreed to the published version of the manuscript.

Funding

This work was sponsored by National Key Research and Development Program of China (2021YFB3900601), and the Postgraduate Research and Practice Innovation Program of Jiangsu Province (KYCX21_0531).

Data Availability Statement

The data are available from the corresponding author upon reasonable request.

Acknowledgments

The authors are grateful to the NMIC of CMA for providing ground observation data, and thankful to NSMC for providing FY-2 QPEs.

Conflicts of Interest

The authors declare no conflict of interest.

References

  1. Hou, A.; Kakar, R.; Neeck, S.; Azarbarzin, A.; Kummerow, C.; Kojima, M.; Oki, R.; Nakamura, K.; Iguchi, T. The Global Precipitation Measurement Mission. Bull. Am. Meteorol. Soc. 2014, 95, 701–722. [Google Scholar] [CrossRef]
  2. Michaelides, S.; Levizzani, V.; Anagnostou, E.; Bauer, P.; Kasparis, T.; Lane, J.E. Precipitation: Measurement, remote sensing, climatology and modeling. Atmos. Res. 2009, 94, 512–533. [Google Scholar] [CrossRef]
  3. Zhai, P.; Zhang, X.; Wan, H.; Pan, X. Trends in total precipitation and frequency of daily precipitation extremes over China. J. Clim. 2005, 18, 1096–1108. [Google Scholar] [CrossRef]
  4. Meehl, G.; Karl, T.; Easterling, D.; Changnon, S.; Pielke, R., Jr.; Changnon, D.; Evans, J.; Groisman, P.; Knutson, T.; Kunkel, K.; et al. An Introduction to Trends in Extreme Weather and Climate Events: Observations, Socioeconomic Impacts, Terrestrial Ecological Impacts, and Model Projections. Bull. Am. Meteorol. Soc. 2000, 81, 413–416. [Google Scholar] [CrossRef]
  5. Ding, M.; Yong, B.; Yang, Z. Extreme precipitation monitoring capability of the multi-satellite jointly retrieval precipitation products of Global Precipitation Measurement (GPM) mission. Natl. Remote Sens. Bull. 2022, 26, 657–671. (In Chinese) [Google Scholar]
  6. Tong, K.; Su, F.; Yang, D.; Hao, Z. Evaluation of satellite precipitation retrievals and their potential utilities in hydrologic modeling over the Tibetan Plateau. J. Hydrol. 2014, 519, 423–437. [Google Scholar] [CrossRef]
  7. Wang, H.; Shao, Z.; Gao, T.; Zou, T.; Liu, J.; Yuan, H. Extreme precipitation event over the Yellow Sea western coast: Is there a trend? Quat. Int. 2017, 441, 1–17. [Google Scholar] [CrossRef]
  8. Wang, Z. Spatial and Temporal Variation of Extreme Precipitation Indices in Sichuan Province from 1971 to 2018. Open J. Nat. Sci. 2019, 007, 333–348. (In Chinese) [Google Scholar] [CrossRef]
  9. Westra, S.; Alexander, L.; Zwiers, F. Global increasing trends in annual maximum daily precipitation. J. Clim. 2013, 26, 3904–3918. [Google Scholar] [CrossRef]
  10. Shen, Z.; Yong, B.; Gourley, J.; Qi, W. Real-time bias adjustment for satellite-based precipitation estimates over Mainland China. J. Hydrol. 2021, 596, 126133. [Google Scholar] [CrossRef]
  11. Huffman, G.; Adler, R.; Morrissey, M.; Bolvin, D.; Cyrtis, S.; Joyce, R.; Mcgavock, B.; Susskind, J. Global precipitation at one-degree daily resolution from multisatellite observations. J. Hydrometeorol. 2001, 2, 36–50. [Google Scholar] [CrossRef]
  12. Kidd, C. Satellite rainfall climatology: A review. Int. J. Climatol. 2001, 21, 1041–1066. [Google Scholar] [CrossRef]
  13. Tapiador, F.J.; Turk, F.J.; Petersen, W.; Hou, A.Y.; García-Ortega, E.; Machado, L.A.T.; Angelis, C.F.; Salio, P.; Kidd, C.; Huffman, G.J.; et al. Global precipitation measurement: Methods, datasets and applications. Atmos. Res. 2012, 104–105, 70–97. [Google Scholar] [CrossRef]
  14. Yu, C.; Hu, D.; Di, Y.; Wang, Y. Performance evaluation of IMERG precipitation products during typhoon Lekima (2019). J. Hydrol. 2021, 597, 126307. [Google Scholar] [CrossRef]
  15. Habib, E.; Henschke, A.; Adler, R. Evaluation of TMPA satellite-based research and real-time rainfall estimates during six tropical-related heavy rainfall events over Louisiana, USA. Atmos. Res. 2009, 94, 373–388. [Google Scholar] [CrossRef]
  16. Ricciardelli, E.; Di Paola, F.; Gentile, S.; Cersosimo, A.; Cimini, D.; Gallucci, D.; Geraldi, E.; Larosa, S.; Teodosio Nilo, S.; Ripepi, E.; et al. Analysis of Livorno heavy rainfall event: Examples of satellite-based observation techniques in support of numerical weather prediction. Remote Sens. 2018, 10, 1549. [Google Scholar] [CrossRef]
  17. Palharini, R.S.A.; Vila, D.A.; Rodrigues, D.T.; Palharini, R.C.; Mattos, E.V.; Pedra, G.U. Assessment of extreme rainfall estimates from satellite-based: Regional analysis. Remote Sens. Appl. Soc. Environ. 2021, 23, 100603. [Google Scholar] [CrossRef]
  18. Eini, M.R.; Rahmati, A.; Salmani, H.; Brocca, L.; Piniewski, M. Detecting characteristics of extreme precipitation events using regional and satellite-based precipitation gridded datasets over a region in Central Europe. Sci. Total Environ. 2022, 852, 158497. [Google Scholar] [CrossRef]
  19. Palharini, R.S.A.; Vila, D.A.; Rodrigues, D.T.; Quispe, D.P.; Palharini, R.C.; de Siqueira, R.A.; de Sousa Afonso, J.M. Assessment of the extreme precipitation by satellite estimates over South America. Remote Sens. 2020, 12, 2085. [Google Scholar] [CrossRef]
  20. Sutton, J.R.; Jakobsen, A.; Lanyon, K.; Lakshmi, V. Comparing precipitation during typhoons in the Western North Pacific using satellite and in situ observations. Remote Sens. 2022, 14, 877. [Google Scholar] [CrossRef]
  21. Prakash, S.; Mitra, A.; Pai, D.; AghaKouchak, A. From TRMM to GPM: How well can heavy rainfall be detected from space? Adv. Water Resour. 2016, 88, 1–7. [Google Scholar] [CrossRef]
  22. Omranian, E.; Sharif, H.O.; Tavakoly, A.A. How well can global precipitation measurement (GPM) capture hurricanes? Case study: Hurricane Harvey. Remote Sens. 2018, 10, 1150. [Google Scholar] [CrossRef]
  23. Talchabhadel, R.; Nakagawa, H.; Kawaike, K.; Yamanoi, K.; Musumari, H.; Adhikari, T.R.; Prajapati, R. Appraising the potential of using satellite-based rainfall estimates for evaluating extreme precipitation: A case study of august 2014 event across the west rapti river basin, Nepal. Earth Space Sci. 2021, 8, e2020EA001518. [Google Scholar] [CrossRef]
  24. Huang, Y.; Chen, S.; Cao, Q.; Hong, Y.; Wu, B.; Huang, M.; Qiao, L.; Zhang, Z.; Li, Z.; Li, W.; et al. Evaluation of version-7 TRMM multi-satellite precipitation analysis product during the Beijing extreme heavy rainfall event of 21 July 2012. Water 2013, 6, 32–44. [Google Scholar] [CrossRef]
  25. Chen, J.; Wang, Z.; Wu, X.; Lai, C.; Chen, X. Evaluation of TMPA 3B42-V7 product on extreme precipitation estimates. Remote Sens. 2021, 13, 209. [Google Scholar] [CrossRef]
  26. Qi, W.; Yong, B.; Gourley, J. Monitoring the super typhoon lekima by GPM-based near-real-time satellite precipitation estimates. J. Hydrol. 2021, 603, 126968. [Google Scholar] [CrossRef]
  27. Xu, J.; Ma, Z.; Tang, G.; Ji, Q.; Min, X.; Wan, W.; Shi, Z. Quantitative Evaluations and Error Source Analysis of Fengyun-2-Based and GPM-Based Precipitation Products over Mainland China in Summer, 2018. Remote Sens. 2019, 11, 2992. [Google Scholar] [CrossRef]
  28. Lu, H.; Ding, L.; Ma, Z.; Li, H.; Lu, T.; Su, M.; Xu, J. Spatiotemporal Assessments on the Satellite-Based Precipitation Products from Fengyun and GPM Over the Yunnan-Kweichow Plateau, China. Earth Space Sci. 2020, 7, e2019EA000857. [Google Scholar] [CrossRef]
  29. Wu, H.; Yong, B.; Shen, Z.; Qi, W. Comprehensive error analysis of satellite precipitation estimates based on Fengyun-2 and GPM over Chinese mainland. Atmos. Res. 2021, 263, 105805. [Google Scholar] [CrossRef]
  30. Guo, Y. Variations of Temperature and Precipitation in Henan Province in Past 49 Years. Master’s Thesis, Zhengzhou University, Zhengzhou, China, 2012. (In Chinese). [Google Scholar]
  31. Liu, C.; Lyu, J.; Zhai, X.; Li, Q.; Liu, R.; Sun, C.; Zhao, Y. Risk simulation and comparative analysis of “21·7” heavy rainfall and flood in Henan Province. Express Water Resour. Hydropower Inf. 2021, 42, 8–14. (In Chinese) [Google Scholar] [CrossRef]
  32. Darand, M.; Amanollahi, J.; Zandkarimi, S. Evaluation of the performance of TRMM Multi-satellite Precipitation Analysis (TMPA) estimation over Iran. Atmos. Res. 2017, 190, 121–127. [Google Scholar] [CrossRef]
  33. Xu, J.; Zhang, W.; Yang, J.; Zhao, L. Practical Manual of Fengyun-2 Satellite Business Products and Satellite Data Format; China Meteorological Press: Beijing, China, 2008; pp. 11–16. (In Chinese) [Google Scholar]
  34. Chu, P.S.; Wang, J.B. Recent climate change in the tropical western Pacific and Indian Ocean regions as detected by outgoing longwave radiation records. J. Clim. 1997, 10, 636–646. [Google Scholar] [CrossRef]
  35. Prasad, K.D.; Bansod, S.D. Interannual variations of outgoing longwave radiation and Indian summer monsoon rainfall. Int. J. Climatol. 2000, 20, 1955–1964. [Google Scholar] [CrossRef]
  36. Liang, Y.; Bu, Y.; He, Z.; Gu, X. Application of FY-2C satellite data in a typhoon rainstorm process in Henan Province. In Proceedings of the Satellite Remote Sensing Technology Progress and Application Conference at the 2006 Annual Meeting of the Chinese Meteorological Society, Chengdu, China, 25–27 October 2006; pp. 51–55. (In Chinese). [Google Scholar]
  37. Derin, Y.; Yilmaz, K.K. Evaluation of multiple satellite-based precipitation products over complex topography. J. Hydrometeorol. 2014, 15, 1498–1516. [Google Scholar] [CrossRef]
  38. Negri, A.J.; Adler, R.F. An intercomparlson of three satellite infrared rainfall techniques over Japan and surrounding waters. J. Appl. Meteorol. Climatol. 1993, 32, 357–373. [Google Scholar] [CrossRef]
  39. Tuttle, J.D.; Carbone, R.E.; Arkin, P.A. Comparison of ground-based radar and geosynchronous satellite climatologies of warm-season precipitation over the United States. J. Appl. Meteorol. Climatol. 2008, 47, 3264–3270. [Google Scholar] [CrossRef]
  40. Zhu, S.; Ma, Z. PECA-FY4A: Precipitation Estimation using Chromatographic Analysis methodology for full-disc multispectral observations from FengYun-4A/AGRI. Remote Sens. Environ. 2022, 282, 113234. [Google Scholar] [CrossRef]
  41. Yuan, W.; Yu, R.; Fu, Y. Study of different diurnal variations of summer long-duration rainfall between the southern and northern parts of the Huai River. Chin. J. Geophys. 2014, 57, 752–759. (In Chinese) [Google Scholar]
  42. Dinku, T.; Chidzambwa, S.; Ceccato, P.; Connor, S.J.; Ropelewski, C.F. Validation of high-resolution satellite rainfall products over complex terrain. Int. J. Remote Sens. 2008, 29, 4097–4110. [Google Scholar] [CrossRef]
  43. Xu, R.; Tian, F.; Yang, L.; Hu, H.; Lu, H.; Hou, A. Ground validation of GPM IMERG and TRMM 3B42V7 rainfall products over southern Tibetan Plateau based on a high-density rain-gauge network: Validation of GPM and TRMM over TP. J. Geophys. Res. Atmos. 2017, 122, 910–924. [Google Scholar] [CrossRef]
  44. Ma, Z.; Xu, J.; Zhu, S.; Yang, J.; Tang, G.; Yang, Y.; Shi, Z.; Hong, Y. AIMERG: A new Asian precipitation dataset (0.1°/half-hourly, 2000–2015) by calibrating the GPM-era IMERG at a daily scale using APHRODITE. Earth Syst. Sci. Data 2020, 12, 1525–1544. [Google Scholar] [CrossRef]
  45. Gebregiorgis, A.S.; Kirstetter, P.E.; Hong, Y.E.; Gourley, J.J.; Huffman, G.J.; Petersen, W.A.; Xue, X.; Schwaller, M.R. To what extent is the day 1 GPM IMERG satellite precipitation estimate improved as compared to TRMM TMPA-RT? J. Geophys. Res. Atmos. 2018, 123, 1694–1707. [Google Scholar] [CrossRef]
  46. Kidd, C.; Levizzani, V.; Turk, J.; Ferraro, R. Satellite Precipitation Measurements for Water Resource Monitoring 1. JAWRA J. Am. Water Resour. Assoc. 2009, 45, 567–579. [Google Scholar] [CrossRef]
Figure 1. (a) Topographic map of eastern China, (b) topographic map of Henan province, and (c) spatial distribution of meteorological stations over Henan province.
Remotesensing 15 02726 g001
Figure 2. Simple 2 × 2 contingency table that presents how satellite rainfall estimates and ground observation identify three independent error components (hit, miss, and false).
Remotesensing 15 02726 g002
Figure 3. Daily average OLR over Henan province on 20 July 2021 from FY-2G (a) and FY-2H (b).
Remotesensing 15 02726 g003
Figure 4. Accumulated rainfall over Henan province during the period of 17–22 July 2021, from gauge observations, FY-2G, and FY-2H QPEs.
Remotesensing 15 02726 g004
Figure 5. Maximum precipitation rate over Henan province during the period of 17–22 July 2021, from gauge observations, FY-2G, and FY-2H QPEs.
Remotesensing 15 02726 g005
Figure 6. Precipitation duration over Henan province during the period of 17–22 July 2021, from gauge observations, FY-2G, and FY-2H QPEs.
Remotesensing 15 02726 g006
Figure 7. Temporal variation of hourly mean rainfall for two QPEs (FY-2G and FY-2H) and ground observations.
Remotesensing 15 02726 g007
Figure 8. Temporal variation of accumulated mean rainfall for two QPEs (FY-2G and FY-2H) and ground observations at hourly scale.
Remotesensing 15 02726 g008
Figure 9. Spatial distributions of temporal categorical metrics for two QPEs (FY-2G and FY-2H) over Henan province: POD (a,b), FAR (c,d), CSI (e,f).
Remotesensing 15 02726 g009
Figure 10. Spatial distributions of temporal continuous metrics for two QPEs (FY-2G and FY-2H) over Henan province: CC (a,b), BIAS (c,d), RMSE (e,f).
Remotesensing 15 02726 g010
Figure 11. Precipitation intensity distributions of categorical metrics for two QPEs (FY-2G and FY-2H) over Henan province: POD (a), FAR (b), CSI (c).
Remotesensing 15 02726 g011
Figure 12. Precipitation intensity distributions of continuous metrics for two QPEs (FY-2G and FY-2H) over Henan province: BIAS (a), RMSE (b).
Remotesensing 15 02726 g012
Figure 13. Scatterplots of the hourly precipitation for FY-2G (a) and FY-2H (b) versus gauge observations over Henan province.
Remotesensing 15 02726 g013
Figure 14. Elevation distributions of categorical metrics for two QPEs (FY-2G and FY-2H) over Henan province: POD (a), FAR (b), CSI (c).
Remotesensing 15 02726 g014
Figure 15. Elevation distributions of continuous metrics for two QPEs (FY-2G and FY-2H) over Henan province: BIAS (a), RMSE (b).
Remotesensing 15 02726 g015
Table 1. The list of the evaluation metrics used in this study.
Statistical MetricCalculation FormulaPerfect Value
CC C C = i = 1 n G i G ¯ S i S ¯ i = 1 n G i G ¯ 2 i = 1 n S i S ¯ 2 1
RMSE R M S E = 1 n i = 1 n S i G i 2 0
BIAS B I A S = i = 1 n S i G i i = 1 n G i × 100 % 0
POD P O D = H H + M 1
FAR F A R = F H + F 0
CSI C S I = H H + M + F 1
Note: n represents the total number of samples; G i and G ¯   represents the ground observation and its average; S i and S ¯   represents the satellite precipitation and its average; H is the number of hit events that observed rainfall was also detected by satellite; M denotes the number of missed events that observed rainfall was not detected by satellite; F refers to the false alarms which is inverse with M.
Disclaimer/Publisher’s Note: The statements, opinions and data contained in all publications are solely those of the individual author(s) and contributor(s) and not of MDPI and/or the editor(s). MDPI and/or the editor(s) disclaim responsibility for any injury to people or property resulting from any ideas, methods, instructions or products referred to in the content.

