1. Introduction
Urban reform is instrumental to sustainable urban renewal. The renewal guidelines present the economic, environmental, and social expectations of the future. One of the sustainability issues concerns the ways in which replots were made to the old fabric, without destroying the old identity, while, at the same time, creating a new identity. The recirculated old trails (or alleys) usually created a new conversation between the old and new residences in a street block. This new arrangement raises a question: how old is the old part of a city? The definition should take into account the degree to which the replots of the old fabric have evolved in order to discover the details of the co-existence of the two parts, especially in the downtown area.
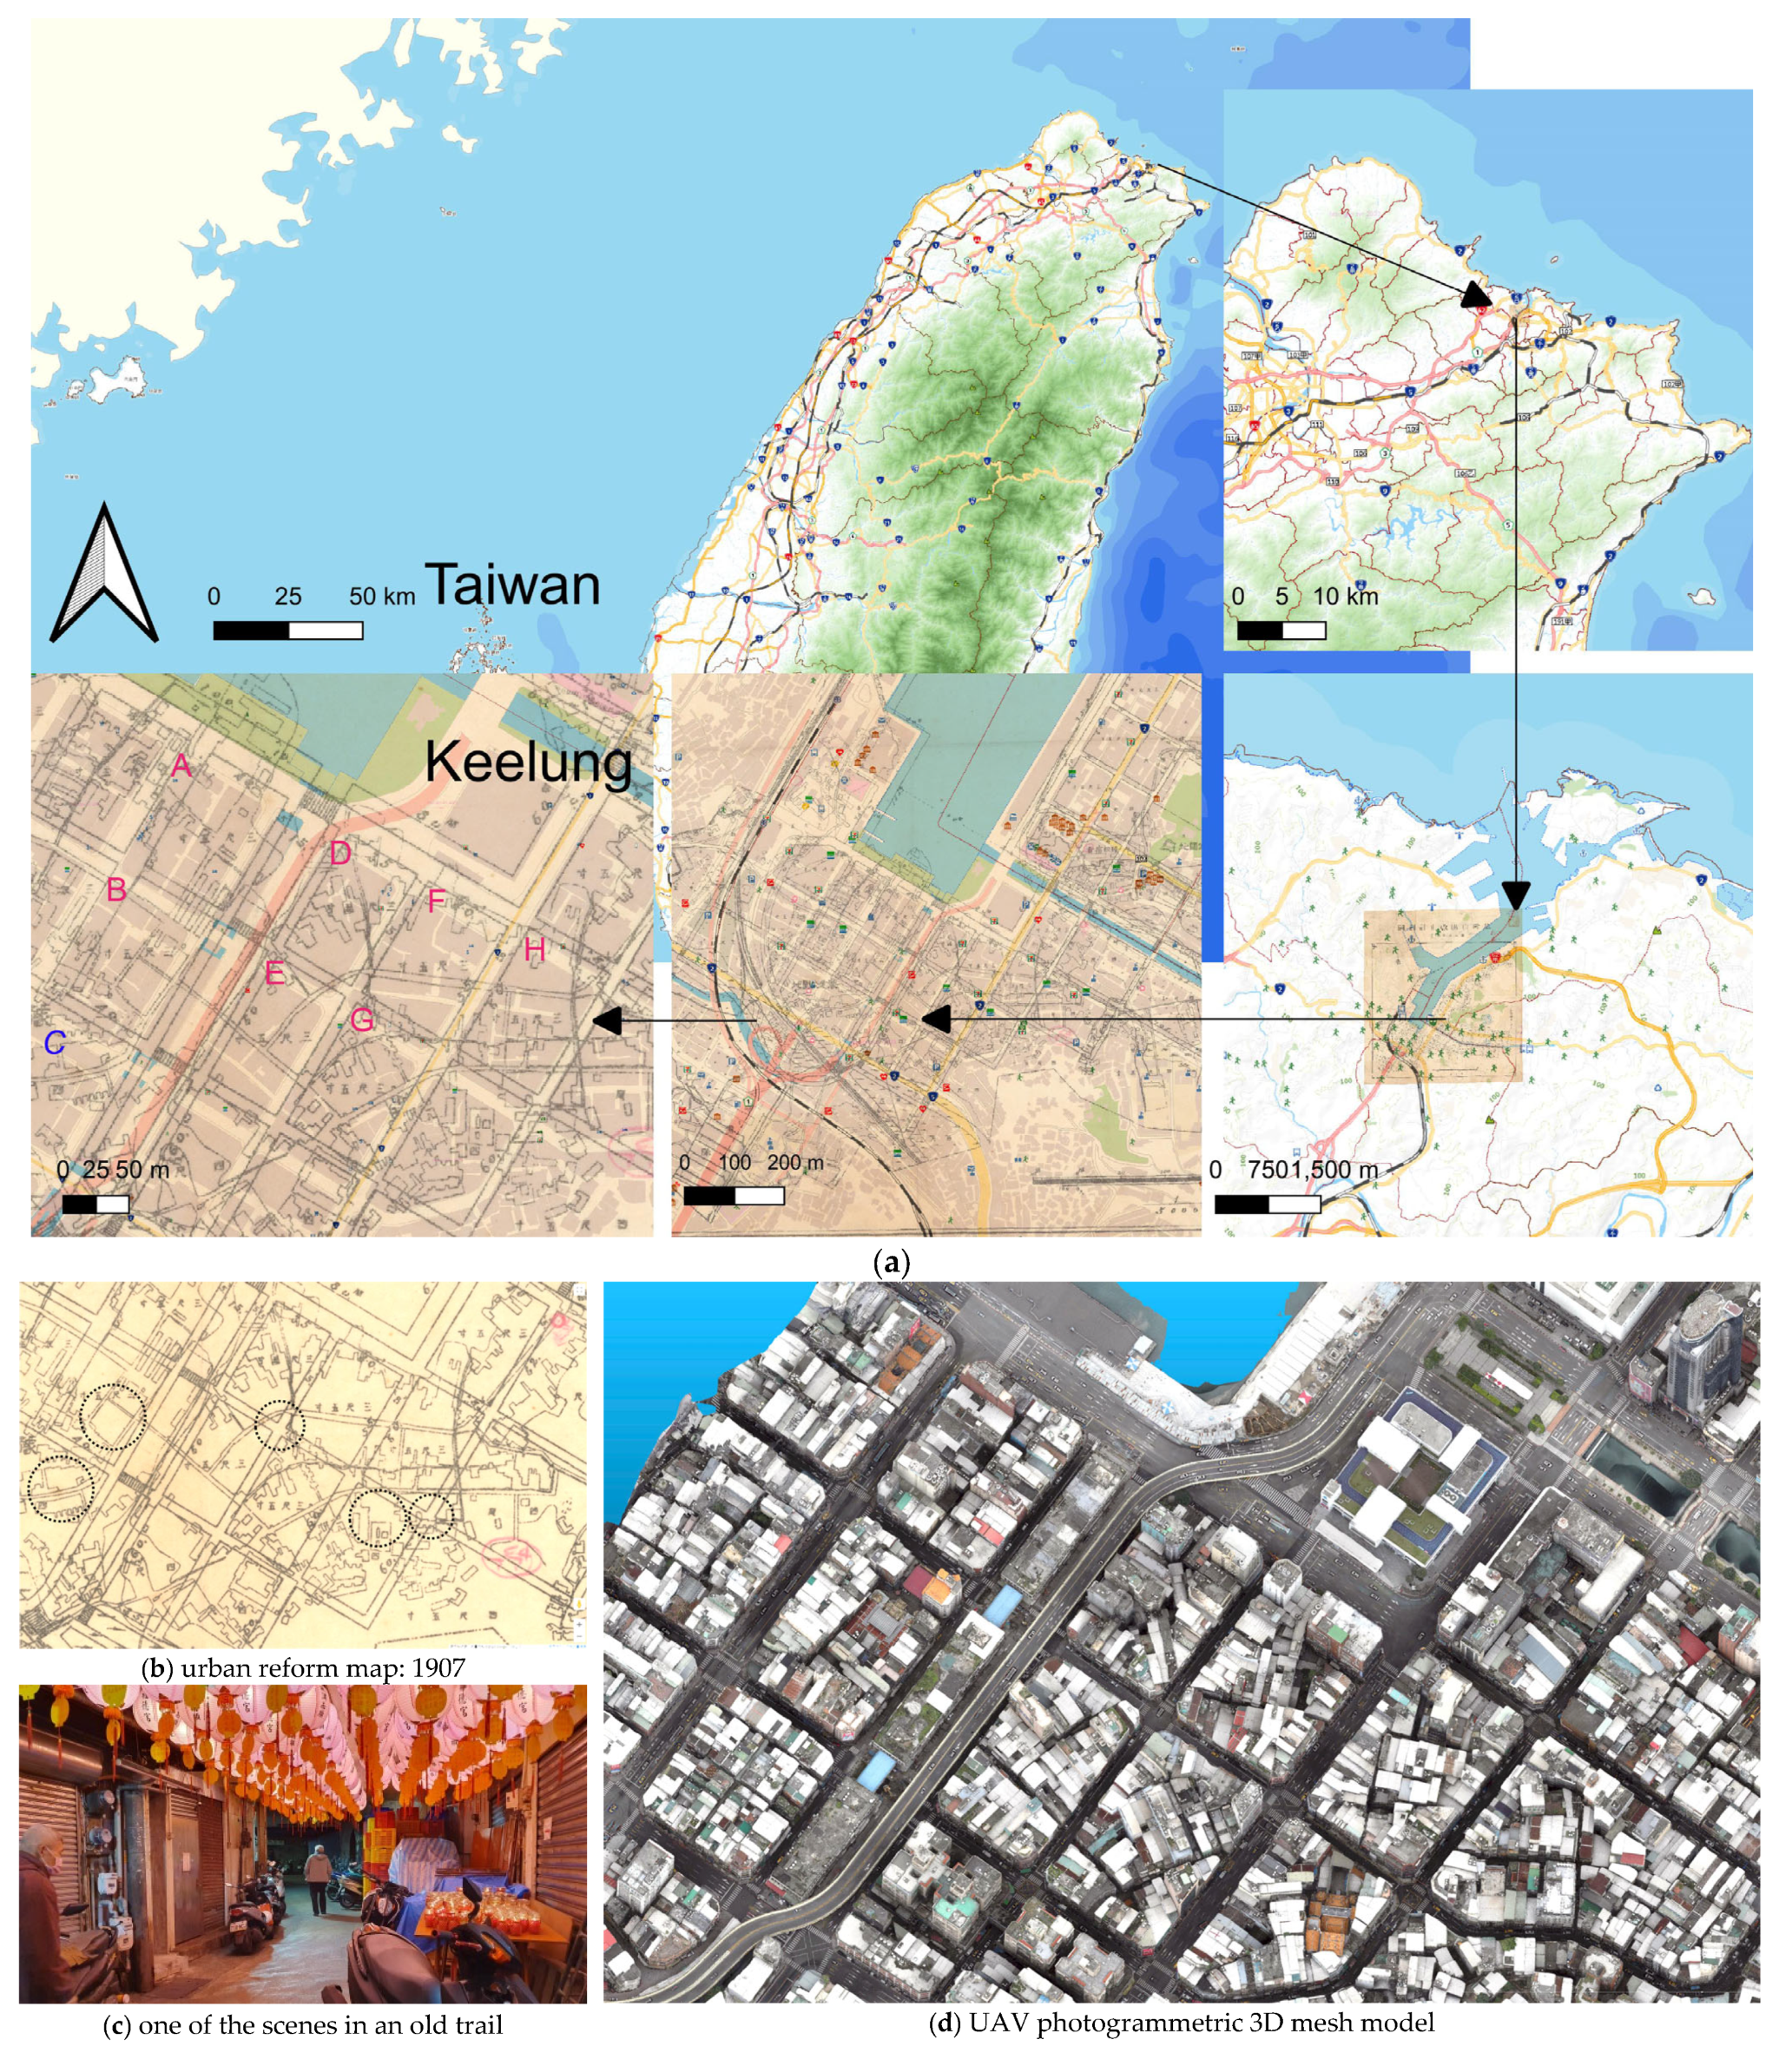
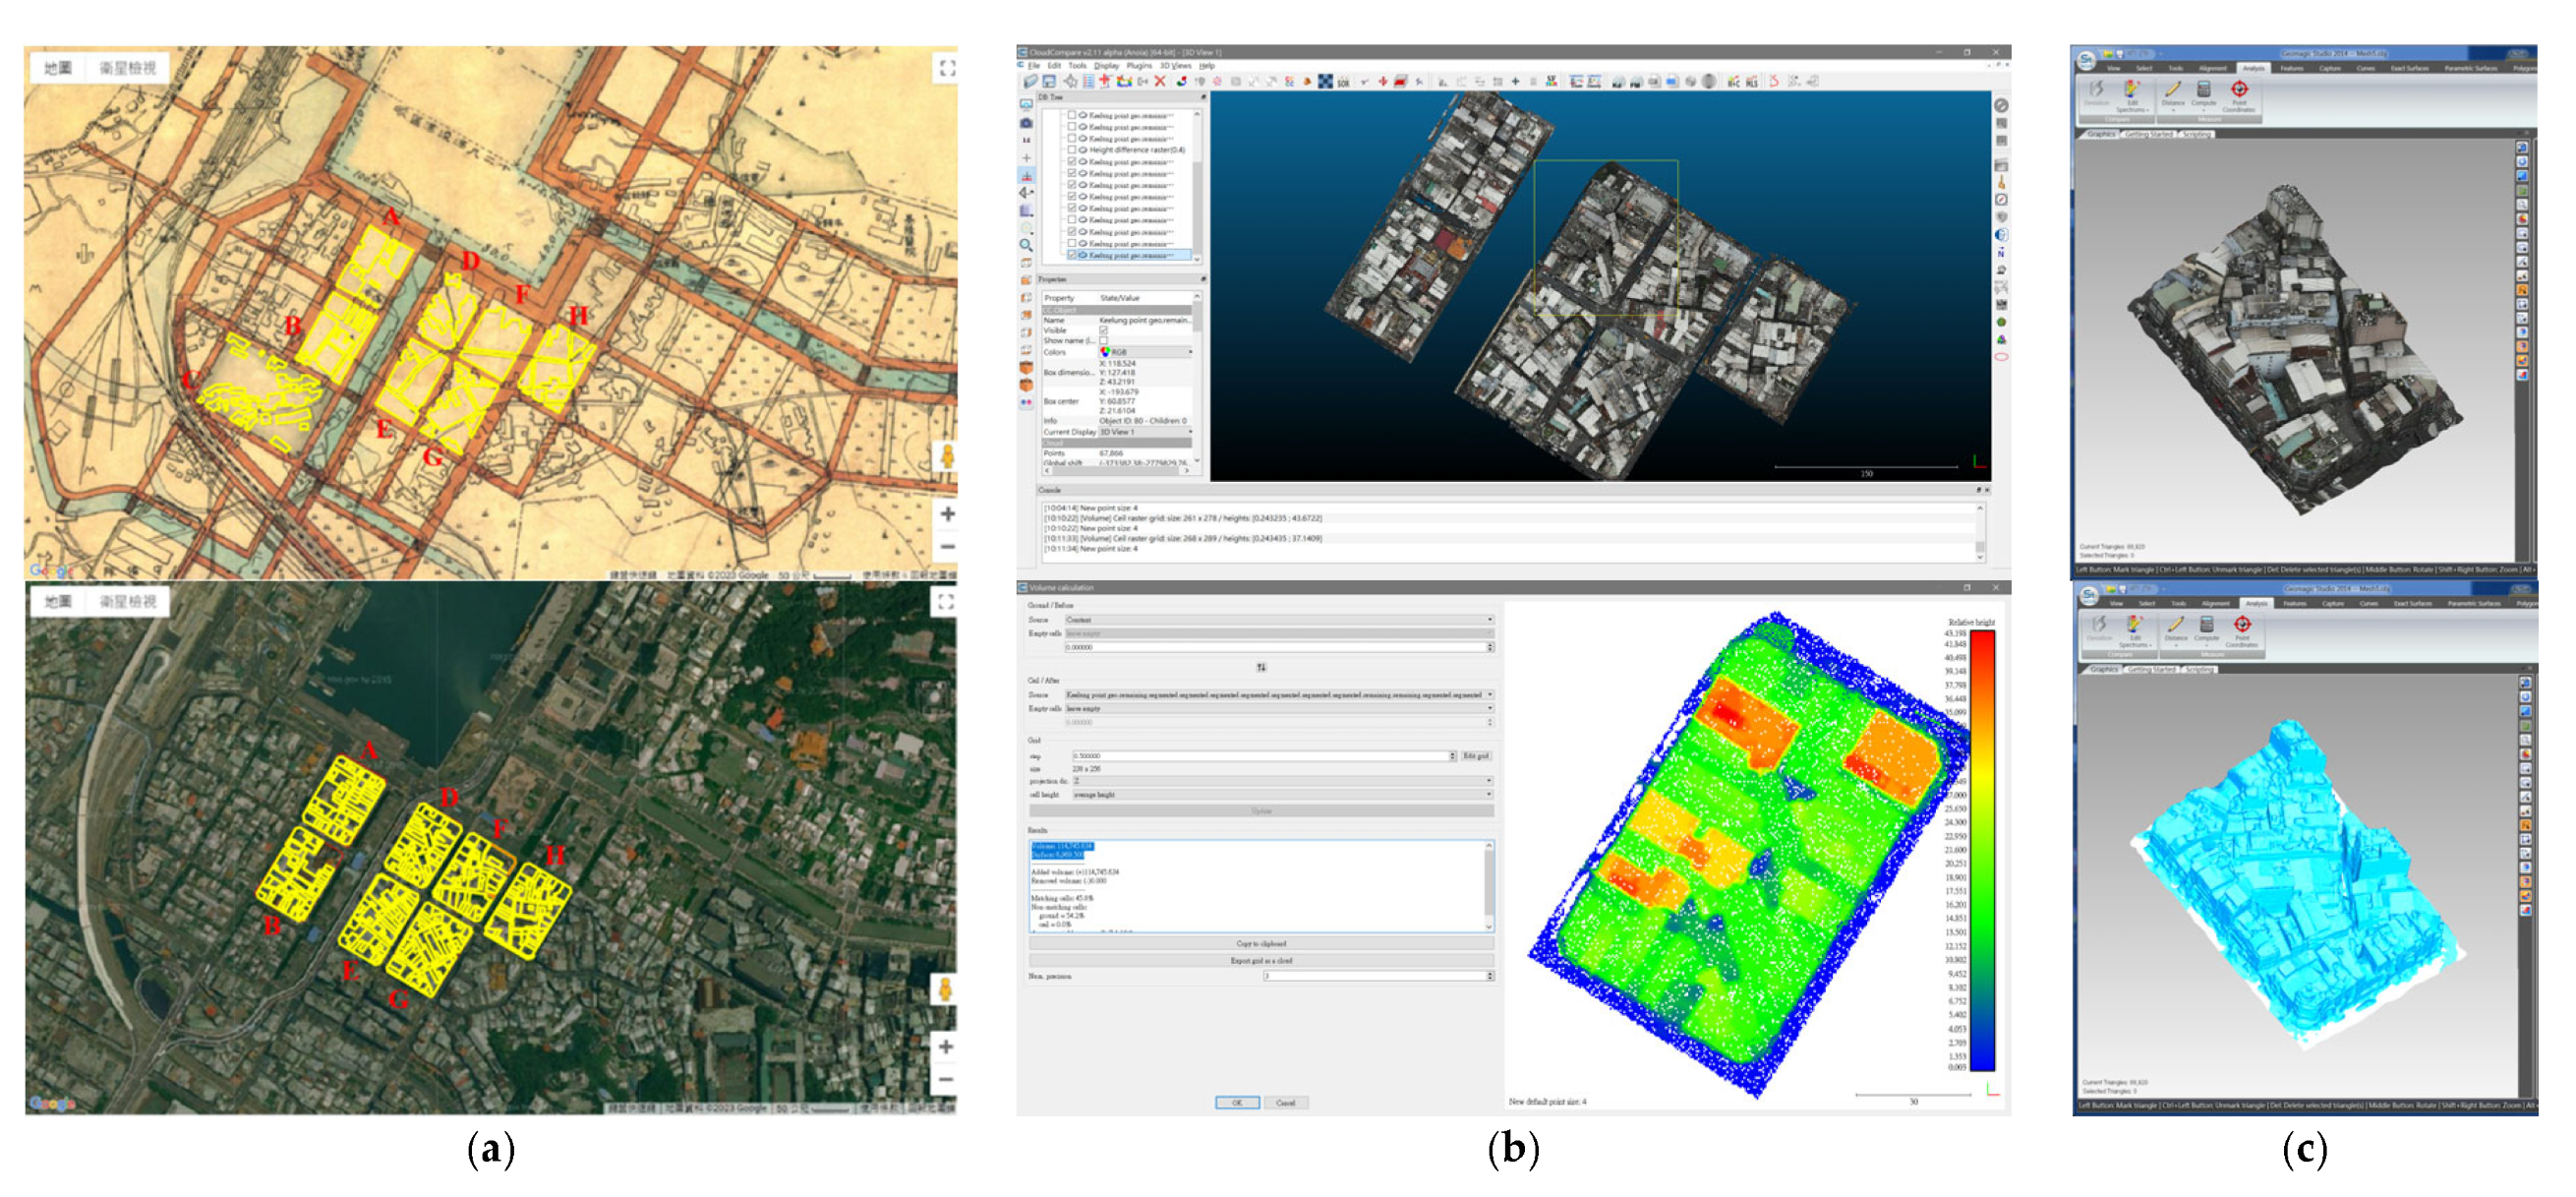
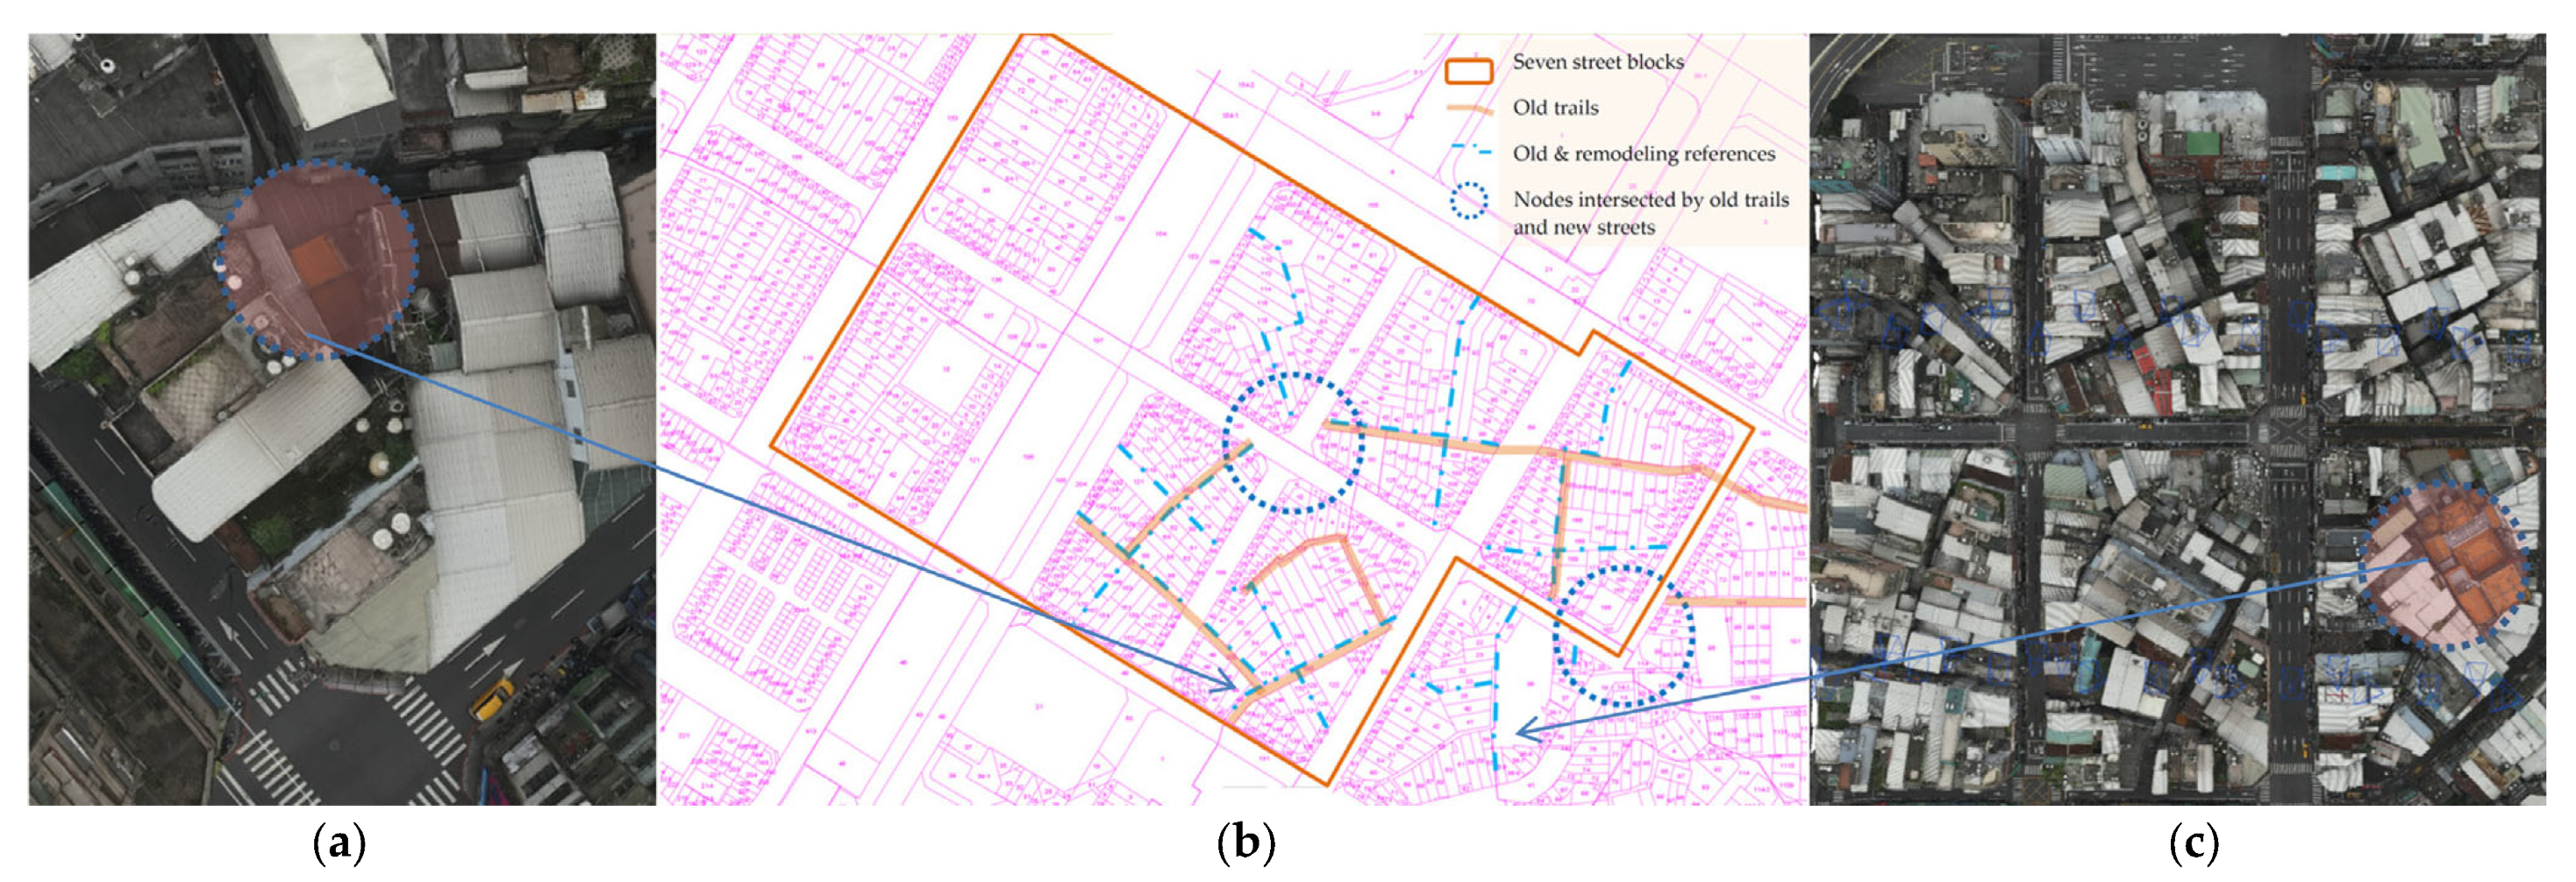
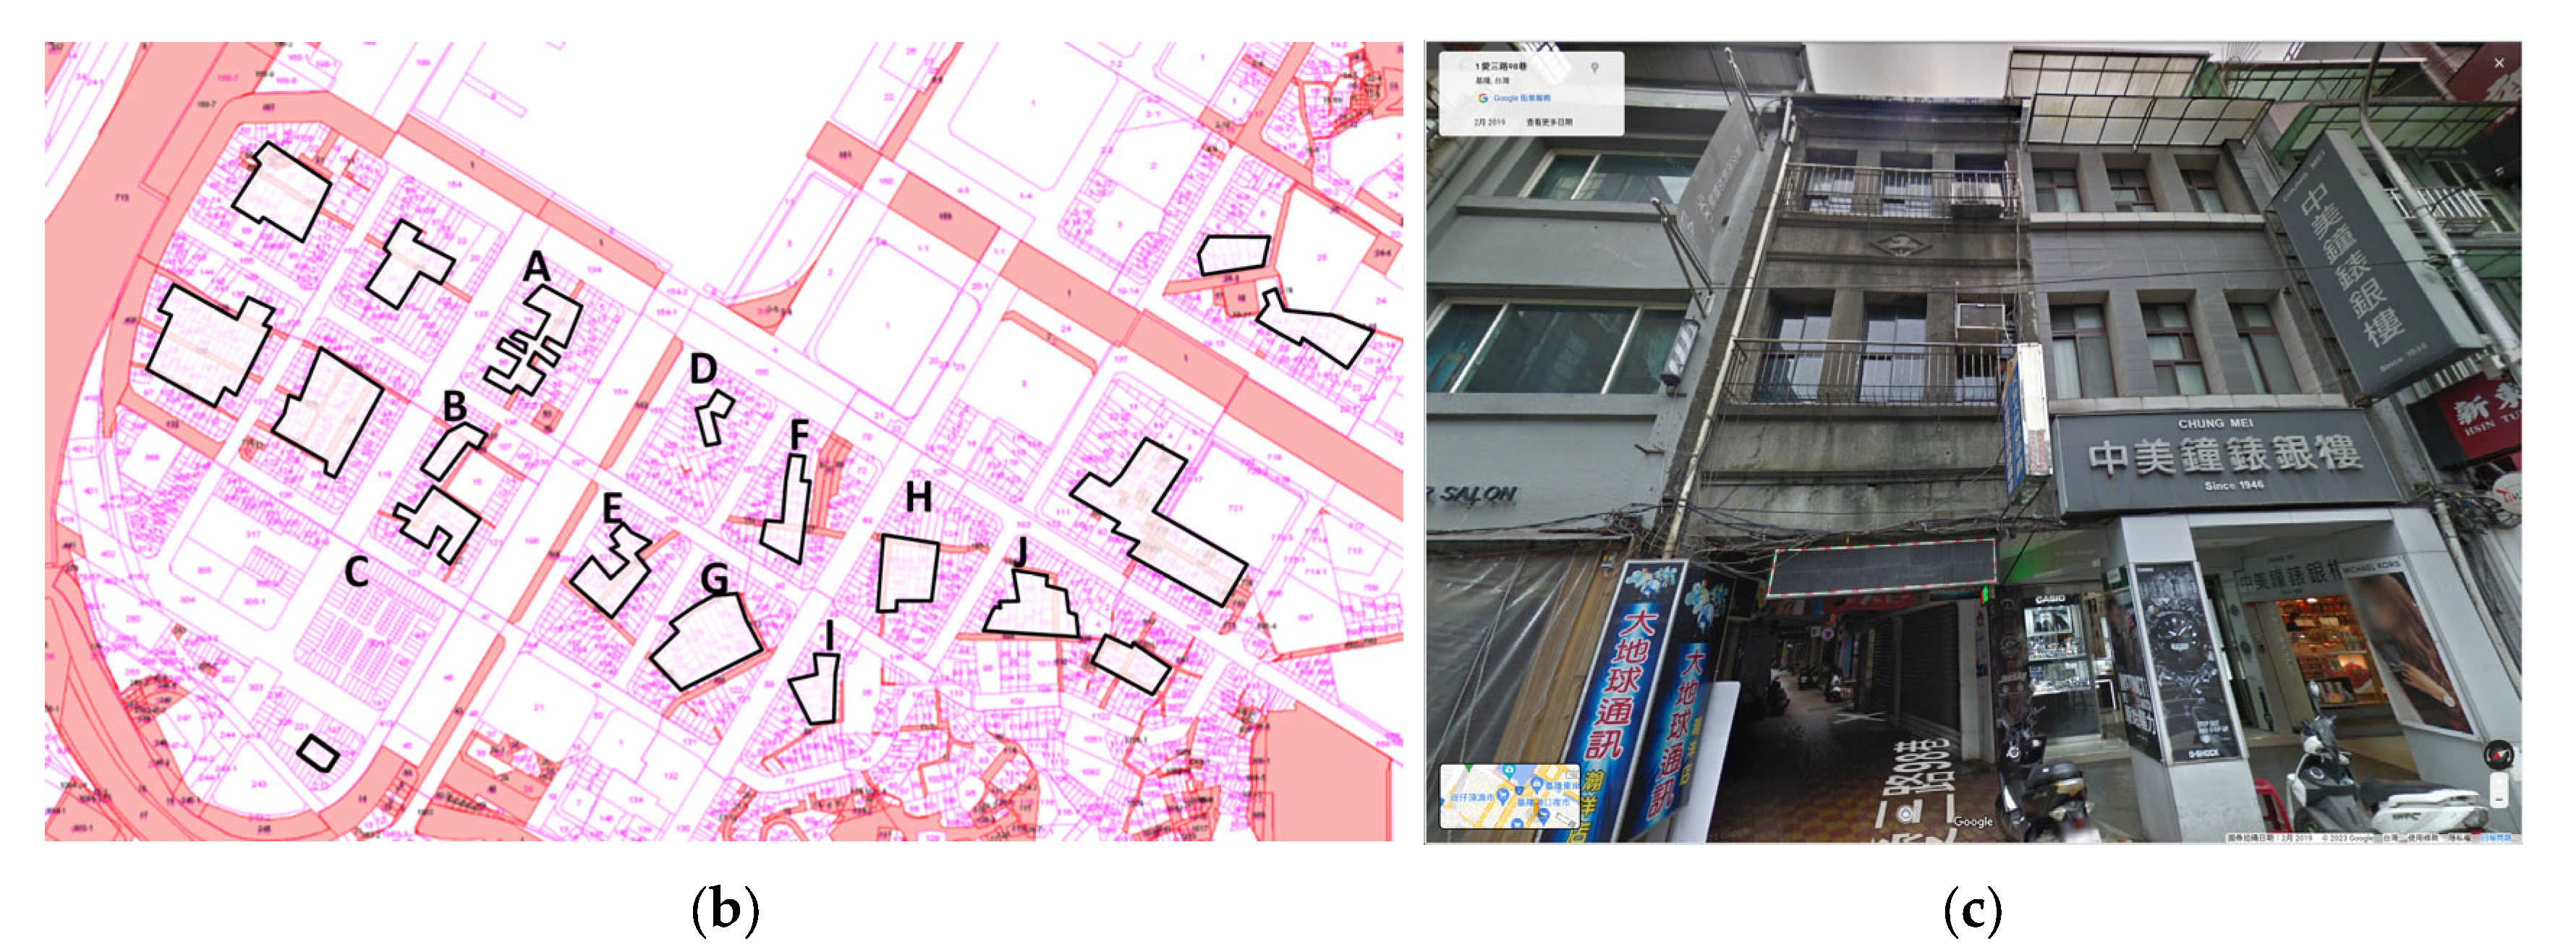
This research aims to analyze the adaptation of the nested fabric in order to determine how the previous evolvement impacted the fabric within another fabric. We selected seven blocks in the downtown area of Keelung (
Figure 1a), Taiwan, to interpret the old replot strategy and to assess the changes made to the inner area of the blocks. These seven blocks inherited the most diversified pattern of old and new circulation systems.
A city usually evolves by demolishing the spatial structure of the past. In Keelung, the old trails remain, but they are exquisitely hidden within the downtown area and eventually merge with people’s daily life as part of the circulation system. The heritage structure exists within a street block, and it connects to the next block across the main streets as a nested fabric adaption. Some of the trails have a façade built along the street front, above the pedestrian arcade. This area was selected because it is an example of the entangled urban fabric covered up by new fabric. The geographical relationship between the old and the new is also a unique urbanization process, and the assessed percentage of the evolved area can enlighten people with knowledge of the past.
2. Related Studies
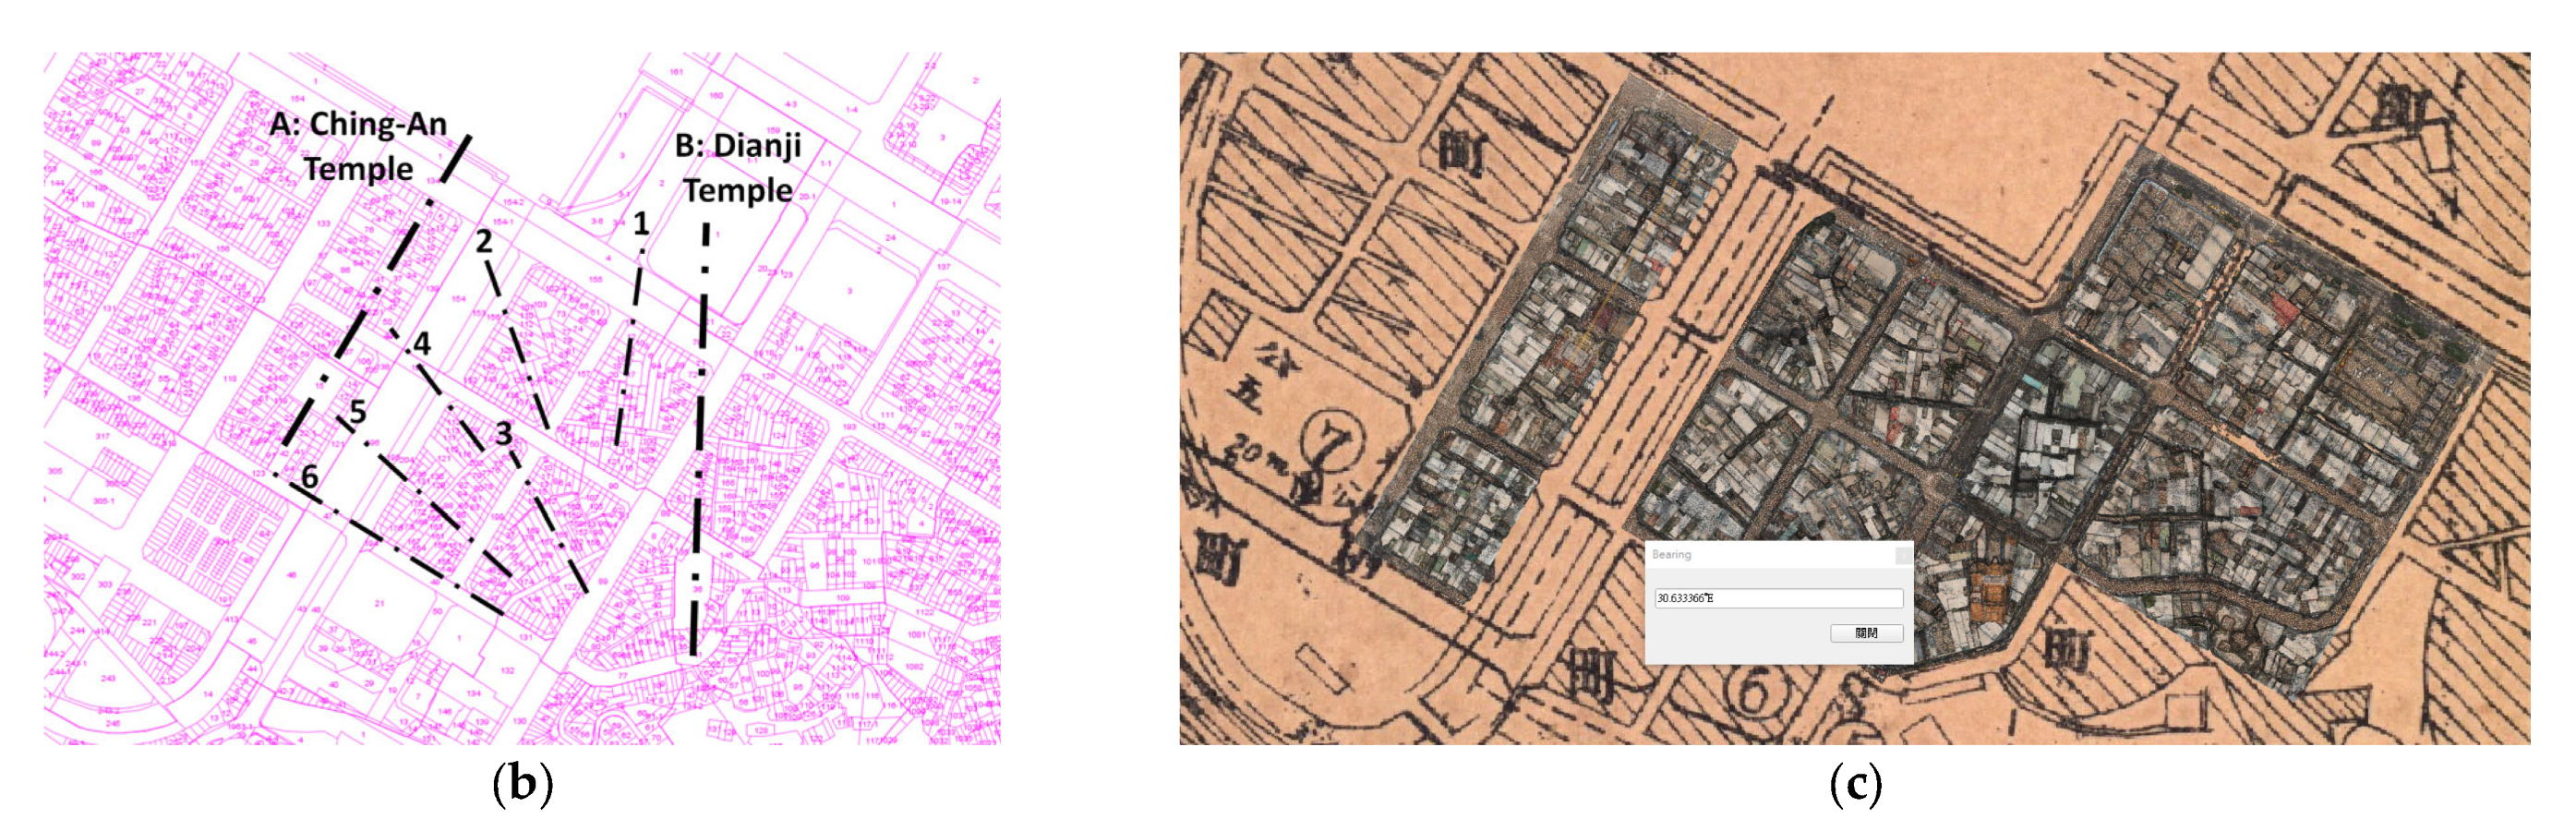
The old diagonal trails (
Figure 1b) in Keelung represent the former geographical distribution of the urban fabric, and they create the identity and character of the urban fabric types and subspaces within the city. The morphological order of the old and new block types shows the complexity that needs to be assessed and presented. The urban fabric has been assessed to understand a city’s complexity [
2]. Urban fabric analysis has been conducted from a pedestrian perspective [
3]. The streetscape, which creates different spatial patterns of perception, can be considered using historical maps.
Modern urban development presents a morphological perspective [
4]. Urban morphology involves the transition between the private and public domains and the connections between the different forms of urban components. The morphology is also represented by the interface of physical characteristics, which gradually evolve in urban development. Sustainability-oriented development has been conducted for the urban interface of historic centers [
5]. Rapid urbanization should recognize the plurality of heritage values [
6], as heritage production and urban locational policy involves local residents [
7]. Urban heritage sites in cities are involved in resilience and sustaining the human dimension [
8]. The interface has been explored through the transition between the private and public domains [
9]. The core of hierarchical urban structure includes textures, patterns, and shapes [
10].
Urban expansion is usually accompanied by environmental degradation as part of the urbanization process. Urban infill developments are expected to emerge and to increase urban pressure [
11]. Remote sensing (RS) and geographic information systems (GIS) have been very useful in differentiating the mixed layout of the old and new parts of a city. GIS-based methodology for contemporary practices helps to acquire new meanings that overlap the past ones [
12]. Urban transformations can use the data collected from multi-source and multi-temporal RS data, which can be mutually validated via GIS techniques [
11]. A related technique was used for an archaeology study [
13] and land degradation monitoring to support landscape preservation and planning tools [
14]. RS-derived observations and historical cartographic data sources provide new and promising ways to assess urbanization and long-term land cover changes [
15]. A related site study facilitated the understanding of cultural landscapes with an assessment of the conditions, which augmented our knowledge of the fabric [
13].
Commission stores (
Figure 1a—“C”) became a specific scene that was unique to Keelung in the early days of consumer activity. While the role of cultural production and consumption is related to contemporary urban regeneration [
16], the store layout also represented the unique identity of the city. Historical urban identity is related to authentic urban identity [
17]. The link between the urban and commercial phenomena in a city enables a link to be created between a city’s urban identity and its market identity [
18]. As a result, the specific fabric which contributes to the identity of the city should be retrieved by unmanned aerial vehicles (UAV) and historical GIS; this may form the reference basis of the assessed development.
Urban metabolism contributes to the sustainability and regeneration of the circulation systems in urban fabrics [
19]. Different cities, which have different metabolisms, present different evolving stages. Reducing the metabolic footprint produced by factors other than resource inputs and waste outputs involves making the best use of open space, respecting religious traditions, and continuing the construction of infrastructure into the future.
Urban reform contributes to the sustainable and resilient evolvement of a city. Urban resilience demands the analysis, design, planning, and management of cities [
20,
21,
22,
23]. Based on the size and distribution of the old trails and the new construction, the earlier development of the fabric in Keelung followed the topographic features of the harbor. A detailed investigation of the old and current fabric should be conducted by fusing data from multiple sources; such an investigation forms part of the assessment of a lifecycle with different quality dimensions [
24].
Scholars can model urban landscapes by using real-time data to produce the most realistic results [
25]. RS systems capture images and 3D geometries to formulate the specific attributes of the physical environment. RS, light detection and ranging (LiDAR), UAVs, and GIS have been very useful in differentiating the mixed layout of the old and new parts of a city. A UAV was used to scan the limited samples of subject growth areas identified with the GIS model [
26]. A photogrammetry survey was conducted for medieval archaeology [
27]. UAV photogrammetry was applied for resilience management in the reconstruction plans for urban historical centers after seismic events [
28]. Historical heritage and cultural landscapes were often digitally reconstructed by integrating RS and GIS data [
29]. LiDAR studies have been conducted to reconstruct a city [
30], inspect physical cultural heritage [
31], and simulate a real environment in augmented reality (AR) [
32,
33,
34,
35]. RS images can be integrated with LiDAR data to improve geo-positioning accuracy in metropolitan areas [
36,
37]. Aerial images, 3D laser scans, and GIS have been integrated into inundation dynamics, shoreline changes, and other domains [
38,
39,
40] in order to enrich the data representation of the urban context. Moreover, photogrammetry technologies have been applied to produce 3D models of streets, buildings, and city details [
41,
42].
Previous studies should be applied to interpret the physical dynamics. The data and related interactions should involve issues within an extended hierarchy. This study explored the urban fabric in downtown Keelung, and it is possible that the study in 3D can present an interesting and efficient dialogue between the old and new fabrics using GIS and interaction with AR.
4. Results
New planning, which moved the main façade from its position facing the old trails to the new street orientation, has prevented environmental problems and promoted the increased business activity that exists today. The spatial structure was totally changed, from the old building fronts to the service entrances hidden in the alley. The majority of the old alleys now serve as areas for service access and fire evacuation. Shops with a non-community-friendly business nature also exist as part of the reflected urban cityscape.
4.1. Map Findings
The historical maps showed how the fabric evolved from the former to the new circulation system. The evolvement included streets, open spaces, and house layouts. The current maps provided clues regarding the gaps inside blocks, the truncated floor patterns, and the new property boundaries by household numbers. The maps showed that the old trails enclosed a sub-block inside the new one and isolated it. The old temple and new streets preserved an old community from the block in front. The perpendicular layouts that pointed to the old trail were bent and adjusted to make them perpendicular to the new grids. The junctions between the old trails and the new streets were open or covered by buildings above the entrances. The floor plans were truncated by crossroads and presented a special pattern. Roof construction is an important and reliable indicator of property, since the roofs would not usually cross or intrude on other properties, and an integrated structure was preferred.
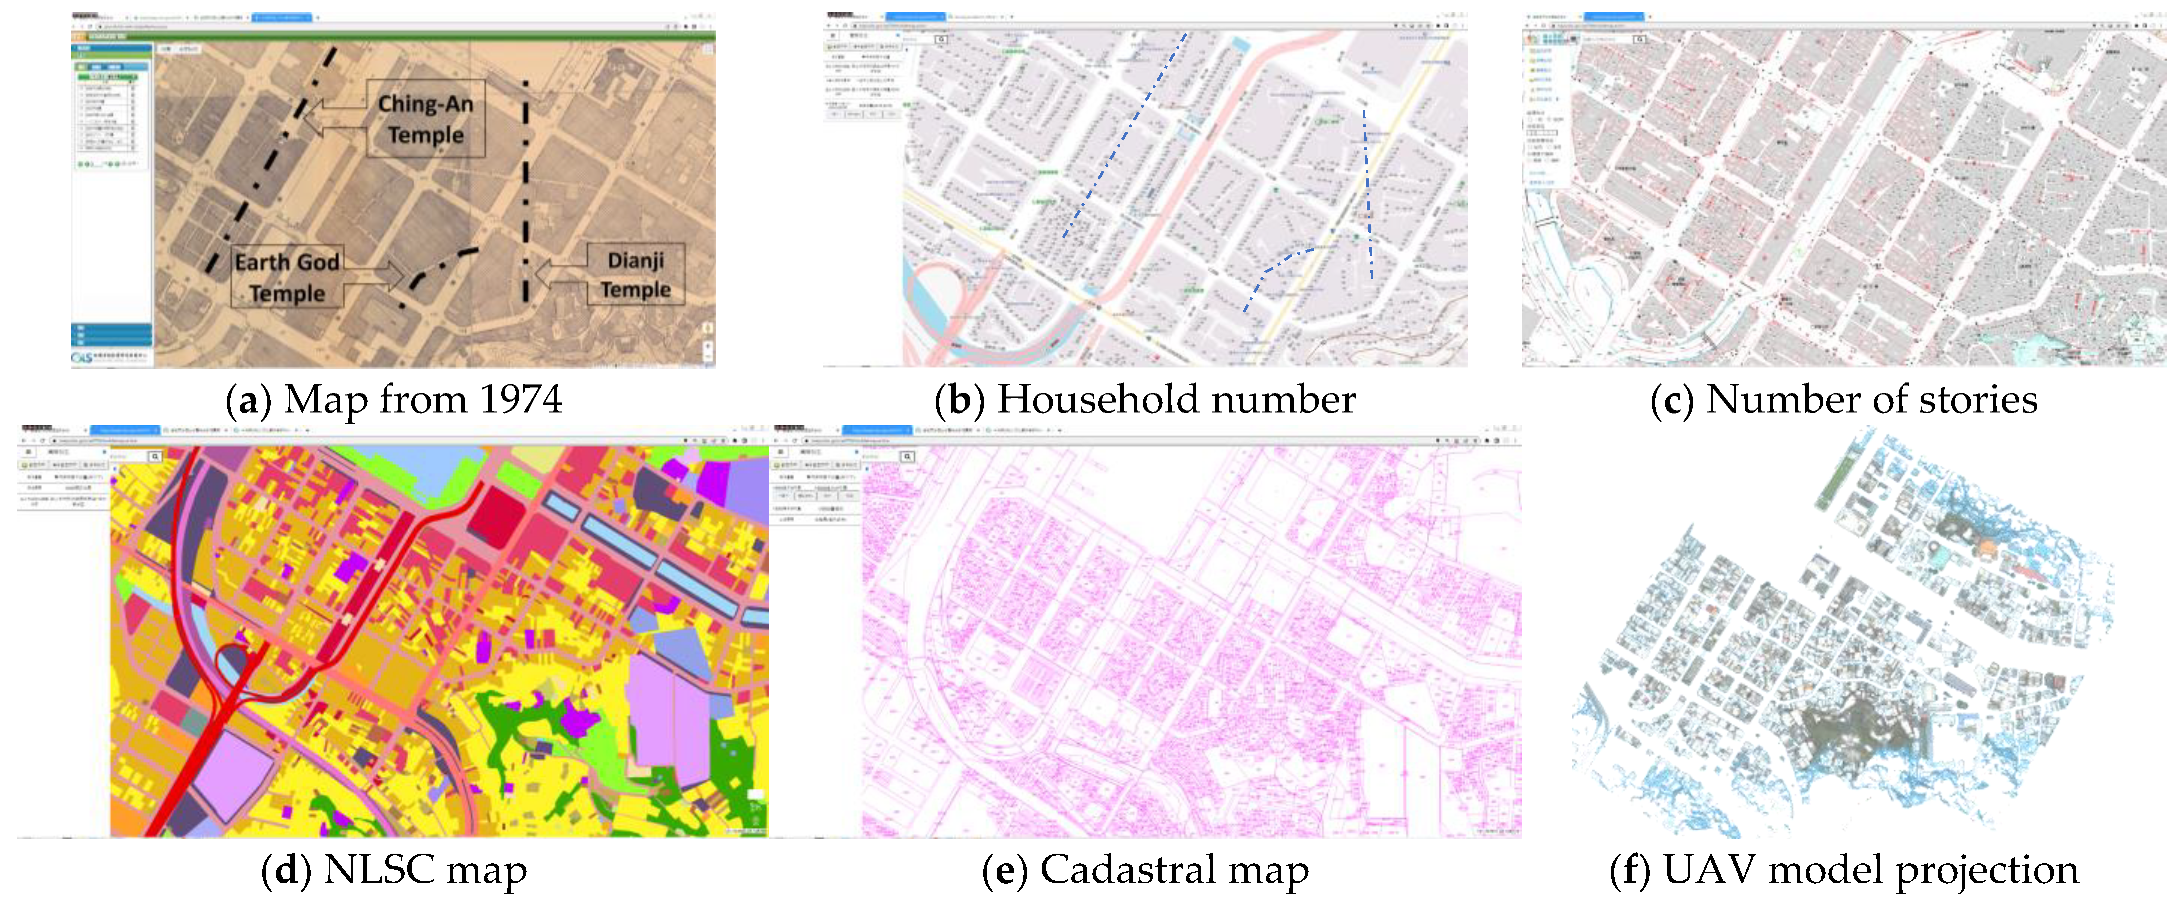
The household or land number (
Figure 2b) stands for the designated property and the distributed boundary in a block. The number is also connected to each property, and it indicates the number of stories for height estimation. The numbers reveal different heritage fabric patterns by the topology of their circulation. The block to the south of the temple has a dense clustering of small properties. The new buildings above Asahikawa River have properties arranged with a central corridor. The block which contained old streets after the new urban planning presented properties that were arranged along alleys and extended to the center. A property that was connected to both the street and the inner alley could reach a length of up to 40 m.
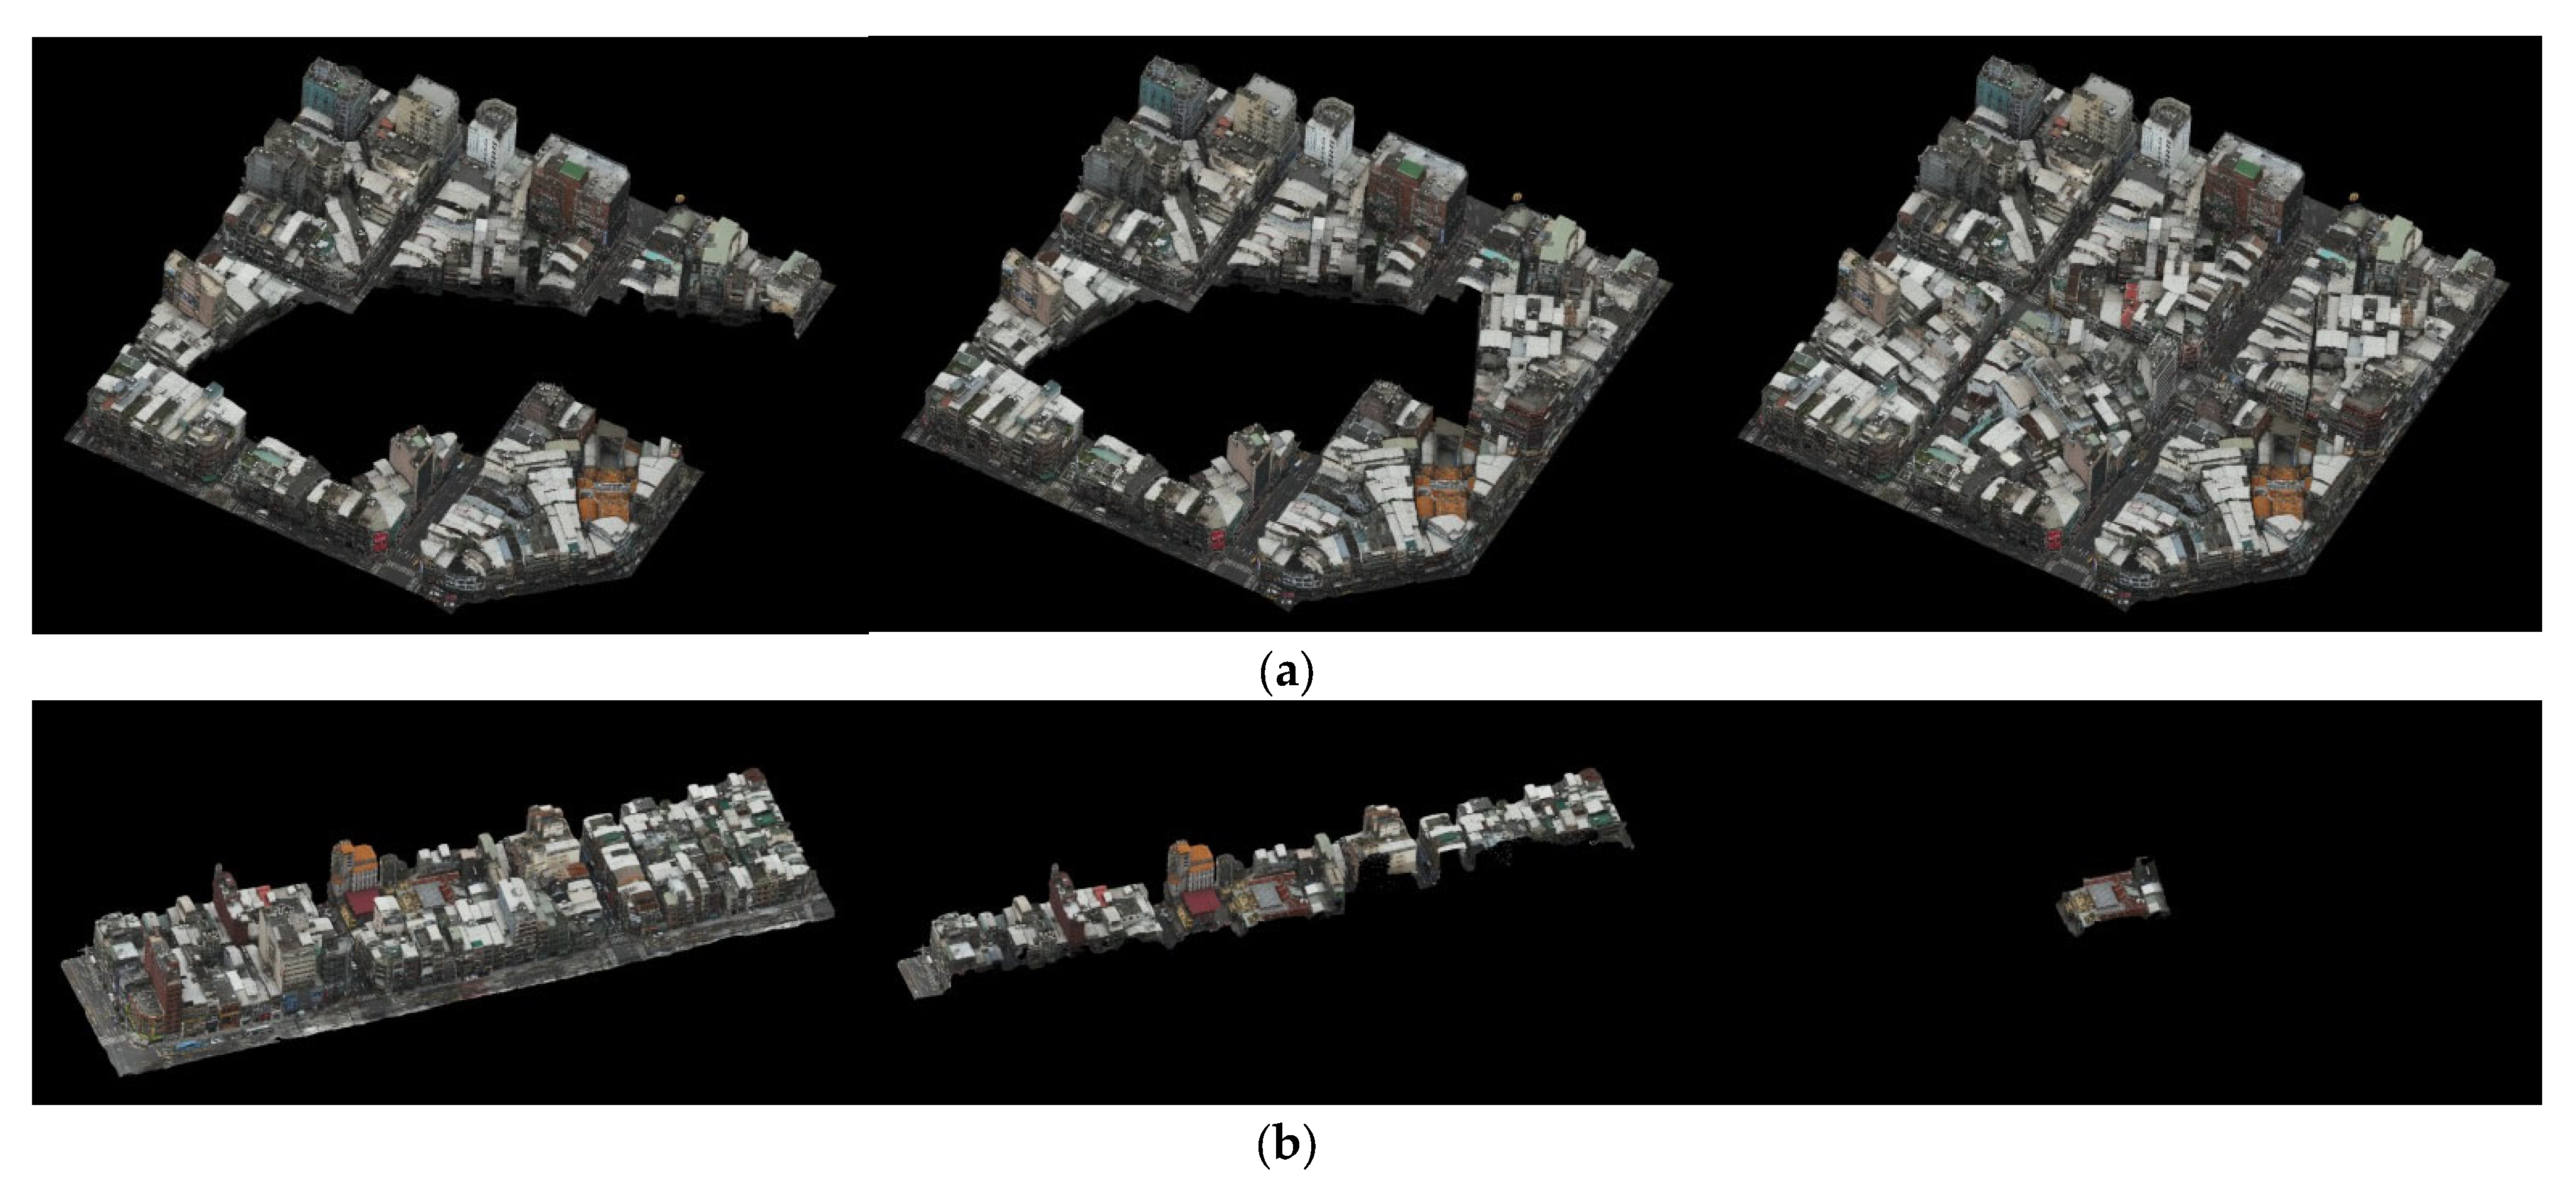
Temples were usually established much earlier than the year in which the Japanese urban reform was initiated. The temple-oriented sections facilitated the as-built presentation of the urban fabrics. Three axes (
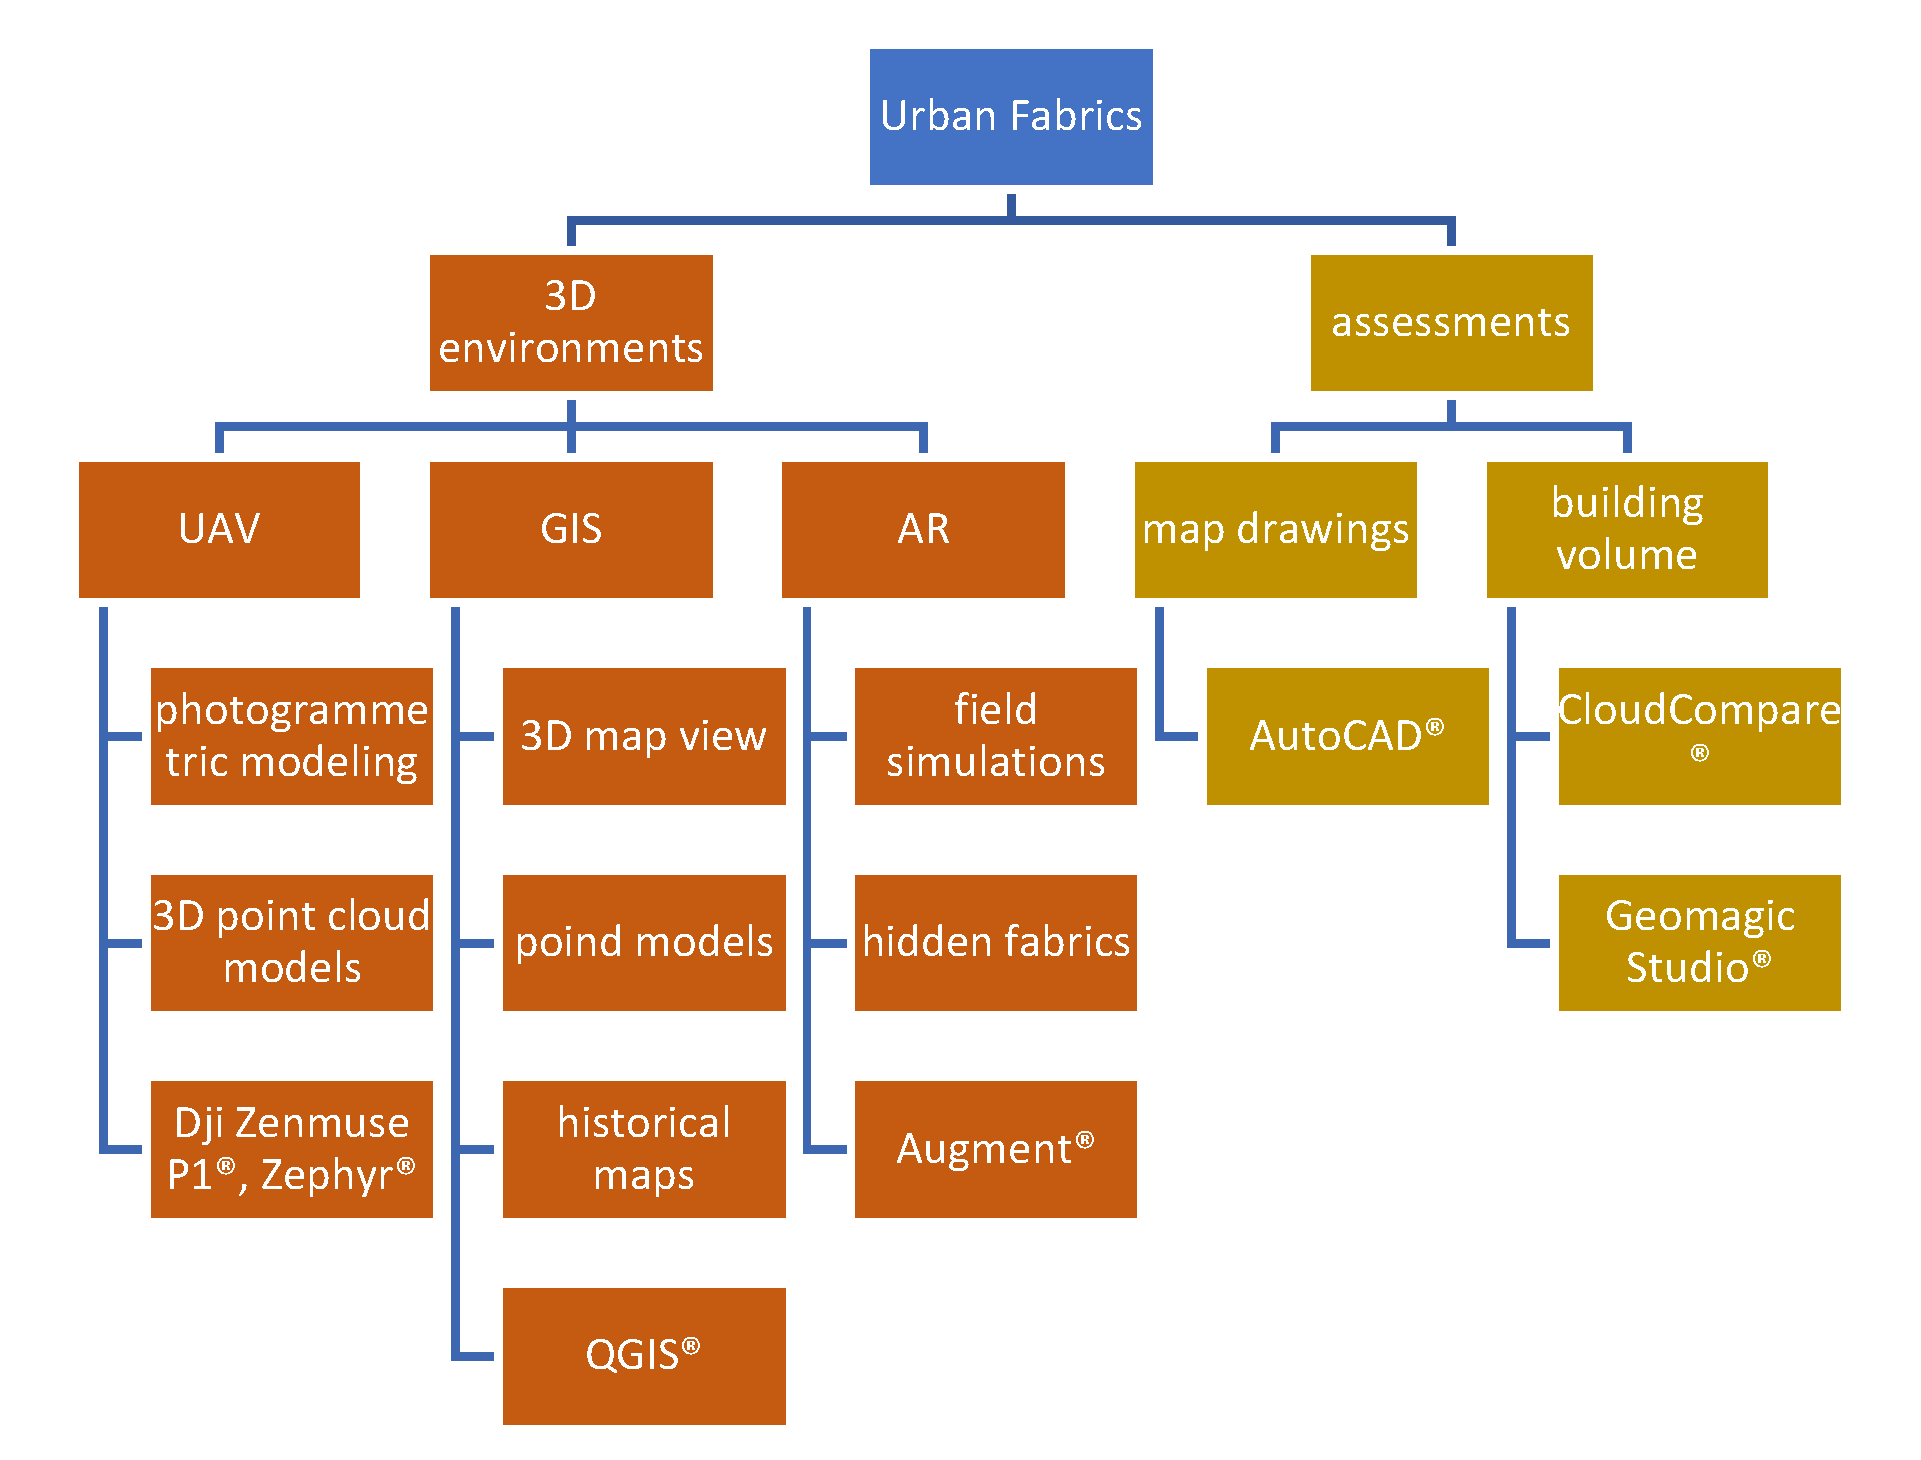
Figure 2a) of the model were developed and, later, represented by QGIS
® and cloud model overlay.
Axis I (Ching-An Temple): harbor front–street block–temple front courtyard–temple–bars–old trails–block front–commission block;
Axis II (Dianji Temple): harbor front–night market–snack booths–temple front courtyard–temple–bars–old trails–hill front–hill–temple–God sculpture landmark;
Axis III (Earth God Temple): new street–entrance/exit–old trail–temple–old trail–entrance/exit–new street–market.
4.2. Referred Fabric
Referred building plans and façades were found using the street front of the commission block (
Figure 1a—“C”) and the roof layout orders by central aisles (
Figure 6), which were located just behind the religion block. It followed the temple fabric without much remodeling. The location advantage it possessed as a place to invite visitors after a temple visit made it a perfect place to have a business. How could another block compete with the one located next to the famous temple? The businesses, which were usually religion-related, were somehow transformed into a different business model: that of the most modern shops trading in foreign goods. The store pattern, which followed the old street-facing pattern, was condensed into a more efficient pattern to accommodate more shops within a block in the form of a mall with a cross-corridor in the center.
Not only was the plan of the fabric evolving and being created within the existing block, but the block front façade was also evolving and being designed according to the illustrated styles from the old partitioning and vocabulary, the simpler materials and construction vocabulary, and the neo-patterns based on older ones in new partitions. Vocabularies were juxtaposed with undecorated columns, horizontal exterior windowsills, and window frame partitions, with simplified details and with three vertical strips or less.
4.3. Proof and Instances in Fabric Remodeling
A city is usually defined by paths, edges, districts, nodes, and landmarks [
45]. The old trails were developed in curves, which followed the original configuration of the old bay front. The new reform straightened the front into harbors and, consequently, developed grids parallel to the harbor front (
Figure 1a). The adjustment of the old, curved trails and related block infill to the new grids inevitably curtailed the old trails, made them into discontinuous segments, and truncated the block perimeter into rectangles. The alleys were usually terminated by a viaduct, which was another factor altering the old fabrics.
The fabric remodeling comprises an irregular property line, bent axis, truncated floor plan, and truncated second skin (
Figure 7). At least eleven bent axes were found inside the blocks. The two most dominant nodes were located at the crossroads by the truncated trails. The nodes were found, with truncated second skins and floor plans, at the intersections between the old and new circulation systems.
Irregular property line or floor plan: The triangle shelter on the roof and the old façade vocabulary showed evidence of the evolvement of the old fabric and the adaptation to a new one. The triangle counter was located at the corner with the façade suspended in midair. The buildings to the north, east, south, and west of the crossroads may also represent heterogeneously juxtaposed plan configurations.
Truncated by the crossroads: An enforced orientation, which happened with the remodeling of the old, truncated houses, can be seen from the same building axis orientation, even with no old alley and the adjacency to a nearby temple.
Bent axis: A reorienting of the house axis of the old alleys was applied in order for it to be perpendicular to the new street.
Truncated second skin: The modification of the fabric can be easily found on the second skin of the commission block, in which the old vocabulary was truncated or new ones were installed for the new opening partition and hand-railing system. Inconsistent street façade partitioning (width and partition) was found on either side of the block. The front façade was found across the alley on the same side of the street.
4.3.1. Block at 45 Degrees
The studied fabric has two aspects: the typical pattern that appeared before urban reform and the one that occurred after the reform. The reference is important since it determines the dominant signature of the remaining pattern, which leads to the assessment of the changed parts and how the changes were made.
Urban reform started in 1905. A temple could have been established as early as 1780, nearly 120 years earlier than the year of the Japanese urban reform. It seems that the old reform purposefully avoided the streets that ran directly through the temples, which, at the same time, were open to the streets. The temple-oriented pattern showed that an unchanged layout occurred at the center of the blocks. For example, Dianji Temple (1875), which followed the old fabric at a near 45-degree orientation, opens to the street and the night market. The Earth God Temple (1849), which had the geographic advantage of the Qin official routes, was entirely enclosed within a block. The Ching-An Temple (1780), which was more consistent with the original orthogonal layout, was located parallel to the old river and next to the fish market.
4.3.2. Block at 90 Degrees
The current fabric leads to the findings on the modified fabric pattern in terms of axis and façade. For example, the original layout of the Ching-An Temple opened to the sea, just like the Town God’s Temple (1818/1887). Now, a new axis has developed from the sea, harbor front, street block, temple, Qin Dynasty official routes, and bars to the commission block.
The land pattern of the newer block, with orthogonal geometries, was different from the old ones, which followed the original fabric. The smaller partitioning was also different from the old ones, in which connections were also made by new openings to the new streets. In a way, the clustering in the new blocks and mall was less friendly as a living environment since as many as six lines of booths were made within 72 m of the commission streets. The uniform shop fronts, the mall design, and the periodical promotion activity have created community involvement and a linked identity from the past to now. The block façade of the commission streets, which was designed in a traditional style, creates an immediate contrast between the orthogonal planning and the non-orthogonal planning of the boundary.
4.4. Block Inside a Block
The block inside a block was verified by an infill made of the interface, entrance, configuration, living environment, and circulation.
4.4.1. Infill
The land pattern in the newer block, under an orthogonal geometry, was different from the old ones, which followed the original curved fabric. Part of the floor plan adopted a new transformation by converting to a near 45-degree orientation to meet the new orthogonal layout. Most of the inner fabrics within the blocks remained the same, and there was consistency between the past and the present, except that the building volume had significantly increased. The smaller partitioning of the interiors was also different from that of the new ones, in which floor connections and new openings had to be made to face new streets.
Entrances to the alleys were usually made through the old building or a remodeled façade. The old façade barely existed inside. The new constructions have created a fully developed building height vs. one story prior to the reform. The inner and the perimeter part of a block once presented a totally separate access to the streets. The almost-totally-isolated buildings created solid blocks within a block instead of empty courtyards. The increased population and associated utility spaces degenerated the living quality and significantly overloaded the possible service capacity of the old trails.
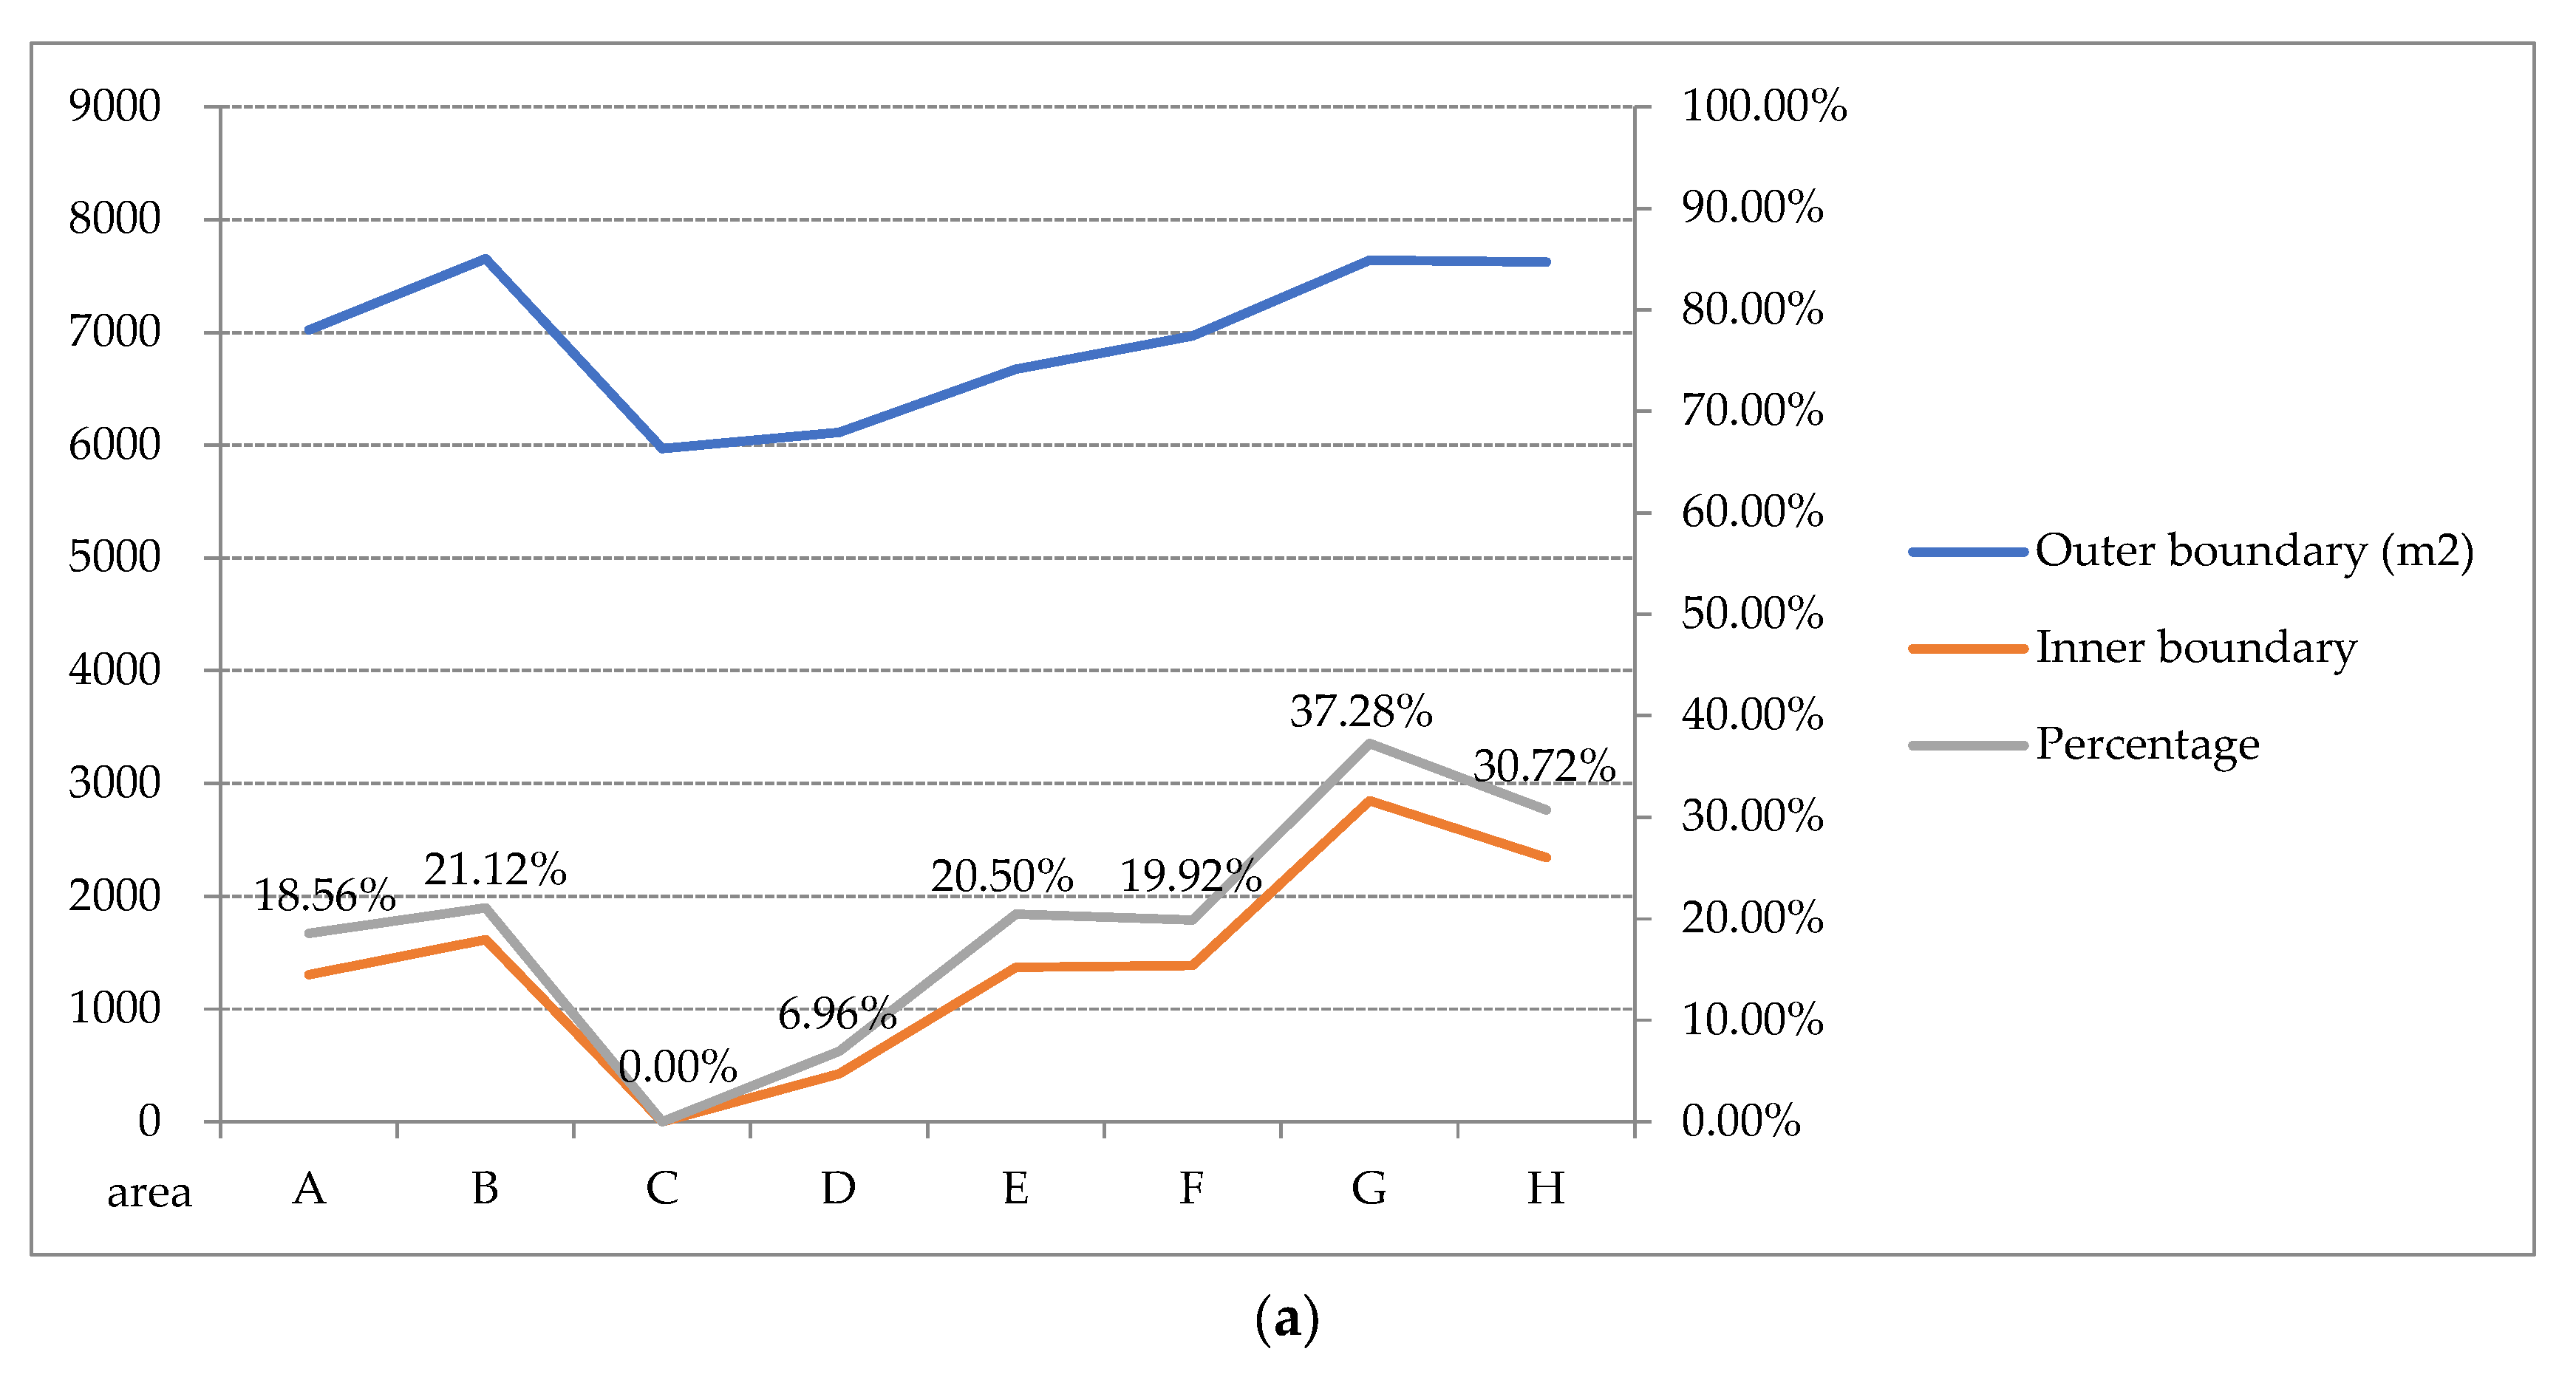
The interface between the new grids and the old blocks was the construction which had evolved for over 100 years. The inner block area was considered to be infill (
Figure 8) and is discussed and assessed according to types, orientation, proportion, and circulation. The infill types include the solid infill of the residential areas within a block and the empty infill of the open space within a block, such as the courtyard in front of a temple. The solid infill evolved mainly because of the old plot, and it was followed by accumulated layers of floors. The infill orientation either followed the old diagonal trails with a truncated floor plan or the new orthogonal orientation parallel to the grids. The infill proportion formed by the floor width and depth was either lengthened by a deteriorated interior space quality and circulation or bent by an adapted layout to the new fabric at the cost of the structural system and the irregular configuration. The truncated proportion caused a misfit and reversed the spatial hierarchic structure, orientation, and entrance of the floor plan. In particular, the original opening was sealed or enclosed on the back side by the street-facing fabric of the perimeter or by other lanes. A new connection was made to the truncated structural system.
The infill circulation was differentiated by type, entrance, and connection. The alley connected directly to the streets via a sub-grid system of through cuts or dead ends. The straight or twisty lane had an opening at either both ends or one end only. The other end may have opened to another lane or a dead end. The entrances to the sub-system can be either undefined, as simply a gap between buildings, or they can be well-defined constructions or installations, such as houses, covered shelters, sightseeing posts, pavements, banners, or lights.
4.4.2. Physical and Cultural Labyrinths
The role of the old trails had changed from the main circulation system to intra-block service alleys. The trails, which served an important function in that they made it possible to reach the outside, were truncated to reach the main streets between the crossroads. The block types were differentiated by inner alley width or by their role as highway truncations. The block with an equally divided interior had less width and was truncated by a viaduct. The spatial hierarchy of the housing was reoriented from the back to the street front. The block within a block, which had sufficient width and was not truncated by a viaduct, featured centered and occupied residential, religious, or mixed-use buildings.
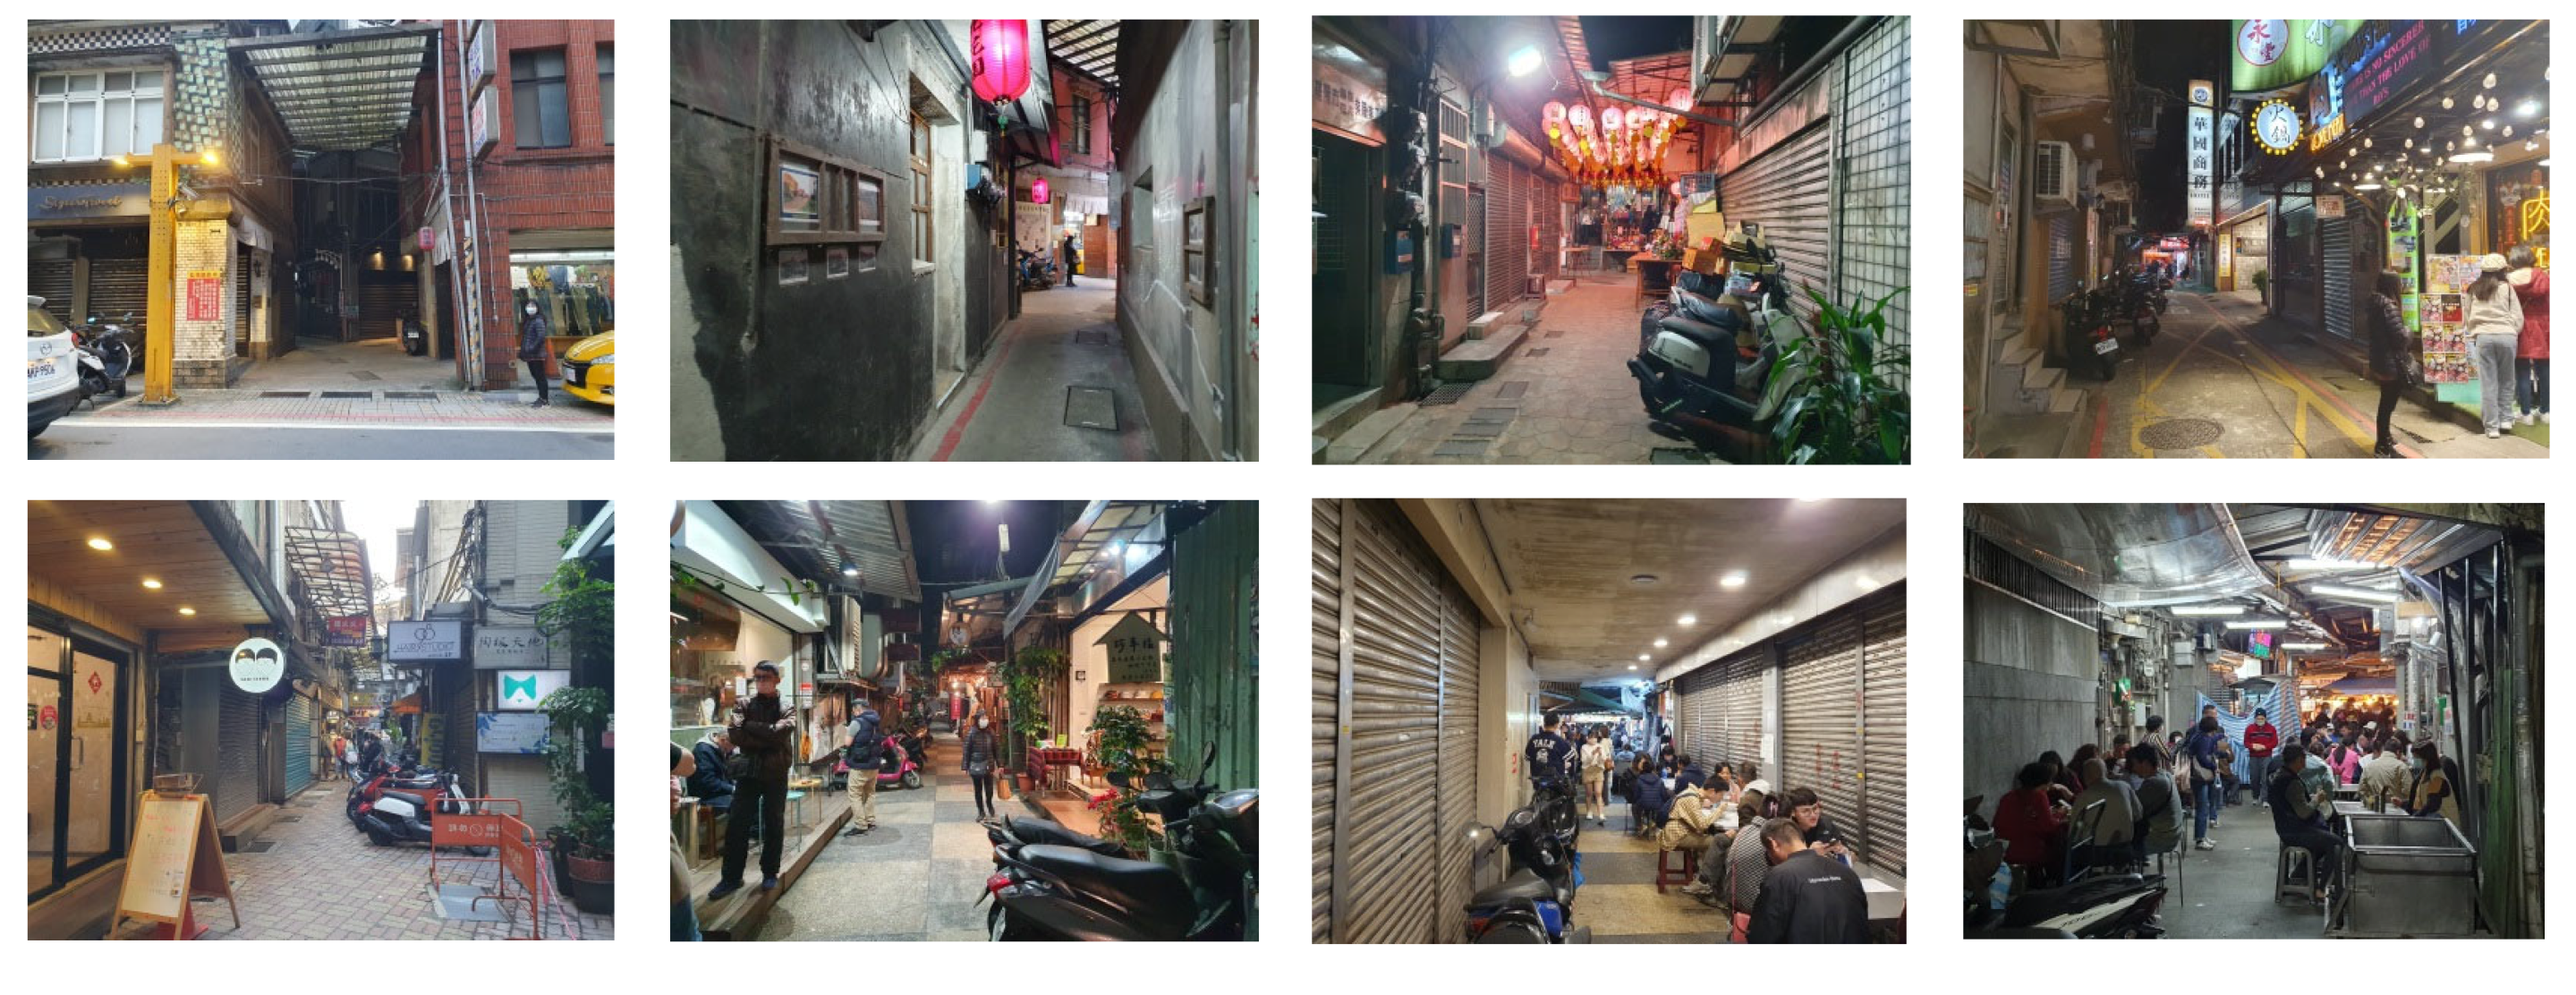
The abrupt encounter of public and private spaces makes the alleys a cultural labyrinth of mixed social space: the balcony was replaced by seats at the front door. The arcade, which was not recessed, was replaced by fixed canopies. Insufficient space for living support makes an alley a place for parking and storage. The opaque rolling door contributes to the major part of the façade after business hours. Privacy intrusion includes the short building gaps of the façade-to-façade, balcony-to-balcony, rolling door-to-door, and window-to-window distances. Protruding or extended private use is also made of the alley space. There is a shortage of drainage, garbage collection access, and ensured wide access for ambulances or fire engines. The house number and property also cause delivery confusion with regard to mail, food, gas, billing, or large furniture.
The possibility of cheap rent forms an alley with these adapted living environments and their associated business patterns. The shops open directly into the alley. The business-oriented ground floor and entrance layout also have exposed utility and advertisement panels. In addition to old temples, there are also hair salons, coffee shops, KTV, vocal studios, hotels, groceries, restaurants, flower shops, clothing shops, traditional medicine and health care centers, vending machines, retailing stores, and computer or smartphone maintenance stores.
The space is also a narrow labyrinth of facilities. An assessment of the complexity can be made by considering the meters, entangled wires, exposed utilities, and mutual sound intrusions from the second skins. The space is either under insufficient lighting or suffers the intrusion of public lighting or the decorated lanterns of temples into private spaces. The utilities include protruding advertisement panels, condensed water drain pipes of air conditioners, and bent or redirected exhaust ducts from cooling units to prevent short-distance air drafts.
4.5. GIS and 3D Visualization
The GIS-based illustration integrated the 3D visualization of the alley scale, entrance, façade, map scale, old layout, inner part of the block, and the consistent layout year of the map. The sections presented the elevated skyline of the roofs along an axis. The spaces under the skyline, which were not retrieved by the UAV, were private residential areas and were presented as a void.
Stepwise segmentation: The segmentation of the area was represented by the inside of the old and the outside of the new circulation system, as a way of proving the truncated inter-relationship between the past and the present (
Figure 9a). The sections, which were made through the central alley and through the heritage temple block (
Figure 9b), enhanced a former urban axis, which connected the temple to the harbor and further development of the commercial store block behind the temple block.
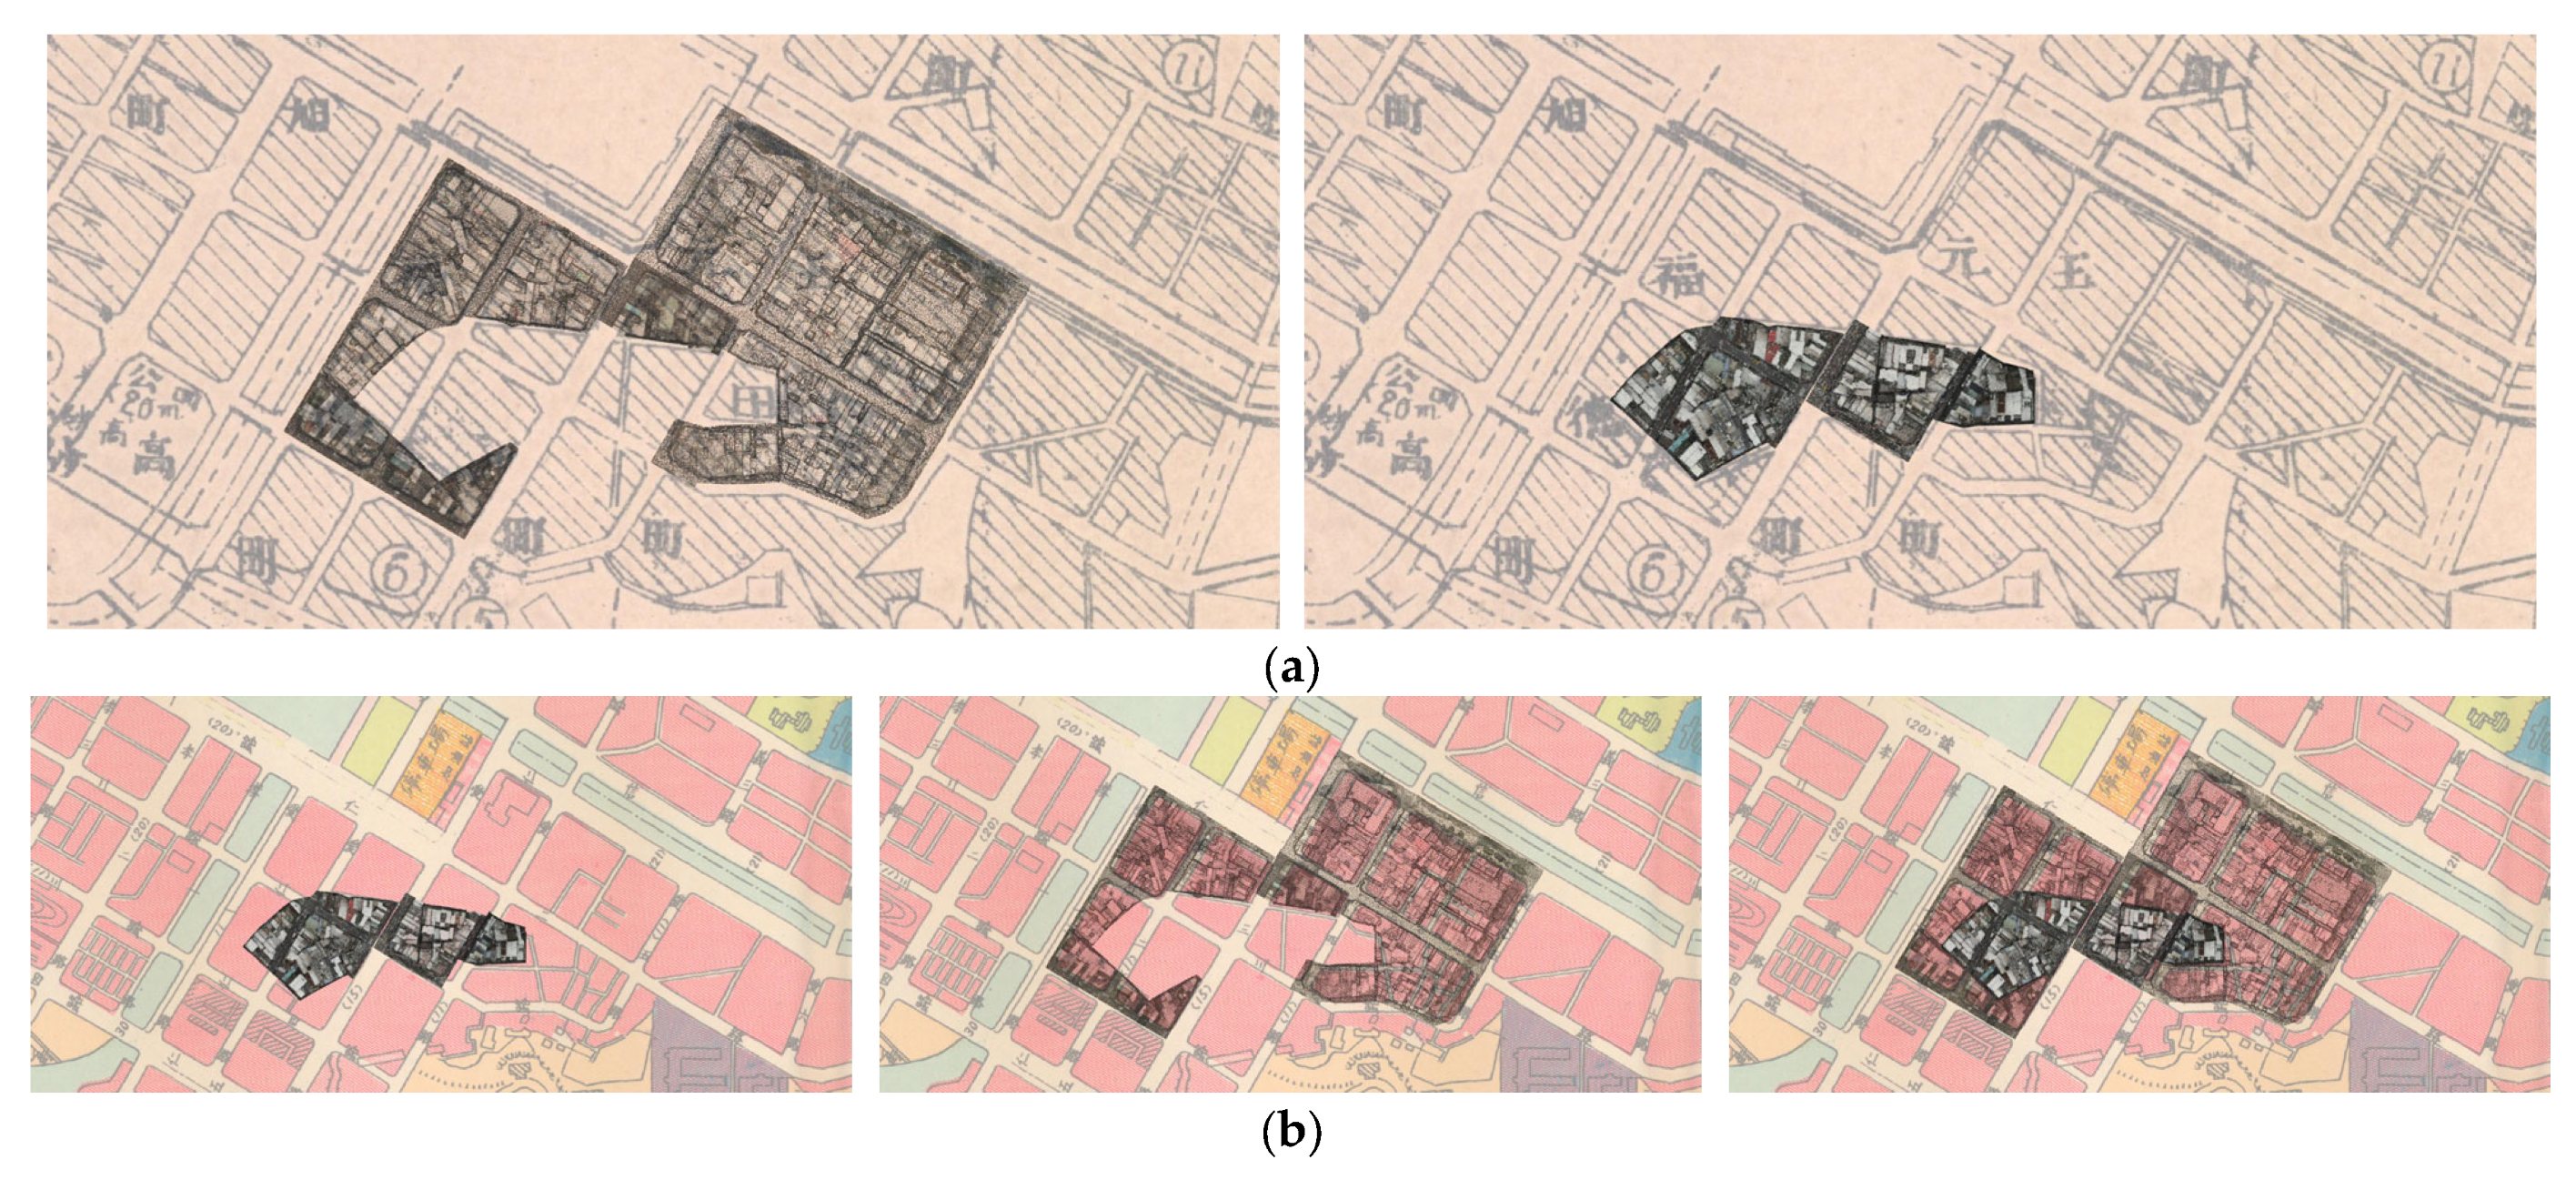
Heritage segmentation: This represented different levels of tolerance and circulation, street partitions, and offsetting by the historical maps. A stepwise historical map-based segmentation was illustrated using a 1941 map of the city inside the old and outside the new circulation system (
Figure 10a). The historical map-based segmentation (1971) presented the evolved fabric (
Figure 10b). The paths were not consistent between the maps.
Block inside a block in full scale: The 3D point model was highlighted at the center of the blocks by the difference caused by a hidden alley being exposed to the street along the old trails (
Figure 11), although the tolerance and former development of the trails varied within the maps. The relationship between the temples and commercial spaces (night market vs. commission stores) under the impact of the urban reform was presented.
We found that the 3D point model and historical maps presented a convincing explanation of the evolved fabric from the past to the present. The stepwise segmentation visualized the significant changes, which were made by the old trails and which very likely overloaded the environment inside each block.
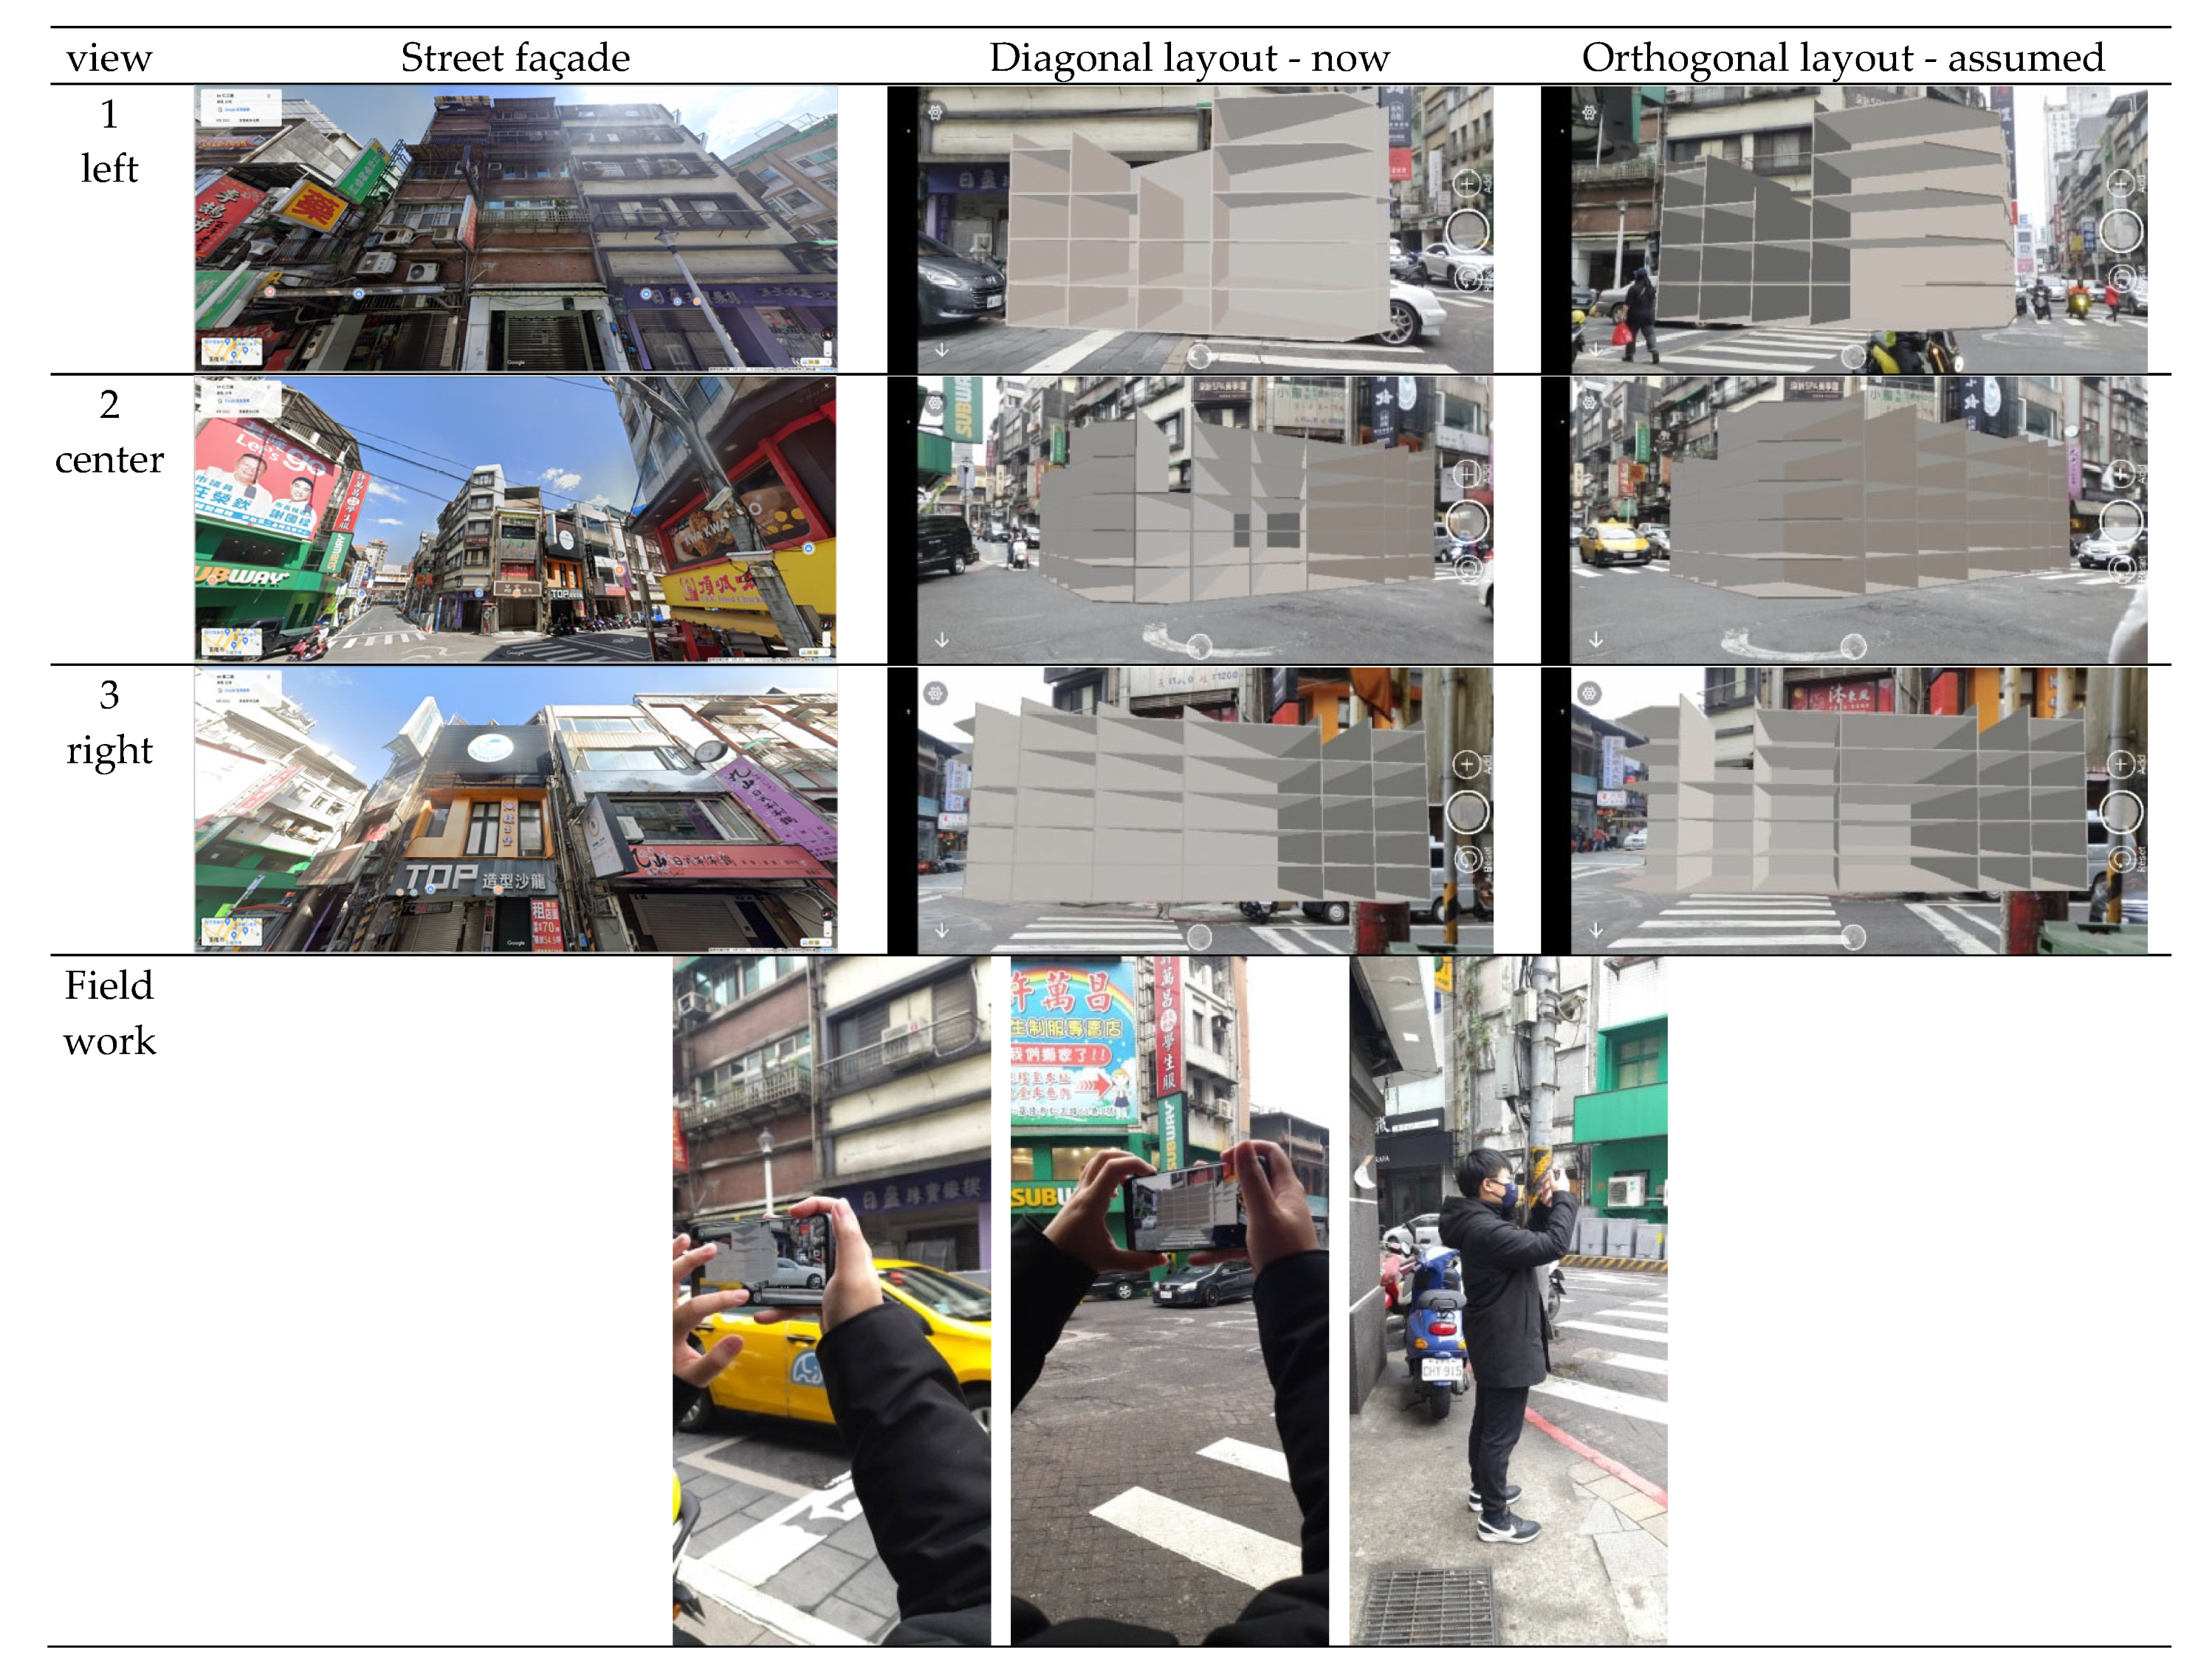
4.6. AR Interpretation
Field AR simulations were conducted on the corner of the crossroads (
Figure 12). AR models of the partitions were simulated in the same locations as the shops with the assumed orthogonal and diagonal partitioning. The unseen floor layout, which is invisible from the exterior, could only be inspected by the slightly different bay width on the façade without AR. The AR interpretation became a means of connecting the past and the present behind the second skin. The ground floor inspection was collaborated by the UAV images and was also confirmed through the roof layout.
5. Discussions
Historical urban extensions provide a better understanding of long-term urbanization and land development processes through the dynamics of the wild land–urban interface [
15]. A related study has characterized the historical landscape and evolving fabric according to their value and significance in urban reform [
13]. The renewal or replots inevitably caused a mixed layout of the old and new town and created a new interface between the structure and construction types. Urban renewal by replots exemplified a significant remodeling of the original hydrographic topology of the harbor and, moreover, the supporting urban fabric and the evolvement of the fabric over 100 years. Urban renewal contributed to the residence policy, the scale of the area, and the nature of the urban identity to enact the most sustainable and resilient strategy. Renewal for a general housing policy is also different in a harbor city, which had to trade off industry and identity under the pressure of limited land supply.
This research was conducted through the novel integration of historical maps, GIS platforms, and UAV as-built modeling. Map assessment, which presents the remaining areas and their ratios, defines the locations that are still under the old impact. Volumetric assessment was performed by 1” sensor UAV imagery collected from a low altitude for as-built data assessment. These efforts included combining historical map files in a GIS system.
5.1. Partition of Street Blocks
Although the replots or reform did destroy part of the old fabric, we found two types that were developed under different scales of block dimensions. The wider partition of the streets created isolated fabric islands inside. The inconsistent fabric configuration relied heavily on the secondary alley circulation system within a block, the old trails, to reach the outside from the entrance. The secondary system ran between the crossroads, under old buildings, and through new façades.
Truncated floor plans existed. This was made worse by the fact that the over-lengthened and bent house axis was created with exaggerated house proportions. The newly developed layout raised new environmental problems, such as those related to fire zoning and evacuation, emergency rescue, utility services, natural and artificial lighting, and ventilation. This was proven by the completely enclosed house or lot numbers inside.
Although the main part of the old trails remained, we found that the new grid system had significantly changed the floor plan and the nature of the businesses associated with the trails. The hidden fabric was remodeled by construction or reactivated by businesses. The construction also created an identity with the design of the pavements, the gateway house cantilever, or the entrances. The businesses in the downtown urban area are now shops that are more related to escape, such as coffee shops, hotels, beauty salons, karaoke bars, or bars.
In contrast, the narrower blocks were not sufficiently large in proportion or dimension to create isolated fabrics. The direct truncation, as a positive result, made a block narrower and made it easier to reach the outside, and the block had to sacrifice less to the impact of traffic. The follow-up development of the old pattern alleviated the impact of overload.
5.2. Block Center
After reviewing the earliest temple history and the former development of the bay front geography, we found that temple-centered and residentially oriented strategies of replots were developed. The replots made from the old fabric were gradually transferred from a temple-centered curve to straight lines with an orthogonal residential layout. Although the block partition avoiding the temples led to the preservation of open space inside a block (
Figure 9b), most parts of the downtown area do not have open space and depend on the old trails as the auxiliary circulation system. By following the old reform strategy, the block center still consisted of temples and residences, with new business types, such as hotels or food booths, which demand less street access. The temples and frontcourts remained, with truncated peripheral lots. Small open spaces remained within the blocks.
The original cultural identity had to be carefully maintained and, at the same time, connected to future social and environmental sustainability. It seems that the religion-centered planning guideline created the least impact and, at the same time, preserved most of the open space by using the temple front to reduce the residential density at the block center.
5.3. Maturity of Interface
An explicit or hidden interface has evolved between the inner and outer block areas. The layout of the old and new towns can be in different or juxtaposed zones. This is important, since the old part may be renewed by putting in new construction within the old spatial structure. Examples can be found during the time when the inner segment of the housing was reversed and exposed to the main streets. The old, trail-facing housing structure was reversed to face the utility lanes. Moreover, the iconic node of the junctions, which occurred between the old and new fabrics, was exposed at two crossroads.
The fabric interface was usually carefully managed in order to transfer smoothly from the past to the present. Open space was one of the most commonly adopted means of preserving the old identity while, at the same time, creating a new one [
15]. However, beyond being just an issue of old and new street-facing spatial structure, the living support between the old housing layout and the new utility space was the most direct indicator for differentiating the results of the renewal. In other words, the construction material, method, and system also demanded a new mediating interface.
After years of evolvement, a mature interface developed between the new grids and old blocks with a neo-façade partition, a preserved façade above, and a recessed pedestrian arcade. However, the immature interface between the new grids and old blocks still exists, as shown by the truncated continuity of the recessed pedestrian arcade, the insufficient width of the fire safety escape, and the inward invasion of the commercial spaces. Immature block infill has created twisty or layered connections or dead ends. Fortunately, the former immaturely amended block infill has been redeveloped by an indoor shopping arcade design, a community support group, and the local tradition of flower shops and artists in a commission store block.
The two patterns of maturity were found to be due to consistent or different fabric orientations. The solid infill of residential areas within a block, especially because of the old plots and the following of the new role inside, has also evolved, with an adapted space structure, adapted life, and adapted identity from the past. For example, a cultural reactivation program was promoted within the auxiliary degenerated commercial space in the commission store block.
5.4. Circulation Hierarchy
A sub-system to serve and circulate the inner block to a new system was developed based on the old trails. The interface between the old and new fabric impacted the circulation hierarchy, block center, and building remodeling. Each alley was constructed according to different width hierarchies. In comparison to the width of the new grids, the trails of the main former streets prior to the harbor construction had become sub-grids. The alleys were usually terminated by new streets and viaducts, as another factor in the alteration of the old fabrics, with entrances at both ends. The distance between the old alley entrances and the new crossroads could be as short as 8.5 m. The old buildings were even constructed above the alleys to create an arch-like entrance. The connecting trails in the severed blocks had fewer shops and were used as utility spaces and spare parking spaces. Remodeling was also demonstrated at the alley tops, where protruding second skins in the utilities or weather shelters within the trails were shown.
The old and new circulation systems act in supplementary or complementary roles. Both systems still interact with each other to fulfill the daily local service needs. The resilient nature presented another cultural icon of heritage, which is still heavily involved with our needs and has, at the same time, evolved with the new urban fabrics. Although the environment has degenerated, the old systems are still needed to serve the overloaded block inside another block. The originally truncated trails, which are also considered to be disconnected cultural icons, somehow lessened the load when the living volume was fully developed.
5.5. Fabric Consistency
The old and new buildings were remodeled and identified by the indicators of layout, façade, and second skin. In addition to the evolvement of the former layout, the block perimeter adapted the fabric of the floor plan and the second skin of the façade to reach out to the streets. The final adjustments, such as the remodeling of the fabric, can be found in the buildings remodeled with a consistent vocabulary. The once consistent floor width created an inconsistent layout and façade. The orientations of the old building layouts followed the old alleys and were perpendicular to the alleys. The diagonal layout was adjusted to be perpendicular to the new streets after the reform. The truncated floor plan of the street front had a bent floor plan and created façades of different widths while aligning to the street front. Moreover, the variation was exaggerated at the crossroads by two patterns on either side. The corner at the crossroads may have created shops with three street-facing façades. The one facing the old trail also increased the real estate values and defined the entrance.
5.6. Axis Consistency and Inconsistency
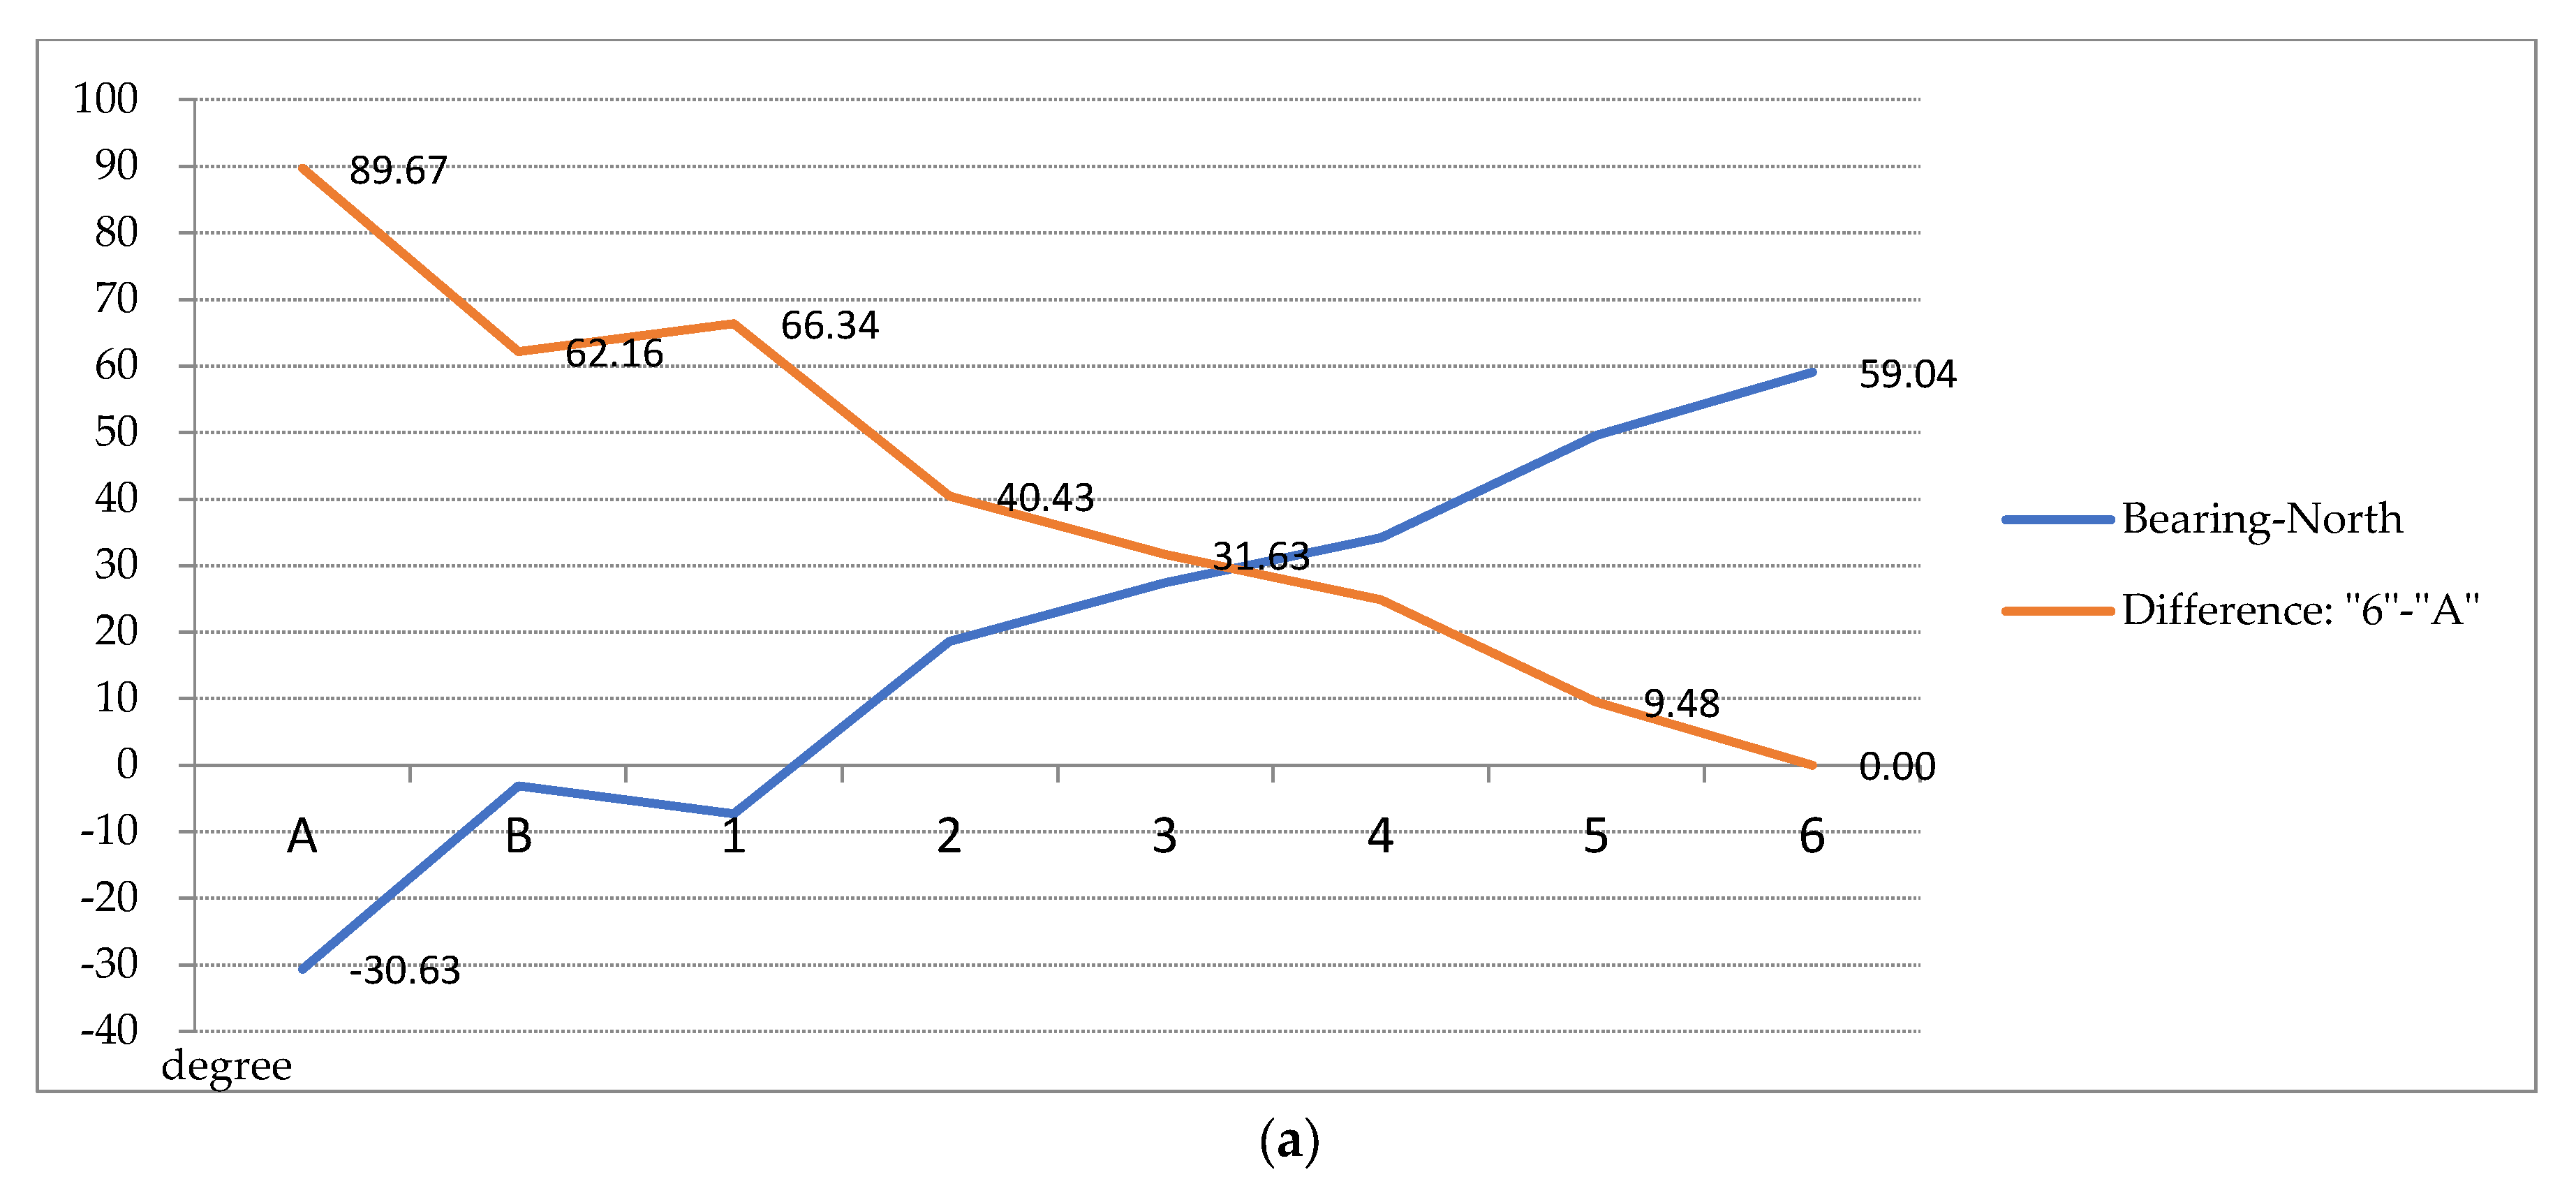
The urban axis, which represents the spatial structure of a city, frames the emphasis on evolvement. The axis also interprets the old planning strategy with its consistent elements, orientation, and infill. Based on the old street map, before the Japanese reform, the main elements, which determined the topology of the old trails, were two rivers, free-form shorelines, and hill footage. The two rivers guided the street planning by gradually reorienting or bending from a diagonal to an orthogonal orientation with reference to the harbor front. The temple orientation represented the original relation to the bay, Fensui (due north), as well as the new harbor shoreline. Old residences in-filled and connected the circulation pattern between the free-formed shorelines and the hill footage.
The consistent parts between the old and new grids or shorelines represented a reform strategy by maintaining the openness of the temple front, in order to lessen the impact of the old layout made by the two rivers, shoreline, and hill footage. The strategy smoothly transferred the fabric from the traditional religion-centered layout to the harbor-centered planning and developed the local identity from a religious culture to a harbor industry with less modification. The result is the difference between the old trails and the new horizontal grid in
Figure 13, which illustrates the variation in the orientation from 89.67 degrees to 0.00 degrees. The block and the center were orthogonally developed. An example can be seen on the axis created by the sequence of the harbor front–temple front courtyard–Ching-An Temple–bars–old trails–block front–commission stores. The further developed axis included the old riverfront and the associated fish market. Although the temple front has degenerated from when it used to be open to the sea, and is now occupied by private residences, the elimination of the contour-based influence of the shore and hill was achieved.
An inconsistent axis between the old and new grids or shorelines created tilted grids parallel to the new harbor shoreline. An example can be found on the bay–hill axis created by the sequence of harbor front–night market–snack booths—temple front courtyard–Dianji Temple–bars–old trails–bars–hill front–hill–temple–God sculpture landmark. The old streets followed the contour-based deployment of the bay shore topology. The old streets, which were truncated by other streets, became streets within blocks. The truncated axis was created by the sequence of the alley–new street–alley–new street–crossroads–alley–Earth God Temple–alley–new street.
The linear axis of hierarchy presented a cultural transformation in such a short distance under the close adjacency of the religious district and the business district. The composition of the diversified spaces also created the adjacency of the diversity and the juxtaposition of the contrasting spaces. Other than the traditional pattern of dining/local snack/food industries found near Dianji Temple by the night market, the hierarchy developed a different pattern of religion-related industry near the Ching-An Temple (Mazu Temple), such as a fish market parallel to it and the commission stores behind it. Conversely, the small scale of the Earth God Temple is enclosed inside a block and is still connected to the traditional market by a curved axis made of the remains of the old trail. As a result, the axis of the old heritage trail also presents an articulated connecting circulation system between the inner block and an important local market in a cross-street of an adjacent block.
5.7. Assessments
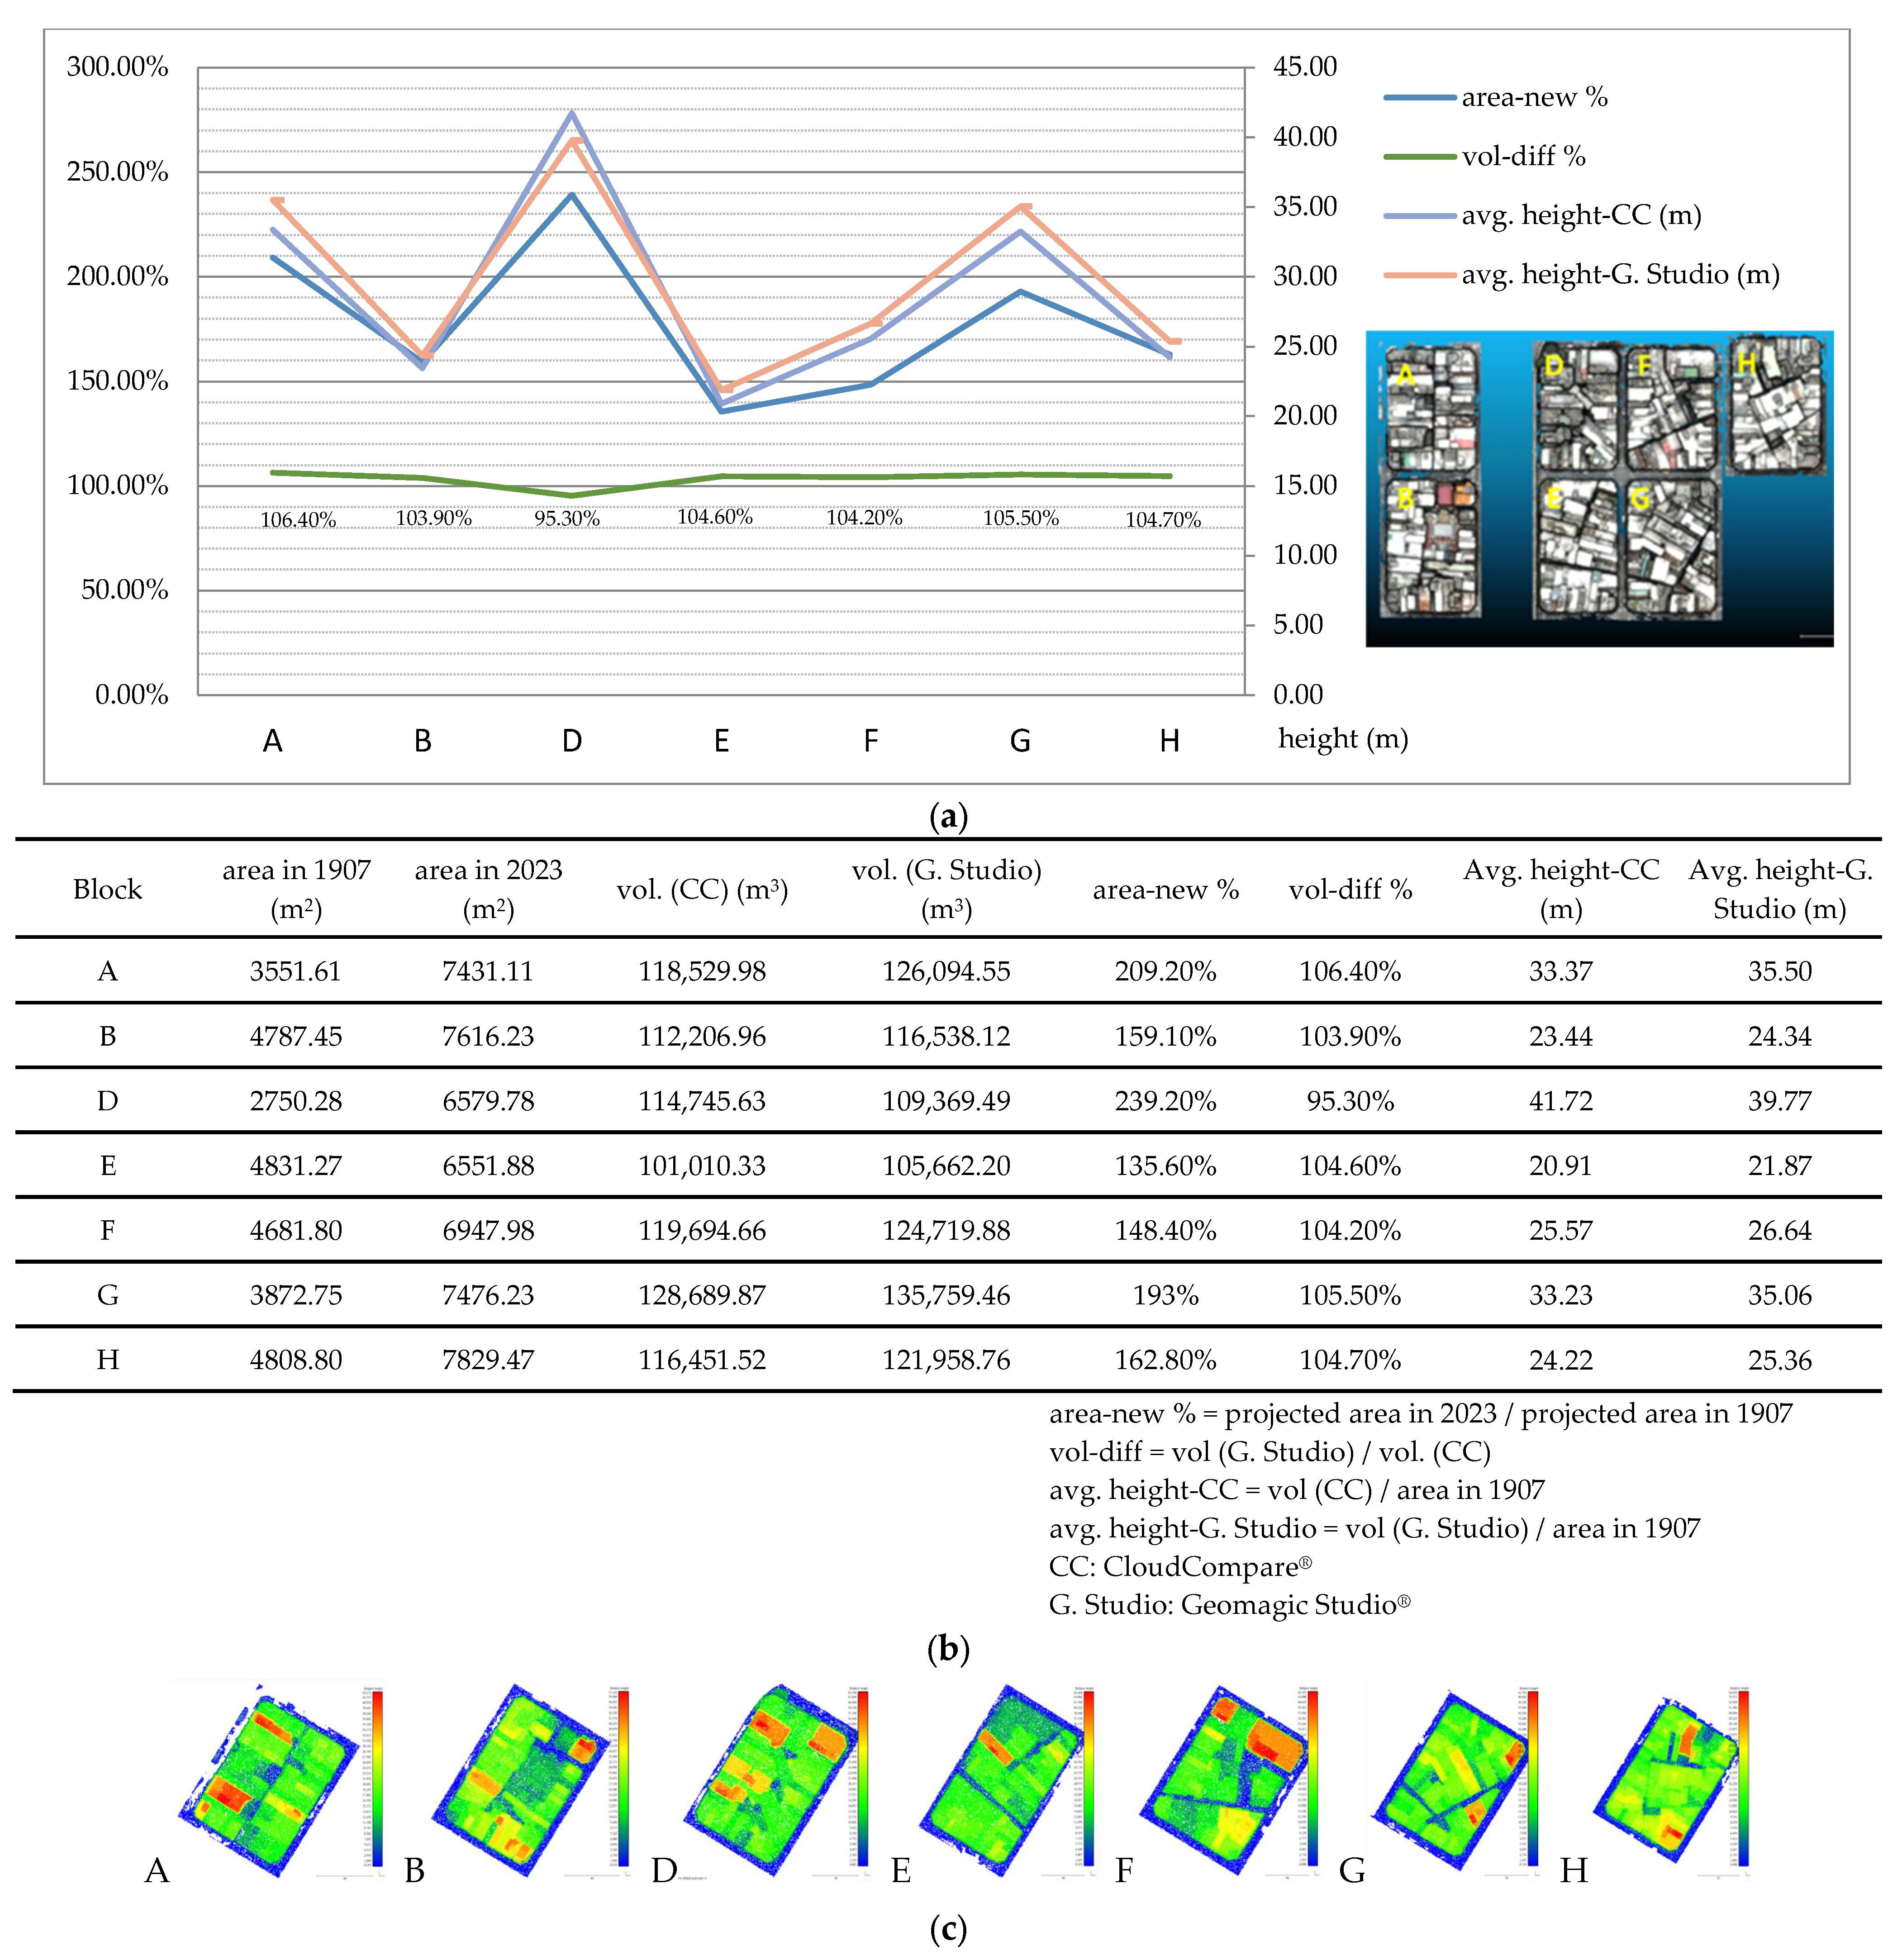
This question was raised earlier: how old is the old part of a city? It seems that this is not determined by age; instead, it is determined by the amount of area or volume of an urban space that is influenced by the old policy. For example, how much of the volume was reconstructed based on the old fabric, which was isolated from street access, influenced by the old policy, and subject to a degenerated environment? From the temple-oriented layout to the new fabric, the old urban reform created a fabric within a fabric. The area of the inner block was subjected to the old impact in the urban replots, and the volume increased after years of evolvement.
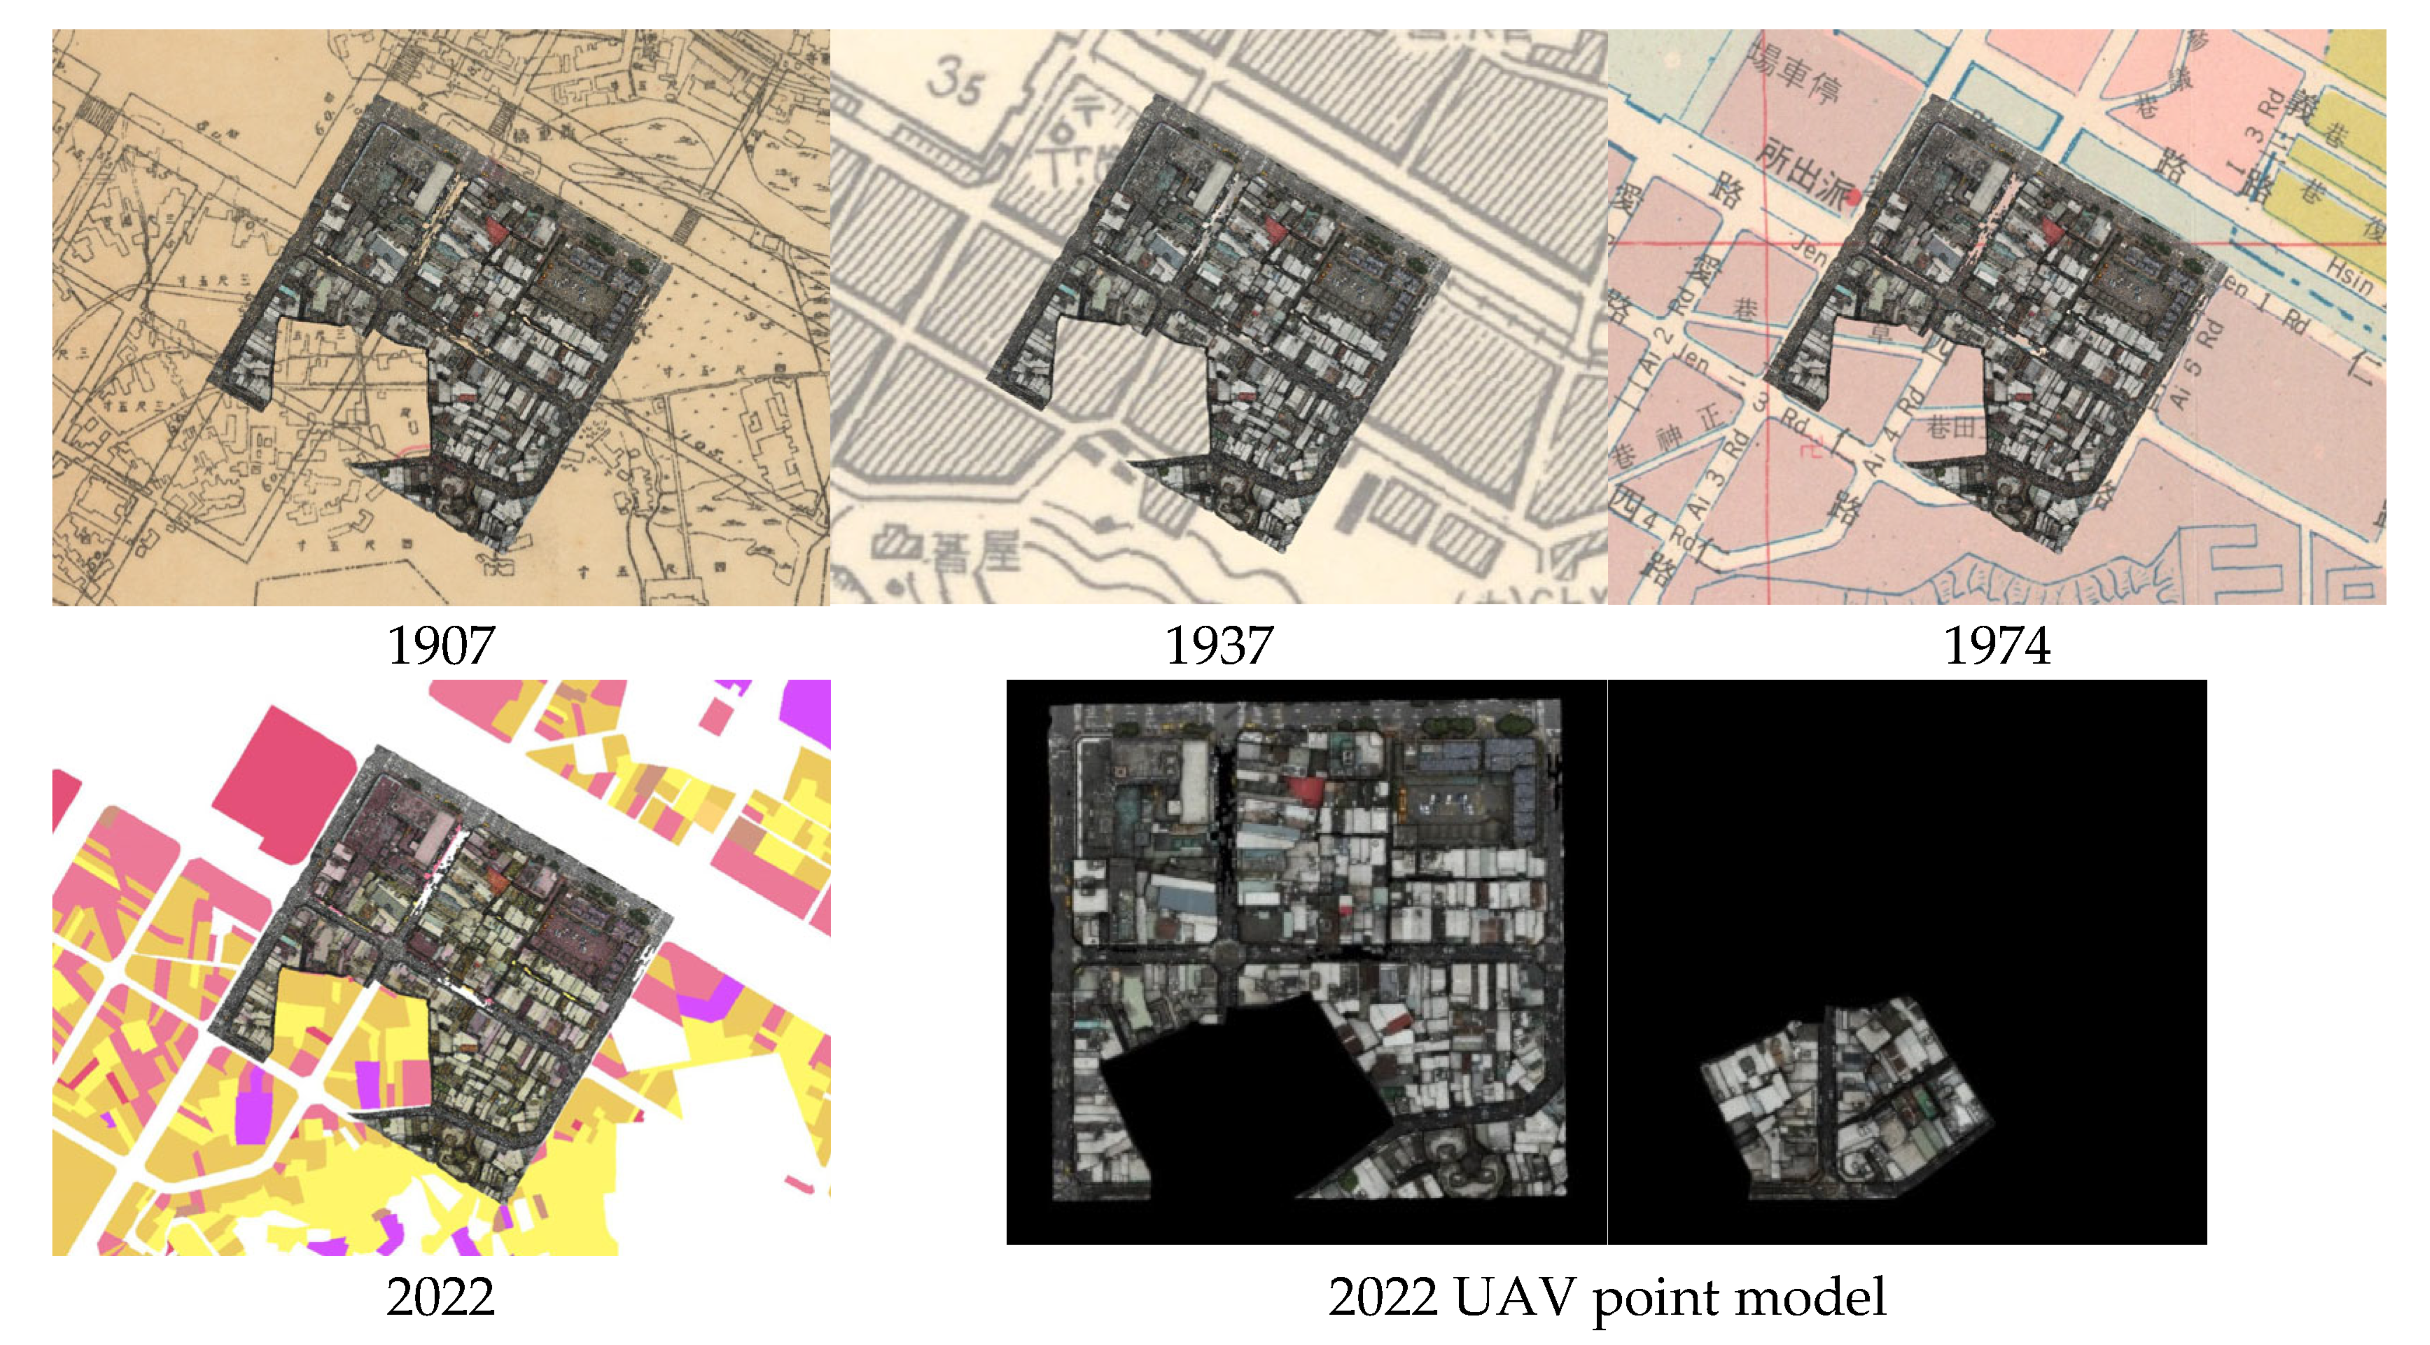
An assessment was made of the old and new construction areas within the new block boundaries in order to verify the evolved percentage. The boundary areas were traced on the 1907 map and aerial images (
Figure 5a). The ratios of the new construction areas to the old ones varied between 135.60% and 239.20% of the projected area (
Figure 14). The highest increment occurred in the harbor-facing D block. Both types of data were related by dividing the volume by the area in 1907 in order to estimate the average height of the entire block in relation to the projected construction area. It varied between 20.91 m (E block) and 41.72 m (D block) (in avg. height-CC) of the entire block. The mesh model was applied for additional volume assessment in Geomagic Studio
®, as indicated in
Figure 5c and
Figure 14. In general, the mesh model, which has clearly defined boundaries, resulted in a larger volume. As indicated in
Figure 14 “vol-diff”, a higher percentage was found in all blocks except in the D block.
Due to the remodeling of the center of the street block, the block center gradually enlarged in volume between 1 and 13 stories. However, illegal construction, generally added to the roof, increased the volumetric ratio even more. The roof additions made the height estimation of block volume incorrect when using the topographic map. This GIS information underestimated the load added to the city by one story, although not all the added parts were for residential use. This was confirmed by using the measurements retrieved from the UAV models in QGIS®.
A heritage site would not usually increase its volume or be reconstructed afterward with multiple stories on top. A residential area presents a totally different story in terms of volumetric evolvement since the former volume can be increased by many times more than that which is specified in the urban codes. The highly contrasted fabric needs as-built 3D urban models for the most complete assessment, in addition to the incomplete assessment made merely by reviewing the historical maps. As a result, the new building volumes and narrow trails degenerated, and this lessened the comfort of the environment.
In addition to the percentages of the evolving area and volume of seven street blocks in
Figure 14, more aspects of quantitative analysis were added based on existing figures at different sections of the research.
Section 5.4. Circulation hierarchy is defined for the inner trails and streets outside the block by width.
Section 5.5. Fabric consistency can refer to the assessment made in
Section 4.4.1. Infill, in which
Figure 8 assesses the occupied percentage of the inner boundary from 0% to 37.28% of each corresponding block area.
Section 5.6. Axis consistency and inconsistency can be inferred by the assessment made in
Figure 13, in which the numeric rotation in angle is introduced under the 30–60 degree bearing (N30°E and N60°W) of the existing grid, from 89.67 degrees to 0.00 degrees.
6. Conclusions
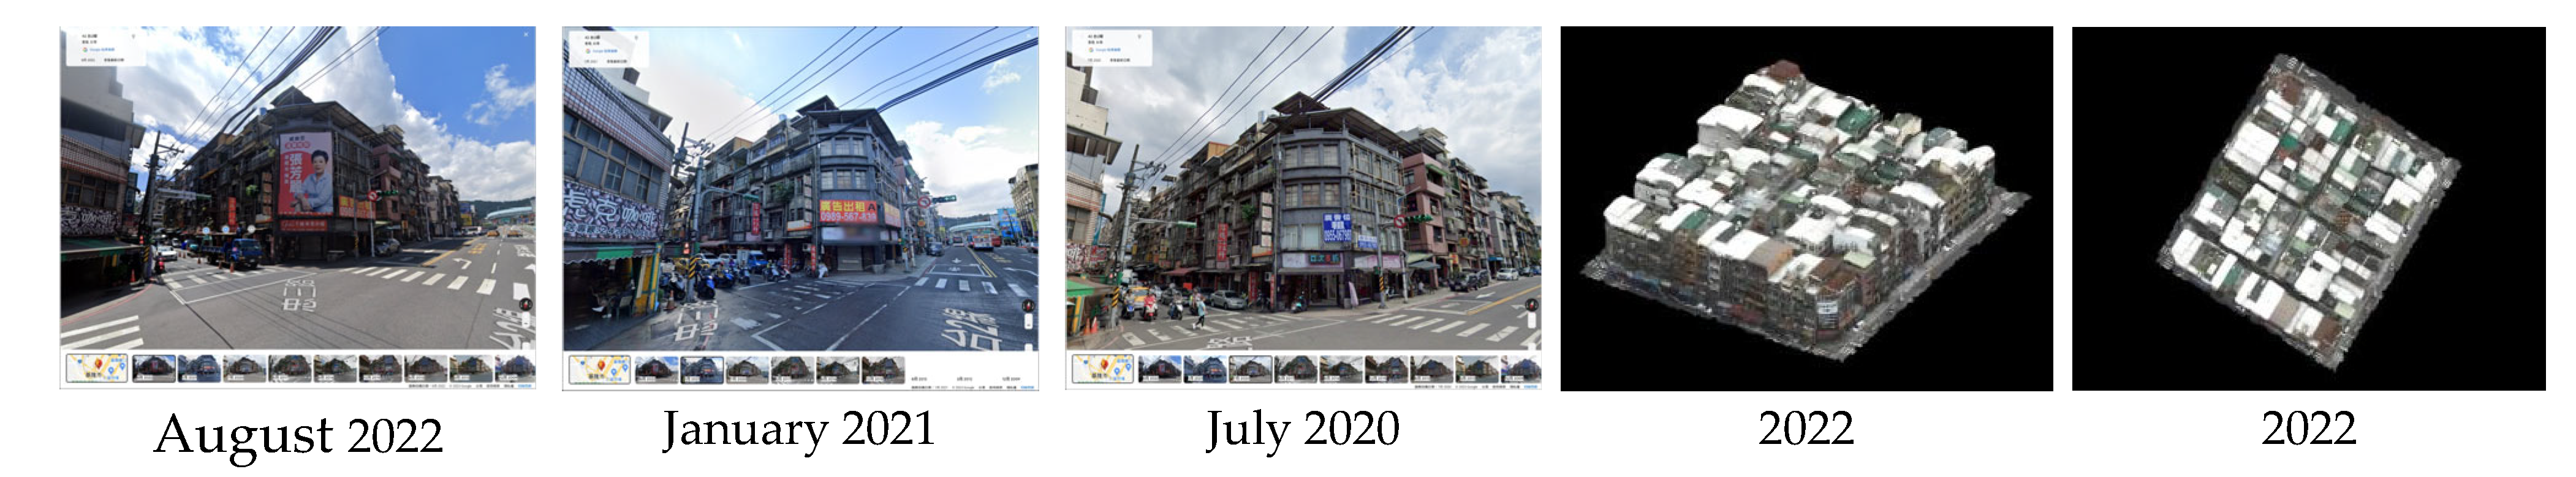
This research aims to present and assess the nested fabric adaptation, as a unique urban development, and interaction occurring in the heritage space and street block. An as-built 3D model was created using UAV imagery to compare historical and new maps. The unique fabric has evolved with the maturity of the interface, the circulation hierarchy, the fabric consistency, and the axis consistency and inconsistency. Urban reform has evolved from degeneration to cultural preservation and regeneration of living fabric.
The urban morphology presented a smooth and abrupt transition between the heritage urban fabric and the rest of the city, involving temple-centered and floor-truncated plans. The reverted house spatial structure was totally changed from the old building fronts to the service entrances hidden in the alley. The new fronts have formulated a mixed style of old and new identities. Careful observations of the missing parts of the old fabric and the reoriented plan and partition encourage the tracing of the urban evolvement, which was not only an urban reform but also an important means of formulating the current cultural landscape. The effort continues and redefines the landscape.
Whether the new approach will create a new trend remains to be seen, since the most populated alley segment is located adjacent to the night market as an auxiliary dining space. The distribution of shop types and locations presents a space still gradually departing from the rest of the city, except for the commission shop block.
The fabric within a fabric, which was assumed to encapsulate the cultural space, has mainly been replaced by different functions. The intangible identity is mainly located in the temple district and commission shop district. Moreover, the vanished part of the fabric at the crossroads has disappeared in both its tangible and intangible forms. With the assistance of AR and historical maps, the old fabric can be simulated by removing the façades to reveal the interior partition. The contrast between the solid and the empty part of its heritage makes Keelung a very interesting city with a special cultural landscape in the downtown area. The heritage alleys should not be considered utility spaces. Instead, the alleys are catalysts of great opportunity for cultural regeneration or reactivation.
Heritage development has created a new domain of RS technology. A platform should be investigated to integrate the application of RS, interaction, and urban morphology in the future. RS and GIS technologies, together with ancillary data, can be used to assist decision-makers in preparing future plans to determine the appropriate solutions to the encroachment of urbanization. AR also provides a more direct connection to the current fabric behind the façades. Future studies should be extended to different cities to determine a regional pattern of development.


