Article

Landsat Satellite Image-Derived Area Evolution and the Driving Factors Affecting Hulun Lake from 1986 to 2020

1
State Key Laboratory of Earth Surface Processes and Resource Ecology, Beijing Normal University, Beijing 100875, China
2
Center for Geodata and Analysis, Faculty of Geographical Science, Beijing Normal University, Beijing 100875, China
*
Author to whom correspondence should be addressed.
These authors contributed equally to this work.
Remote Sens. 2023, 15(10), 2682; https://doi.org/10.3390/rs15102682
Submission received: 14 April 2023 / Revised: 15 May 2023 / Accepted: 19 May 2023 / Published: 22 May 2023
(This article belongs to the Section Remote Sensing in Geology, Geomorphology and Hydrology)

Abstract

:
The area fluctuation of lakes directly affects the stability of the surrounding ecological environment. Research on the area evolution of lakes and the driving factors affecting it plays an important role in sustainable water resource management. In this study, Hulun Lake, located in the Hulunbuir grassland, was taken as the research object. Based on remote sensing images of the Hulun Lake area from 1986 to 2020, MNDWI interpretation was used to obtain the change law of lake surface area over a long time frame. Combined with natural factors and anthropogenic factors, Pearson correlation analysis and principal component analysis were used to analyze the driving force. The results showed that (1) in the past 35 years, the water surface area of Hulun Lake has decreased significantly. The dynamic change in water area could be divided into four stages. The areas with dramatic changes in water area are distributed mainly in the northeast and south of Hulun Lake. (2) In terms of natural factors, the meteorological factors based on evaporation and relative humidity, the runoff of rivers entering the lake, and the vegetation with medium-high coverage and medium-low coverage had significant effects. In terms of anthropogenic factors, the population had the most significant impact. The artificial water diversion project had different degrees of influence on the response of the Hulun Lake area change to natural factors. (3) Anthropogenic factors were the main driving force causing the rapid change in the Hulun Lake area from 2000 to 2016, explaining 48% of the change in the Hulun Lake area. These research results can provide a scientific basis for the development and utilization of water resources and sustainable development in the Hulun Lake area.

1. Introduction

Lakes are sensitive indicators of climate and environmental change. They are the connecting point of the interaction between the layers of the Earth’s surface system and an important part of the terrestrial hydrosphere [1]. Lakes play an important role in regulating water storage, degrading pollutants, and protecting biodiversity. However, in recent years, due to global climate change and the intensification of human activities, the balance of lake ecosystems has been broken, and changes in their state have seriously affected local ecological balance and security. Water surface area is an important characteristic parameter of lakes. A reduction in water surface area leads to the shrinkage of wetlands around the lake, destroys fish and bird habitats, and threatens the ecological security of lakes [2,3]. Studies have shown that lakes in arid and semiarid regions of China are facing serious shrinkage problems under the dual interference of climate change and human activities [4,5]. According to statistics, the total area of lakes in Inner Mongolia decreased from 4160 km2 in 1987 to 2900 km2 in 2010, a decrease of 30.3%. The number of lakes decreased from 427 to 282, and 145 lakes disappeared completely [6]. The loss of lake water resources has seriously damaged the service value of lake ecosystems in arid and semiarid areas and has restricted the sustainable development of the economy and society in the basin.
Hulun Lake is located in the Hulunbuir grassland of the Inner Mongolia Autonomous Region in China. It is the largest freshwater lake in the grassland area of Central Asia and is an important part of the ecological security barrier of northern China [7,8], which plays an important role in maintaining the stability of local ecosystems and economic development [9]. However, since the beginning of the 21st century, the water surface area of Hulun Lake has declined sharply, the wetland area has been reduced, and the natural resources and ecological environment have been seriously affected, which has attracted extensive attention from researchers. Zhu et al. [10] monitored the water level change in Hulun Lake through Jason-1 data and found that the water level of Hulun Lake showed a very obvious downward trend in the past three years. Zhao et al. [11] and Yang et al. [12] found that the shrinking water area of Hulun Lake has caused a decrease in vegetation coverage, a decrease in primary productivity, and an increase in land desertification area. Pang et al. [13] used multisource satellite remote sensing data to dynamically monitor the change characteristics of the wetland area in the Hulun Lake area in the past 36 years and found that the wetland of Hulun Lake showed a trend of atrophy and degradation. Chen et al. [14] found that the concentration effect caused by the continuous decline in water storage in Hulun Lake led to the evolution of the lake from a mild eutrophication level to a severe eutrophication level. Numerous studies have been conducted to investigate the water level, water quantity change, and its influencing factors on Hulun Lake. Fan et al. [15] used XGBoost to reconstruct the water storage change in Hulun Lake on a century-long time scale and studied the relationship between water volume and climatic factors. It was found that the water volume of Hulun Lake was mainly affected by precipitation, followed by water vapor pressure, temperature, potential evapotranspiration, and wet day frequency. By constructing the water balance equation of the Hulun Lake area, Guo et al. [16] and Sun et al. [17] explored the changing trend of water level, area, and storage capacity of Hulun Lake in the past 60 years, and pointed out that groundwater recharge was also an important source of water increase in Hulun Lake. Xu et al. [18] found that human activities were the most important driving factors, especially coal mining, agricultural irrigation, and grazing, which explained more than 70% of the water storage changes in Hulun Lake. Among the natural factors, evapotranspiration and runoff were the secondary factors affecting the change in lake water storage. However, these studies generally did not take into account the artificial water diversion project when examining the correlation between the dynamic changes of Hulun Lake and various influencing factors. Given that Hulun Lake is an important lake at the junction of China, Russia, and Mongolia, further research is necessary to better understand its dynamics.
In this study, we selected Hulun Lake as the research object and used Landsat remote sensing image datasets from 1986 to 2020 to extract the water area of Hulun Lake in a long time series, and comprehensively considered the influence of meteorological factors, surface runoff, vegetation succession, and anthropogenic factors including the water diversion project. Statistical methods such as the M–K trend test, Pearson correlation analysis, and principal component analysis were used to calculate and analyze the shrinking process of Hulun Lake and its driving factors and to provide a scientific basis for the development and utilization of water resources and sustainable development in the Hulun Lake area.

2. Materials and Methods
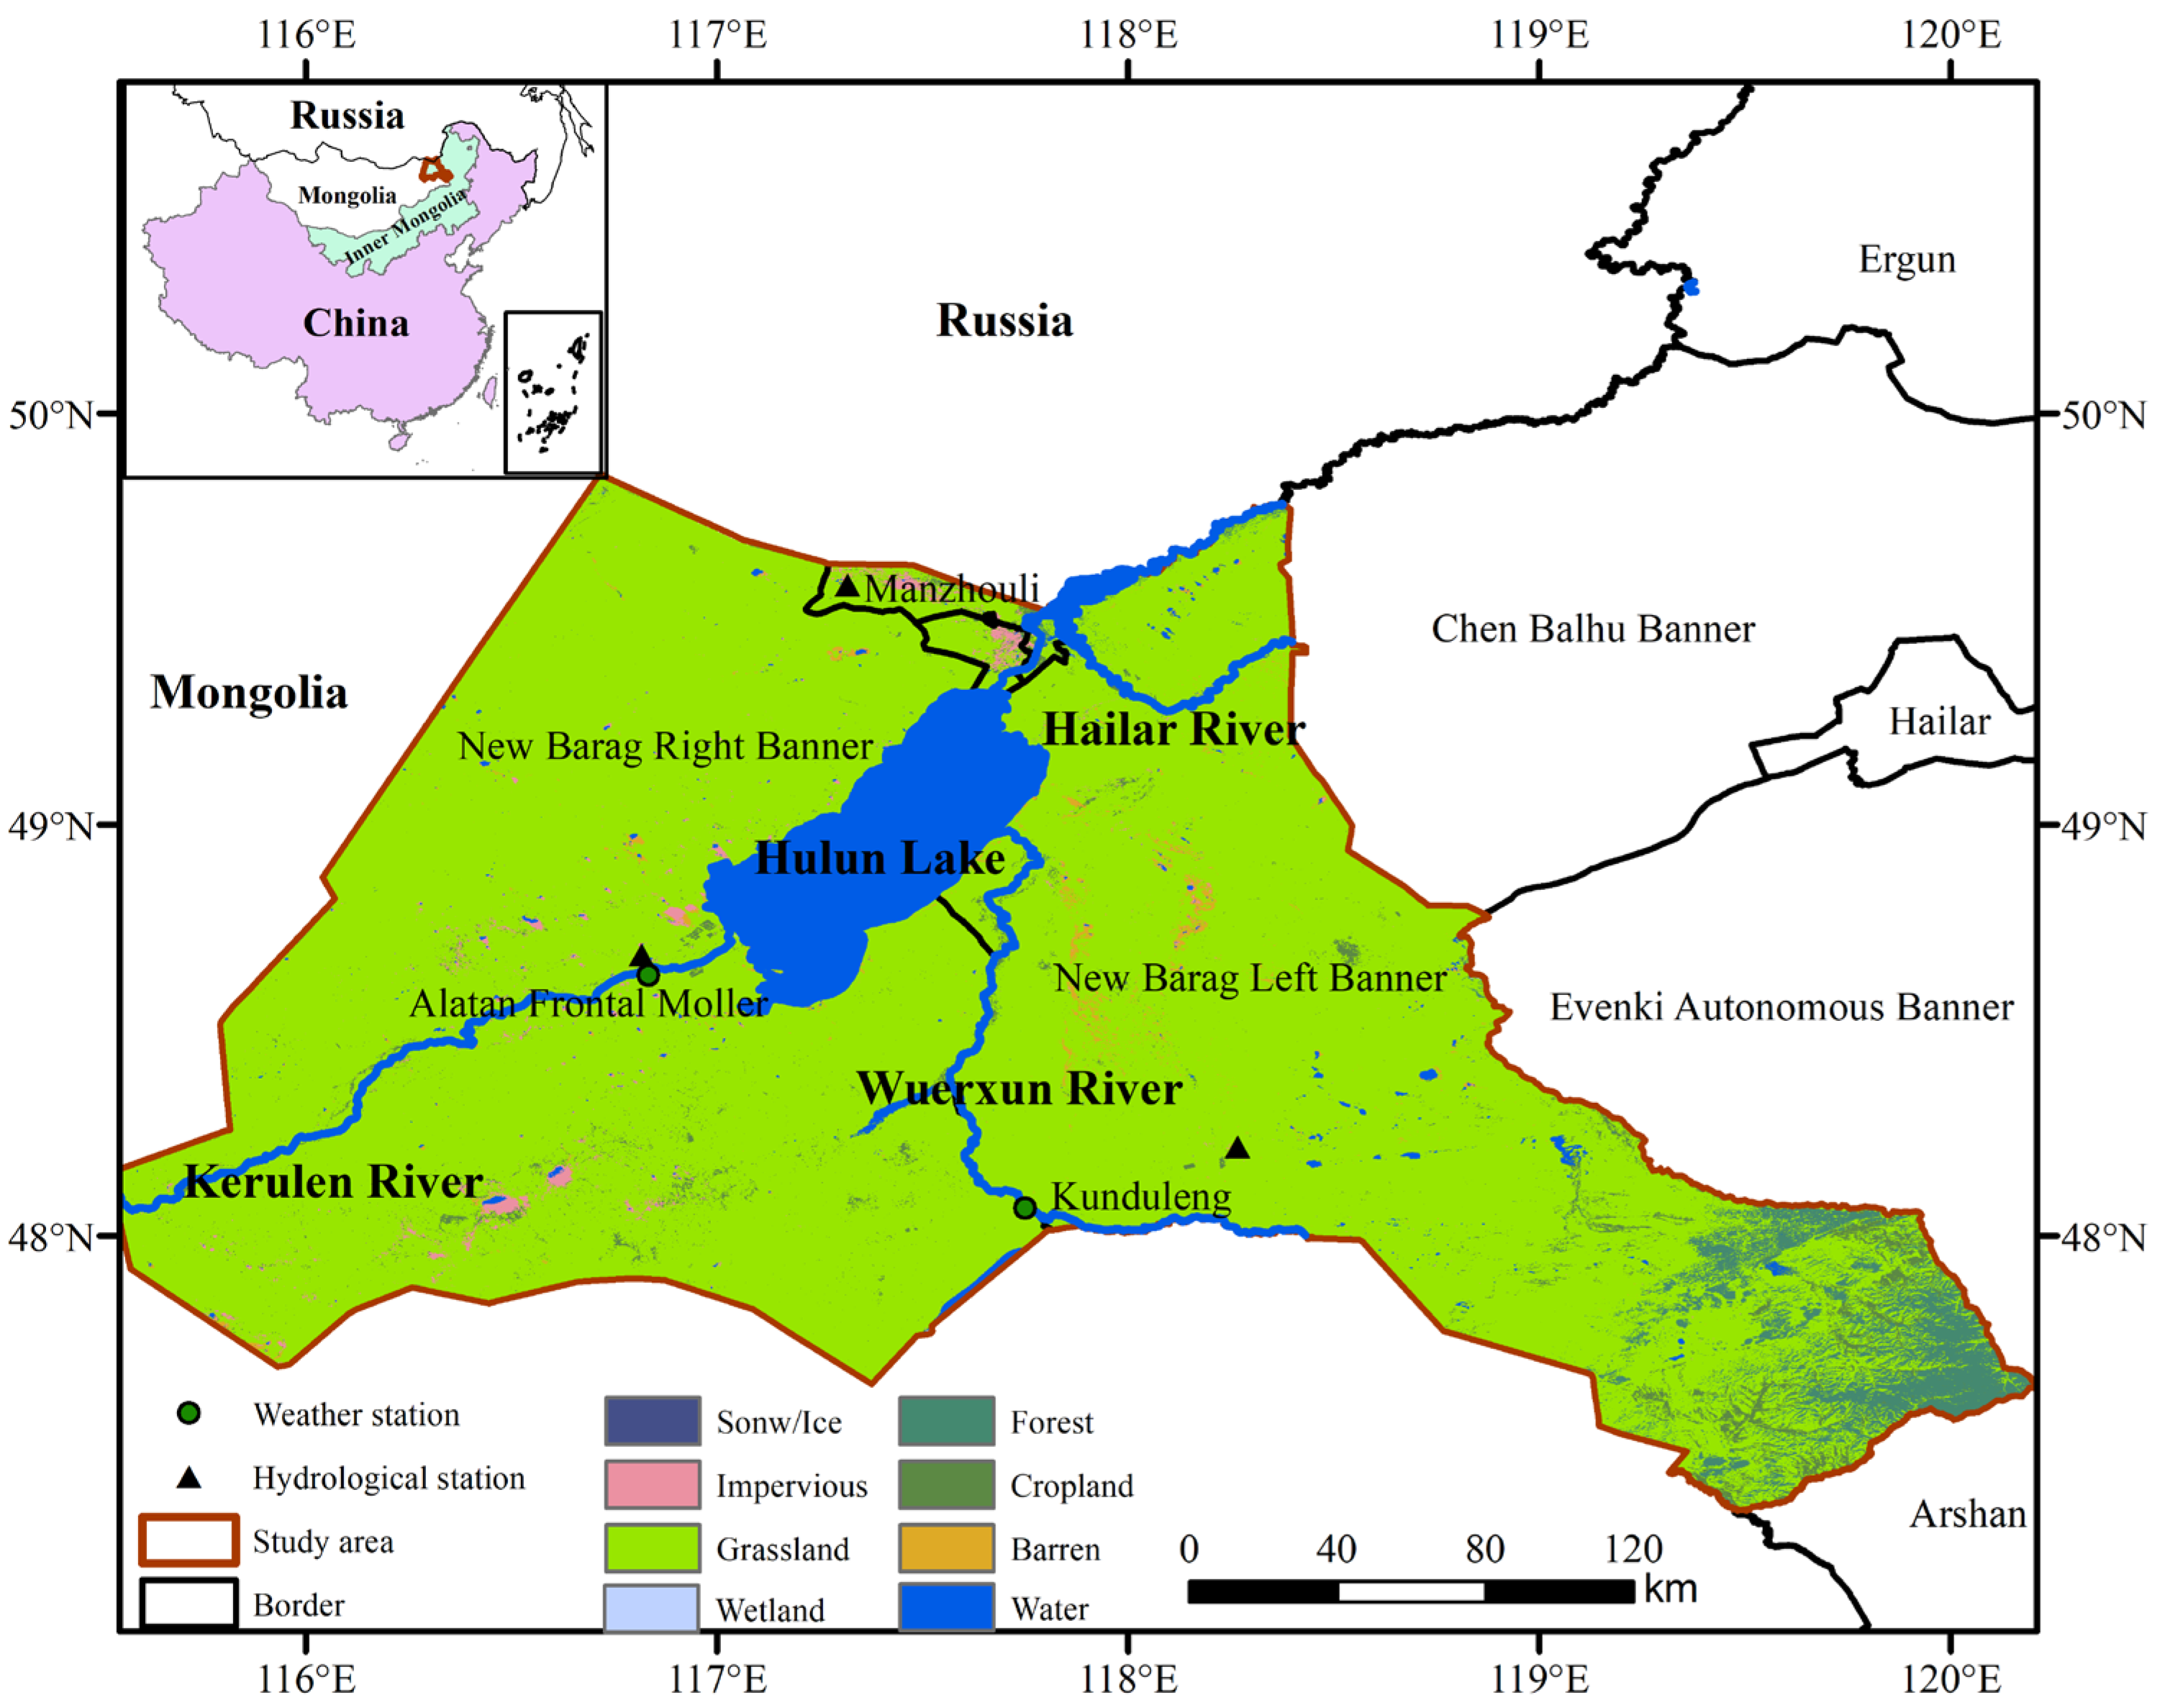
2.1. Study Area

Hulun Lake (Figure 1) is located between Manzhouli city, New Barag Left Banner, and New Barag Right Banner in the Inner Mongolia Autonomous Region, China. It is located between 116°58′–117°48′E and 48°33′–49°20′N. The lake’s surface is irregularly rectangular. According to the CLCD land use type data in 2021, 87.9% of the area is grassland. The climate is a semiarid continental monsoon climate. It has the characteristics of severe cold and long winters, dry winds in spring, sudden temperature drops, and early frost in autumn. The average annual temperature from 1986 to 2019 was 0.85 °C, and the average annual precipitation was 263 mm. The precipitation is mainly concentrated from June to September. The rivers connected to Hulun Lake include the Kerulen River, the Wuerxun River, and the Hailar River. The first two rivers are the main natural recharge sources.

2.2. Data Source and Processing

The remote sensing image data are Landsat series satellite images (TM, ETM+, OLI), and the spatial resolution of the images is 30 m. The images came from the USGS (United States Geological Survey, https://earthexplorer.usgs.gov, accessed on 8 December 2022) and were from 1986 to 2020. It is worth noting that in our study, the remote sensing images used to extract the lake surface were acquired from September to October each year. Meanwhile, the images used to calculate the vegetation coverage were acquired from May to September each year. This is important to ensure that the data used for the lake surface and vegetation coverage calculations are representative of the seasonal changes in the area. The quality of the remote sensing images selected in this study was good, and the cloud cover was less than 10%. To eliminate the influence of sensor factors on the spectral information of ground objects, ENVI 5.3 software was used to preprocess the Landsat series satellite remote sensing data. The preprocessing included cloud removal, orthorectification, radiometric calibration, atmospheric correction, and other steps. Landsat 7 ETM+ data were processed using strip restoration.
The water body data came from the JRC (Joint Research Centre of European Commission) global surface water data provided by Google Earth Engine. JRC is a global surface water product with 30 m resolution produced using all corrected Landsat 5, 7, and 8 archived data and other auxiliary data since 1984. The overall omission error is less than 5%, and the commission error is less than 1%, which has high accuracy on a global scale [19]. In this study, JRC data every 10 years from 1990 to 2020 were selected as the validation dataset for the comparative verification of the lake area extraction results.
The meteorological data mainly came from the daily average temperature, precipitation, average relative humidity, and evaporation of three meteorological stations around Hulun Lake (Manzhouli, New Barag Right Banner, and New Barag Left Banner) from 1986 to 2019 and were provided by the China Meteorological Administration. The vapor pressure data came from Climatic Research Unit (CRU), which provides a long-timescale gridded dataset on a global scale [20]. The runoff data came from the Kunduleng and Alatan Frontal Moller hydrological stations from 2000 to 2020. The socioeconomic data came from the population, GDP, industrial output value, and agricultural output value of Manzhouli city, New Barag Right Banner, and New Barag Left Banner from 2000 to 2016.

2.3. Research Methods

2.3.1. Water Area Extraction

The methods for extracting lake water information mainly include the single-band threshold method, spectral relationship method, exponential model method, supervised classification method, and decision tree method. Among them, the water index method combined with threshold segmentation to extract water bodies is the fastest and most reliable [21]. Based on the idea of the normalized difference vegetation index (NDVI), McFeeters [22] constructed the normalized difference water index (NDWI) by using the green band and near-infrared band of the TM image. Xu Hanqiu [23] proposed a modified normalized difference water index (MNDWI) based on the analysis of the NDWI, and it replaced the original near-infrared band with the mid-infrared band and improved the water extraction effect. The studies by Dong et al. [24] and Xu et al. [25] also verified the reliability of the MNDWI method. Moreover, studies [26] have shown that for eutrophic lakes, the MNDWI can better bypass the effects of suspended solids and algae and is better for land–water separation. Therefore, we used the modified normalized difference water index (MNDWI) to extract the water area of Hulun Lake. The calculation formula is as follows:
M N D W I = ( ρ G ρ M I R ) / ( ρ G + ρ M I R )
where  ρ G  is the wavelength of the green band, and  ρ M I R  is the mid-infrared wavelength. Numerous studies [27,28,29] have shown that lakes in arid and semi-arid regions have seasonal differences and are affected by winter snow cover. Therefore, the months obtained by remote sensing images in this study were mainly concentrated in September-October, during which the lake area reached the stable maximum value of the year. When extracting the lake surface, the average value of available images from September to October was calculated as the lake area of the year. The extraction range included Hulun Lake and its upper right affiliated small lake (Xin Dalai Lake).

2.3.2. Precision Validation

To verify the accuracy of water extraction, the image taken by Maxar Technologies on Google Earth on 2 October 2012 was used as the reference data. The lake water boundary was obtained by visual interpretation, and 400 sample points were selected using random sampling method, including 200 water samples and 200 non-water samples. According to the water extraction results, the confusion matrix was generated using producer accuracy (PA), user accuracy (UA), overall accuracy (OA), and kappa coefficient (Kc) as the bases for the accurate evaluation of the Hulun Lake water body. PA represents the consistency between the reference data and the classified pixels. UA is the evaluation index of the degree of coincidence between the classified pixels and the reference data. OA is the percentage of correctly classified pixels in the total classified pixels, and this index measures the overall performance of the water body recognition algorithm [30]. The calculation formulas of the confusion matrix method are as follows:
P A = S i j S i × 100 %
U A = S i j S j × 100 %
O A = S N × 100 %
K c = N × S i = 1 r S i S j N 2 i = 1 r S i S j
where  S  is the sum of correctly classified pixels,  N  is the sum of verified pixels,  r  is the number of rows,  S i j  is the observed value of row  j  in column  i S i  is the marginal total number of row  i , and  S j  is the marginal total number of column  j .

2.3.3. Pixel Dichotomy Model and Vegetation Coverage Classification

As the most widely used linear mixed pixel decomposition model, the pixel dichotomy model [31] has the advantages of a simple and reliable calculation model, universal data parameters, and high inversion accuracy. In this study, the pixel dichotomy model was used to invert the vegetation coverage in the study area. The calculation method is as follows:
F V C = N D V I N D V I soil N D V I v e g N D V I soil
where  F V C  is the vegetation coverage;  N D V I  is the normalized difference vegetation index;  N D V I soil  is the NDVI value of completely bare soil or no vegetation coverage area; and  N D V I v e g  is the NDVI value of a pixel completely covered by vegetation, that is, the NDVI value of a pure vegetation pixel. According to the research of many scholars, we used 5% and 95% confidence to intercept the upper and lower thresholds of the NDVI on the cumulative frequency histogram to determine the NDVIsoil and NDVIveg, respectively. We selected May to September as the vegetation growth season in the Hulun Lake area and selected a total of 35 remote sensing images from 1986 to 2020 to calculate and analyze the vegetation coverage.
We referred to the estimation method proposed by Li [31] and Gutman et al. [32] to classify the vegetation coverage, as shown in Table 1.

2.3.4. Mann–Kendall Test

In this study, the nonparametric rank Mann–Kendall (M–K) test was used to analyze the trend of data change. The nonparametric test does not make any assumptions about the distribution of data, which helps to detect monotonic trends, and is widely used in trend analysis. The M–K test further analyzes the trend changes of the sequence in a certain period by analyzing the statistical sequence UF and BF and determines whether the sequence has a mutation, as well as the time and region of the mutation. The calculation formula is as follows [33]:
U F i = S i E ( S i ) V a r ( S i ) ( i = 1,2 , n )
S k = i = 1 k r i ( k = 2,3 , n )
r i = + 1 , x i > x j 0 , x i x j
where  x i  is a variable that is an independent variable and a random variable with the same distribution, and  n  is the sample size. The expected value  E ( S i )  and variance  V a r ( S i )  can be estimated as follows:
E ( S i ) = i ( i 1 ) 4
V a r ( S i ) = i ( i 1 ) ( 2 i + 5 ) 72
where  U F i  is a standard normal distribution. At the significance level α (generally α = 0.05, Uα = ± 1.96), | U F i | > || indicates that the sequence has a significant increasing or decreasing trend. A positive  U F i  value indicates an increasing trend, and a negative  U F i  value indicates a decreasing trend. All  U F i  form UF curves, and the reliability test can be used to determine whether there is a significant change trend. The above method is applied to the inverse sequence, and the above calculation process is repeated. The calculated value is multiplied by −1 to obtain UBi. UBi is represented as UB in the figure. If the intersection of UF and UB is between the reliability line, this point may be the beginning of the mutation point.

2.3.5. Pearson Correlation Coefficient and Principal Component Analysis

In this study, the Pearson correlation coefficient method was used to analyze the correlation between the water area of Hulun Lake and natural factors (precipitation, temperature, relative humidity, evaporation, vapor pressure, wet day frequency, surface runoff, vegetation coverage) and anthropogenic factors (population, GDP, industrial output value, agricultural output value). On this basis, principal component analysis (PCA) was used to extract the principal components of the influencing factors, and the shrinking process of Hulun Lake and its driving forces were analyzed.
(1)
Pearson Correlation Coefficient
Pearson correlation analysis is used to study the relationship between quantitative data, including whether there is a relationship and the degree of the relationship. The correlation coefficient is calculated as follows:
r = i = 1 n ( X i X ) ( Y i Y ) i = 1 n ( X i X ) 2 i = 1 n ( Y i Y ) 2
In the formula,  X ( x 1 , x 2 , , x n )  and  Y ( y 1 , y 2 , , y n )  are two continuous correlation variable sequences;  r  is the correlation coefficient, which is between −1.0 and 1.0. The greater the absolute value of  r , the higher the correlation is between the dependent variable and the independent variable: 0–0.09 is no correlation, 0.1–0.3 is a weak correlation, 0.3–0.5 is a moderate correlation, and 0.5–1.0 is a strong correlation.
(2)
Principal Component Analysis (PCA)
Principal component analysis adopts a mathematical dimension reduction method to find several comprehensive variables to replace the original numerous variables so that these comprehensive variables represent the original variable information as much as possible and are not related to each other. For sample data, the data matrix of the sample is [34]:
X = x 11 x 12 x 1 p x 21 x 22 x 2 p x n 1 x n 2 x p p
where  p  is the number of observed variables;  n  is the total number of samples; and  x y  is the jth observed value of the ith sample.
Based on the idea of dimension reduction, the original variables  x 1 , x 2 , , x p  with certain correlations were recombined into a new set of mutually independent comprehensive variables  Z 1 , Z 2 , , Z m ( m p )  through linear combination and screening, then:
Z 1 = a 11 x 1 + a 21 x 2 + + a p 1 x p Z 2 = a 12 x 1 + a 22 x 2 + + a p 2 x p Z m = a m x 1 + a 2 m x 2 + + a m m x p
where  a y  denotes the coefficients of the original variables  x 1 , x 2 , , x p  on the principal components  Z 1 , Z 2 , Z m ( m p ) , which is the unit eigenvector corresponding to the larger m eigenvalues in the correlation coefficient matrix of  x 1 , x 2 , , x p . According to the calculated principal component, its contribution rate is as follows:
r = p i i = 1 m P i
where  r  represents the contribution rate of each principal component;  p i  denotes the variance of the ith principal component.
The number of principal components is mainly determined by the cumulative contribution rate of the principal components. The greater the contribution rate is, the stronger the information of the original variables contained in the principal component. The cumulative contribution rate is generally required to be greater than 70% to ensure that the comprehensive variable can include the vast majority of the original variable information.

3. Results

3.1. Hulun Lake Area Extraction Accuracy Verification

In this study, the accuracy of the Hulun Lake water area extracted based on the MNDWI was high. The overall accuracy of the 400 sample points reached 95.25%, and the kappa coefficient was 0.905 (Table 2a). Compared with similar studies, based on Landsat 8 images, Wang et al. [26] used the MNDWI method to obtain a 95.17% overall accuracy and a 0.903 kappa coefficient in the extraction of Taihu Lake with a high cyanobacteria content. Based on the Resourcesat-2 AWiFS satellite image and the MNDWI, Singh et al. [35] obtained an overall accuracy of 96.9% and a kappa coefficient of 0.89 in water extraction in India. The results showed that the extraction of surface water based on the MNDWI was reliable and accurate.
The extraction results were compared with the JRC global water body data. As shown in Figure 2, the change trend of the lake area extracted by the two was the same as the time trend. The water area of Hulun Lake extracted in this study was generally smaller than that of the JRC global water body data. The average relative error of the area extracted by the two was 3.46%. The confusion matrix of the water body extracted by JRC (Table 2b) showed that the overall accuracy was 79.75%, and the kappa coefficient was 0.595. The extraction accuracy of this product in Hulun Lake was lower than that of this study.

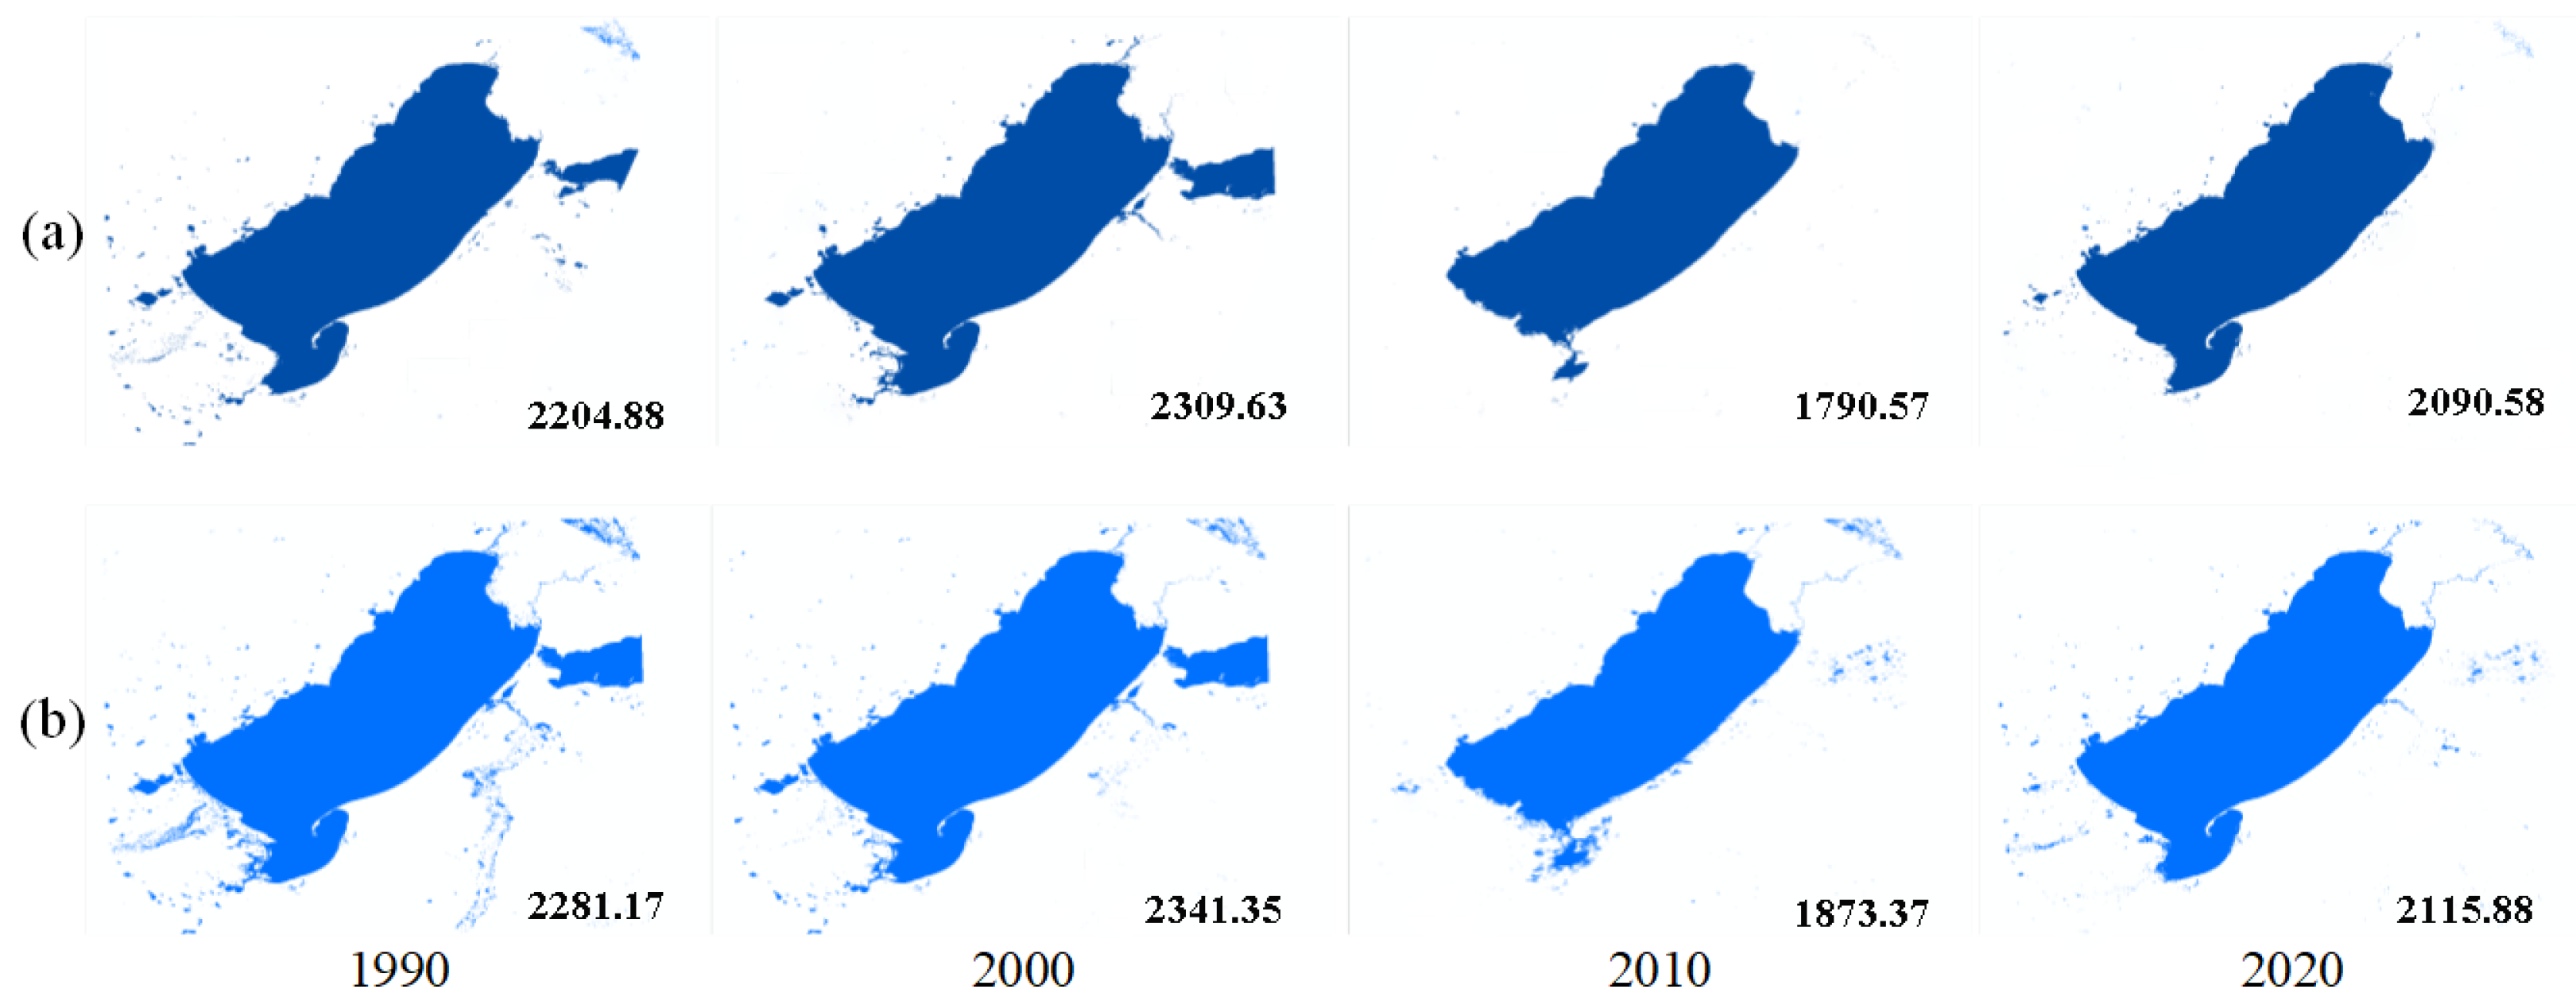
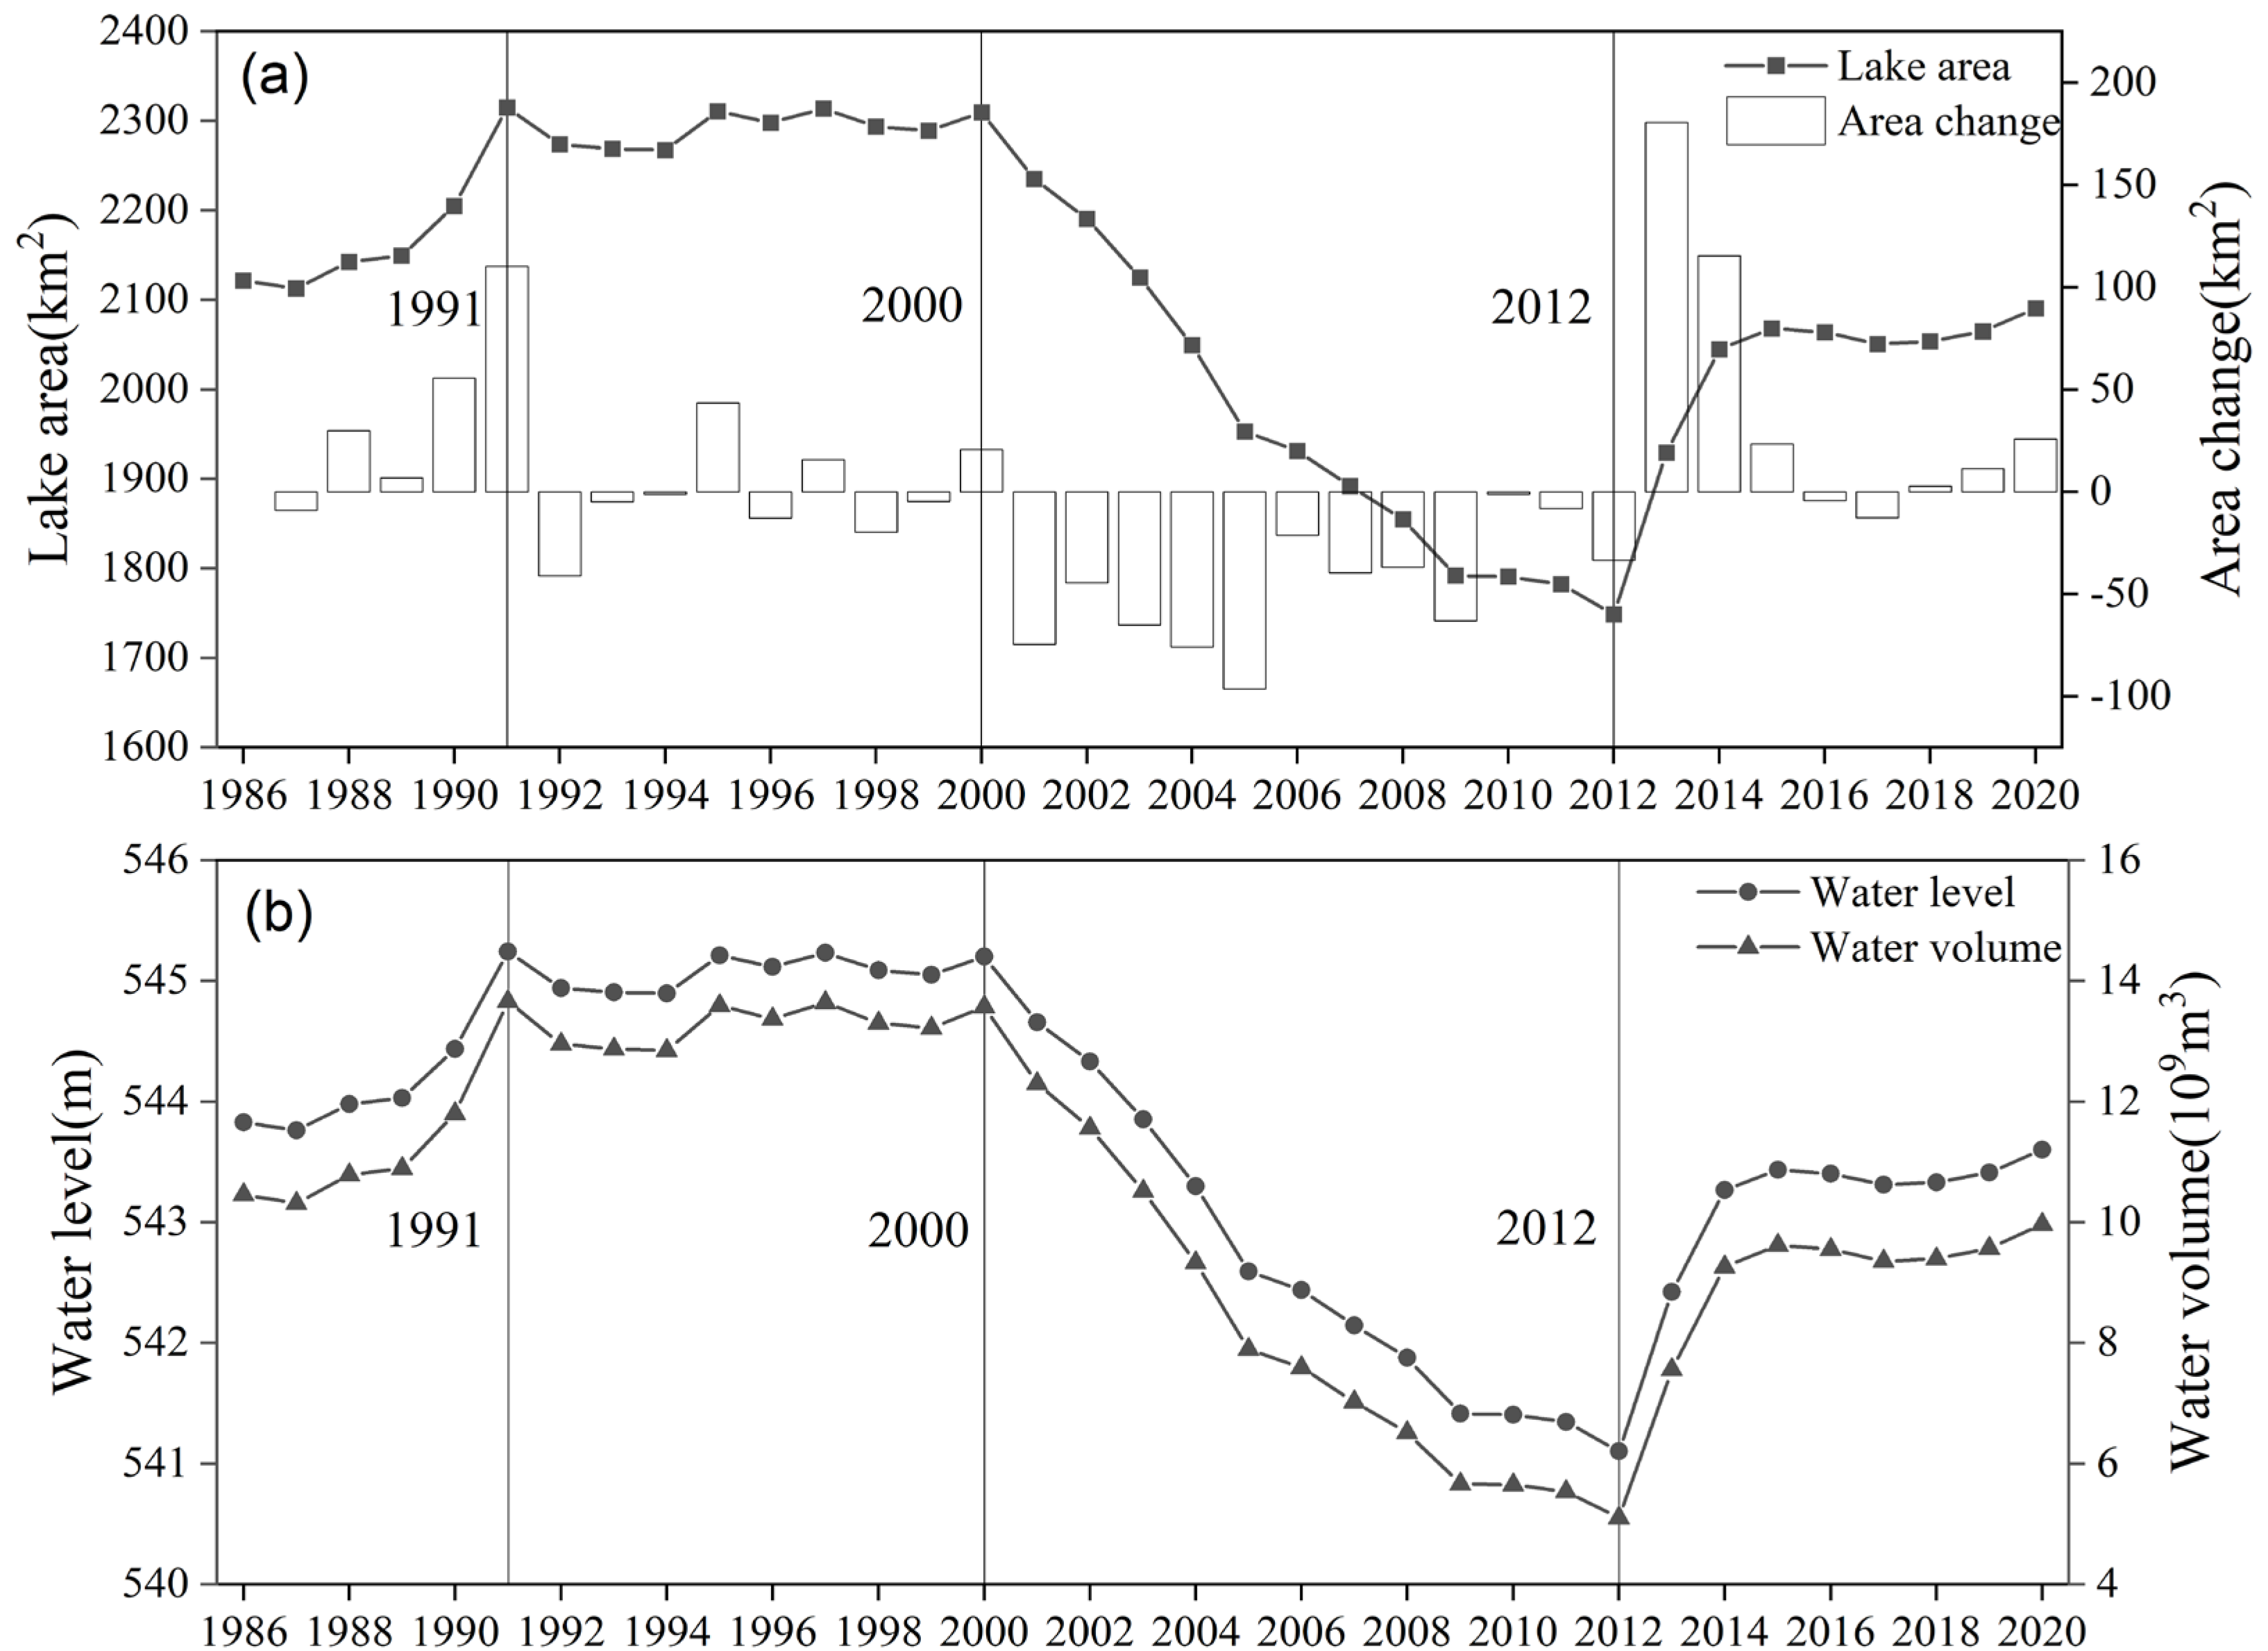
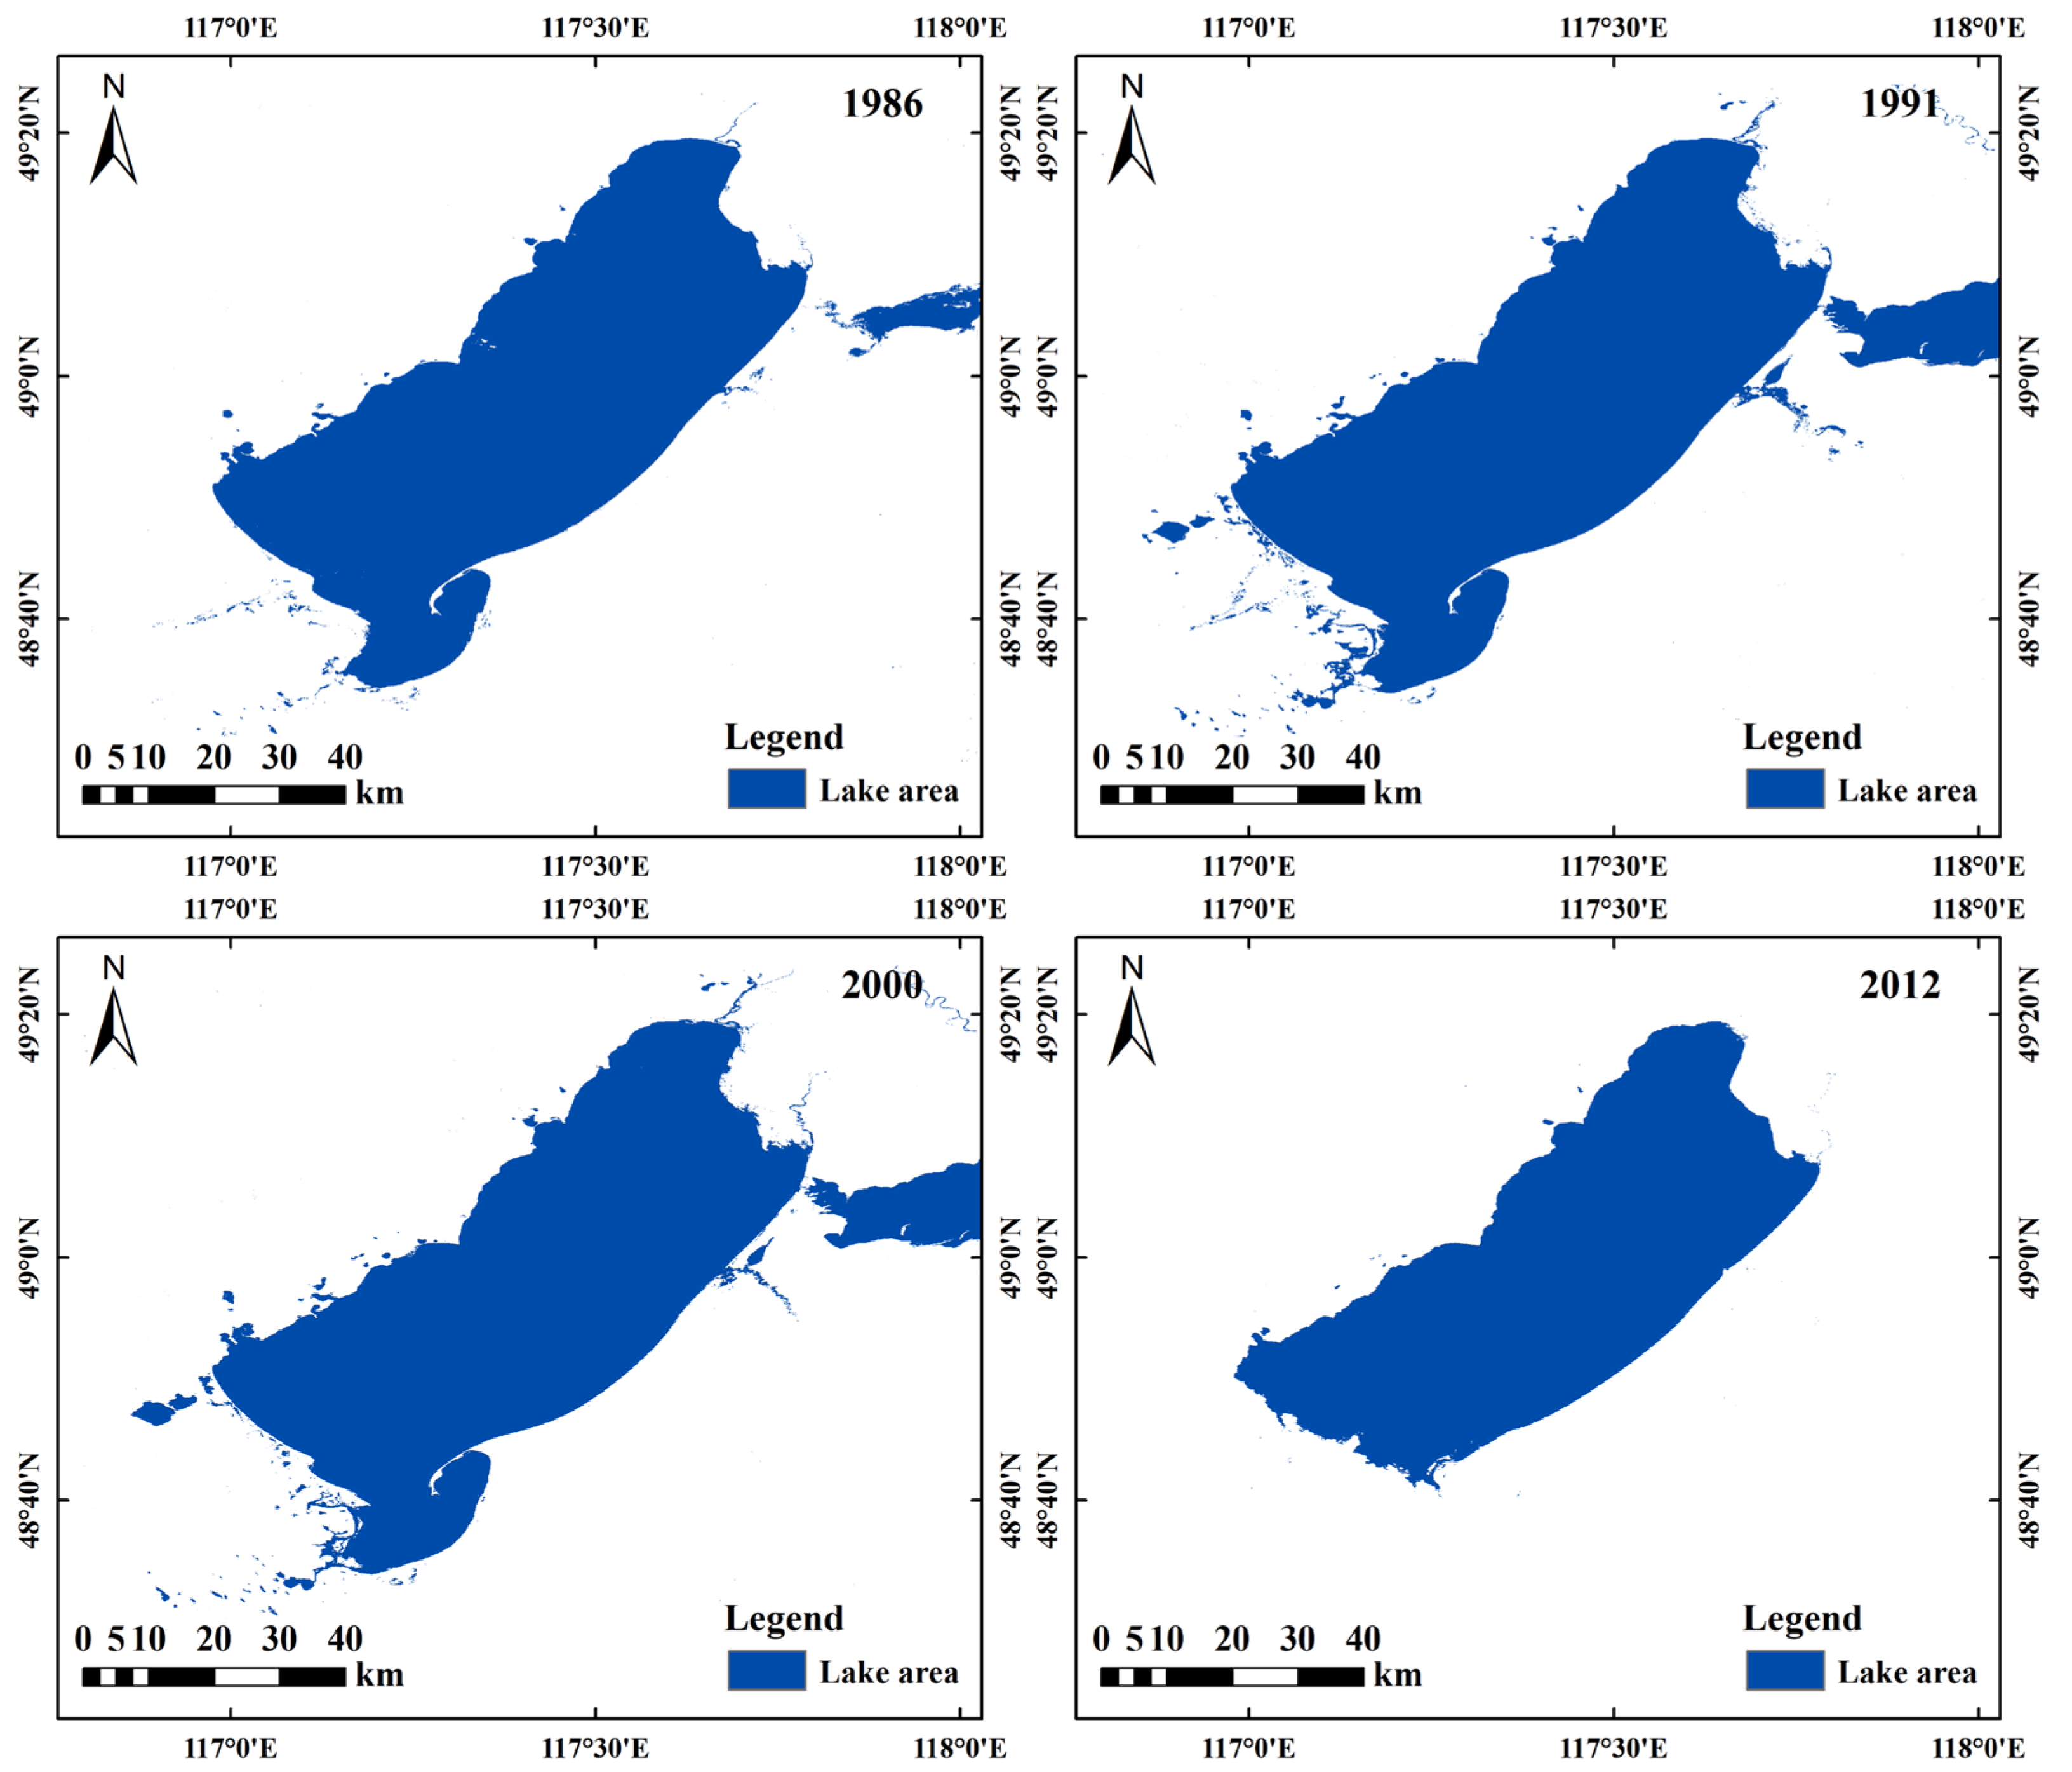
3.2. Evolution Characteristics of the Water Area of Hulun Lake

According to the results of this study, the water area of Hulun Lake varied from 1748.81 km2 to 2314.96 km2 from 1986 to 2020, with the smallest value recorded in 2012 and the largest value recorded in 1991 (Figure 3a). The results of the M–K trend test showed that the water surface area of Hulun Lake has decreased significantly in the past 35 years (Z = − 3.238, p < 0.01). From 1986 to 2020, the dynamic change in the water area of Hulun Lake could be divided into four stages: 1986–1991, the stage with an area increase, and the area increase rate of Hulun Lake was 38.6 km2/a. From 1991 to 2000, the area of Hulun Lake remained at approximately 2300 km2, and the maximum difference was 43.4 km2. From 2000 to 2012, the area of Hulun Lake decreased by 560.82 km2, and the area reduction rate was 46.7 km2/a. From 2012 to 2020, which was the recovery phase, the area of Hulun Lake increased significantly and stabilized at 2060 km2, reaching the level of 2004.
Based on the results of lake area extraction, this study used the water level–area–water volume curve established by Li et al. [36] in Hulun Lake to estimate the water level and water volume of Hulun Lake. The results (Figure 3b) showed that the trend of the water level and the water volume in Hulun Lake was basically consistent with the water area. This is consistent with the results of Guo et al. [16] and Sun et al. [17]. In the past 35 years, the water level of Hulun Lake changed between 545.2 m and 541.1 m, and the water volume changed between 13.66 billion m3 and 5.10 billion m3.
The distribution map of the water area of Hulun Lake in the representative years of 1986–2020 was as follows (Figure 4). The areas with more dramatic changes were distributed mainly in the northeastern and southern waters of Hulun Lake. The small lake in the northeast has not recovered since it disappeared in 2005. The southern waters of Hulun Lake showed a decreasing trend before 2012, with the most serious shrinkage in 2012, and then the lake began to recover gradually.

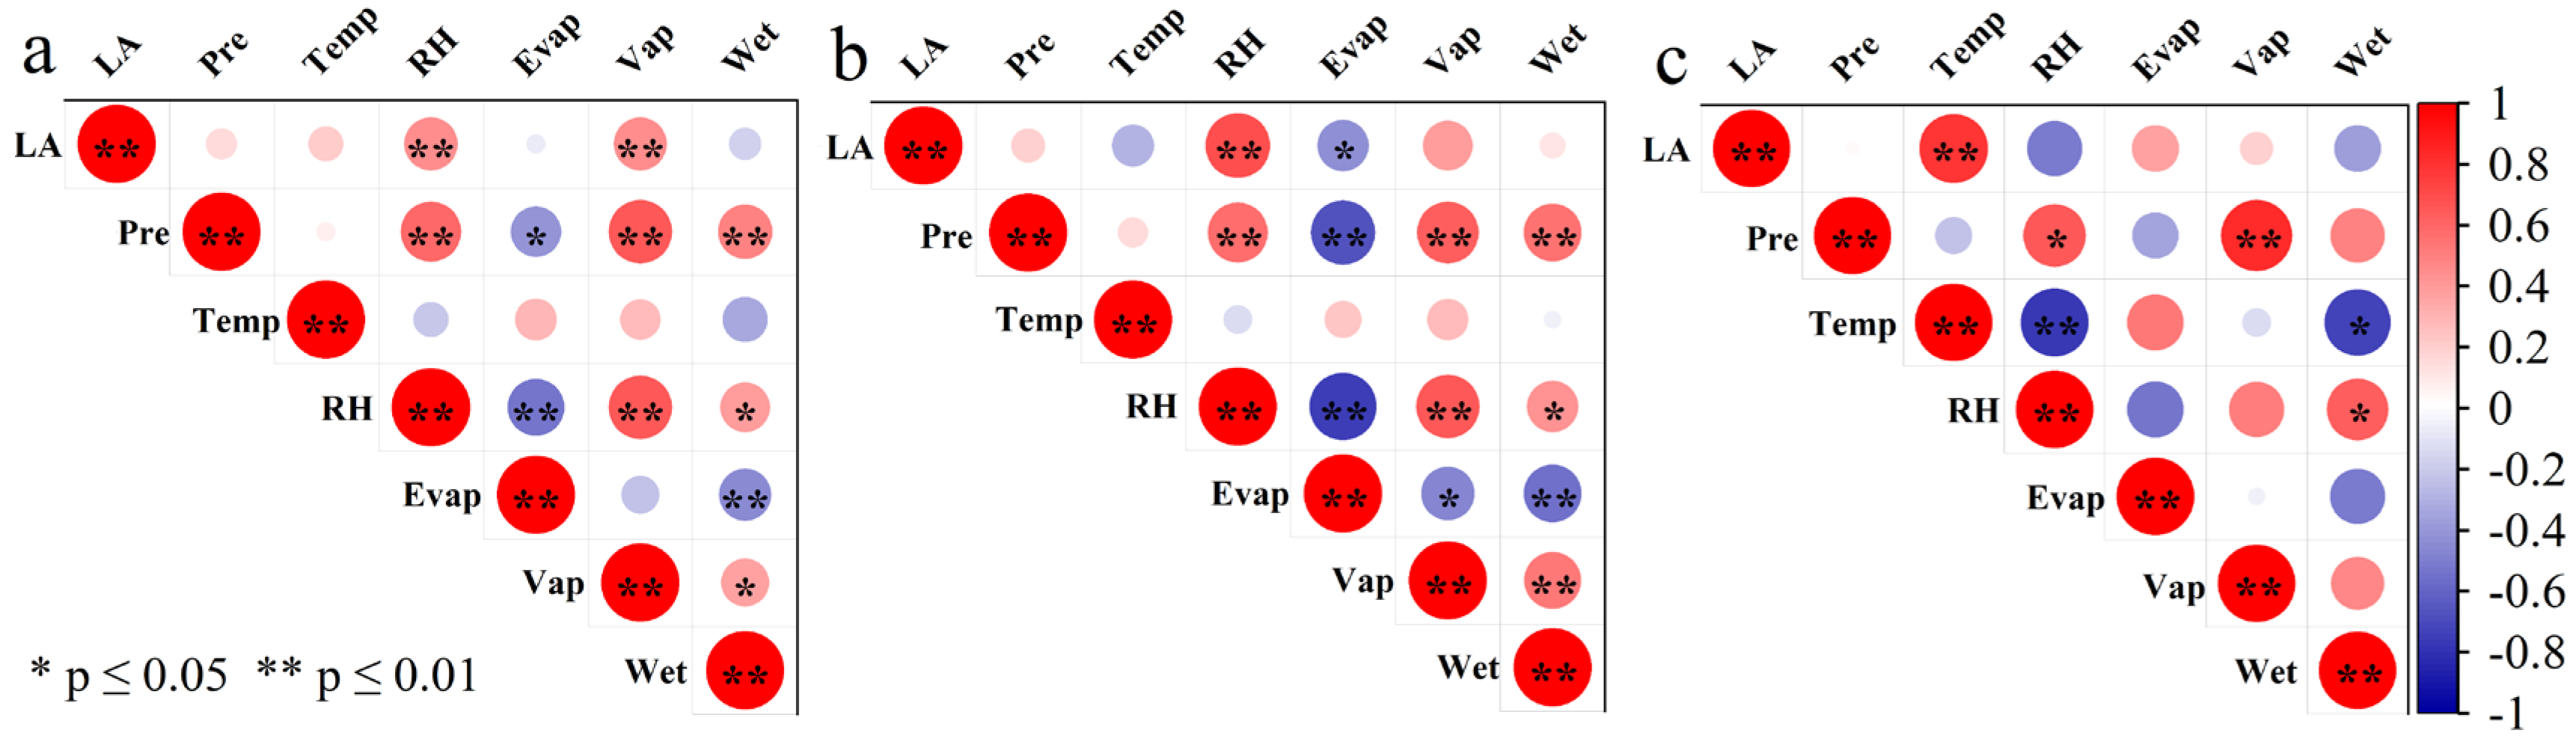
3.3. Correlation Analysis between Water Area and Natural Factors of Hulun Lake

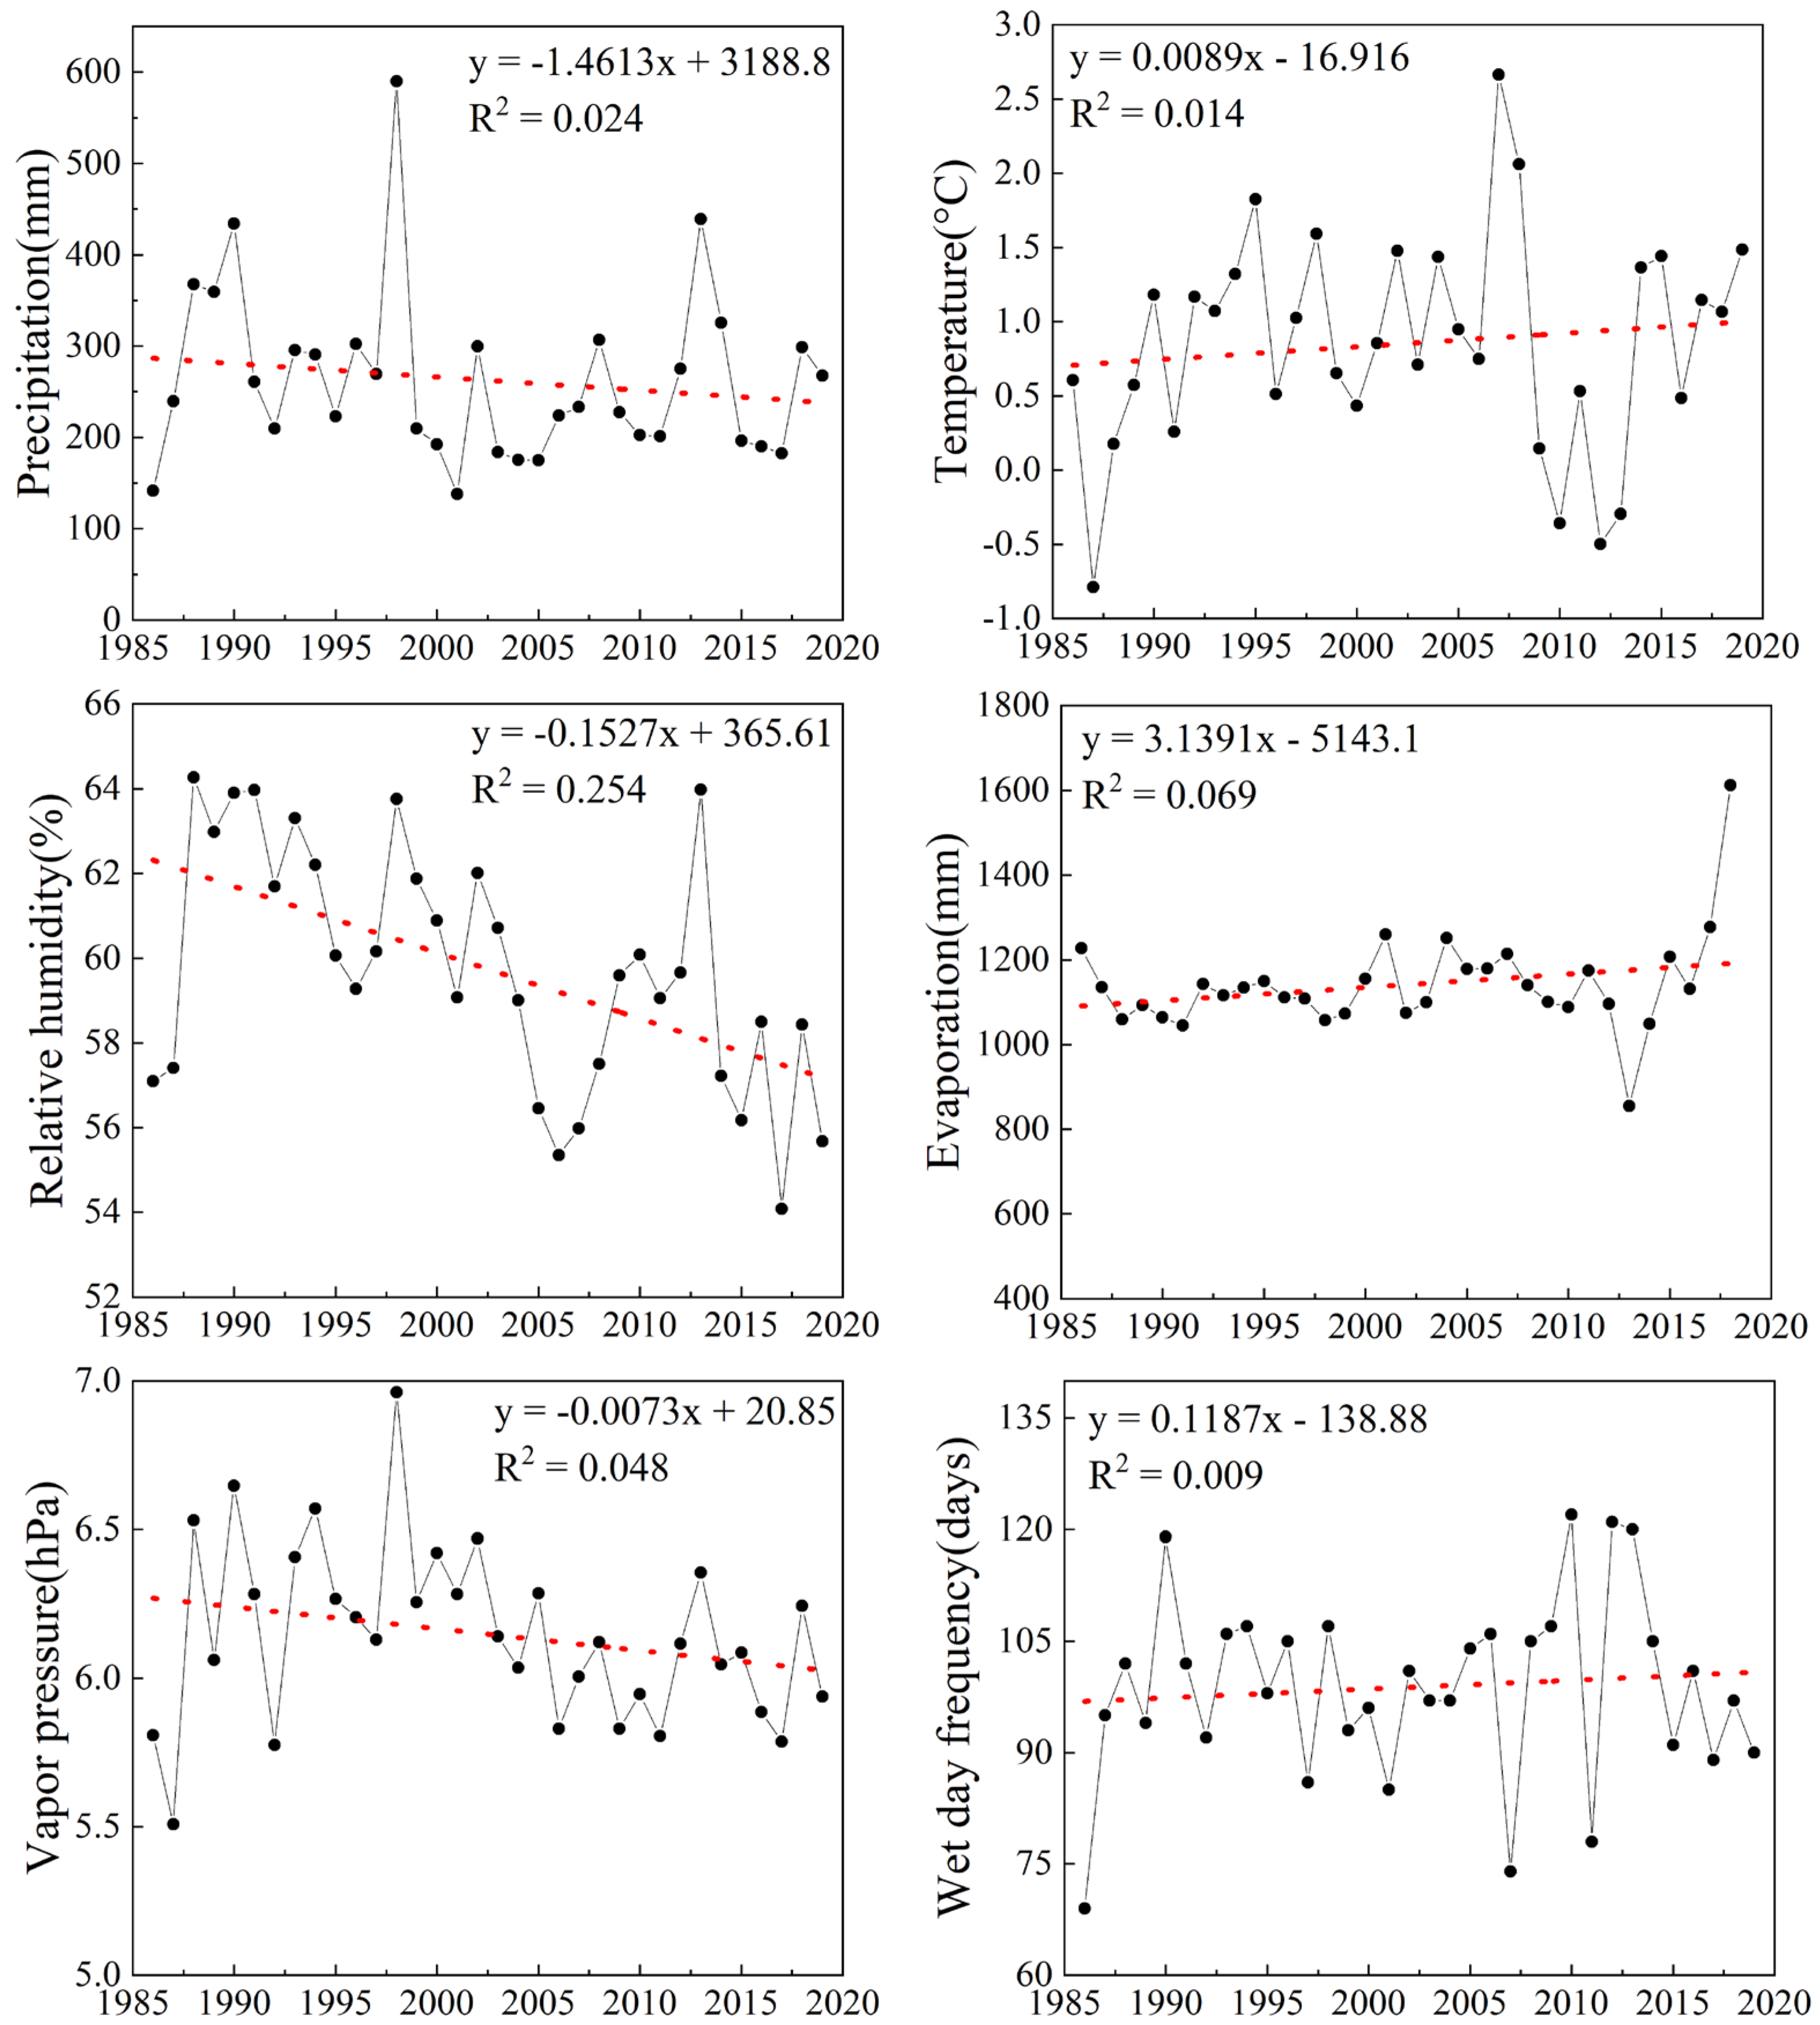
3.3.1. Meteorological Factors

The annual temperature, precipitation, evaporation, and relative humidity in the Hulun Lake area were represented by the average values of meteorological elements from the three meteorological stations. The annual precipitation, average temperature, relative humidity, evaporation, vapor pressure, and wet day frequency in the Hulun Lake area from 1986 to 2019 are shown in Figure 5. The evaporation in the non-freezing period (May-September) was converted according to the evaporation conversion coefficient [37]. The frequency of wet days was calculated according to the number of days with precipitation ≥ 0.1 mm. The vapor pressure data were extracted according to the mask of the study area. The changes in the main meteorological factors showed that the annual precipitation and vapor pressure in the region showed a nonsignificant downward trend, the annual average temperature, annual evaporation, and wet day frequency showed a nonsignificant upward trend, and the average relative humidity showed a significant downward trend (Z = −3.469, p < 0.01). The meteorological data in the last 34 years showed that the Hulun Lake area tended to be warm and dry.
To reveal the possible impact of the artificial water diversion project on the response of the Hulun Lake water surface area to climate change, the correlations between the Hulun Lake water surface area and meteorological factors in 1986–2019, 1986–2008 before water transfer, and 2009–2019 after water transfer were analyzed.
Pearson correlation analysis showed that the water surface area of Hulun Lake was significantly positively correlated with the average relative humidity (p < 0.01) and vapor pressure (p < 0.01) from 1986 to 2019 (Figure 6a), with correlation coefficients of 0.45 and 0.46, respectively. The average relative humidity increased from 57.09% to 63.97% from 1986 to 1991. From 1991 to 2000, it maintained a relatively high level, ranging from 59.28% to 63.76%. From 2001 to 2012, it was relatively low, with the highest value recorded in 2002 (62.01%) and the lowest value recorded in 2006 (55.35%). In 2013, because the precipitation was significantly higher than the average precipitation, the relative humidity reached 63.98% and remained at approximately 56% after 2014. The variation trend of vapor pressure is similar to that of relative humidity, which can also be divided into four stages: rising from 1986 to 1991, relatively stable from 1991 to 2000, declining from 2001 to 2012, peaking in 2013, and maintaining at about 6 hPa after 2014. The average relative humidity and vapor pressure were similar to the overall change law of the water area of Hulun Lake. It was speculated that the change in the water surface area of Hulun Lake may be affected by relative humidity and vapor pressure.
If considering only the data before the water transfer project (Figure 6b), compared with 1986–2019, the Pearson correlation coefficient between the water surface area of Hulun Lake and relative humidity increased from 0.45 to 0.69, the correlation coefficient with precipitation increased slightly from 0.16 to 0.19, the correlation coefficient with evaporation increased from −0.06 (no correlation) to −0.43 (moderate correlation), the correlation coefficient with temperature changed from a positive correlation to a negative correlation, and the correlation coefficient with wet day frequency changed from a negative correlation to a positive correlation. In addition to the vapor pressure (R = −0.40, p = 0.06), the correlation between the other meteorological elements and the water surface area was enhanced. In addition to relative humidity, the relationship between the water surface area and evaporation of Hulun Lake was significant (p < 0.05). The increase in evaporation also influenced the decrease in the water surface area of Hulun Lake, which was weaker than that of relative humidity. Consistent with the results from 1986 to 2019, relative humidity may be the main factor affecting the change in water area in Hulun Lake.
From 2009 to 2019, after the implementation of artificial water diversion (Figure 6c), Pearson correlation analysis showed that the water surface area of Hulun Lake was significantly positively correlated with the temperature, and the correlation coefficient was 0.79, which was inconsistent with the reduction effect of temperature increases on the water surface area of non-glacial snowmelt recharge lakes. Compared with that before water diversion, the correlation between water area and meteorological factors was seriously reduced, which showed that artificial water diversion seriously interfered with the response of the water area of Hulun Lake to climate change from 2009 to 2019.

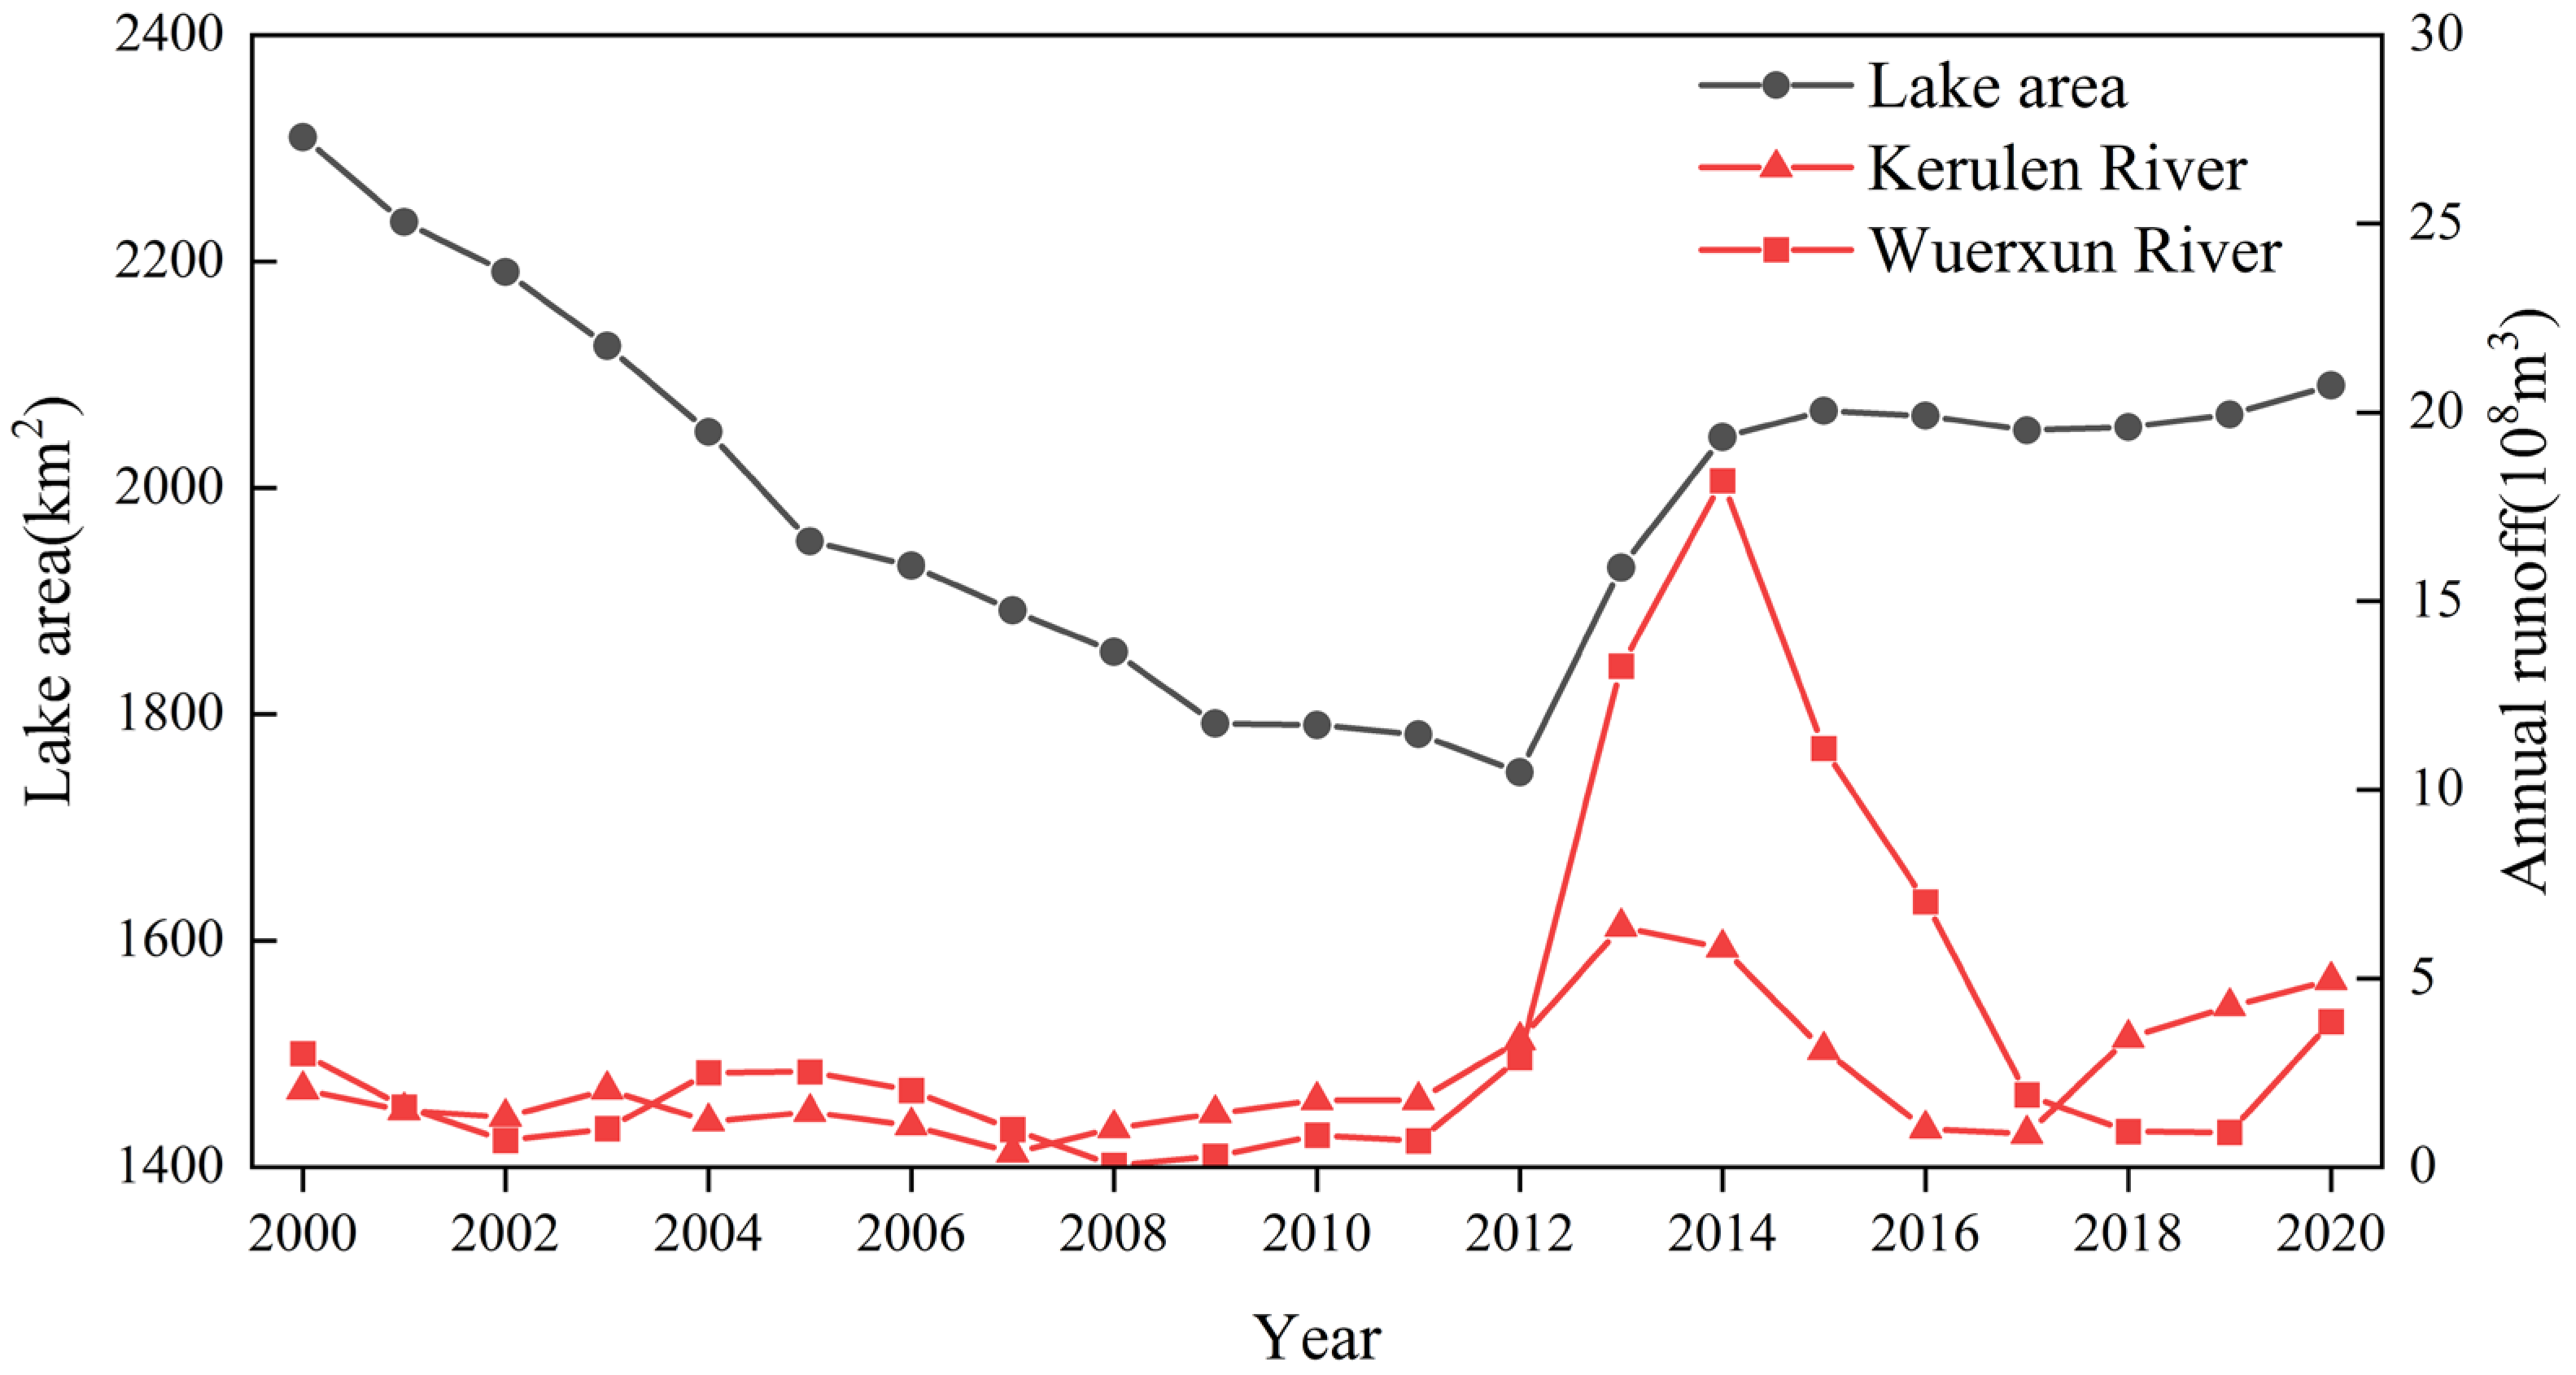
3.3.2. Surface Runoff

In addition to atmospheric precipitation and groundwater, the natural supply of Hulun Lake water mainly comes from the Kerulen River and the Wuerxun River. Figure 7 shows the dynamic change map of the annual runoff of the two inflow rivers and the water area of Hulun Lake from 2000 to 2020. It can be found from the figure that the annual runoff of the Wuerxun River and the Kerulen River was at a low level from 2000 to 2012, and then increased. The flood peak of the Kerulen River appeared earlier. To eliminate the influence of the artificial water diversion project on the correlation between water area and surface runoff, the correlation between lake area and runoff before water diversion was analyzed (Table 3). The results showed that the water area of Hulun Lake had a significant positive correlation with the annual runoff of the Kerulen River and an insignificant positive correlation with the annual runoff of the Wuerxun River.

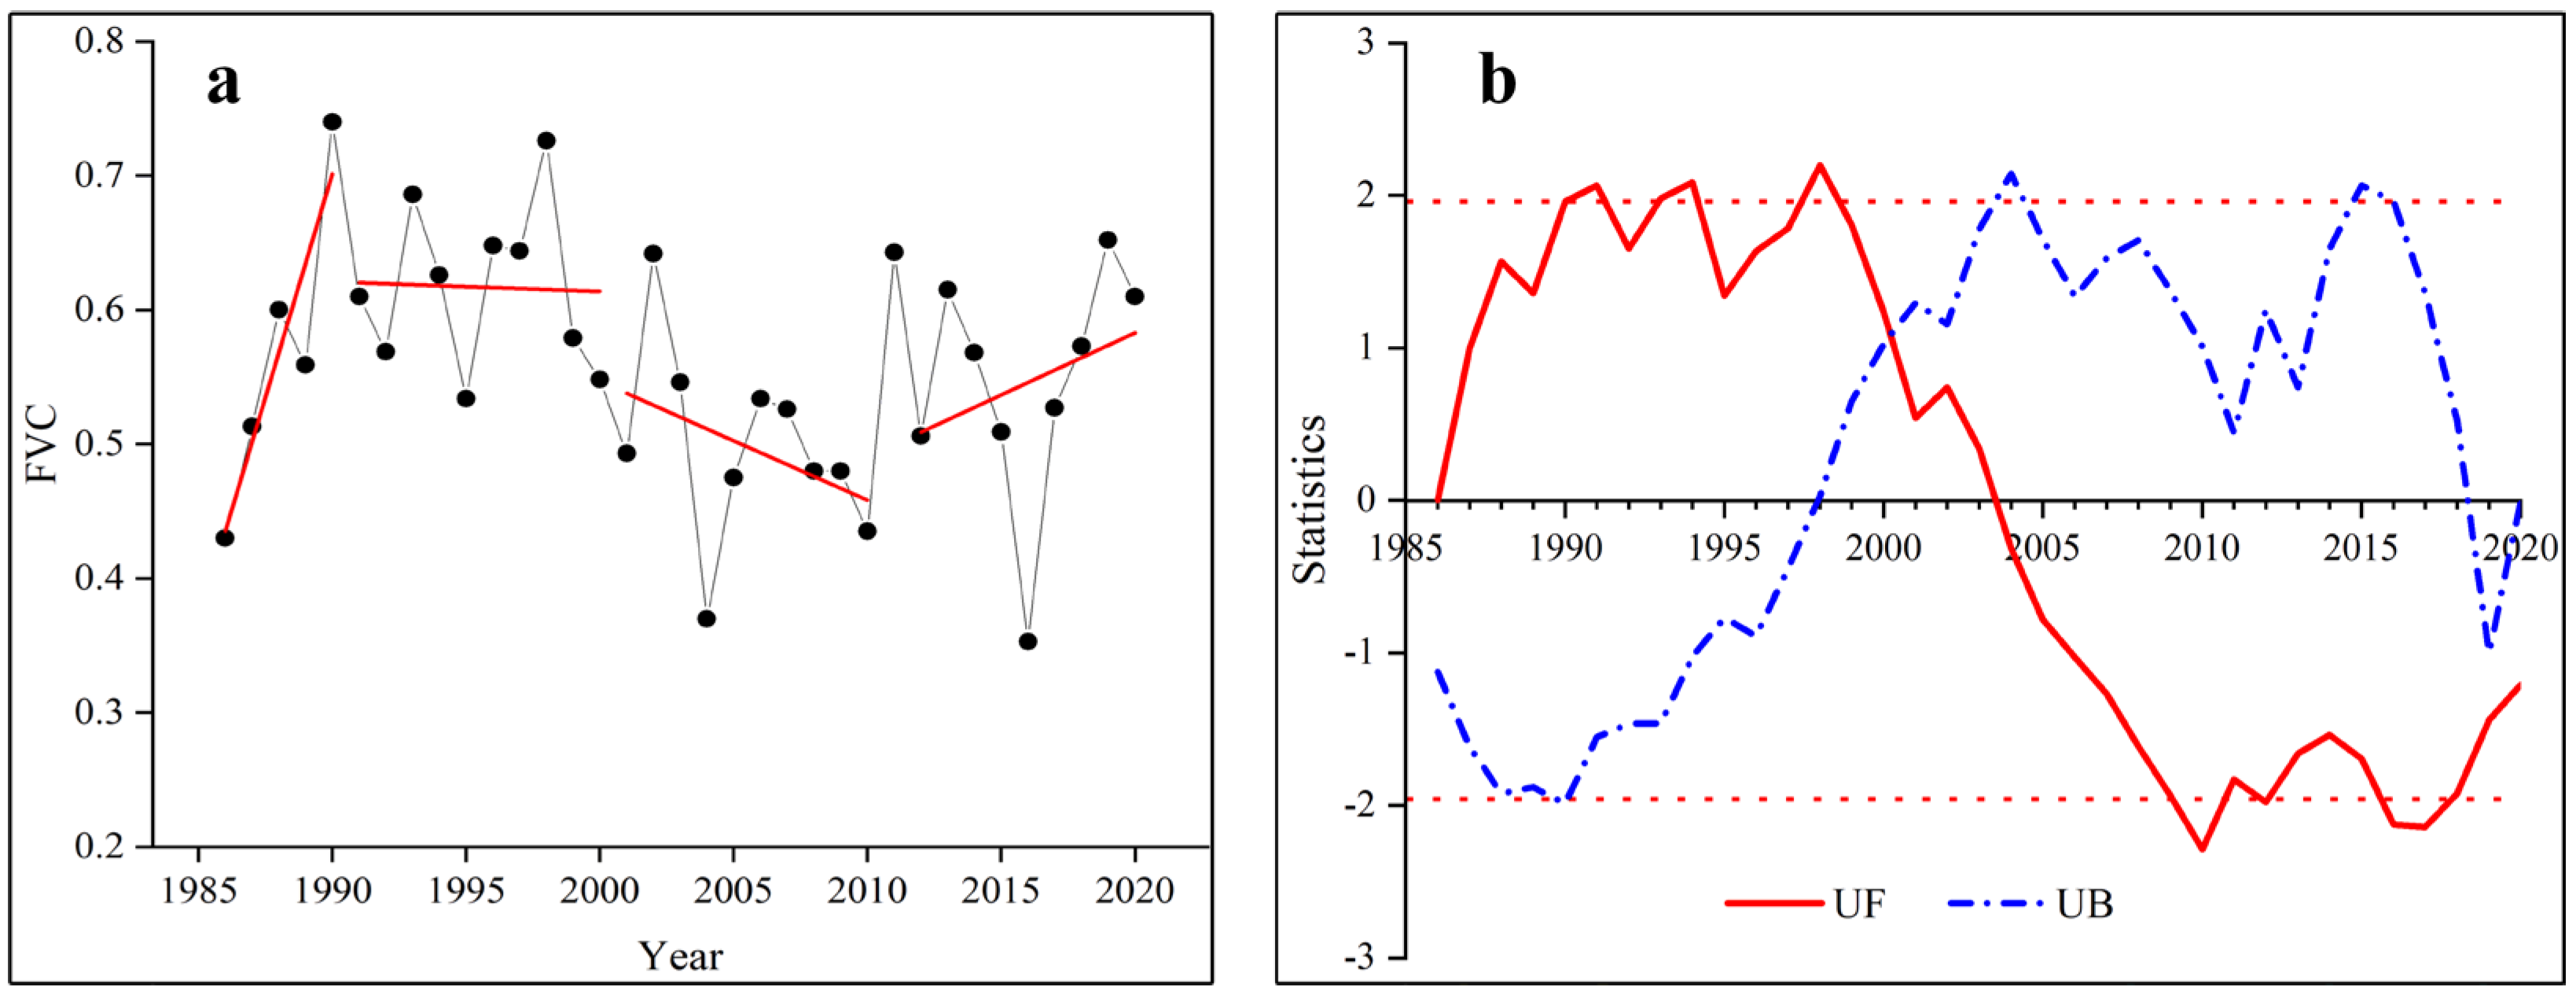
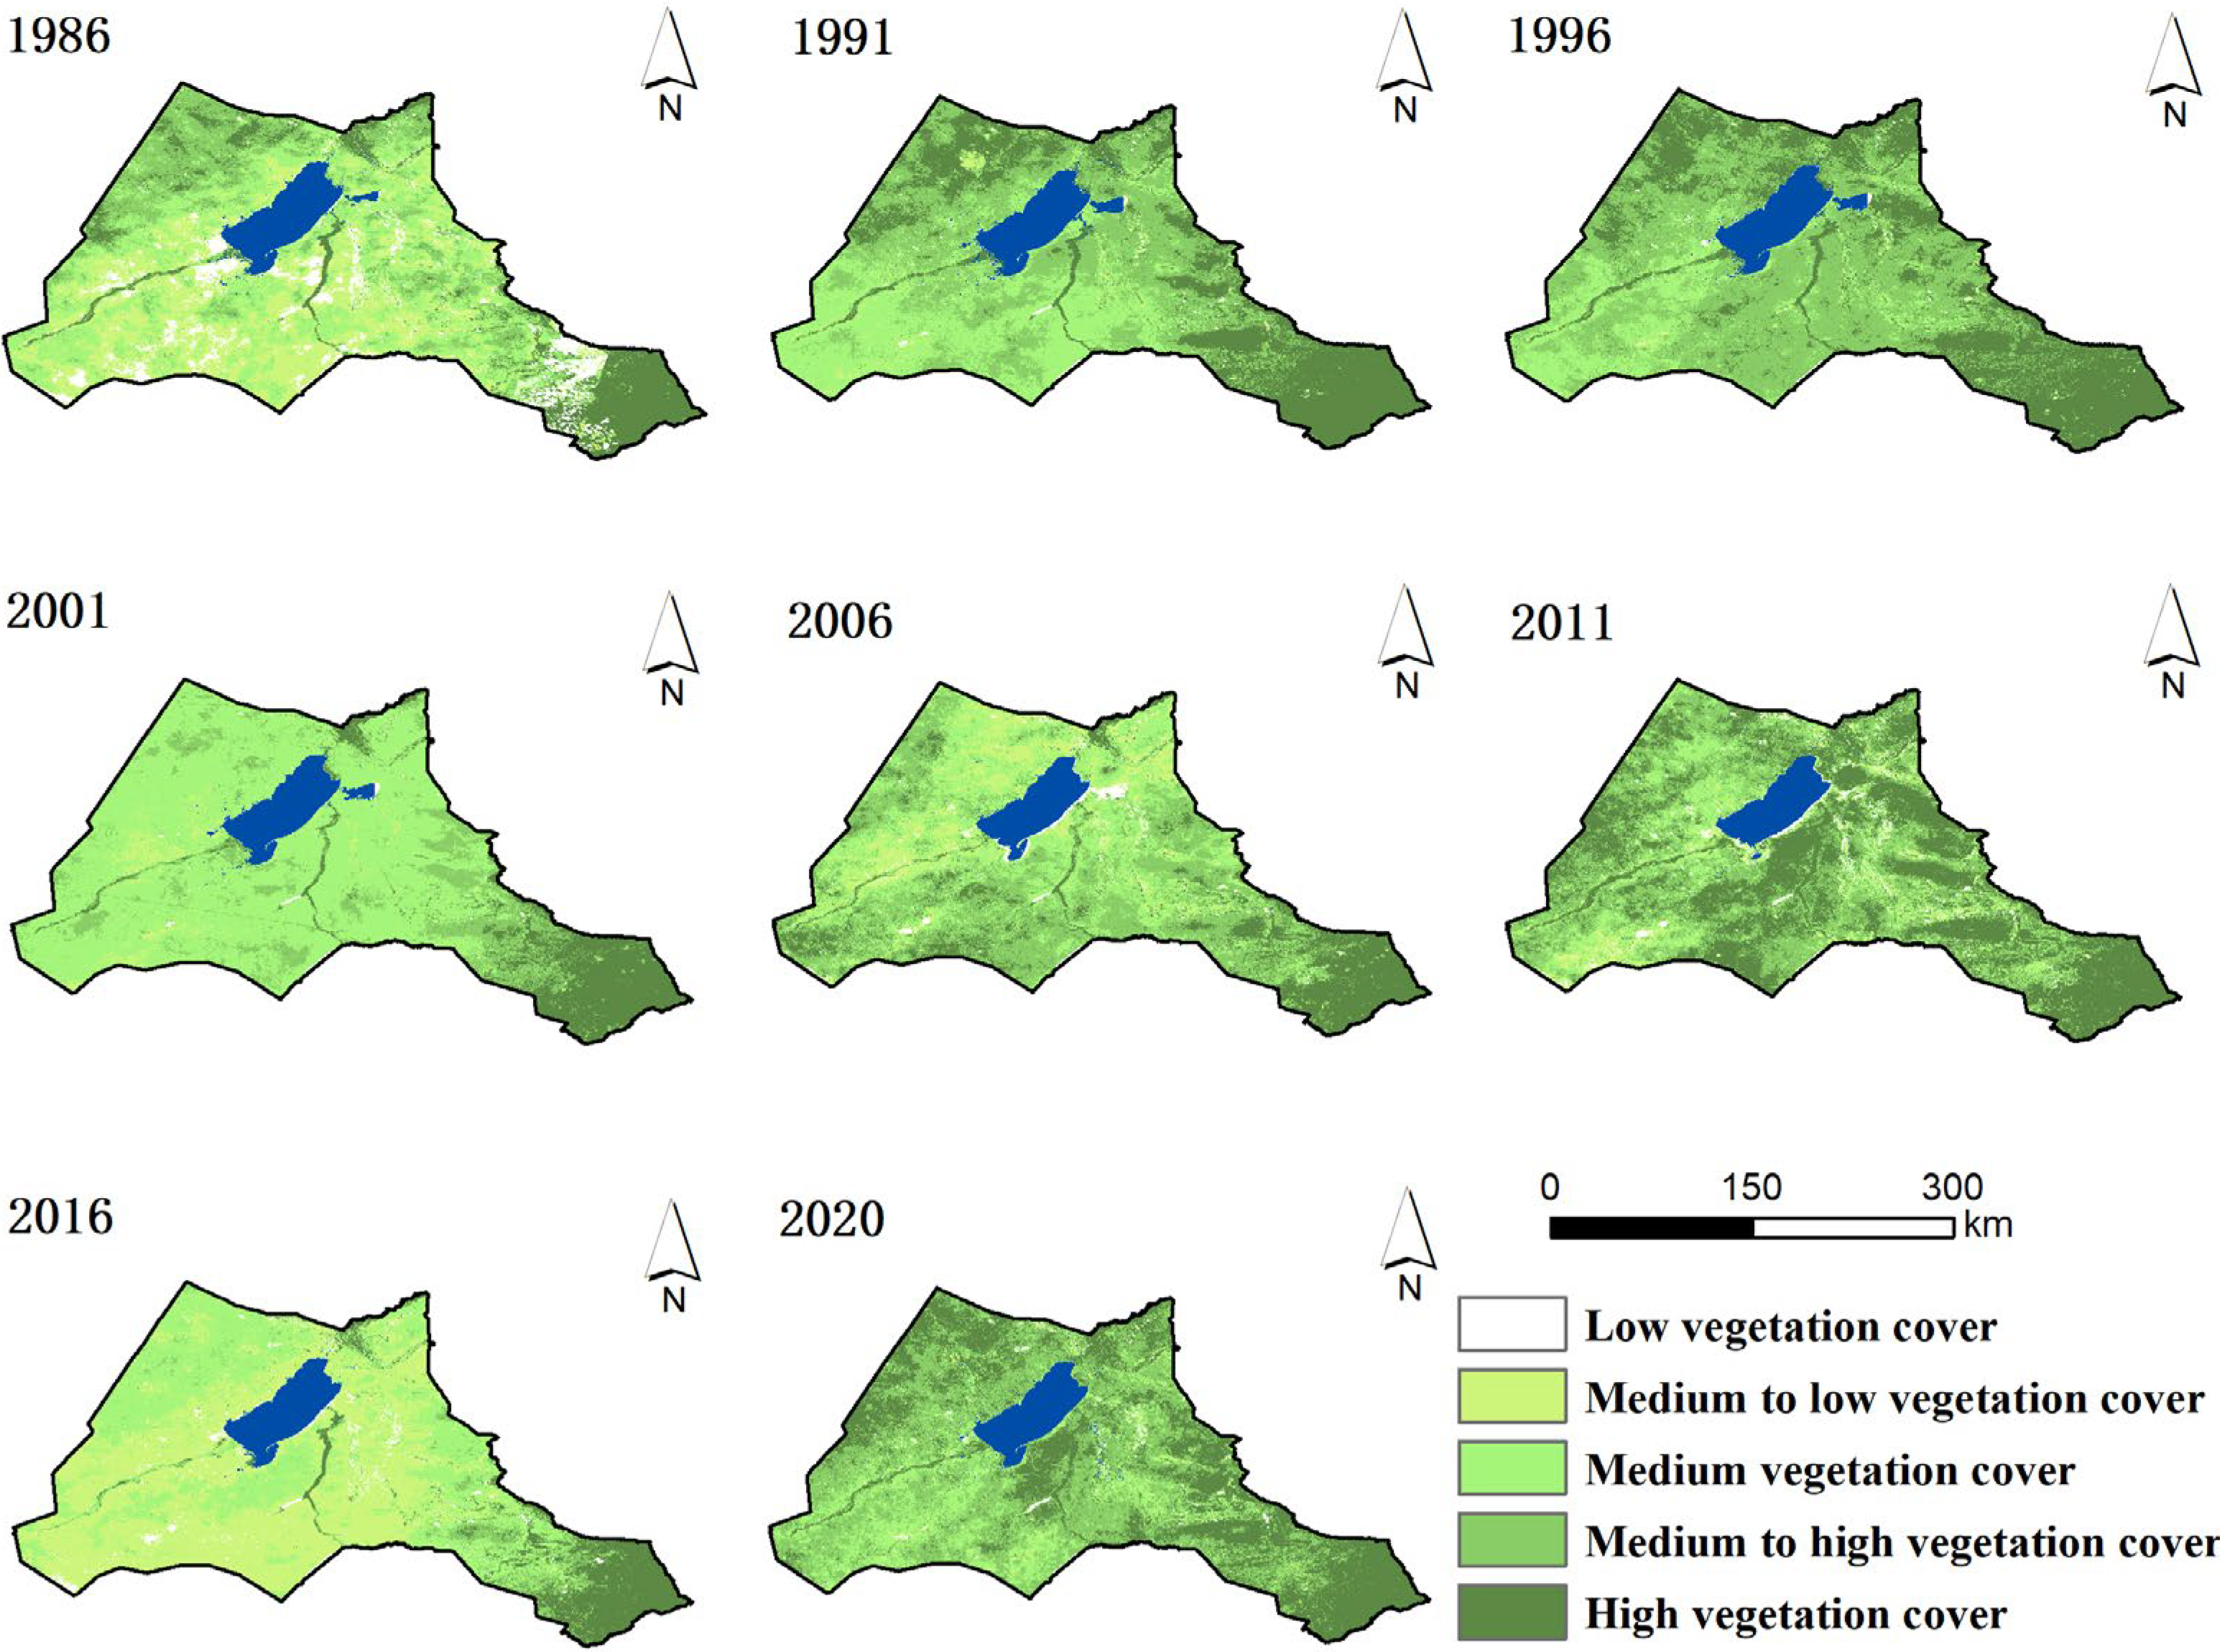
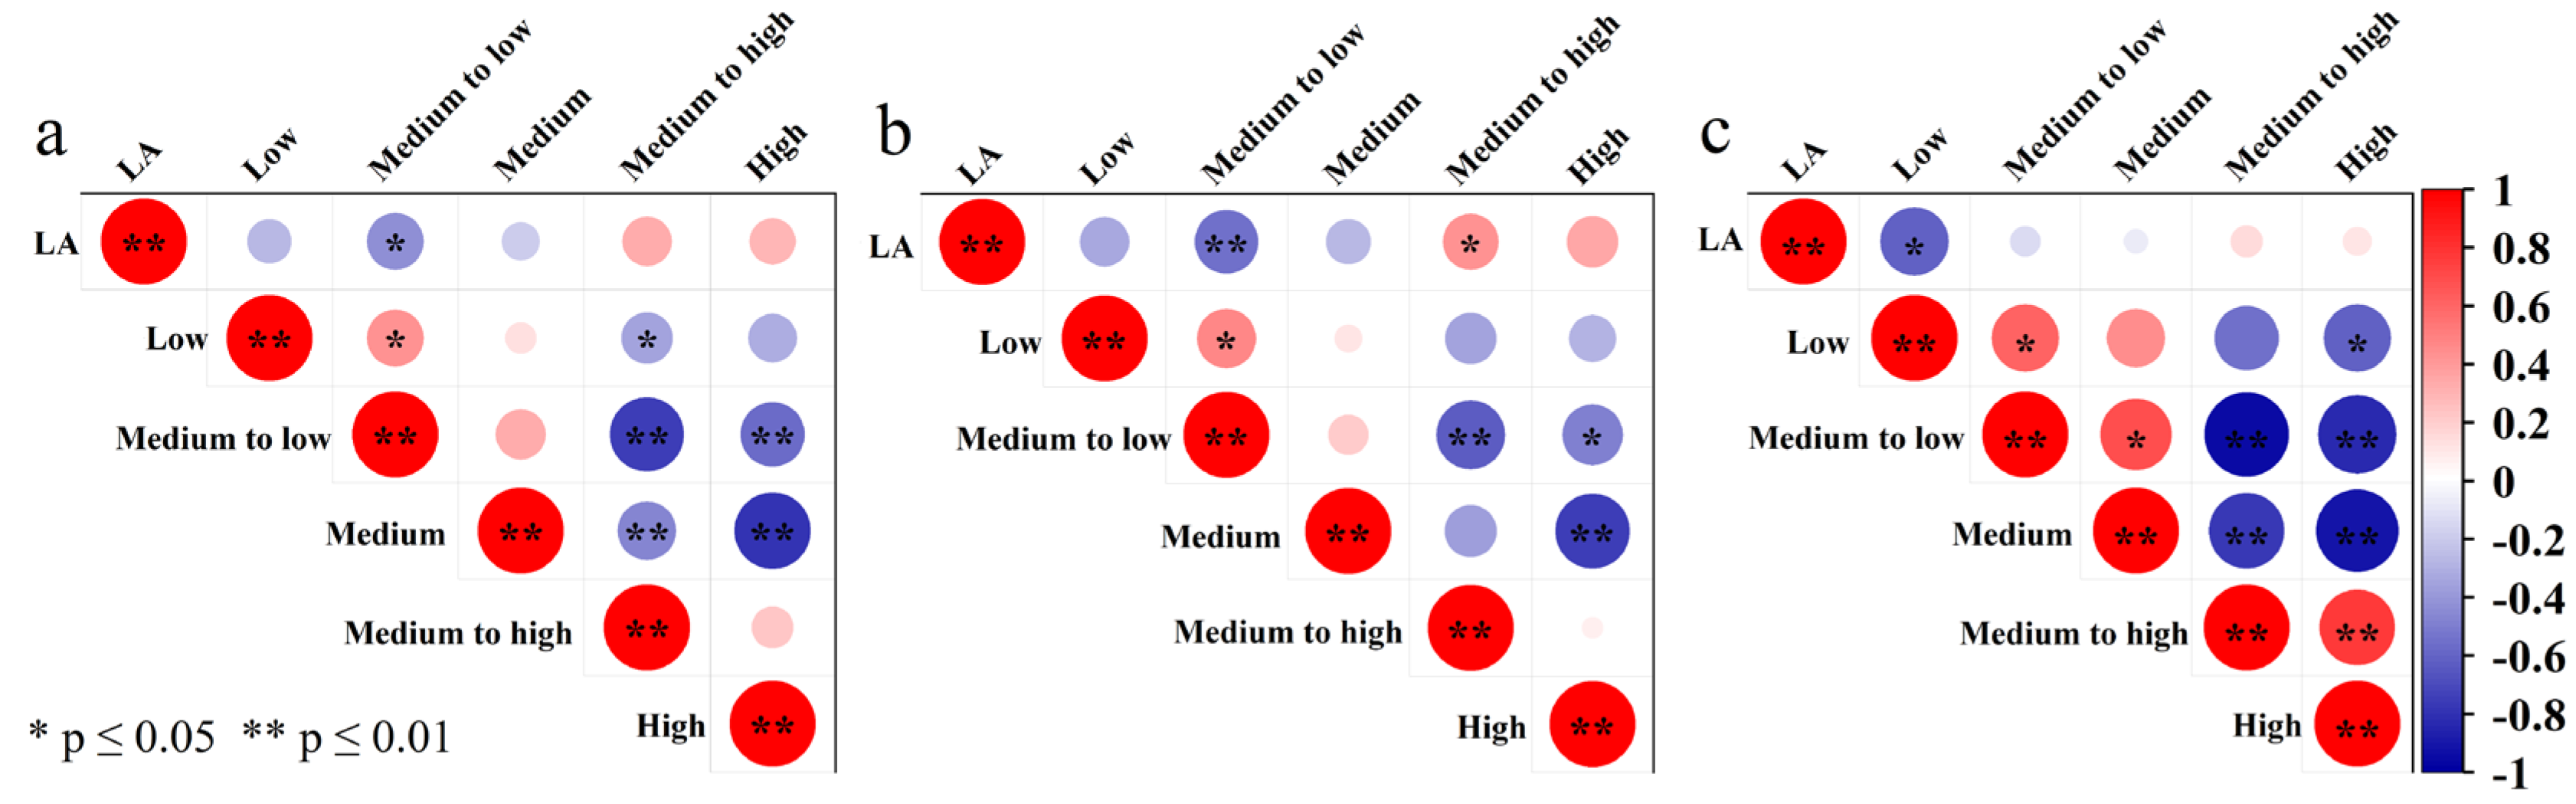
3.3.3. Fractional Vegetation Cover

From 1986 to 2020, the average vegetation coverage in the Hulun Lake area was 0.56, which generally represents a medium-high coverage level. The regional vegetation coverage showed a downward trend, and the change rate was −0.002/a. Figure 8a shows that the change trend of vegetation coverage in the Hulun Lake area was roughly the same as that of the water surface area of Hulun Lake and was divided into four stages. From 1986 to 1990, the vegetation coverage increased significantly, and the level of vegetation coverage increased from medium to high. From 1991 to 2000, the vegetation coverage was relatively stable and was maintained at the middle and high coverage levels. From 2001 to 2010, the vegetation coverage decreased at a rate of −0.009/a to a medium coverage level. From 2012 to 2020, the vegetation coverage increased and returned to a medium-high level. Due to the influence of other external factors, vegetation coverage may increase or decrease suddenly in a short time. As shown in Figure 8b, the M–K mutation test was used to analyze the vegetation coverage in the Hulun Lake area from 1986 to 2020. The results showed that the UF and UB curves intersected in 2000, that is, the vegetation coverage mutation occurred in 2000. After 2000, the vegetation coverage decreased rapidly, and it was the same year that the water area of Hulun Lake entered a stage of drastic reduction.
Figure 9 shows a five-year statistical map of vegetation coverage in the Hulun Lake area. The proportion of medium- and high-coverage vegetation in the whole study area was the largest, at approximately 33.13%, followed by medium-coverage vegetation, high-coverage vegetation, and medium- and low-coverage vegetation, accounting for 27.70%, 27.38%, and 10.54% of the study area, respectively. The proportion of low-coverage vegetation was the lowest, at only 1.25%. In terms of spatial distribution, high-coverage vegetation was distributed mainly in the southeast and north of the region, and medium-coverage and low-coverage vegetation was distributed mainly in the southwest of the region. With time, the vegetation coverage in the west of the region changed greatly, while the vegetation coverage in the east of the region remained relatively stable. It is speculated that this result may be caused by the distance from lakes and rivers.
The change trend and mutation time of vegetation coverage were similar to the change in the Hulun Lake water surface area. To reveal the possible influence of artificial water diversion on the response relationship between the water surface area and vegetation coverage of Hulun Lake, the correlations between the water surface area and vegetation coverage of Hulun Lake in 1986–2020, 1986–2008 before water transfer, and 2009–2020 after water transfer were analyzed.
Pearson correlation analysis (Figure 10a) from 1986 to 2020 showed that the water area of Hulun Lake was significantly negatively correlated with medium- and low-coverage vegetation (R = −0.43), negatively correlated with low-coverage vegetation (R = −0.27, p = 0.12) and medium-coverage vegetation (R = −0.19, p = 0.28), and positively correlated with medium- and high-coverage vegetation (R = 0.33, p = 0.06) and high-coverage vegetation (R = 0.29, p = 0.10). The results show that the area change in Hulun Lake was related to the change in vegetation with medium and low coverage.
The correlation analysis of the Hulun Lake area and vegetation coverage before water diversion (Figure 10b) showed that the water area of Hulun Lake was significantly negatively correlated with medium- and low-coverage vegetation (R = −0.55) and significantly positively correlated with medium- and high-coverage vegetation (R = 0.42). There was a negative correlation with low-coverage vegetation (R = −0.32, p = 0.13) and medium-coverage vegetation (R = −0.27, p = 0.21) and a positive correlation with high-coverage vegetation (R = 0.36, p = 0.10). Compared with 1986–2020, the correlation coefficients of this period increased, the significance level generally decreased, and the change in medium- and high-coverage vegetation became another influencing factor.
The correlation analysis of 2009–2020 after artificial water diversion (Figure 10c) showed that the water area was significantly negatively correlated with low coverage vegetation (R = −0.61), the correlation coefficients with other levels of coverage vegetation were less than 0.14, and the significance level was higher than 0.68, which indicated no correlation. The correlation between water area and vegetation coverage was seriously reduced compared with that before water transfer. The artificial water diversions seriously disturbed the response of the water surface area of Hulun Lake to the change in vegetation coverage from 2009 to 2020.

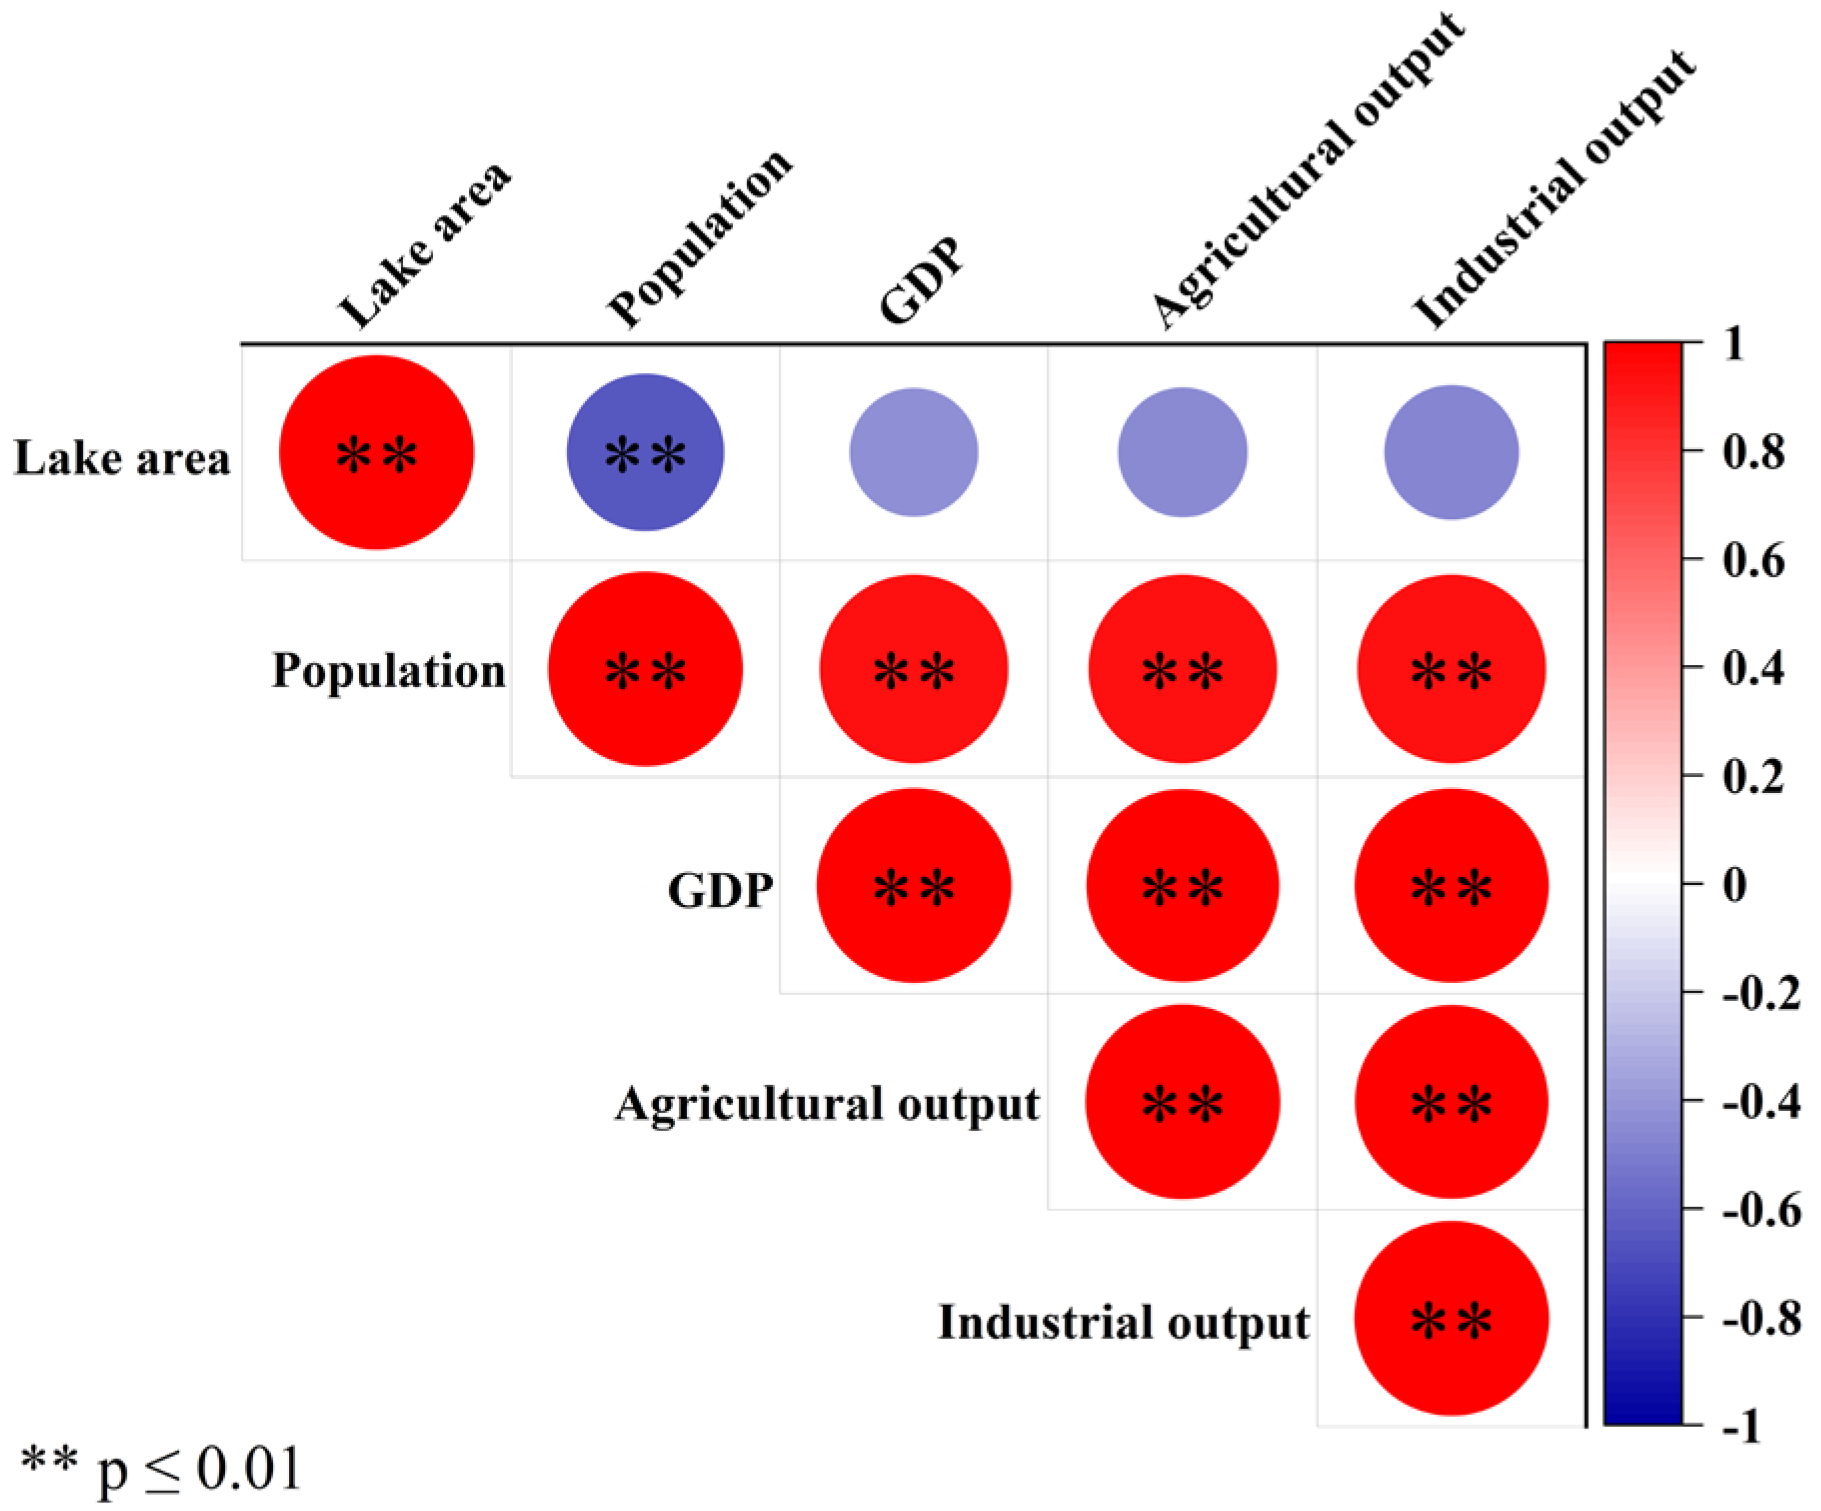
3.4. Correlation Analysis between Water Area and Anthropogenic Factors of Hulun Lake

As a product of human activities, anthropogenic factors also have different degrees of impact on the ecological environment, especially in arid climate areas, where human activities have a more obvious impact on the environment. In this study, the four indicators of population, regional GDP, agricultural output value, and industrial output value were selected to analyze human activities.
Pearson correlation analysis results (Figure 11) showed that the water area of Hulun Lake was significantly negatively correlated with the population (R = −0.65) and negatively correlated with the GDP (R = −0.44, p < 0.1), the agricultural output value (R = −0.45, p < 0.1), and the industrial output value (R = −0.48, p < 0.1). In addition, there was a significant positive correlation between anthropogenic factors.

3.5. Analysis of the Factors Causing Hulun Lake Area to Shrink Rapidly

Pearson correlation analysis showed that the water area change in Hulun Lake had a certain correlation with relative humidity (R = 0.69, p < 0.01), evaporation (R = −0.43, p < 0.05), surface runoff (R = 0.73, p < 0.05), medium- to low-coverage vegetation (R = −0.55, p < 0.01), and medium- to high-coverage vegetation (R = 0.42, p < 0.05) and had no significant correlation with other natural factors. It had a certain correlation with the population (R = −0.65, p < 0.01), GDP (R = −0.44, p < 0.1), agricultural output value (R = −0.45, p < 0.1), and industrial output value (R = −0.48, p < 0.1).
Based on the results of correlation analysis, the relative humidity, evaporation, surface runoff, medium- and low-coverage vegetation, medium- and high-coverage vegetation, population, GDP, agricultural output value, and industrial output value were analyzed using principal component analysis. Considering that the dimensions of each factor were different, statistical analysis could not be directly performed. Therefore, the data were first standardized, and the range standardization method was used to eliminate the influence of variable dimension and variation range. To test whether the data were suitable for principal component analysis, we conducted the KMO test and Bartlett spherical test on the standardized data. The results are shown in Table 4. The KMO was 0.667, greater than 0.6, and the Sig was less than 0.05, indicating that the data support the use of principal component analysis.
According to the principle of eigenvalues greater than 1, two principal components were extracted, as shown in Table 5. The variance contribution rate of the first principal component was 47.85%. Among them, GDP (R = 0.99), industrial output value (R = 0.98), agricultural output value (R = 0.98), and population (R = 0.96) were highly correlated with the first principal component, and these are all anthropogenic factors. Thus, the dominant factors of the first principal component are anthropogenic factors, that is, anthropogenic factors can explain 48% of the change in the Hulun Lake water area. The variance contribution rate of the second principal component was 26.54%. Among them, evaporation (R = −0.86) was highly correlated with the second principal component, followed by medium- and high-vegetation coverage (R = 0.74), medium- and low-vegetation coverage (R = −0.73), and relative humidity (R= 0.66), all of which are natural factors; thus, natural factors explained 27% of the change in the Hulun Lake water area. In summary, the first principal component with anthropogenic factors as the main factors and the second principal component with natural factors as the main factors can explain 75% of the change in the Hulun Lake area.

4. Discussion

In this study, the overall accuracy of extracting the water area of Hulun Lake based on the MNDWI was 95.25%, which proved that the index could be effectively used to extract the water body in this area. Additionally, the accuracy of the JRC global water body data in this area was limited, but the extracted lake area had the same trend, and the data processing was fast and convenient. This method has advantages in analyzing the dynamic changes in lake areas on a large scale and over long time scales. Based on the GEE platform, Peng et al. [38] used JRC water products combined with the water index method to study the area change in Bosten Lake in the last 20 years and achieved good results. Many studies have shown that the applicability of JRC global surface water datasets in different regions is different. Jin et al. [39] found that JRC global surface water data could minimize the interference of cloud shadows. This product was suitable for the high cloud coverage plateau area of the Three-River Headwaters region. Wu et al. [40] compared the lake area extracted using different water indices with JRC data in the Hulun Lake area and found that the accuracy of the JRC data was poor. Therefore, the applicability of the dataset needs further study. The variation law of the Hulun Lake area extracted in this study was consistent with the conclusion obtained by Zhao et al. [27] through visual interpretation. It was roughly divided into four stages. The water area fluctuated between 1748.81–2314.96 km2, and the variation range was the same.
In this study, climate change, surface runoff change, vegetation succession, and economic and social development were fully considered when analyzing the influencing factors of the Hulun Lake water area. Our findings suggest that evaporation and relative humidity are most closely related to the change in the Hulun Lake area. This result is consistent with the findings of Wang et al. [41] and Zhao et al. [27] in their studies. Water surface evaporation is the primary mechanism by which inland lakes consume water [41]. Sun et al. [17] estimated that the average annual evaporation of Hulun Lake was approximately 4.8 times the direct precipitation based on the water balance. Relative humidity is a comprehensive indicator that reflects the conditions of precipitation, temperature, evaporation, vapor pressure, and other factors. Although precipitation, vapor pressure, and wet day frequency did not show a significant correlation with the water area of Hulun Lake, they have an indirect correlation with relative humidity. This suggests that relative humidity plays an important role in the water area changes in Hulun Lake, and variations in relative humidity can be used as an indicator of the lake’s hydrological conditions. The runoff of the river into the lake was also a very significant factor affecting the dynamic change in the lake area. The amount of water in the river flowing into the lake would directly affect increases and decreases in lake area, and the change in climatic factors would also lead to a change in runoff. Further analysis of the correlation between meteorological factors found that evaporation and precipitation and relative humidity were significantly negatively correlated (p < 0.01). The warming and drying of the regional climate led to an increase in evaporation, an increase in lake water consumption, and a decrease in precipitation, which reduced lake surface precipitation and surface runoff. Guo et al. [16] thought that the decrease in river runoff caused by climate warming and drying was the main reason for the decrease in water level and area of Hulun Lake. Vegetation coverage was the most direct indicator of a change in water surface area. We found that the smaller the area of low-medium coverage vegetation was, the larger the water surface area; additionally, the larger the area of medium-high coverage vegetation was, the larger the water surface area. This shows that compared with medium-low coverage vegetation, medium-high coverage vegetation has more obvious effects on sand fixation and soil conservation, water conservation, and soil erosion prevention in lakes in semiarid areas.
As a product of human activities, social and economic factors seriously restrict the development of the ecological environment in semiarid areas. Tao et al. [6] analyzed the relationship between the number and area of lakes in Inner Mongolia and climatic and anthropogenic factors and found that the changes in lakes in Inner Mongolia were affected mainly by human activities, especially coal mining. By analyzing the main driving factors of the rapid change in the Hulun Lake area from 2000 to 2016, we found that anthropogenic factors were the main driving force causing the shrinkage of the Hulun Lake area. After 2000, the GDP of the Hulun Lake region increased rapidly, and industry became the main source of economic growth in the region. As the basic resource of industry, coal mining accounted for nearly 10% of the secondary industry [16]. Relevant studies [42,43,44] have shown that there are numerous significant deposits in the study area, with Manzhouli being a crucial coal-producing region in Hulunbuir, where coal mining has been a severe issue. On the one hand, the overexploitation of coal destroyed the native vegetation, aggravated grassland degradation, accelerated soil erosion and desertification, and destroyed the local ecological environment [45]. On the other hand, coal mining led to land subsidence and the destruction of underground aquifers, affecting the regulation and storage of runoff by the groundwater system, resulting in a decline in groundwater levels and a sharp decrease in surface runoff [46,47]. These indirectly led to the shrinking of Hulun Lake. The data on agricultural output value indirectly reflected the increase in cultivated land area and livestock number and the increase in population, which directly led to the increase in water consumption in this area. Furthermore, the region has also experienced significant human activities such as deforestation and urbanization [48]. The combination of these factors has resulted in a significant reduction in the water area of Hulun Lake.
In 2013, the area of Hulun Lake rebounded rapidly. To explore the reasons why, we believed that it was the result of the combined action of meteorological factors and artificial water diversion. In 2013, anthropogenic factors, as the main driving factor, did not change much, while meteorological factors changed dramatically (Figure 5). The precipitation, vapor pressure, and relative humidity increased significantly, and the evaporation reached the lowest value in the past 35 years. The response of the lake area to the change in meteorological factors was rapid in a short time. However, to curb the shrinking of Hulun Lake, the state began building the “diversion into the lake” project beginning in 2007, introducing the water of the Hailar River into the lake. It was planned to divert 750 million m3 of water each year, and the project was completed and diversion started in 2009. In the first two years, due to the small runoff of the Hailar River, the amount of water diversion did not reach the planned value, and the shrinkage of the Hulun Lake area was not curbed but was actually further aggravated. The lake storage capacity decreased by 1.27 billion m3 in two years. Since 2013, the annual water diversion into the lake has been stable at 600 million m3 [49], which has played a crucial role in the increase in the Hulun Lake area.
There are several limitations to this study. The method of extracting the water body was relatively singular, and other methods were not comprehensively utilized. In the future, an accuracy comparison of various water body methods can be carried out to explore the best method of water body extraction in this area. The runoff data for inflow rivers were not long enough to cover the whole research period. In the future, a hydrological model or remote sensing inversion method can be used to extend and interpolate runoff data. Human activities were considered as a whole in this study; however, quantifying the effects of different human activities remains an important issue [50]. In the future, we will determine the proportion of different human activities in anthropogenic factors based on field surveys or statistical models. Groundwater recharge is also an important factor that affects the area of Hulun Lake. Unfortunately, due to the lack of data, this study did not consider the impact of underground runoff on the lake area. In the future, GRACE satellites can be used to estimate groundwater reserves in the area or collect meteorological and hydrological data to calculate groundwater reserves using the water balance formula. This will help to explore the impact of groundwater recharge on the water area of Hulun Lake. Later, with the improvement of data, we will carry out more work on the physical mechanism to further clarify the driving mechanism of the dynamic changes in Hulun Lake.

5. Conclusions

Based on Landsat remote sensing image data from 1986 to 2020, this paper extracted the water area of Hulun Lake in a long time scale and analyzed and discussed the shrinking process and driving force of Hulun Lake by combining natural factors and socioeconomic factors. The following conclusions were drawn:
(1) The water surface area of Hulun Lake decreased significantly in the past 35 years. The dynamic change in the water area of Hulun Lake could be divided into four stages: 1986–1991, a stage with area increases; 1991–2000, a relatively stable stage; 2000–2012, a stage with a sharp decrease; and 2012–2020, the recovery phase. The areas with more dramatic changes in the water area of Hulun Lake were distributed mainly in the northeastern and southern waters of Hulun Lake.
(2) The dynamic change in the Hulun Lake area was affected by both natural factors and anthropogenic factors. In terms of natural factors, meteorological factors such as evaporation and relative humidity, runoff of inflow rivers, medium- to high-coverage, and medium- to low-coverage vegetation had significant effects. In terms of anthropogenic factors, the population had the most significant impact. The artificial water diversion project had different degrees of influence on the response of the Hulun Lake area change to natural factors.
(3) Anthropogenic factors were the main driving force causing the rapid change in the Hulun Lake area from 2000 to 2016, and they explained 48% of the change in the Hulun Lake area. Natural factors were the secondary driving force and explained 27% of the change in the Hulun Lake area.

Author Contributions

Conceptualization, Y.W. and W.S.; methodology, W.S.; validation, Y.W. and Y.A.; formal analysis, W.S.; investigation, W.S. and B.X.; resources, Y.W. and Y.A.; data curation, B.X.; writing—original draft preparation, W.S.; writing—review and editing, Y.W. and W.S.; supervision, B.X. and Y.W.; funding acquisition, Y.W.; All authors have read and agreed to the published version of the manuscript.

Funding

This study is supported by the National Key Research and Development Program of China, No. 2022YFC3204400, and the National Natural Science Foundation of China, No. 52109001.

Data Availability Statement

Not applicable.

Conflicts of Interest

The authors declare no conflict of interest.

References

  1. Li, J.; Fang, H.; Bao, A.; Yang, L. Spatio-temporal Analysis of Recent Changes of Lake Area and Lake Water Level at High Mountains in Central Asia. Resour. Sci. 2011, 33, 1839–1846. [Google Scholar]
  2. Lioubimtseva, E.; Henebry, G.M. Climate and environmental change in arid Central Asia: Impacts, vulnerability, and adaptations. J. Arid Environ. 2009, 73, 963–977. [Google Scholar] [CrossRef]
  3. Wang, Y.; Zhao, H.; Li, C.; Song, W. The Review of the Relationship with Climate Change and Hulun Lake Wetland. Chin. Agric. Sci. Bull. 2012, 28, 300–305. [Google Scholar]
  4. Li, Q.; Lu, L.; Wang, C.; Li, Y.; Sui, Y.; Guo, H. MODIS-Derived Spatiotemporal Changes of Major Lake Surface Areas in Arid Xinjiang, China, 2000–2014. Water 2015, 7, 5731–5751. [Google Scholar] [CrossRef]
  5. Ma, R.; Duan, H.; Hu, C.; Feng, X.; Li, A.; Ju, W.; Jiang, J.; Yang, G. A half-century of changes in China’s lakes: Global warming or human influence? Geophys. Res. Lett. 2010, 37, L24106. [Google Scholar] [CrossRef]
  6. Tao, S.; Fang, J.; Zhao, X.; Zhao, S.; Shen, H.; Hu, H.; Tang, Z.; Wang, Z.; Guo, Q. Rapid loss of lakes on the Mongolian Plateau. Proc. Natl. Acad. Sci. USA 2015, 112, 2281–2286. [Google Scholar] [CrossRef] [PubMed]
  7. Cai, Z.; Jin, T.; Li, C.; Ofterdinger, U.; Zhang, S.; Ding, A.; Li, J. Is China’s fifth-largest inland lake to dry-up? Incorporated hydrological and satellite-based methods for forecasting Hulun lake water levels. Adv. Water Resour. 2016, 94, 185–199. [Google Scholar] [CrossRef]
  8. Cao, B.; Xu, D.; Dou, H.; Pang, B.; Ao, W.; Gu, Y.; Shan, N.; Wang, W.; Liu, B.; Zou, C. Index system of ecological security of inland lakes in cold arid region: A case study of Hulun Lake, China. Acta Ecol. Sin. 2021, 41, 2996–3006. [Google Scholar]
  9. Cao, B.; Shan, N.; Gu, Y.; Ao, W.; Pang, B.; Dou, H.; Wang, W.; Zou, C. Evaluation of Ecological Security in Hulun Lake Watershed and Its Spatio-Temporal Distribution Trend. Res. Environ. Sci. 2021, 34, 801–811. [Google Scholar]
  10. Chu, Y.; Li, J.; Jiang, W.; Zhang, Y. Monitoring of Water Level Variations of Hulun Lake with Jason-1 Altimetric Data. J. Geod. Geodyn. 2005, 25, 11–16. [Google Scholar]
  11. Zhao, H.; Wu, L.; Hao, W. Influences of climate change to ecological and environmental evolvement in the Hulun Lake wetland and its surrounding areas. Acta Ecol. Sin. 2008, 28, 1064–1071. [Google Scholar]
  12. Yang, H.; Jiang, M.; Yinglan, A.; Wang, G.; Wu, B. Changes in Land Use and Landscape Pattern in Hulun Lake Nature Reserve. J. Beijing Norm. Univ. Nat. Sci. 2013, 49, 318–325. [Google Scholar]
  13. Pang, Z.; Wu, Y.; Lu, J.; Qu, W. Dynamic Change Remote Sensing Monitoring and Driving Forces Analysis of Hulun Lake Wetland. In Proceedings of the 35th World Congress of the International-Association-for-Hydro-Environment-Engineering-and-Research (IAHR), Chengdu, China, 8–13 September 2013. [Google Scholar]
  14. Chen, X.; Chuai, X.; Yang, L. Status Quo, Historical Evolution and Causes of Eutrophication in Lakes in Typical Lake Regions of China. J. Ecol. Rural Environ. 2014, 30, 438–443. [Google Scholar]
  15. Fan, C.; Song, C.; Liu, K.; Ke, L.; Xue, B.; Chen, T.; Fu, C.; Cheng, J. Century-Scale Reconstruction of Water Storage Changes of the Largest Lake in the Inner Mongolia Plateau Using a Machine Learning Approach. Water Resour. Res. 2021, 57, e2020WR028831. [Google Scholar] [CrossRef]
  16. Guo, J.; Zhang, Y.; Shi, X.; Sun, B.; Wu, L.; Wang, W. Driving Mechanisms of the Evolution and Ecological Water Demand of Hulun Lake in Inner Mongolia. Water 2022, 14, 3415. [Google Scholar] [CrossRef]
  17. Sun, B.; Yang, Z.; Zhao, S.; Shi, X.; Liu, Y.; Ji, G.; Huotari, J. Water Balance Analysis of Hulun Lake, a Semi-Arid UNESCO Wetland, Using Multi-Source Data. Remote Sens. 2023, 15, 2028. [Google Scholar] [CrossRef]
  18. Xu, Y.; Gun, Z.; Zhao, J.; Cheng, X. Variations in lake water storage over Inner Mongolia during recent three decades based on multi-mission satellites. J. Hydrol. 2022, 609, 127719. [Google Scholar] [CrossRef]
  19. Pekel, J.-F.; Cottam, A.; Gorelick, N.; Belward, A.S. High-resolution mapping of global surface water and its long-term changes. Nature 2016, 540, 418–422. [Google Scholar] [CrossRef]
  20. Harris, I.; Osborn, T.J.; Jones, P.; Lister, D. Version 4 of the CRU TS monthly high-resolution gridded multivariate climate dataset. Sci. Data 2020, 7, 109. [Google Scholar] [CrossRef]
  21. Wu, J.; Tan, W.; Yu, L. Comparative study of different water indexes based on TM/ETM+ imagery. Sci. Surv. Mapp. 2013, 38, 193–195. [Google Scholar]
  22. McFeeters, S.K. The use of the normalized difference water index (NDWI) in the delineation of open water features. Int. J. Remote Sens. 1996, 17, 1425–1432. [Google Scholar] [CrossRef]
  23. Xu, H. A Study on Information Extraction of Water Body with the Modified Normalized Difference Water Index (MNDWI). J. Remote Sens. 2005, 9, 589–595. [Google Scholar]
  24. Dong, Y.; Yang, Q. Study on the Dynamic Change of Water Area in the Danjiangkou Reservoir. South--North Water Transf. Water Sci. Technol. 2009, 7, 255–257. [Google Scholar]
  25. Xu, J.; Chen, X.; Chen, W. Study of Water Body Information Extracting Methods Based on Spectrum Characteristics. Geo-Inf. Sci. 2009, 11, 98–103. [Google Scholar] [CrossRef]
  26. Wang, L.; Xie, H.; Wen, G.; Yang, Y. A study on water information extraction method of cyanobacteria lake based on Landsat8. Remote Sens. Land Resour. 2020, 32, 130–136. [Google Scholar]
  27. Zhao, S.; Ji, W.; Gao, P.; Han, W.; Xu, D. Study on Dynamic Change of Hulun Lake Water Area and the Relationship with the Climatic Factors during 1986~2016. J. China Agric. Resour. Reg. Plan. 2018, 39, 53–58. [Google Scholar]
  28. Chang, Y.; Zhang, J.; Han, W.; Ding, X.; Zhang, Y. Monitoring Inter-monthly Change of Namtso Lake Surface Using Sentinel-1AData. Remote Sens. Inf. 2022, 37, 45–52. [Google Scholar]
  29. Wang, W.; Samat, A.; Ma, L.; Ge, Y.; Abuduwaili, J. Spatio-temporal variations and trend analysis of lake area in Xinjiang in 1986–2019. Acta Ecol. Sin. 2022, 42, 1300–1314. [Google Scholar]
  30. Xia, H.; Zhao, J.; Qin, Y.; Yang, J.; Cui, Y.; Song, H.; Ma, L.; Jin, N.; Meng, Q. Changes in Water Surface Area during 1989–2017 in the Huai River Basin using Landsat Data and Google Earth Engine. Remote Sens. 2019, 11, 1824. [Google Scholar] [CrossRef]
  31. Li, M.; Wu, B.; Yan, C.; Zhou, W. Estimation of Vegetation Fraction in the Upper Basin of Miyun Reservoir by Remote Sensing. Resour. Sci. 2004, 26, 153–159. [Google Scholar]
  32. Gutman, G.G. Vegetation Indexes from Avhrr—An Update and Future-Prospects. Remote Sens. Environ. 1991, 35, 121–136. [Google Scholar] [CrossRef]
  33. Zhang, J.; Zhang, S.; Wang, J.; Li, Y. Study on runoff trends of the six larger basins in China over the past 50 years. Adv. Water Sci. 2007, 18, 230–234. [Google Scholar]
  34. Liu, X.; Xue, Y.; Ji, Y.; Xu, B.; Ren, Y. An assessment of water quality in the Yellow River estuary and its adjacent waters based on principal component analysis. China Environ. Sci. 2015, 35, 3187–3192. [Google Scholar]
  35. Singh, K.V.; Setia, R.; Sahoo, S.; Prasad, A.; Pateriya, B. Evaluation of NDWI and MNDWI for assessment of waterlogging by integrating digital elevation model and groundwater level. Geocarto Int. 2015, 30, 650–661. [Google Scholar] [CrossRef]
  36. Li, S.; Chen, J.; Xiang, J.; Pan, Y.; Huang, Z.; Wu, Y. Water level changes of Hulun Lake in Inner Mongolia derived from Jason satellite data. J. Vis. Commun. Image Represent. 2019, 58, 565–575. [Google Scholar] [CrossRef]
  37. Ren, Z.; Li, M.; Zhang, W. Conversion coefficient of small evaporation pan into E-601B pan in China. J. Appl. Meteorol. Sci. 2002, 13, 508–512. [Google Scholar]
  38. Peng, Y.; Li, Z.; Yao, X.; Mou, J.; Han, W.; Wang, P. Area Change and Cause Analysis of Bosten Lake based on Multi-source Remote Sensing Data and GEE Platform. J. Geo-Inf. Sci. 2021, 23, 1131–1153. [Google Scholar]
  39. Jin, Y.; Xu, M.; Gao, S.; Wan, H. Analysis on the Dynamic Changes and Driving Forces of Surface Water in the Three-River Headwater Region from 2001 to 2018. Remote Sens. Technol. Appl. 2021, 36, 1147–1154. [Google Scholar]
  40. Wu, S.; Sun, Y. Analysis of Surface and Groundwater Changes of the Hulun Lake based on Multi-source Data. Remote Sens. Technol. Appl. 2021, 36, 155–164. [Google Scholar]
  41. Wang, P.; Guo, Y.; Zhou, K.; Zheng, S.; Jiang, X.; Wang, S. Variation of Lake Area of Hulun Lake during 1961–2018 and Its Response to Climate Change. Res. Environ. Sci. 2021, 34, 792–800. [Google Scholar]
  42. Yang, L.; Tian, L.; Bai, G.; Pei, S.; Zhang, D. Ecological risk assessments and source analysis of heavy metals in the soil of Xin Barag Youqi, Inner Mongolia. Geol. China 2022, 49, 1970–1983. [Google Scholar]
  43. Pei, S.; Yuan, J.; Huang, M. Soil Geochemical anomly Characteristics of Xinbaerhuzuoqi, Inner Mongolia and the Ore prospecting direction. Contrib. Geol. Min. Resour. Res. 2018, 33, 449–457. [Google Scholar]
  44. Gu, Y.; Pang, B.; Qiao, X.; Xu, D.; Li, W.; Yan, Y.; Dou, H.; Ao, W.; Wang, W.; Zou, C.; et al. Vegetation dynamics in response to climate change and human activities in the Hulun Lake basin from 1981 to 2019. Ecol. Indic. 2022, 136, 108700. [Google Scholar] [CrossRef]
  45. Shi, J.; Zhao, L. The Research on Sustainable Development and the Industrial Transformation of Resource-based Region. J. Arid Land Resour. Environ. 2008, 22, 47–50. [Google Scholar]
  46. Lei, S.; Bian, Z. Research progress on the environment impacts from underground coal mining in arid western area of China. Acta Ecol. Sin. 2014, 34, 2837–2843. [Google Scholar]
  47. Zhao, C.; Wang, Q.; Wang, H.; Yang, J.; Liu, J.; Zhang, Y. Analysis of influence of open-pit coal mining on groundwater system and curtain wall protection in grassland area of Northeastern China. J. China Coal Soc. 2019, 44, 3685–3692. [Google Scholar]
  48. Huang, Y.; Yao, B.; Li, Y.; Zhang, H.; Wang, S. Deciphering Hulun lake level dynamics and periodical response to climate change during 1961–2020. J. Hydrol. Reg. Stud. 2023, 46, 101352. [Google Scholar] [CrossRef]
  49. Chen, J.; Chen, S.; Ma, F.; Chen, J. Analysis of water balance of Hulun Lake based on digital remote sensing images. Water Resour. Prot. 2020, 36, 73–79. [Google Scholar]
  50. Pei, H.; Liu, M.; Jia, Y.; Zhang, H.; Li, Y.; Xiao, Y. The trend of vegetation greening and its drivers in the Agro-pastoral ecotone of northern China, 2000–2020. Ecol. Indic. 2021, 129, 108004. [Google Scholar] [CrossRef]
Figure 1. Study area.
Remotesensing 15 02682 g001
Figure 2. Comparative verification of water area extraction results (The unit is km2): (a) MNDWI and (b) JRC.
Remotesensing 15 02682 g002
Figure 3. Characteristics of temporal variation in Hulun Lake. (a) Lake area and (b) water level and water volume.
Remotesensing 15 02682 g003
Figure 4. Distribution of the water area of Hulun Lake in key years.
Remotesensing 15 02682 g004
Figure 5. Distribution of meteorological factors in the Hulun Lake region.
Remotesensing 15 02682 g005
Figure 6. Correlation coefficient between the water area of Hulun Lake and meteorological factors: (a) 1986–2019; (b) 1986–2008; (c) 2009–2019. (Lake area (LA), precipitation (Pre), temperature (Temp), relative humidity (RH), evaporation (Evap), vapor pressure (Vap), and wet day frequency (Wet)).
Remotesensing 15 02682 g006
Figure 7. Dynamic changes in the water area and surface runoff in Hulun Lake from 2000 to 2020.
Remotesensing 15 02682 g007
Figure 8. 1986–2020 annual variation in FVC in the Hulun Lake region (a) and M–K mutation test results (b).
Remotesensing 15 02682 g008
Figure 9. Grading map of FVC in the Hulun Lake area.
Remotesensing 15 02682 g009
Figure 10. Correlation coefficient between the area of Hulun Lake and the fractional vegetation cover: (a) 1986–2020; (b) 1986–2008; (c) 2009–2020.
Remotesensing 15 02682 g010
Figure 11. The correlation coefficient between the area of Hulun Lake and anthropogenic factors.
Remotesensing 15 02682 g011
Table 1. Vegetation cover grading.
GradeGrading Standard
High CoverageFVC > 0.7
Medium-High Coverage0.5 < FVC ≤ 0.7
Medium Coverage0.3 < FVC ≤ 0.5
Medium-Low Coverage0.1 < FVC ≤ 0.3
Low CoverageFVC ≤ 0.1
Table 2. Hulun Lake water extraction confusion matrix.
(a) MNDWI
Google Reference DataTotalUA
WaterNon-Water
Water189819795.94%
Non-Water1119220394.58%
Total200200 OA95.25%
PA94.50%96.00% Kc0.905
(b) JRC
Google Reference DataTotalUA
WaterNon-Water
Water1866725373.52%
Non-Water1413314790.48%
Total200200 OA79.75%
PA93.00%66.50% Kc0.595
Table 3. Correlation coefficient between the area of Hulun Lake and the annual runoff of rivers entering the lake.
Lake AreaAnnual Runoff of Wuerxun RiverAnnual Runoff of Kerulen River
Lake Area1
Annual Runoff of Wuerxun River0.351
Annual Runoff of Kerulen River0.73 *0.381
Note: * represents a significant correlation at the 0.05 level.
Table 4. KMO test and Bartlett spherical test.
KMO Test and Bartlett Spherical Test
KMO0.667
Bartlett Spherical Testχ2204.847
df36
Sig0.000 **
Note: ** represents an extremely significant correlation at the 0.01 level.
Table 5. Total variance explained by PCA. (Component 1–8 is a comprehensive variable obtained from data dimensionality reduction, which can fully reflect the data characteristics of the original information. The weight of each load in each comprehensive variable is different, which represents the influencing factors of different biases of each comprehensive variable.)
ComponentInitial EigenvalueExtract the Load Sum of Squares
Total %Variance %Accumulation %Total %Variance %Accumulation %
14.3147.8547.854.3147.8547.85
22.3926.5474.392.3926.5474.39
30.9810.9485.33
40.869.5194.84
50.262.8697.70
60.121.3699.06
70.070.7499.80
80.020.20100.00
Disclaimer/Publisher’s Note: The statements, opinions and data contained in all publications are solely those of the individual author(s) and contributor(s) and not of MDPI and/or the editor(s). MDPI and/or the editor(s) disclaim responsibility for any injury to people or property resulting from any ideas, methods, instructions or products referred to in the content.

