1. Introduction
Coffee is one of the most important products for the Colombian economy and represents a source of income for 540,000 medium and small producers’ families. According to the Colombian Ministry of Finance, it is an important export product for economic recovery thanks to its international value. Coffee production in Colombia was 12.1 million 60 kg bags in 2021, falling by 11% compared to 2020. This diminution was due to unfavorable weather conditions for coffee crops. For this reason, it is of particular interest to focus efforts on investigating the coffee production process that allows for the optimization of production [
1]. The crop yield is quantified by the number of coffee grains per unit area as a representative measure of productivity [
2].
Early yield prediction can anticipate the nutritional requirements of the trees, and can also allow for optimizing irrigation and fertilizer use, improving production quality at a lower cost. To predict yield early, it is important to consider phenological cycles and production stages to support the farmers’ decision-making as set out in [
3]. The phenological cycle starts at the flowering stage [
4]. The subsequent process is the filling of the coffee fruits, and it is fundamental to foresee the demanding nutritional requirements of the tree, before the maturation stage and picking. Furthermore, understanding crop yields allows support for decision-making in the other processes, such as picking, drying, and storage [
4,
5]. Crop yield is directly determined by the dynamics of the tree–soil–environment system, as defined by specific predictors in each element of the system. For example, temperature, water availability, and precipitation are predictors that correspond to the environment [
6]. Other variables may be edaphic predictors, such as the soil type and its composition, and tree characteristics, such as its age, variety, planting density, health, and physiology, which directly influence crop yield.
Predictors can be collected manually or by proximity sensors, satellites, cameras, or weather stations. Currently, the use of UAVs has countless advantages in precision agriculture. By capturing images, it is possible to obtain high-resolution data without the influence of atmospheric conditions, making this technology accessible to small and medium size growers.
One of the applications of aerial images is to obtain physical and spectral characteristics; for example, the work of dos Santos et al. [
7] calculated the height and diameter variables from aerial images. The objective of this research was to use DSM from UAVs carrying conventional RGB cameras. That work [
7] demonstrated the feasibility of obtaining the height and the diameter of a coffee tree with a correlation of 95% for diameter and 85% for height.
In our research of the literature, the work of Idol et al. in [
8] exemplified the prediction of crop yields through manually obtaining information. This process estimates the number of nodes and fruits on all the visible sides of the tree. In the same way, Castro et al. in [
9] studied collecting manual yield samples, showing the relationship between the lateral yield and total tree yield. Both works show the efforts in making yield estimates. However, neither does it in a non-early way. Similarly, Unigarro et al. [
10] compared the phenotypic characteristics of coffee trees to yield, concluding that the leaf area is a determining predictor. The above methods detail manual data collection methodology. These models have a precision greater than 90% but the data collection is very difficult and is highly invasive. They are both costly and time-consuming, and do not allow early prediction of crop yields [
8,
9].
Works such as [
11,
12] that involved agrometeorological models likewise used satellite images and environmental variables at a regional level, but was not suitable for tree-centered analysis. For example, Picini et al. [
11] studied a model to estimate potential coffee production based on the evapotranspiration of the planting and the previous year’s production; this work obtained a
of 0.9 in a deterministic model involving the relationship between potential yield and expected yield. However, Rosa et al. [
12] obtained a non-conclusive result using the NDVI and its relationship with the LAI.
Barbosa et al. proposed another essential approach in [
13], studying regression models on the basis of physiological characteristics, such as the height and diameter obtained from RGB images using UAVs for yield estimation, manually validating the results with the image. In this research, the total beans of the coffee tree were obtained by georeferencing each point with the GCP tool. The training process of regression models, such as SVM, PLS, gradient boosting, and RF, used 144 data records. The calculation of the height and diameter varied between 6% and 7%, and the MAPE measurement for the regression models was around 31%. This work did not consider the spectral analysis based on vegetation indices.
Kouadio et al. [
14] has a relevant approach, where a machine learning model based on three different algorithms, EML, RF, and LR, was proposed. All of these models were trained using the soil nutrient characteristics which allowed yield calculations. It is important to note that the best performance model for yield calculation was EML, using organic material, phosphorus and sulphur predictors. This was validated by RMSE with ±13.6% and a MAE with ±7.9%. Similarly, Nguyen et al. [
15] proposed a statistical model for the early prediction of coffee crop yields based on vegetation indexes at a regional level with Copernicus data for the NDVI, FAPAR, and LAI predictors, obtaining an Adj
from 64 to 69% in regression models using the Crop Growth Monitoring System statistical tool, which allows early prediction of up to 6 months before the harvest.
Considering these previous works, this research focuses on obtaining reliable data to demonstrate the feasibility of early coffee yield prediction using low-cost tools, facilitating higher technology access to small and medium producers. The aerial images obtained were processed and segmented to find the spectral and physical characteristics for each coffee tree. Manual methodology was used to collect yield data. This consisted of picking all the coffee cherries on one tree. Finally, a linear correlation analysis was performed, obtaining significant results, such as a 70% correlation between the tree volume and the crop yields. With these results, a regression model training process was carried out. It obtained a
score of approximately 56% for some models, such as linear regression. The
score or the determination coefficient defines the quality or the adjustment of a model using the percentage variance of a variable that is explained by another according to [
16].
This work involved the following process: 1. obtaining multi-spectral aerial images during the flowering stage; 2. defining the post-processing process for the segmentation and individualization of the trees; 3. building a manual data collection interface; 4. the manual data collection; 5. the manual data analysis to calculate the yield by tree; 6. exploiting the regression-based prediction models; 7. analysis of the results.
2. Materials and Methods
Section 2 describes the image collection process and the task of obtaining manual coffee crop yield training information. This section begins with a description of the study area, the tools, the image processing, and the segmentation of the trees, and ends with the analysis of the predictors for the regression models.
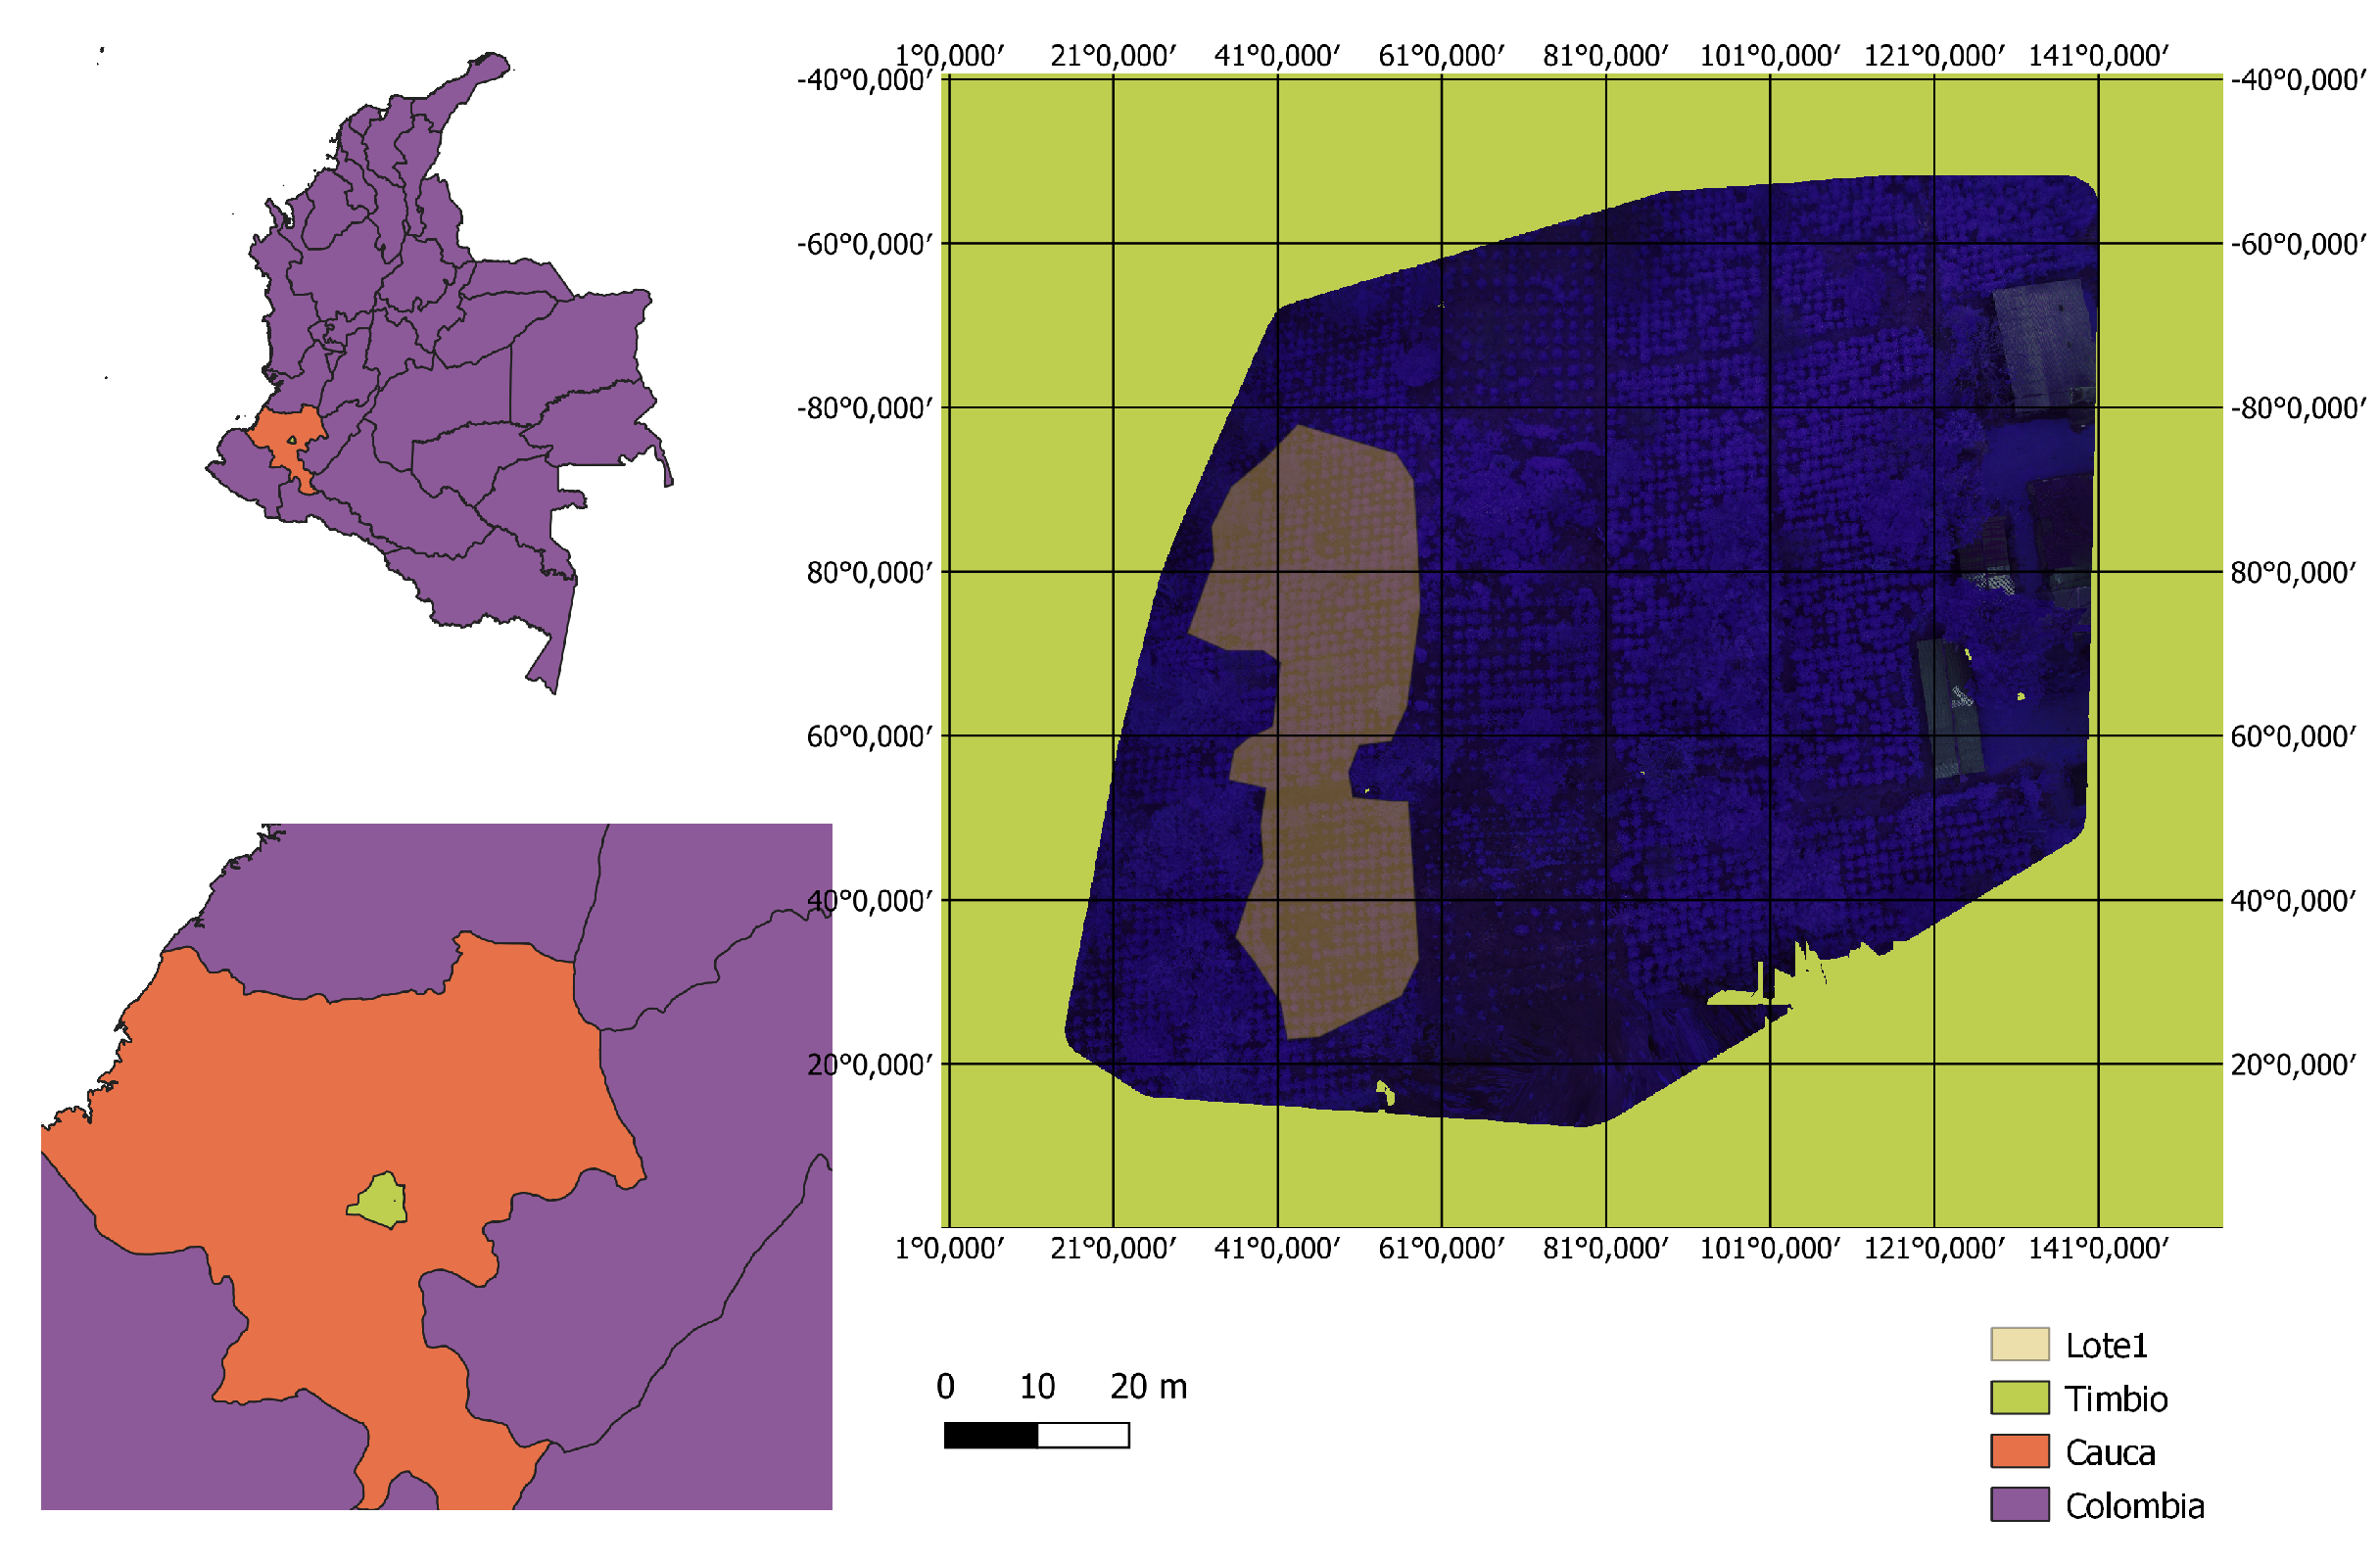
2.1. Study Area
This experiment was carried out on the “La Sultana” estate, which is a farm at the Universidad del Cauca located in the municipality of Timbio, Cauca, Colombia (
Figure 1) (2°
28.51
N, 76°
31.89
O) altitude: 1850 m.s.n.m.
Since 2006, La Sultana has carried out sustainable coffee production through its ecological processing and management [
17]. In addition, good practices produce high-quality coffee with environmental, social, and economic sustainability.
On the other hand, the image taking was carried out during the flowering stage from July to August 2021. Manual yield samples were taken from three coffee plantations of the Castillo variety between November and December 2021.
2.2. Manual Yield Sampling of Coffee Trees
The objective to obtain manual variables is to determine the real yield of a tree. The non-invasive data collection process in this paper was based on the work of Idol et al. [
8]. It begins counting plagiotropic branches and then performs a sampling of nodes and beans in order to estimate the total yield per tree.
Manual data collection is a costly, complex, and slow process. This work does not have per tree information that would allow training the prediction models. Because of this, a web tool was implemented to expedite the process of obtaining the crop yield samples. The individualization of trees in the web application streamlines manual sampling. This process is explained in
Section 2.4.
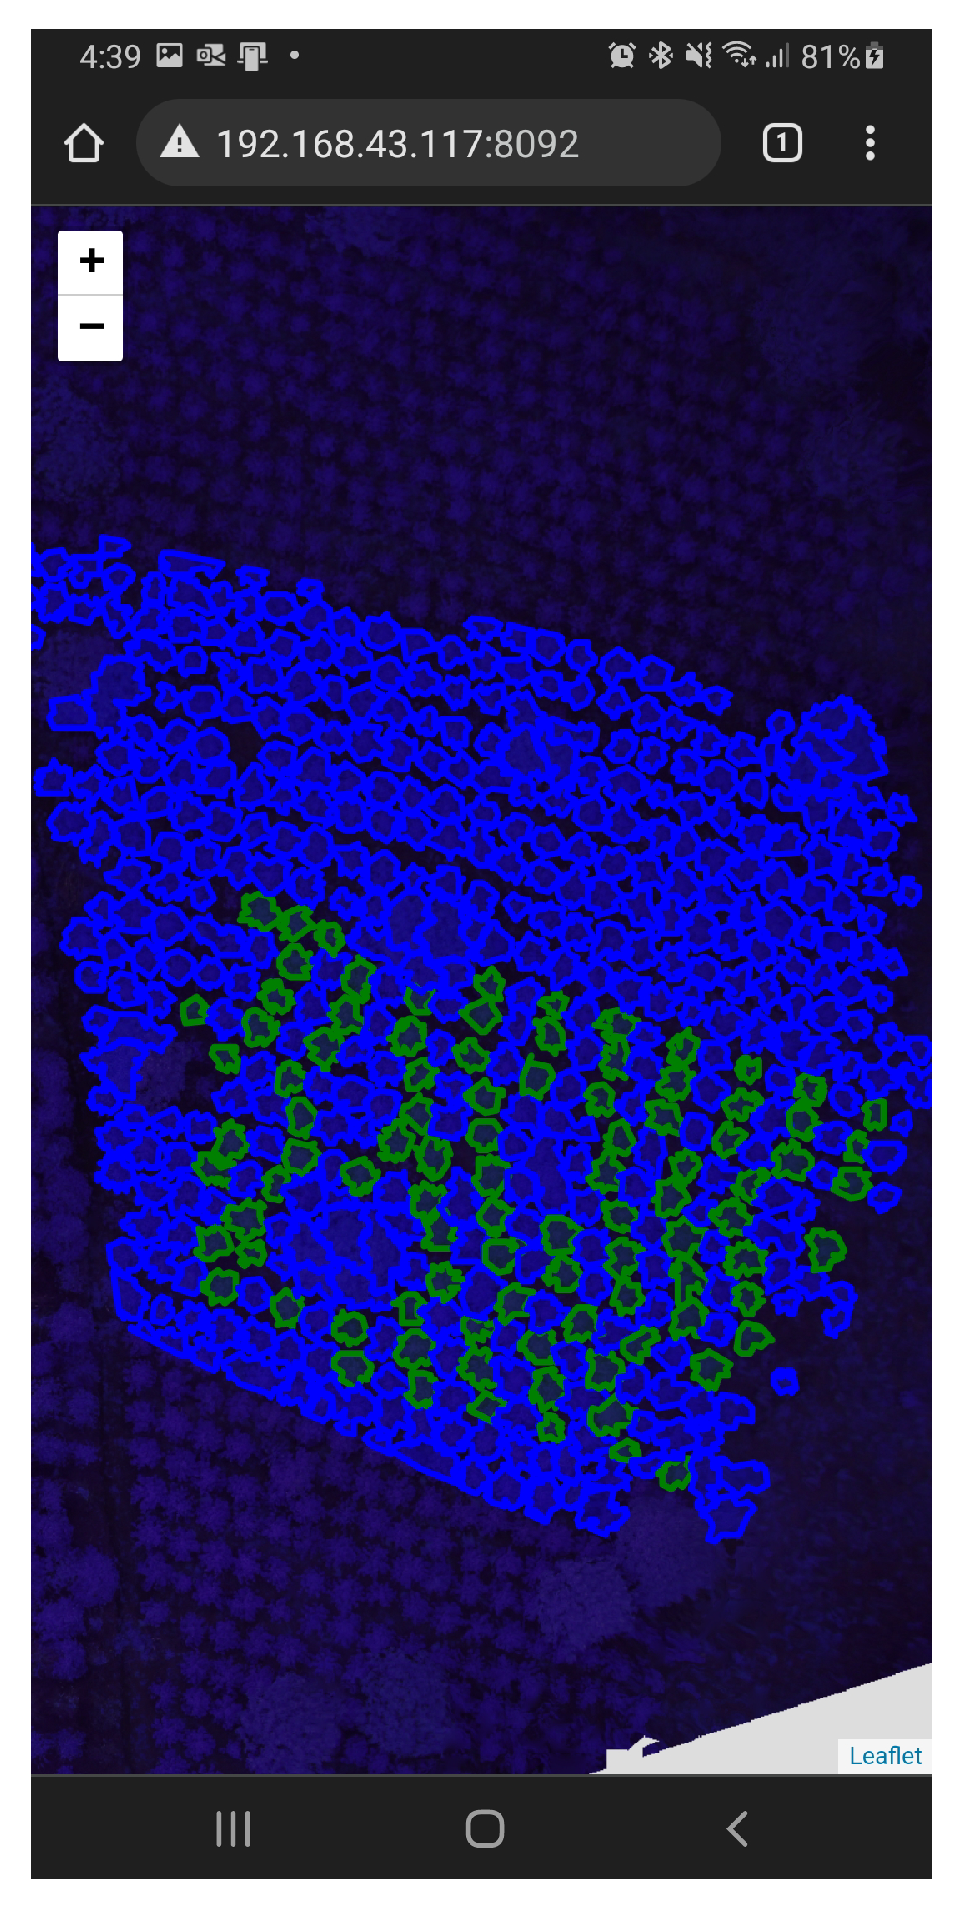
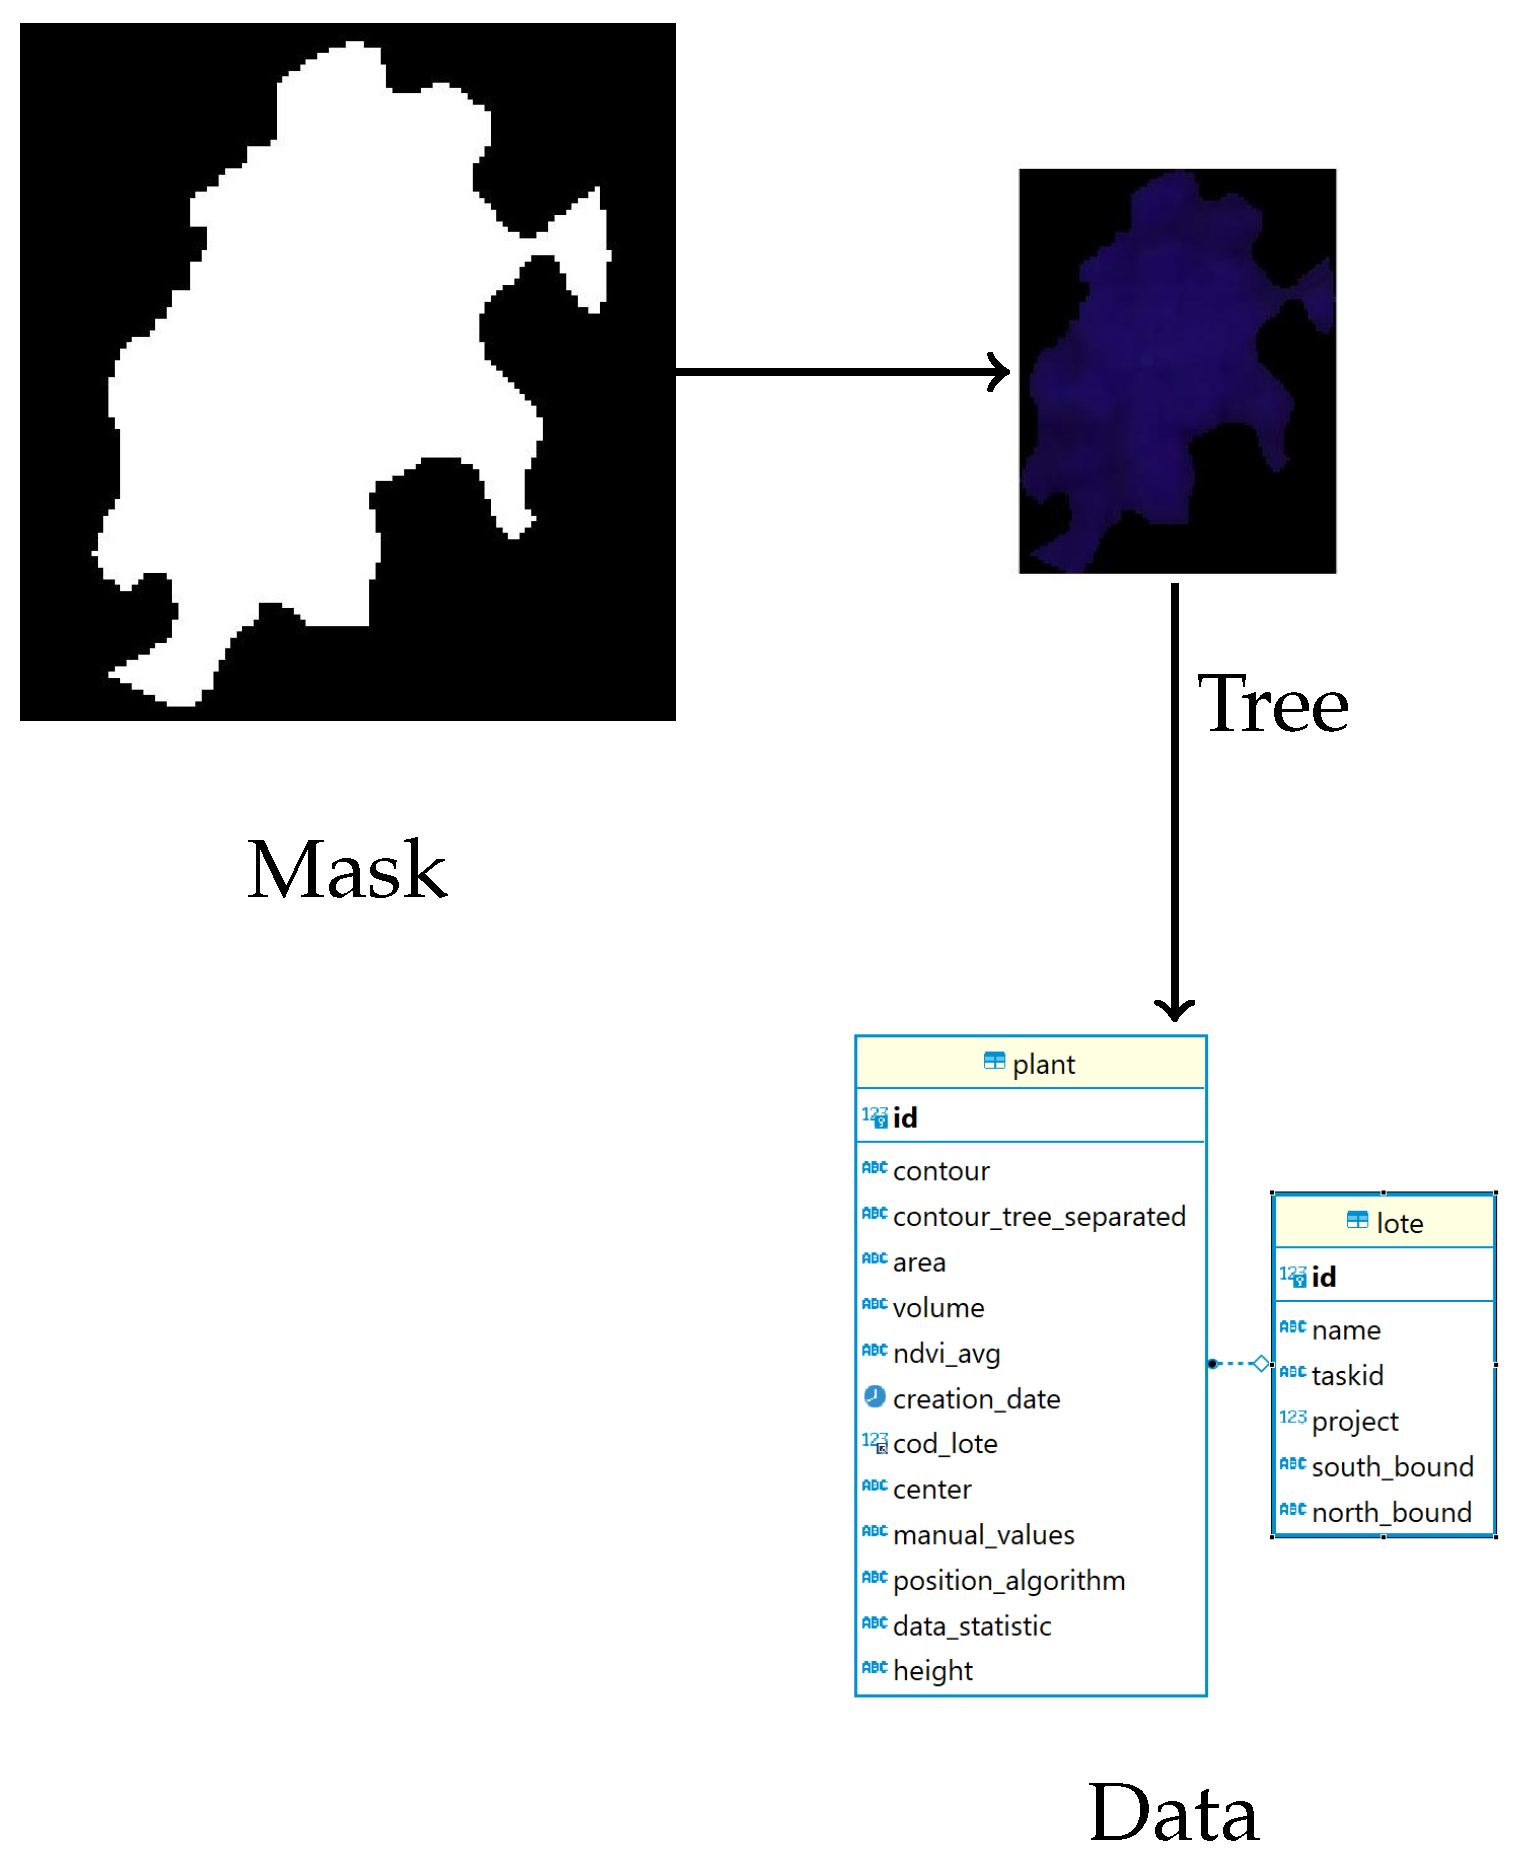
Figure 2 shows the results of the massive segmentation carried out by the web tool developed to obtain manual variables. All of the tree information is stored in a Mysql relational database.
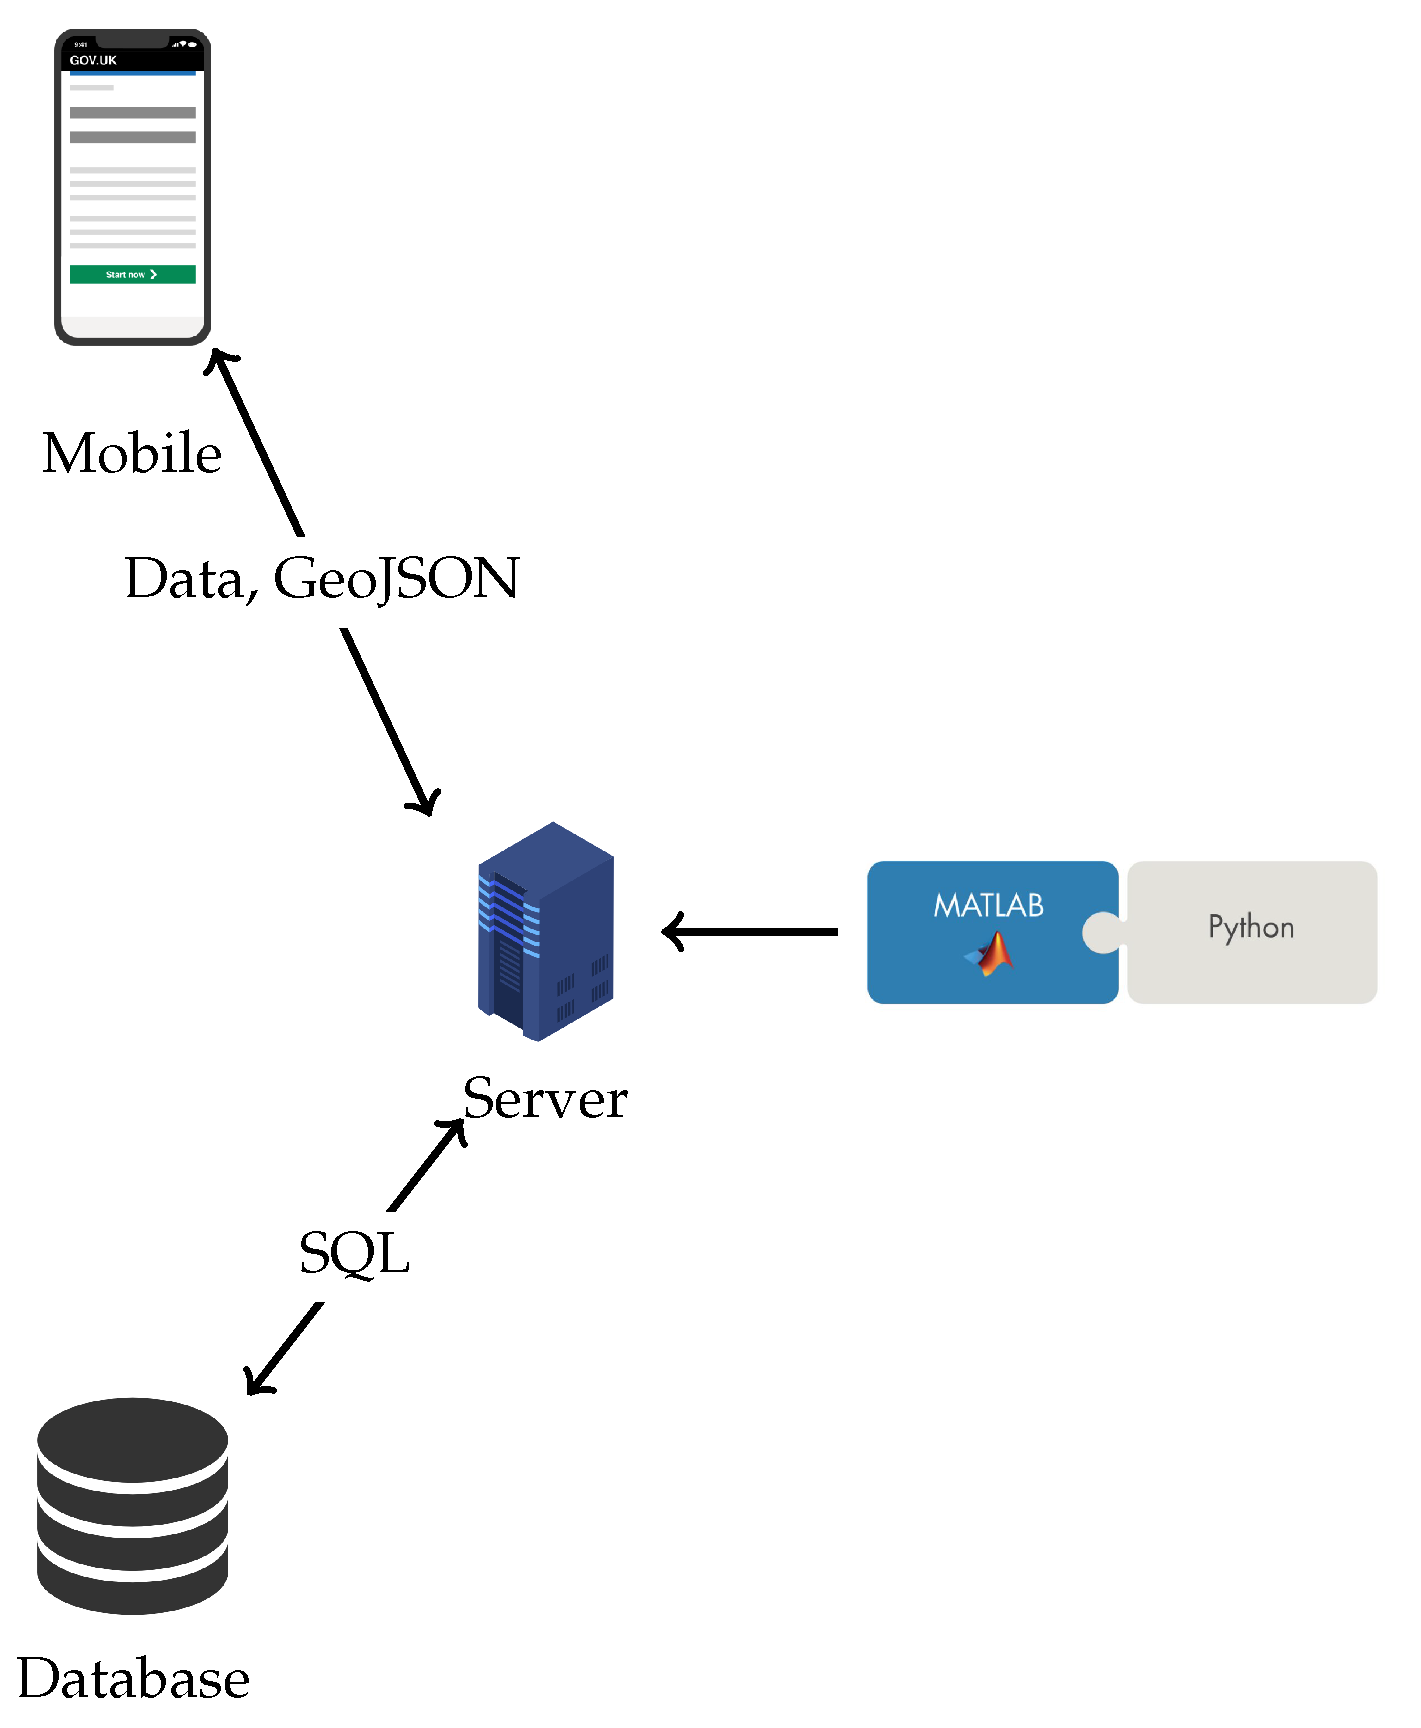
Figure 3 shows a representation of the client–server architecture of the web application. The interface allows us to save the information automatically to avoid any data loss. For the dynamic, georeferenced and agile load of the orthophotos, this research integrated the WEBodm mosaic service. This service, along with the GEOJson representation of tree edges, allows us to use the LeafletJS library that incorporates all the information on the same map [
18]. The result is an interactive experience that is easy to carry out by people with no advanced knowledge of the sample collection process.
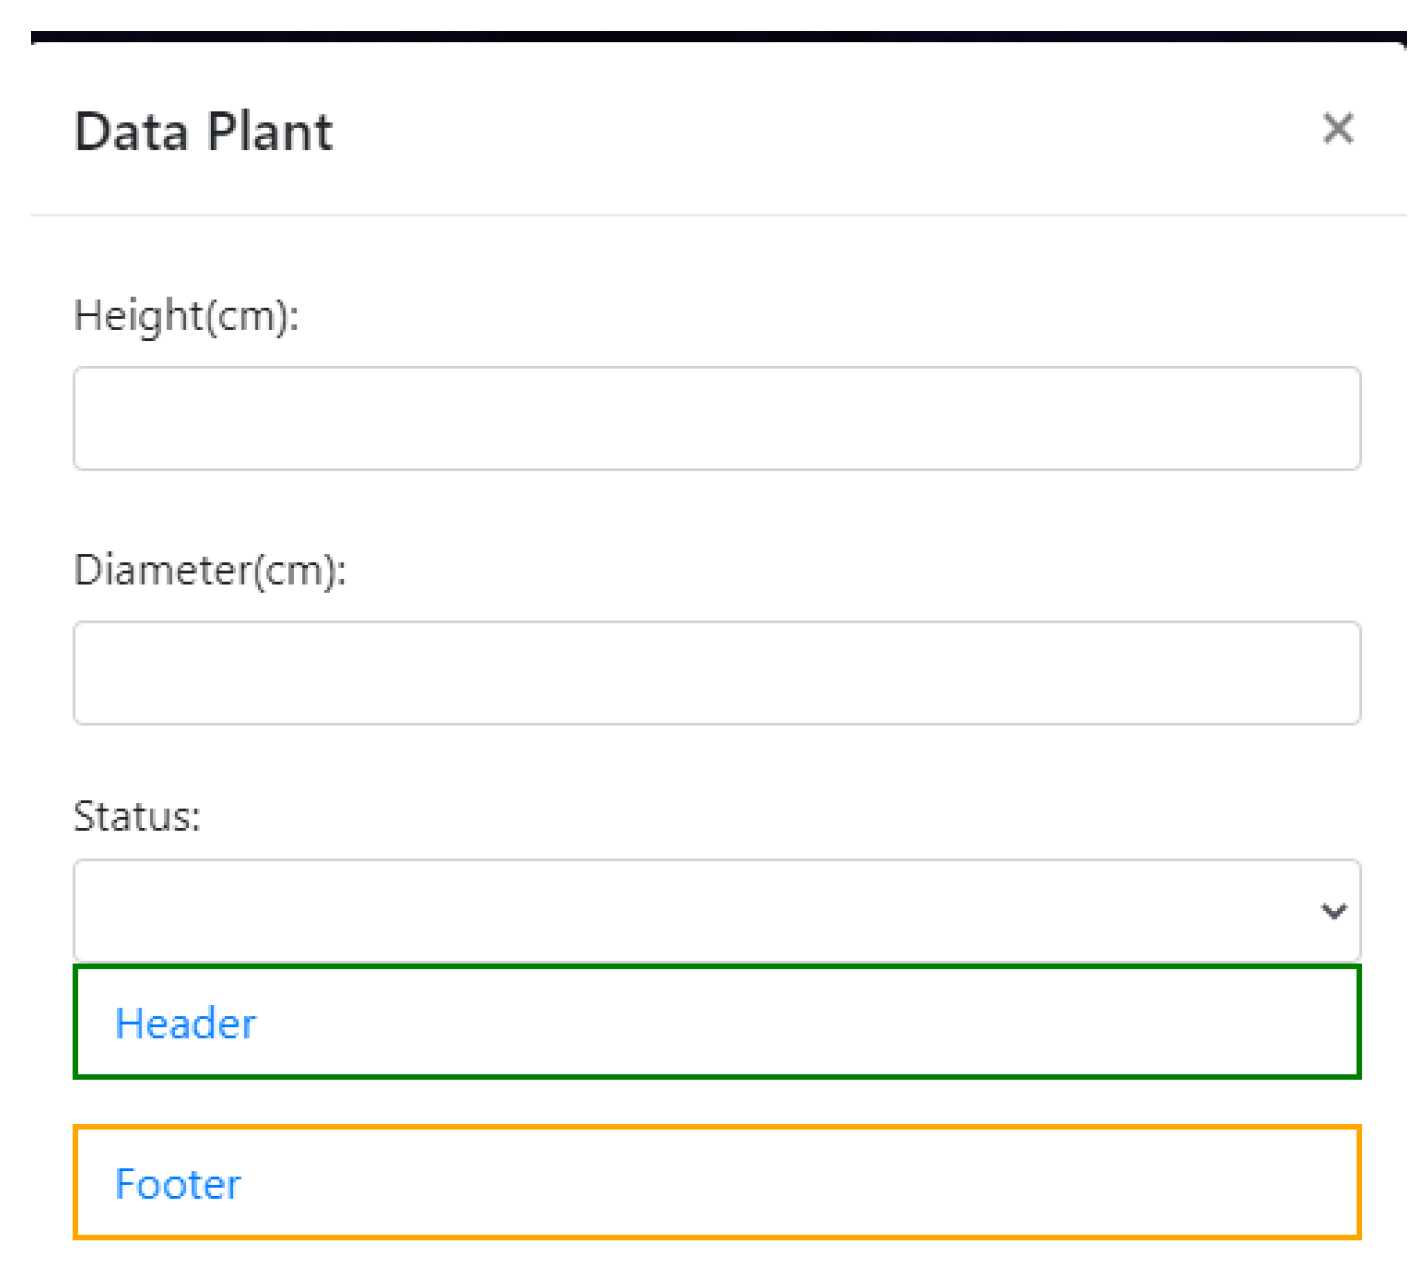
As shown in
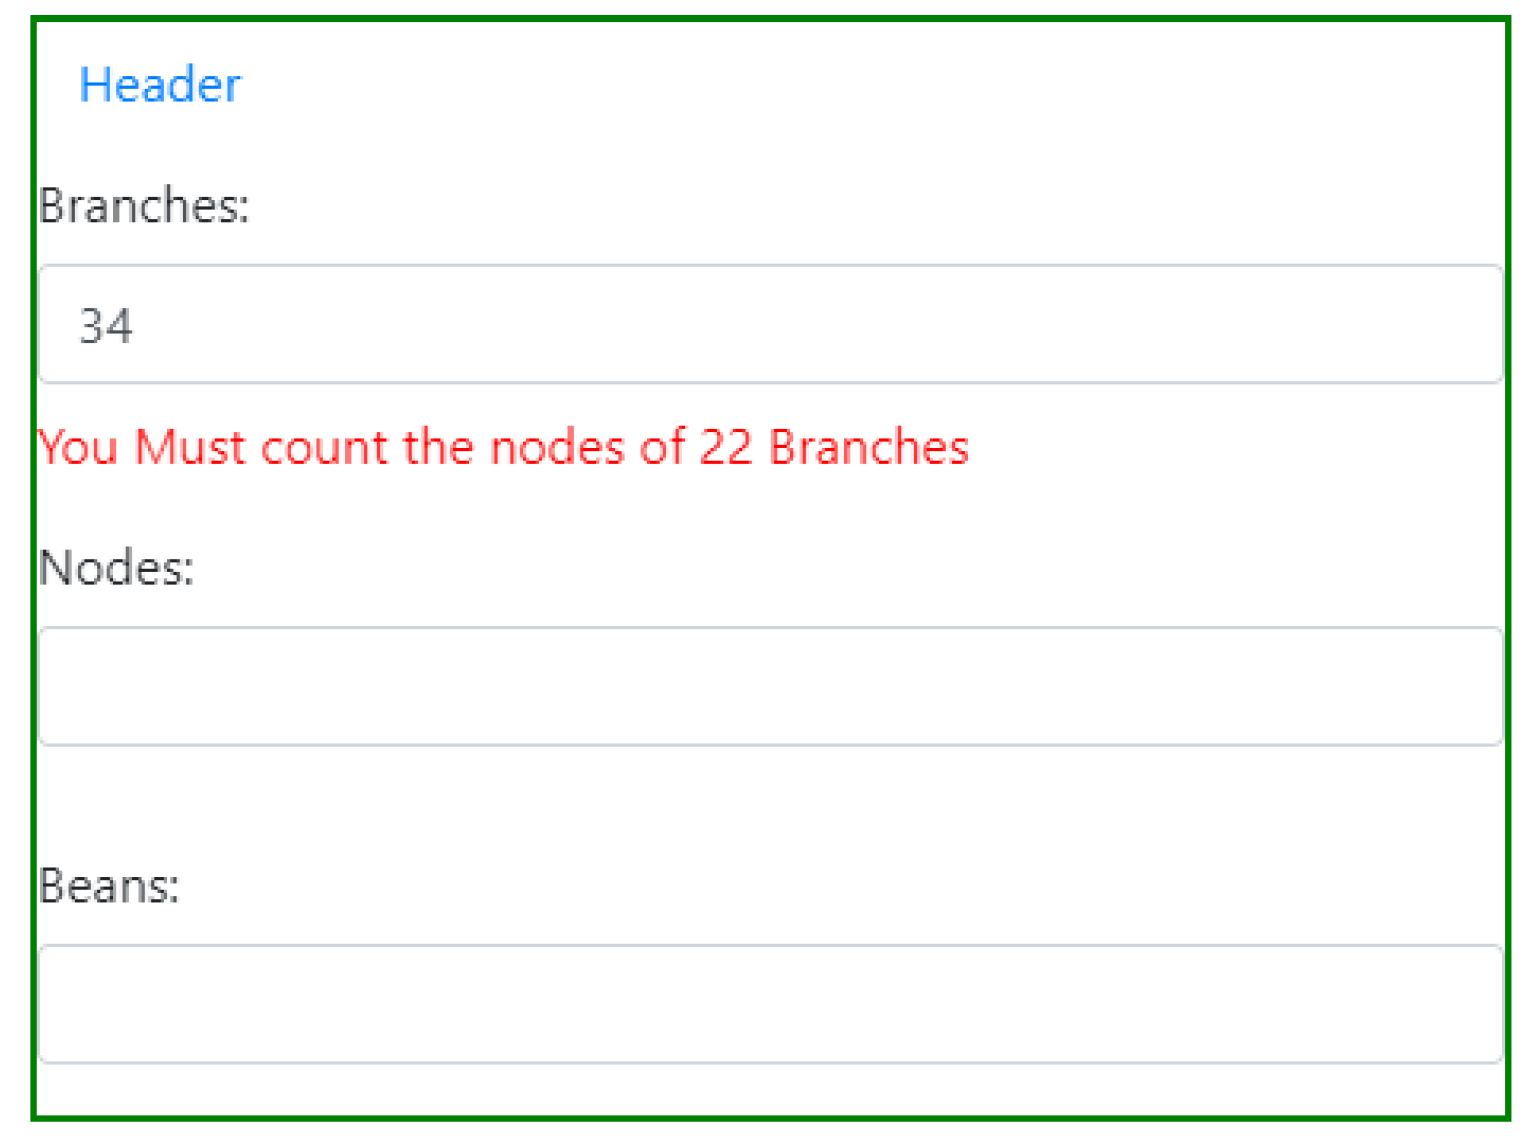
Figure 4, the height and diameter of the trees are required in the interface for comparison purposes. Here, the trees were divided into two independent samples, the header and the footer.
Figure 5 shows the interface where the number of branches, nodes and cherries is recorded. Based on a statistical calculation of the sample size, this research sampled nodes and cherries with an 8% error and a 80% confidence level. The standard deviation was fixed at 0.5 [
19].
The manual sampling process is expensive, so the data volume cannot be high. In this work, it was possible to take 370 real data samples verified in 3 different fields randomly defined by the coffee pickers. The age of the trees in the fields were 2, 3, and 7 years, respectively.
2.3. Platform to Acquire Images
The UAV platform used in this work was a Phantom 3 Standard four-bladed drone. Mission Planner was used for flight plans, the missions were run using the Litchi app The operating speed was 5 km/h with an 18-meter altitude. This research established longitudinal and lateral overlapping of 80%, capturing the images between 10:00 a.m. and 1:00 p.m. Colombian local time under a cloudy sky. The aerial image capture was carried out between July and August 2021 to perform the early yield predictions.
The images were obtained using a MAPIR Survey 3W camera. The modified RGN camera was equipped with a Sony Exmor R IMX117 sensor that has a 12-megapixel resolution using the default parameters recommended by Mapir [
20]. All the configurations were the same for all flights. Finally, the resulting images were saved in the JPG and RAW format for subsequent processing.
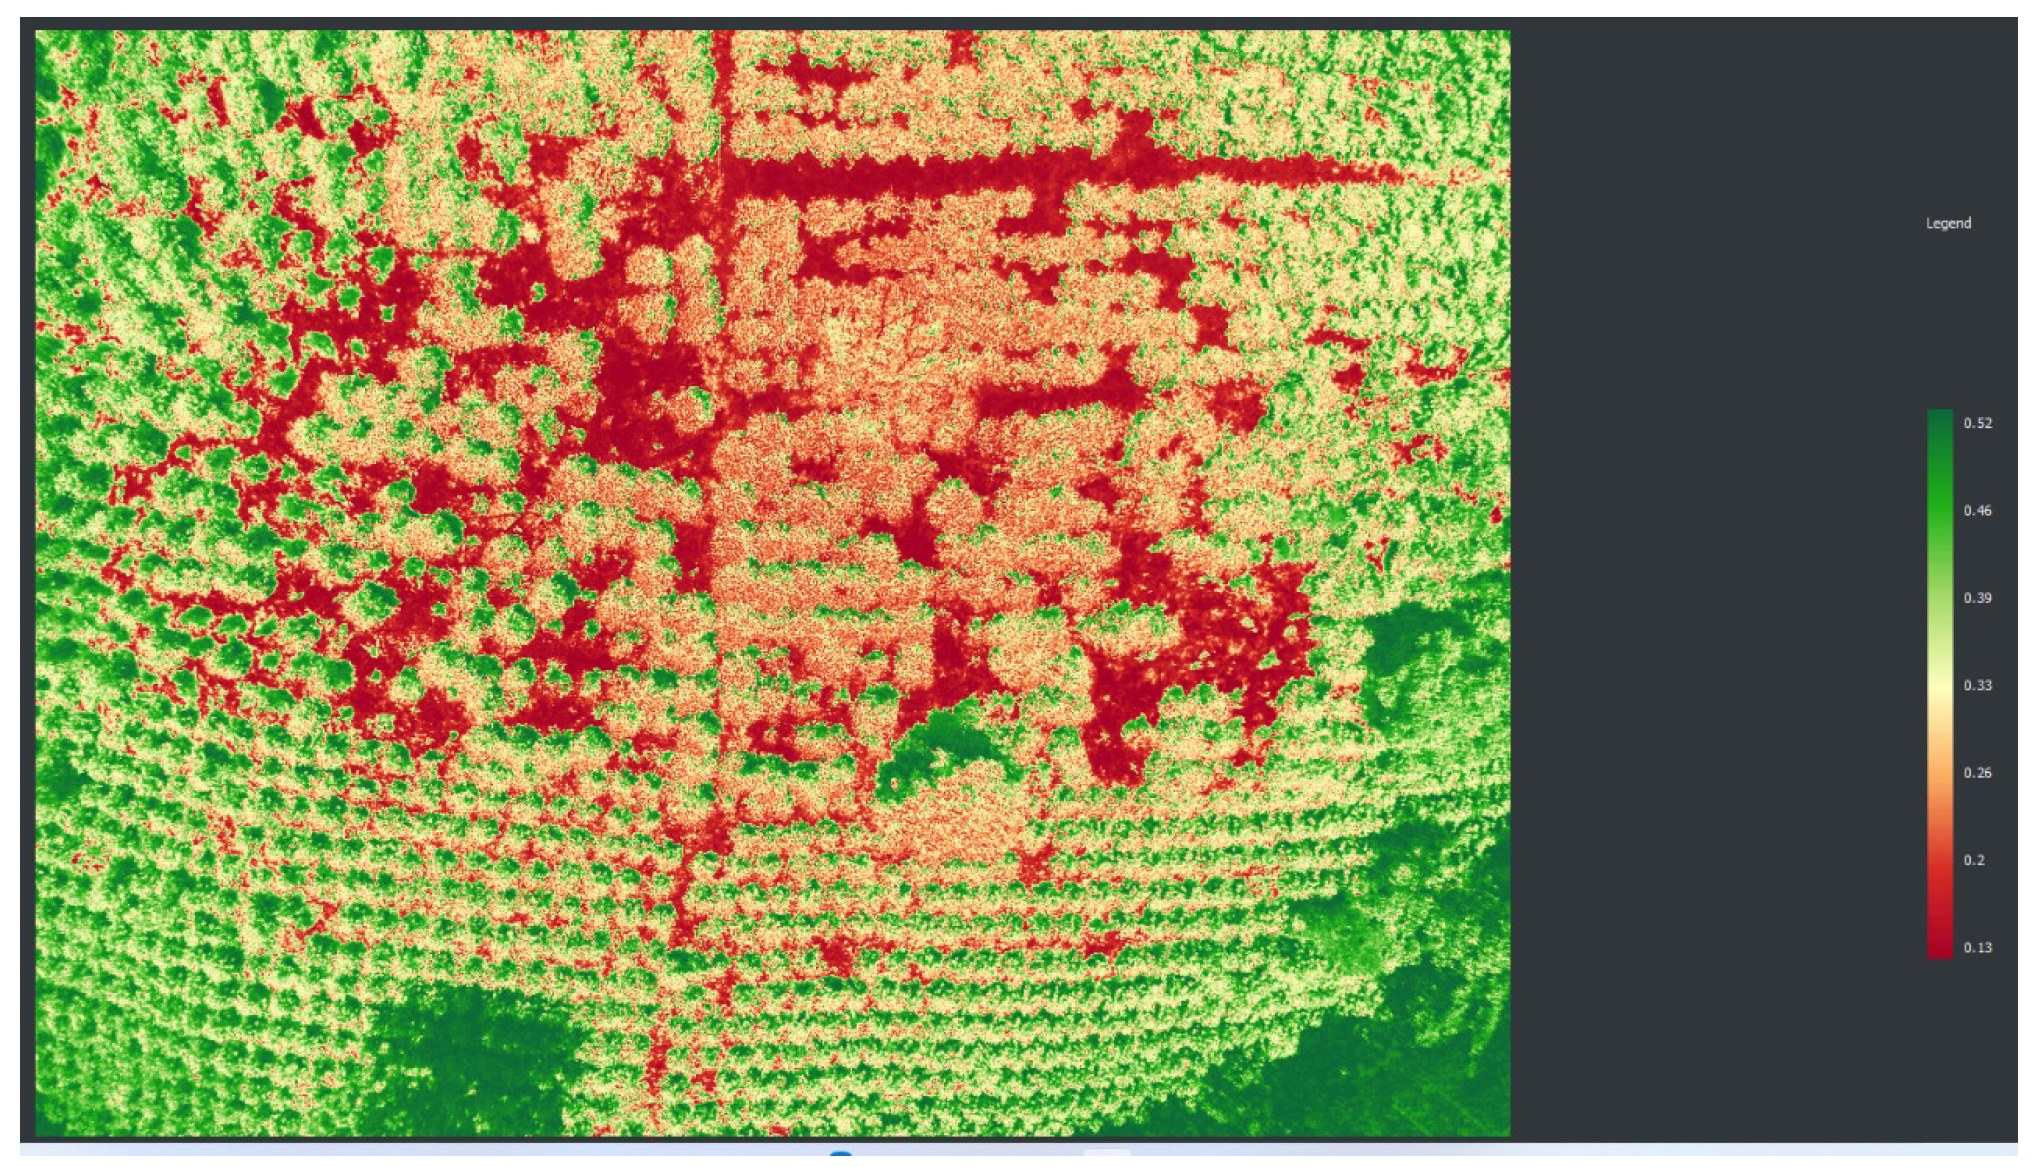
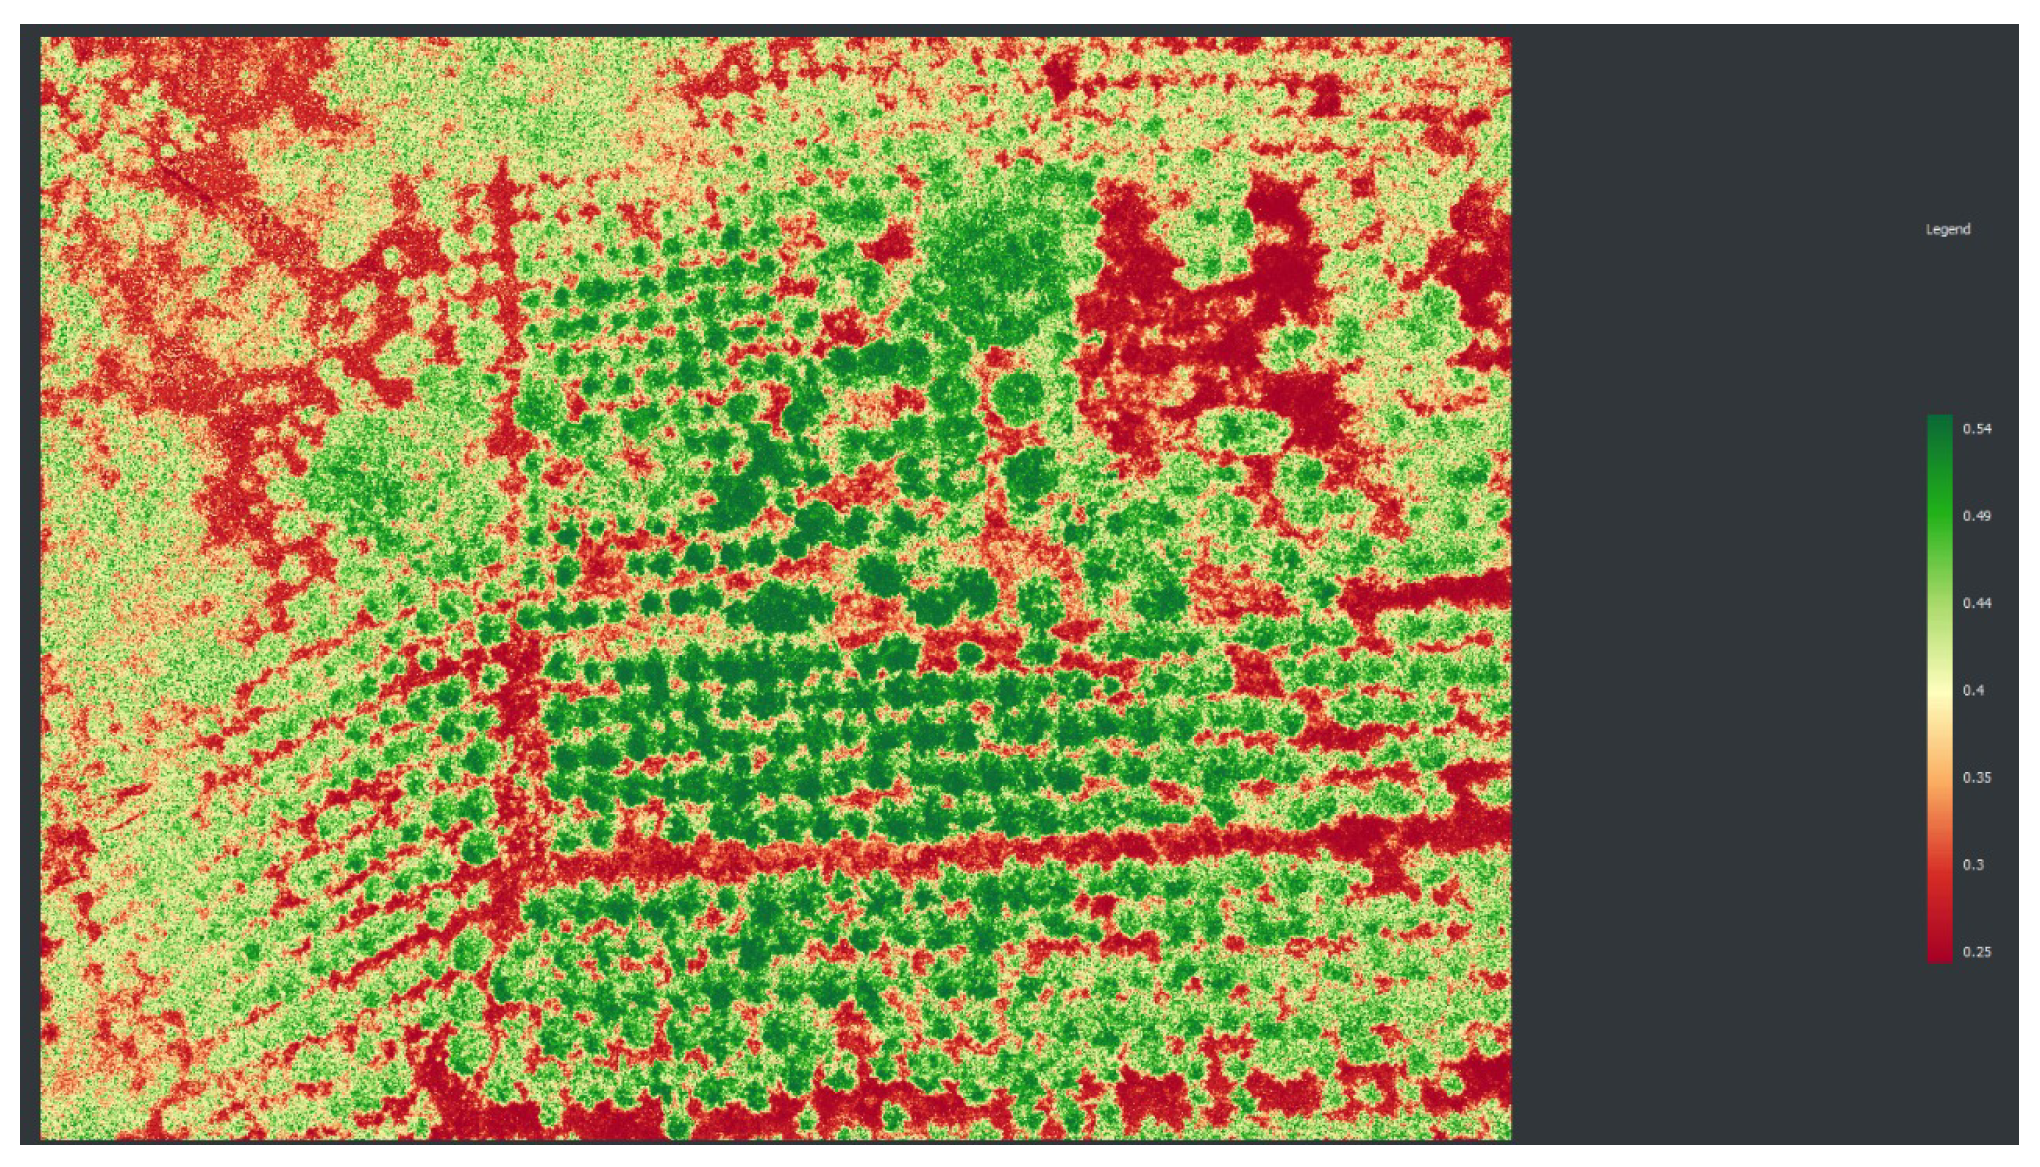
Cloudy sky conditions were chosen to avoid saturating the camera’s NGR channels. The NIR reflectance affects the red channel as established in [
21]. Images were taken under cloudy and clear sky conditions to determine the best NDVI results, as shown in
Figure 6 and
Figure 7. In the sunny image, the shadows directly influence the NDVI index behavior.
This research pre-processed the images collected using the Mapir Camera Control for the radiometric calibration [
22]. The GPS was set up with incorrect height tags; the ExifTool solved this. Later, the image mosaics were made using the WEBOdm tool generating the DSM and the orthophotos [
23].
2.4. Processing Images
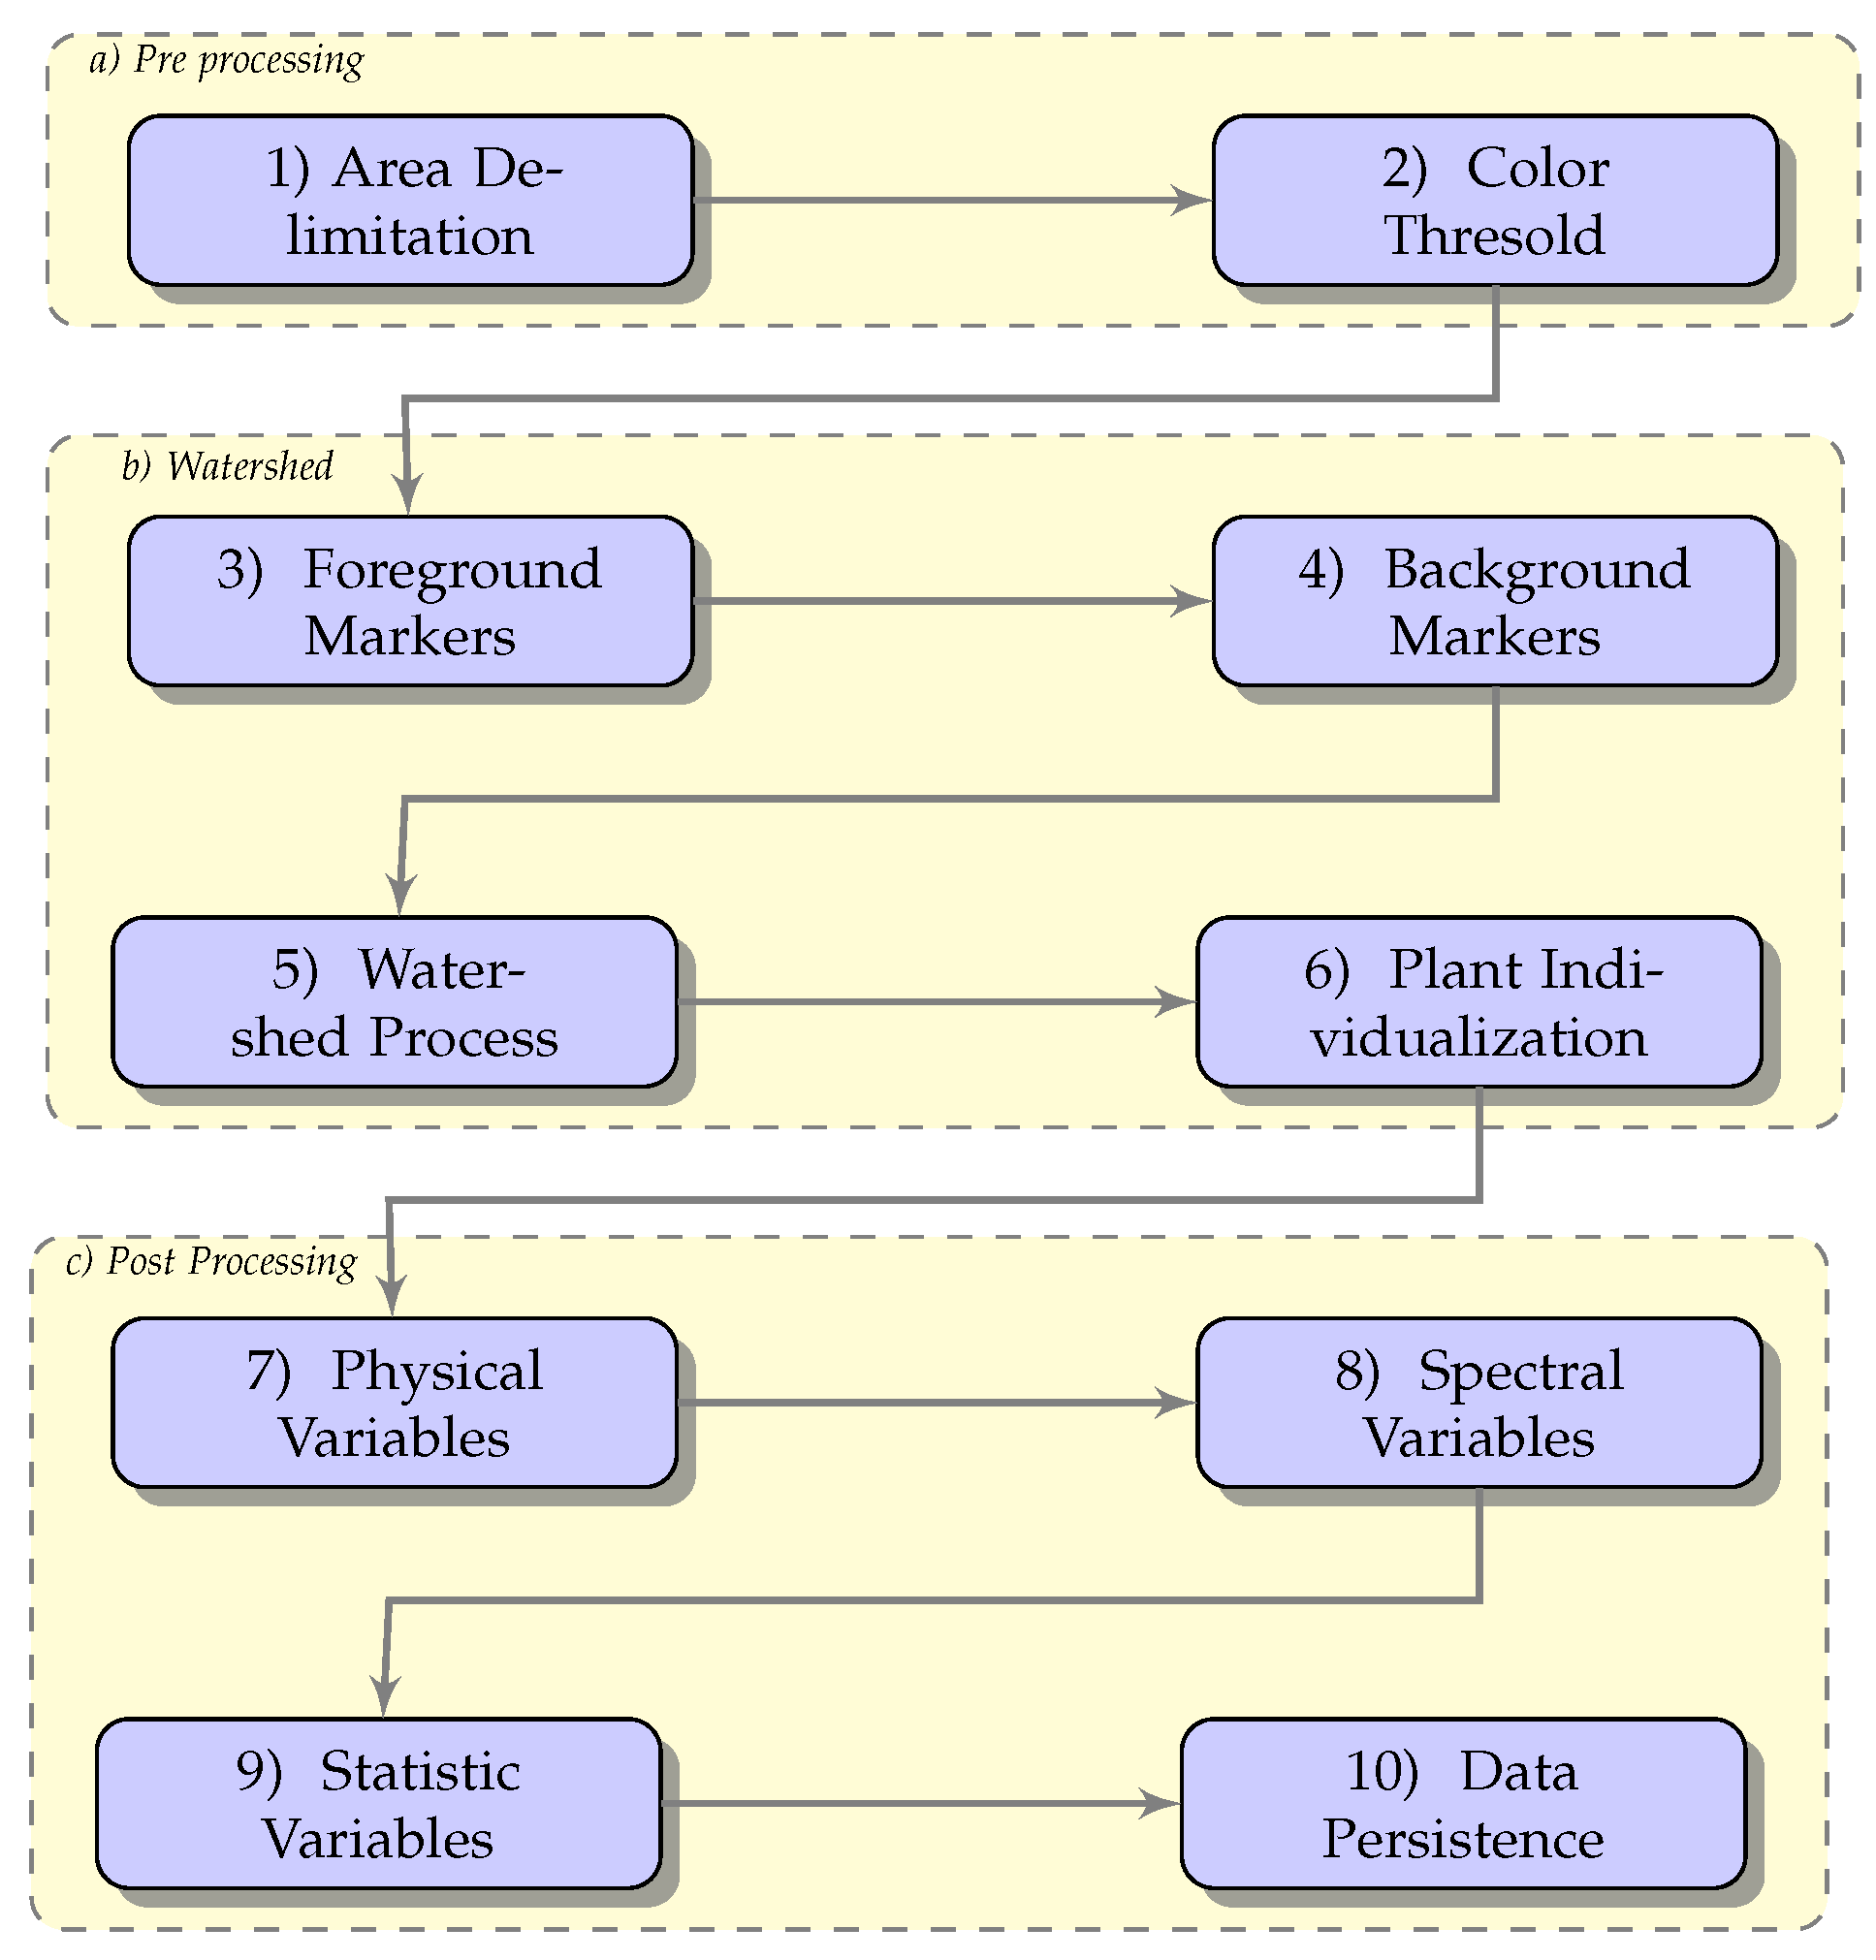
To identify each single coffee tree, a watershed method based on the foreground markers was used. This algorithm separates and defines the edges between two elements of an image. It consists of simulating the watershed basins, which are filled based on local minimum levels until a limit between two or more watersheds is defined [
24]. In
Figure 8, a representation of this process is described.
In the preprocessing stage, the target coffee field is delimited and segmented. This research carries out this process through a previously delimited polygonal mask. In step two, the background or the image floor is removed by a color threshold based on the LAB color space or by using 3 groups with the K-means algorithm. Both background removal methods were tested and the color threshold prevailed.
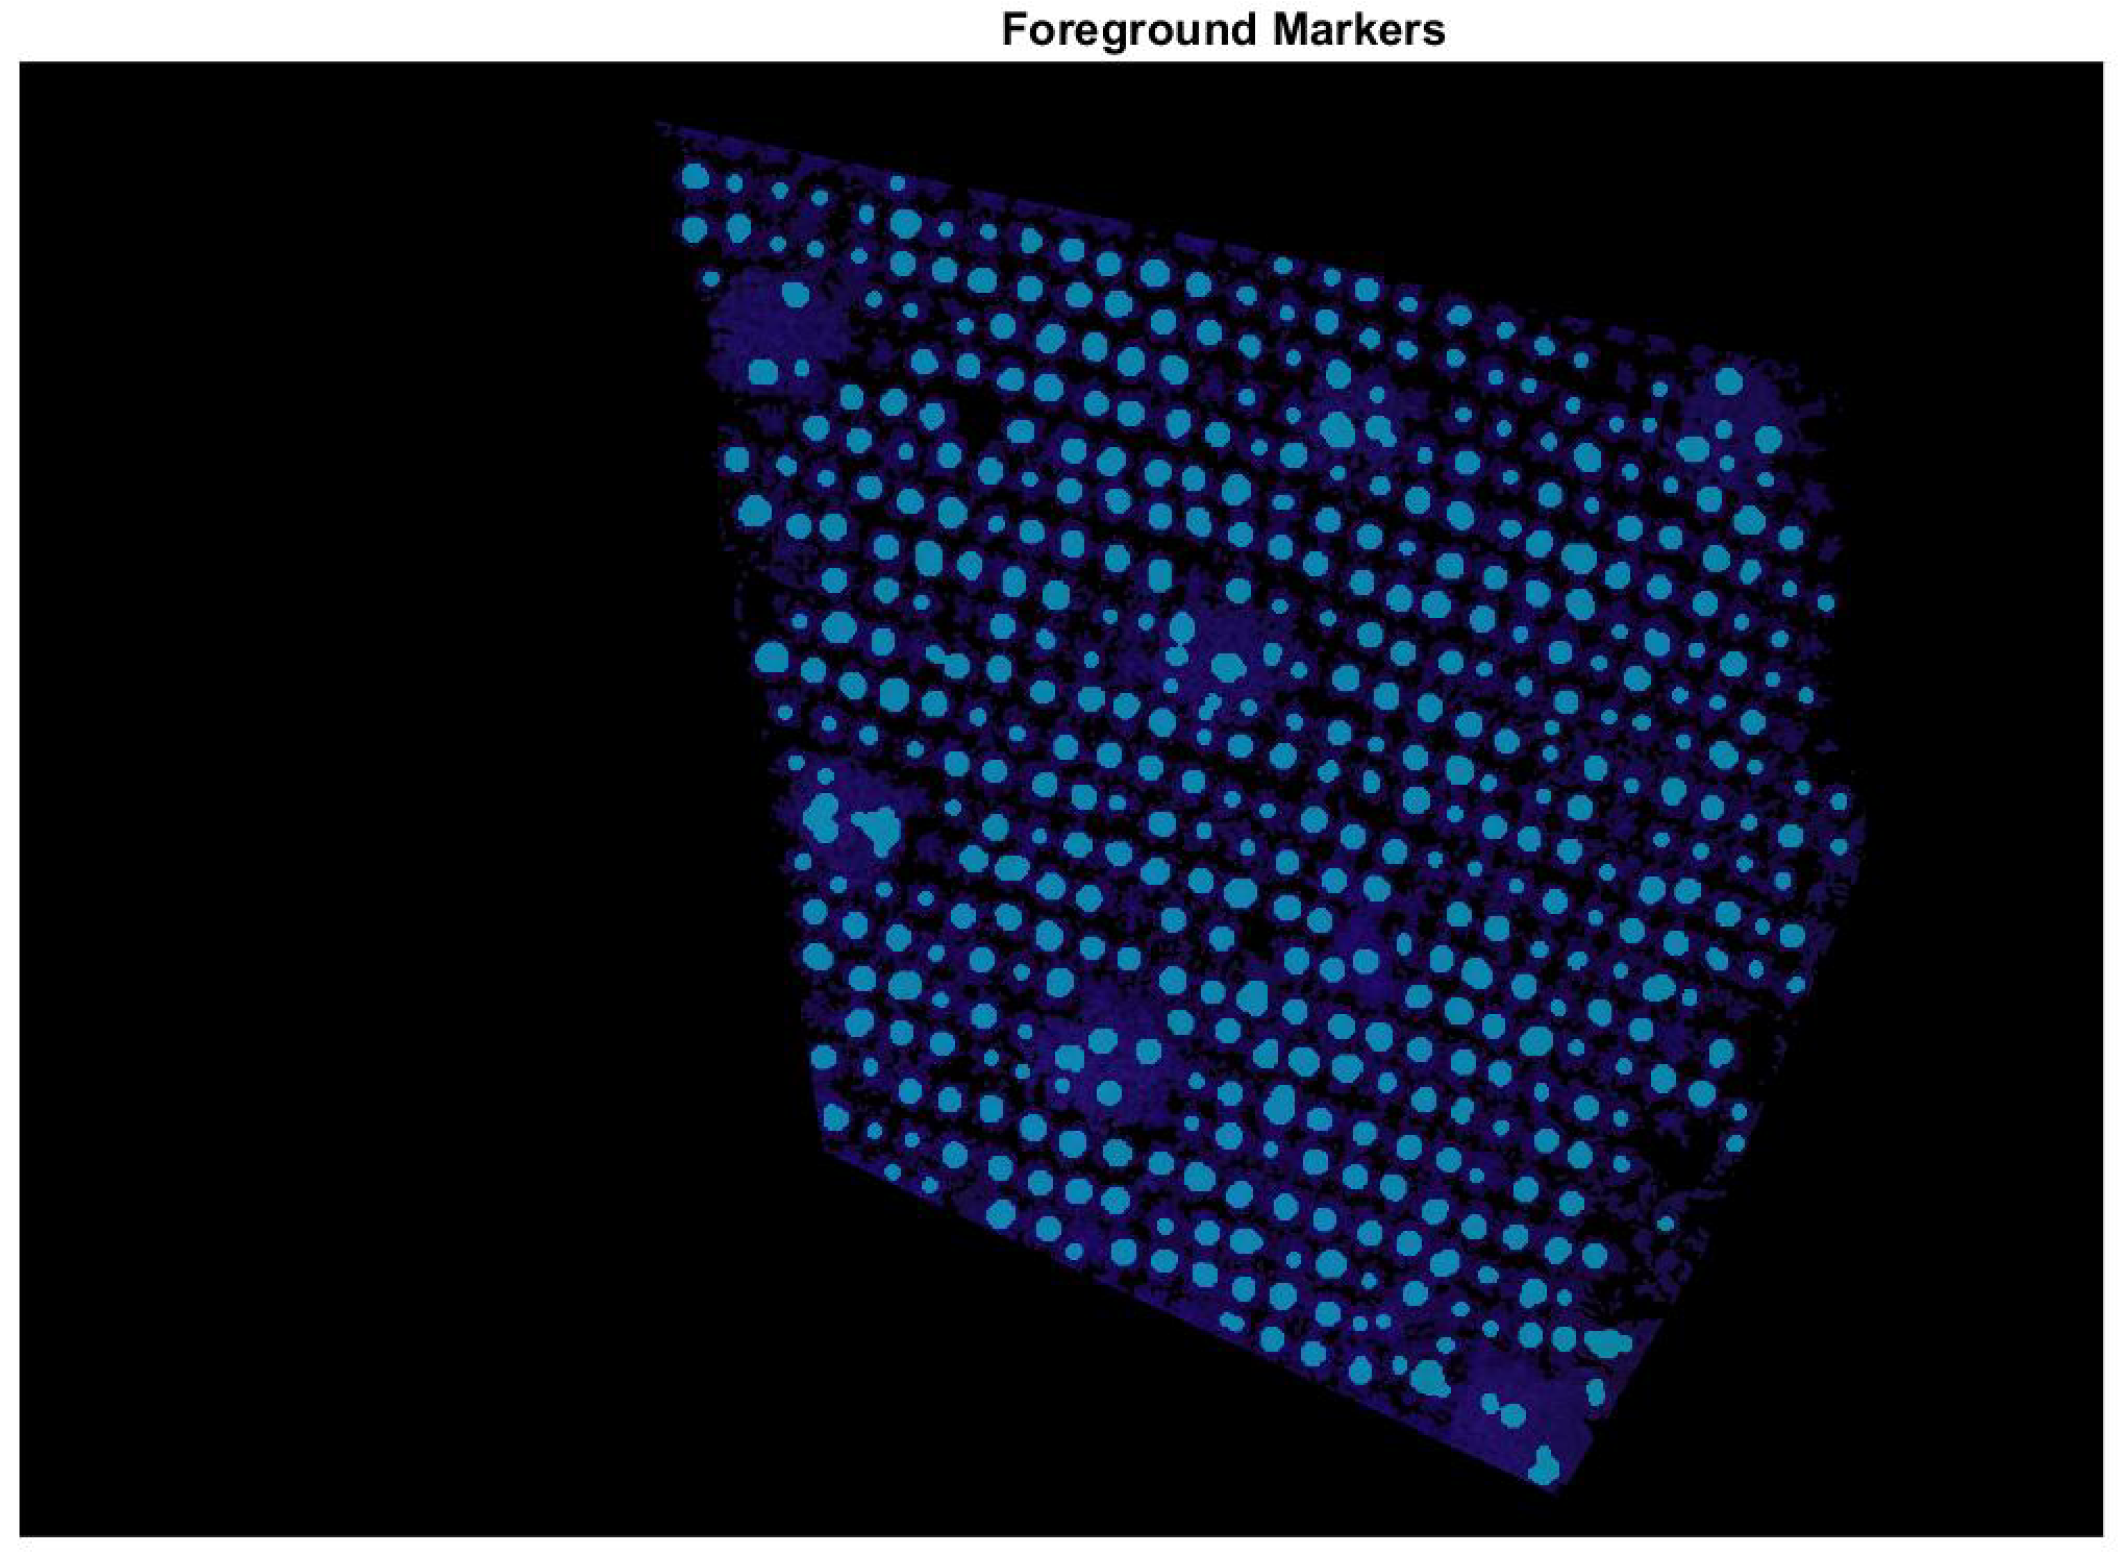
One of the ways to apply the Watershed algorithm is to use the foreground and background markers [
25]. This work carried out multiple tests to find the correct configuration of the foreground markers, which led to a successive application of morphological operations to define them. The final result of the foreground marker definition is superimposed in blue in
Figure 9.
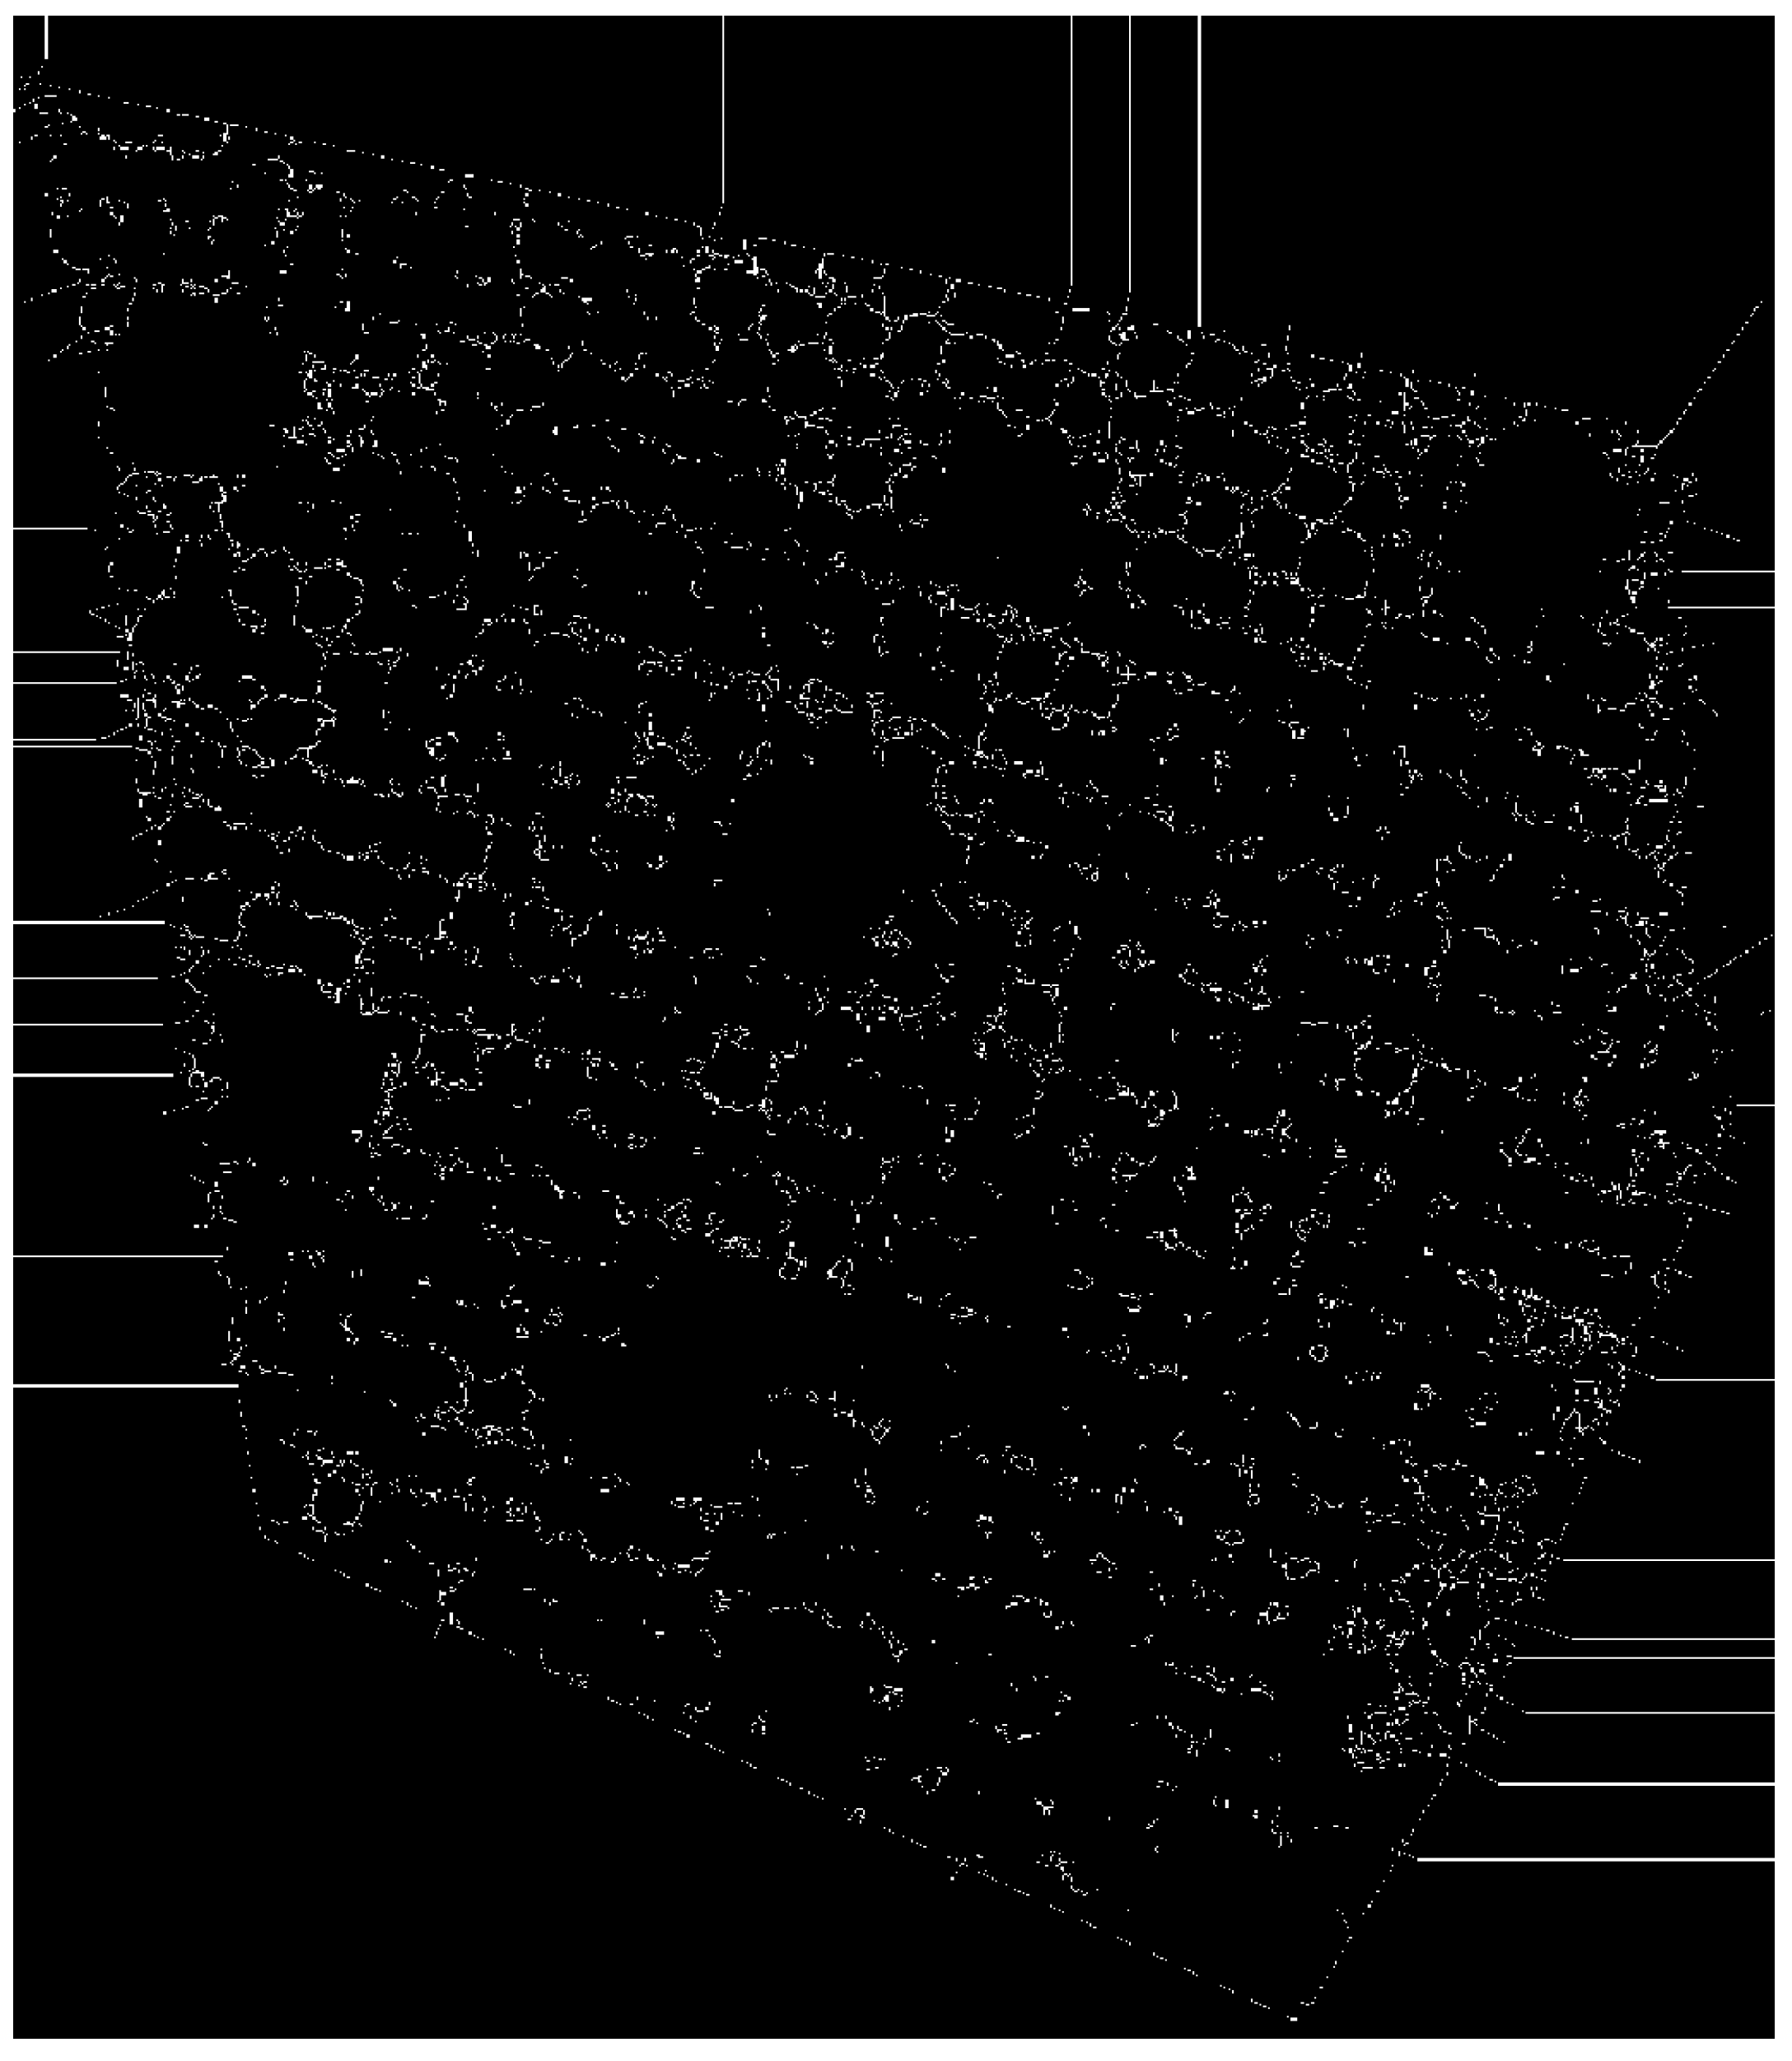
The background markers define what is not a tree. This process allows the algorithm to establish the limits based on a magnitude gradient. The background markers are shown in
Figure 10.
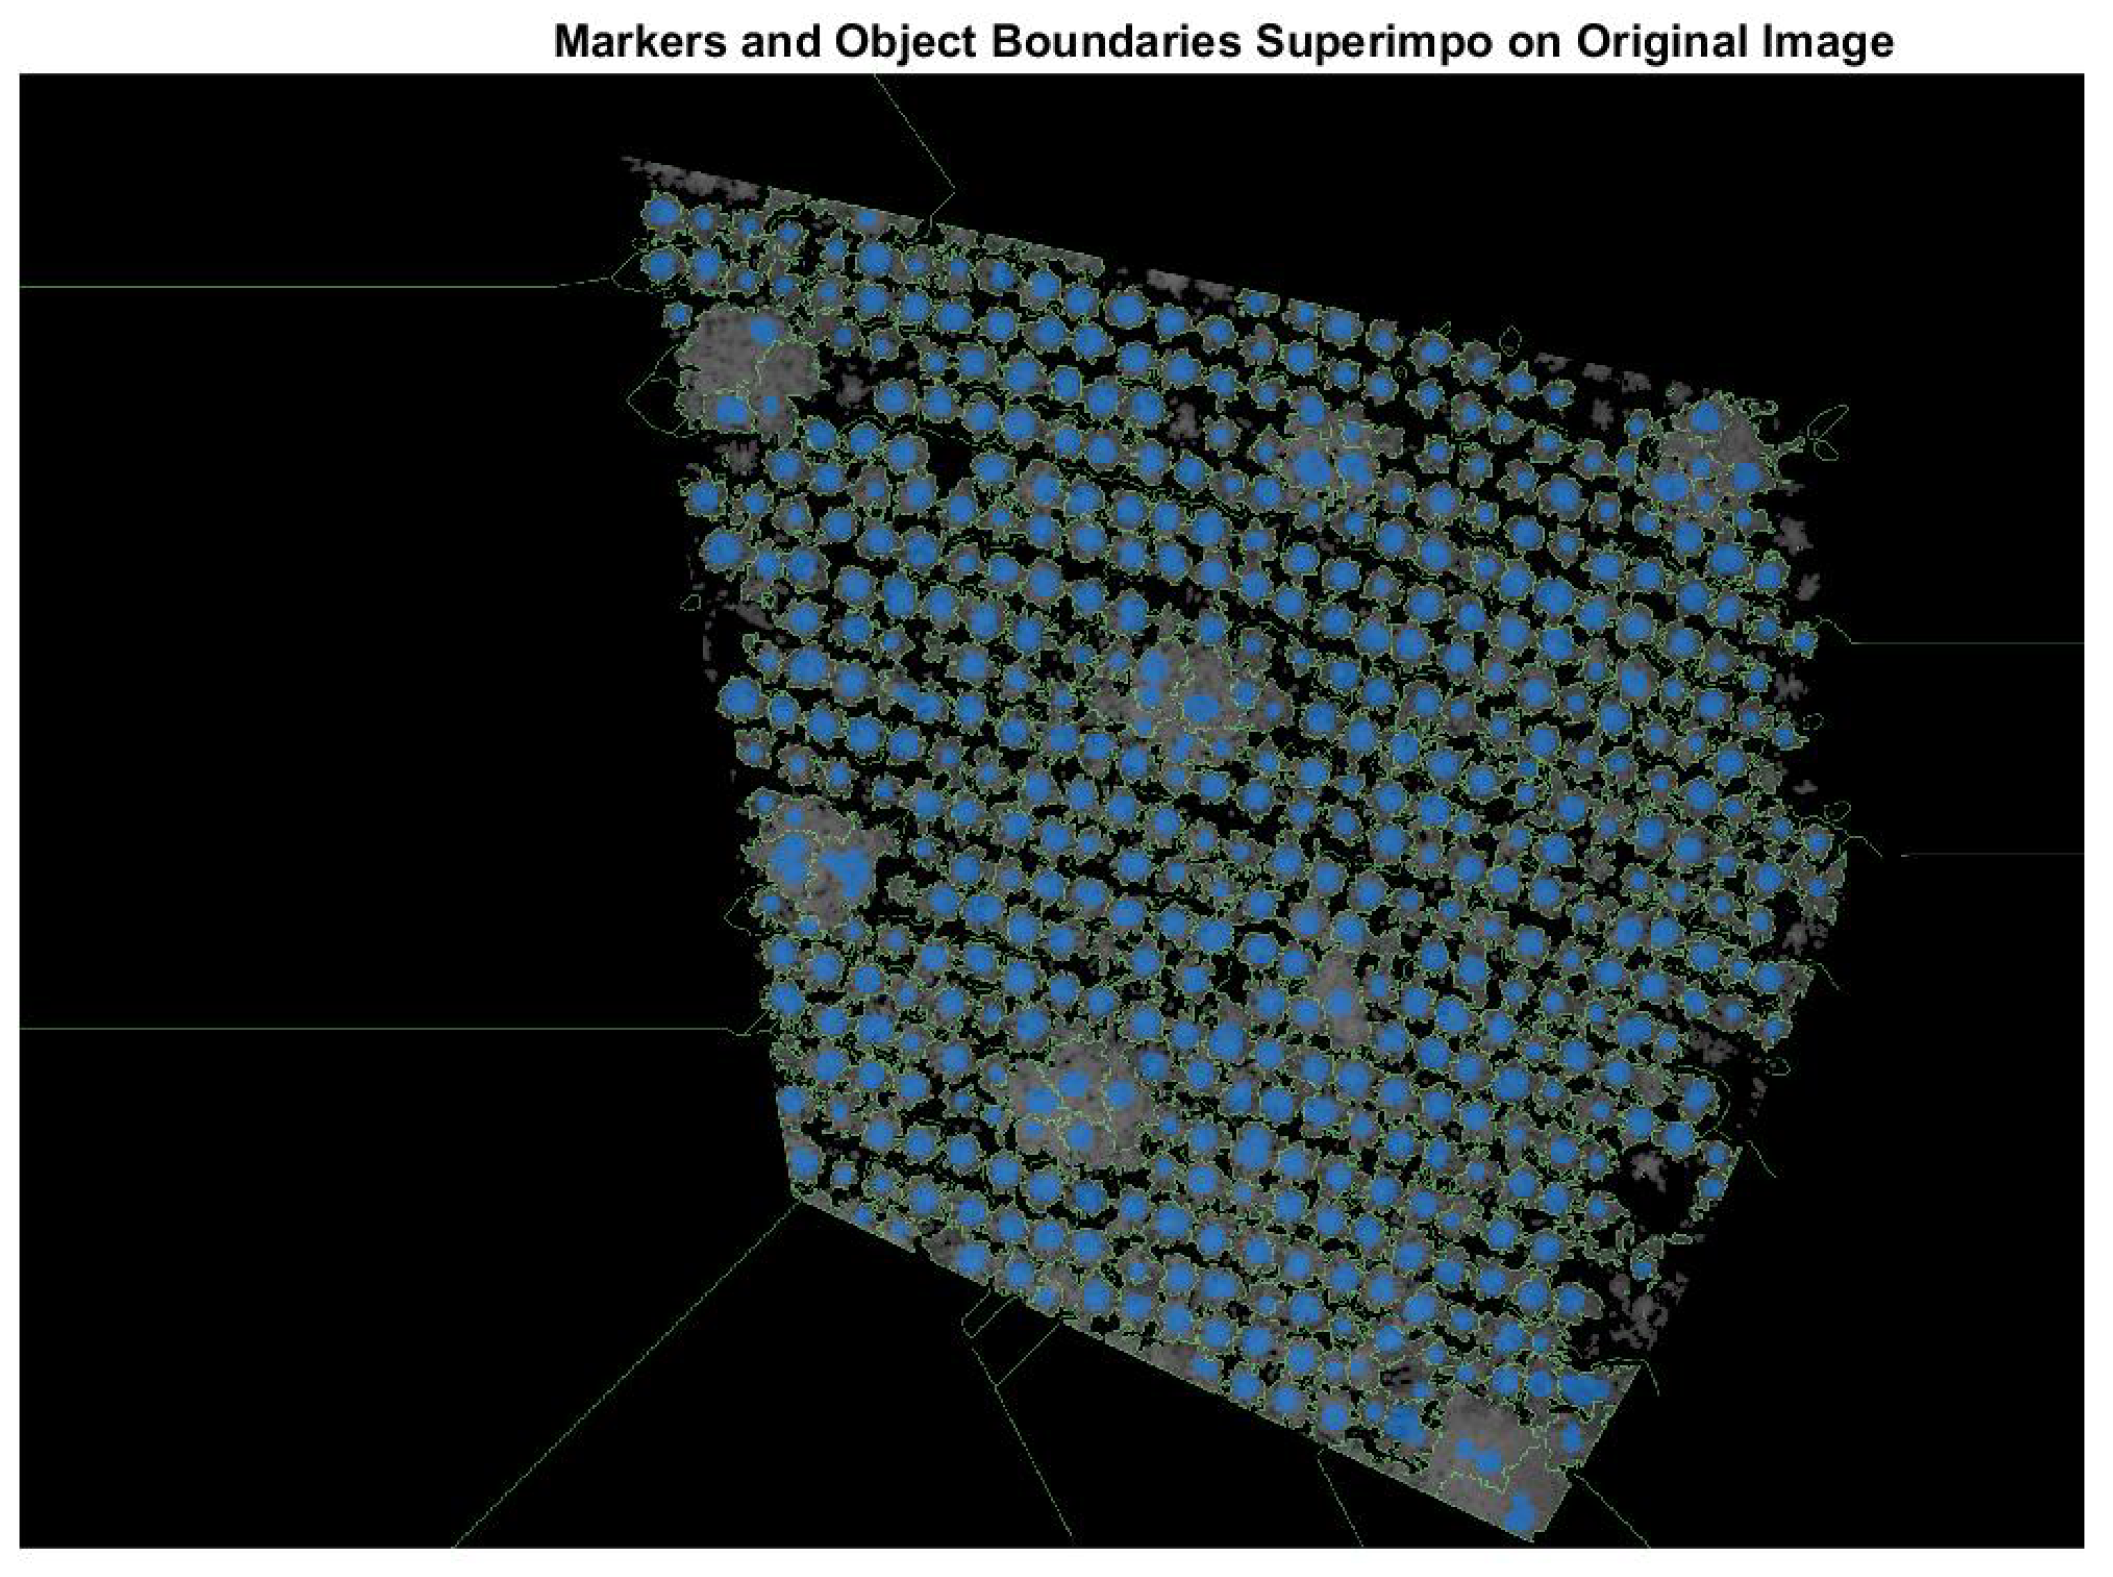
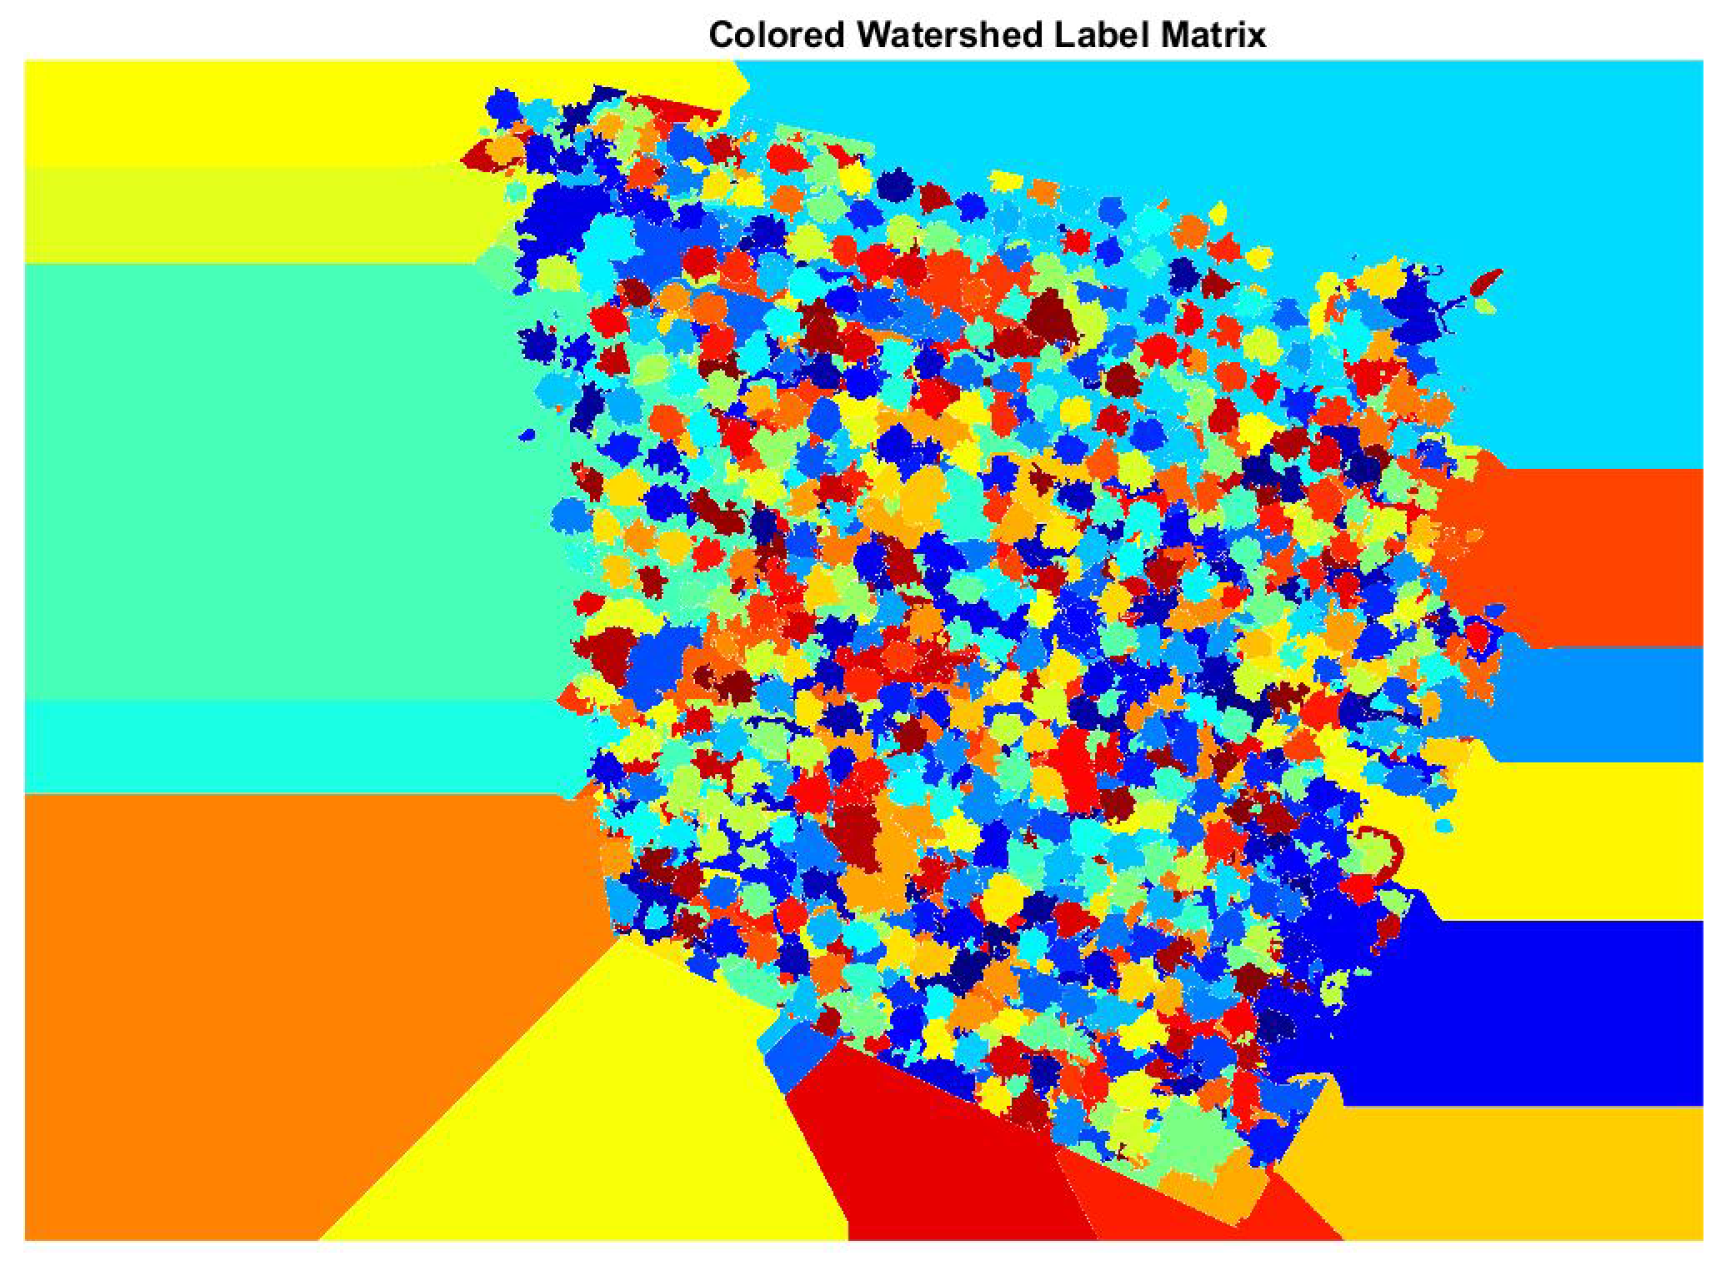
The marker-based watershed algorithm resulted in
Figure 11. In this case, the edges of the limits of each individual tree were defined, accompanied by each foreground marker. These results were highlighted by applying a color map to each label to observe the segmentation quality, as in
Figure 12.
Once the individualization of the trees was complete, the next step was the information extraction process. This process begins with the noise analysis to review the size of each tree by previously determined values of the lower and higher limits. The outline of the mask of
Figure 13 is processed by changing the (x, y) points in their pairs (lat, long). This process is focused on calculating the WGS84 coordinates using the georeferenced information through a Python language process. With this information it is possible to obtain physical measurements of the coffee trees.
The separate tree interest bands were defined by applying the figure mask
Figure 13 to the original image. This process allows us to calculate statistical variables, such as the average of each band and their variance and the vegetation indices of
Table 1, which were calculated by going over and operating each pixel of the image of the three bands of the individual tree. Each tree was processed so that it was possible to obtain its outline as geographical coordinates WGS84. With this GEOJson format contour, the area in square meters can be obtained using the python “area” package.
In short, this whole process is necessary to obtain the spectral and physical descriptors used to train and test the prediction models. The variables received were the area, height, and vegetation indices and the statistical variables of the spectral bands.
2.5. Physical Descriptors
The physical descriptors of the coffee trees are characteristic measures that can be height or area. This work uses the georeferenced orthophoto and the DSM to generate this information. The tree height is measured by the subtracting of the minimum value of the maximum calculated by the geographical coordinates in the DSM. This work built a method that iterates through tree image pixels. This method shows the heights present in the DSM every 10 pixels in the individualized tree image. The pixel jump values were tested incrementally to increase speed without losing any precision; it is not necessary to transform all of the pixels of the tree mask. The tree image is dilated with a radius of 20 to include part of the ground. Finally, all the points are compared to extract the maximum and the minimum, and then the difference. The volume, lateral area, and LAI values were calculated by taking into account the work of Favarin et al. [
26]; these values were obtained from Equations (
1), (
3) and (
4), respectively:
The
and height (
h) are previously known image values. The
value corresponds to the leaf area index obtained from the lateral area based on the work of Favarin et al. [
26], who successfully proposed a linear approximation to this expected value.
2.6. Spectral Descriptors
The spectral descriptors correspond to those obtained through aerial images, which will be the input for the prediction models. These were obtained considering the segmentation of
Section 2.4. The vegetation indices were processed for each tree, obtaining medium, maximum, and minimum values.
Normally, the spectral reflectance of a tree changes according to the wavelength and its physiological state [
22]. In this work, the value of the vegetation indices and the maximum, minimum, and average values of the red bands, green, NIR, and histogram were collected.
By using vegetation indices, different physical conditions can be inferred. Trees mostly reflect the NIR band and absorb the red band when they are in good condition, representing the physiological state. This condition is shown using the normalized difference vegetation index NDVI [
12]. Other important indices are the NDWI, which can provide information on tree moisture, or the visible excess of green band EXG, which can be used for tree segmentation, as well as for improved NDVI versions, such as ENDVI, which is also used to minimize the effect of the ground in the final result [
27].
Table 1 presents the summary of the vegetation indices involved in this work. This research was based on the vegetation indices of the results obtained by Rosas et al. [
21], who carried out spectrometric analysis with the Survey3W camera. All the vegetation indices of the
Table 1 are available using the RGN bands of the Survey3 camera.
Table 1.
Vegetation indices.
Table 1.
Vegetation indices.
| Index | Form | Description | Ref |
|---|
| CRI | | Coffee Ripeness Index | [21] |
| GNDVI | | Green Normalized Difference Vegetation Index | [21] |
| MCARI1 | | Modified Chlorophyll Absorption in Reflectance Index 1 | [28] |
| MTVI1 | | Modified Triangular Vegetation Index 1 | [28] |
| NGRDI | | Normalized Green–Red Difference Index | [29] |
| NDVI | | Normalized Difference Vegetation Index | [21] |
| RVI | | Ratio Vegetation Index | [21] |
| NRVI | | Normalized Ratio Vegetation Index | [21] |
2.7. Prediction Models
The prediction models can be defined as a representation of the relationship between two or more variables [
30]. The main objective of this work is to predict the crop yield at an early stage of the phenological cycle. Since the amount of data is limited, it is impossible to use neural network models, so a simple regression model is proposed for this work.
A cross-validation methodology was carried out to obtain an average result of the
metric that measures how good an algorithm is in predicting a variable [
31]. This methodology divides the dataset into data groups, performs a cross-validation of all groups and gives each iteration a value of
. The final result of the process corresponds to the average of all the values.
The tested models are the support vector regression or SVR with linear kernel, multiple and simple linear regression, random forest, and decision trees. All the models were implemented using the Scikit-learn library [
30,
32]. Cross-validation is a process where the number of iterations to be performed on the data is defined. In this case, a value of fourth data subsets was defined and each of the models was executed with their default settings.
3. Analysis and Results
This section analyzes the results obtained by reviewing the variables collected through graphs and correlations. The results obtained by the prediction models were exposed.
3.1. Predictors Selection
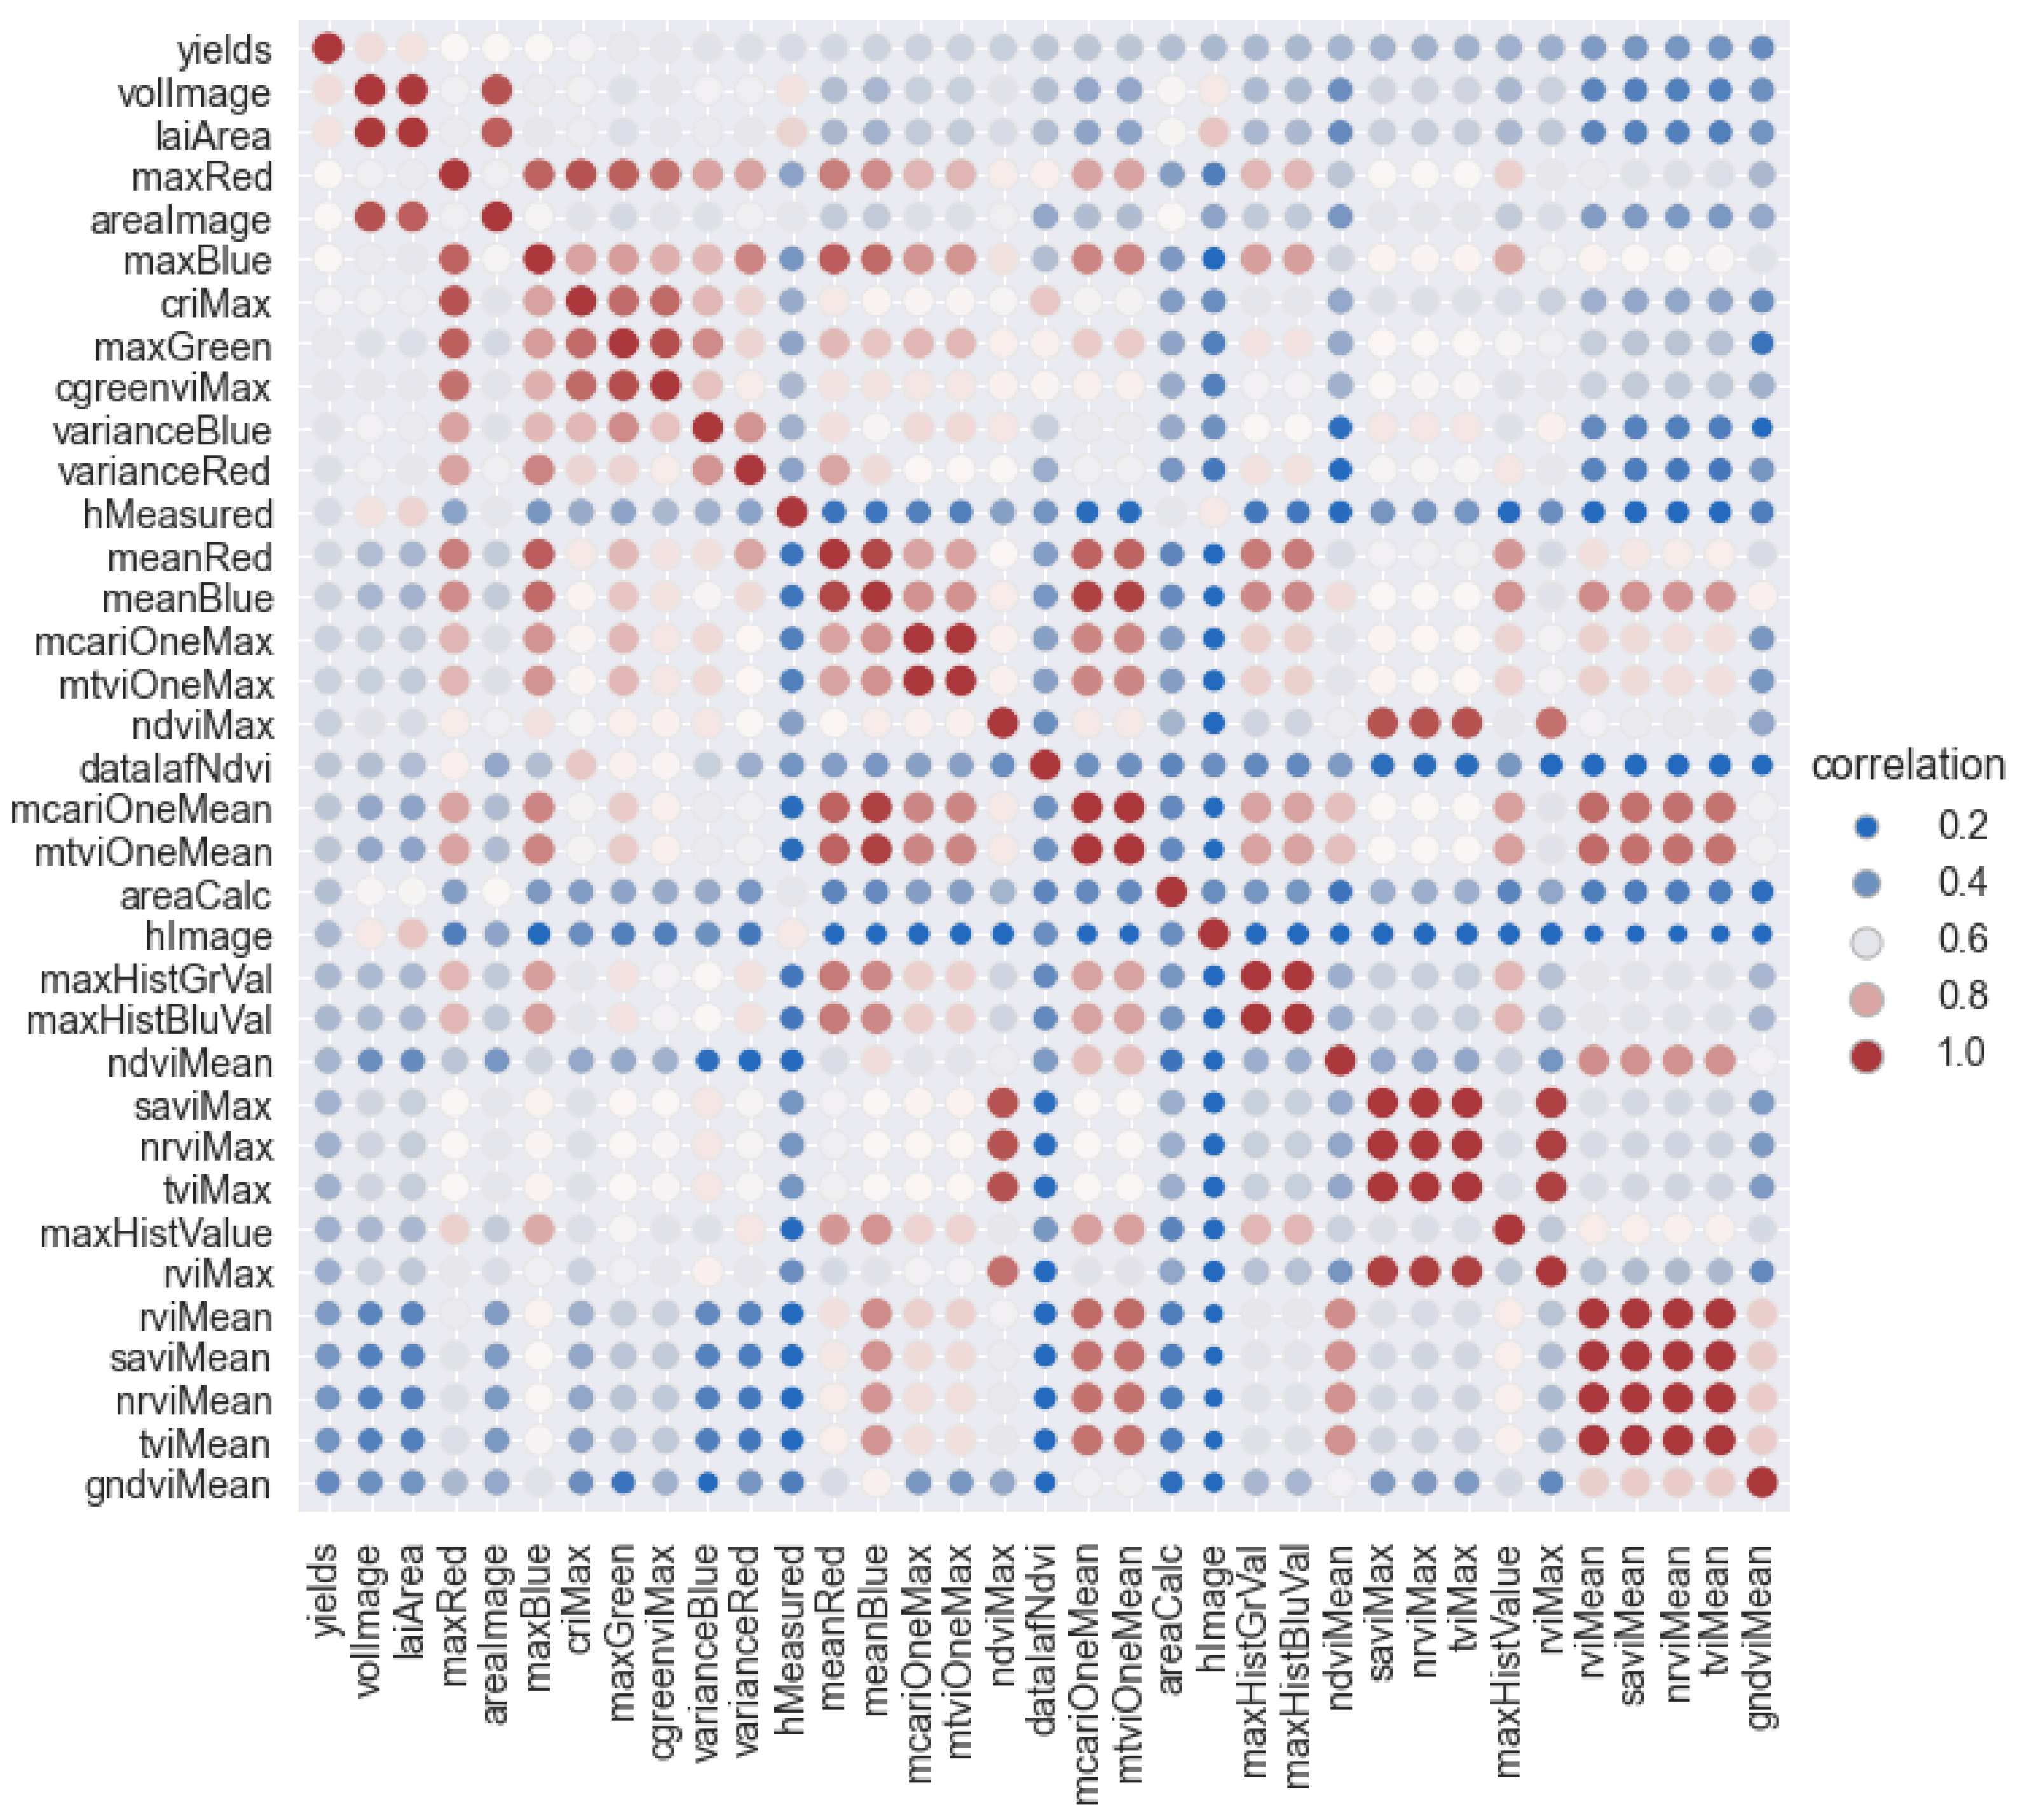
With all the information collected, this research carried out a data cleaning, checking the ranges and assuring that all the manual sampling was complete. Initially, taking into account the correlation analysis of Pearson, the behavior of the available characteristics was verified in relation to the crop yield obtained manually in
Section 2.2, representing the most relevant results in
Figure 14, this analysis allows evaluating the relationship between the predictors and the crop yield [
33].
The graph also shows a strong relationship between the height measure (hMeasured) and the calculated height (hImage) with the DSM since the correlation index was 75%, which validates the tree height calculation process based on the image information.
The tree volume values, as volImage calculated from the contour areas and heights, such as in Equation (
1), gave a correlation of 76%, as well as the lateral area that was calculated with (
3) gave 77% and an expected value according to [
9] who in his work shows the relationship between physical characteristics, such as LAI which is strongly related to the lateral area and to the volume [
26]. Regarding the vegetation indices, this research found different behavior. The NDVIMean had a correlation of 49%, the NDVimin and the NDVimax were −39% and 55%, which shows the importance of the NDVI that, according to [
21], represents the greenness and the vigor of the plant [
34]. The RVI, SAVI, NRVI, and TVI vegetation indices have a correlation of about 45%, so it is essential to take them into account in analyzing crop yield.
This work measured all of these variables at the flowering stage, which represents the state of the trees before the cherries fill out. The other indices with their median, maximum, and minimum values had slightly higher values but were less than 0.5, probably due to their low physiological relationship with crop yield. By including the maximum and minimum values in the analysis of the vegetation indices, it was possible to find that the NDVI had higher correlation values in the average of the maximums.
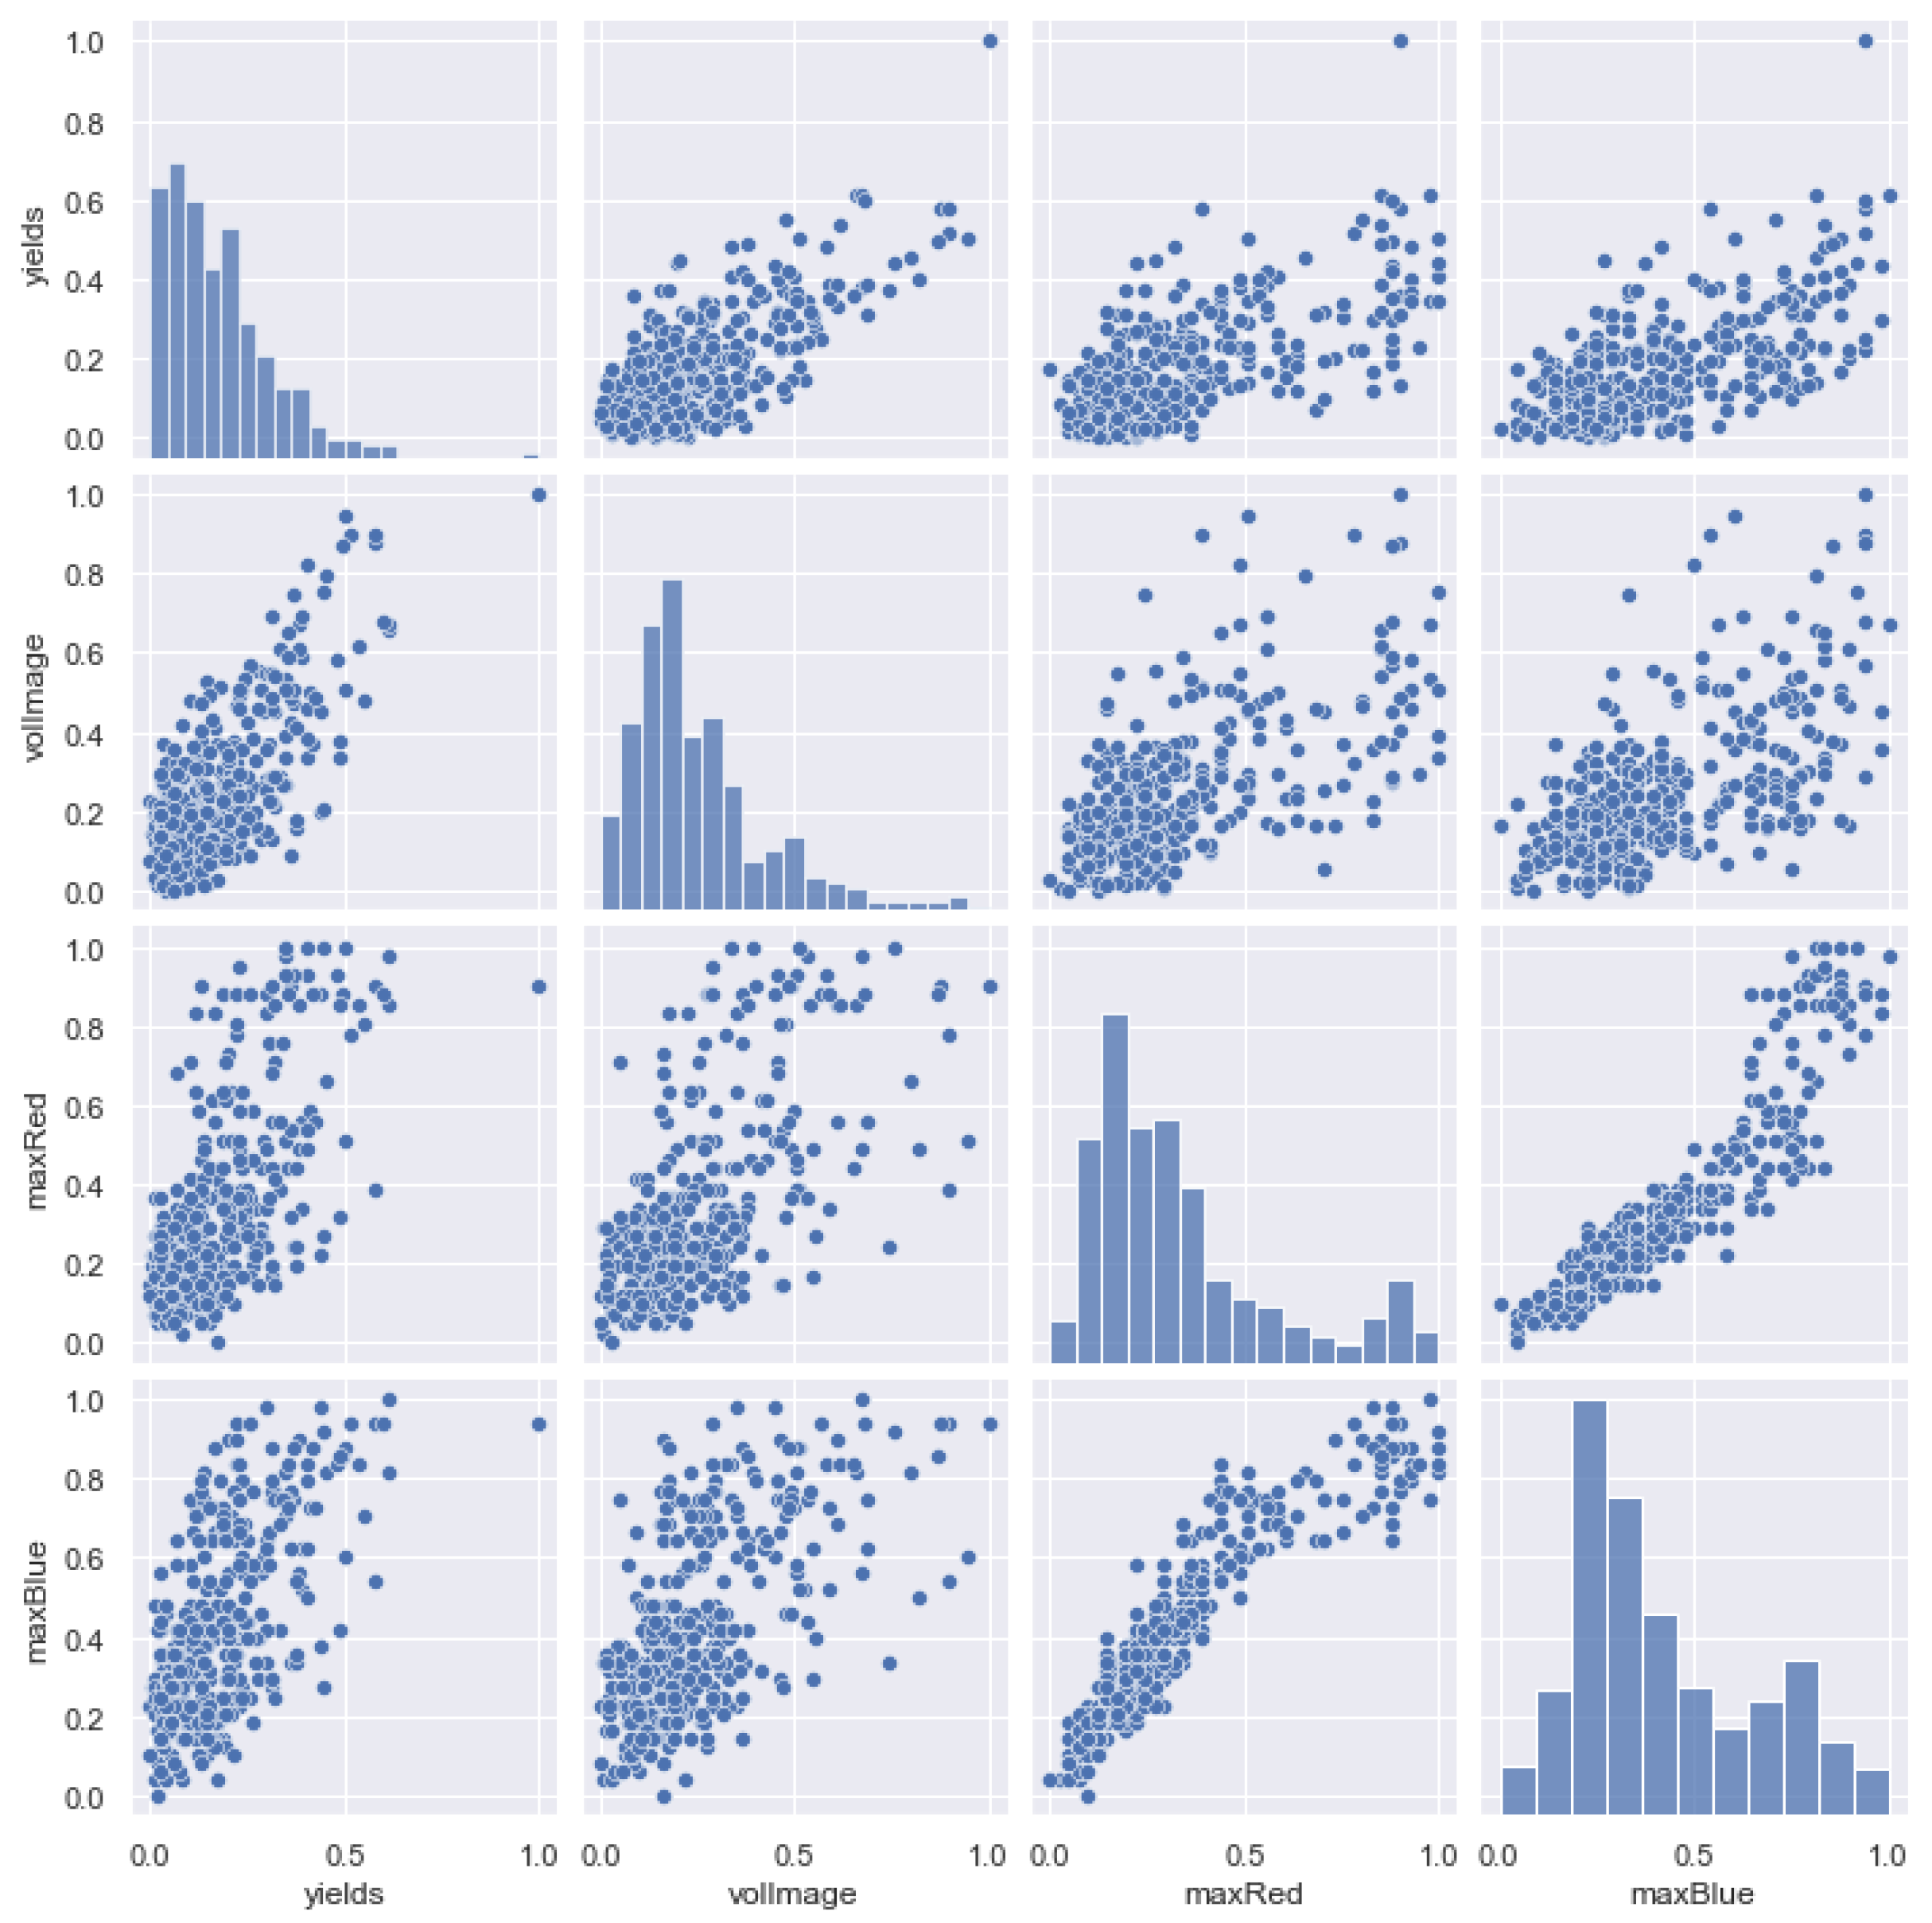
According to these correlations, the predictors were prepared in “dataframes” to carry out the regression models. Some of the variables involved were volume, NDVIMax, maxRed, maxBlue, and criMax.
Figure 15 shows a dispersion diagram with yield, volImage, maxRed, and maxBlue, which shows a linear relationship between all of these variables and the crop yield in column one. The tree volume is correlated 77% with the crop yields and has a lower dispersion compared to the other two variables. Max red and max blue versus yield have similar graphics, but with a lower concentration in their higher values. It is important to note that the crop yield values are concentrated in the first quarter of the standard range of 0 to 1, similar to the tree volume values.
3.2. Performance of Prediction Models
Table 2 presents the variables found by the characteristic selection method which obtained the best determination coefficient
. In this process, some correlated variables, such as criMax with a correlation of 63%, decreased the behavior of the
coefficient, and the variables with a correlation of 45%, such as saviMax, tviMax, and ndviMean, increased the value of
for linear regression.
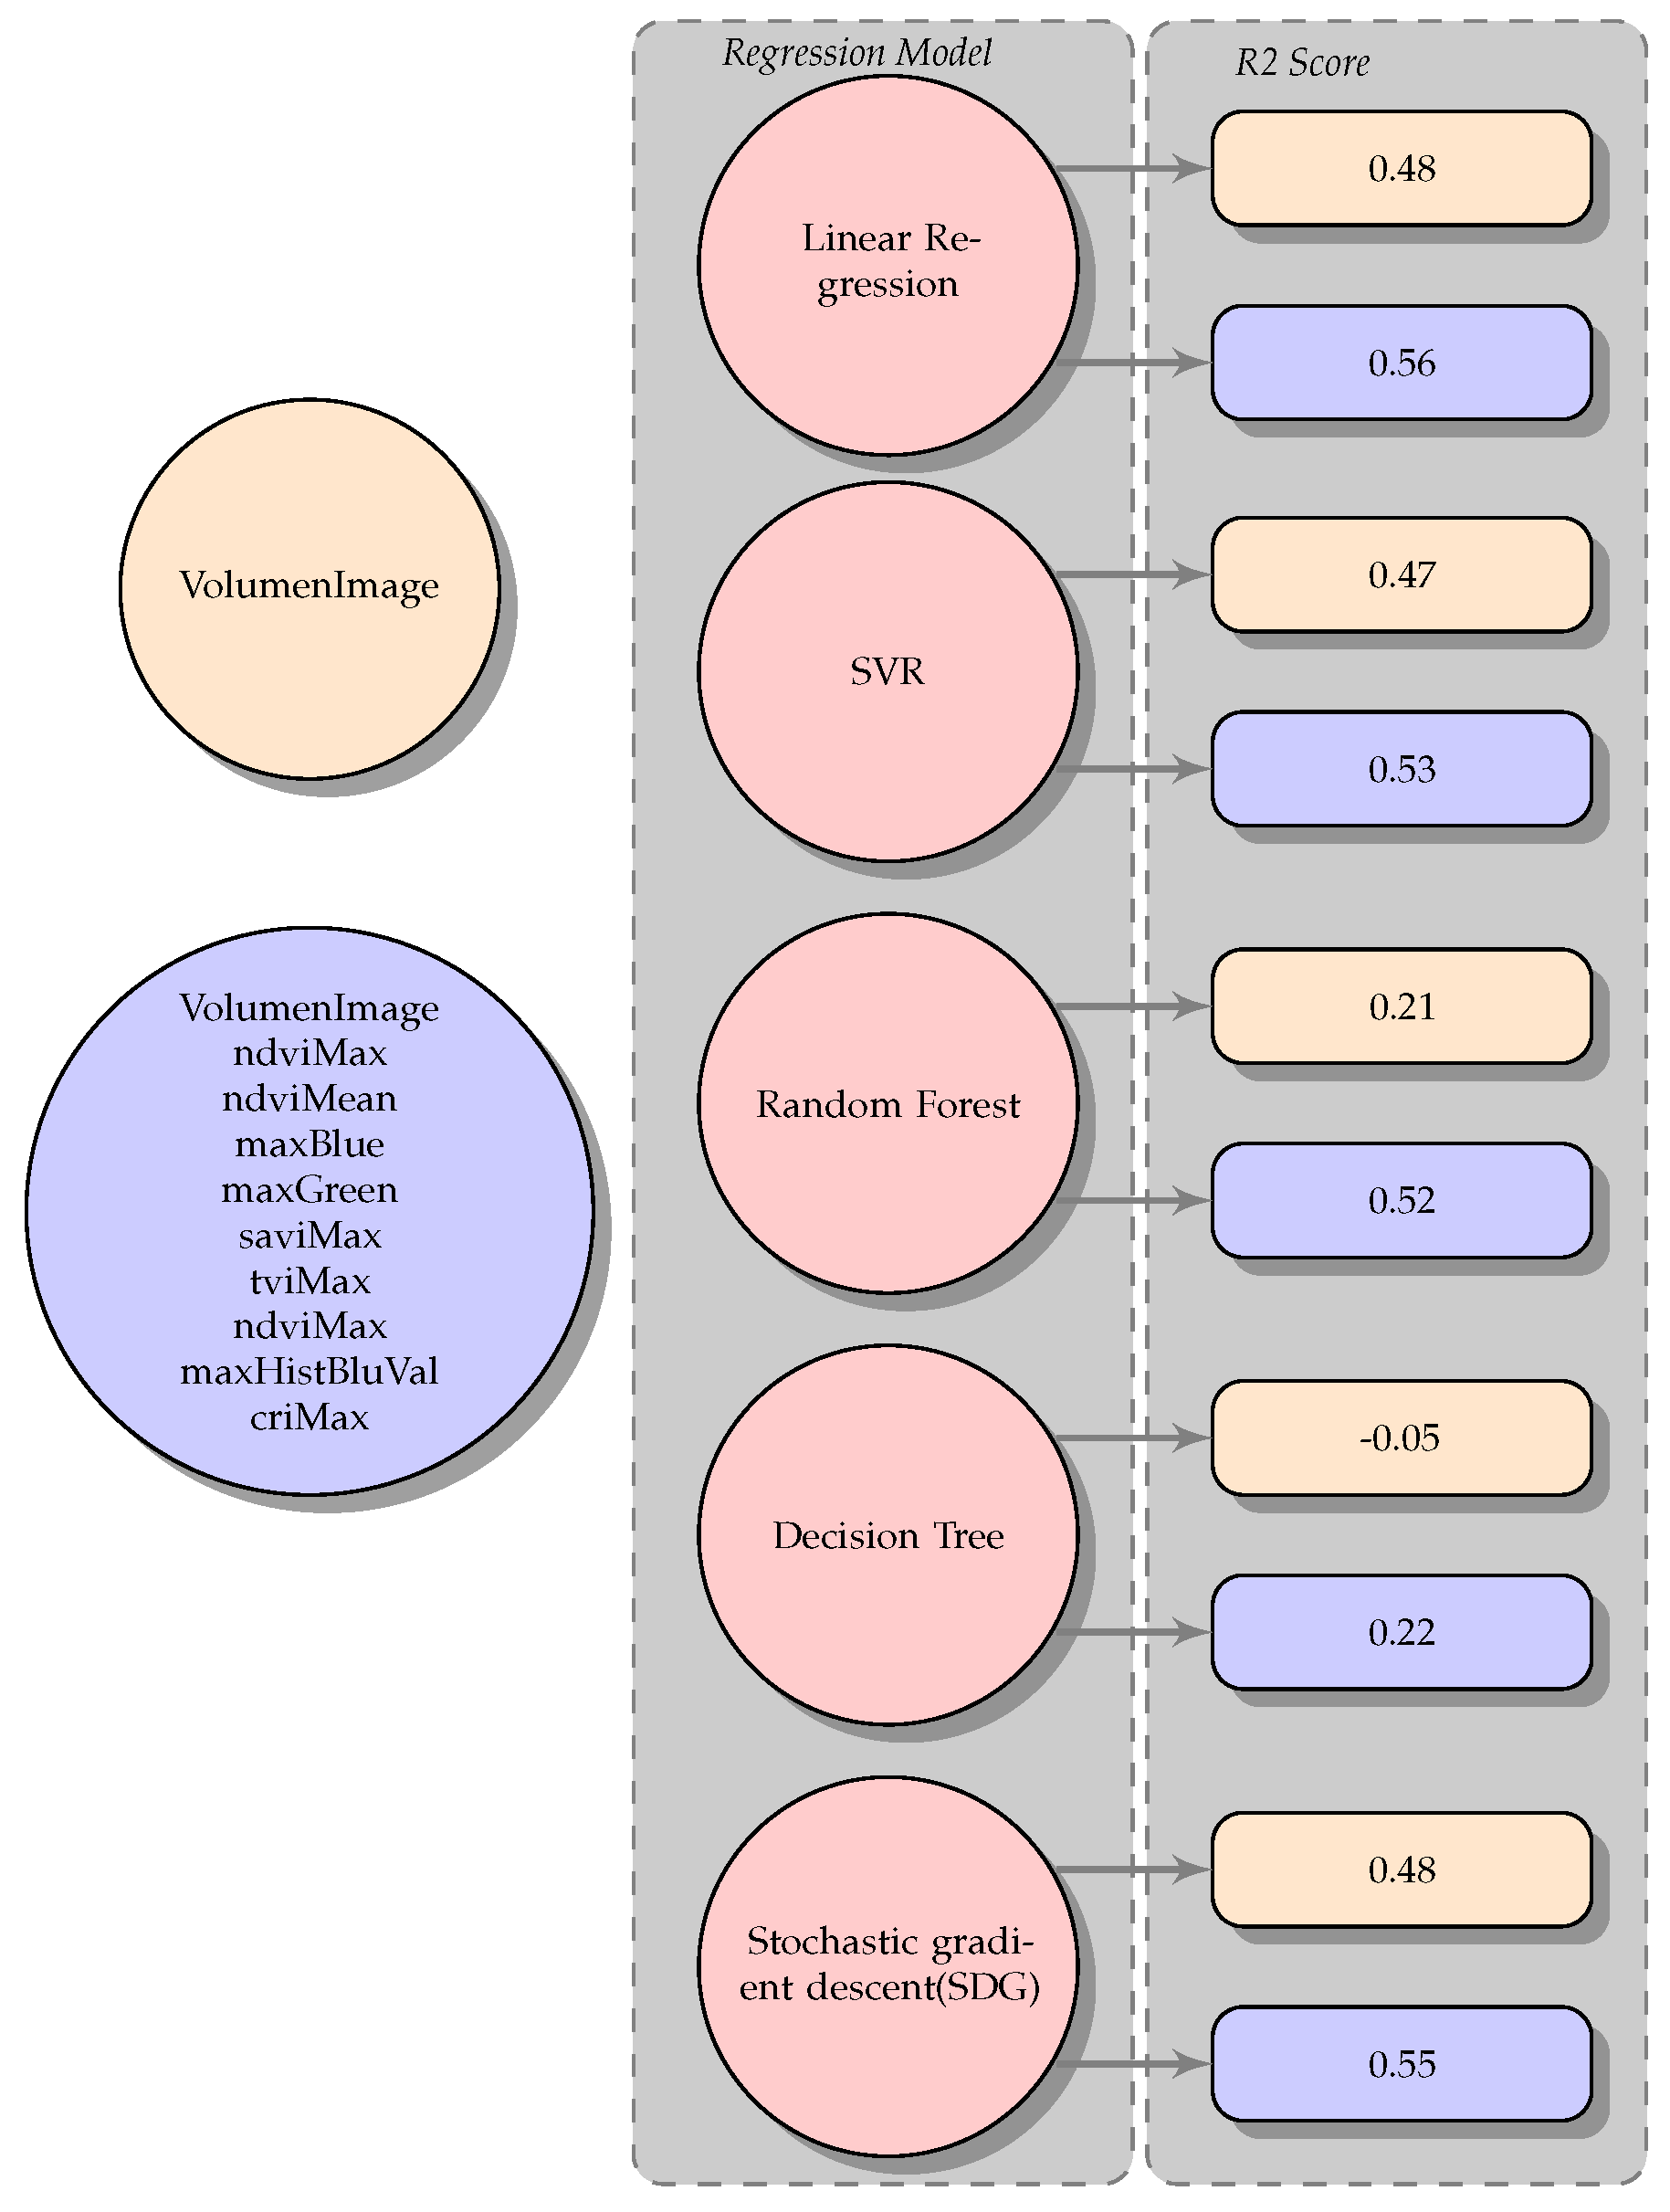
The prediction model application process is based on the SkLearn library using supervised learning regression models. This research selected the regression models based on the data quantity and the linear correlation of
Figure 16.
The model entries were manual crop yield and the predictors of
Table 2. This research tested a simple variable model with volume since it had the highest correlation with the crop yield and multiple models with the following variables to compare the simple and multiple regression models. Several iterations were performed using different configurations with the available regression models; for example, for SVR, the core was changed from RBF to linear. For SDG, the loss function was changed between huber, squared_error, or epsilon_insensitive, showing better results with the squared_error settings. For the other models, this research maintained its default settings.
The models were evaluated by cross-validation with a
score that allowed us to determine the model adjustment percentage of the data. The predictors and the models with the highest
score are shown in
Table 3. The volume role in the regression models can be explained by the relationship between the tree architecture and its age [
10]. In addition, it can be supplemented by a physiological status indicator, such as the NDVI [
13].
The results of
Table 3 show that for this process, the method that showed best results was the linear regression method with 57.6% and a 2361 RMSE, followed by Lasso with a
of 55% and with 2442 RMS. The SVR model with linear kernel obtained 53%. In this model, when the kernel was changed to rbf, the result decreased to 46%. Since the previous models have a linear base, they adjust better to the data better. Still, the difference between Random Forest applied to the tree volume with 22% and multivariate with 52% is an interesting phenomenon.
The least suitable model for the data in this scenario was the decision tree. The random forest model is less affected by dispersion, and its performance is closer to the SVR, higher than this model with the RBF type kernel of 48%. Similar to [
13], in this work, the height and the area are not relevant separately until they become volume. The two component PLSR model has a coefficient of 0.54 and a 2462 RMSE. The foregoing results define the linear behavior of the selected variables as related to crop yields.
During the cross-validation process, this research tested 10 regression models, and in all cases, the multiple regression model had better results than simple regression.
Table 4 compares the yield obtained by manual yield models. These values were randomly calculated by iterating the division of the training and test values The original crop yield was presented in
Section 2.2. The objective of this proposal was to evaluate the relevance of the coffee yield predictors, showing that the predictor behavior is linear, supported by regression models. In addition, when the predictors are combined, they have behave better when making the predictions.
These results validate the approach proposed in this work; however, validations with more data need to be carried out to make the process conclusive.
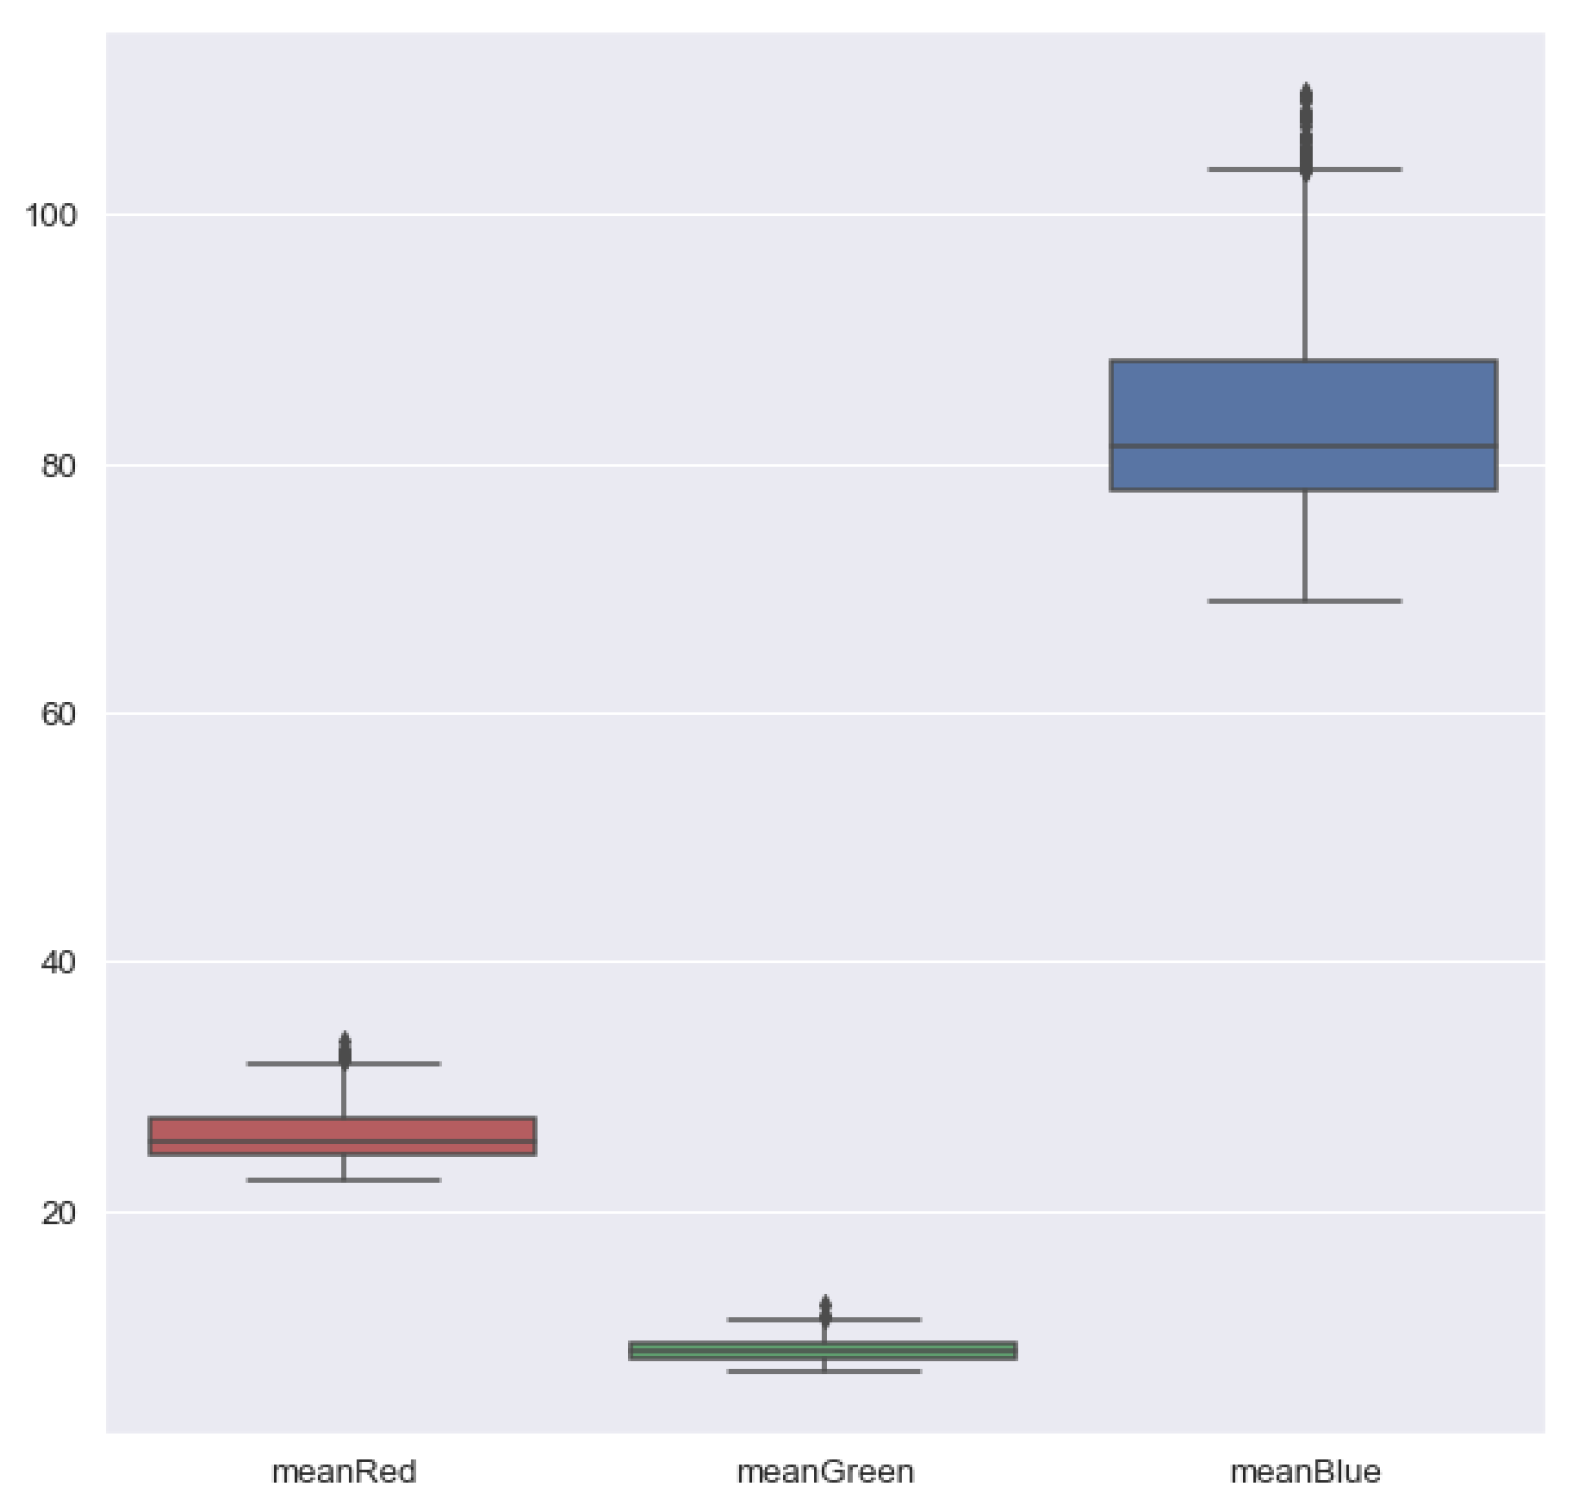
Figure 17 shows the behavior of the spectral bands as presented by Rosas et al. [
21] on the spectral reflectance in plants. This result validates the radiometric correction and shows that the camera reflectance agrees with what was expected, since for the plants, the NIR band has the lowest absorption and the greatest reflectivity [
21].
4. Discussion
Coffee cultivation is extremely important for the Colombian economy. To ensure that these crops remain economically profitable, new cultivation techniques need to be adopted to improve the current processes. Several models are dedicated to crop yield estimation through climatic variables, flowering records, and soil factors, among others [
4,
5,
6,
35]. This study is oriented towards early prediction of coffee crop yields by using only multi-spectral image data obtained using low-cost tools. Multi-spectral images obtained from UAVs allow a high precision, focused analysis which, for this research, led to precise, automatic individualization of coffee trees and generated physical and spectral descriptors with the potential to predict crop yields [
28,
36,
37].
The vegetation indices have the potential to predict yield in other crops. In this sense, the work of Douglas et al. [
27]. involves the
, NDWI, and NDVI indices based on MODIS data to use regression models with a
of 0.70, 0.69, and 0.69, respectively, for soybeans. It also shows that in corn (maize), the
obtains a
of 0.73. The importance of using multi-spectral images in calculating yield in different crops is highlighted.
This research focused on early yield prediction by obtaining images at the phenological flowering stage. The
determination coefficient of 0.54 presented in
Table 3 shows a clear potential for calculating yield tree by tree as used by Barbosa et al. [
13] but with physical variables and RGB images.
One of the limitations of this research obtaining crop yield data for model training. The manual data collection process is very expensive, both in terms of time and money. The multispectral image approach to facilitate manual collection of crop yield data is one of the contributions of this research. The plant segmentation process of this research defined a sample collection method guided by a web-based application that allows identifying the plants to be sampled.
In future perspectives, this application can be complemented by observation and surveillance. Hyperspectral cameras enable the capturing of many more bands than multi-spectral cameras. However, the multispectral cameras are more accessible for small and medium producers. This research studied arabica coffee varieties, the dominant varieties grown in Colombia. It would be interesting to apply this methodology to other varieties, such as Robusta. This research analyzes the data by assuming a linear relationship between crop yield data and linear predictors. However, additional analysis looking for non-linear behaviors and testing the method on different varieties of coffee of other ages would be desirable.


