Communication

A Step-Wise Workflow for SAR Remote Sensing of Perennial Heaving Mound/Crater on the Yamal Peninsula, Western Siberia

by
Valery Bondur
1,*,
Tumen Chimitdorzhiev
1,2 and
Aleksey Dmitriev
1,2
1
AEROCOSMOS Research Institute for Aerospace Monitoring, 105064 Moscow, Russia
2
Institute of Physical Materials Science of SB RAS, Optical-Microwave Remote Sensing Department, 670047 Ulan-Ude, Russia
*
Author to whom correspondence should be addressed.
Remote Sens. 2023, 15(1), 281; https://doi.org/10.3390/rs15010281
Submission received: 7 December 2022 / Revised: 26 December 2022 / Accepted: 31 December 2022 / Published: 3 January 2023
(This article belongs to the Special Issue Remote Sensing of Environmental Changes in Cold Regions Ⅱ)

Abstract

:
Climate change in the Arctic region is more significant than in other parts of our planet. One of the manifestations of these changes is crater creation with blowouts of a gas, ice and frozen soil mixture. In this context, dynamics studies of long-term heaving mounds that turn into craters as a result are relevant. A workflow for detecting and assessing anomalous dynamics of heaving mounds in the Arctic regions is proposed. Areas with anomalous increase of ALOS-2 PALSAR-2 synthetic aperture radar (SAR) backscattering intensity are detected in the first stage. These increases take place due to sudden changes in local terrain slopes when the scattering surface (mound slope) turns toward the radar. Radar backscattering intensity also rises due to depolarization at newly formed frost cracks. Validation of the detected anomaly is carried out at the second stage through a comparison of multi-temporal digital elevation models obtained from bistatic radar interferometry TerraSAR-X/TanDEM-X data. At the final stage, the deformations are assessed within the detected areas using differential SAR interferometry (DInSAR) technique by ALOS-2 PALSAR-2 data. The magnitude of the heaving along the line of sight (LOS) was 22–24 cm in the period from January 2019 to January 2020. In general, effectiveness for detecting the perennial heaving mounds and the rate assessment of their increase were demonstrated in the suggested workflow.

1. Introduction

Studies of perennial heaving mounds (PHM) became relevant after the discovery of a huge gas-emission crater in the northern part of western Siberia in 2014 [1,2,3,4,5,6]. The “gas-emission crater” term is quite well-known; it has already been used in [1,3,4,5]. The PHM acronym was used in [2] to describe a perennial frost mound. We will also use this acronym, since the same PHM is used as a test site. Some of those PHMs pose a danger, because the heave provokes powerful blowouts of a mixture of gas, ice, and frozen soils. These blowouts are forming the craters.
High-resolution images from WorldView-1,2, SPOT-5 satellites and unmanned aerial vehicles (UAV) are mainly used [1,2,3,4,5] to study these craters. However, the use of optical satellite images for the Arctic region study involves the selection of data for a cloudless period during the polar day. From this point of view, data of satellite radars with synthetic aperture (synthetic aperture radar—SAR) [6,7,8,9] are more effective for regular monitoring, since these radars are able to collect information regardless of any cloudiness and time of the polar day. So, for example, the authors of this study, earlier in [6], showed the possibility of detecting anomalous deformations of heaving mounds by analyzing changes in the PHM slopes.
The approach proposed in [6] allows us to quantify only changes in the slope angles of the surface of a heaving mound. The magnitude of deformations remains unknown; however, it is not less important, and it is possibly the main component for predicting the probable blowout of a mixture of gas, ice, and soil resulting in the formation of a crater. From this point of view, radar interferometry techniques are an effective tool to compute digital elevation models (DEM) [9,10,11,12,13,14] and to detect displacements of the surface at wavelength scale [7,8,15]. However, the decorrelation of backscattered signals during the time between surveys often leads to intense noise in the interferogram, and it makes the measurements unreliable. For example, this is typical for the Arctic regions due to significant changes in the watering of the surface related to the processes of thawing/freezing of the upper soil layer in summer periods and off-season. This is more typical for the C- and X-bands (5.6 cm and 3 cm wavelengths, respectively), which are used by most of the existing satellite radars. Therefore, the use of the differential SAR interferometry (DInSAR) technique in these bands with non-zero time baselines is not very informative in most cases. DInSAR is more effective in case of L-band (ALOS-1/2 PALSAR-1/2; 24 cm wavelength) use due to smaller time decorrelation in comparison to X- and C-bands. However, the data in L-band is affected by decorrelation and distortions because of ionospheric disturbances [16], apart from low coherence during the season of snow and soil thawing and increased surface watering. It is common for northern latitudes and, together with the seasonal effects listed above, significantly reduces the effectiveness of ALOS-1/2 PALSAR-1/2 interferometric measurements in the Arctic regions. In that context, the data of a bistatic TerraSAR-X/TanDEM-X radar system are less dependent on these factors and can be used for the creation and comparison of multi-temporal DEMs.
Thus, each method for radar data processing (L-band SAR backscattering, L-band DInSAR, and TanDEM-X interferometry) has its own advantages and limitations when it is used in polar regions. Therefore, it is extremely important to create a workflow for comprehensive radar monitoring of the Arctic regions to identify anomalous deformations of heaving mounds that can turn into craters. It is the main task of this study. The crater formed in 2020 and described in detail in [2] will be used as a test site.

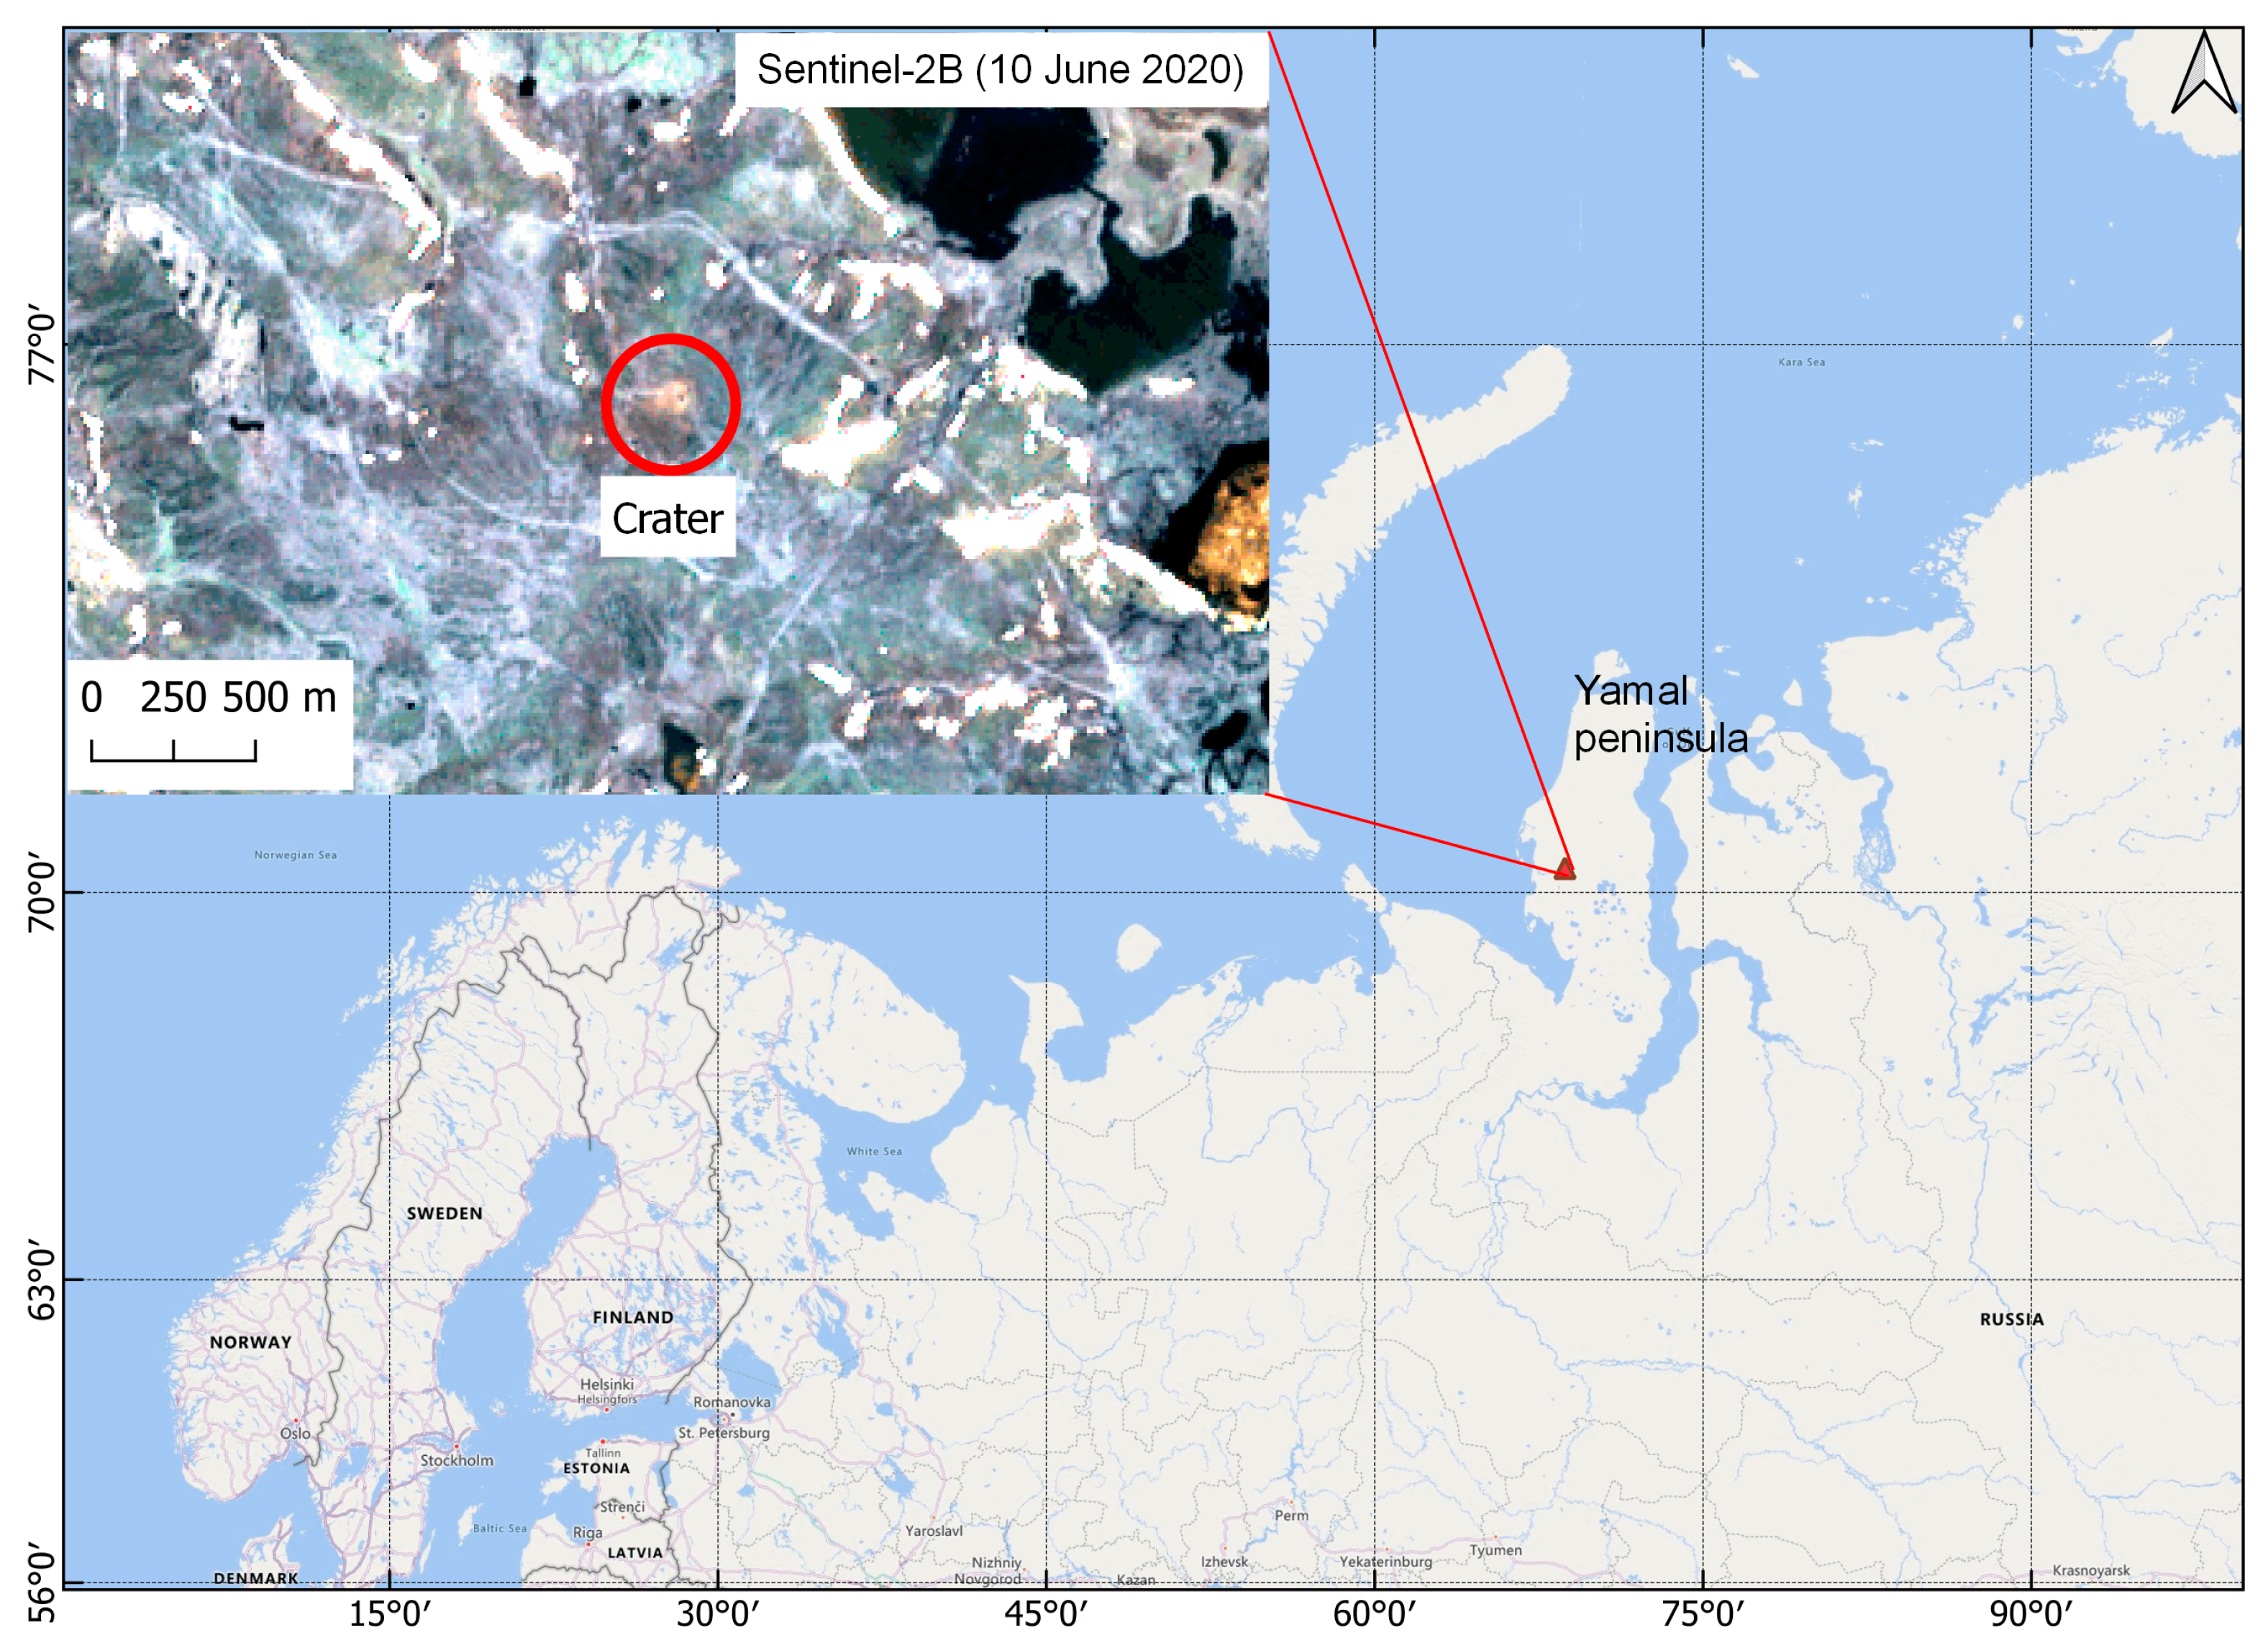
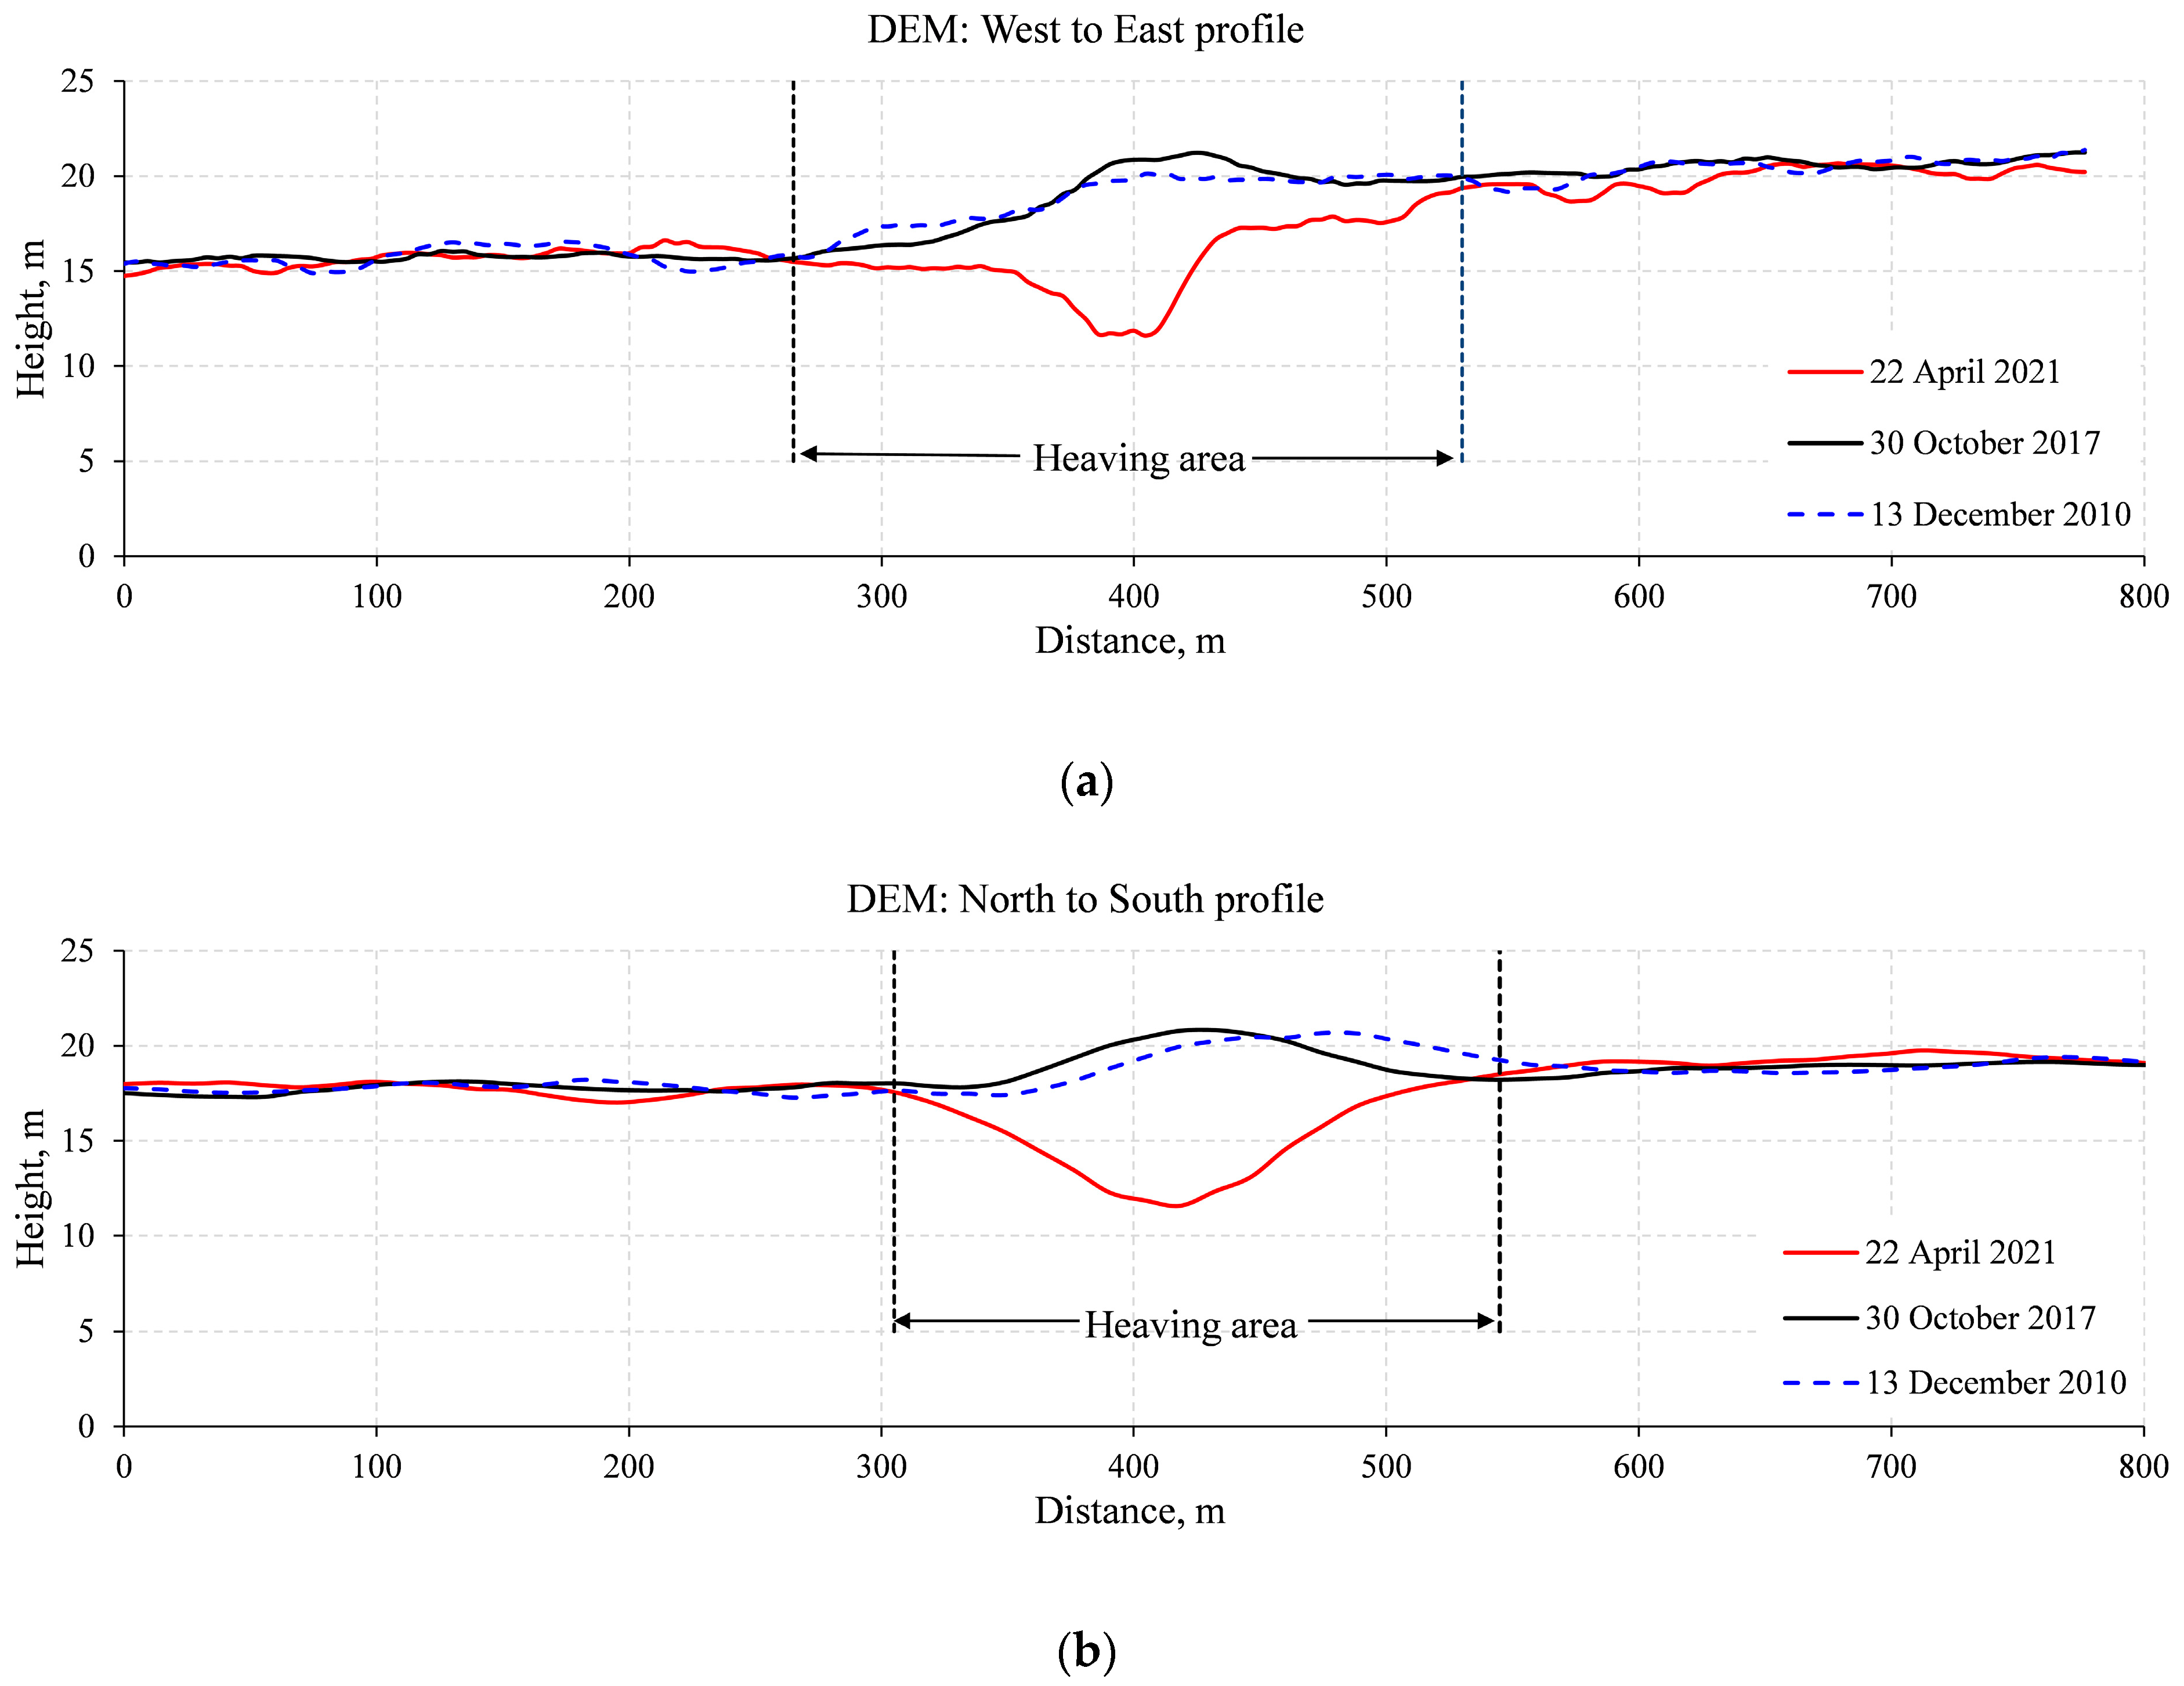
2. Description of the Perennial Heaving Mound

The location of the perennial heaving mound/crater is shown in Figure 1 and on a web page [17]. The scale on the web page is shown in the lower right corner. The average outer diameter of the crater (near the ground surface) was about 25 m [2]. According to the analysis of the available data of the ArcticDEM strips [18] as of 2011 and 2017, there was a PHM before the explosion, which existed at the site of the crater. Its height increased from 3.4 m in 2011 to 4.2 m in 2017 with the average growth rate equal to 13.3 cm per year over the period. For 6 years, the horizontal dimensions along the lower closed contour of the mound increased from 36 × 46 m in 2011 to 43 × 58 m in 2017 [2]. A comprehensive analysis of retrospective remote sensing data and the available detailed topographic maps showed that the PHM existed for at least 20 years before the explosion.

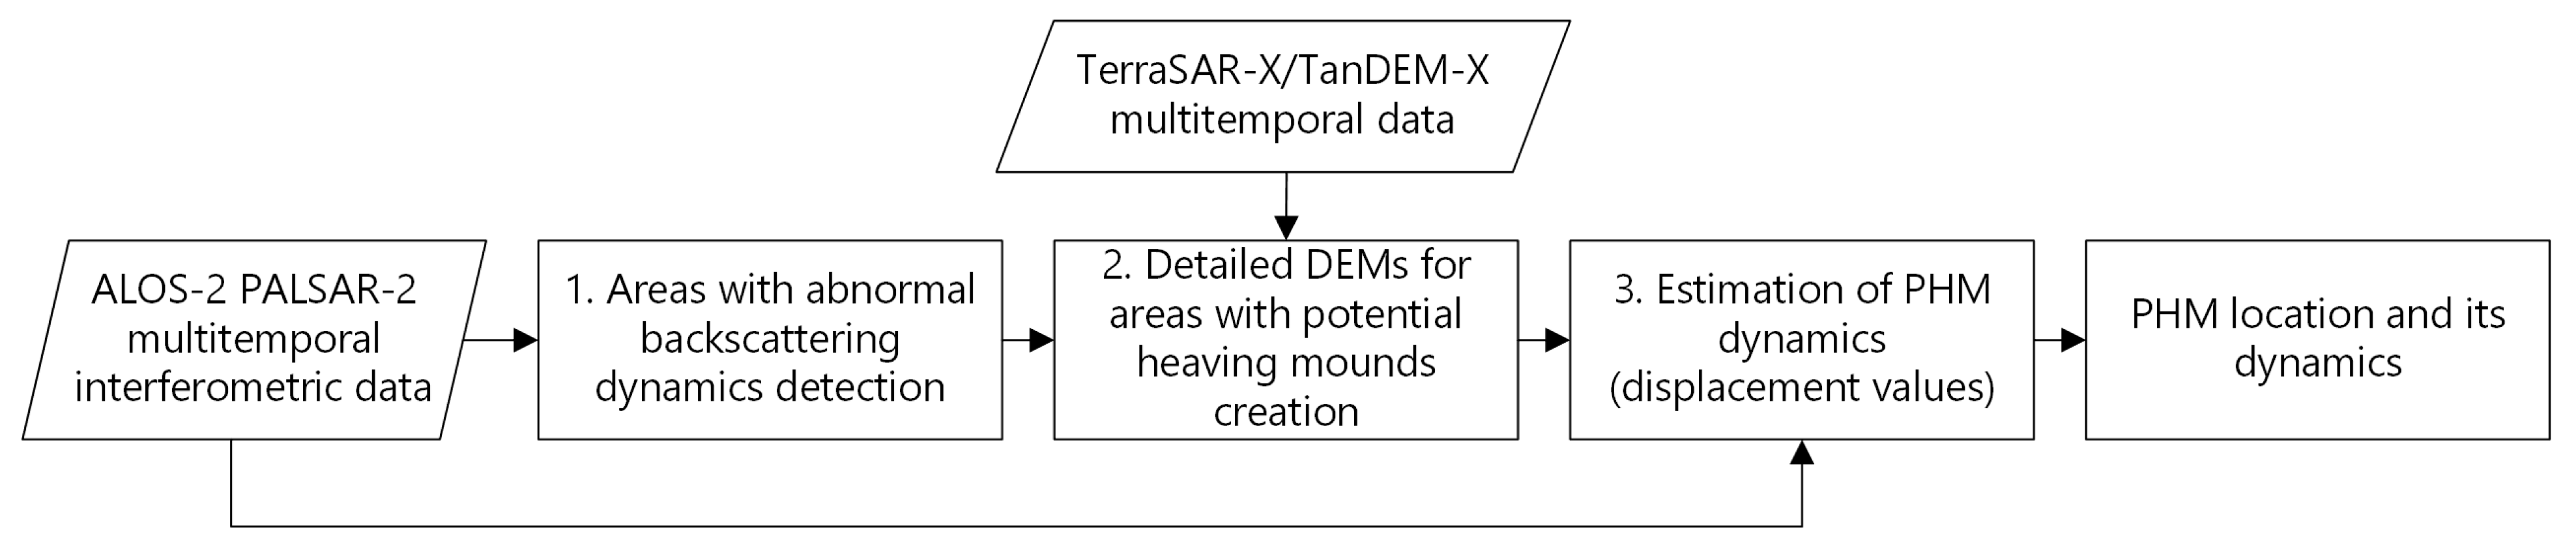
3. Workflow of Heaving Mound/Crater Study

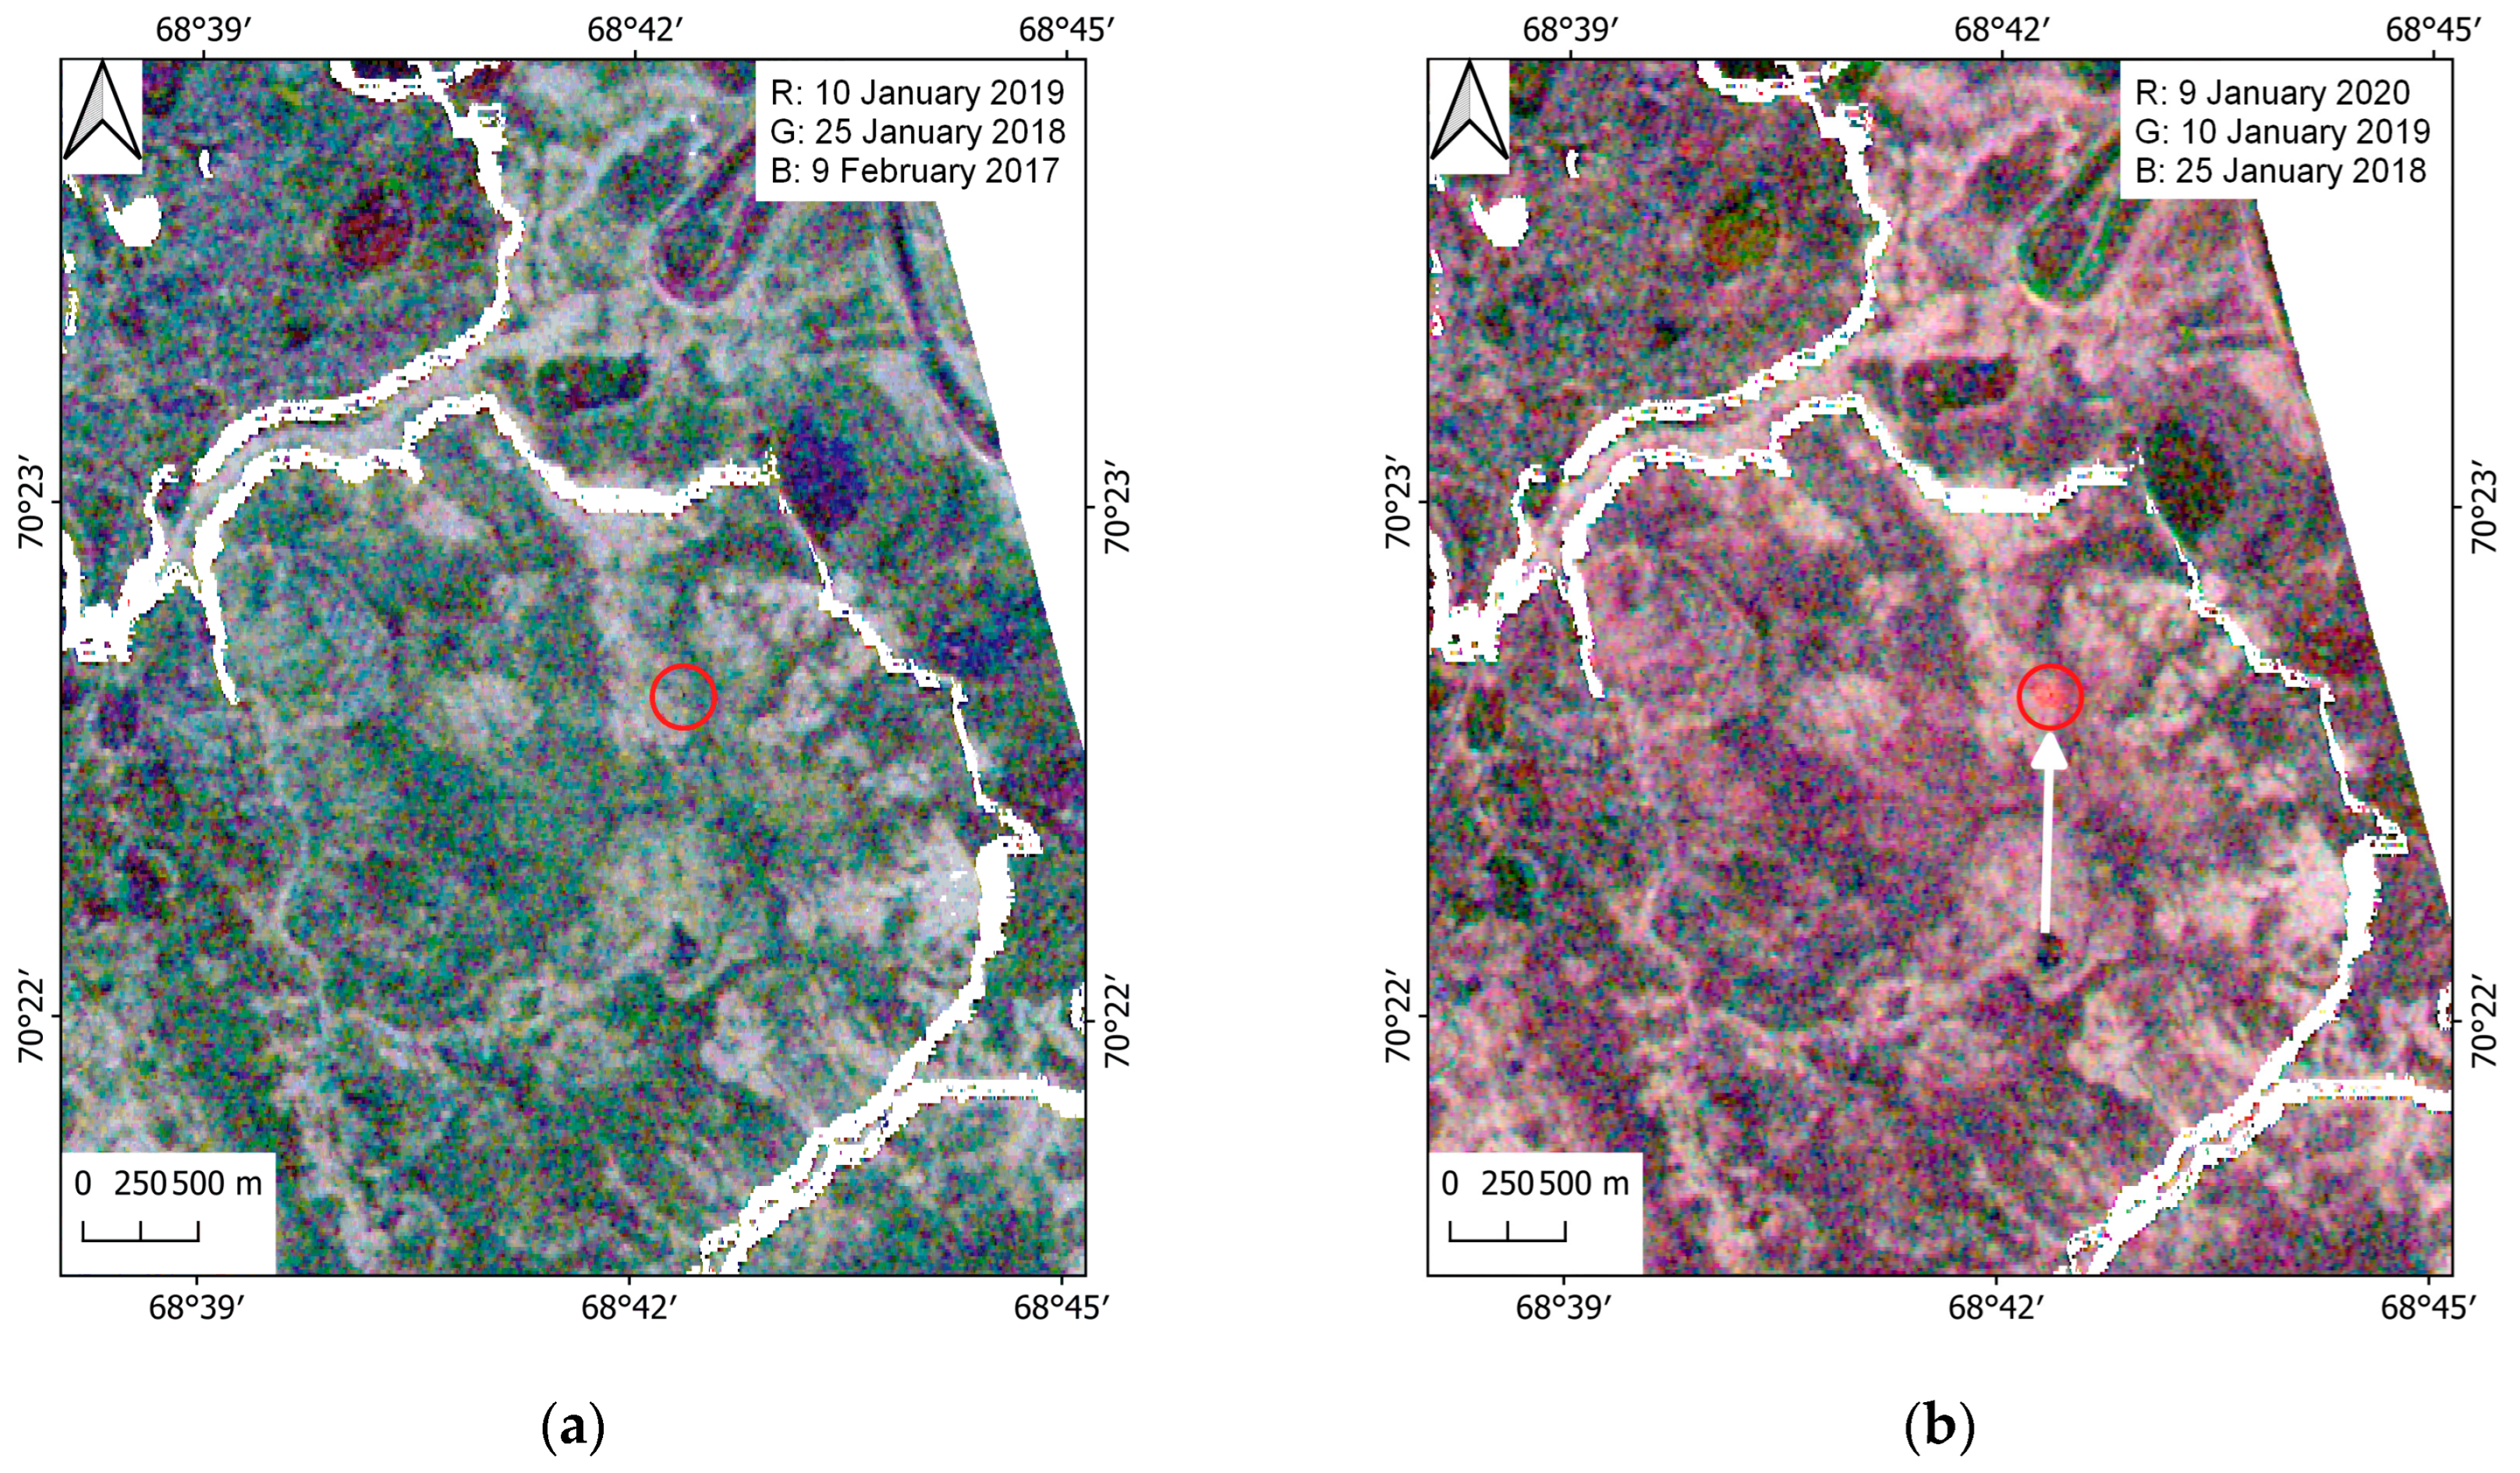
3.1. PHM Detection and Data Used

The workflow shown in Figure 2 is proposed to monitor the state and dynamics of PHM in the Arctic regions.
In the first stage (Figure 1), we need to detect a PHM against the background of a multiple chaotic terrain changes of various spatial scales. The difficulty of detecting PHMs with anomalous backscattering dynamics is primarily due to their relatively small size, as well as the intense processes of seasonal thawing/freezing over a large area. We suggest using multi-temporal long-wave L- and P-band SAR backscattering data to decrease the influence of small-scale roughness. More stable winter data should be used for the elimination of seasonal thawing/freezing/watering factors that affect backscattering and severely corrupt the interferometric phase. Due to the relatively slow PHM increase, we cannot use data within one winter season, for example from December to February. So, the best choice is to take data from the same winter months of different years. Now, the only option is L-band ALOS-2 PALSAR-2 radar interferometric data for the winter period with a time baseline of about one year (see Table 1). Herein, we assume that the thickness of the snow cover is the same in different years and does not create an additional phase shift [19].
ALOS-2 PALSAR-2 images at ascending orbit in FBD (Fine Beam Dual) mode were processed using Sarmap SARScape© software. The original spatial resolution of images was 10 m. We used multilook with 3 resolution cells for azimuth and 1 for range, as well as Goldstein filtering with a 3 × 3 pixel window to reduce speckle noise.
The assessment of changes in the radar backscattering amplitude for detecting PHM is described in detail in work [6]; however, we consider it necessary to provide an equation characterizing the ratio of the brightness of the radar image pixels corresponding to the front (for the radar) slope, β s 0 , and the horizontal surface, β H 0 [20]:
β s 0 β H 0 = s i n θ i s i n ( θ i α l o c )
where θ i is the local incidence angle of the radar pulse, and αloc is the slope of the mound side facing the radar. As a result of a heaving, the slope increases; it leads to the rise of backscattering from the front mound slope (facing the radar) relative to the neighboring areas.
Against the general ambient background, PHM with anomalous dynamics is most clearly seen in the cross-polarized multi-temporal composite RGB representation (Figure 3 and webpage [17], Section 1. Abnormal backscattering dynamics detection). For example, in the period from 2017 to 2019 (Figure 3a), PHM is not detected, and a significant backscattering increase in 2020 (red color) is evident in the second RGB composite in Figure 3b. A white arrow points at this anomaly.
More explicit PHM according to cross-polarized data compared to co-polarized (web-page [17], Section 1) is the evidence of the fact that an anomalous radar backscattering increase occurs not only due to an increase in the angle of inclination of the side slopes of the PHM but also due to the formation of many frost cracks that are randomly oriented. These frost crack increase depolarization.
In these images (Figure 3 and [17]), the diameter of the detected anomaly reaches 140 m, which exceeds greatly the average diameter (25 m) of the formed crater [2]. This difference is related to the fact that the area of the surface that was deformed is much greater than the formed crater. Further, it is proposed to perform the analysis only within a 270 m-diameter circle covering the heaving area, with a buffer zone (red circle in Figure 3b).
Thus, anomalous, compared to the surrounding background, dynamics of slopes and frost cracks around the mound was revealed. However, the effect of the increase in amplitude of HH- and HV-polarized radar backscattering may correspond to other phenomena. For example, this dynamic is possible when a small surface area of thawing subsides and slopes of its inner part increase. Therefore, it is required to separate the effects of heaving (convex shape) and the gradual lowering of the surface (concave shape).

3.2. PHM Validation

The next stage 2 (Figure 2) is focused on the convexity/concavity of the relief. It involves the creation of digital elevation models and their comparison or the estimation of the interferometric phase. Both options are identical, and the same data set is used, but in the first case, additional averaging procedures are applied. The second approach, without the use of subsequent phase unwrapping with smoothing, will allow us to reveal sharp local changes in the elevation. In both cases, it is necessary to use bistatic radar data (with a zero-time baseline). This will ensure the high coherence of interferometric data and therefore a flawless interferogram and digital elevation model. Herein, we cannot construct accurate DEMs based on ALOS-2 PALSAR-2 data due to their small perpendicular baselines (Table 1). Data with such baselines are best suited for displacement estimation (see next Section 3.3).
TerraSAR-X/TanDEM-X radar interferometric data are used for the studied case (see Table 2).
Small convex and concave landforms were revealed as the result of this stage. The heaving mound detected on the TerraSAR-X/TanDEM-X interferogram is shown in Figure 4 and also in [17] as an example. Multi-temporal digital elevation models comparison is another way of discovering the heaving mound (see Figure 5).
Figure 5a,b shows the elevation profiles extracted from three calculated TerraSAR-X/TanDEM-X DEMs: 13 December 2010 (blue dashes), 30 October 2017 (black solid line), and 22 April 2021 (red solid line). These profiles are presented by white dashed lines in the box in Figure 4: along the west to east line (Figure 5a) and along the north to south one (Figure 5b). The elevation change observed just corresponds to this PHM/crater. Note that, in order to improve the accuracy of satellite interferometric data and DEM coregistration, one should use data obtained with the same geometry of the radar survey. In the studied case, radar satellite data obtained from the ascending and descending orbits were used (Table 2). All three DEMs are presented at the web page [17].
Thus, a comparison of these DEMs (see Figure 5) provides an opportunity for detecting heaving mounds and craters with significant changes in the elevation.

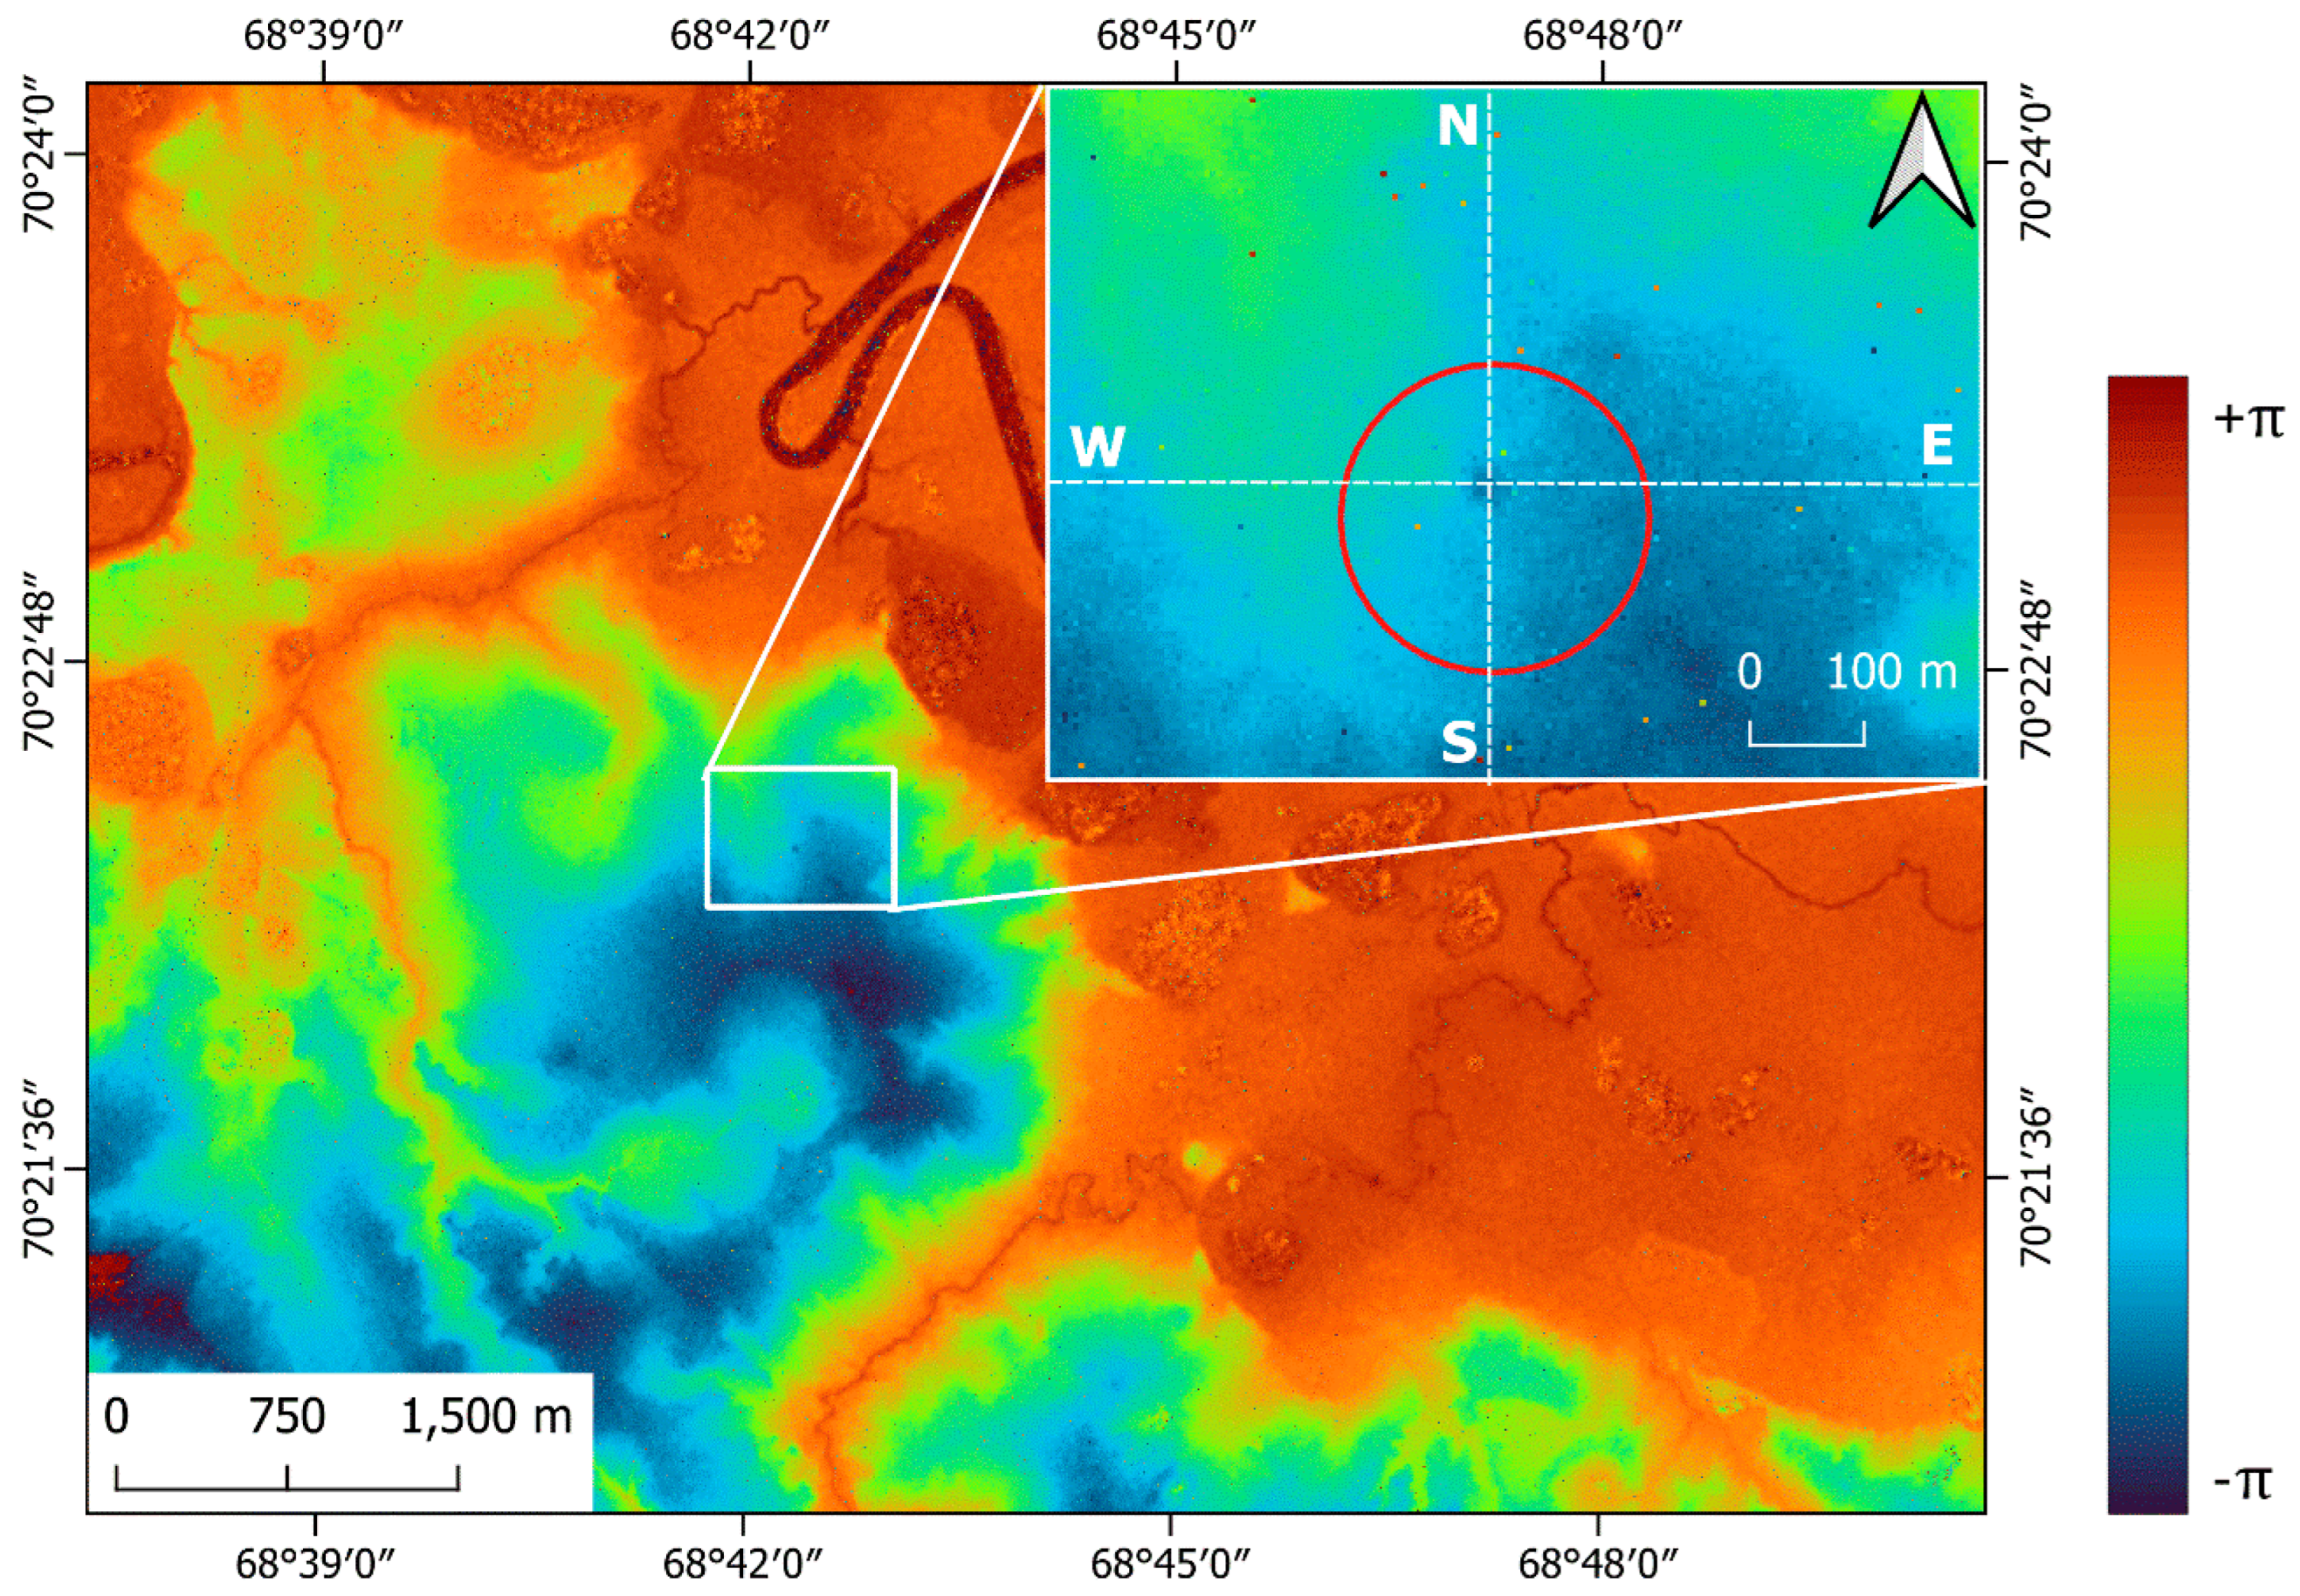
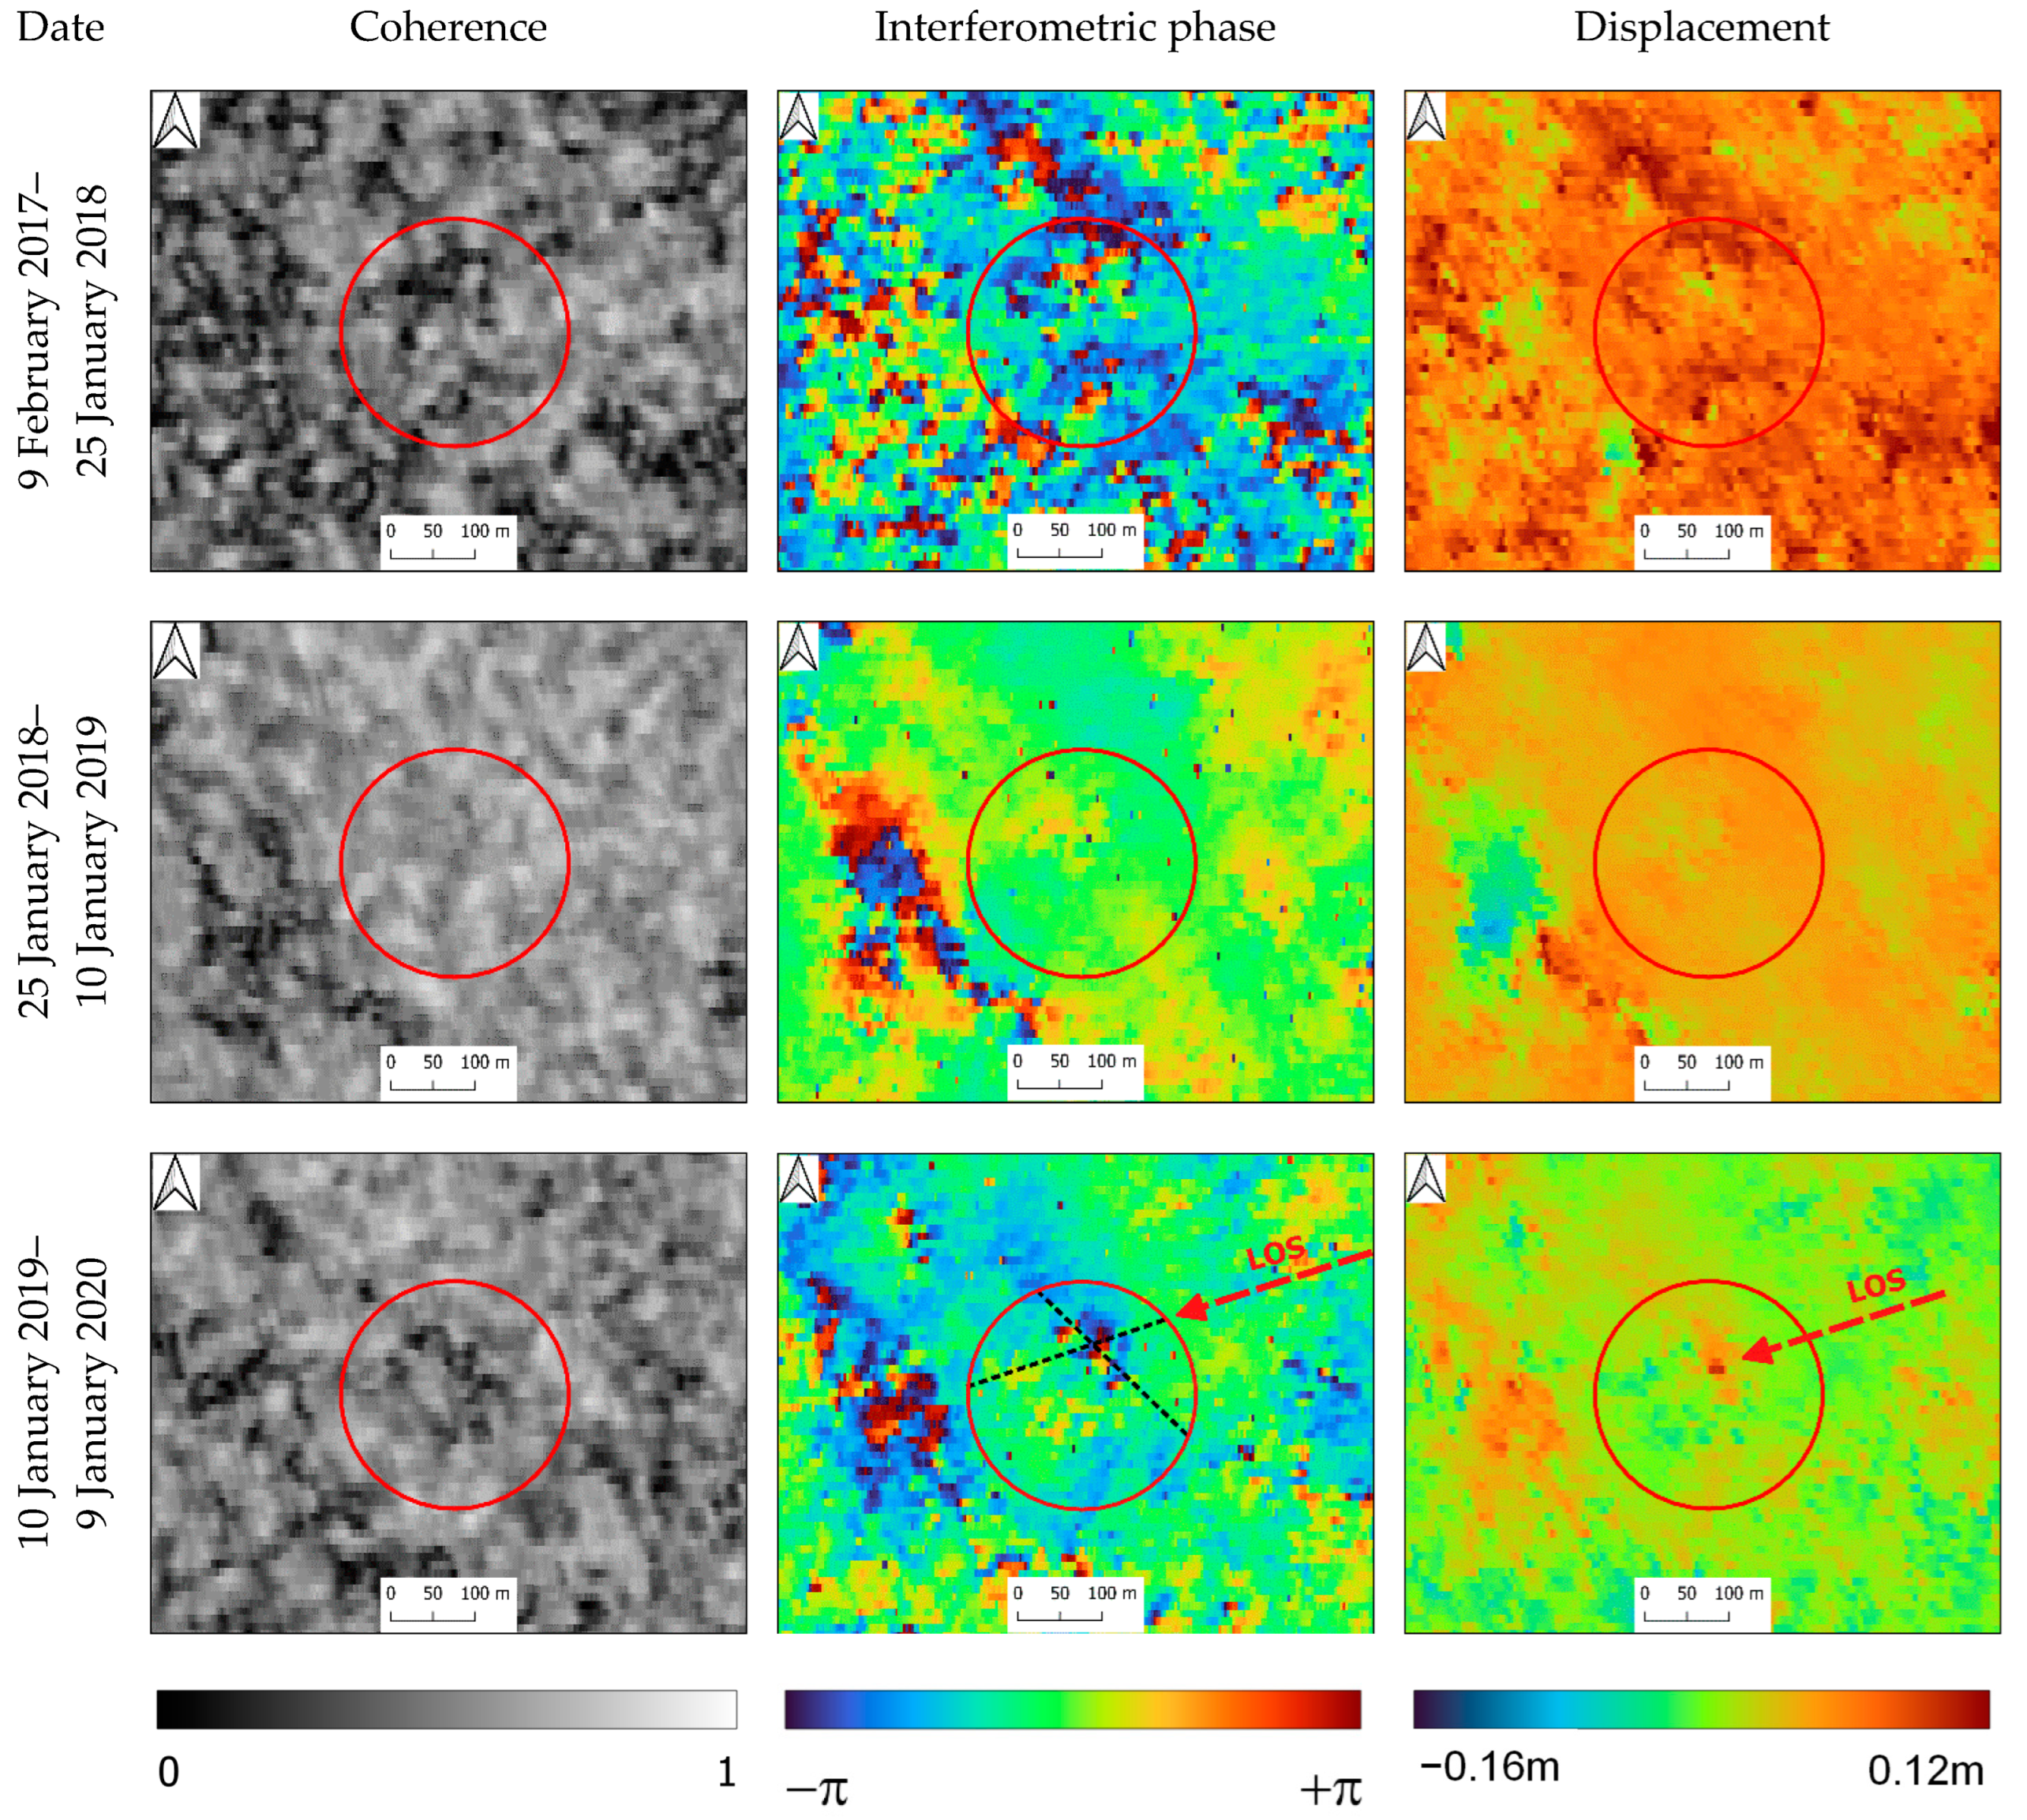
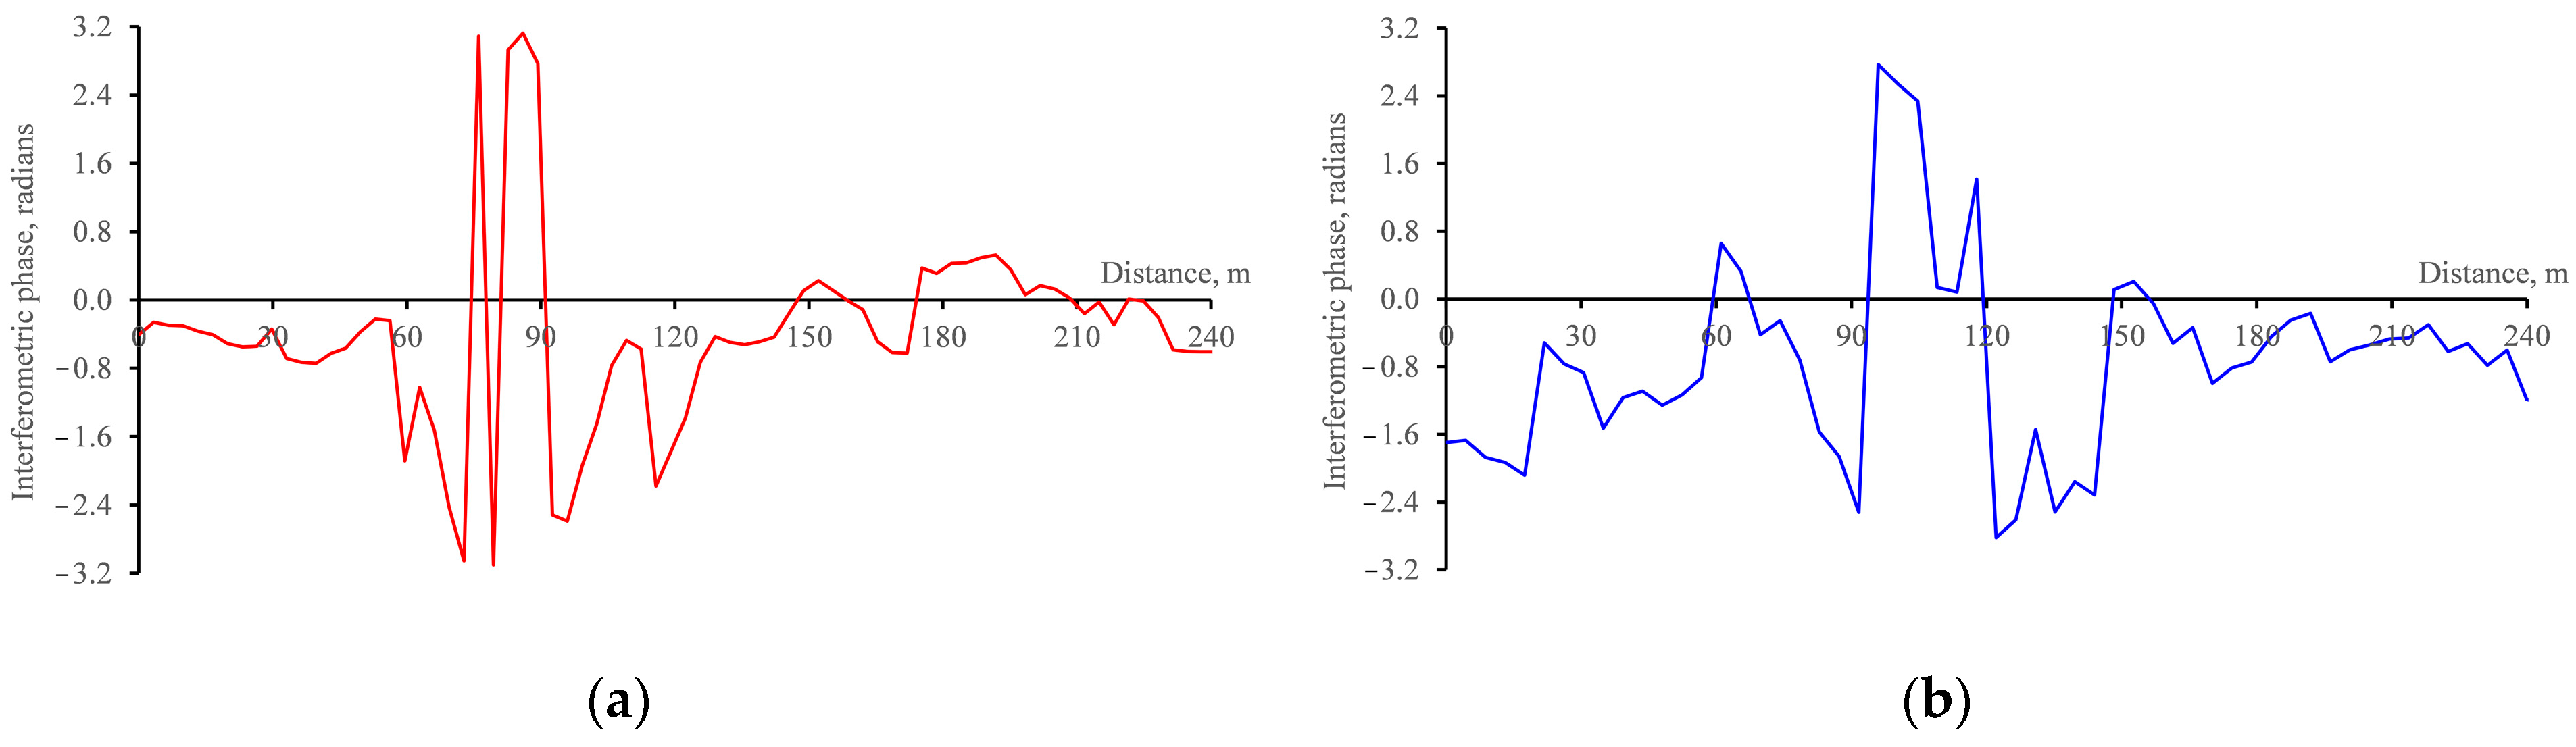
3.3. PHM Deformation Estimation by DInSAR Technique

After detecting an area with temporal dynamics of L-band SAR backscattering (Stage 1 in Figure 2) that differs from the background and the subsequent validation of the mound growth using TerraSAR-X/TanDEM-X bistatic radar data (Stage 2 in Figure 2), it is proposed to quantify its deformation (stage 3 on Figure 2). For this, we take previous HH-polarized L-band ALOS-2 PALSAR-2 interferometric data (see Table 1) that were used at the first step of detection. The differential radar interferometry method is used as a measurement tool. Speckle noise reduction was performed as described above (see Section 3.1). Phase unwrapping was performed using the minimum cost flow method. Phase unwrapping for pixels with coherence values less than 0.2 was not performed. However, the gaps obtained were interpolated when the phase to displacement conversion was carried out. A 5 m-resolution TanDEM-X digital elevation model of Oct. 30, 2017 was used as a reference elevation. The interferograms and resulting deformation maps are given in Figure 6 and in the Section 3. Estimation of PHM dynamics [17].
L-band ionospheric anomalies in the Arctic regions introduce an additional phase shift in the azimuthal direction (along the satellite path) but was almost absent or barely noticeable along the slant range [16]. Besides, typical distortions due to ionospheric irregularities appear as elongated fringes tens to hundreds of kilometers long, parallel or oriented at a small angle to the west–east line, as well as along the radar-looking direction. Since PHM dimensions are notably smaller, the impact of ionospheric disturbances can be neglected.
Figure 6 (north-to-south direction, vertical) shows fragments of coherence images, interferograms after filtering, and maps of displacements along the radar line of sight (LOS). As it can be seen from Figure 6, it is difficult to assess deformations within the circular outline according to the 9 February 2017–25 January 2018 pair of images due to low coherence (less than 0.2) and great speckle noise. According to the second annual interval, 25 January 2018–10 January 2019, the coherence over almost the entire contour is more than 0.2, and the flattened interferometric phase is relatively stable. Inside and outside the circular outline, there is an areal uplift along the LOS [17]. Overall, the results obtained according to the 9 February 2017–25 January 2018 and 25 January 2018–10 January 2019 pairs of images are consistent with the results of [6]. The values of deformations within the outlines corresponded to the background dynamics around it these years.
The coherence inside the outline for the third interferometric pair, 10 January 2019–9 January 2020, is lower than 0.2 only for several pixels. These low-coherence areas only partially intersect with a small (2–3 pixel wide) interferometric fringe (i.e., PHM), which is indicated by the red arrow. This arrow shows the direction of the line of sight as well. The estimated magnitude of displacement is equal to 10–12 cm towards the radar along LOS. However, this value is not consistent with the results of [2]. Authors in [2] report that the rate of heaving from 2011 to 2017 was 13.3 cm per year on average. Moreover, in paper [6], it is noted that PHM growth dynamics in 10 January 2019–9 January 2020 greatly exceeded those in previous years. Therefore, the value of heaving should be greater than 13.3 cm per year.
The profiles of the filtered interferometric phase for the pair of images 10 January 2019–9 January 2020 crossing through a small interferometric fringe (PHM) are presented by black dashed lines in Figure 6. The profiles along and across the LOS are shown in Figure 7.
Two consistent maxima of the interferometric phase on profile along the LOS (Figure 7a) correspond to a 2π phase jump. This jump is not observed for the profile across the LOS (Figure 7b). Nevertheless, we can conclude about displacement values no less than 22–24 cm. This result shows the necessity to analyze interferograms before their averaging and interpolation which are performed at subsequent stages of displacement calculation (phase unwrapping, re-flattening). Taking into account the small size of the crater, we can assume that the second maximum (between 80 and 90 m) in Figure 7a and the only maximum (between 95 and 110) in Figure 7b are the interpolated gap, i.e., a 2π phase jump. Thus, the probable value of deformations along the LOS can be 3λ/2, i.e., about 36 cm from 10 January 2019 to 9 January 2020.
The main result of DInSAR technique application for PHM study is the concluded relevance of the additional analysis of a filtered interferogram before phase unwrapping and further recalculation into the values of displacements. As for the quantitative evaluation of deformations, it is difficult to define the exact number of 2π cycles for these PHMs. We can only state the deformations of more than 22–24 cm for the period of 10 January 2019–9 January 2020. So, the question of the exact amount of heaving is not considered, but only its lower threshold is estimated.

4. Conclusions

Thus, the workflow for detecting PHM with anomalous dynamics based on the integrated application of radar methods and data is presented. It is proposed to detect the PHM deformations and then quantify them taking into account the advantages and disadvantages of radar phase and amplitude measurements for X- and L-band electromagnetic waves, as well as the specifics of the Arctic regions.
Firstly, an area with significantly increased L-band SAR backscattering against the background is to be found. This increase is supposed to be due to the following:
  • Intensive mound heaving and relevant change of its slopes assuming the bending of the scattering surface towards the satellite;
  • Formation of frost cracks, which simultaneously increase backscattering depolarization due to the chaotic location of microrelief features and form local slopes facing the radar.
ALOS-2 PALSAR-2 interferometric data for the winter period are selected for the calculation, preferably with annual intervals (for example, 10 January 2019–9 January 2020), i.e., no thawing/freezing processes and assuming comparability of snow cover depth.
The second stage involves validation based on the estimation of the terrain shape (convex or concave), as well as the comparison of multi-temporal DEMs according to TerraSAR-X/TanDEM-X bistatic interferometry data.
The third stage involves quantifying deformations by the DInSAR technique within the detected anomalous area using ALOS-2 PALSAR-2 data from the first stage. A thorough analysis of the filtered interferograms is also proposed, taking into account the fragmentary low coherence for the PHM region and the fact that the problem of automated interferometric phase unwrapping for these cases is not yet completely solved.

Author Contributions

Conceptualization, funding acquisition, and editing of the manuscript, V.B.; T.C. contributed in terms of methodology and writing the original draft, analysis of satellite data, editing of the manuscript; software, processing and analysis of satellite images, visualization, editing of the manuscript, A.D. All authors have read and agreed to the published version of the manuscript.

Funding

This research was carried out with the financial support of the Ministry of Science and Higher Education of the Russian Federation in the framework of the Agreement No. 075-15-2020-776.

Data Availability Statement

The data presented in this study are available on the web: https://omdoki.nextgis.com/resource/778/display?panel=layers.

Acknowledgments

The authors thank the Japan Aerospace Exploration Agency—JAXA for ALOS-2 PALSAR-2 data provided in the framework of the ALOS-2 RA6 (PI-3402) project and the German Aerospace Center DLR for TerraSAR-X/TanDEM-X data provided in the framework of TerraSAR-X/TanDEM-X Science Team international collaboration (XTI_HYDR0485).

Conflicts of Interest

The authors declare no conflict of interest.

References

  1. Kizyakov, A.; Khomutov, A.; Zimin, M.; Khairullin, R.; Babkina, E.; Dvornikov, Y.; Leibman, M. Microrelief Associated with Gas Emission Craters: Remote-Sensing and Field-Based Study. Remote Sen. 2018, 10, 677. [Google Scholar] [CrossRef] [Green Version]
  2. Bogoyavlensky, V.; Bogoyavlensky, I.; Nikonov, R.; Kargina, T.; Chuvilin, E.; Bukhanov, B.; Umnikov, A. New Catastrophic Gas Blowout and Giant Crater on the Yamal Peninsula in 2020: Results of the Expedition and Data Processing. Geosciences 2021, 11, 71. [Google Scholar] [CrossRef]
  3. Zolkos, S.; Fiske, G.; Windholz, T.; Duran, G.; Yang, Z.; Olenchenko, V.; Faguet, A.; Natali, S.M. Detecting and Mapping Gas Emission Craters on the Yamal and Gydan Peninsulas, Western Siberia. Geosciences 2021, 11, 21. [Google Scholar] [CrossRef]
  4. Chuvilin, E.M.; Sokolova, N.S.; Bukhanov, B.A.; Davletshina, D.A.; Spasennykh, M.Y. Formation of Gas-Emission Craters in Northern West Siberia: Shallow Controls. Geosciences 2021, 11, 393. [Google Scholar] [CrossRef]
  5. Kizyakov, A.; Leibman, M.; Zimin, M.; Sonyushkin, A.; Dvornikov, Y.; Khomutov, A.; Dhont, D.; Cauquil, E.; Pushkarev, V.; Stanilovskaya, Y. Gas Emission Craters and Mound-Predecessors in the North of West Siberia, Similarities and Differences. Remote Sen. 2020, 12, 2182. [Google Scholar] [CrossRef]
  6. Bondur, V.G.; Chimitdorzhiev, T.N.; Kirbizhekova, I.I.; Dmitriev, A.V. Radar Detection of Anomalous Dynamics of Perennial Heaving Mounds from the Example of the Yamal Mound/Crater in 2020. Dokl. Earth Sc. 2022, 506, 654–660. [Google Scholar] [CrossRef]
  7. Wang, L.; Marzahn, P.; Bernier, M.; Ludwig, R. Sentinel-1 InSAR Measurements of Deformation over Discontinuous Permafrost Terrain, Northern Quebec, Canada. Remote Sens. Environ. 2020, 248, 111965. [Google Scholar] [CrossRef]
  8. Abe, T.; Iwahana, G.; Efremov, P.V.; Desyatkin, A.R.; Kawamura, T.; Fedorov, A.; Zhegusov, Y.; Yanagiya, K.; Tadono, T. Surface Displacement Revealed by L-Band InSAR Analysis in the Mayya Area, Central Yakutia, Underlain by Continuous Permafrost. Earth Planets Space 2020, 72, 138. [Google Scholar] [CrossRef]
  9. Massonnet, D.; Feigl, K.L. Radar Interferometry and Its Application to Changes in the Earth’s Surface. Rev. Geophys. 1998, 36, 441–500. [Google Scholar] [CrossRef] [Green Version]
  10. Mohammadi, A.; Karimzadeh, S.; Jalal, S.J.; Kamran, K.V.; Shahabi, H.; Homayouni, S.; Al-Ansari, N. A Multi-Sensor Comparative Analysis on the Suitability of Generated DEM from Sentinel-1 SAR Interferometry Using Statistical and Hydrological Models. Sensors 2020, 20, 7214. [Google Scholar] [CrossRef] [PubMed]
  11. Devaraj, S.; Yarrakula, K. Evaluation of Sentinel 1–Derived and Open-Access Digital Elevation Model Products in Mountainous Areas of Western Ghats, India. Arab J Geosci 2020, 13, 1103. [Google Scholar] [CrossRef]
  12. Braun, A. Retrieval of Digital Elevation Models from Sentinel-1 Radar Data—Open Applications, Techniques, and Limitations. Open Geosci. 2021, 13, 532–569. [Google Scholar] [CrossRef]
  13. Tan, J.; Chen, M.; Xie, X.; Zhang, C.; Mao, B.; Lei, G.; Wang, B.; Meng, X.; Guan, X.; Zhang, Y. Riparian Zone DEM Generation from Time-Series Sentinel-1 and Corresponding Water Level: A Novel Waterline Method. IEEE Trans. Geosci. Remote Sens. 2022, 60, 1–10. [Google Scholar] [CrossRef]
  14. Chindo, M.M.; Hashim, M.; Rasib, A.W. Revising Digital Elevation Models Generation from Sentinel-1 Synthetic Aperture Radar and Interferometric Technique in Densely-Vegetated Humid Tropical Environment. Geocarto Int. 2022, 1–20. [Google Scholar] [CrossRef]
  15. Ramirez, R.; Lee, S.-R.; Kwon, T.-H. Long-Term Remote Monitoring of Ground Deformation Using Sentinel-1 Interferometric Synthetic Aperture Radar (InSAR): Applications and Insights into Geotechnical Engineering Practices. Appl. Sci. 2020, 10, 7447. [Google Scholar] [CrossRef]
  16. Wegmuller, U.; Werner, C.; Strozzi, T.; Wiesmann, A. Ionospheric Electron Concentration Effects on SAR and INSAR. In Proceedings of the IEEE International Symposium on Geoscience and Remote Sensing, Denver, CO, USA, 31 July–4 August 2006; pp. 3731–3734. [Google Scholar] [CrossRef]
  17. Detection of Perennial Heaving Mound by SAR Backscattering and DinSAR. Available online: https://omdoki.nextgis.com/resource/778/display?panel=layers (accessed on 20 December 2022).
  18. Porter, C.; Morin, P.; Howat, I.; Noh, M.-J.; Bates, B.; Peterman, K.; Keesey, S.; Schlenk, M.; Gardiner, J.; Tomko, K.; et al. ArcticDEM, Version 3; Harvard Dataverse: Cambridge, MA, USA, 2018. [Google Scholar] [CrossRef]
  19. Dagurov, P.N.; Chimitdorzhiev, T.N.; Dmitriev, A.V.; Dobrynin, S.I. Estimation of Snow Water Equivalent from L-Band Radar Interferometry: Simulation and Experiment. Int. J. Remote Sens. 2020, 41, 9328–9359. [Google Scholar] [CrossRef]
  20. Henderson, F.M.; Lewis, A.J. (Eds.) Principles and Applications of Imaging Radar (Manual of Remote Sensing, Volume 2), 3rd ed.; John Wiley & Sons, Inc.: Hoboken, NJ, USA, 1998; ISBN -13: 978-0471294061. [Google Scholar]
Figure 1. Location of the studied mound/crater and Sentinel-2B composite image after crater formation.
Remotesensing 15 00281 g001
Figure 2. Flowchart of the proposed methodology for detection and study of PHM.
Remotesensing 15 00281 g002
Figure 3. Multi-temporal RGB composites of radar backscattering (dB) at HV polarization: (a) red for 10 January 2019, green for 25 January 2018, blue for 9 February 2017; (b) red for 9 January 2020, green for 10 January 2019, blue for 25 January 2018. Red circle marks the heaving area with a buffer zone.
Remotesensing 15 00281 g003
Figure 4. TerraSAR-X/TanDEM-X wrapped interferogram with detected PHM (30 October 2017).
Remotesensing 15 00281 g004
Figure 5. Comparison of multi-temporal TerraSAR-X/TanDEM-X DEMs. Elevation along profiles crossing the mound/crater from (a) west to east and (b) from north to south.
Remotesensing 15 00281 g005
Figure 6. Fragments of coherence, interferograms, and displacement maps for the area with PHM.
Remotesensing 15 00281 g006
Figure 7. Interferometric phase profile for the pair of images from 10 January 2019–9 January 2020: (a)—along the LOS; (b)—across the LOS.
Remotesensing 15 00281 g007
Table 1. Used ALOS-2 PALSAR-2 data.
ALOS-2 PALSAR-2
SceneID
Imaging DateSpatial Baselines, m
25 January 201810 January 20199 January
2020
ALOS2146771410-1702099 February 2017185
ALOS2198521410-18012525 January 2018 119
ALOS2250271410-19011010 January 2019 144
ALOS2304091410-2001099 January 2020
Table 2. TerraSAR-X/TanDEM-X data baseline parameters.
Interferometric Baseline, m2π Ambiguity, mOrbit
13 December 201032522Ascending
30 October 2017392.818.4Descending
22 April 202126423.7Descending
Disclaimer/Publisher’s Note: The statements, opinions and data contained in all publications are solely those of the individual author(s) and contributor(s) and not of MDPI and/or the editor(s). MDPI and/or the editor(s) disclaim responsibility for any injury to people or property resulting from any ideas, methods, instructions or products referred to in the content.

