Article

Spatio-Temporal Patterns and Driving Forces of Desertification in Otindag Sandy Land, Inner Mongolia, China, in Recent 30 Years

1
Key Laboratory of National Forestry and Grassland Administration on Ecological Landscaping of Challenging Urban Sites, National Innovation Alliance of National Forestry and Grassland Administration on Afforestation and Landscaping of Challenging Urban Sites, Shanghai Engineering Research Center of Landscaping on Challenging Urban Sites, Shanghai Academy of Landscape Architecture Science and Planning, Shanghai 201499, China
2
Beijing Engineering Research Center of Soil and Water Conservation, Beijing Forestry University, Beijing 100083, China
3
Shanghai Foundation Ding Environmental Technology Company, Shanghai 200063, China
*
Author to whom correspondence should be addressed.
Remote Sens. 2023, 15(1), 279; https://doi.org/10.3390/rs15010279
Submission received: 15 November 2022 / Revised: 18 December 2022 / Accepted: 18 December 2022 / Published: 3 January 2023
(This article belongs to the Special Issue Remote Sensing with Landscape Ecology and Landscape Sustainability)

Abstract

:
Background: Desertification is one of the main obstacles to global sustainable development. Monitoring, evaluating and mastering its driving factors are very important for the prevention and control of desertification. As one of the largest deserts in China, the development of desertification in Otindag Sandy Land (OSL) resulted in the reduction in land productivity and serious ecological/environmental consequences. Although many ecological restoration projects have been carried out, the vegetation restoration of OSL and the impact mechanism of climate and human activities on desertification remain unclear. Methods: Taking OSL as the research area, this paper constructs the desertification index by using the remote sensing images and meteorological and socio-economic data, between 1986 and 2016, and analyzes the spatio-temporal evolution process and driving factors of desertification by using trend analysis and spearman rank correlation. Results: The results showed that: (1) Desertification in the OSL has fluctuated greatly during the past 30 years. Desertification recovered between 1986 and 1990, expanded and increased between 1990 and 2000, reduced between 2000 and 2004, developed rapidly between 2004 and 2007, and recovered again between 2007 and 2016; (2) The desertification of OSL is dominated by a non-significant change trend, accounting for 73.27%. In the significant change trend, the area of desertification rising trend is 20.32%, which is mainly located in the north and east, and the area of declining trend is 6.41%, which is mainly located in the southwest; (3) Desertification is the result of the superposition of climate and human activities. Climate change is the main influencing factor, followed by human activities, and the superposition effects of the two are spatio-temporal differences. Conclusions: These results shed light on the development of desertification in OSL and the relative importance and complex interrelationship between human activities and climate in regulating the process of desertification. Based on this, we suggest continuing to implement the ecological restoration policy and avoid the destruction of vegetation by large-scale animal husbandry in order to improve the situation of desertification.

1. Introduction

Desertification refers to land degradation in arid, semi-arid and dry sub-humid areas caused by various factors, including climate variability and human activities [1,2]. Desertification is a compound disaster under the influence of natural and human factors, which has a wide range and deep degree of harm. As a major global ecological problem, desertification poses a severe challenge to world food security and ecological security [3]. Desertification, known as the “cancer of the earth”, threatens the survival and development of two-thirds of countries and regions, and one-fifth of the population, in the world [4,5].
Around the world, about 33,100 ha of land is degraded into deserts every day, resulting in 1.3 billion USD in economic losses [6]. China is one of the countries most seriously affected by desertification in the world. Since 1995, China has organized the monitoring of desertification and sandification land every five years [7]. According to the fifth monitoring of desertification and sandification in China, the area of desertification land was 26.12 million ha, accounting for 27.20% of the total land area [8]. The development of desertification leads to the deterioration of the ecological environment, the decline of soil quality, sandstorms and other problems, which seriously restricts the sustainable development of the ecosystem [9,10,11].
Since the 1970s, scholars have begun to use satellite images to study desertification, mainly focusing on the causes, spatial pattern, evolution process, prevention and control measures and vulnerability assessment of desertification [12,13,14,15], among which dynamic monitoring of desertification is the basis of other studies. There are three common research methods. One is to study the sandy land changes after 2000 on the basis of continuous interannual middle-low resolution remote sensing data (MODIS data of 250 m, 500 m or 1000 m). For example, using the classification method, linear regression or Mann-Kendall test and other methods, based on the leaf area index (LAI), Net Primary Productivity (NPP) or Normalized Difference Vegetation Index (NDVI) as the basic data, to analyze the change of vegetation characteristics, and then invert the degree of desertification [16,17]. The other is to study the change of sandy land based on the medium resolution remote sensing data (10 m or 30 m) within a period of between five and ten years. For example, the Landsat TM/ETM+/OLI or SPOT data were used for interpretation to distinguish different landscape areas of sandy land and then analyze the dynamic trend of desert [18,19,20]. The last one is to interpret the morphology and area of surface rheumatoid pits by using medium-high resolution remote sensing data, such as Quickbird, WordView and GF series data, to reflect the process and extent of desertification [21]. However, because the development of desertification is a long-term process, it is difficult to fully grasp the change rules of desertification in short and long-time intervals. In addition, due to the large desert area, low resolution image data is difficult to reflect the detailed changes of desertification. Therefore, it is necessary to use medium-high resolution remote sensing data with a more continuous time series to monitor the process of desertification change, in order to comprehensively understand the dynamic spatio-temporal evolution of desertification.
Desertification is the result of the joint action of climate change and human activities. The comprehensive study on the historical climate and stratigraphic profile of Otindag Sandy Land (OSL) showed that climate change was the key factor triggering OSL desertification [22,23]. Vegetation in this region was sensitive to climate change, especially in the early growing season [24]. The frequency of spring drought in the region was up to 60%. Spring drought would affect the grass greening, slow down the growth of pasture and result in reduced pasture production. In addition, livestock trampling on food and spring wind would further accelerate the development of desertification [25]. However, the extent to which climate change and human activities affect desertification in OSL is still worthy of further study and analysis.
This study takes OSL as the research area and aims to: (1) clarify the overall restoration of OSL through the process of ecological protection; (2) analyze the difference and fluctuation of restoration in different desertification areas; (3) discuss the influence of man-made driving factors and climate driving factors on desertification is discussed. This paper has important reference value for clarifying the formation mechanism of sandy desertification and putting forward effective control methods.

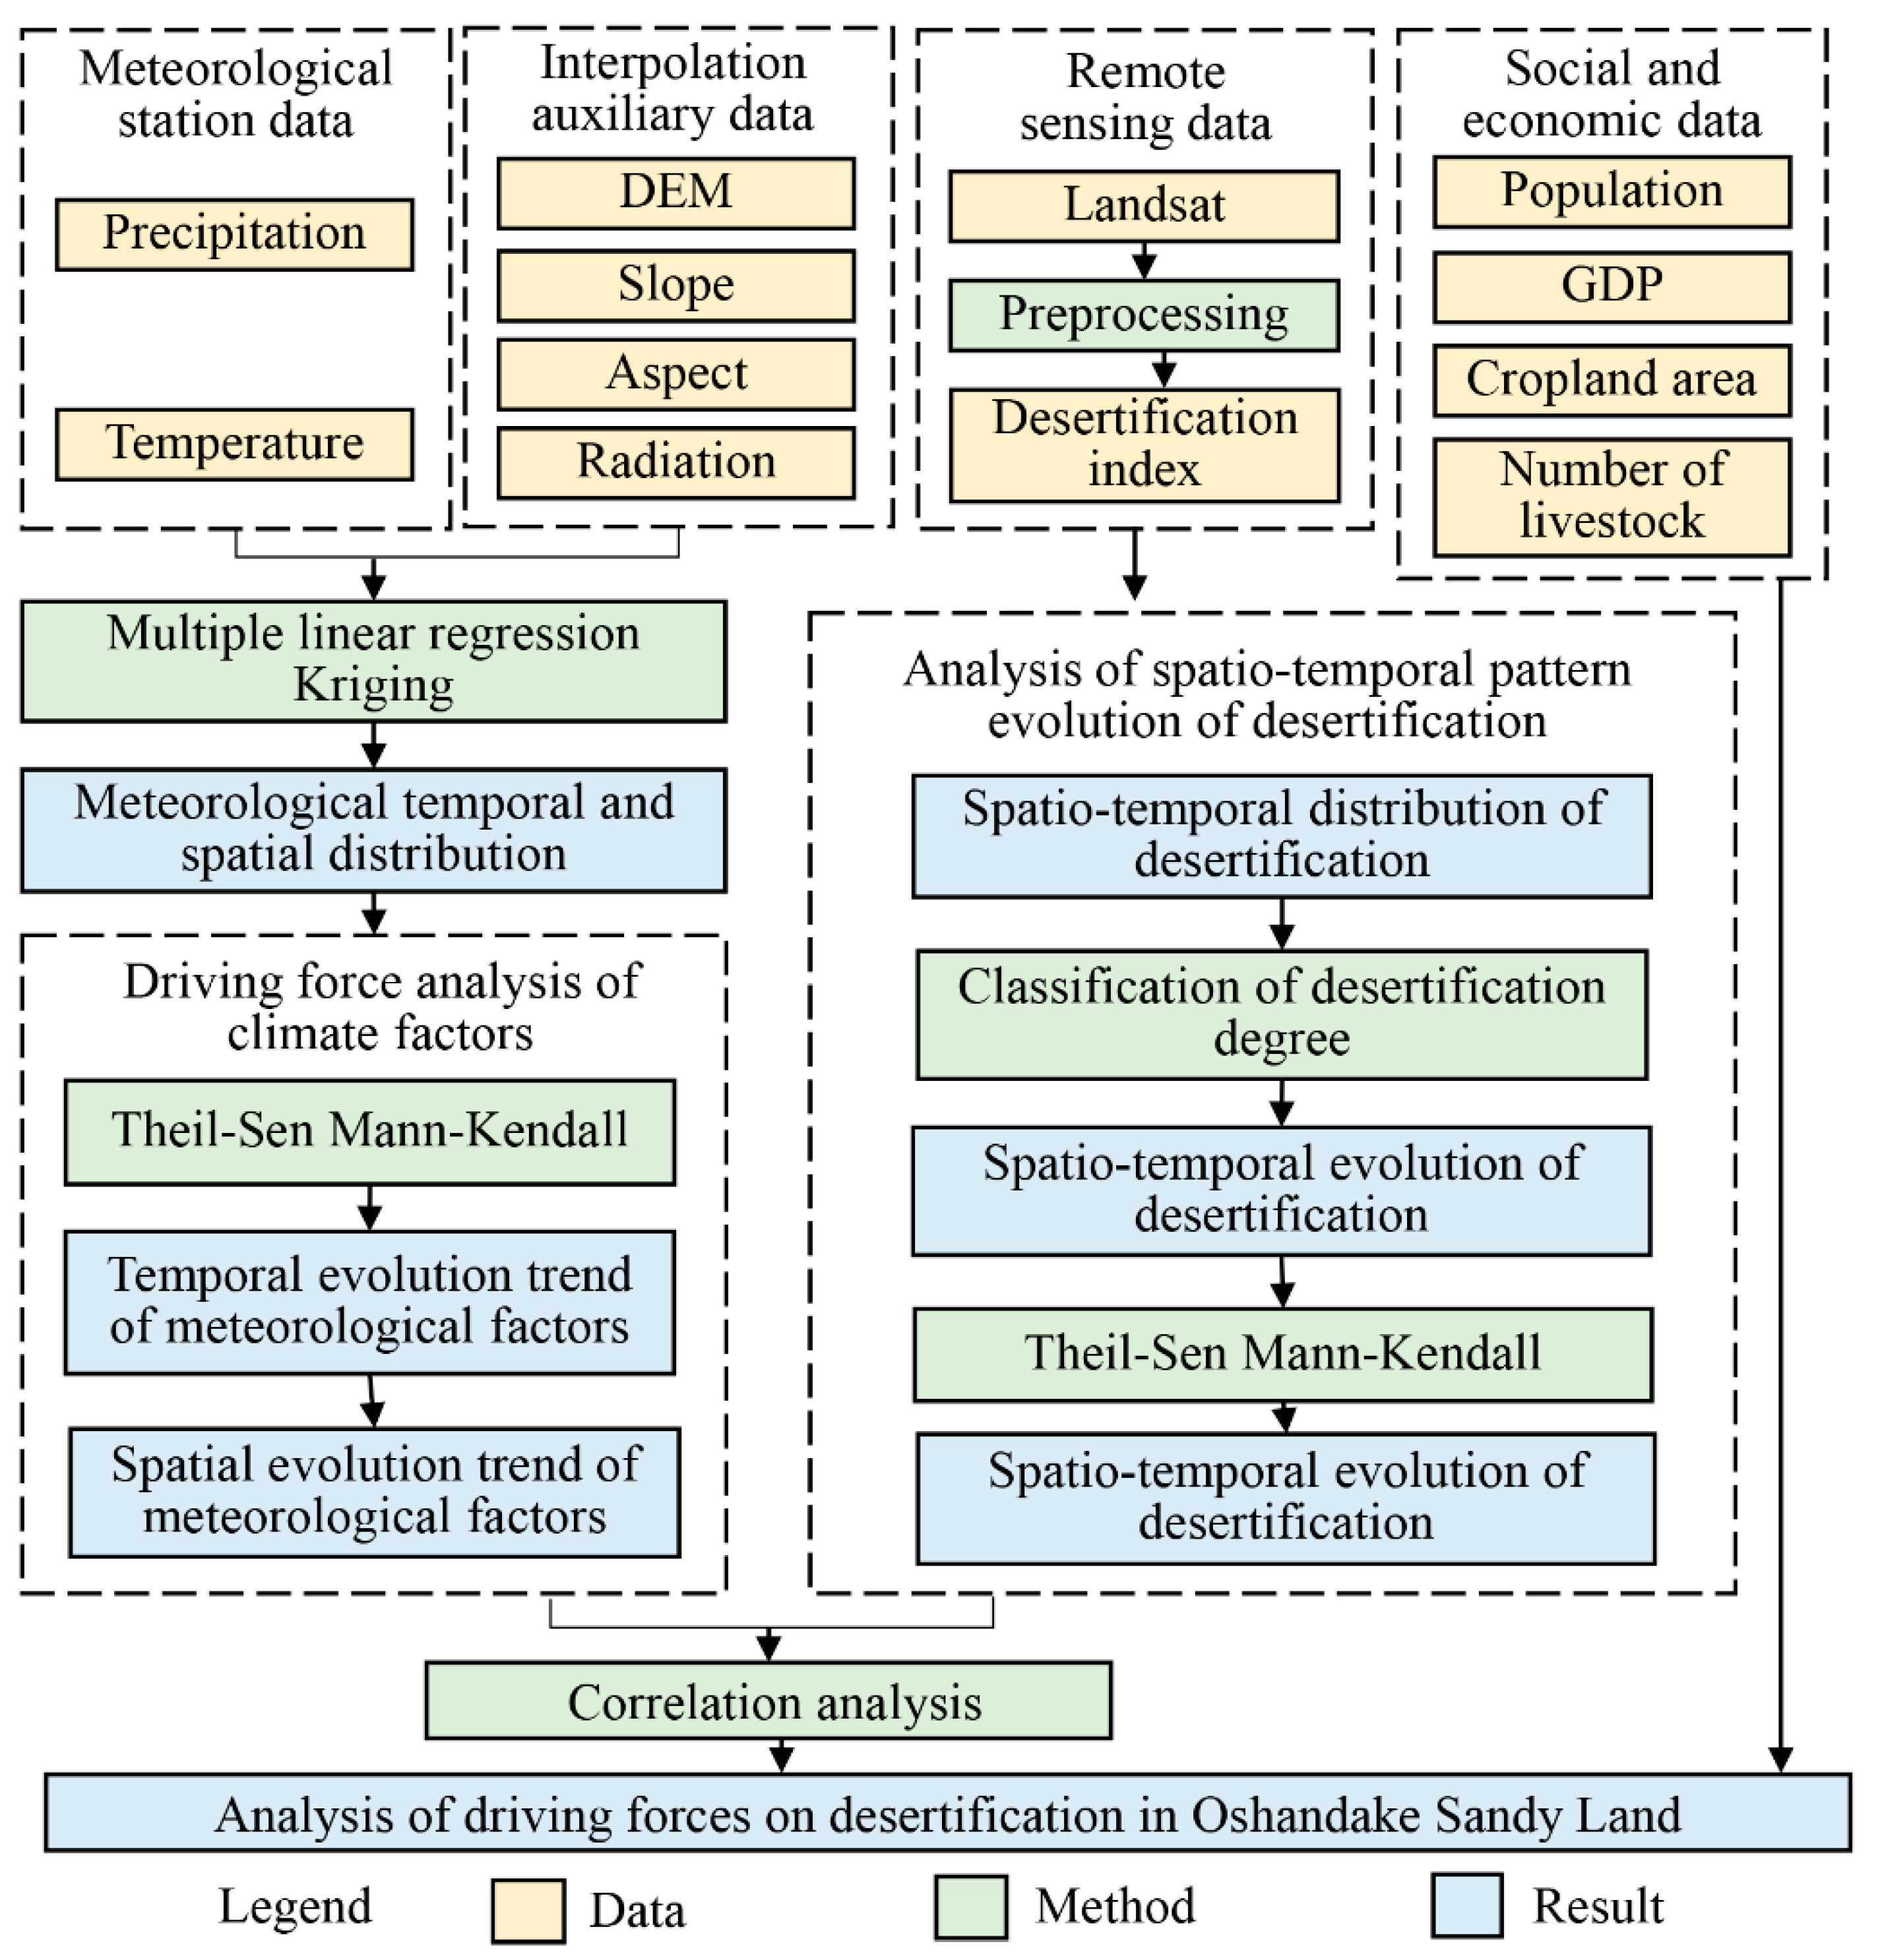
2. Methodological Framework and Study Area

2.1. Methodological Framework
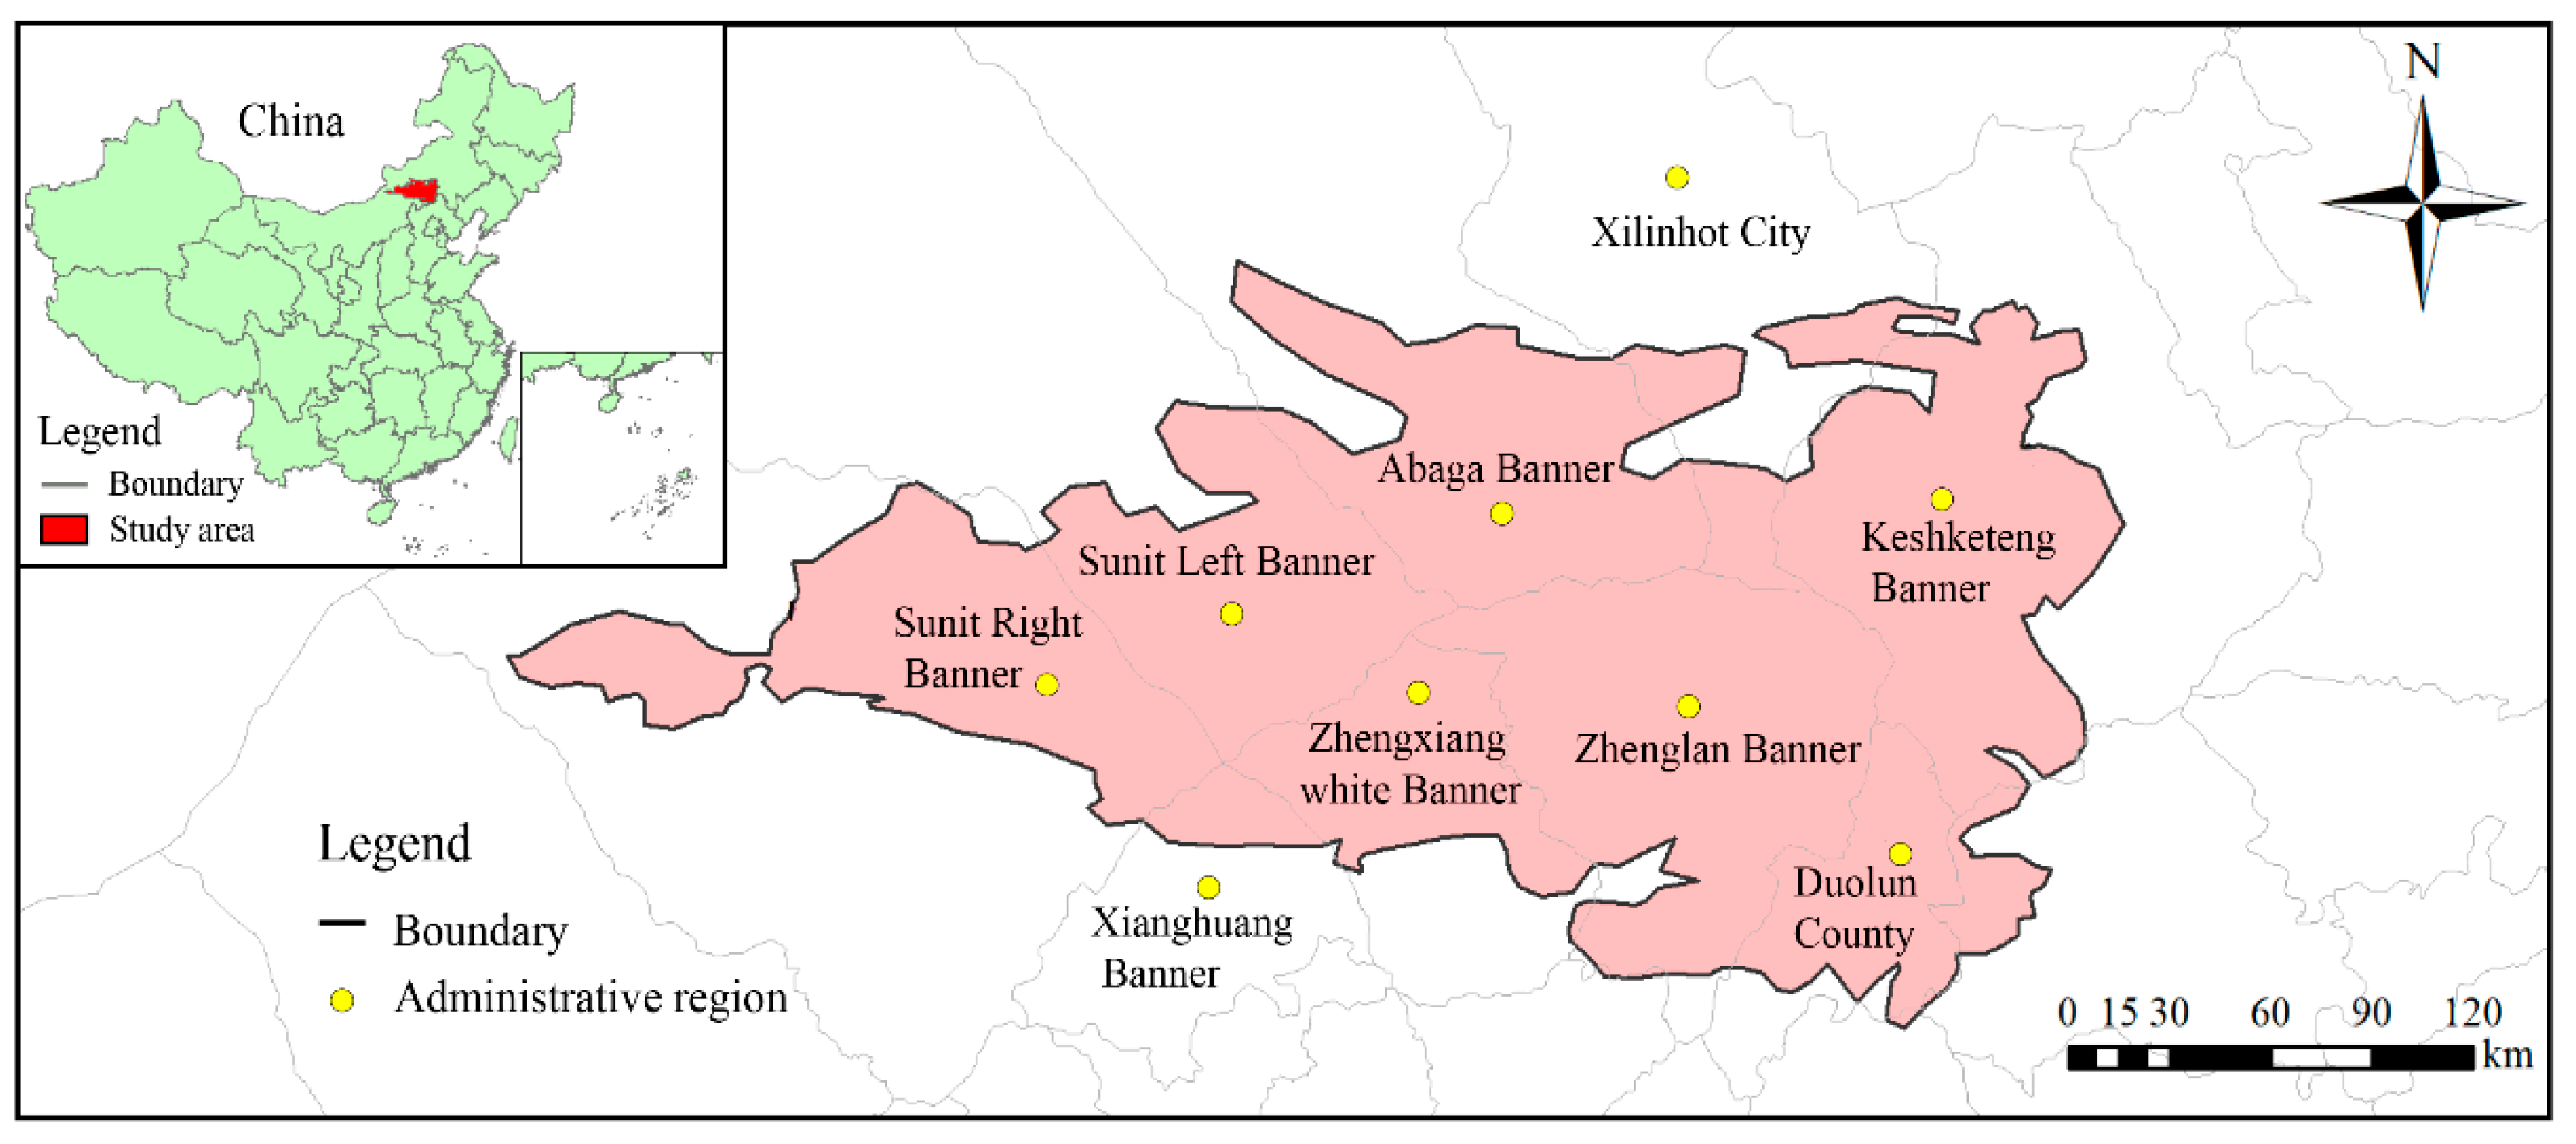
The study collected meteorological, topographic, remote sensing, social and economic data. Using the Landsat remote sensing image data, the desertification index was constructed to represent the desertification situation of the sandy land. The spatio-temporal distribution, evolution and trend of the index were analyzed, and the spatio-temporal evolution law of the sandy land in recent 30 years was obtained. The driving force of desertification was analyzed from two aspects: the meteorological factor and the human activity factor (Figure 1).

2.2. Study Area

Otindag Sandy Land (OSL) (111°27’34.2”E-117°10’46.9”E, 41°10’10.5”N-42°58’30.7”N) is located in the Middle East of Inner Mongolia Plateau [26]. It belongs to the sand land of eastern and northern China, with a total area of 49,000 km2 [27]. The study area possess a temperate continental monsoon climate, with a mean precipitation of approximately 250 to 400 mm and a mean annual evaporation of approximately 1643 to 2969 mm. The annual precipitation is mainly concentrated between July and September, accounting for approximately 80% of the annual precipitation. The annual mean temperature is approximately 0.5 to 3.5 °C. The mean temperature in January is −18.3 °C. The mean temperature in July is 18.7 °C. The number of strong wind days in the whole year is, approximately, between 50 and 80 days. The wind period is between March and May, and the dominant wind direction is northwest wind (Figure 2).
As one of the top ten largest deserts in China, OSL is located in the south end of Xilingol Grassland in central Inner Mongolia [28]. It is one of the most serious areas of desertification in China and a typical grassland desertification area. The sandy land is located in the arid and semi-arid grassland area. Desertification has increased the sensitivity of the originally fragile ecosystem and poor ecological environment. OSL is a part of the agricultural and pastoral ecotone in northern China [29]. The development of desertification has seriously affected the development of the local social economy. The development of local animal husbandry depends on the good and stable ecological environment; however, it also promotes the process of desertification. In addition, OSL is 180 km away from Beijing, the capital of China. It is an important part of the northern ecological barrier of the “Beijing-Tianjin-Hebei Region” [30]. Grassland desertification destroys its important function as the northern ecological barrier, making it one of the dust source areas of dust storms in Beijing and Tianjin. The vegetation of OSL is dominated by Stipa grandis, Stipa hirylovi, Leymus chinensis, Agropyron cristatum zonal vegetation, elmus pumila, Caragana sinica, Tamarix chinensis, Salix gordejevi, Artemisia halodendron and other sandy vegetation.

3. Data and Methods

3.1. Data Preprocessing and Collection

The Landsat-5 Thematic Mapper images, Landsat-7 Enhanced Thematic Mapper Plus and Landsat-8 Operational Land images were acquired on the few clouds in summer, between 1986 and 2016, for OSL (path 30–31 and row 123–127), with a spatial resolution of 30 m (http://earthexplorer.usgs.gov/, accessed on 7 March 2022). Data preprocessing includes radiometric correction, geometric correction, mosaic, clipping and spatial projection. The meteorological data included the daily data (temperature and precipitation) of 43 meteorological stations in and around OSL (http://cdc.cma.gov.cn, accessed on 7 March 2022). The socio-economic data comes from the Inner Mongolia statistical yearbook between 1985 and 2017 (IMARBS, 1985–2015.), including the year-end population data, gross national product, cropland area and livestock number (livestock quantity, large livestock and sheep).

3.2. Research Methods

3.2.1. Desertification Index

In the grassland desertification area, the distribution of vegetation and desertification are oppositional, which can reflect the desertification indirectly by reflecting the vegetation status. The normalized difference vegetation index (NDVI) was used to calculate the vegetation coverage [31,32], and the desertification index ( D d e s ) was obtained to characterize the degree of desertification in the study area. The formula is as follows:
N D V I = R 2 R 1 / R 2 + R 1
V v e g = N N s o i l / N v e g + N s o i l
D d e s = 1 V v e g
In Equations (1)–(3), R 2 is the reflectance in the near infrared band; R 1 is the reflectivity of the red band; N s o i l is the NDVI value of bare soil or non-vegetation covered pixels; N v e g represents the NDVI value of pixels completely covered by vegetation. V v e g is vegetation coverage; D d e s is the desertification index. D d e s is divided into five grades: I (<0.15), II (0.15–0.45), III (0.45–0.65), III (0.65–0.85) and IV (>0.85), representing non-desertification (ND), mild desertification (MD), moderate desertification (MOD), severe desertification (SD) and extremely severe desertification (ESD), respectively.

3.2.2. Theil-Sen Median Trend Analysis

Theil-sen Median trend analysis is a method to fit lines to sampling points in the plane, steadily, by selecting the Median slope of all of the lines of paired points. Its advantage is that it is not interfered by outliers and does not require samples to follow a certain distribution, so it can better avoid errors and outlier data [33,34]. The formula is as follows:
T S e n = M e d i a n D d e s j D d e s i j i ,           1985 i < j 2016
In Equation (4), T S e n is the trend in desertification change; D d e s j is the D d e s of the jth year; and D d e s i is the D d e s of the ith year. If T S e n > 0, D d e s is increasing, indicating desertification improvement or recovery. If T S e n < 0, the D d e s is decreasing, indicating desertification degradation.

3.2.3. Mann–Kendall Test

The Mann–Kendall test is a non-parametric test method, also known as the non-distribution test, which is used to judge the significance of trends. It has been widely used to analyze the trend changes of hydrological and meteorological time series and to study the trend changes of vegetation annual series. Its samples have no specific distribution requirements, and its results free from the interference of outliers. [35,36]. The formula is as follows:
Set D d e s j , where j = 1986, 2000, …, 2016. The V statistic can be defined as:
V = S 1 s S ,           S > 0 0 ,                   S = 0 S + 1 s S ,           S < 0
S = j = 1 n 1 i = j + 1 n s g n D d e s j D d e s i
s S = n n 1 2 n + 5 18
s g n D d e s j D d e s i = 1 ,             D d e s j D d e s i > 0 0 ,             D d e s j D d e s i = 0 1 ,             D d e s j D d e s i < 0
In Equations (5)–(8), D d e s i and D d e s j represent the D d e s of pixel i and j years, respectively; n is the length of the time series. The sgn is a sign function. The value of the V statistic is in the range of (−∞, +∞). When |V| is greater than V1−α/2 at a given significance level α, there is a significant change in the time series at the ⍺ level. In this study, α = 0.05 was used to assess the significance of the pattern in the regional NDVI change between 1986 and 2016 when |V| > 1.96 at the confidence level of 0.05.

3.2.4. Meteorological Data Interpolation

The required meteorological data were spatially interpolated using the multiple linear regression Kriging (MLRK) method. By establishing the multiple linear regression relationship between the precipitation and mean temperature and interpolation auxiliary factors, the residuals of the real value and predicted value were obtained. The kriging spatial interpolation method was used to carry out the spatial interpolation of the residual values, and the residual interpolation results of the regions to be predicted were added to the predicted values of the linear regression to obtain the final interpolation results [37]. The formula is as follows:
Z ^ s 0 = k = 0 ρ β ^ k q k s 0 + i = 1 n λ i e s i
where Z ^ s 0 represents the interpolation results of the predicted position points; k = 0 ρ β ^ k q k s 0 is the deterministic part of the regression fitting; i = 1 n λ i e s i is the interpolation result of the regression residual by ordinary Kriging; K represents the position serial number during regression fitting; β represents the total number of spatial positions; β ^ k is the coefficient of the regression model, when k = 0 , β ^ 0 is the intercept; i represents the position serial number of the regression residual interpolation, n represents the total number of spatial positions, q k s 0 is the value of the auxiliary variable of the position point prediction, and λ i is the weight of ordinary Kriging interpolation, determined by the spatial correlation structure of the regression residual; e s i is the residual at position s i . In this study, the accuracy discriminant coefficient R2 of the meteorological data is over 90% (Figure A1 and Figure A2).

3.2.5. Correlation Analysis

The Spearman rank correlation was used to reveal the relationship between meteorological factors and human activities and desertification [38,39]. The method is a common non-parametric statistical analysis method used to analyze the correlation between two groups of variables. This method does not require the data required for analysis to conform to the assumption of normality and can avoid the interference of outliers on the analysis results. The formula is as follows:
r = 1 6 i = 1 n R i Q i 2 n n 2 1
where r is the correlation coefficient, and its value is between −1 and 1; r < 0 means relevant, r > 0 means positive correlation, r = 0 means no correlation; n is the data length; i is the ordinal time; Ri and Qi are the numerical order of the two groups of comparison data.

4. Results

4.1. Temporal Variation, Spatial Distribution and Evolution Trend of Desertification Degree

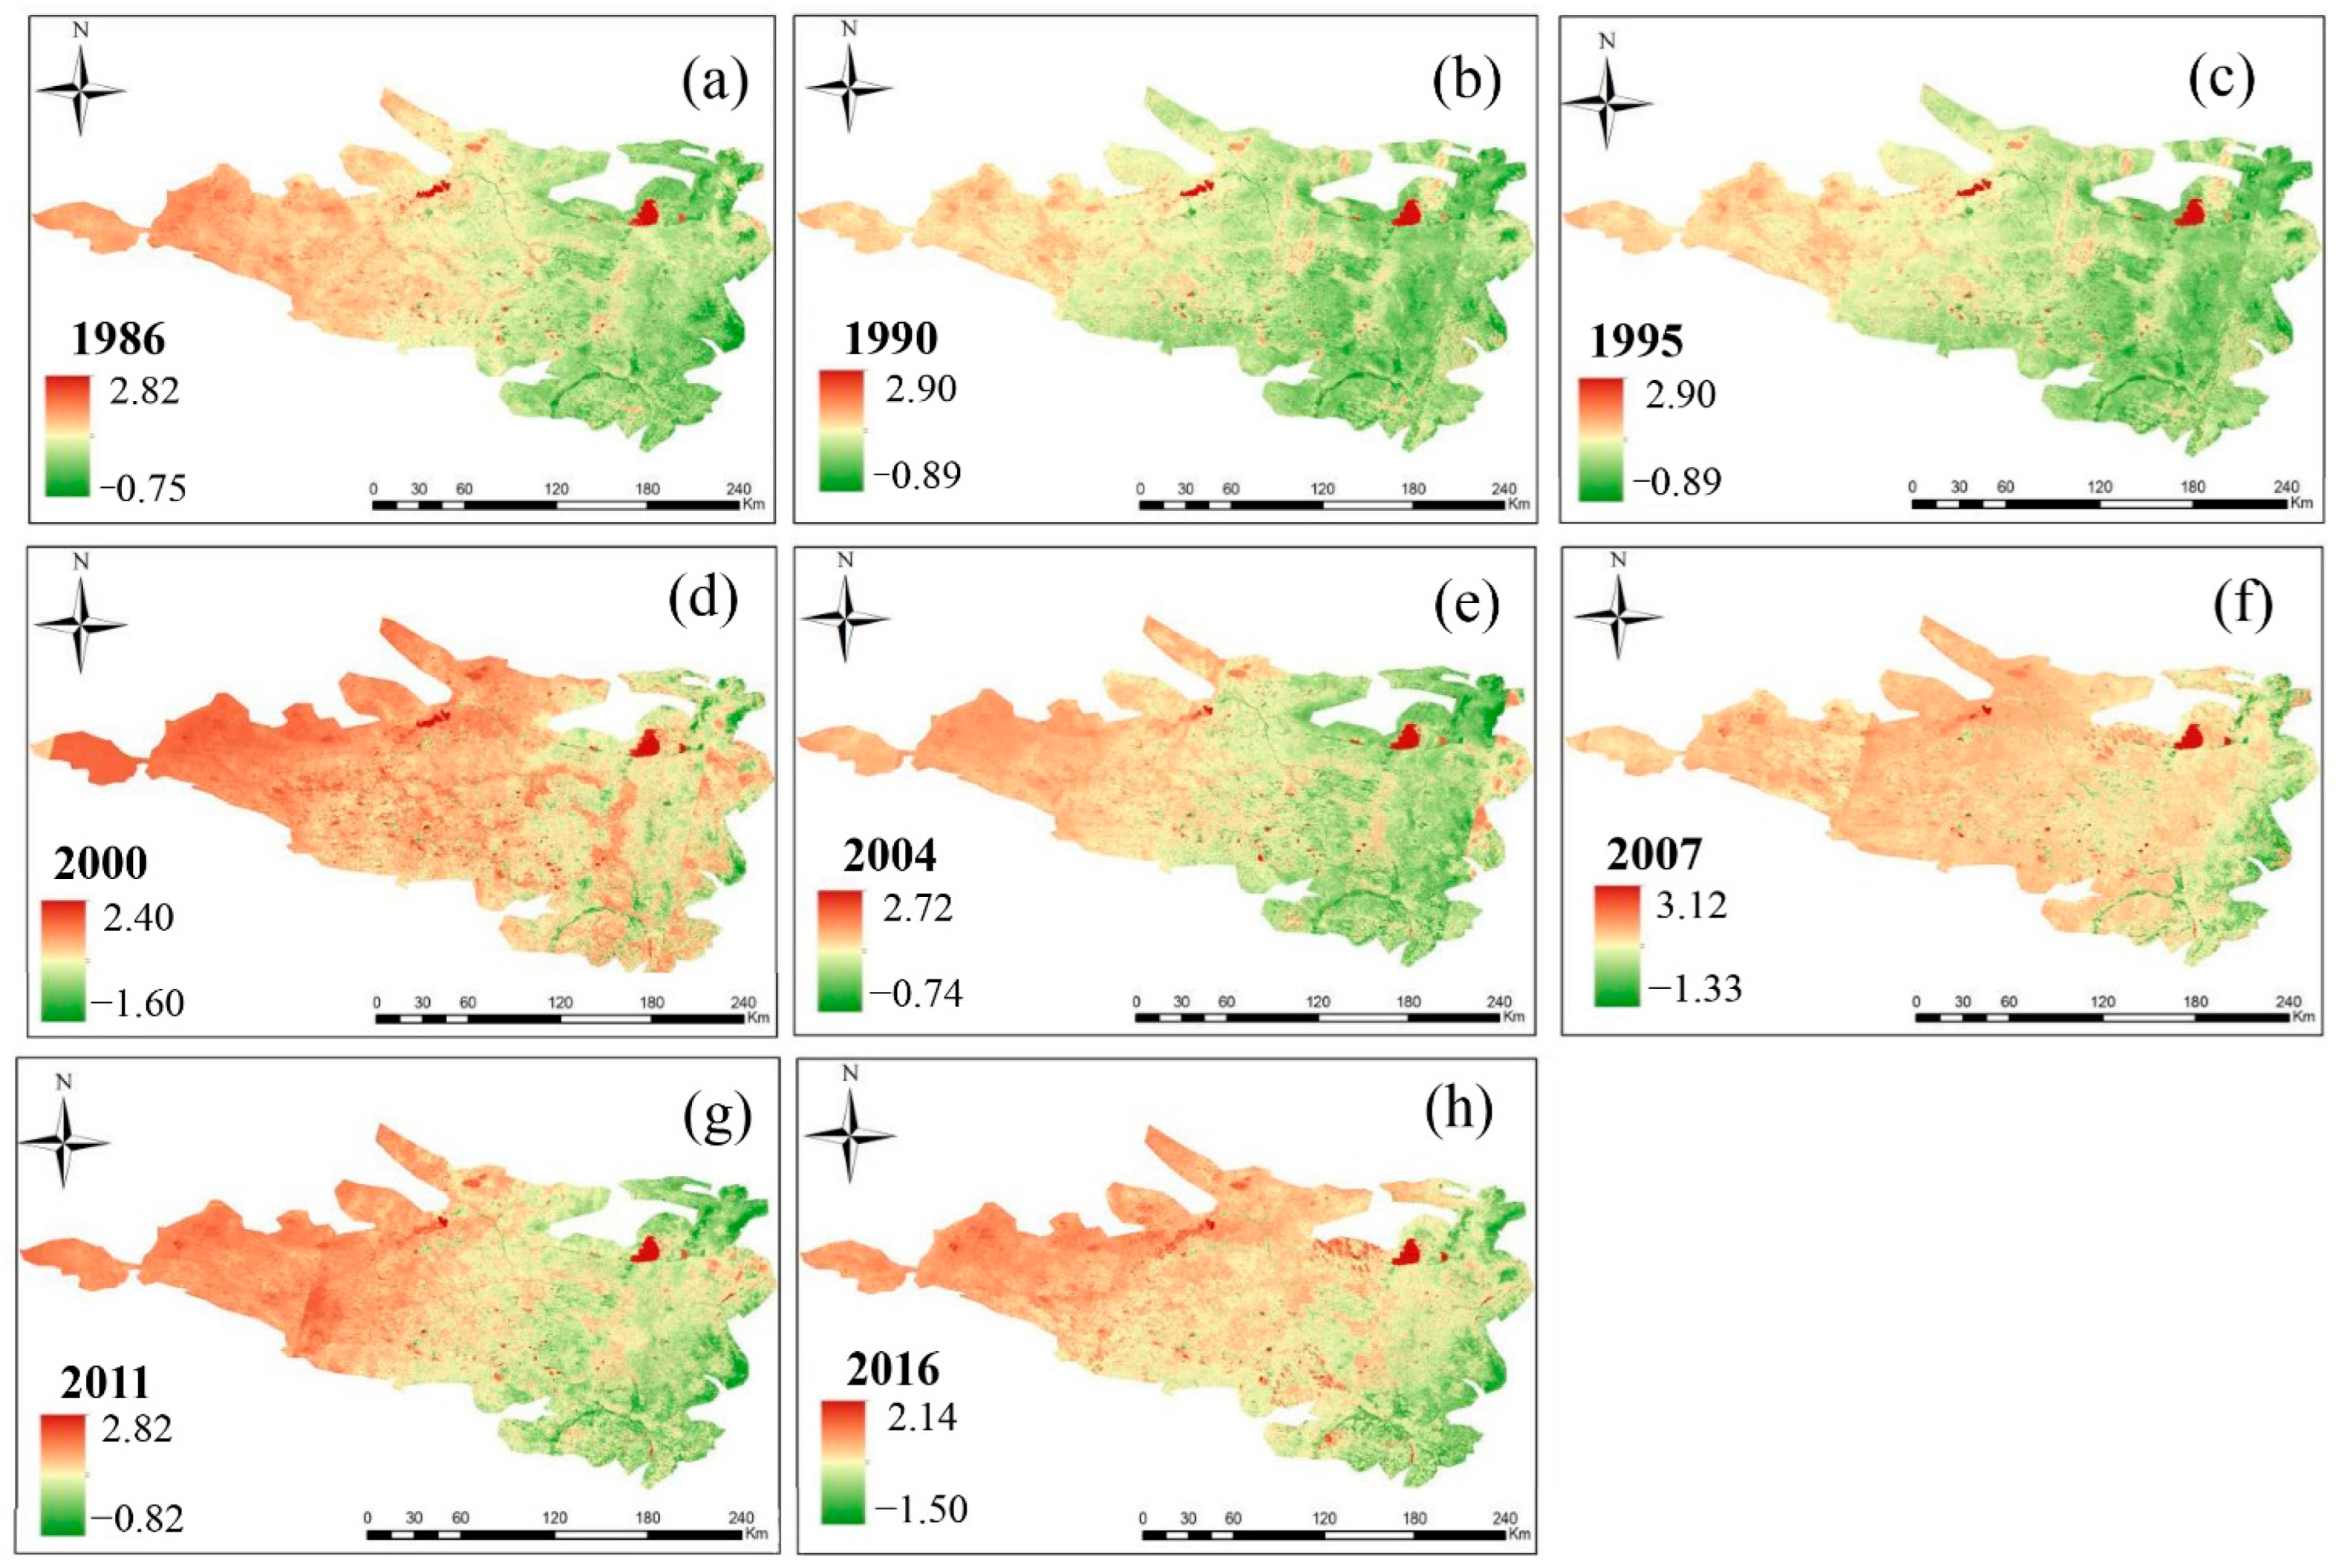
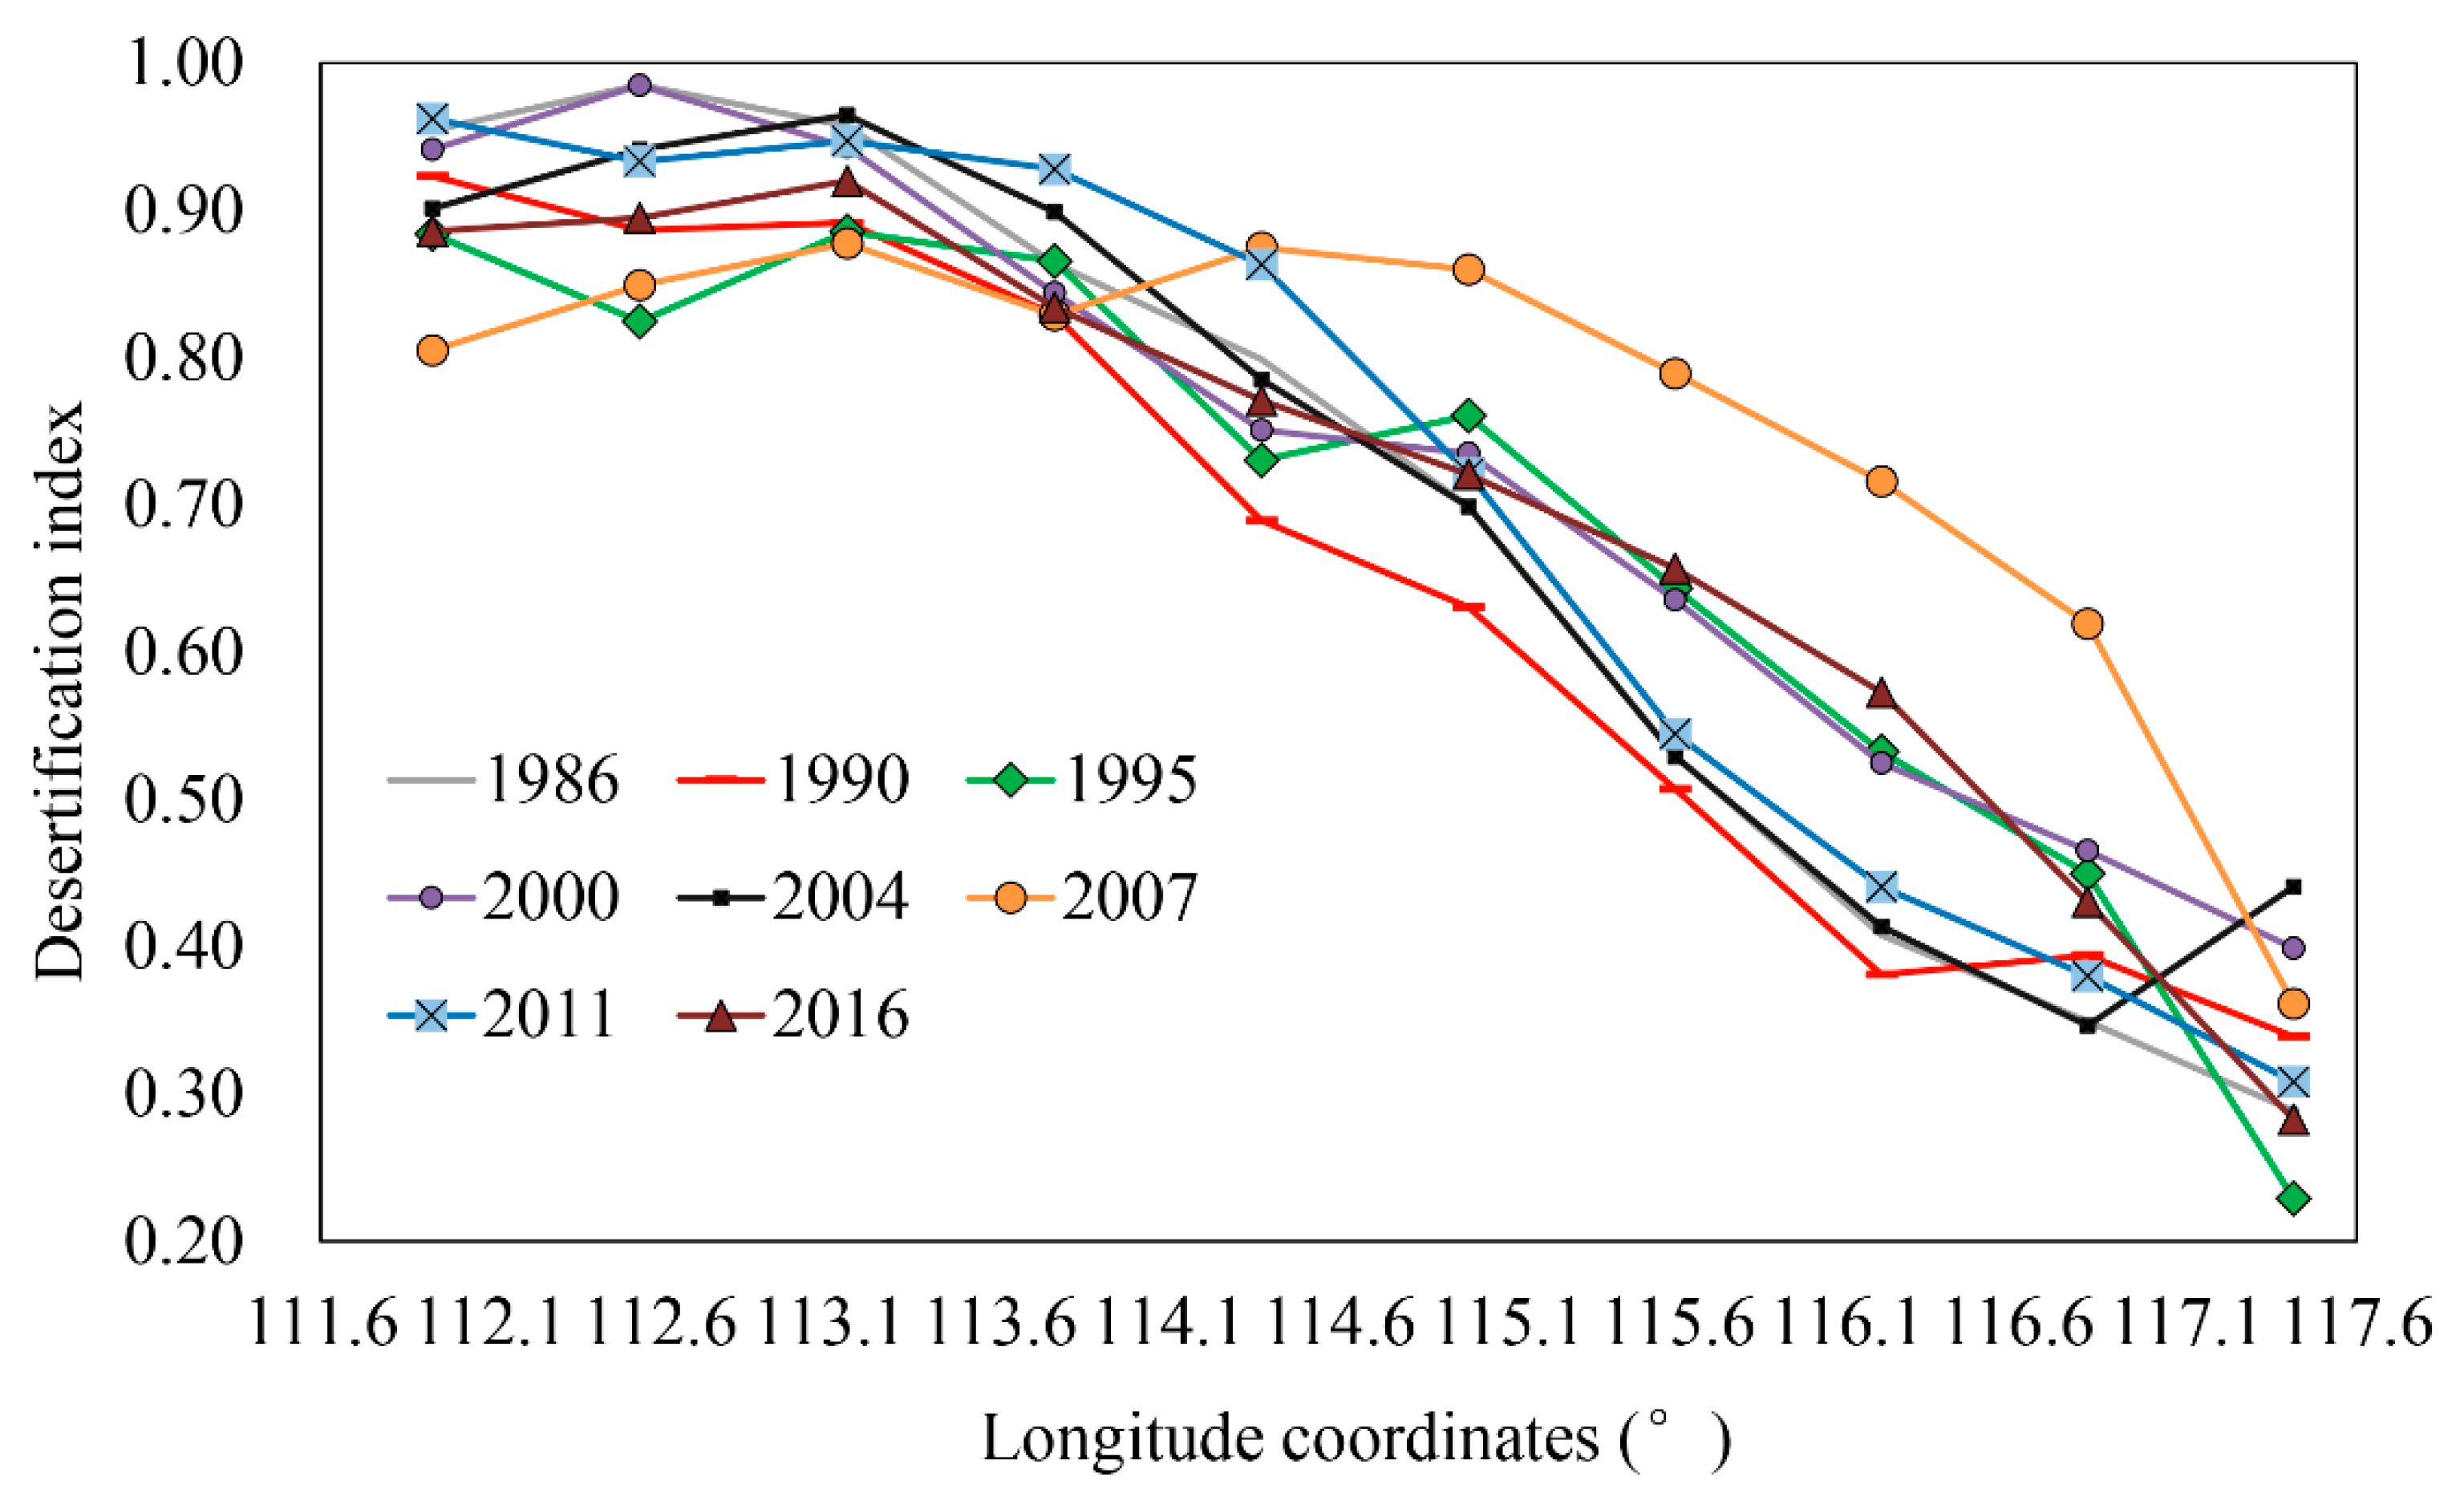
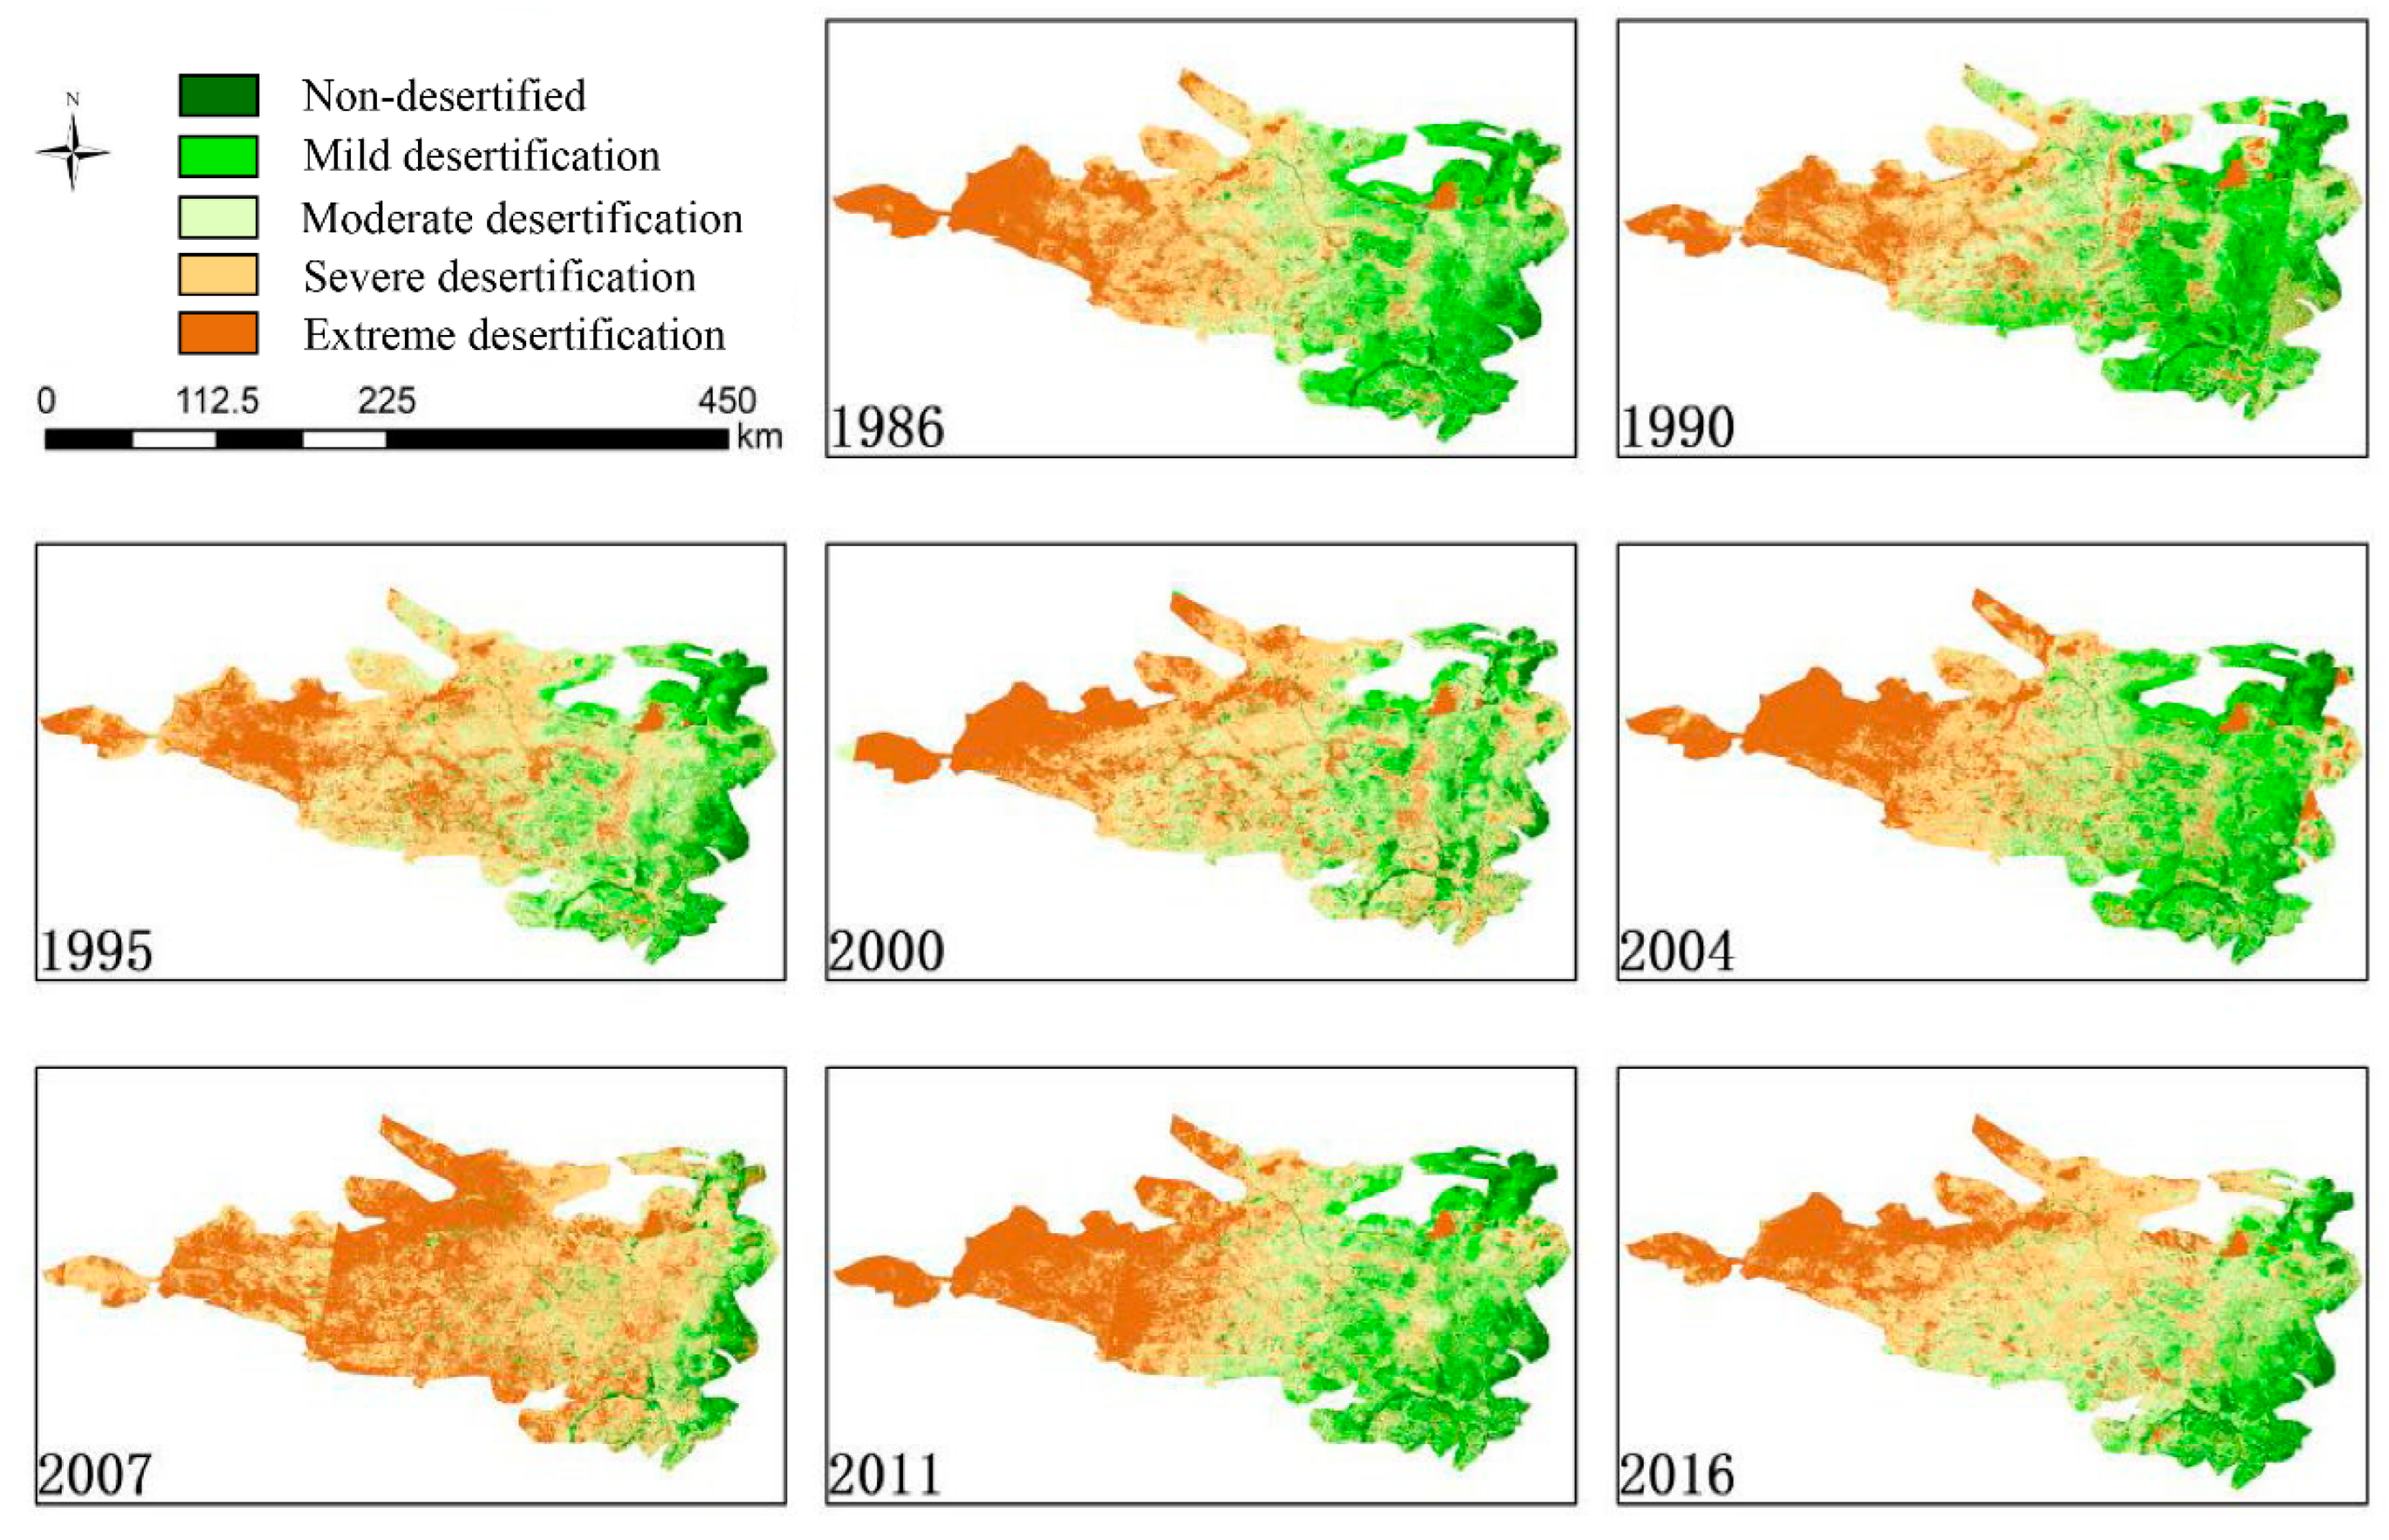
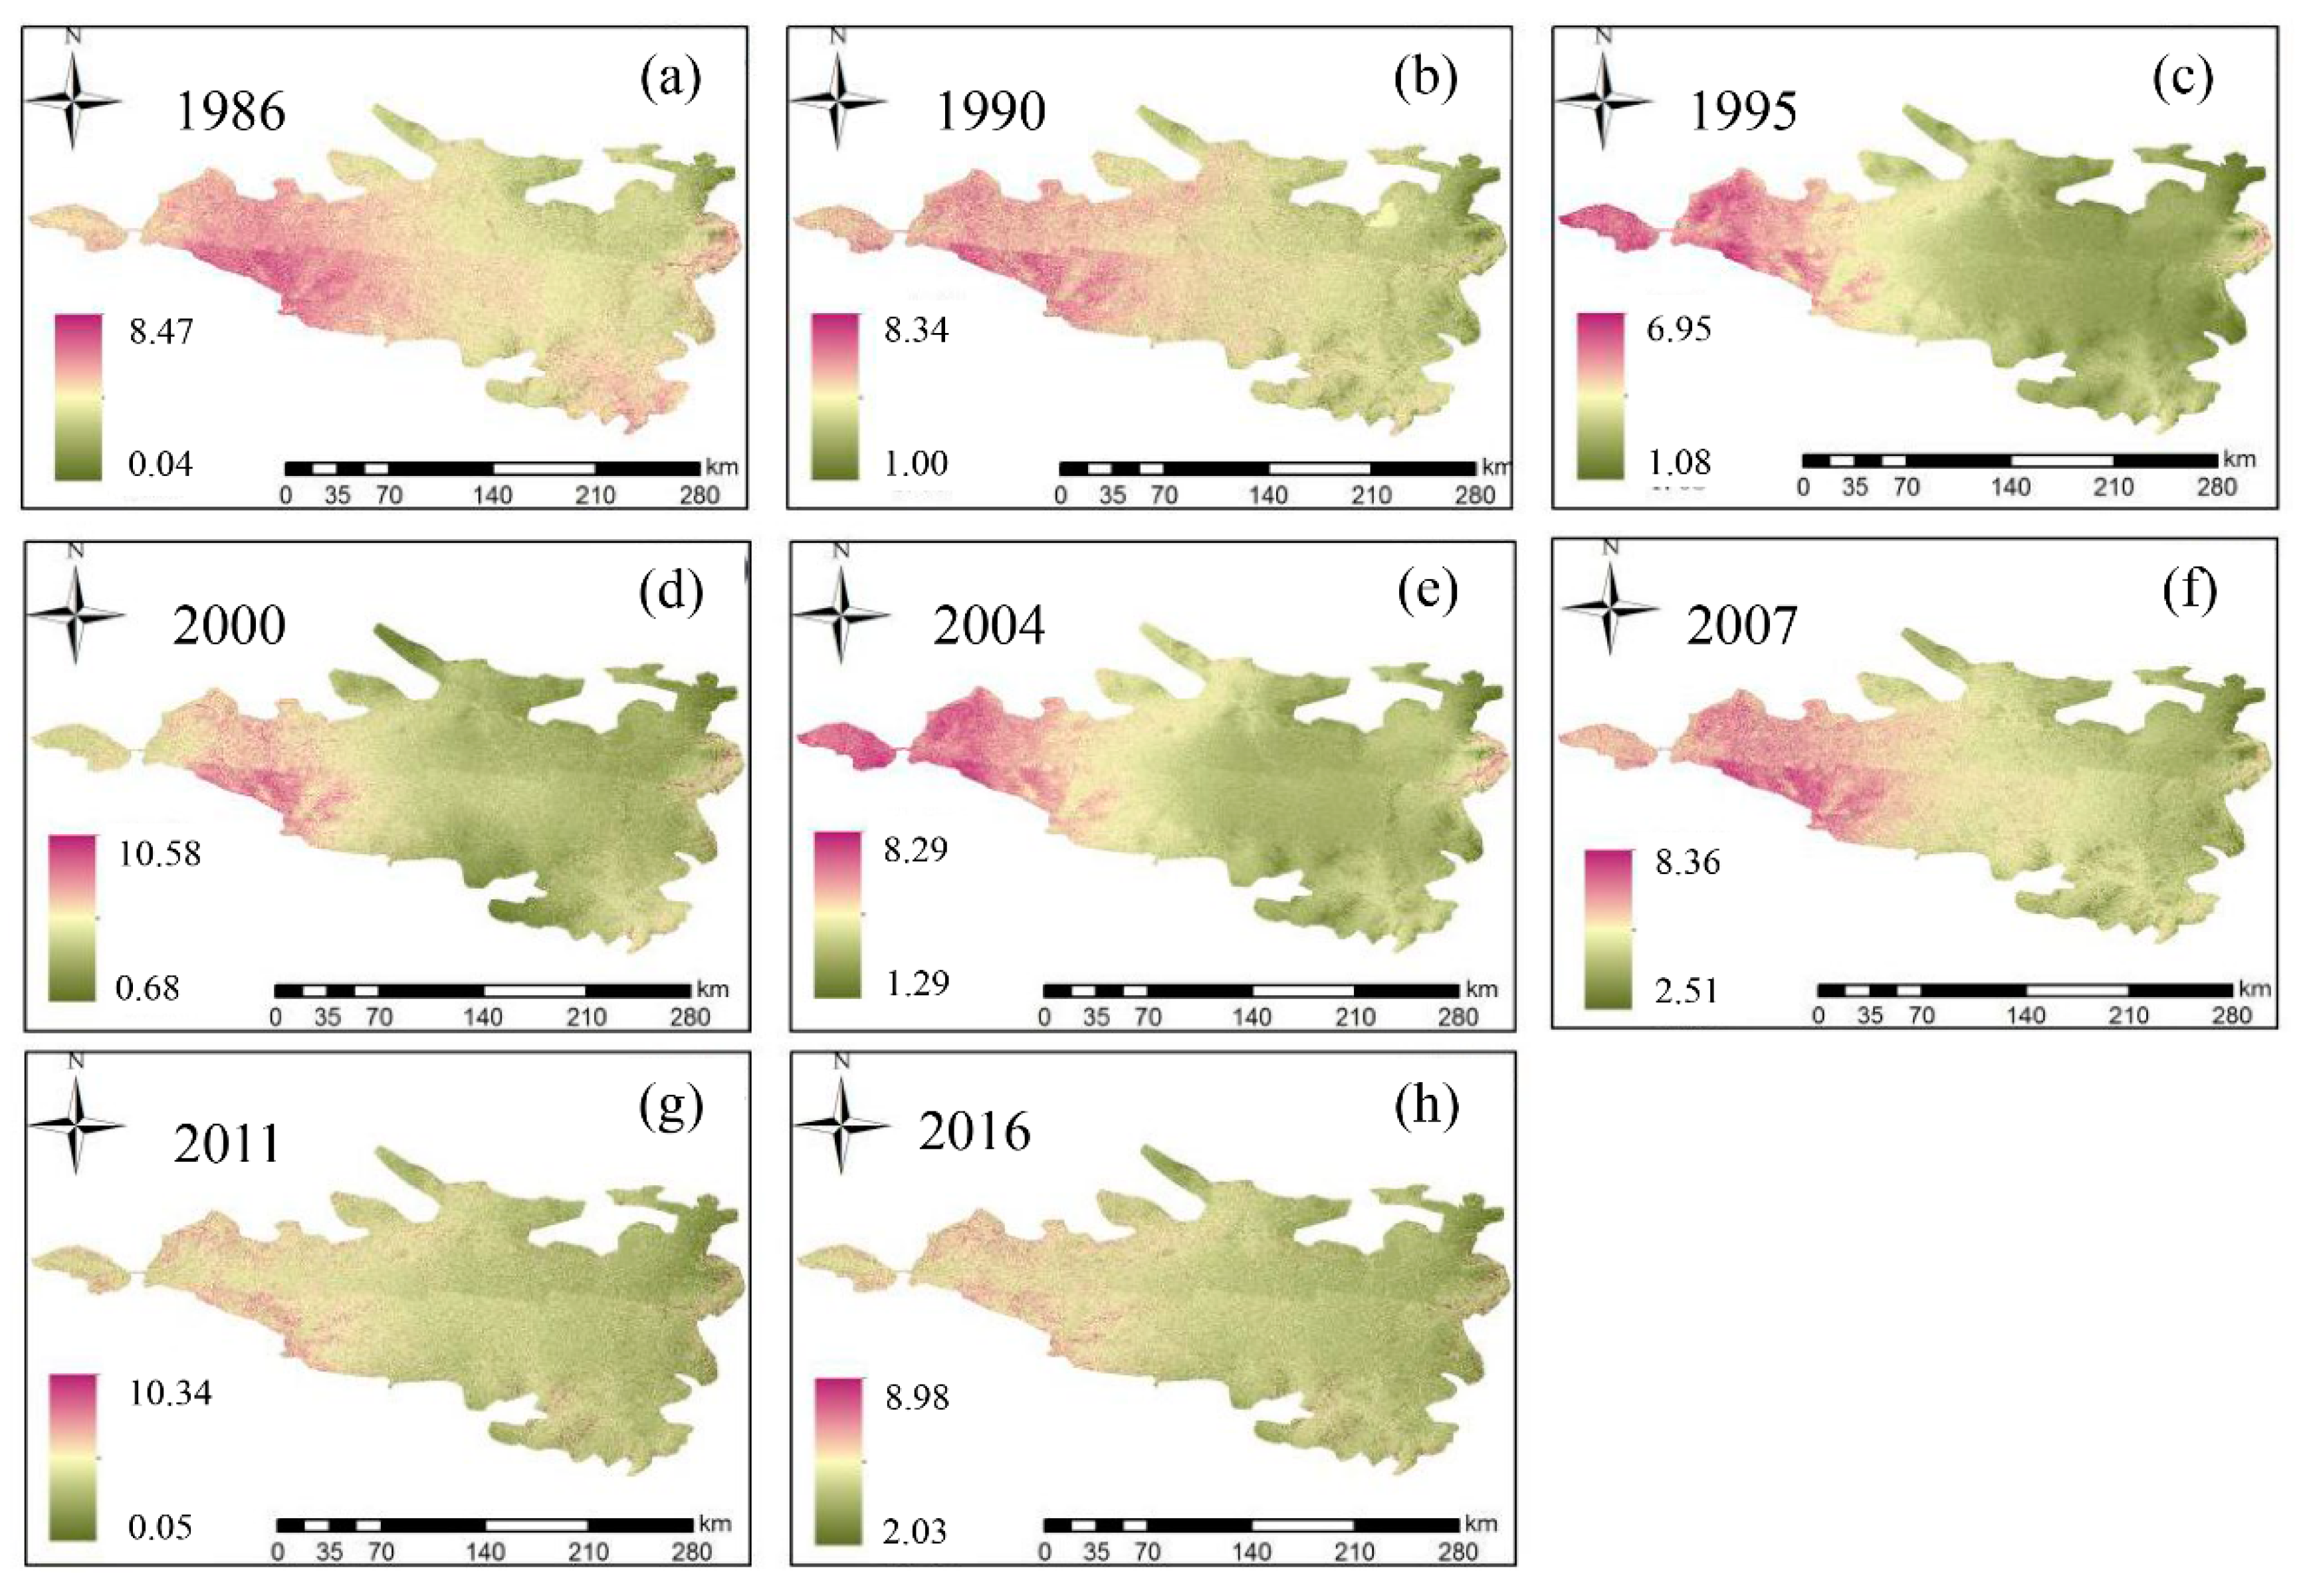
4.1.1. Spatial and Temporal Distribution Pattern of Desertification Degree

In terms of time, the D d e s increased from 0.58, in 1986, to 0.64 in 2016, indicating that the D d e s showed an increasing trend during the study period (Figure 3 and Table 1). The D d e s in 1990 and 2007 were 0.56 and 0.75, respectively, which were the lowest and most serious period. In 2000 and 2007, the desertification degree was relatively high, and the spatial distribution was relatively uniform, and the regional D d e s of each county was more than 0.5, indicating that the desertification degree difference between the eastern and western OSL was small, and the area of desertification expansion was large. In terms of spatial distribution, the study area spans ten equal longitudes (Figure 4), and the spatial distribution of desertification in each period has an obvious decreasing trend from west to east. The results indicated that the desertification degree is high in the western part and low in the eastern part of the OSL in recent 30 years (Figure 3).

4.1.2. Evolutionary Characteristics of Desertification Degree

From 1986 to 1990, the D d e s decreased from 0.58 to 0.56, which was lower than the mean value from 1986 to 2016 of 0.63. SD and ESD decreased by 964.02 km² and 1540.32 km², respectively. The area of ND, MD and MOD increased by 427.5 km², 1285.91 km² and 790.92 km², respectively. From 1990 to 2000, the D d e s increased from 0.56 to 0.64, and the area of ND and MD decreased by 1687.74 km² and 6605.34 km², respectively. MD, SD and ESD increased by 230.87 km², 5016.33 km² and 3045.88 km² respectively (Figure 5 and Table 2).
From 2000 to 2004, the D d e s decreased to 0.60. The area of ND, MD and ESD increased by 1223.82 km², 5241.12 km² and 387.61 km², respectively. MD and SD decreased by 2797.16 km² and 4192.79 km², respectively, indicating that the desertification degree was decreasing as a whole, but the area of ESD increased slightly, indicating that the desertification degree was still aggravating in some regions. From 2007 to 2016, the D d e s decreased to 0.64, and the area of ND, MD and MOD increased by 1081.54 km², 4273.46 km² and 6501.99 km², respectively. SD and ESD decreased by 3758.03 km² and 8098.96 km², respectively (Figure 5 and Table 2).

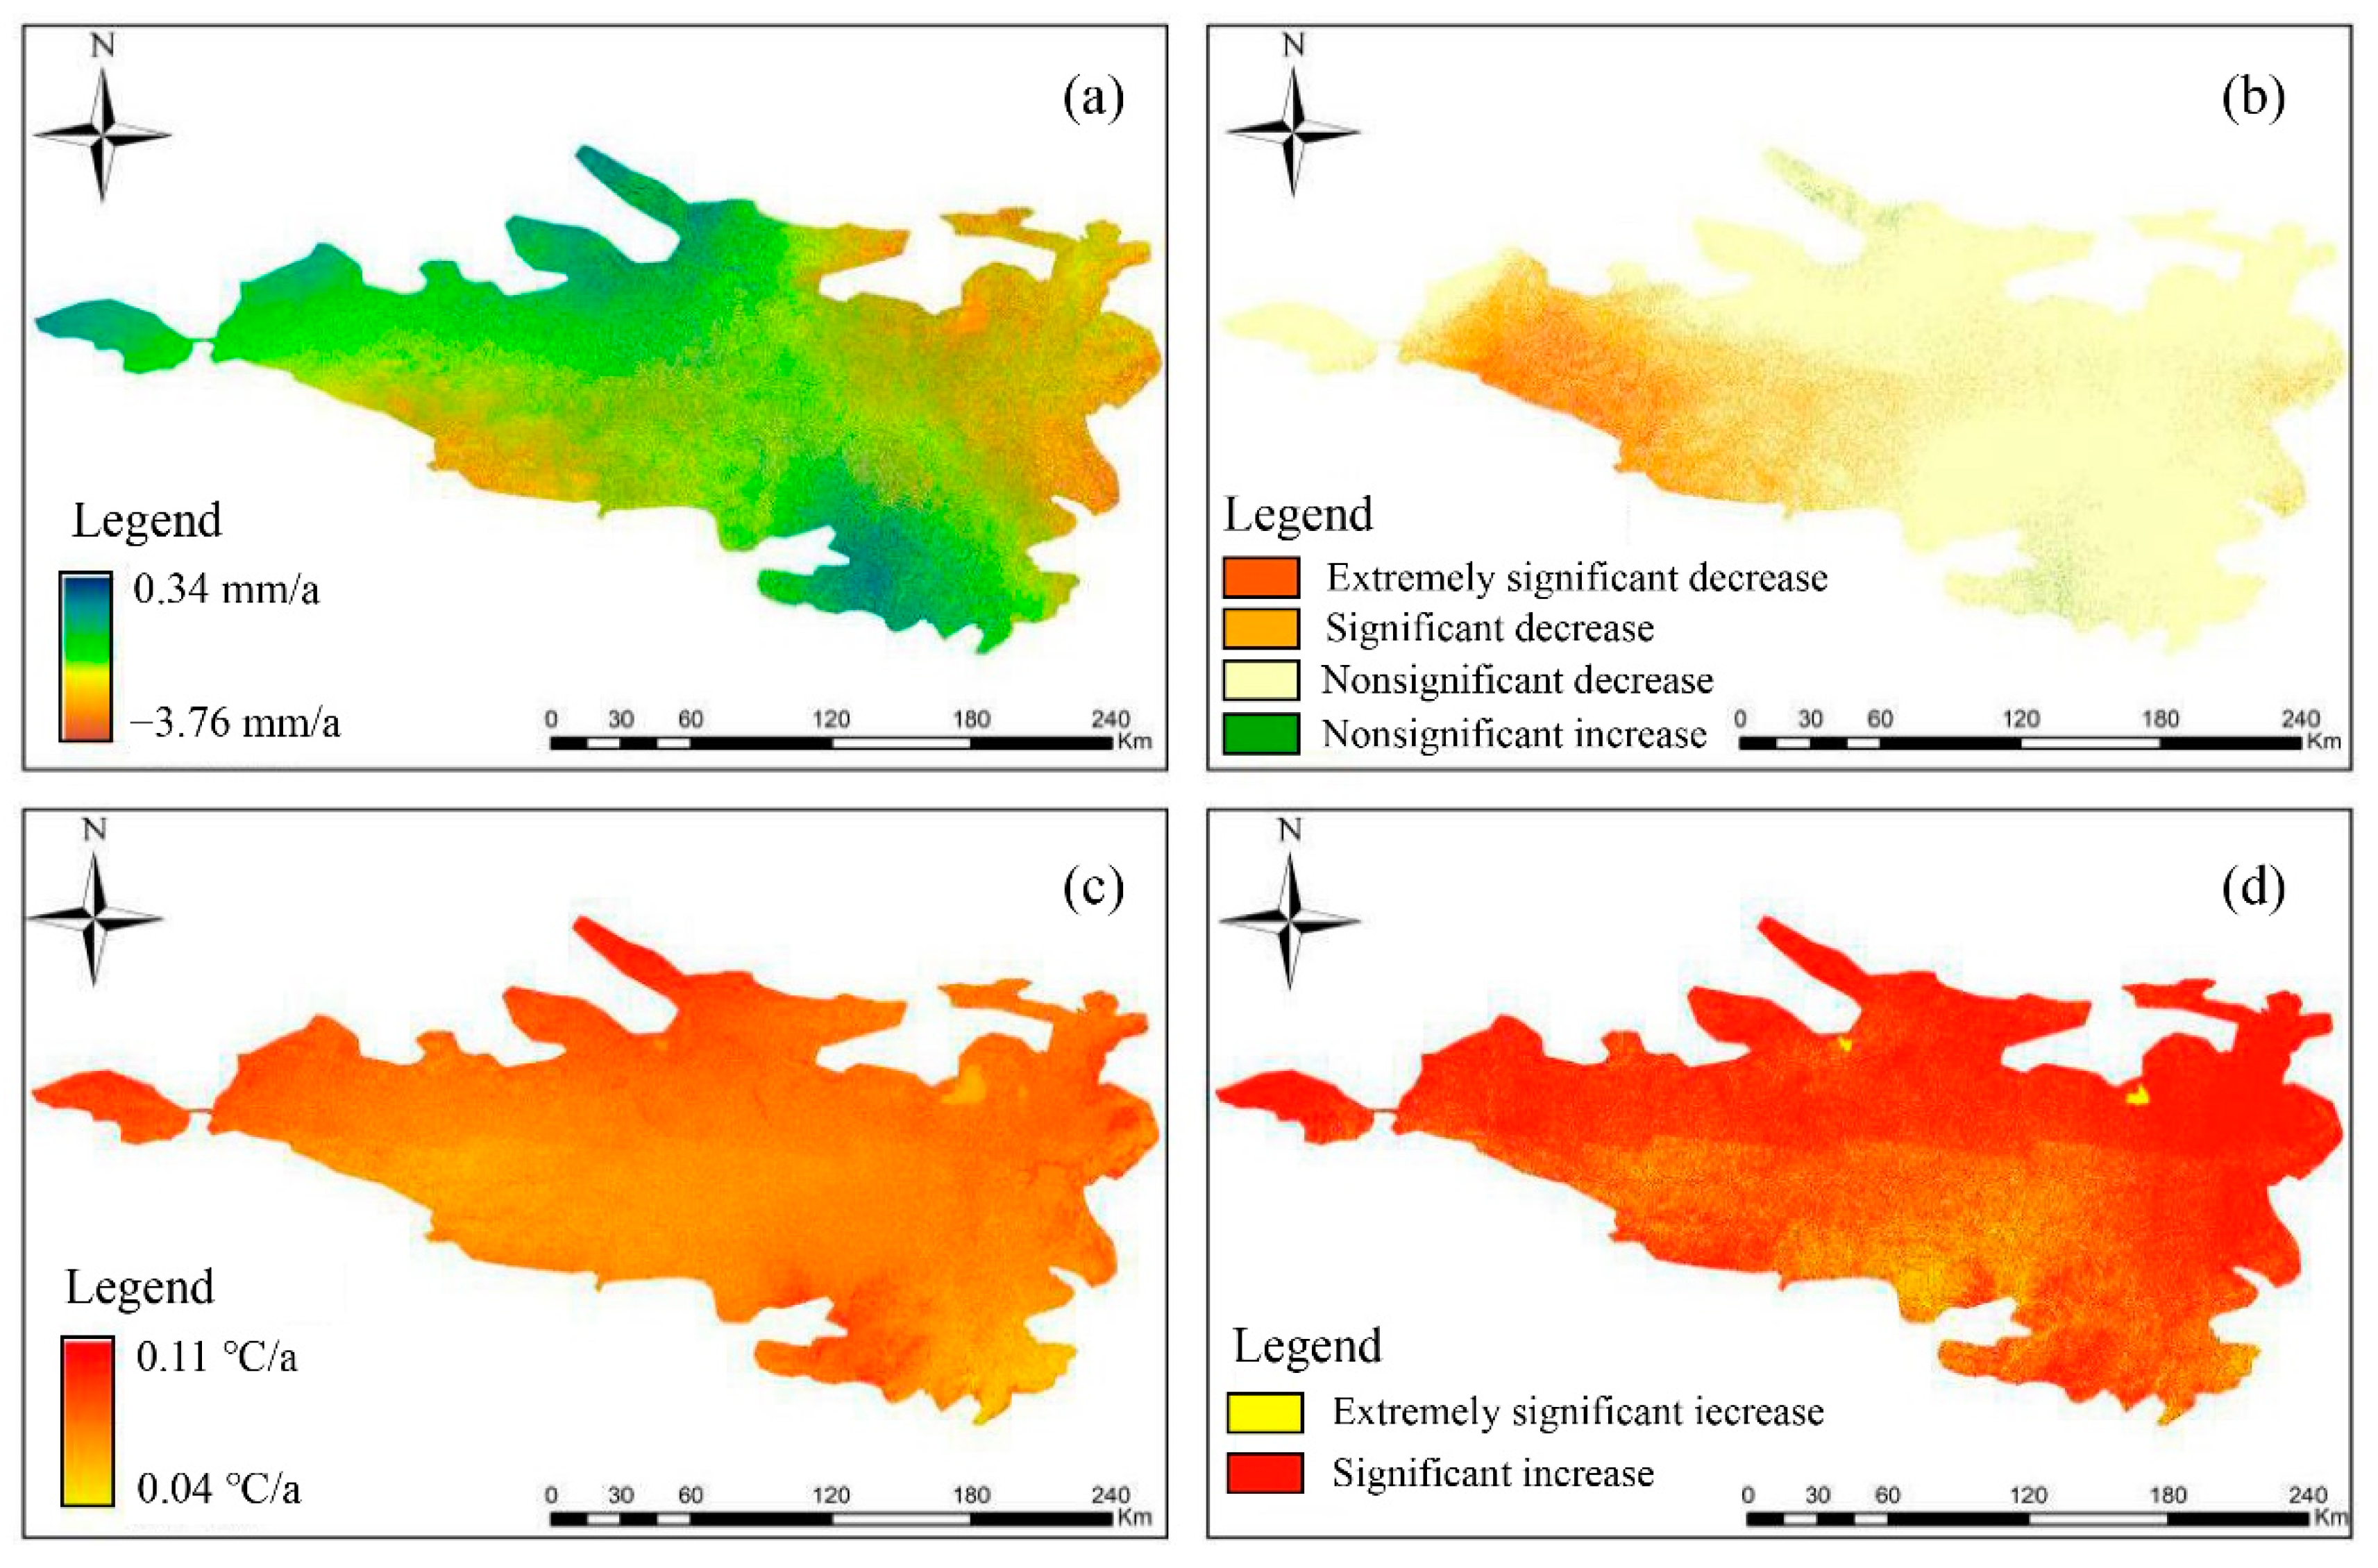
4.1.3. Trend Characteristics of Desertification Degree

The increasing and decreasing trend of desertification in OSL accounted for 70% and 30%, respectively. The areas of non-significant increase, significant increase and extremely significant increase were 23,236.52 km², 5629.07 km² and 3851.14 km², respectively. The areas of non-significant decline, significant decline and extremely significant decline were 10,952.14 km², 1724.09 km² and 1267.26 km², respectively. The types of down trend were dispersed in space, and the only concentrated distribution area was located in the western part of the study area. The distribution range of the rising trend types is wide, and the spatial distribution is relatively uniform, which indicates that the desertification of the sandy land has risen in the last 30 years and the desertification degree is increasing. The desertification of OSL was dominated by a nonsignificant trend (73.27%). The areas with a non-significant decline and rising trend were 10,952.14 km² (23.47%) and 23,236.52 km² (49.80%), respectively, indicating that the ecological environment of OSL has been unstable in the last 30 years (Figure 6 and Table 3).

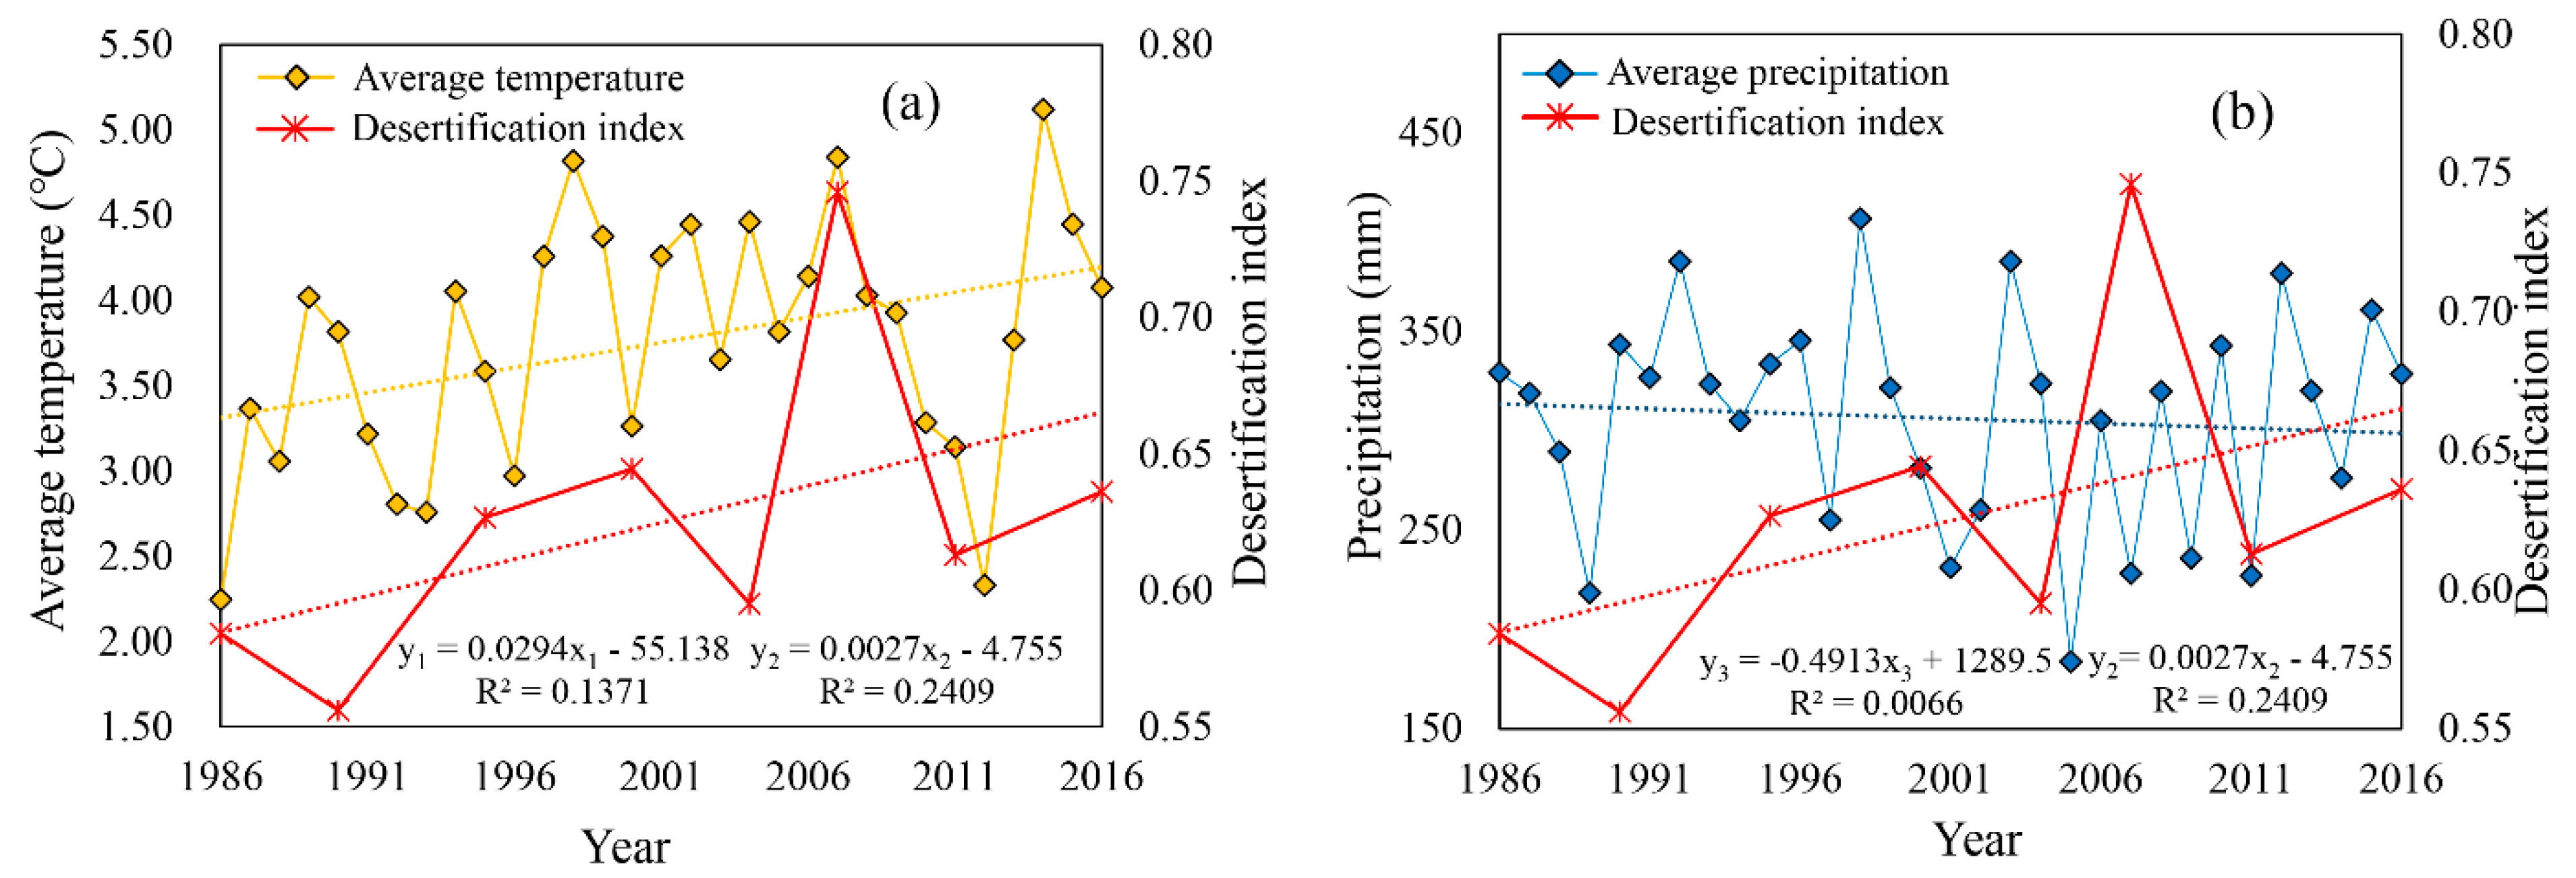
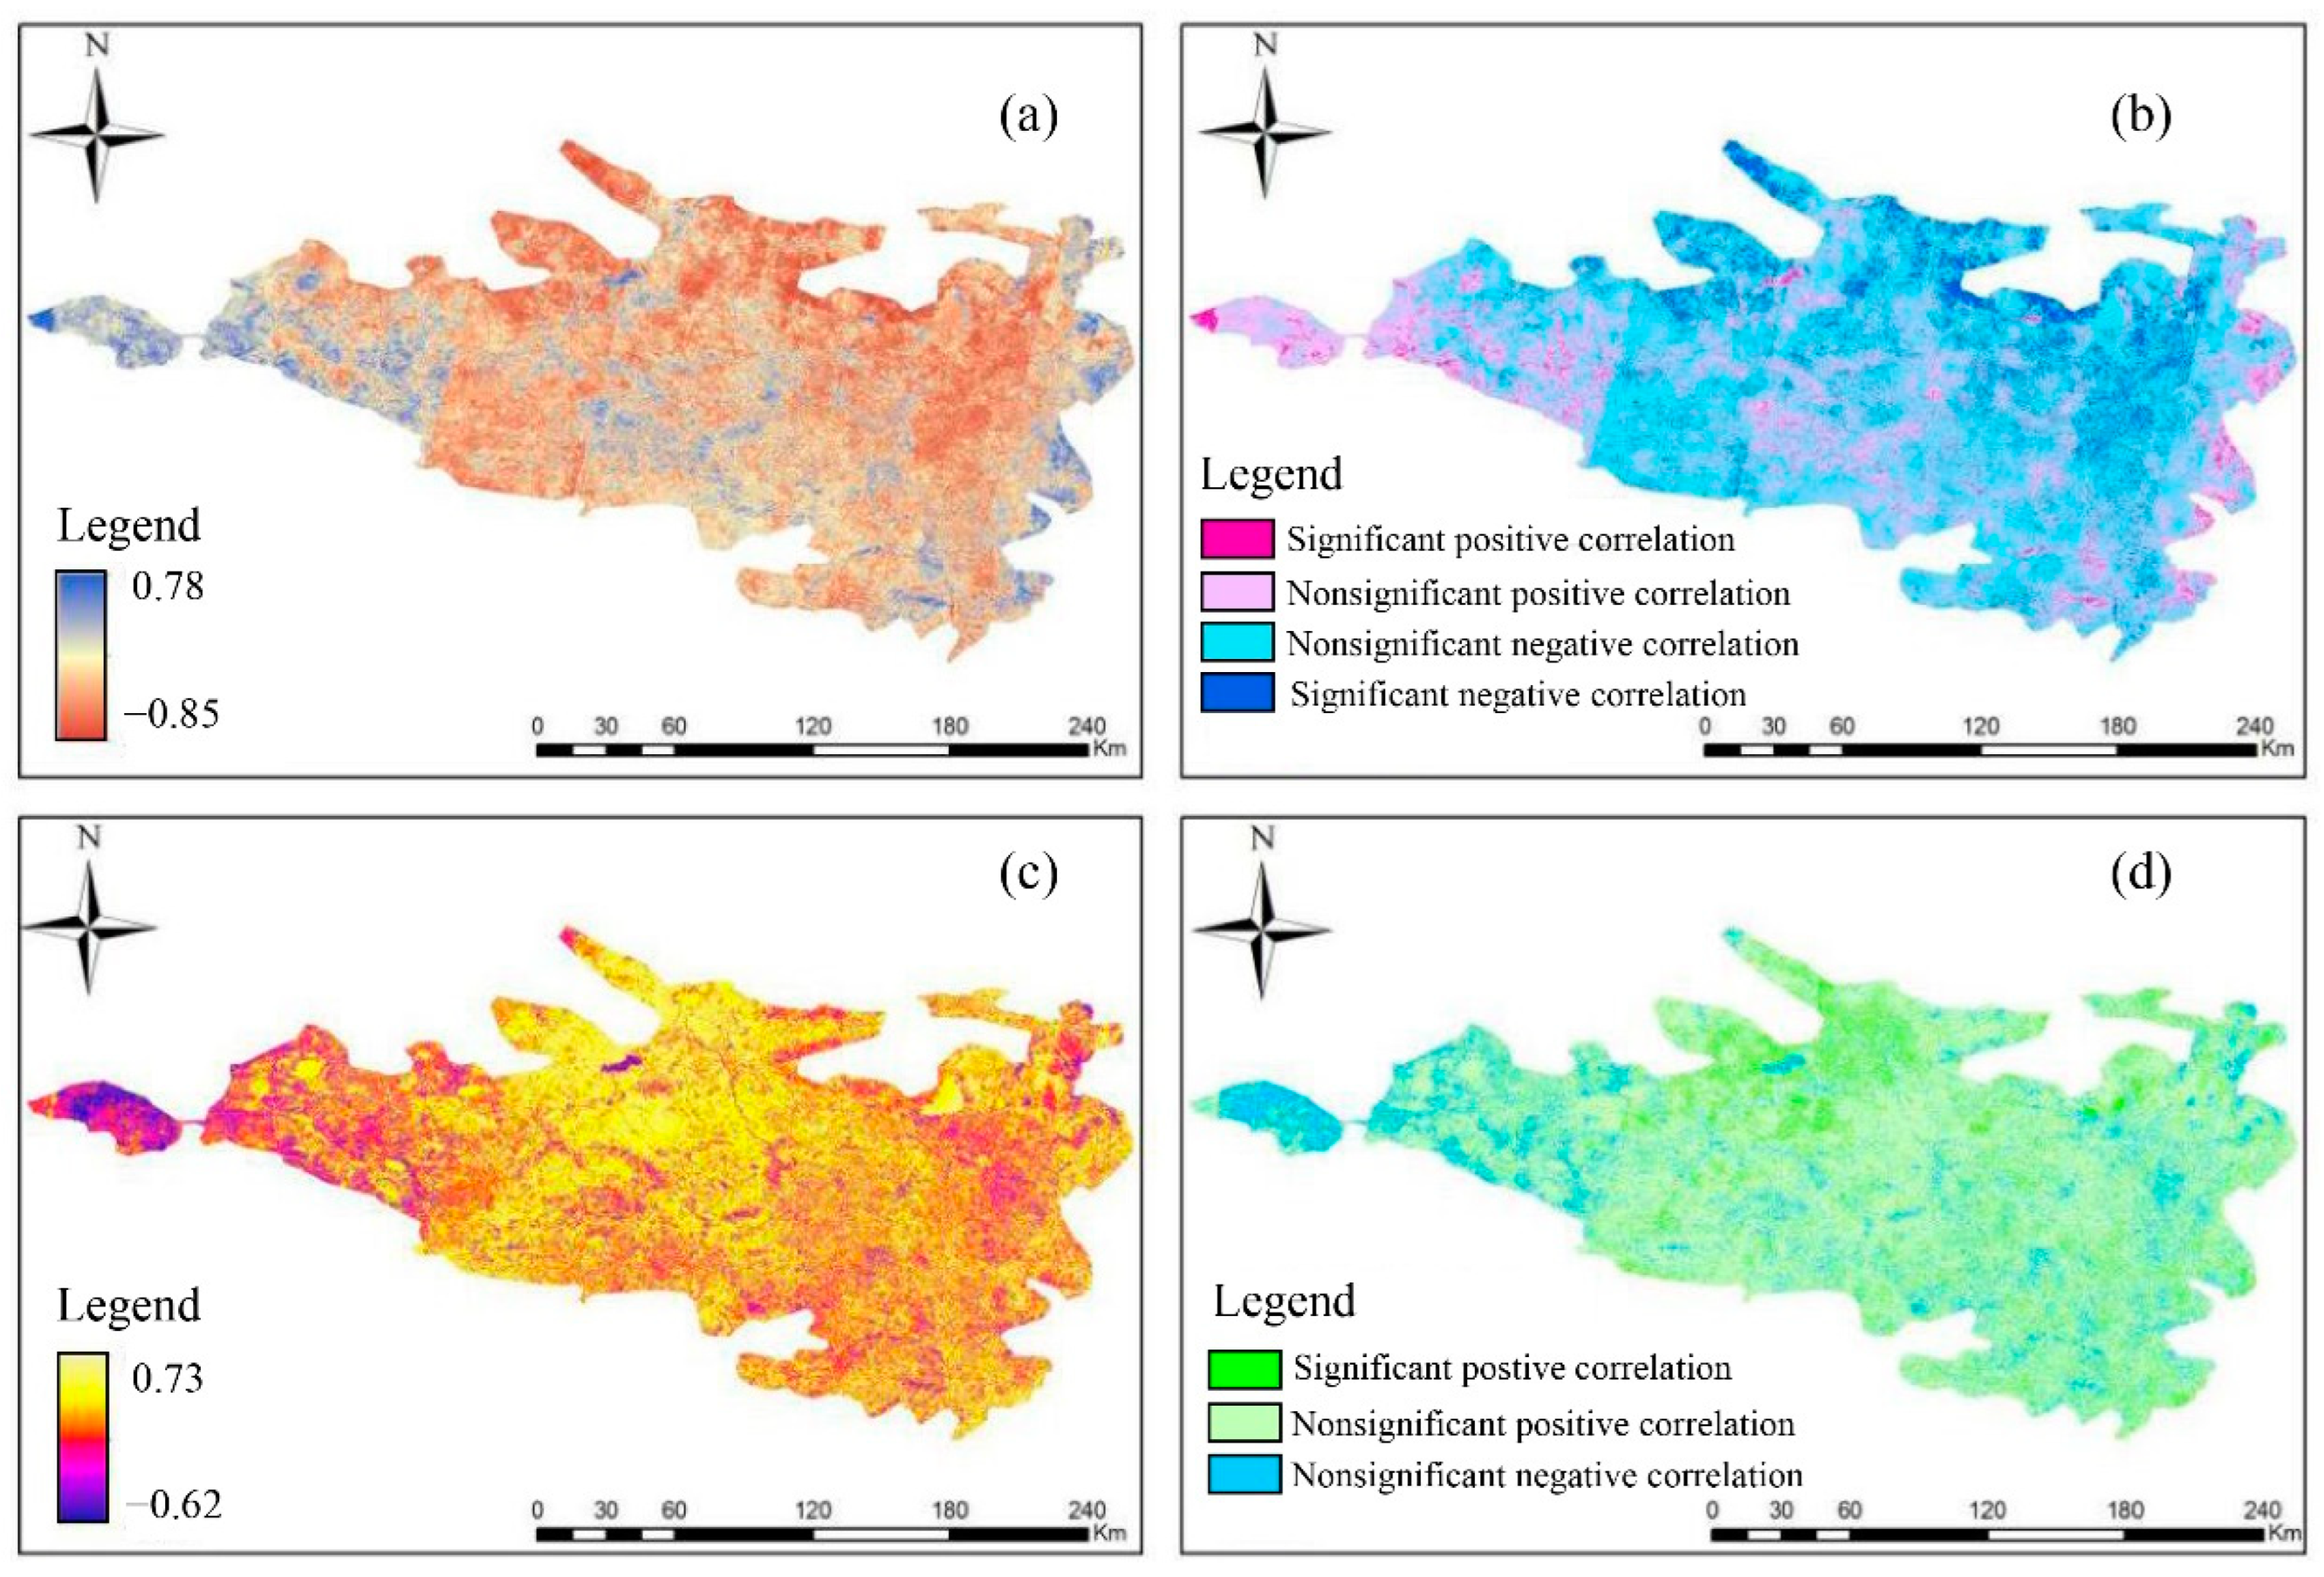
4.2. Meteorological Driving Factors of Desertification

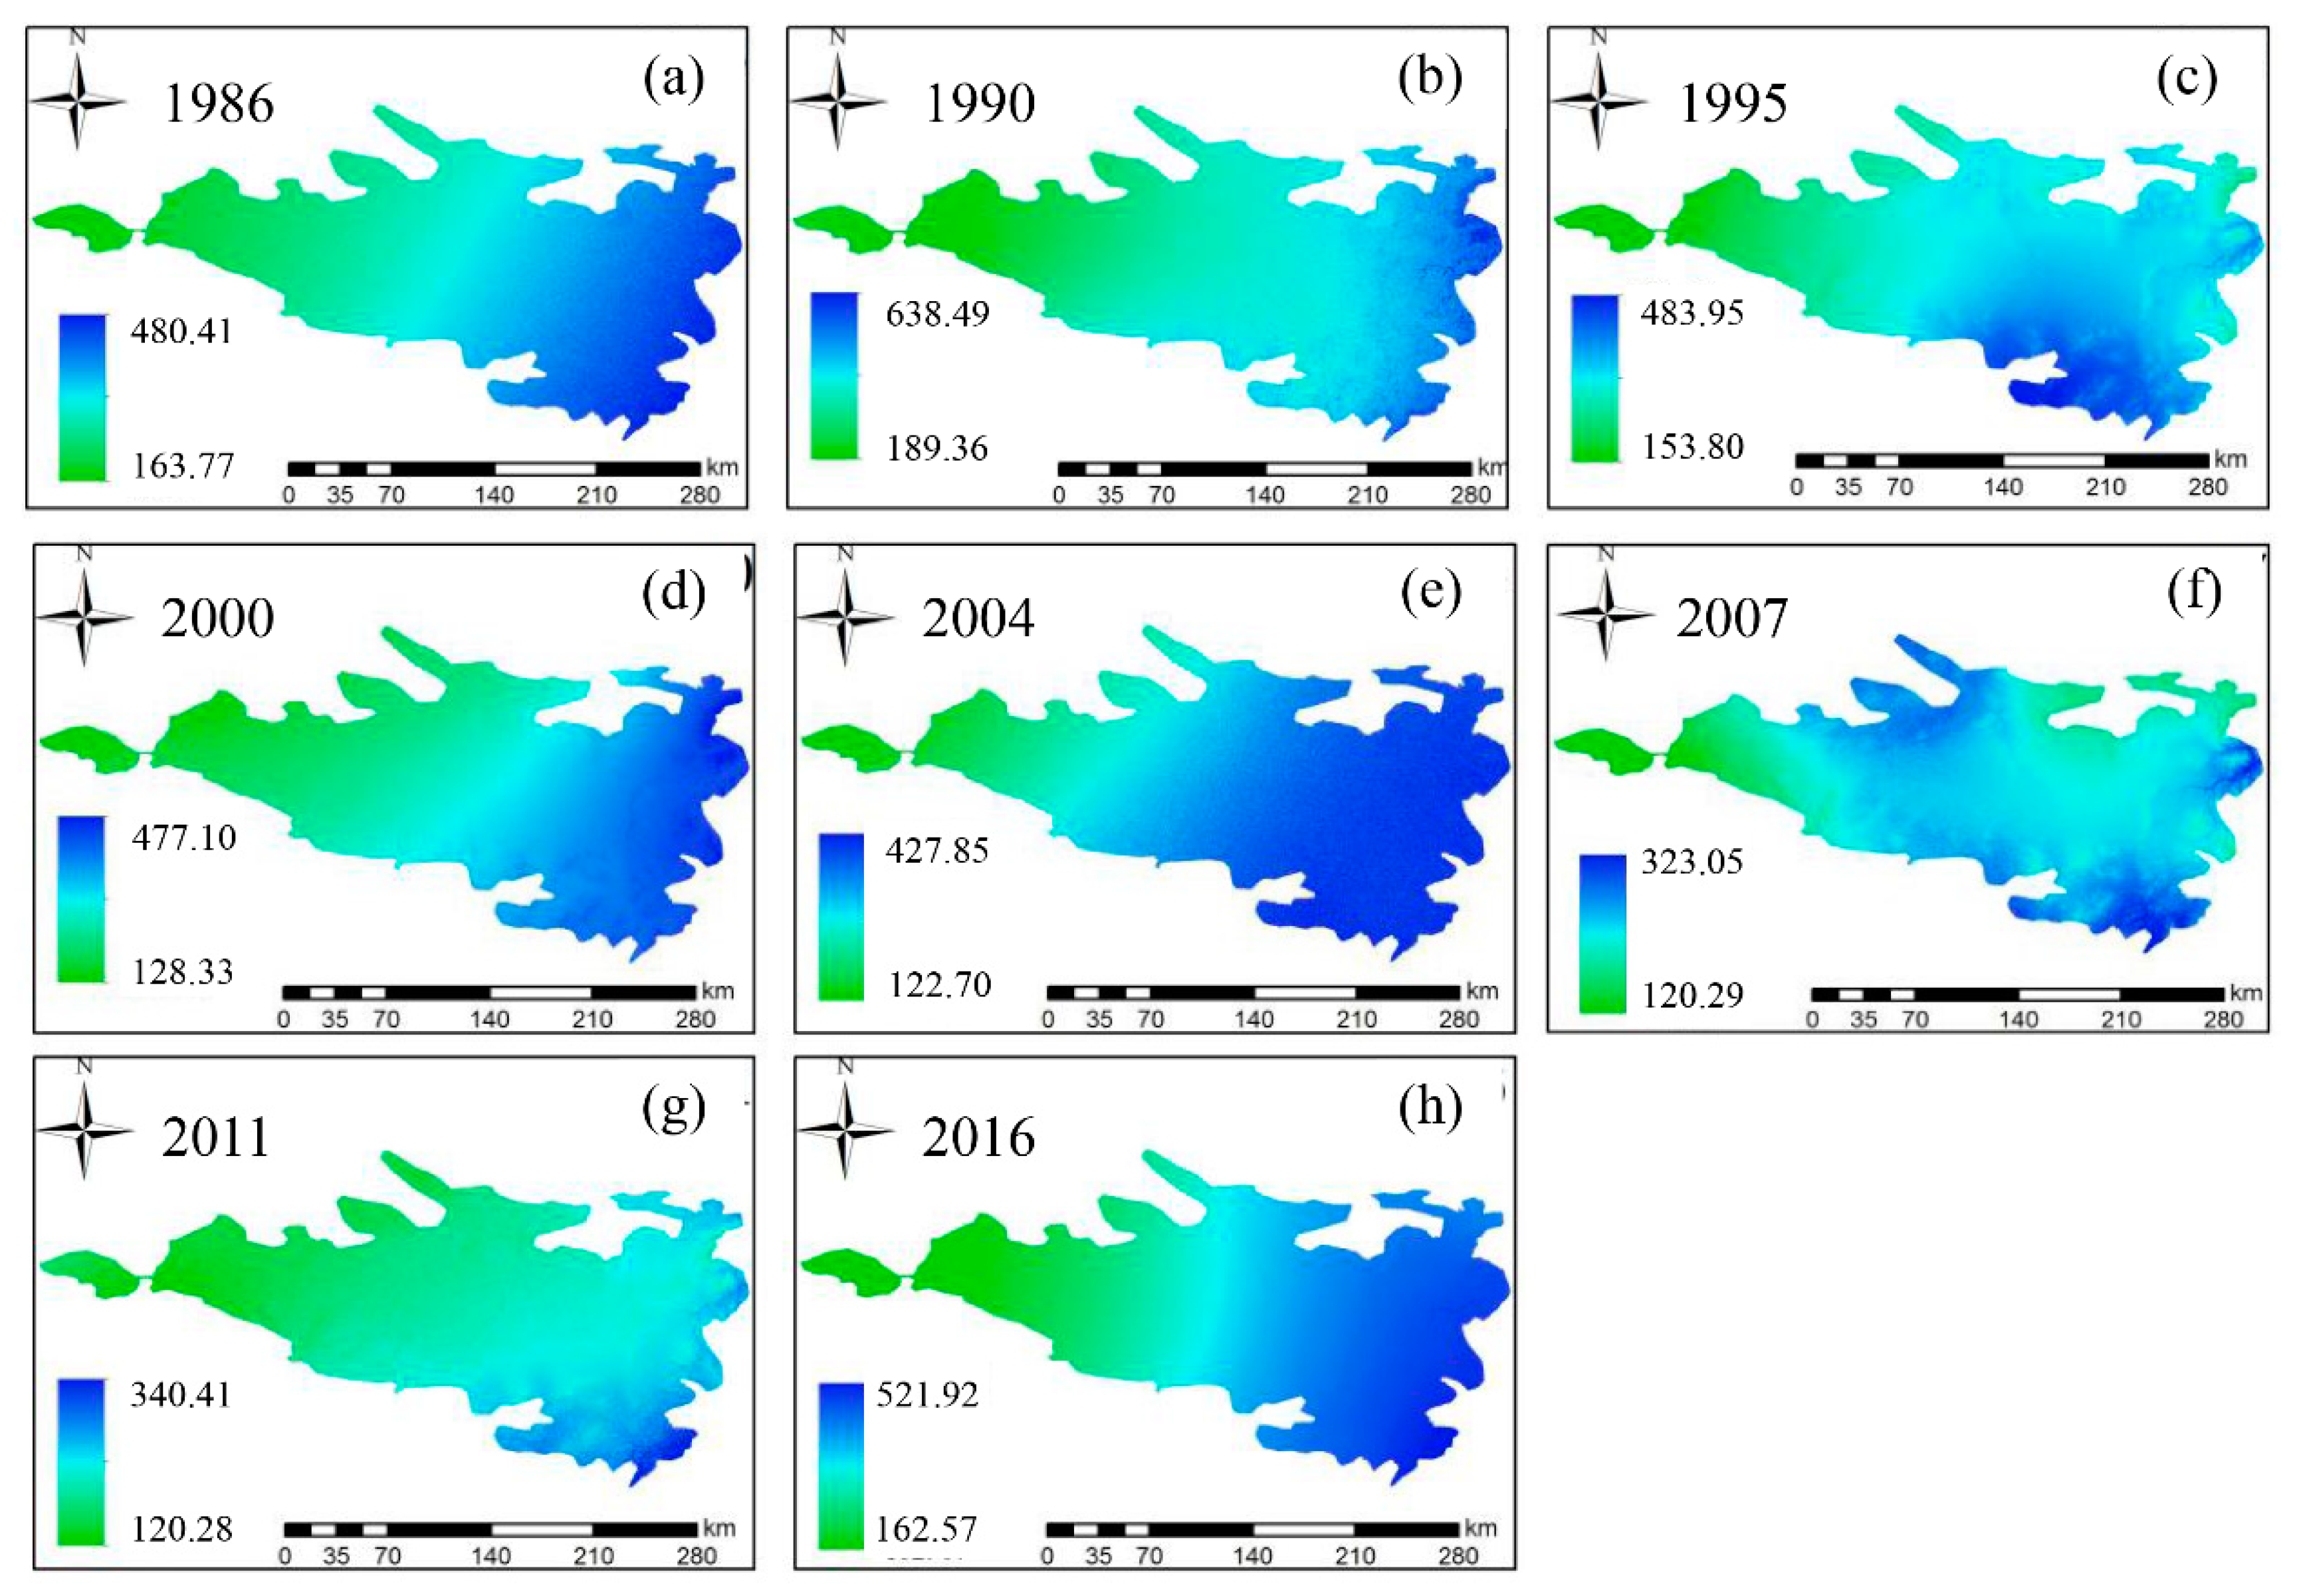
4.2.1. Spatial and Temporal Distribution of Meteorological Factors

In the last 30 years, the change rate of precipitation in OSL was −1.78 mm/a, which did not pass the significance test. The mean temperature change rate was 0.068 °C/a (p < 0.05). The correlation analysis showed that the correlation coefficient between precipitation and desertification is −0.652, and that between the mean temperature and desertification was 0.51, both of which fail to pass the significance test. The fluctuation of precipitation and mean temperature was stronger than that of desertification, and the influence of hydrological and thermal conditions on desertification were different. From 1986 to 1990, the overall extent of desertification decreased, and precipitation and mean temperature increased by 14.14 mm and 1.57 °C. From 1990 to 2000, precipitation decreased by 62.23 mm, and mean temperature did not change much. From 2000 to 2004, precipitation and temperature increased by 48.99 mm and 1.20 °C. From 2004 to 2007, desertification developed rapidly, precipitation decreased by 53.07 mm, and mean temperature increased slightly. From 2007 to 2016, the precipitation increased by 100.49 mm, and the mean temperature decreased by 0.38 °C. The effects of meteorological changes on desertification in OSL in recent 30 years were not consistent in different periods (Figure 7 and Figure A3).

4.2.2. Analysis of Spatio-Temporal Law of Meteorological Factors Driving Action

The effects of the mean temperature and annual precipitation on desertification were different in different regions. The area with a positive correlation between mean temperature and desertification was 40,370.13 km², accounting for 87.19% of the study area. The area of positive correlation through the correlation test was 4406.76 km² (p < 0.05), accounting for 9.52% of the study area. The area of negative correlation through the correlation test was 6939.99 km² (p < 0.05), accounting for 14.98%. The area with a positive correlation between annual precipitation and desertification was 12,907.08 km², accounting for 27.79%, and the area with negative correlation was 33,545.7 km², accounting for 72.22%. The area of positive correlation and negative correlation were 1006.56 km² (2.17%) and 5163.57 km² (11.12%), respectively (Figure A4 and Table 4).

4.3. Human Activity Driving Factors of Desertification

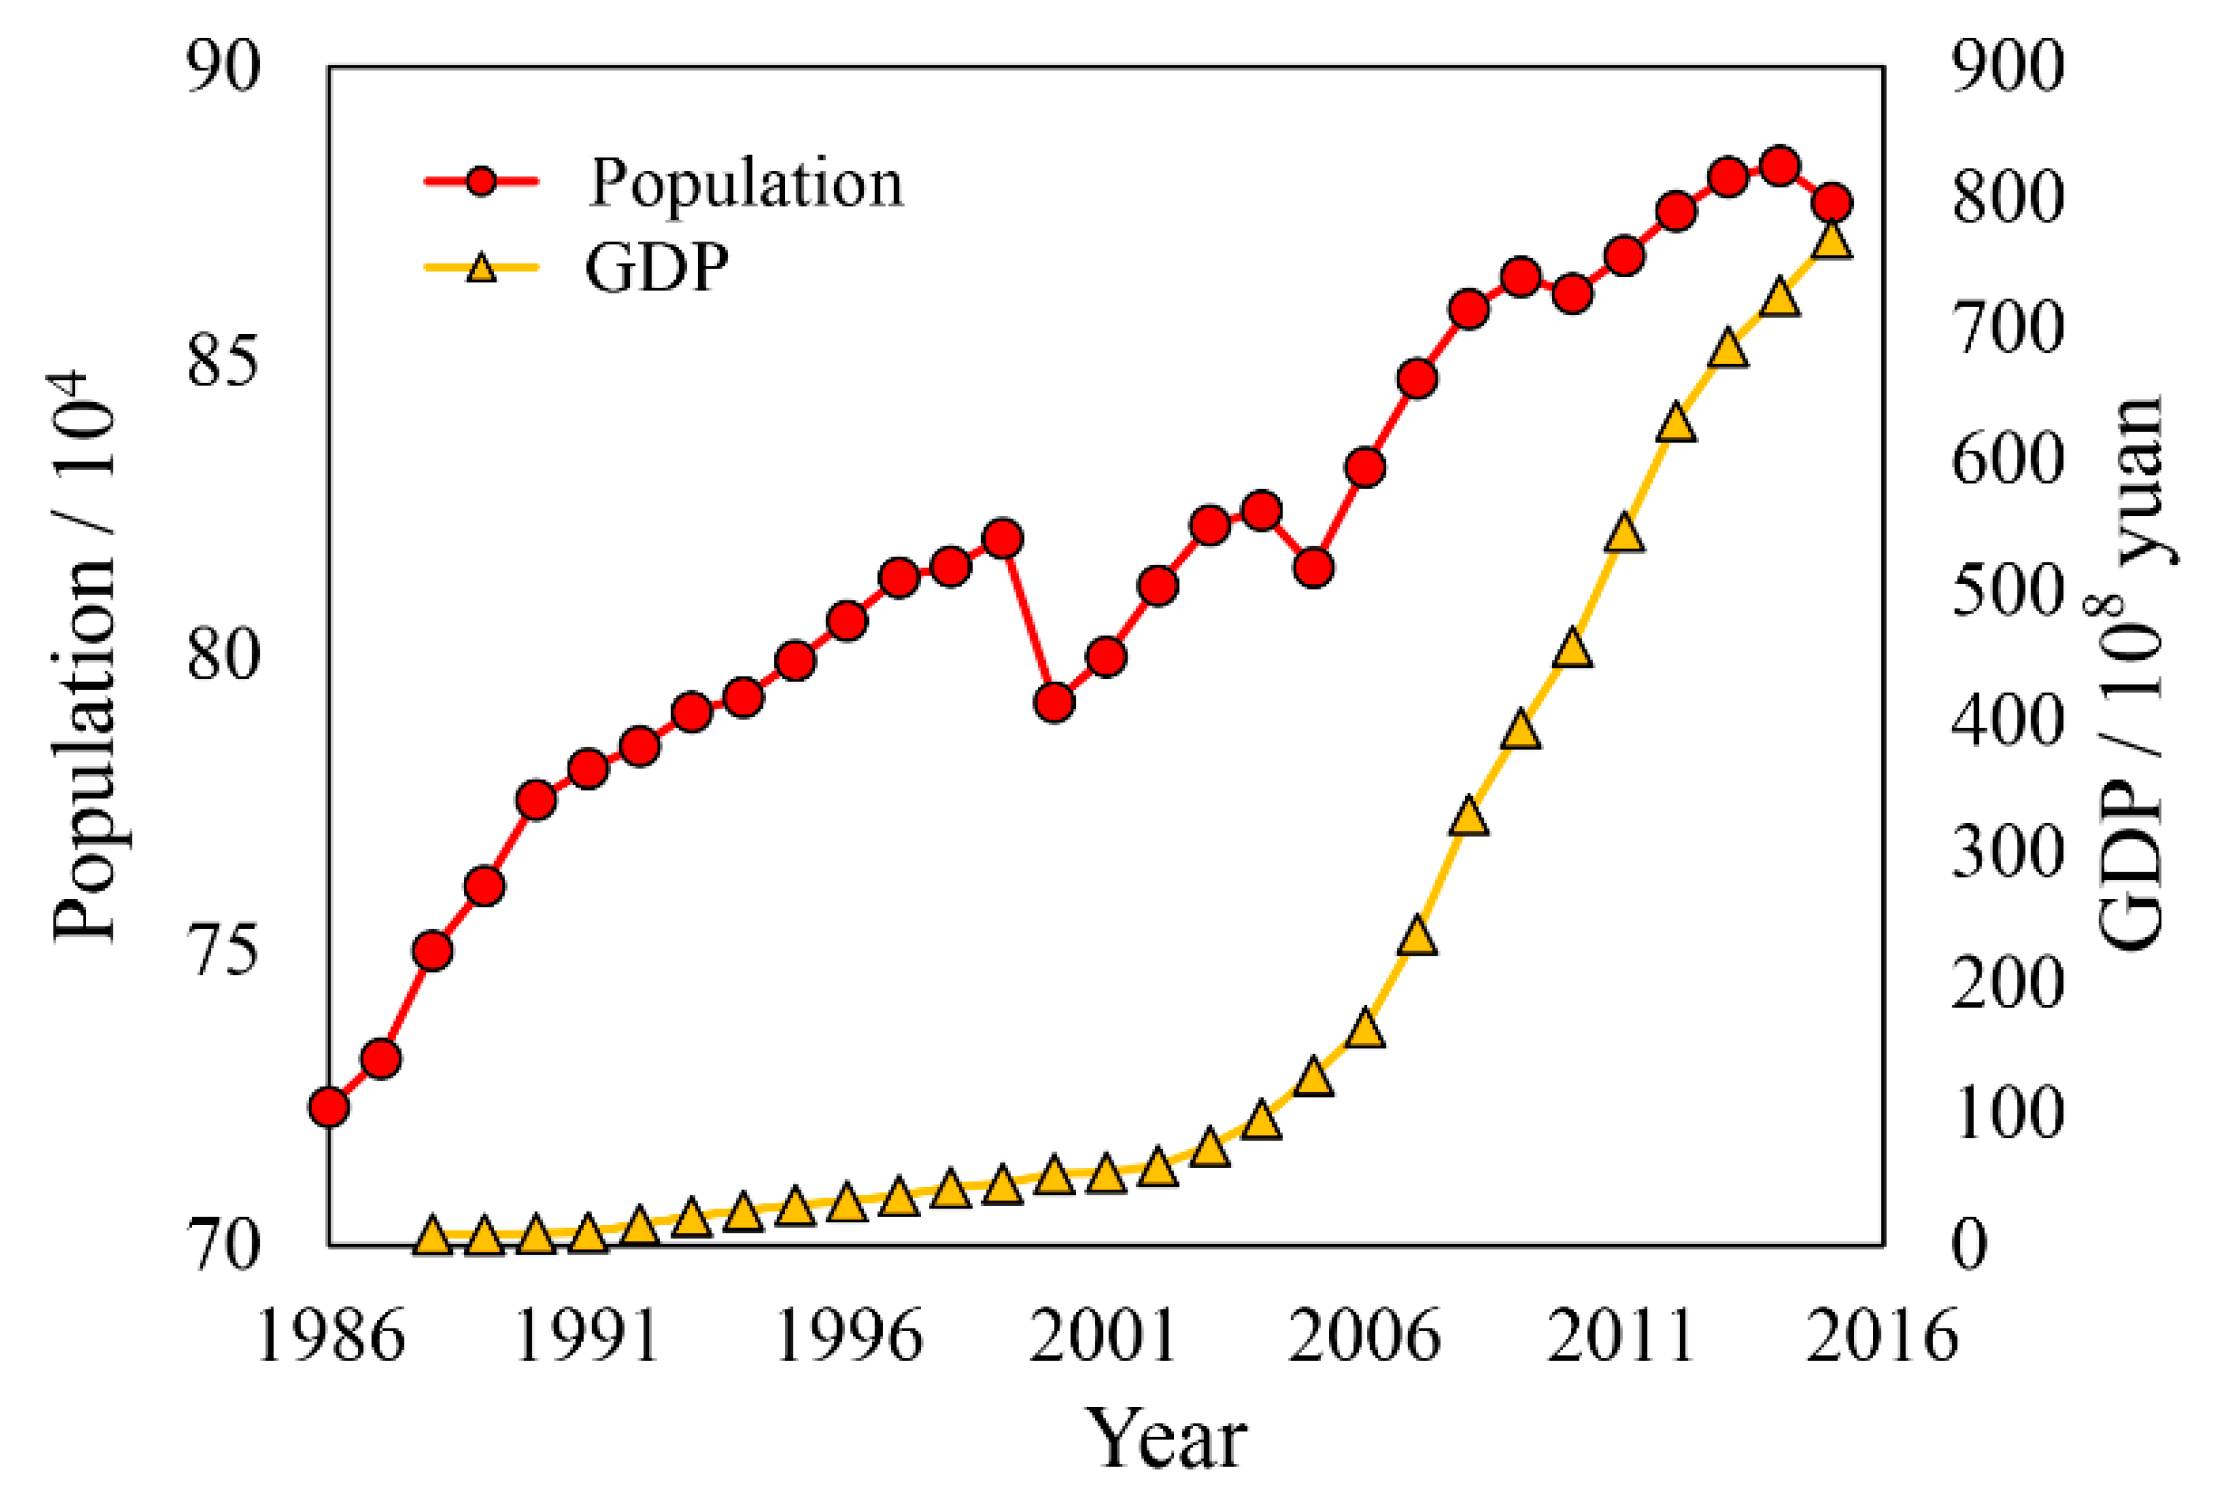
4.3.1. Analysis on Driving Force of Population and Economic Development to Desertification

In the past 30 years, the Gross Domestic Product (GDP) of the study area has grown rapidly, from 876 million yuan in 1988 to 76.956 billion yuan in 2015, nearly 88 times, with rapid economic development. After 2000, the economic development speed greatly exceeded that of before 2000. From 1986 to 2000, the GDP increased by five times, from 876 million yuan to 5.489 billion yuan in 2000. From 2000 to 2015, the GDP increased by 13 times from 5.489 billion yuan to 76.956 billion yuan. In terms of population, the population of the OSL increased from 723,500 in 1986 to 876,800 in 2015, an increase of 153,300 (an increase of 21.1%). The correlation coefficient between GDP and desertification was 0.198, and that between population and desertification was 0.442 (Figure A5).

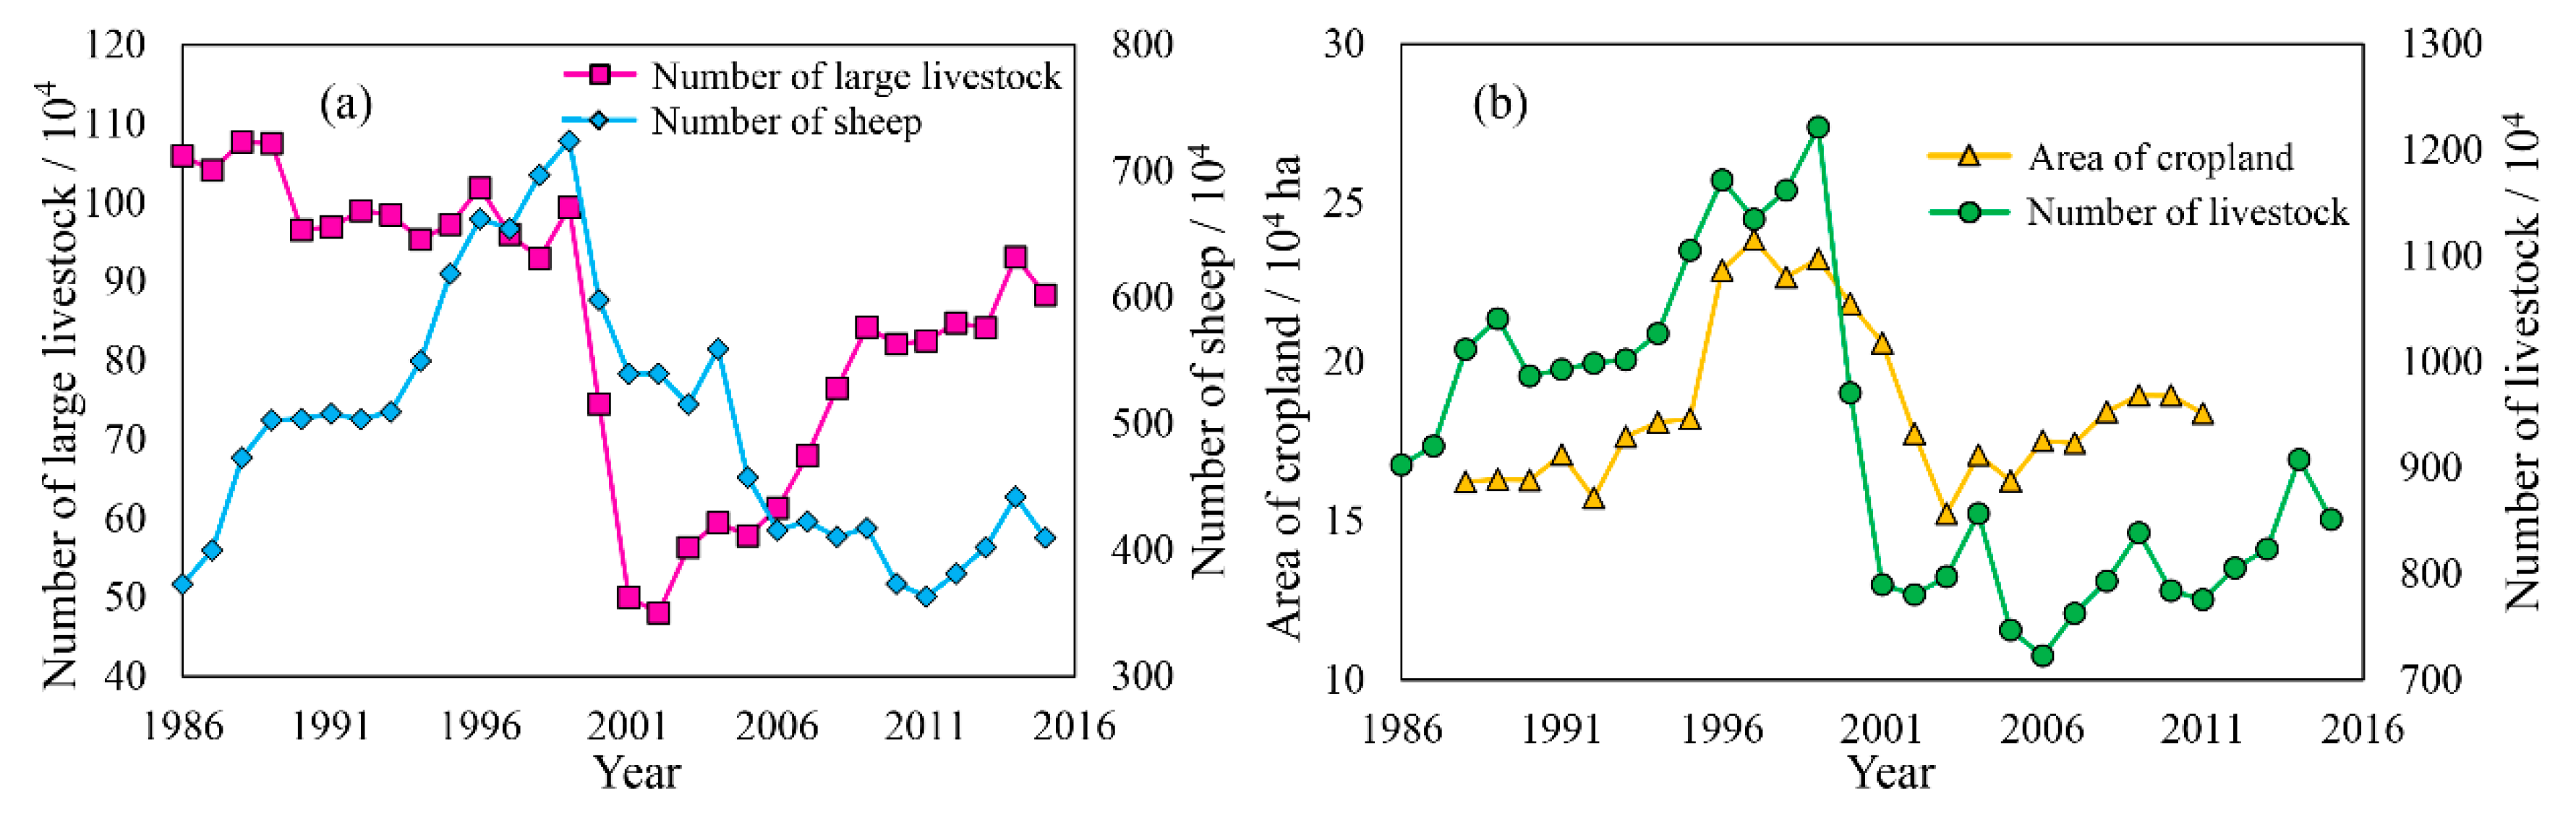
4.3.2. Analysis on the Driving Force of Agriculture and Animal Husbandry to Desertification

In the past 30 years, the cropland area in OSL increased from 162,300 ha in 1988 to 183,800 ha in 2011, an increase of 13.24%. The change in the cropland area experienced three stages; from 1988 to 1997, the cropland increased by 76,200 ha. From 1997 to 2003, it decreased by 86,300 ha. From 2003 to 2011, it increased again by 31,600 ha. The number of livestock also experienced three stages. From 1986 to 1999, the livestock increased from 90.68 × 10⁴ to 12.21 × 10⁴. From 1999 to 2006, the livestock decreased to 72.27 × 10⁴, and the livestock breeding reached the lowest value in the study period. Between 2006 and 2016, livestock started to recover, increasing by 1.288 million. The correlation coefficients between the area of cropland and the number of livestock and desertification were 0.177 and −0.420, respectively, which did not pass the significant test (Figure A6).

5. Discussion

5.1. Effects of Climate Change on Desertification

Three-quarters of the global expansion of arid and semi-arid areas will take place in developing countries, which will be at risk of further land degradation and increased poverty in these areas [40]. Studies have shown that desertification in the east and west of arid Asia [41,42], El-Dakhla oasis in Egypt [43], Horqin Sandy Land and Hulun Buir Sandy Land in China were mainly affected by climate change [44]. Desertification was mainly affected by human factors in the semi-arid highland of central Mexico [45], Heihe River Basin of China and Gangcha County of Qinghai Province [46]. Desertification in HognoKhaan of Mongolia, Dharmapuri of India and Mu Us of China were affected by climate factors and human activities [47,48,49]. Wang et al. found that the desertification process in the east and west of the arid region of Asia is sensitive to climate change [50]. In our study, although, overall, there was no significant correlation between the climate and human activity indicators and desertification between 1986 and 2016, the desertification process in arid and semi-arid areas of China was affected by natural and human factors. The area with a positive correlation between the average temperature and desertification and the area with a negative correlation between precipitation and desertification account for approximately three-quarters of the total area of sandy land. Natural factors were the main driving force of desertification, which was consistent with the relevant research [51]. Desertification in arid and semi-arid areas of China was sensitive to climate change, which was similar to Wang et al. [50]. Among the climate factors, precipitation had the greatest influence, which was consistent with the relevant studies [52,53]. Our results also showed that the regions with a significant correlation between the average temperature and desertification, precipitation and desertification in the OSL were in the north central part of the study area. In these areas, temperature and precipitation were significantly related to desertification, accounting for about one-tenth of the total area, and the impact of precipitation was slightly greater. This might be due to the high volatility and spatial heterogeneity of desertification in the short term.

5.2. Effects of Human Activities on the Process of Desertification

In order to curb the development of desertification, four major afforestation projects have been carried over the world: The Great Stalin Plan for the Transformation of Nature [54], the American Roosevelt Shelterbelt Project [55], the Green Dam Project of the Five Countries in Northern Africa and Three Norths Shelter Forest Program in China [56]. These four major afforestation projects have had a significant impact on the international community and have triggered enthusiasm for repairing the ecological environment all over the world [57]. In addition, OSL has also carried out the Beijing Tianjin Sand Storm Source Control Project, the Combating of Destruction Program, the Natural Forest Protection Project, and the Grain for Green Project, etc. Studies have shown that in the past 30 years, Chinese ecological restoration projects have played an important and promoting role in the process of greening the world [58].
In addition to the ecological protection projects guided by policies, the rapid economic development of the study area and the environmental development, such as industrial development, urban construction and agricultural water use, have also led to the gradual shrinkage of high-quality grassland around the river, thus increasing the risk of desertification [59]. The rapid but irregular development of tourism leads to tourists trampling on and destroying grassland, and the trend of desertification expands outwards, with roads as the center of tourism routes [60]. This excessive exploitation and utilization of natural resources has led to the rapid development of desertification in OSL. During the development of OSL’s animal husbandry in the past 30 years, the change trend of sheep and big livestock is oppositional, which reflects the adjustment of the animal husbandry industry structure in OSL [61]. According to the relevant industrial development data of the OSL region, in recent years, the research area has carried out the strategy of “reducing sheep and increasing cattle” to promote economic development and protect the ecological environment by reducing the breeding number of sheep and increasing the breeding amount of large cattle [62]. From the perspective of ecological protection, the grazing mode of sheep is “gnawing feeding”, while the grazing mode of cattle is “rolling feeding” [63]. At the initial stage of pasture growth, the growth rate of pasture in cattle grazing areas was higher than that in sheep grazing areas. Therefore, the number of livestock was still an important reason for the reduction of desertification between 2007 and 2016 due to the adjustment of the breeding structure.

5.3. Measures and Suggestions to Prevent or Slow down the Desertification Process

The zonal vegetation of OSL is typical grassland, and animal husbandry is the pillar industry. According to the statistical data, the primary industry accounted for 80% in 1990, but by 2015, the proportion had dropped to 10%, which was still higher than the average level of Inner Mongolia (9.1%) and the country (8.4%) [64]. To maintain the sustainable development of OSL, it is still necessary to explore the reasonable prevention and control of land desertification and the sustainable use mode of land resources. First, natural recovery plays a huge role in the restoration of regional degraded ecosystems. We should follow the path of the intensive development of agriculture and animal husbandry and engage in production in a small area and ecology in a large area [65]. For example, grazing in the enclosure is forbidden for natural recovery. Research shows that after four years of enclosure, the grass layer height inside the enclosure is 410% higher than that outside the enclosure, the coverage is 397% higher, and the aboveground biomass is 126% higher [66,67]. In addition, we can also consider adjusting the industrial structure of OSL. OSL has the largest lignite field in China and the largest alkali mine in Asia. These rich resources need to be developed and utilized [68]. Moreover, a sound policy guarantee system is also the key to desertification control, and a guaranteed system for the paid development, utilization and protection of regional resources should be established [69]. Finally, we should strengthen the dynamic monitoring and early warning of grassland in this area and grasp the dynamic status of grassland resources in a timely manner in order to scientifically verify the livestock carrying capacity of OSL, regulate the relationship between grass and livestock, and promote regional sustainable development.

5.4. Uncertainties in the Process of Desertification and the Limitations of This Paper

Policy and investment in science and technology can also influence desertification. Due to the limitations of the data and regional scale, this study did not quantitatively analyze the effects of these factors on the desertification process [70]. In addition, the response of desertification to driving factors has a spatial difference and lag, which should be strengthened in the follow-up research [71]. Our research cycle is only 30 years, so in order to pursue the spatial resolution accuracy of the remote sensing data, we chose the Landsat series data at the cost of temporal resolution. In fact, if MODIS data are used, it is possible to calculate data with a wider time range and shorter intervals [72,73] Future studies that comprehensively consider temporal resolution, spatial resolution and spectral resolution will reveal the driving mechanism of desertification in the study area more systematically.

6. Conclusions

In the past 30 years, the evolution process of desertification in OSL has fluctuated greatly and has experienced five periods. The degree of desertification in OSL gradually decreased from west to east. The area with a significant desertification trend accounted for one-fifth of the whole study area, the area with a significant improvement of desertification was less than one-tenth, and the non-significant area accounted for approximately three-quarters of the whole area. During the evolution of desertification in OSL, there was a strong correlation between the meteorological changes and desertification evolution, which was the main reason to promote desertification, and the driving effect of precipitation on desertification was stronger than that of temperature. Human activities were the secondary caused of desert evolution, including economic development, population increase and the development of animal husbandry. In order to prevent the further development of desertification and to restore the regional ecological environment, global climate change should be taken seriously. Policies to increase carbon sinks and reduce carbon emissions should be developed. In addition, scientific and reasonable industrial development policies should be formulated to regulate tourism development and the production activities of farmers and herdsmen, supplemented by scientific and effective means of desertification control.

Author Contributions

Conceptualization, Y.Y. and M.S.; methodology, Y.Y.; software, Y.Y.; validation, J.W.; formal analysis, X.Y.; investigation, C.Z., X.Y., J.W. and N.Y.; resources, M.S. and J.W.; data curation, J.W.; writing—original draft preparation, Y.Y.; writing—review and editing, M.S.; visualization, Y.Y.; supervision, M.S.; project administration, Y.Y.; funding acquisition, M.S. All authors have read and agreed to the published version of the manuscript.

Funding

This research was sponsored by Shanghai Sailing Program (22YF1444000), National Key R&D Program (2017YFC0505501), Youth initiation project of Shanghai Academy of landscape planning (KT00262, KT00258) and Special Project of Shanghai Municipal Economy and Information Technology Commission (201901024), The central government guided the local science and technology development project “Research and Demonstration of Key Technologies for Ecological and Cultural Industries in Otindag Sandy Land”; Key science and technology project of Inner Mongolia Autonomous Region “Screening of resistant tree species in desertified land and study on suitable tree species in desertified land”.

Conflicts of Interest

The authors declare no conflict of interest.

Appendix A

Figure A1. Spatial-temporal distribution of annual precipitation from 1986 to 2016.
Remotesensing 15 00279 g0a1
Figure A2. Spatial-temporal distribution of annual mean temperature from 1986 to 2016.
Remotesensing 15 00279 g0a2
Figure A3. Spatial distribution of annual precipitation and annual mean temperature variation in OSL. (a) Variation trend of precipitation; (b) Significance of precipitation trend change; (c) Variation trend of temperature (d) Significance of temperature trend change.
Remotesensing 15 00279 g0a3
Figure A4. Spatial distribution of correlation between annual precipitation, annual mean temperature and desertification index in OSL. (a) Correlation of precipitation; (b) Correlation significance of precipitation; (c) Correlation of temperature (d) Correlation significance of temperature.
Remotesensing 15 00279 g0a4
Figure A5. Population and gross national product (GDP) trends of OSL from 1985 to 2015.
Remotesensing 15 00279 g0a5
Figure A6. Change trend of livestock number and cropland area in OSL. (a) Trends in large livestock and sheep; (b) Trends of livestock quantity and cropland area.
Remotesensing 15 00279 g0a6

References

  1. United Nations Convention to Combat Desertification. Intergovernmental Negotiating Committee for a Convention to Combat Desertification, Elaboration of an International Convention to Combat Desertification in Countries Experiencing Serious Drought and/or Desertification, Particularly in Africa; U.N. Doc. A/AC.241/27, 33 L.L.M; United Nations: New York, NY, USA, 1994; p. 328. [Google Scholar]
  2. United Nations Convention to Combat Desertification. Conference of the Parties: Thirteenth Session Ordos, China, 6–16 September 2017. Available online: http://www2.unccd.int/sites/default/files/inline-files/Ordos%20declaration.pdf (accessed on 7 March 2022).
  3. Yuan, B.; Ren, S.; Chen, X. Can environmental regulation promote the coordinated development of economy and environment in China’s manufacturing industry? A panel data analysis of 28 sub-sectors. J. Clean. Prod. 2017, 149, 11–24. [Google Scholar]
  4. Chasek, P.; Akhtar-Schuster, M.; Orr, B.; Luise, A.; Rakoto, R.; Safriel, U. Land degradation neutrality: The science-policy interface from the UNCCD to national implementation. Environ. Sci. Policy 2019, 92, 182–190. [Google Scholar] [CrossRef]
  5. Abuzaid, A.; Abdelatif, A. Assessment of desertification using modified MEDALUS model in the north Nile Delta, Egypt. Geoderma 2022, 405, 115400. [Google Scholar] [CrossRef]
  6. National Guangming Daily (NGD). Notice on the Issuance of the “Sand Stop Desert, Total Protection of Green Mountains”. 18 June 2021. Available online: https://baijiahao.baidu.com/s?id=1702851808756173823&wfr=spider&for=pc (accessed on 27 April 2022).
  7. Li, S.; He, S.; Xu, Z.; Liu, Y.; Bloh, W. Desertification process and its effects on vegetation carbon sources and sinks vary under different aridity stress in Central Asia during 1990–2020. Catena 2023, 221, 106767. [Google Scholar] [CrossRef]
  8. Tu, Z.; Li, M.; Sun, T. Results and analysis of the fifth national desertification and desertification monitoring. For. Resour. Manag. 2016, 1, 106–110. (In Chinese) [Google Scholar]
  9. Nwilo, P.; Olayinka, D.; Okolie, C.; Emmanuel, E.; Orji, M.; Daramola, O. Impacts of land cover changes on desertification in northern Nigeria and implications on the Lake Chad Basin. J. Arid Environ. 2020, 18, 104190. [Google Scholar] [CrossRef]
  10. Meng, X.; Gao, X.; Li, S.; Li, S.; Lei, J. Monitoring desertification in Mongolia based on Landsat images and Google earth engine from 1990 to 2020. Ecol. Indic. 2021, 129, 107908. [Google Scholar] [CrossRef]
  11. Sharma, L.; Raj, A.; Somawat, K. Spatio-temporal assessment of environmentally sensitive areas (ESA) in the Thar Desert India, to combat desertification under UNCCD framework. J. Arid Environ. 2021, 194, 104609. [Google Scholar] [CrossRef]
  12. Tariq, A.; Ullah, A.; Sardans, J.; Zeng, F.; Graciano, C.; Li, X.; Wang, W.; Ahmed, Z.; Ali, S.; Zhang, Z.; et al. Alhagi sparsifolia: An ideal phreatophyte for combating desertification and land degradation. Sci. Total Environ. 2022, 844, 157228. [Google Scholar] [CrossRef]
  13. Guo, B.; Yang, F.; Fan, Y.; Zang, W. The dominant driving factors of rocky desertification and their variations in typical mountainous karst areas of southwest China in the context of global change. Catena 2023, 220, 106674. [Google Scholar] [CrossRef]
  14. Klinge, M.; Schneider, F.; Li, Y.; Frechen, M.; Sauer, D. Variations in geomorphological dynamics in the northern Khangai Mountains, Mongolia, since the Late Glacial period. Geomorphology 2022, 401, 108113. [Google Scholar] [CrossRef]
  15. Hanafi, A.; Jauffret, S. Are long-term vegetation dynamics useful in monitoring and assessing desertification processes in the arid steppe, southern Tunisia. J. Arid. Environ. 2008, 72, 565–572. [Google Scholar] [CrossRef]
  16. Sun, B.; Li, Z.; Gao, W.; Zhang, Y.Y.; Gao, Z.H.; Song, Z.L.; Qin, P.Y.; Tian, X. Identification and assessment of the factors driving vegetation degradation/regeneration in drylands using synthetic high spatiotemporal remote sensing data: A case study in Zhenglanqi, Inner Mongolia, China. Ecol. Indic. 2019, 107, 105614. [Google Scholar] [CrossRef]
  17. Gou, F.; Liang, W.; Sun, S.; Jin, Z.; Zhang, W.B.; Yan, J.W. Analysis of the desertification dynamics of sandy lands in Northern China over the period 2000–2017. Geocarto Int. 2019, 36, 1938–1959. [Google Scholar] [CrossRef]
  18. Ajaj, Q.; Pradhan, B.; Noori, A. Spatial monitoring of desertification extent in western iraq using Landsat images and GIS. Land Degrad. Dev. 2017, 3, 2775. [Google Scholar] [CrossRef]
  19. Hu, X.; Leung, K.; Li, W.; Cheung, L. Monitoring interannual dynamics of desertification in Minqin County, China, using dense Landsat time series. Int. J. Digit. Earth 2019, 13, 886–898. [Google Scholar] [CrossRef]
  20. Wang, T.; Yan, C.; Song, X.; Xie, J. Monitoring recent trends in the area of aeolian desertified land using Landsat images in China’s Xinjiang region. ISPRS J. Photogramm. Remote Sens. 2012, 68, 184–190. [Google Scholar] [CrossRef]
  21. Mohamed, H.; Djouher, S.; Moulley, C.C.; Francisco, M.-P.; Manuel, S.M. Spectral signs of aeolian activity around a sand-dune belt in northern Algeria. Catena 2019, 182, 104175. [Google Scholar]
  22. Dong, Y.X.; Liu, Y.H. Study on desertification process in Hunshandake Sandy Land, Inner Mongolia during the past five thousand years. Arid. Land Geogr. 1993, 16, 45–51. (In Chinese) [Google Scholar]
  23. Yang, X.; Ding, Z.; Fan, X.; Zhou, Z.; Ma, N. Processes and mechanisms of desertification in northern China during the last 30 years, with a special reference to the Hunshandake Sandy Land, eastern Inner Mongolia. Catena 2007, 71, 2–12. [Google Scholar] [CrossRef]
  24. Zhang, J.; Zhang, Y.Q.; Qin, S.G.; Wu, B.; Wu, X.Q.; Zhu, Y.K.; Shao, Y.Y.; Gao, Y.; Jin, Q.T.; Lai, Z.R. Effects of seasonal variability of climatic factors on vegetation coverage across drylands in northern China. Land Degrad. Dev. 2018, 29, 1782–1791. [Google Scholar] [CrossRef]
  25. Bai, M.; Hao, R.Q. Effects of climate change on ecological environment evolution in Oshandake Sandy Land. J. Desert Res. 2006, 26, 484–488. (In Chinese) [Google Scholar]
  26. Sun, B.; Wang, Y.; Li, Z.; Gao, W.; Wu, J.; Li, J.; Song, Z.; Gao, Z. Estimating Soil Organic Carbon Density in the Otindag Sandy Land, Inner Mongolia, China, for modelling spatiotemporal variations and evaluating the influences of human activities. Catena 2019, 179, 85–97. [Google Scholar] [CrossRef]
  27. Wu, J.; Shi, M.; Ding, G. Spatial-temporal pattern of desertification in Zhenglan Banner of Otindag sandy land. Sci. Soil Water Conserv. 2019, 17, 110–119. (In Chinese) [Google Scholar]
  28. Wu, J.; Li, Z.; Gao, Z.; Wang, B.; Bai, L.; Sun, B.; Li, C.; Ding, X. Degraded land detection by soil particle composition derived from multispectral remote sensing data in the Otindag Sandy Lands of China. Geoderma 2015, 241, 97–106. [Google Scholar] [CrossRef]
  29. Cong, W.; Li, X.; Pan, X.; Liu, X.; Lu, Q.; Wang, F. A new scientific framework of dryland ecological quality assessment based on 10AO principle. Ecol. Indic. 2022, 136, 108595. [Google Scholar] [CrossRef]
  30. Wang, X.; Lou, J.; Cai, D.; Jiao, L. Effects of Earth surface processes on the heterogeneity of surface soil elements and the responses of vegetation elements in the Otindag Desert, China. Catena 2019, 183, 104214. [Google Scholar] [CrossRef]
  31. Gutman, G.; Ignatov, A. The derivation of the green vegetation fraction from NOAA/AVHRR data for use in numerical weather prediction models. Int. J. Remote Sens. 1998, 19, 1533–1543. [Google Scholar] [CrossRef]
  32. Qi, J.; Marsett, R.; Moran, M. Spatial and temporal dynamics of vegetation in the San Pedro River basin area. Agric. For. Meteorol. 2000, 105, 55–68. [Google Scholar] [CrossRef] [Green Version]
  33. Mandelbrot, B.B.; Wallis, J.R. Robustness of the rescaled range R/S in the measurement of noncyclic long run statistical de-pendence. Water Resour. Res. 1969, 5, 967–988. [Google Scholar] [CrossRef]
  34. Stow, D.; Hope, A.; McGuire, D.; Verbyla, D.; Gamon, J.; Huemmric, F.; Housto, S.; Racine, C.; Sturm, M.; Tape, K. Remote sensing of vegetation and land-cover change in Arctic Tundra ecosystems. Remote Sens. Environ. 2004, 89, 281–308. [Google Scholar] [CrossRef] [Green Version]
  35. Yang, Y.; Wang, S.; Bai, X.; Tan, Q. Factors affecting long-term trends in global NDVI. Forests 2019, 10, 372. [Google Scholar] [CrossRef] [Green Version]
  36. Yi, Y.; Wang, B.; Shi, M.; Meng, Z.; Zhang, C. Variation in Vegetation and Its Driving Force in the Middle Reaches of the Yangtze River in China. Water 2021, 13, 2036. [Google Scholar] [CrossRef]
  37. Jin, Q.; Zhang, J.; Shi, M.; Huang, J. Estimating Loess Plateau Average Annual Precipitation with Multiple Linear Regression Kriging and Geographically Weighted Regression Kriging. Water 2016, 8, 266. [Google Scholar] [CrossRef] [Green Version]
  38. Stefaine, H. Shape improvement of surfaces. J. Comput. 1998, 13, 135–152. [Google Scholar]
  39. Andréas, H.; Alfonso, V. Spearman rank correlation of the bivariate Student and scale mixtures of normal distributions. J. Multivar. Anal. 2020, 179, 104650. [Google Scholar]
  40. Xu, D.; Wang, Y.; Wang, Z.; Wang, F. Linking priority areas and land restoration options to support desertification control in northern China. Ecol. Indic. 2022, 137, 108747. [Google Scholar] [CrossRef]
  41. Huang, J.; Yu, H.; Guan, X.; Wang, G.; Guo, R. Accelerated dryland expansion under climate change. Nat. Clim. Chang. 2016, 6, 166–171. [Google Scholar] [CrossRef]
  42. Wang, X.; Song, J.; Xiao, Z.; Wang, J.; Hu, F. Desertification in the Mu Us Sandy Land in China: Response to climate change and human activity from 2000 to 2020. Geography and Sustainability. 2022, 3, 177–189. [Google Scholar] [CrossRef]
  43. Zhang, C.; Wang, X.; Li, J.; Zhang, Z.; Zheng, Y. The impact of climate change on aeolian desertification in northern China: Assessment using aridity index. Catena 2021, 207, 105681. [Google Scholar] [CrossRef]
  44. Orabi, O.; Zaky, A. Differential dissolution susceptibility of Paleocene foraminiferal assemblage from Farafra Oasis, Egypt. J. Afr. Earth Sci. 2016, 113, 181–193. [Google Scholar] [CrossRef]
  45. Duan, H.; Wang, T.; Xue, X.; Yan, C. Dynamic monitoring of aeolian desertification based on multiple indicators in Horqin Sandy Land, China. Sci. Total Environ. 2019, 650, 2374–3288. [Google Scholar] [CrossRef] [PubMed]
  46. Rocio, B.; Carlos, A.; Enrique, G.; Carlos, D.; Khalidou, M. Assessing desertification risk in the semi-arid highlands of central Mexico. J. Arid. Environ. 2015, 120, 4–13. [Google Scholar]
  47. Shao, Y.; Jiang, Q.; Wang, C.; Wang, M.; Xiao, L.; Qi, Y. Analysis of critical land degradation and development processes and their driving mechanism in the Heihe River Basin. Sci. Total Environ. 2020, 716, 137082. [Google Scholar] [CrossRef] [PubMed]
  48. Shoba, P.; Ramakrishnn, S. Modeling the contributing factors of desertification and evaluating their relationships to the soil degradation process through geomatic techniques. Solid Earth 2016, 7, 341–354. [Google Scholar] [CrossRef] [Green Version]
  49. Lamchin, M.; Lee, J.; Lee, W.; Lee, E.; Kim, M.; Lim, C.; Choi, H.; Kim, S. Assessment of land cover change and desertification using remote sensing technology in a local region of Mongolia. Adv. Space Res. 2016, 57, 64–77. [Google Scholar] [CrossRef]
  50. Feng, K.; Wang, T.; Liu, S.; Yan, C.; Kang, W.; Chen, X.; Guo, Z. Path analysis model to identify and analyse the causes of aeolian desertification in Mu Us Sandy Land, China. Ecol. Indic. 2021, 124, 107386. [Google Scholar] [CrossRef]
  51. Wang, X.M.; Hua, T.; Lang, L.L.; Ma, W.Y. Spatial differences of aeolian desertification responses to climate in arid Asia. Glob. Planet. Chang. 2017, 148, 22–28. [Google Scholar] [CrossRef] [Green Version]
  52. Feng, K.; Yan, C.Z.; Xie, J.L.; Qian, D.W. Spatial-temporal evolutionof aeolian desertification process in Ordos city during 1975–2015. J. Desert Res. 2018, 38, 233–242. (In Chinese) [Google Scholar]
  53. Li, J.; Zhang, C.L.; Li, Q.; Shen, Y.P.; Jia, W.R.; Tian, J.L. Development of sandy desertification and driving forces in HulunBuir sandy land in the past 15 year. J. Beijing Norm. Univ. 2017, 53, 323–328. (In Chinese) [Google Scholar]
  54. Wang, Y.Q.; Yin, S.; Guo, E.L.; Peng, X.Q.; Guo, L.F.; Li, Y.W. Desertification dynamic analysis based on landsat-8 OLI image: Take XilinGol League as an example. J. Inn. Mong. Agric. Univ. 2018, 39, 58–63. (In Chinese) [Google Scholar]
  55. Brain, S. The great Stalin plan for the transformation of nature. Environ. Hist. 2010, 15, 670–700. [Google Scholar] [CrossRef]
  56. Dahl, J. Progress and development of the prairie states forestry project. J. For. 1940, 38, 301–306. [Google Scholar]
  57. Liu, Q.; Zhang, Q.; Yan, Y.; Zhang, X.; Niu, J.; Svening, J. Ecological restoration is the dominant driver of the recent reversal of desertification in the Mu Us Desert (China). J. Clean. Prod. 2020, 268, 122241. [Google Scholar] [CrossRef]
  58. Tack, J.; Quanmen, F.; Kelsy, K.; Naugle, D. Doing more with less: Removing trees in a prairie system improves value of grasslands for obligate bird species. J. Environ. Manag. 2017, 198, 163–169. [Google Scholar] [CrossRef] [PubMed]
  59. Chen, C.; Park, T.; Wang, X.; Piao, S.; Xu, B.; Chaturvedi, R.K.; Fuchs, R.; Brovkin, V.; Ciais, P.; Fensholt, R.; et al. China and India lead in greening of the world through land-use management. Nat. Sustain. 2019, 2, 122–129. [Google Scholar] [CrossRef] [PubMed]
  60. Yue, L. The environmental transformation from late last glacial to Holocene of Otindag sandy land. Quat. Int. 2012, 279, 551–552. [Google Scholar]
  61. Liu, H.; Zhou, C.; Cheng, W.; Long, E.; Li, R. Monitoring sandy desertification of Otindag Sandy Land based on multi-date remote sensing images. Acta Ecol. Sin. 2008, 28, 627–635. [Google Scholar]
  62. Gong, Z.; Li, S.; Sun, J.; Xue, L. Environmental changes in Hunshandake (Otindag) sandy land revealed by optical dating and multi-proxy study of dune sands. J. Asian Earth Sci. 2013, 76, 30–36. [Google Scholar] [CrossRef]
  63. Wang, C.; Li, F. Establishing grassland ecological balance and realizing sustainable development of animal husbandry. Inn. Mong. Grassl. Ind. 2000, 3, 60–63. (In Chinese) [Google Scholar]
  64. Zhao, Y.Y.; Wu, H.Y.; Ding, G.D.; Gao, G.L.; Tu, W.Z. A review on the aeolian desertification in the Otindag Sandy Land. J. Desert Res. 2020, 40, 101–111. (In Chinese) [Google Scholar]
  65. You, Y.; Zhou, N.; Wang, Y.D. Comparative study of desertification control policies and regulations in representative countries of the Belt and Road Initiative. Glob. Ecol. Conserv. 2021, 27, e01577. [Google Scholar] [CrossRef]
  66. Li, N.H.Y.; Yu, W.B.; Hu, X.L.; Lan, D.M.; Li, H.L.; Liu, J.X. Effect of fencing on community characteristics of degenerated grassland in Hunshandake Sand. J. Arid. Land Resour. Environ. 2009, 23, 157–160. (In Chinese) [Google Scholar]
  67. Su, H.; Liu, W.; Xu, H.; Wang, Z.S.; Zhang, H.F.; Hu, H.X.; Li, Y.G. Long-term livestock exclusion facilitates native woody plant encroachment in a sandy semiarid rangeland. Ecol. Evol. 2015, 5, 2445–2456. [Google Scholar] [CrossRef] [PubMed]
  68. Liu, S.L.; Wang, T. Regionalization for Aeolian Desertification Control and Countermeasures in the Otindag Sandy Land Region, China. J. Desert Res. 2010, 30, 999–1005. (In Chinese) [Google Scholar]
  69. You, H.Y. Orienting rocky desertification towards sustainable land use: An advanced remote sensing tool to guide the conservation policy. Land Use Policy 2017, 61, 171–184. [Google Scholar] [CrossRef]
  70. Eskandari, D.; Gholami, H.; Telfer, M.; Comino, J.; Collins, A.; Jansen, J. Desertification of Iran in the early twenty-first century: Assessment using climate and vegetation indices. Sci. Rep. 2021, 11, 20548. [Google Scholar] [CrossRef]
  71. Ma, X.; Zhu, J.; Yan, W.; Zhao, C. Projections of desertification trends in Central Asia under global warming scenarios. Sci. Total Environ. 2021, 781, 146777. [Google Scholar] [CrossRef]
  72. Bezerra, F.; Aguiar, A.; Alvala, R.; Giarolla, A.; Bezerra, K.; Lima, P.; Nascimento, F.; Arai, E. Analysis of areas undergoing desertification, using EVI2 multi-temporal data based on MODIS imagery as indicator. Ecol. Indic. 2020, 118, 106752. [Google Scholar] [CrossRef]
  73. Alizade, Y.; Ghale, G.; Tayanc, M.; Unal, A. Dried bottom of Urmia Lake as a new source of dust in the northwestern Iran: Understanding the impacts on local and regional air quality. Atmos. Environ. 2021, 262, 118635. [Google Scholar] [CrossRef]
Figure 1. Spatio-temporal patterns and driving forces of desertification in OSL.
Remotesensing 15 00279 g001
Figure 2. Study area.
Remotesensing 15 00279 g002
Figure 3. Spatial-temporal distribution of desertification index in OSL from 1986 to 2016.
Remotesensing 15 00279 g003
Figure 4. Change of desertification index with longitude in OSL.
Remotesensing 15 00279 g004
Figure 5. Spatial distribution of desertification types in OSL.
Remotesensing 15 00279 g005
Figure 6. Significant trend of desertification index in OSL. (a) Trend significance of desertification index; (b) Overall trend of desertification index; (c) Desertification index showed a significant downward trend; (d) Desertification index showed a significant upward trend.
Remotesensing 15 00279 g006
Figure 7. (a) Annual mean temperature and (b) annual precipitation at OSL from 1986 to 2016. y1 represents the trend line of mean temperature change; y2 represents the trend line of desertification index change; y3 represents the trend line of mean temperature change.
Remotesensing 15 00279 g007
Table 1. Desertification index and mean value of OSL.
19861990199520002004200720112016Mean
D d e s 0.580.560.630.640.600.750.610.640.63
Table 2. Area of different levels of desertification in OSL (km²).
YearNDMDMODSDSED
19864261.791213711,063.9412,225.8910,155.69
19904689.2913,422.9111,854.8611,261.878615.37
19953431.338004.6512,600.8115,981.469826.06
20003001.566817.5712,085.7316,278.211,661.25
20044225.3712,058.699288.5612,085.412,048.86
20072385.32940.625212.9720,390.6418,914.78
20114183.1610,465.810,643.2410,686.8513,865.26
20163466.837214.0811,714.9616,632.6110,815.82
Note: ND, MD, MOD, SD, ESD represent non-desertification, mild desertification, moderate desertification, severe desertification and extremely severe desertification, respectively.
Table 3. Area and proportion of trend significant types of desertification index.
TypesArea (km²)Percentage (%)
Extremely significant decrease1267.262.72
Significant decrease1724.093.69
Nonsignificant decrease10,952.1423.47
Nonsignificant increase23,236.5249.80
Significant increase5629.0712.06
Extremely significant increase3851.148.25
Note: The test results were classified as extremely significant changes (p < 0.01, Z > 2.32), significant changes (p < 0.05, Z > 1.64) and nonsignificant change.
Table 4. Area and proportion of types associated with climate and desertification.
TypesArea (km²)Percentage (%)
Annual precipitationSignificant negative correlation5163.5711.12
Non-significant negative correlation28,382.1361.10
Non-significant positive correlation11,900.5225.62
Significant negative correlation1006.562.17
Annual mean temperatureNon-significant negative correlation5933.4312.81
Non-significant positive correlation35,963.3777.67
Significant positive correlation4406.769.52
Disclaimer/Publisher’s Note: The statements, opinions and data contained in all publications are solely those of the individual author(s) and contributor(s) and not of MDPI and/or the editor(s). MDPI and/or the editor(s) disclaim responsibility for any injury to people or property resulting from any ideas, methods, instructions or products referred to in the content.

