Article

Comparison of GRACE/GRACE-FO Spherical Harmonic and Mascon Products in Interpreting GNSS Vertical Loading Deformations over the Amazon Basin

1
Shanghai Astronomical Observatory, Chinese Academy of Sciences, Shanghai 200030, China
2
School of Astronomy and Space Science, University of Chinese Academy of Sciences, Beijing 100049, China
3
Shanghai Key Laboratory of Space Navigation and Positioning Techniques, Shanghai 200030, China
4
Department of Land Surveying and Geo-Informatics and Research Institute for Land and Space, The Hong Kong Polytechnic University, Hong Kong 999077, China
*
Author to whom correspondence should be addressed.
Remote Sens. 2023, 15(1), 252; https://doi.org/10.3390/rs15010252
Submission received: 24 November 2022 / Revised: 27 December 2022 / Accepted: 29 December 2022 / Published: 1 January 2023
(This article belongs to the Special Issue GRACE for Earth System Mass Change: Monitoring and Measurement)

Abstract

:
We compute the vertical displacements in the Amazon Basin using the Gravity Recovery and Climate Experiment (GRACE) and GRACE Follow-On (GRACE-FO) observations, including both the gravity spherical harmonic (SH) solutions from the Center for Space Research (CSR), GeoForschungsZentrum (GFZ) and Jet Propulsion Laboratory (JPL) and mascons from CSR, JPL and Goddard Space Flight Center (GSFC). The correlation coefficients, annual amplitude and root mean squares (RMS) reductions are calculated to assess the agreements between the GRACE/GRACE-FO and Global Navigation Satellite System (GNSS) vertical displacements at 22 selected GNSS stations. For the six GRACE/GRACE-FO products (i.e., CSR SH, GFZ SH, JPL SH, CSR mascon, GSFC mascon and JPL mascon), the mean annual amplitude reductions are 77.6%, 76.4%, 76.3%, 78.6%, 78.5% and 76.6%, respectively, the corresponding mean RMS reductions are 63.2%, 61.7%, 62.3%, 64.9%, 65.3% and 63.8%, respectively, and the mean correlation coefficients are all over 0.93. On the whole, mascon solutions agree slightly better with GNSS solutions than SH solutions do. The CSR SH and the GSFC mascon solutions show the best agreements with the GNSS solution among the 3 SH and 3 mascon products, respectively. We estimate GRACE/GRACE-FO noises using the three-cornered hat (TCH) method and find that the CSR SH and GSFC mascons also have the smallest noise variances among the SH and mascon products, respectively. By analyzing the GNSS stations from the central and southern Amazon Basin, we find that: (1) the RMS reductions when the mascon solutions are removed from GNSS height series are slightly larger than those using the SH solutions in the center, while in south all the RMS reductions are fairly close; (2) for both SH solutions and mascon solutions, the correlation coefficients in the center are slightly larger than those in the south, but conversely, the mean annual amplitude reductions in the center are much smaller than those in the south.

1. Introduction

Load deformation is caused by the Earth’s surface mass changes, and can be quantified through the mass load theory [1,2]. The global water cycle contributes dominantly to the mass changes at the Earth’s surface, such as precipitation, evapotranspiration, river runoff, ocean mass change, etc. The mass changes in the atmosphere and cryosphere also cause load deformations. In addition to these natural climate processes, human activities also lead to surface mass redistributions, such as excessive groundwater depletion, dam construction, etc. The Amazon Basin is the region with the largest rainforest on the Earth, which covers an area of ~6.3 million km2. With the Amazon River and the enormous numbers of tributaries flowing through the region, the Amazon system transports a huge volume of water and contributes to significant large-scale signals of climate-driven water mass redistributions, as well as the induced load deformations.
The Global Navigation Satellite System (GNSS) stations, which are established on the bedrock, can be utilized to monitor the surface deformations at specific sites with high temporal and spatial resolutions through dense station distributions in a certain area. The time series of GNSS solutions include not only tectonic but also non-tectonic deformations. For the tectonic deformations, the plate-related crustal movements have been investigated using GNSS technique in early studies, such as orogenic crustal movement [3], and seismic-induced plate motion [4]. The residual non-tectonic deformations include signals from tides, mass loading, thermal expansion, etc. [5]. For example, the hemispheric compressions and expansions due to seasonal mass redistributions were detected using the precise positioning data from the worldwide distributed GNSS sites [6]. The non-tidal atmospheric and oceanic loading displacements were predicted by combining GNSS observations and other geodetic data [7]. The rapid ice mass loss signals over the southeast of the Greenland were also found in the in situ GNSS observations [8].
The Gravity Recovery and Climate Experiment (GRACE) and GRACE Follow-On (GRACE-FO) satellite gravimetry missions, which are led by the National Aeronautics and Space Administration (NASA) and GeoForschungsZentrum (GFZ), provide a new approach to monitor and measure the Earth’s mass redistributions. GRACE/GRACE-FO provides monthly global gravity field products in forms of gravity spherical harmonic (SH) coefficients. After removing effects of the atmosphere and ocean, the residual variations in GRACE/GRACE-FO observations can be used to monitor terrestrial water storage variations over river basins [9,10], quantify global ocean mass changes over oceans [11], and validate accelerated melting of ice sheets over polar regions [12]. GRACE and GRACE-FO observations have also been widely used to enrich the mass load studies. According to the loading deformation theory [2], the GRACE/GRACE-FO observed mass changes can be used to derive loading deformations, and then used to interpret the GNSS observations [13,14,15]. For example, the elastic response to seasonal loading of rain water over the Amazon Basin was investigated by combining GNSS and GRACE observations [16].
For scientific applications of GRACE/GRACE-FO observations, in addition to the SH (also called GSM) products, the mascon (mass concentration) products have also been provided and are playing an increasingly important role. The mascon products are obtained using several reprocessing procedures, including spatial filtering, land-ocean constraints and forward modeling of annual and trend signals from ice losses in polar and mountain glaciers. The use of mascon products is more convenient than that of the SH products, as the mascon solutions do not require any additional decorrelation and spatial filtering and provide mass change results with higher spatial resolutions and signal-to-noise ratios (SNR). The mascon products have been used in a series of previous studies, such as in studying terrestrial water storage changes [17,18], in capturing seismic gravity signals induced by earthquakes [19], and in analyzing the differences of ocean mass changes by combining the mascon with altimeter and Argo measurements [20]. In terms of the comparison among different mascon products, the CSR mascon and JPL mascon were evaluated by comparing with CSR SH and GNSS observations in the Yangtze River Basin [21], and the CSR and JPL mascons derived displacements were compared with five SH solutions derived displacements and selected GNSS solutions at the global stations [22].
However, the studies of loading deformation using mascon products are notably less than those using the SH products. The mascon products are provided in forms of gridded data. It is more complicated and takes additional procedures to convert gridded mass changes to deformations, compared to using the SH coefficients. Furthermore, the mascon definitions and data processing methods at the three institutions in charge of releasing the mascon products, including the Center for Space Research (CSR), Jet Propulsion Laboratory (JPL), and Goddard Space Flight Center (GSFC) are largely different. Thus, the mascon data’s accuracies and reliabilities need further verification.
In this study, we take the Amazon Basin as the studied region to investigate the loading deformations caused by the most significant seasonal mass change signals (on Earth), using GNSS and GRACE/GRACE-FO observations. To compare the GNSS observed and GRACE/GRACE-FO derived loading deformations, we use the root-mean-squares (RMS) reduction, annual amplitude reduction and correlation coefficient between GNSS and GRACE/GRACE-FO time series to evaluate the differences between the mascon and SH products in loading deformation study. In addition, by analyzing the uncertainties of different SH and mascon products using the Three-Cornered Hat (TCH) method, we also quantify the noise level for each GRACE/GRACE-FO product in interpreting the GNSS-observed surface deformations.

2. Materials and Methods

2.1. GNSS Data

We select 22 GNSS stations in the Amazon region according to the record length and data quality, whose coordinates are shown in Table 1. The GNSS daily time series are provided by the data products from Nevada Geodetic Laboratory (NGL), University of Nevada, Reno, NV, USA. The data were processed by the GipsyX software following the standard practice, i.e., the solid Earth tide and pole tide were corrected according to the IERS 2010 Conventions, the ocean tide loading effect were corrected using the FES2004 model, and the final daily coordinates were transformed into IGS14 [23].
In order to be comparable with GRACE/GRACE-FO data, we select the GNSS series spanning the period 2006.6 to 2021.2 and average the GNSS daily series into monthly temporal resolution. The shortest time span is 3.4 years at the ITAM station, which is adequate to retrieve the annual signals that are dominated in the Amazon region. The geographic coordinates and time spans of the 22 stations are listed in Table 1.

2.2. GRACE and GRACE-FO Data

We use 6 GRACE/GRACE-FO Release 6 (RL06) products, including 3 SH products from CSR, GFZ and JPL, and 3 mascon products from CSR, GSFC and JPL [24,25,26]. For the 3 SH products, we use the GSM monthly solutions up to degree and order 96. Following the usual data processing standards, we have included the degree-1 SH coefficients C10, C11, and S11 provided by the GRACE/GRACE-FO project (TN13), replaced the C20 and C30 coefficients by satellite laser ranging (SLR) estimates [27], and corrected the GIA effect using the ICE6G-D model [28]. To reduce the north-south stripe errors and noises of higher degree/order coefficients, we first apply a P4M6 decorrelation filter, which means that for the SH coefficients with the orders 6 and above, the correlation errors are modeled by a quartic polynomial fit and removed from the original coefficients (for those with even and odd degrees, respectively) [29,30], and then a 300 km Gaussian smoothing are applied [31].
For the mascon products, we use the 0.25 ° × 0.25 ° CSR GRACE/GRACE-FO RL06 v02 mascon [24], the 0.5 ° × 0.5 ° GSFC RL06 v02 mascon [25], and the 0.5 ° × 0.5 ° JPL RL06 v02 mascon (CRI-filtered) [26]. For the JPL mascon, the recommended gain factors have been applied. The degree-1 coefficients (geocenter) corrections are estimated by using the method from Sun et al. and Swenson et al. [32,33]. For the CSR and GSFC mascons, the C20/C30 coefficients are replaced by SLR solutions from TN14 [27,34], while for the JPL mascon, only C20 coefficients are replaced [35]. The GIA corrections are applied by using ICE6G-D data [28]. One thing to be noted is that all the 3 mascon data sets have restored the GAD products, which means that the contribution of the ocean bottom pressure (OBP) change is included.
In order to be comparable with the GNSS data, the atmospheric and non-tidal oceanic effects are restored by adding the AOD1B products back to the data. For the SH products, we add back the GAC contributions to the GSM SH coefficients, while for the mascon products, we remove the GAD contributions and add back the GAC contributions. Since the 3 mascon datasets all reflect anomalies relative to the 2004.0–2010.0 mean baseline, the SH coefficients are also adjusted by subtracting the mean values over the same time span for consistency.

2.3. Methods

2.3.1. GRACE/GRACE-FO SH and Mascon Derived Loading Deformation

The elastic vertical loading displacements u θ , Ø at the observation point with colatitude θ and longitude Ø can be calculated using the SH coefficients based on the mass load theory [2,13,36]:
u θ , Ø = R l = 1 m = 0 l P ˜ l m c o s θ C l m c o s m Ø + S l m s i n m Ø h l 1 + k l
where, R is the radius of the Earth, l and m are the degree and order of the SH functions, C l m and S l m are Stokes coefficient changes relative to the 2004.0–2010.0 mean field, P ˜ l m is the fully normalized Legendre function with degree l and order m , and h l and k l are the elastic load Love numbers corresponding to degree l . The load Love numbers are provided by Farrell [2], which are based on the Gutenberg–Bullen Earth model.
To calculate the loading displacements using the mascon data, we convert the mascon mass change distribution q θ , Ø (in which θ is the colatitude and Ø is the longitude) into Stokes coefficients up to degree and order 180 by calculating the spherical integrals in Equations (2)–(4),
C ^ l , m = 1 R ρ w 1 4 π q θ , Ø P ˜ l m c o s θ c o s m Ø d σ
S ^ l , m = 1 R ρ w 1 4 π q θ , Ø P ˜ l m c o s θ s i n m Ø d σ
C l , m S l , m = 3 ρ w ρ e 1 + k l 2 l + 1 C ^ l , m S ^ l , m
where C ^ l , m and S ^ l , m are dimensionless coefficients, ρ w is the water density, ρ e is the mean density of the Earth. Then the mascon derived loading displacements can be calculated using Equation (1).

2.3.2. Agreement Assessments between GNSS and GRACE/GRACE-FO

The correlation coefficient, annual amplitude reduction, and RMS reduction are used to assess the agreement between the GNSS height u i GNSS and GRACE/GRACE-FO derived vertical loading deformation u i GRACE / GRACE FO . For the two time series, we calculate the correlation coefficient β with Equation (5),
β = i = 1 n ( u i GNSS u mean GNSS ) ( u i GRACE / GRACE - FO u mean GRACE / GRACE - FO ) i = 1 n ( u i GNSS u mean GNSS ) 2 i = 1 n ( u i GRACE / GRACE - FO u mean GRACE / GRACE - FO ) 2
where n is the total number of epochs, i represents the ith epoch of the time series, and u mean GNSS and u mean GRACE / GRACE FO are the mean values of the GNSS and GRACE/GRACE-FO time series, respectively.
The annual amplitude reduction and root-mean-squares (RMS) reduction are calculated with Equations (6) and (7), respectively,
A reduction = A GNSS A GNSS GRACE / GRACE FO A GNSS
RMS reduction = RMS GNSS RMS G N S S G R A C E / G R A C E F O RMS G N S S
where A GNSS and A GNSS GRACE / GRACE FO are the annual amplitudes fitted from the time series of “GNSS” and “GNSS minus GRACE/GRACE-FO”, respectively, while RMS GNSS and RMS GNSS GRACE / GRACE FO are the RMS of “GNSS” and “GNSS minus GRACE/GRACE-FO” series, respectively. The percentage of reductions represents how much the GNSS series can be interpreted by GRACE/GRACE-FO predictions, and the large/small reduction means good/bad agreement between GNSS and GRACE/GRACE-FO. The detailed descriptions of the annual amplitude fitting are given in Section 3.1.1.

3. Results

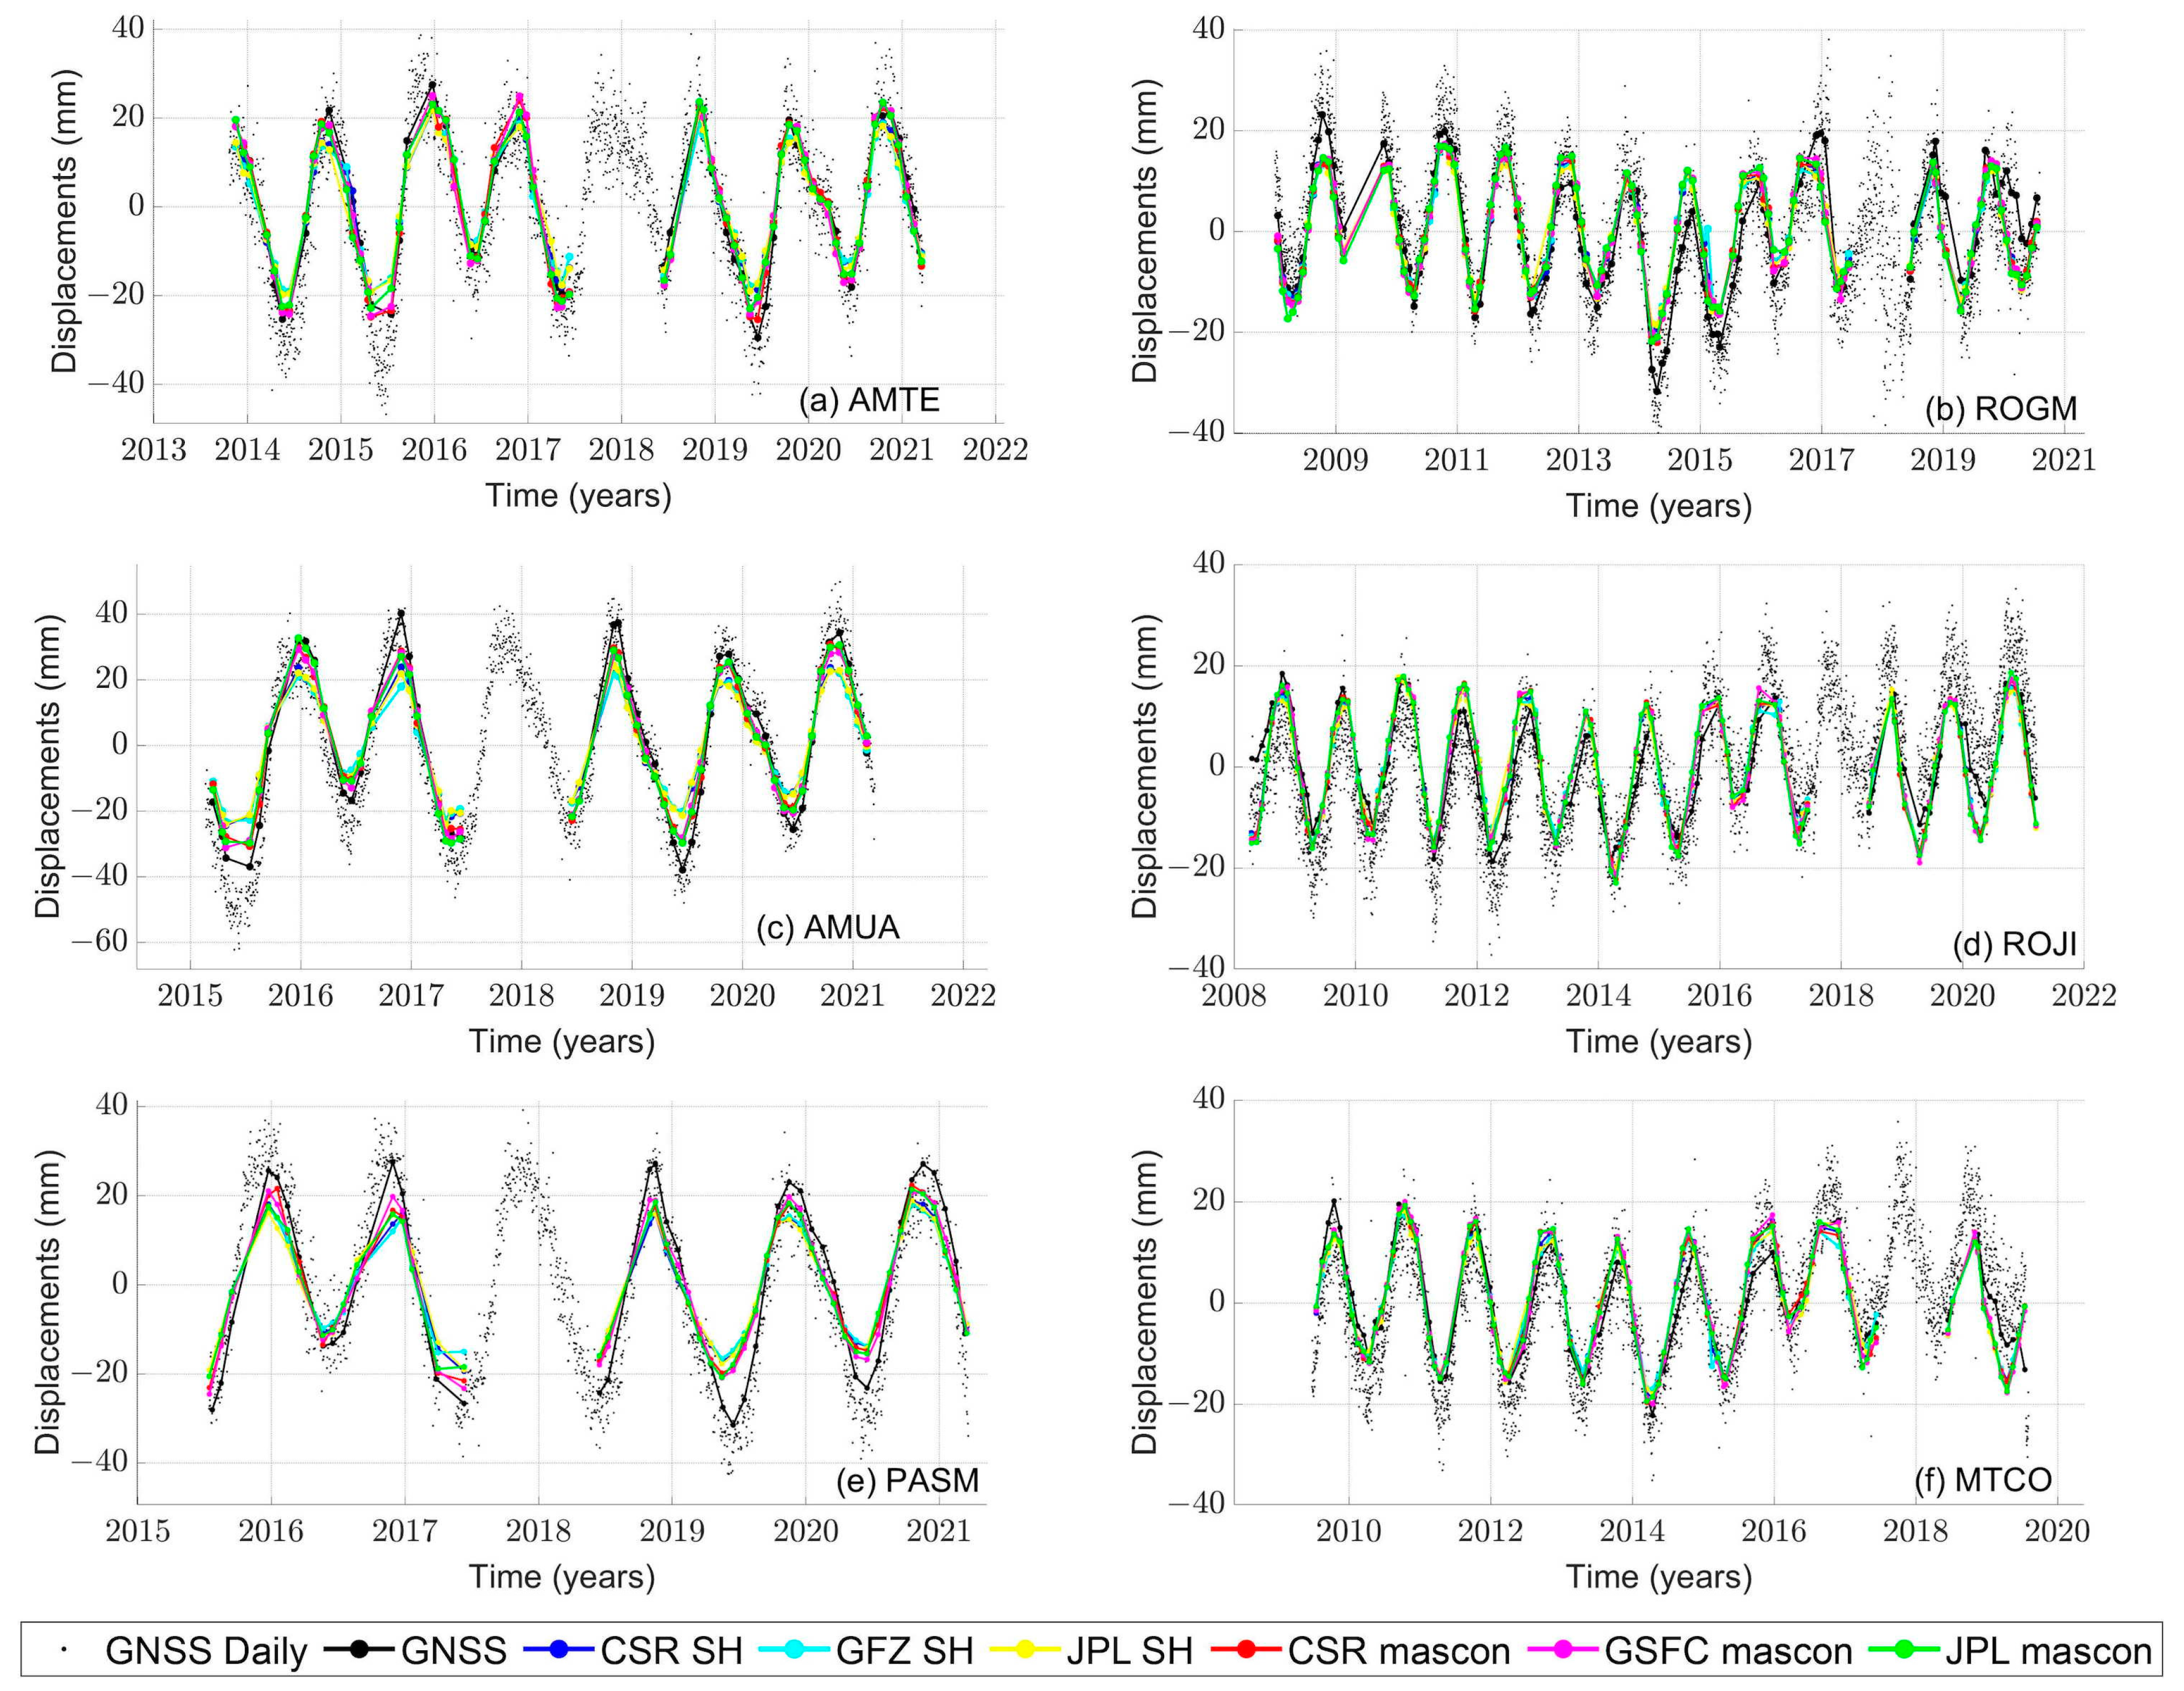
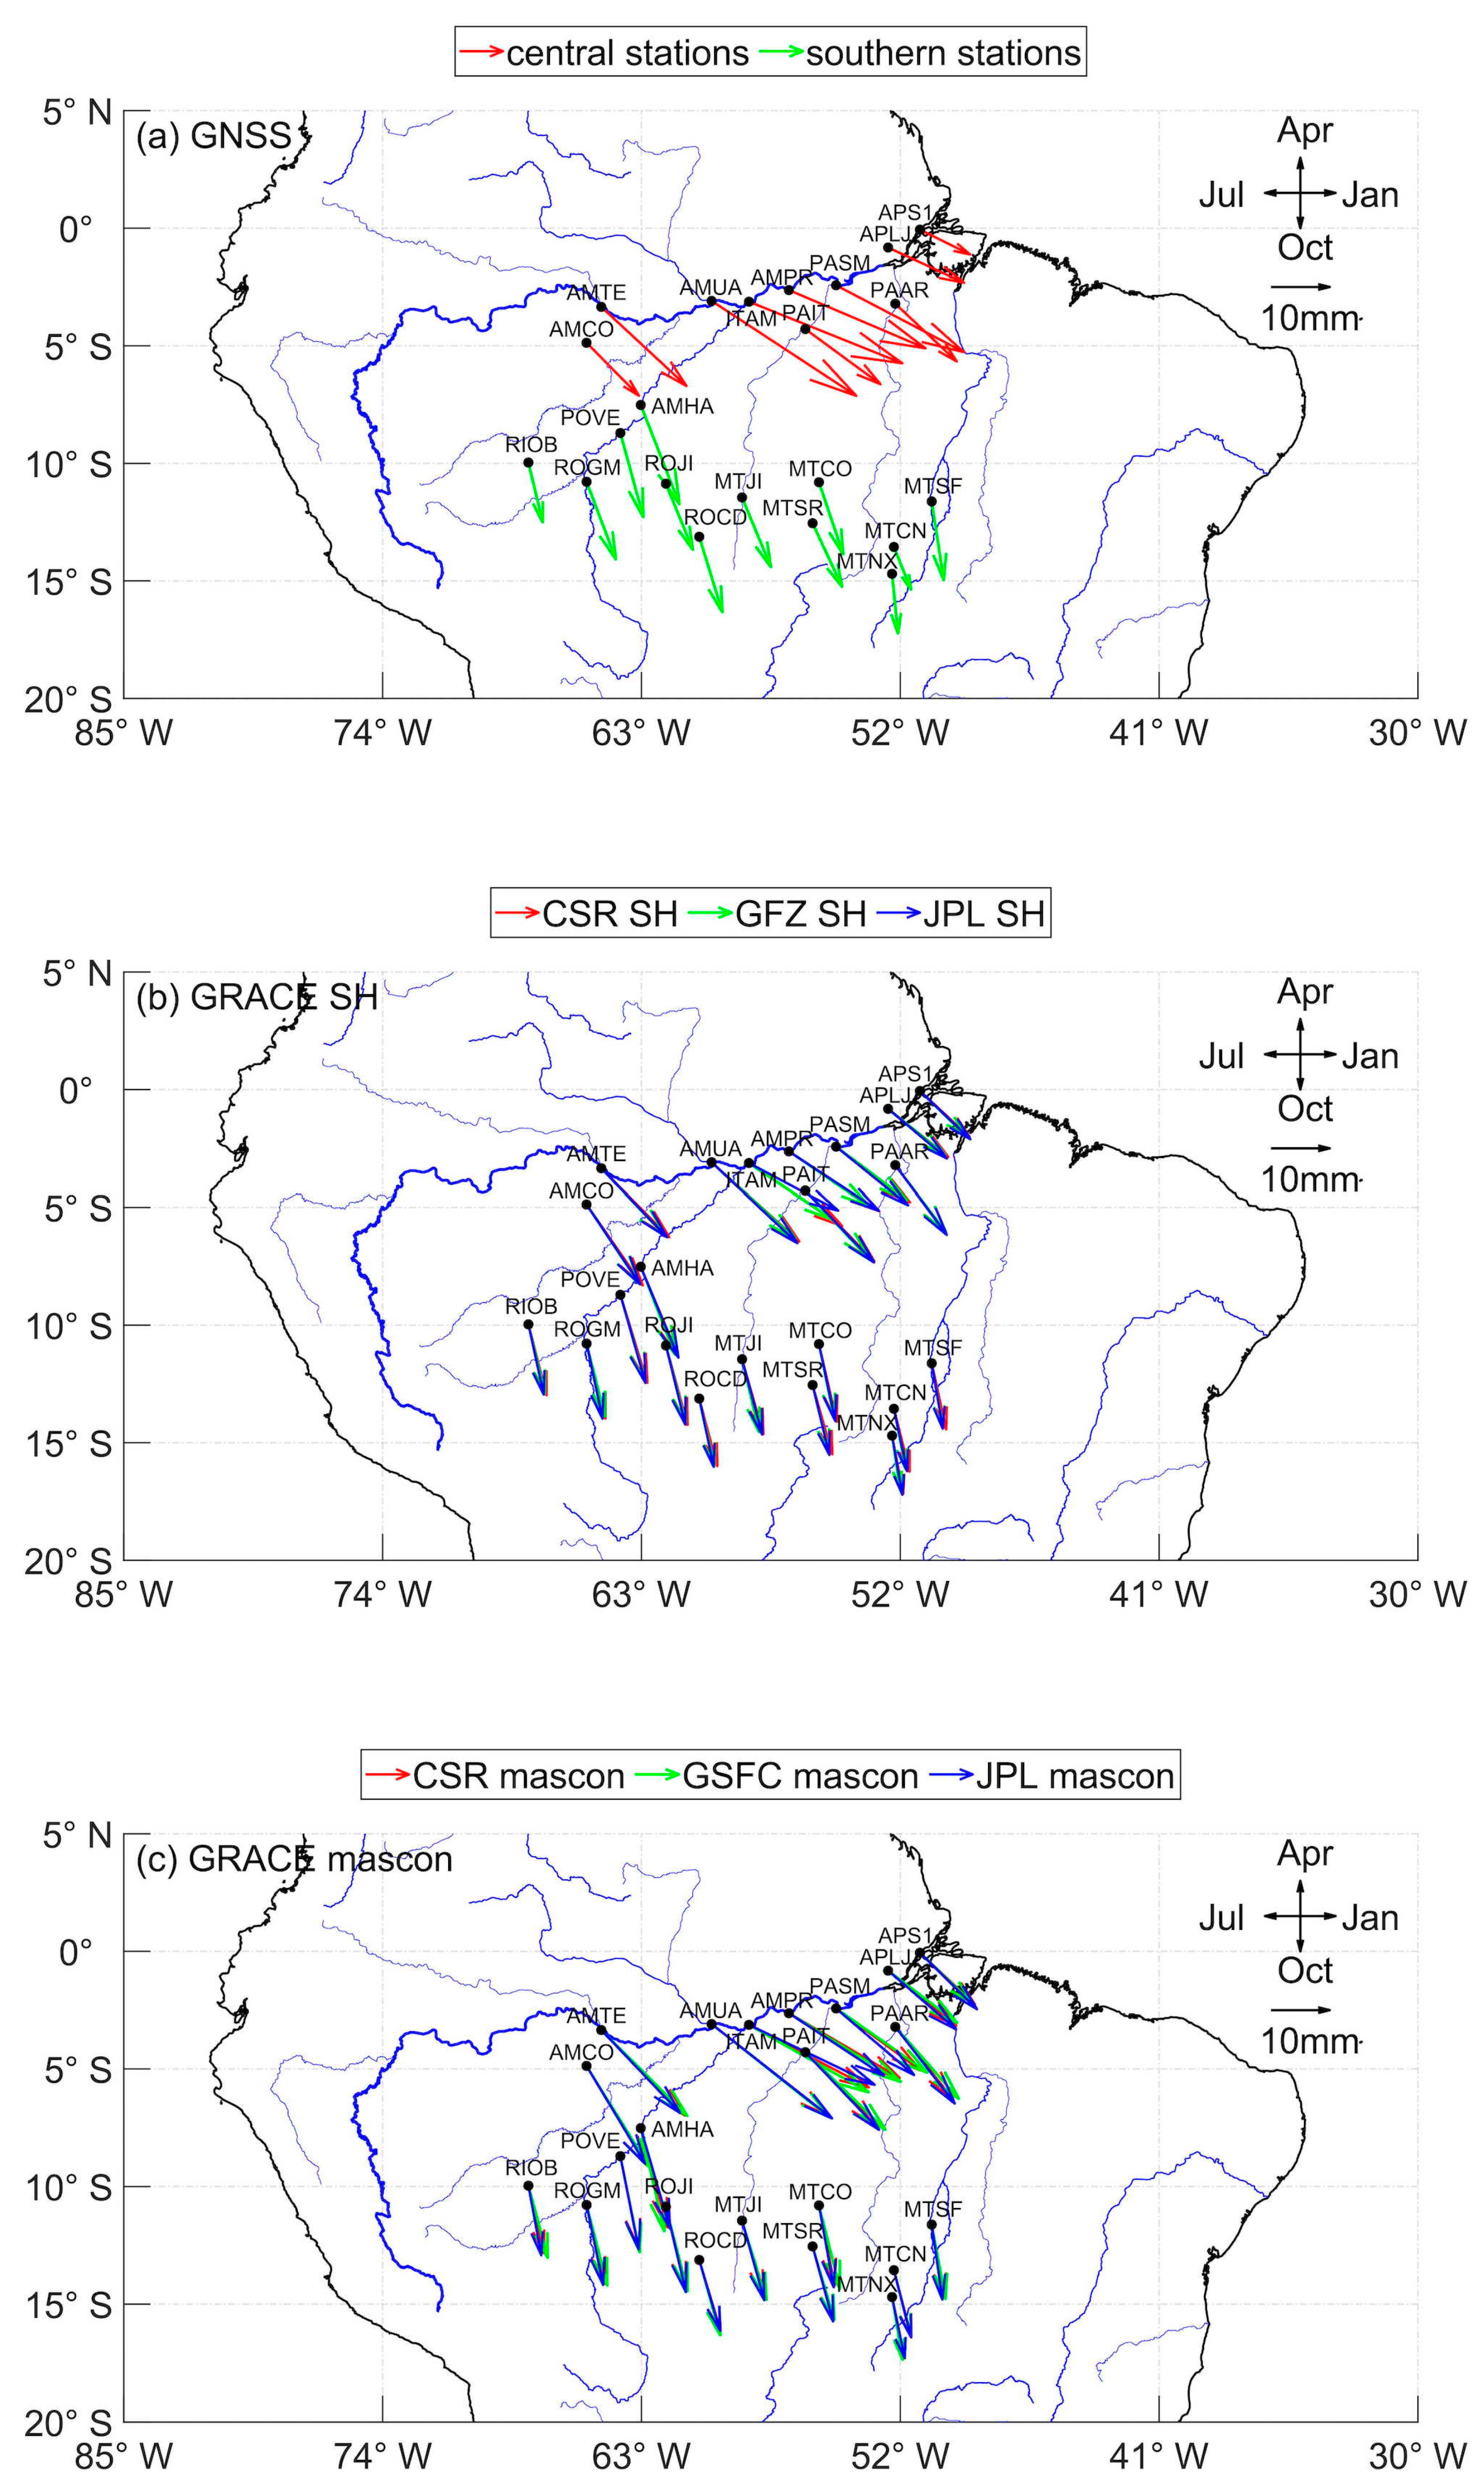
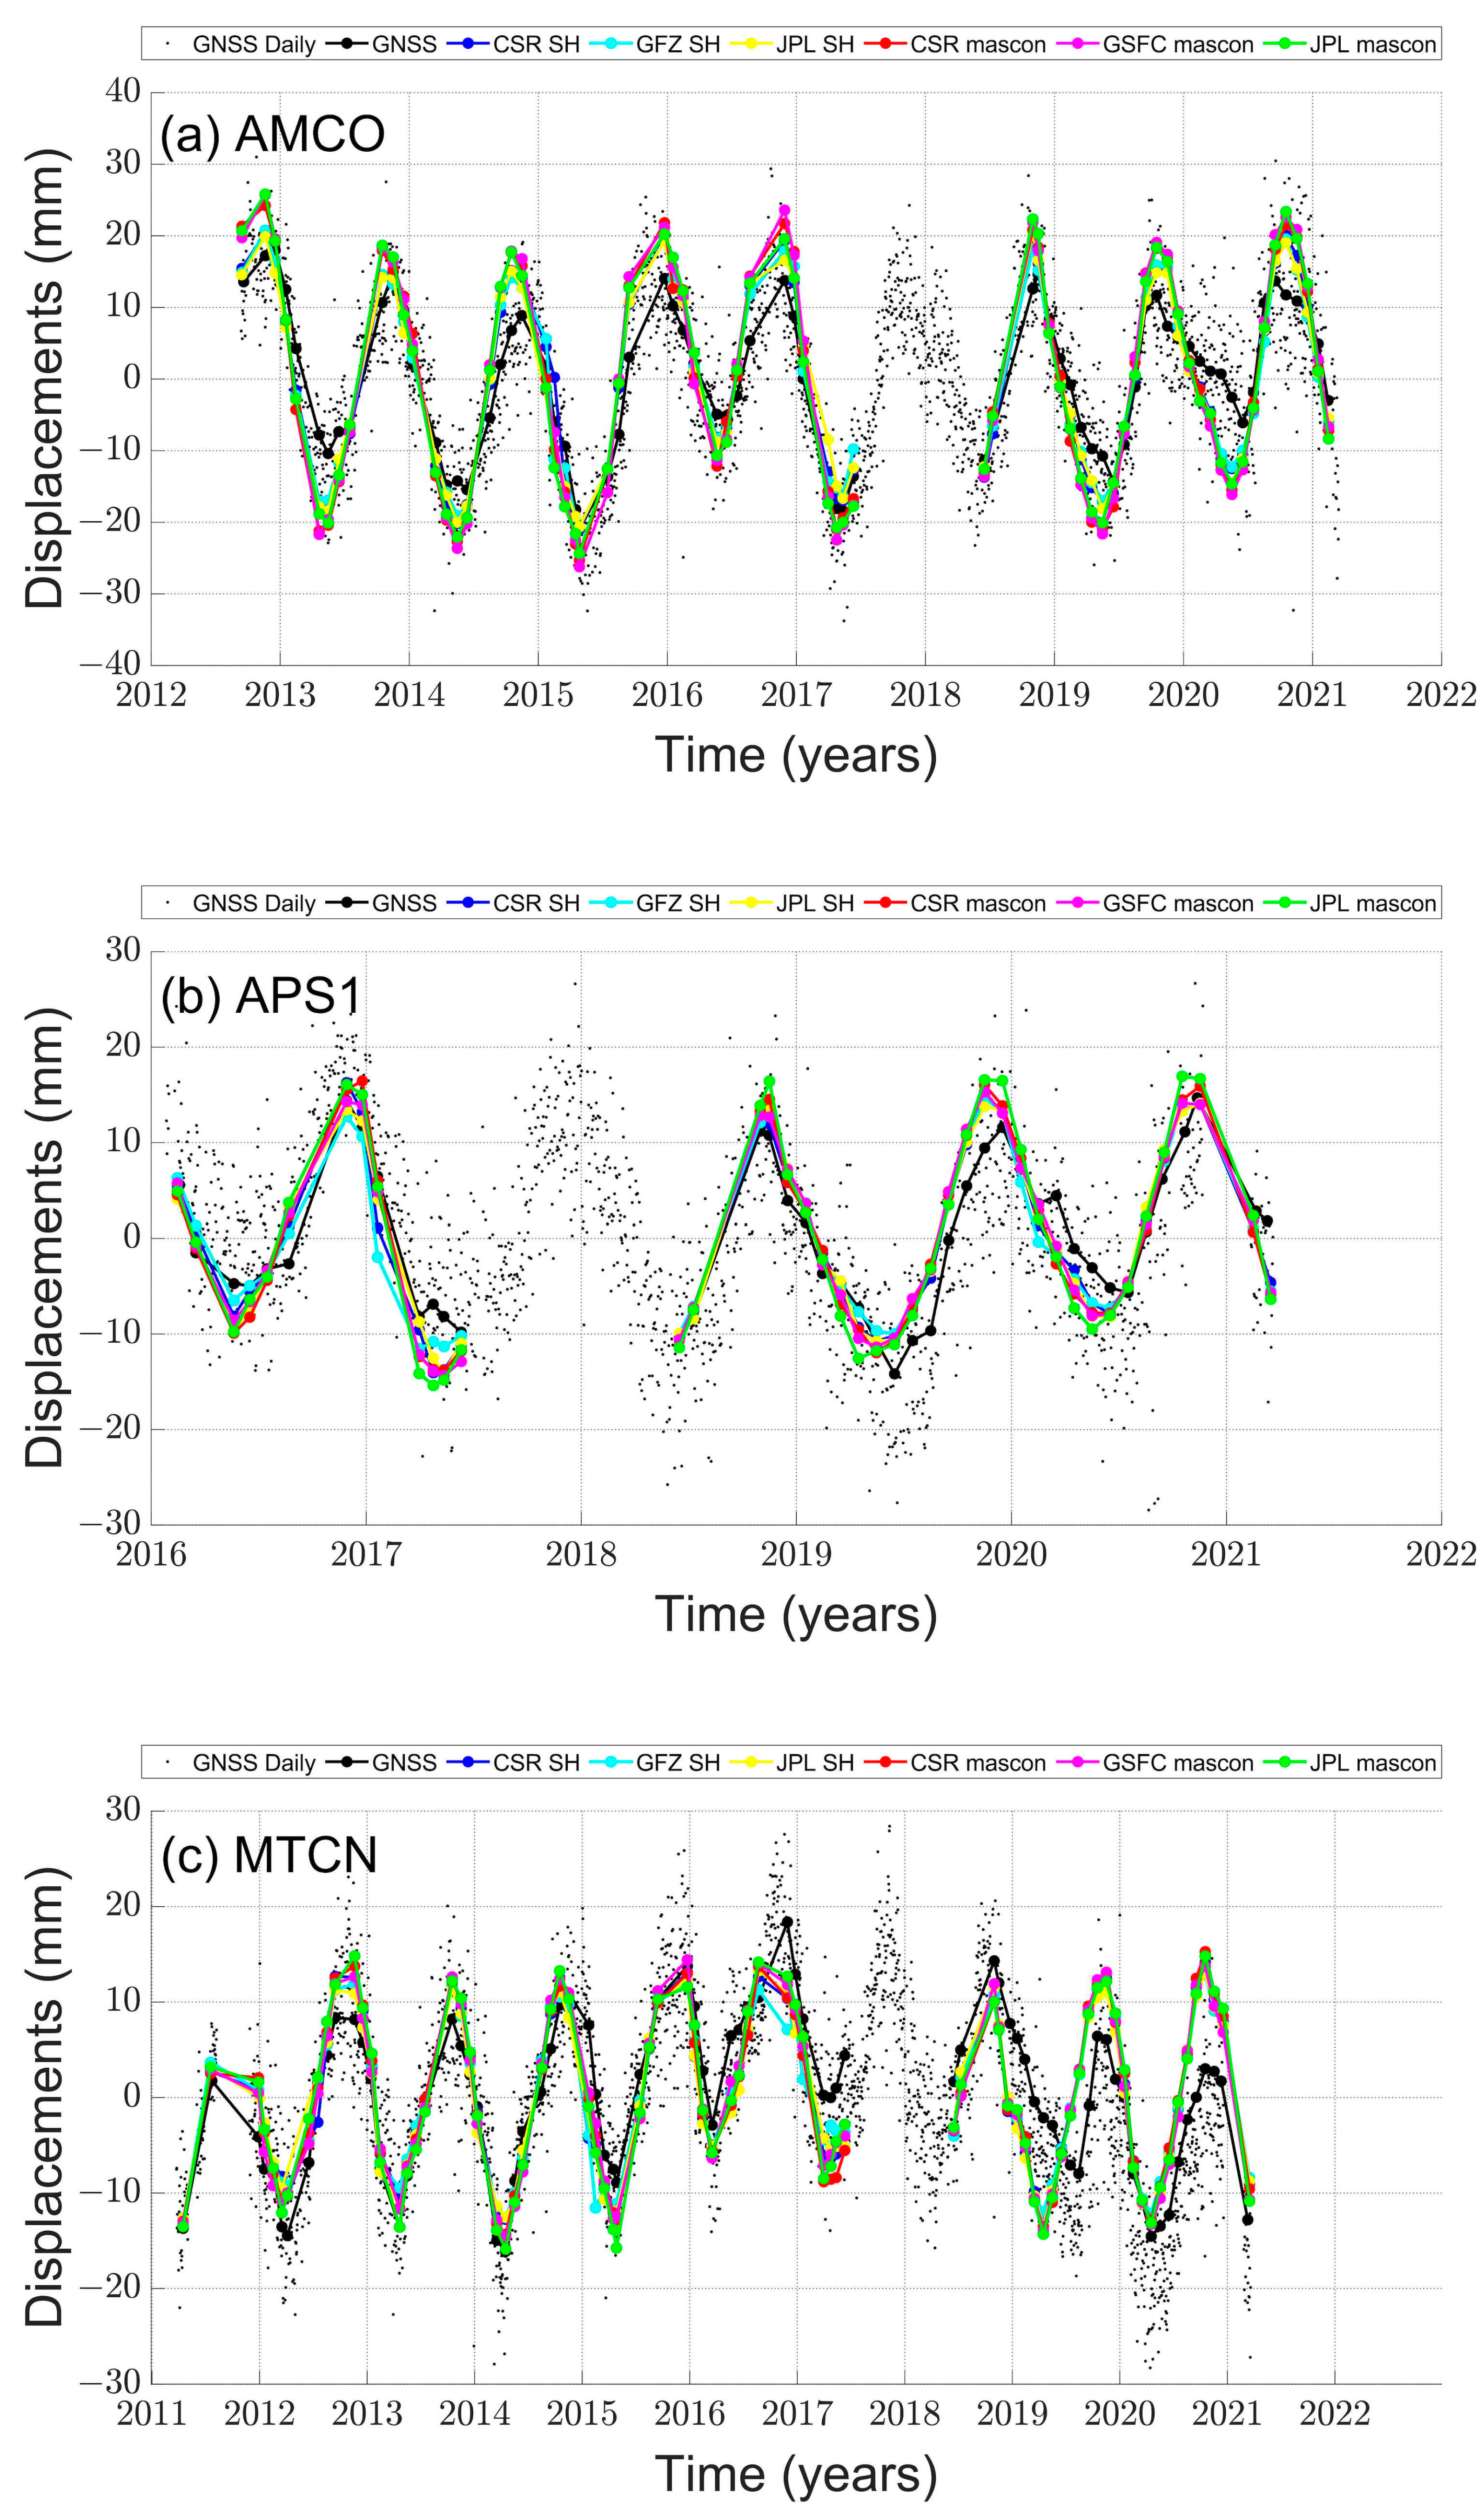
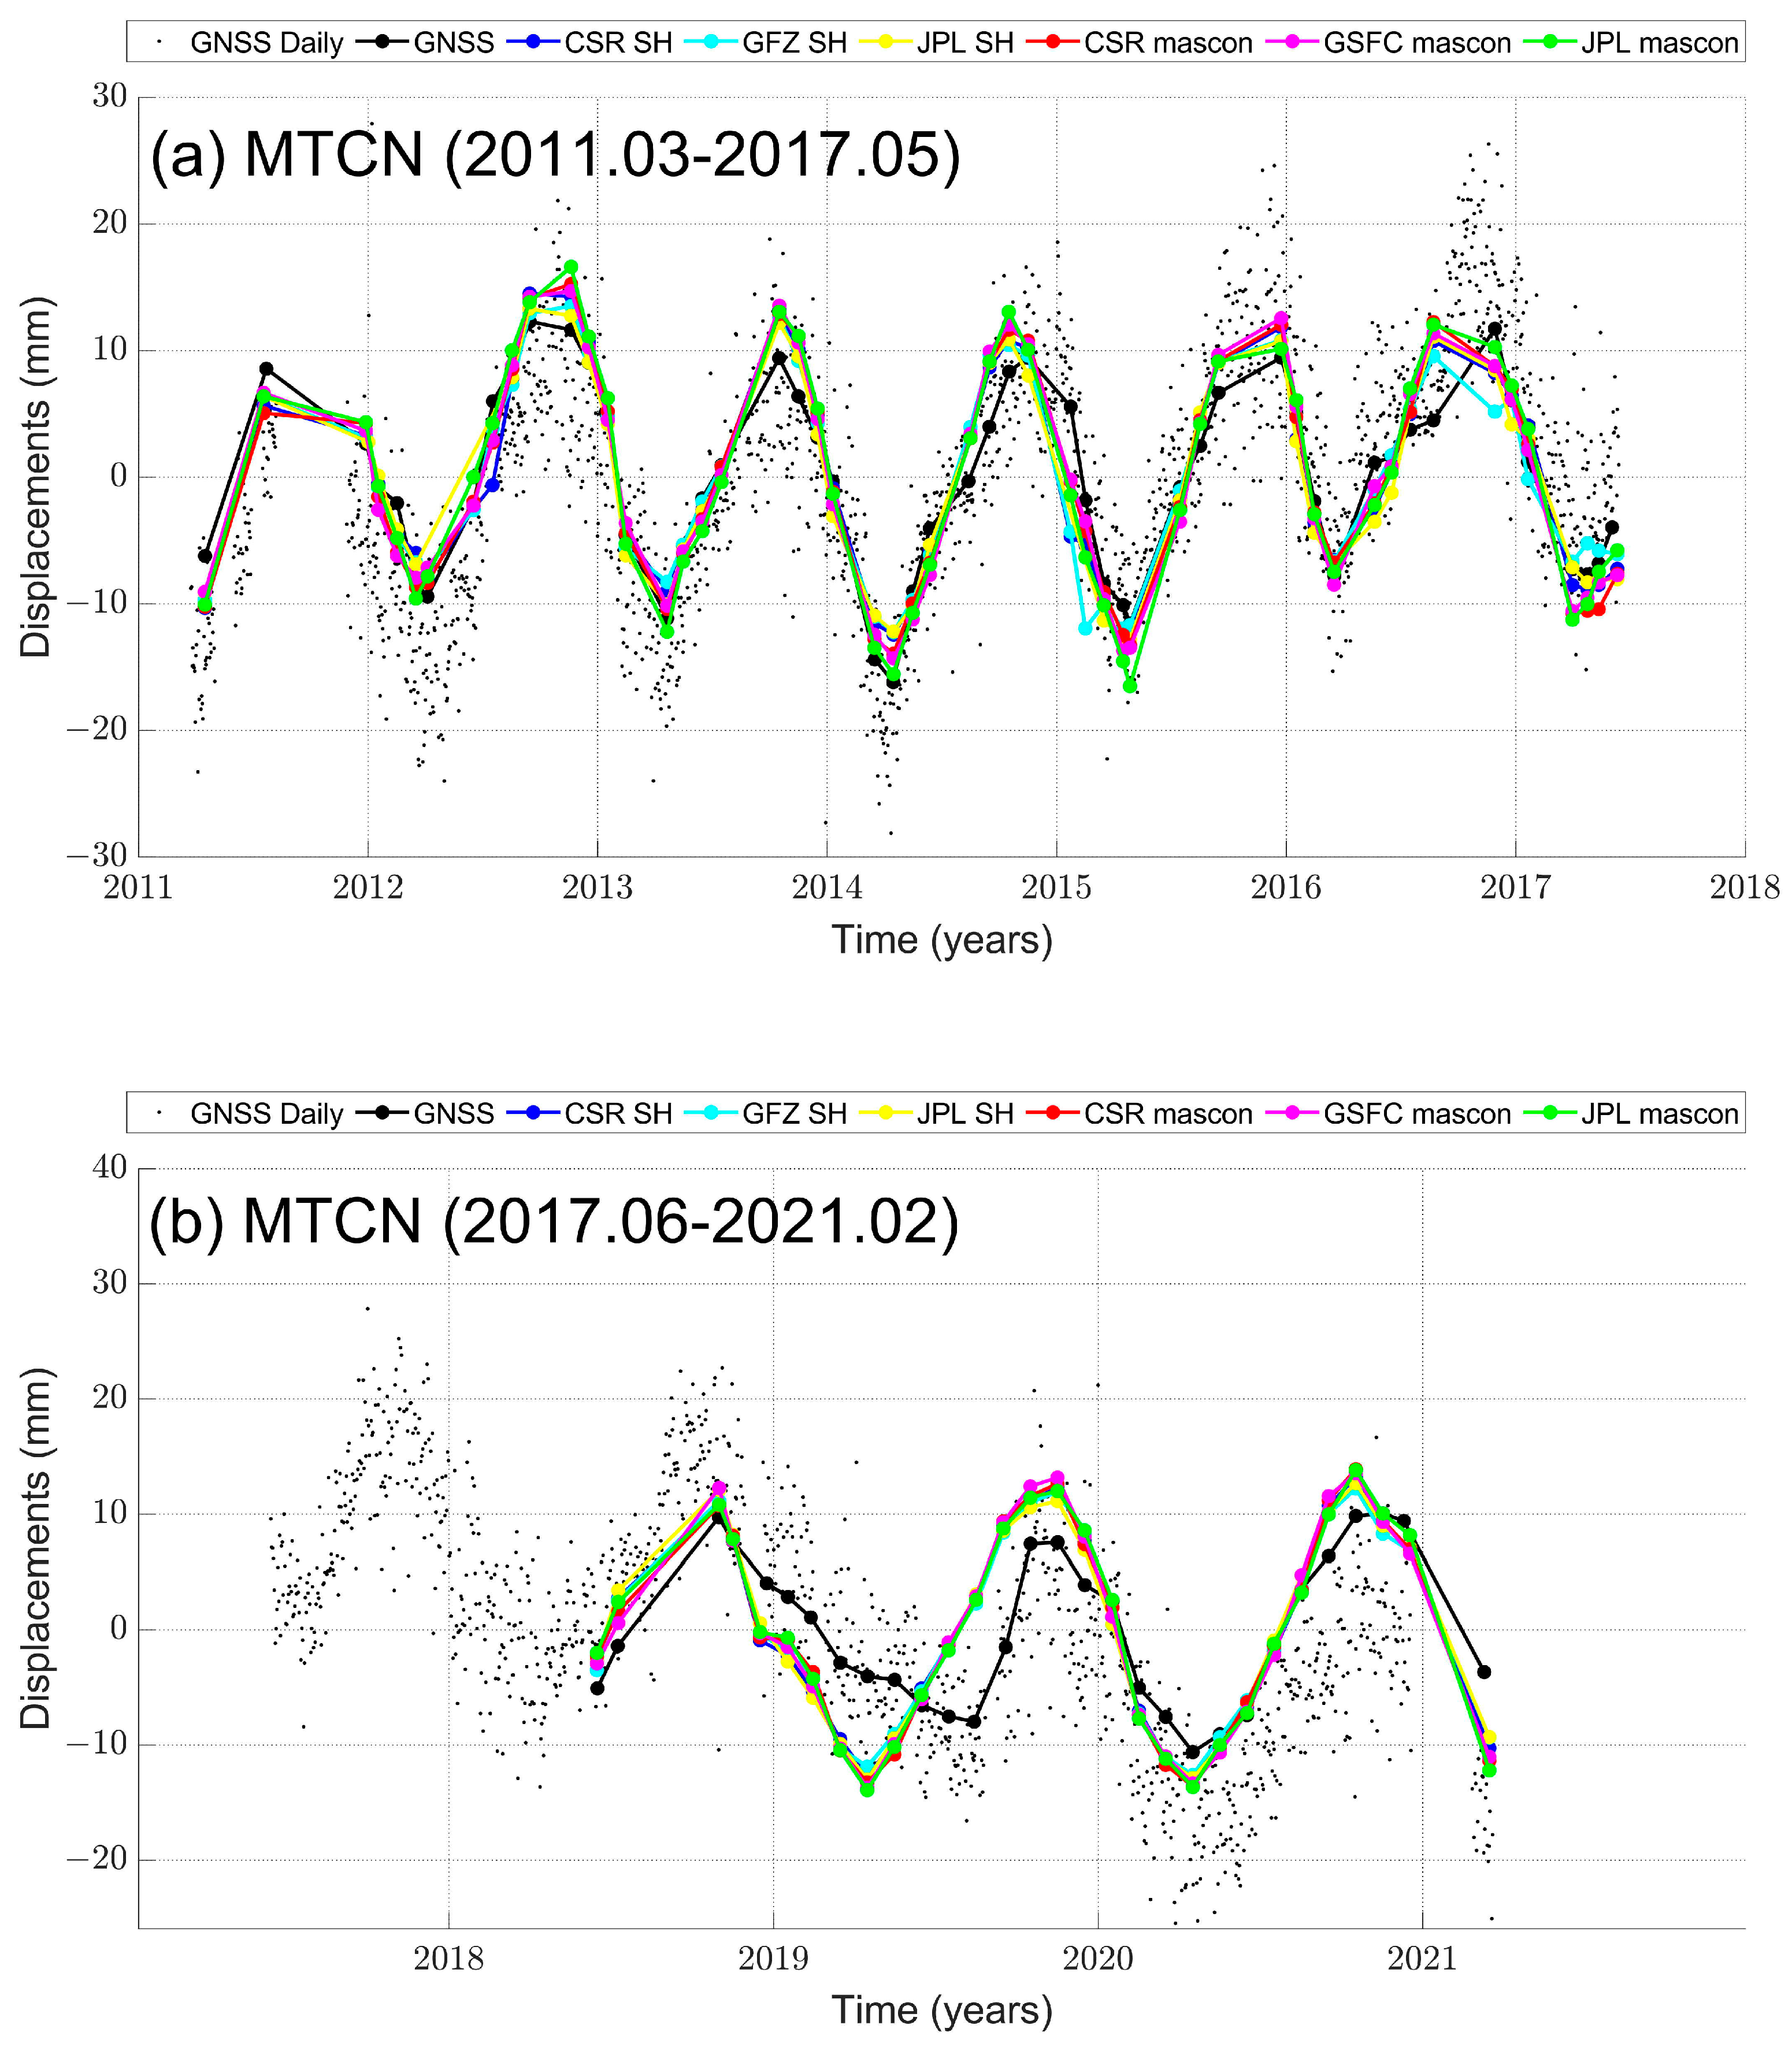
3.1. Comparison of Loading Deformations between GNSS and GRACE/GRACE-FO

3.1.1. Annual Variations Estimated from GNSS and GRACE/GRACE-FO

Figure 1 shows the time series from six GRACE/GRACE-FO and one GNSS products at the six selected stations. Among them, the AMTE, AMUA and PASM stations are located in the central Amazon Basin, and the ROGM, ROJI and MTSR stations are located in the southern Amazon Basin (relatively farther away from the Amazon River). All six time series exhibit dominant annual signals and their amplitudes reach up to more than 10 mm. Moreover, the difference between the stations located in the central Amazon Basin and those located in the southern Amazon Basin is obvious. The annual amplitudes at the stations in the center are much larger than those in the south, and the annual phases of the former lag behind those of the latter.
To further illustrate the annual signals and their spatial patterns, we show the annual amplitudes and phases of GNSS and GRACE/GRACE-FO series using the phasor diagrams in Figure 2. The 22 stations can be divided into two groups (i.e., central ones in red vectors and southern ones in green vectors in Figure 2) based on their annual amplitudes and phases from the GNSS series. The annual signals are determined using least squares fitting together with the constant, linear, annual and semi-annual terms. The equal-weight assumption has been used in the least squares fitting. The annual amplitude A and phase φ are defined as A cos ω t t 0 φ , where t 0 is 2008.0 and ω is the angular frequency equal to 2 π (1 cycle/yr). The length of vector in Figure 2 represents the annual amplitude, and the direction of vector denotes the annual phase (i.e., the epoch of peak-value). The mean GNSS annual amplitude of the time series at the 10 selected stations near the Amazon River (marked as red arrows in Figure 2a) is 19.4 mm, and the corresponding mean annual phase is 328 ° (which means the annual peak appears at the end of November). While for the other stations located relatively farther away from the Amazon River (marked as green arrows in Figure 2a), the mean GNSS annual amplitude is 12.7 mm, and the corresponding mean annual phase is 288 ° (which means the annual peak appears at the middle of October). The comparisons of annual amplitudes and phases of GNSS and six GRACE/GRACE-FO estimates are shown in Table 2.
The phasor diagram of the GRACE/GRACE-FO annual signals in Figure 2 shows a similar spatial pattern as in Figure 1, i.e., the larger amplitude and later month of peak-value (phase) appear at the stations near the Amazon River, and the smaller amplitude and earlier phase appear at the stations farther away from the Amazon River. Among the annual signals of deformations derived from the 6 GRACE/GRACE-FO products, the mean amplitude (of the time series at all the 22 stations) from the GSFC mascon product is the largest and that from the GFZ SH product is the smallest, while the mean phase from the GSFC mascon product is the latest and fairly close to that from the CSR SH product, and the mean phase from the GFZ SH product is the earliest. In general, the amplitudes from GRACE/GRACE-FO mascon products are larger than those from GRACE/GRACE-FO SH products, while the phases of the former have little difference with the latter. Different agreement percentages can be found when comparing the GNSS time series with those from GRACE/GRACE-FO mascon and SH products. In other words, the annual amplitudes from GRACE/GRACE-FO mascon products are much larger and agree better with GNSS than those from GRACE/GRACE-FO SH products. Moreover, these differences are more significant in the central Amazon Basin, and less significant in the southern Amazon Basin.
By fitting the annual terms from the GNSS and GRACE/GRACE-FO data, we obtain the mean annual amplitudes of vertical deformations (for the time series of all the 22 stations), which are listed in the last row in Table 2. We find that the derived annual amplitudes from the GRACE/GRACE-FO mascon products are larger than those from the GRACE/GRACE-FO SH solutions in 21 of all 22 stations, with only one station RIOB as an exception. Among the three mascon products, the annual amplitudes from the CSR mascon products are closest to those from GNSS, with a mean difference of 0.21 mm for all the 22 stations. Besides the annual amplitudes, the differences of the mean annual phases between GRACE/GRACE-FO and GNSS are 6.0 ° , 7.3 ° , 7.1 ° , 6.5 ° , 6.1 ° , and 7.3 ° , for the CSR SH, GFZ SH, JPL SH, CSR mascon, GSFC mascon and JPL mascon products, respectively. This indicates that the annual phases derived from the GRACE/GRACE-FO products lag behind those from GNSS. The CSR SH result shows the best agreement with GNSS in annual phase among the 3 SH products, while the GSFC mascon result shows the best agreement with GNSS in annual phase among the three mascon products.
In order to illustrate the agreement of annual signals between GNSS and GRACE/GRACE-FO, we calculate the annual amplitude reductions following the Equation (6) at all 22 stations (Figure 3). The background colors in Figure 3 denote the annual amplitudes of vertical loading deformations derived from GRACE/GRACE-FO, illustrating the amplitudes from the mascon products are generally larger than those from the SH products. The spatial patterns of the annual amplitudes from both GRACE/GRACE-FO mascon and GRACE/GRACE-FO SH products are similar, which show strong annual variations in the central Amazon Basin. The gray scales of the round dots represent the values of annual amplitude reductions, in which larger values are denoted with lighter colors that correspond to better agreements. The mean annual amplitude reductions for all the 22 stations are listed in the 2nd column in Table 3, corresponding to the 6 GRACE/GRACE-FO products. As shown in Figure 3, the difference in annual amplitude reduction is not significant among the different products.
As to the difference in central and southern Amazon Basin, the mean annual amplitude reductions using the 6 GRACE/GRACE-FO products are shown in the 3rd column and 4th column in Table 3, the annual amplitude reductions of the central Amazon Basin are much smaller than that of the southern Amazon Basin. In the central Amazon Basin, the annual amplitude reductions using the SH products are slightly smaller than those using the mascon products.

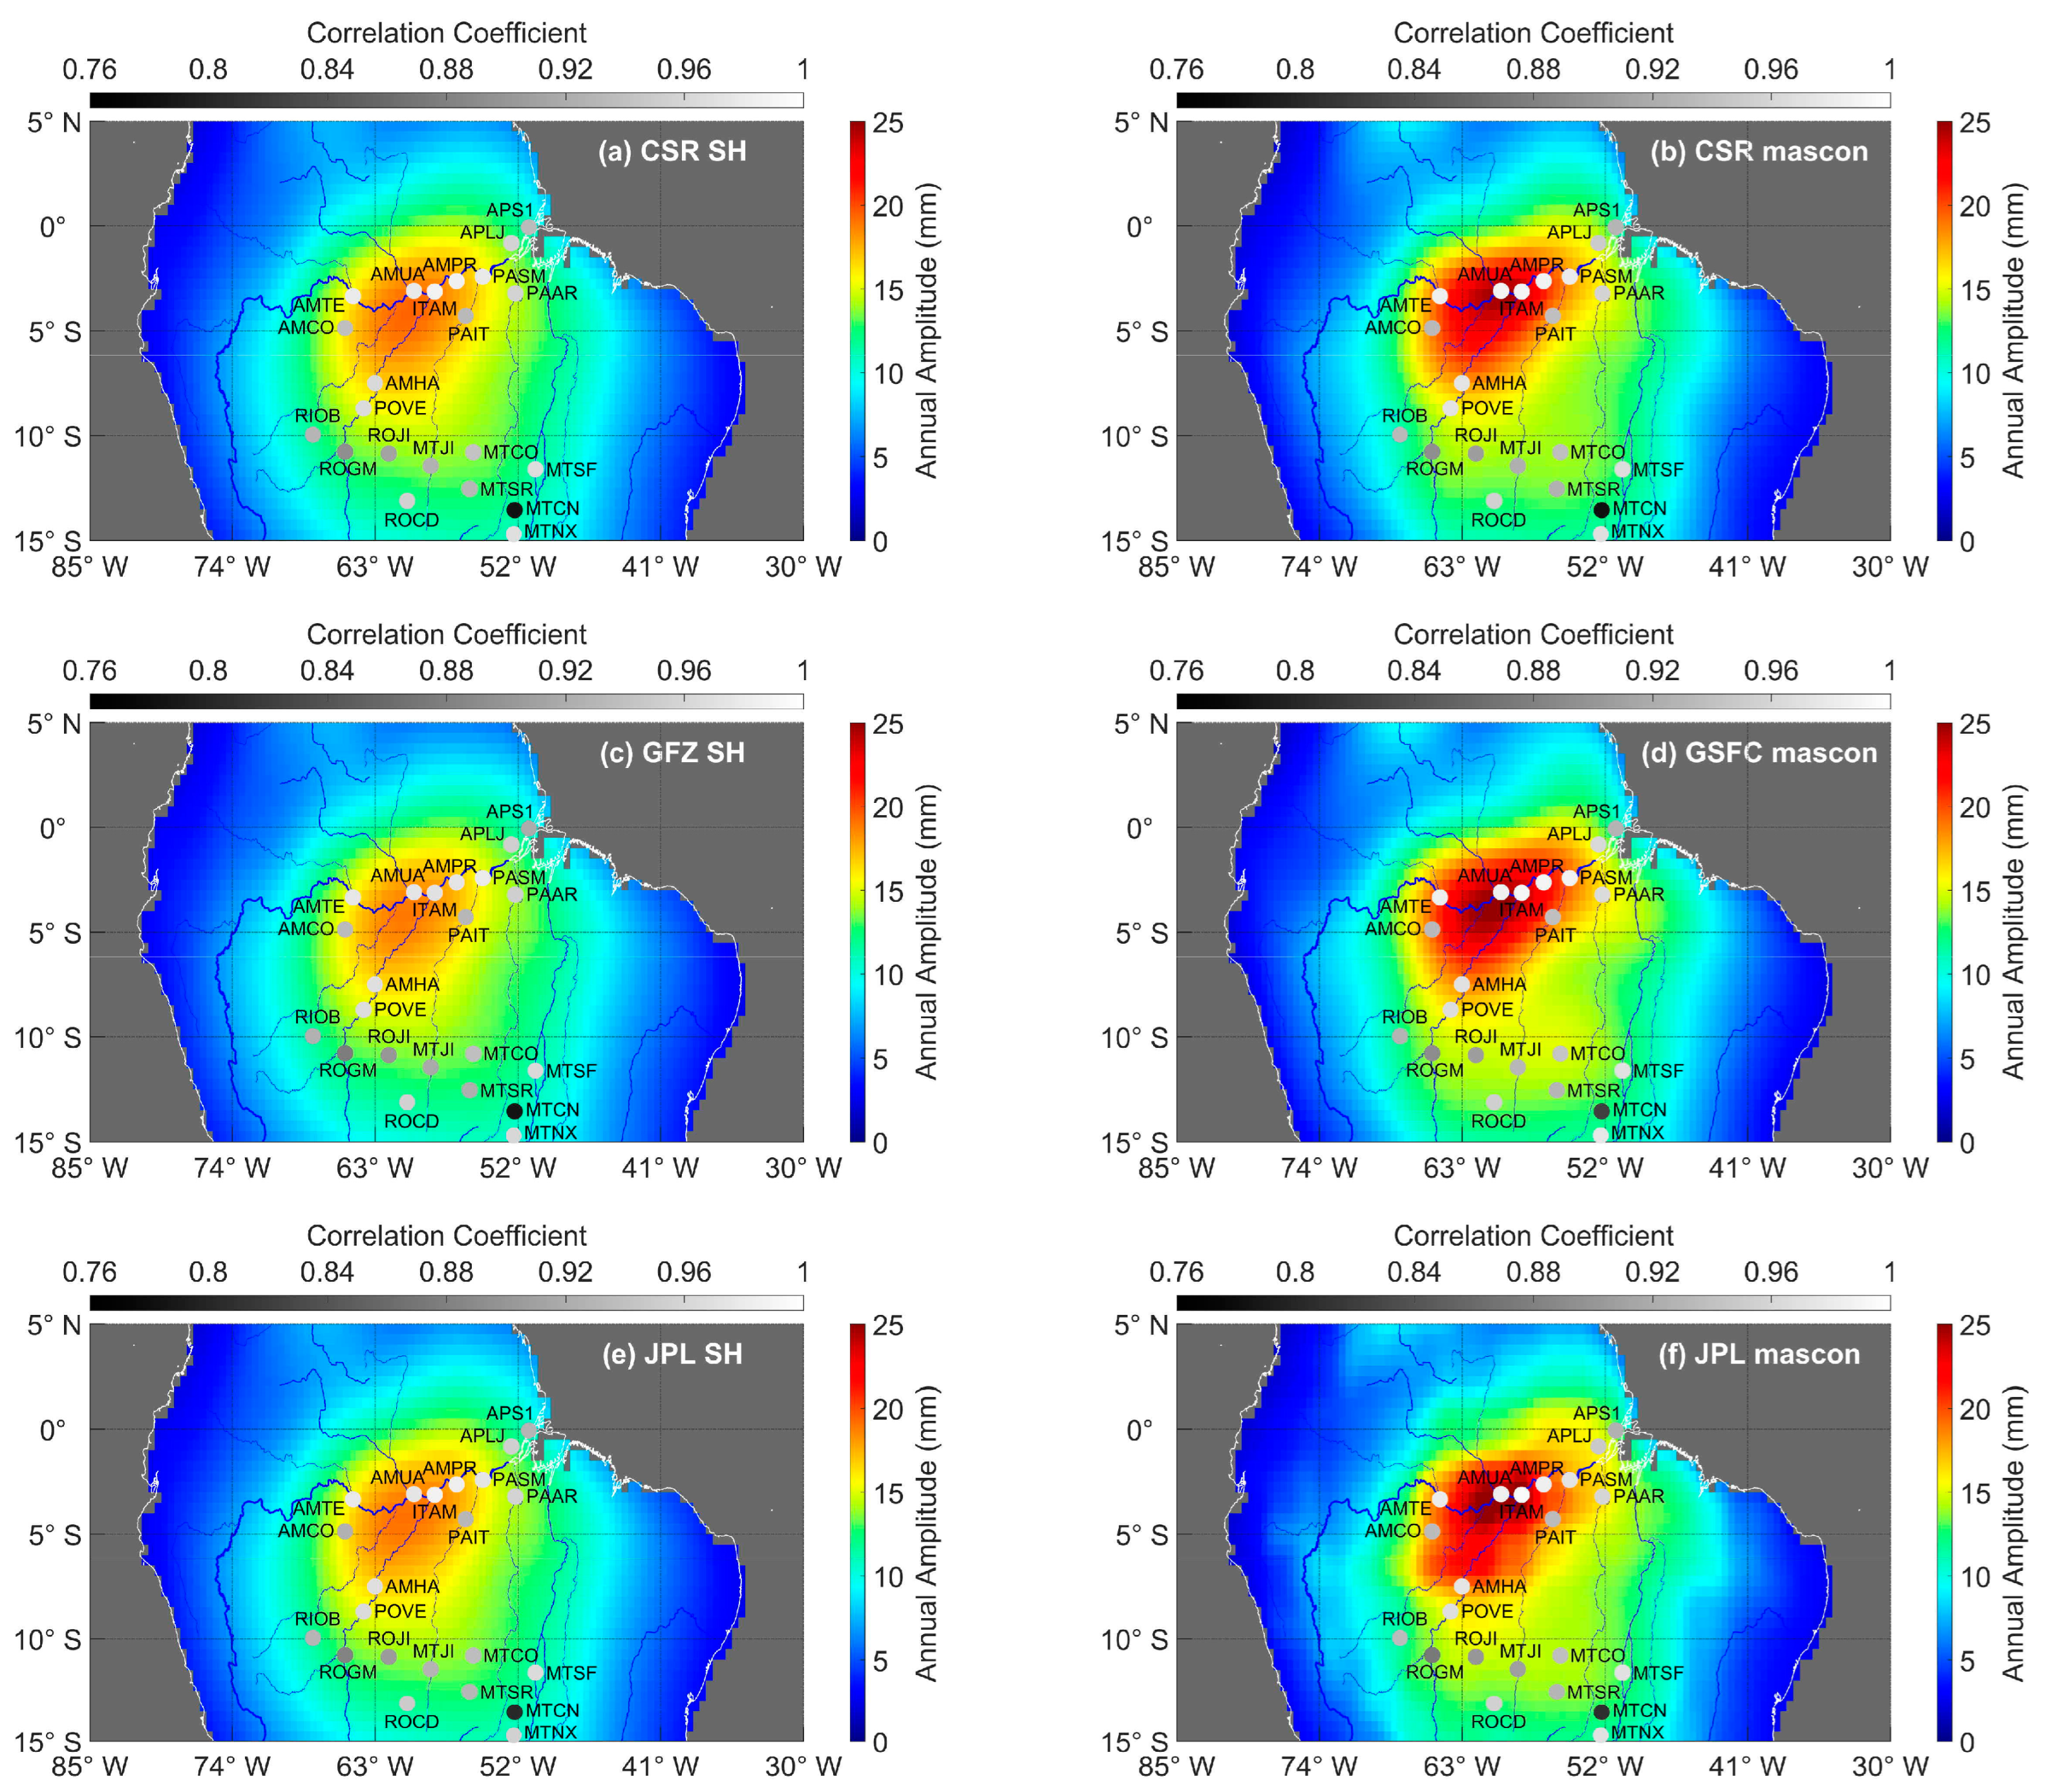
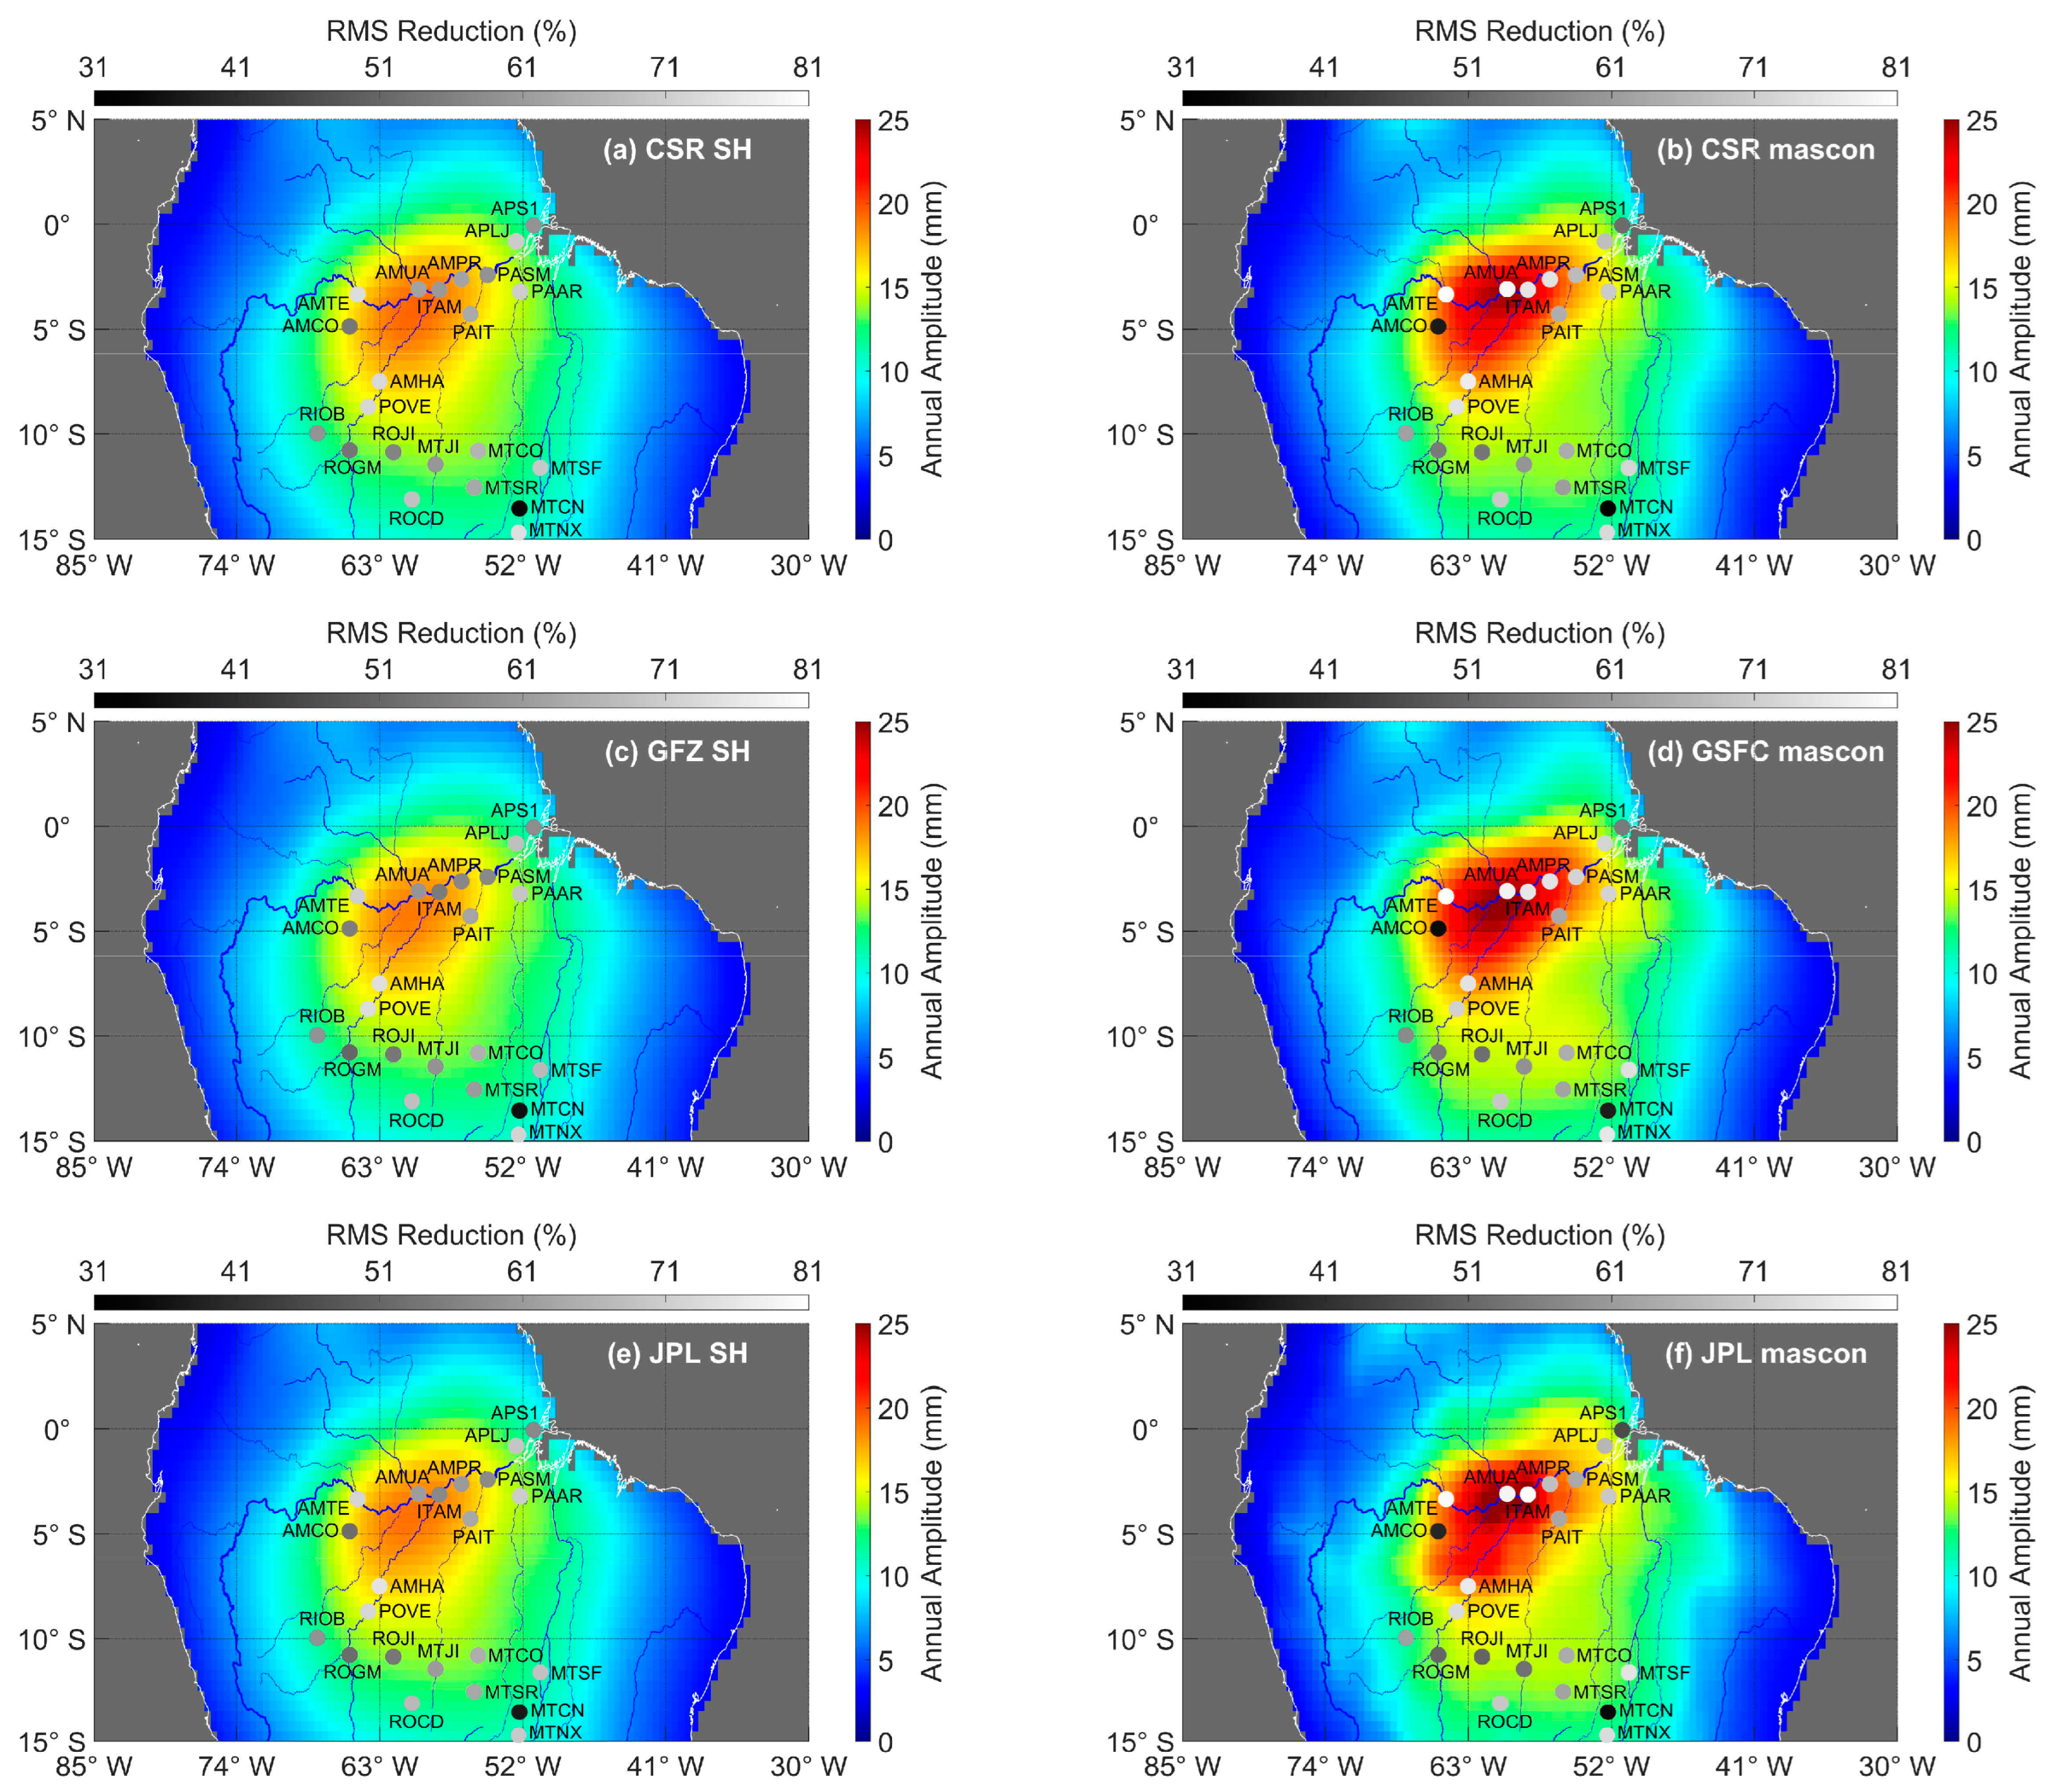
3.1.2. Agreement Evaluation of GNSS and GRACE/GRACE-FO Loading Deformations

In order to quantify the agreement between the GRACE/GRACE-FO derived vertical loading deformations and the GNSS displacement time series, we calculate the correlation coefficients and RMS reductions using the method as described in Section 2.3.2.
Figure 4 shows the correlation coefficients between GRACE/GRACE-FO and GNSS displacement series. The gray scales of the round dots represent the values of the correlation coefficients. The correlation coefficients of the derived vertical displacement series at the 22 stations from the 6 GRACE/GRACE-FO products are all over 0.9 except for MTCN and ROGM, which demonstrates the high correlation between GRACE/GRACE-FO and GNSS in the Amazon region. The mean correlation coefficient of six GRACE/GRACE-FO products in the central Amazon Basin is about 0.96, which is a little larger than that in the southern Amazon Basin with a value of 0.93. The correlation coefficients using GRACE/GRACE-FO mascon solutions and SH solutions are close.
The correlation coefficient is used to evaluate the correlation between two time series, which focuses more on the characteristics of the temporal variations but less on the amplitudes of the signals. The RMS reduction, which has been widely used in previous studies, is used here to estimate the agreement between two time series.
Figure 5 shows the RMS reductions when GRACE/GRACE-FO derived displacements are removed from the GNSS height time series. The gray scales of the round dots represent the values of RMS reductions. The mean RMS reductions of the six GRACE/GRACE-FO products are listed in the 8th column, for CSR SH, GFZ SH, JPL SH, CSR mascon, GSFC mascon and JPL mascon, respectively, the results of 3 mascon products are a little larger than that of three SH products in the central Amazon Basin, but the differences become much more significant when removing the AMCO station, whose result seems to be abnormal. Overall, the values at all the 22 stations are positive, which means that the GNSS height variations can be explained by mass loading effects to a certain extent in this region. Furthermore, the RMS reductions are relatively larger in the central Amazon Basin, and relatively smaller in the southern Amazon Basin. This spatial feature is more apparent for the stations near the Amazon River using GRACE/GRACE-FO mascon products (e.g., AMTE, AMUA, ITAM and AMPR in Figure 5b,d,f), which suggests that the observations from the mascon products might be more informative in reflecting spatial patterns than the SH products do.

3.2. Uncertainty Assessment of Loading Deformations from Different GRACE Products

Since annual variations dominate the GRACE/GRACE-FO derived loading deformations in the study region, we remove the annual and trend terms by time series fitting to eliminate the influence of the probable differences of annual/trend signals in estimating noise of different GRACE/GRACE-FO products. The residuals include noise and other unfitted signals (e.g., the random spikes and the interannual variations). With the assumption that the deformation derived from the six GRACE/GRACE-FO solutions are independent of each other, we apply the “Three-Cornered Hat” (TCH) method [37] to calculate the noise variances. Each deformation time series can be expressed as the sum of the true loading deformation signal (i.e., unfitted signal here) plus noise as follows.
Deform CSR   SH = Deform True + Noise _ Deform CSR   SH Deform G F Z   SH = Deform T r u e + N o i s e _ D e f o r m G F Z   SH D e f o r m J P L   SH = D e f o r m T r u e + N o i s e _ D e f o r m J P L   SH D e f o r m C S R   mascon = D e f o r m T r u e + N o i s e _ D e f o r m C S R   mascon D e f o r m G S F C   mascon = D e f o r m T r u e + N o i s e _ D e f o r m G S F C   mascon D e f o r m J P L   mascon = D e f o r m T r u e + N o i s e _ D e f o r m J P L   mascon
The subtraction of any two time series should eliminate the deformation signal in common and formulate a set of fifteen linear variance equations:
var ( N o i s e _ D e f o r m C S R   SH ) + var ( N o i s e _ D e f o r m G F Z   SH ) = var ( D e f o r m C S R   SH D e f o r m G F Z   SH ) var ( N o i s e _ D e f o r m C S R   S H ) + var ( N o i s e _ D e f o r m J P L   S H ) = var ( D e f o r m C S R   S H D e f o r m J P L   S H ) var ( N o i s e _ D e f o r m C S R   S H ) + var ( N o i s e _ D e f o r m J P L   m a s c o n ) = var ( D e f o r m C S R   S H D e f o r m J P L   m a s c o n ) var ( N o i s e _ D e f o r m G S F C   m a s c o n ) + var ( N o i s e _ D e f o r m J P L   m a s c o n ) = var ( D e f o r m G S F C   m a s c o n D e f o r m J P L   m a s c o n )
We use the least squares estimation to compute the noise variance as well as the standard deviation (STD), from the deformation time series derived from the six GRACE/GRACE-FO products.
For all the six GRACE/GRACE-FO products in the Amazon Basin, the maximum variance values occur in the middle reaches of the Amazon River, which demonstrates that the noise of GRACE/GRACE-FO derived loading deformations is related to the amplitude of the loading signal, the larger the annual amplitude, the larger the noise. Because we only fit and remove the annual signals before applying the TCH method, the difference of the unfitted signals may affect the noise variance (i.e., the Noise_Deform terms in Equation (8) still have residual signals). For the results from the three SH products as shown in Figure 6a,c,e, the magnitude and the spatial distribution of the noise have a strong resemblance, which may be due to the following reasons: (a) The SH products provided by the three institutions have little difference, and (b) The post-processing strategy (decorrelation and spatial filtering) further attenuates the difference. For the results from the three mascon products as shown in Figure 6b,d,f, the significant differences may be caused by different data processing approaches in generating the mascon products, e.g., the CSR mascon used the Tikhonov regularization along with L-ribbon approach to compute the regularization parameter, and they applied the ellipsoidal correction [38], the GSFC mascon divided the earth into several regions and used corresponding regional constraints respectively, and a global hydrological model is applied as a priori model for iteration to reduce signal leakage, to separate the land signal and ocean signal from each other, the JPL mascon applies a CRI (Coastline Resolution Improvement) [39] filter approach in the post-processing, and to aid in the interpretation of signals in sub-mascon resolution, JPL mascon also provides gain factors data [40], which are derived from the CLM (Community Land Model) hydrology model. Furthermore, the variances of the derived deformations from the CSR SH and GSFC mascon products are significantly smaller than those from the other four GRACE/GRACE-FO products, while those from the JPL mascon products show more notable spatial discontinuity compared to the results from the other products.
.

4. Discussion

4.1. Possible Reasons for the Agreement Differences over Different Regions and Using Different GRACE/GRACE-FO Solutions

In general, the GRACE/GRACE-FO mascon derived vertical loading deformations agree better with GNSS height series than those derived from SH solutions, according to the RMS reduction and annual amplitude reduction analyses. This can be clearly demonstrated by the results shown in Table 3, where the values in rows 4–6 (for mascons) are generally larger than those in rows 1–3 (for SH). In addition, the filtering method of SH products is an empirical one (P4M6 decorrelation +300 km Gaussian smoothing), while the changes in these filtering parameters (e.g., P3M6 decorrelation, 500 km Gaussian smoothing) would not significantly affect the comparison of the smoothed SH results with the mascon results. Moreover, it is worth noting that this phenomenon is more obvious in the central Amazon Basin, while in the southern Amazon Basin, the agreements with GNSS observations using the mascon or SH solutions are comparable.
The differences in signal magnitudes (mainly annual variations in the Amazon Basin) reflected by different GRACE/GRACE-FO solutions may be one reason for the above phenomenon. In the central Amazon Basin, the dominant regional/local annual loading signals can be observed by the in situ GNSS stations. However, the GRACE/GRACE-FO solutions, due to their relatively low spatial resolution, are unlikely able to capture the signals in small spatial scales (such as those in the main river channels) and thus underestimate the amplitudes of loading deformations in this region. This is confirmed by a recent study [41] that compared GNSS observations with a high resolution mass loads derived from combining GRACE SH solutions with river routing model in the Amazon Basin.
Since the mascon products include additional constraints (as described in Section 2) and reflect larger amplitudes of loading deformations than the SH products do, better agreements between the mascon and GNSS over the central Amazon Basin can be obtained. While in the southern Amazon Basin with smaller amplitudes of annual loading signals, the GRACE/GRACE-FO solutions probably overestimate the signals due to the fact that the annual amplitudes reflected by the SH and mascon data at most GNSS stations are slightly larger than those observed by GNSS. Therefore, the agreements with GNSS for the two GRACE/GRACE-FO products (mascon and SH) are much closer and fewer differences are visible.
Moreover, when comparing the annual amplitude reductions from the GNSS stations at the central Amazon Basin with those from the stations at the southern Amazon Basin, the former are notably smaller than the latter for both the SH and mascon solutions, i.e., the values in the 4th column are larger than those in the 3rd column in Table 3. In addition, for the stations over the central Amazon Basin, the mean annual phase of the derived displacement series from the 6 GRACE/GRACE-FO solutions is 9.9 ° smaller (that is, ~10-day earlier) than that observed by GNSS, while for the stations over the southern Amazon Basin, the phase difference is 4.1 ° . The reason for the relatively larger annual phase lag in central Amazon is unknown but may be also related to the complications of water storage in river channels in GRACE-observed water mass loads.

4.2. Explanations for the Disagreements at Specific GNSS Stations

The statistical results show that the agreements between GNSS and GRACE/GRACE-FO at AMCO, APS1 and MTCN are apparently lower than those at the other GNSS stations (see the darker round dots at the three stations in Figure 3, Figure 4 and Figure 5). We examine the reasons for the disagreement for each of the three stations as below.
Figure 7a shows the comparison of time series from different products at the AMCO station. The annual amplitudes derived from the GNSS time series and six GRACE/GRACE-FO products of AMCO are listed in Table 2, the amplitude value of GNSS is much smaller than that of GRACE/GRACE-FO. Any inaccuracy in the observations of either GNSS or GRACE/GRACE-FO would contribute to the differences in annual amplitudes, and thus lead to the above disagreement. The uncertainty assessment in Section 3.2 shows that the noise level of GRACE/GRACE-FO is minor relative to the magnitude of the loading signals. Moreover, local mass loading variations in the surrounding area or artificial perturbations of ground motion at the AMCO station can be observed by GNSS but can hardly be detected by GRACE/GRACE-FO. The mismodeling or errors in the data processing of GNSS at AMCO may also contribute to the discrepancy from the observations of GRACE/GRACE-FO.
Figure 7b shows the comparison of time series from different products at the APS1 station. The insufficient length of observations (less than 5 years including the gap between GRACE and GRACE-FO) is one of the reasons for the disagreement between GNSS and GRACE/GRACE-FO. Furthermore, the APS1 is located at the coastline, and is vulnerable to the GRACE/GRACE-FO signal leakage effect (the signal over the land leaks into the ocean and vice versa), which may also lead to large differences between GNSS and GRACE/GRACE-FO.
The agreement at MTCN is the worst among all the selected stations in this study. The time series comparison in Figure 7c shows that the interannual variation (an increase before the end of 2016 and a decrease after 2017) is strong in the GNSS series, and relatively weaker in GRACE/GRACE-FO series. We further divide the data period into two time spans, which correspond to the increase and decrease of the interannual signal, and plot the time series in Figure 8. The front segment of the time series (Figure 8a) shows good agreement, while the back segment of the time series (Figure 8b) shows notable discrepancies between GNSS and GRACE/GRACE-FO. The RMS reductions using the average of the 6 GRACE/GRACE-FO products are 62.3% and 25.3% for the former and latter time spans, respectively. Therefore, the small-scale interannual signals, which can hardly be detected by GRACE/GRACE-FO, as well as the possible inaccuracy in the observations during the GRACE-FO period, may contribute significantly to the disagreement at MTCN.

5. Conclusions

We compare the vertical displacements derived by GRACE/GRACE-FO from both SH (including CSR, GFZ and JPL) and mascon (including CSR, JPL and GSFC) products to interpret the loading signals observed by GNSS over the Amazon Basin. Overall, the good agreements at most of GNSS stations demonstrate that the dominating annual signal in the surface displacements can be interpreted using GRACE/GRACE-FO observations. Among different GRACE/GRACE-FO products, the mascon solutions show better agreements with the GNSS series than the SH solutions. In this study, three indicators are applied to evaluate the agreements as follows: (a) The mean annual amplitude reduction is 77.9% when the mascon solutions are removed from the GNSS series at the 22 stations, and 76.8% for the SH solutions; (b) The mean RMS reduction is 64.7% for the mascon solutions, and 62.4% for the SH solutions; (c) The mean correlation coefficients between GRACE/GRACE-FO and GNSS series are 0.95 and 0.94 for the mascon and SH solutions, respectively. Among the 3 SH products, the CSR solution shows the best agreement with the GNSS series, while among the three mascon products the GSFC solution shows the best agreement with the GNSS series.
The agreements between GRACE/GRACE-FO and GNSS are notably different in the central and southern parts of the Amazon Basin, which can be attributed to the difference in signal amplitude of the loading displacements in different regions, as well as the difference in spatial resolution of the different GRACE/GRACE-FO products. The agreements in the central Amazon Basin are more significant when using the mascon solutions due to the restoration of loading signals through the applied constraints, and less significant when using the SH solutions due to the weaker loading signals caused by the spatial filtering, while in the southern Amazon Basin, the GNSS height series are slightly smaller than GRACE/GRACE-FO derived vertical loading deformations for both SH and mascon solutions, suggesting the likely overestimation of loading signals by GRACE/GRACE-FO. The mean annual amplitude reductions in the central Amazon Basin are smaller than those in the southern Amazon Basin. This may be partly related to the relatively larger phase lags between GNSS and GRACE/GRACE-FO in the central Amazon Basin, which could be up to 9.9°. In addition to the annual signal, the interannual signal is significant in some stations. Besides the few specific stations that have been discussed in this study, many other stations with notable interannual variations over the entire Amazon Basin deserve more comprehensive analysis in the future study.
The noise levels of vertical loading deformations derived from different GRACE/GRACE-FO products are highly related to the loading signal of the region. With different signal amplitudes as reflected by the SH and mascon products, the GSFC mascon shows the smallest noise level among the three mascon solutions over the Amazon Basin, while the 3 SH solutions show comparable noise variances as expected. Moreover, the significant discrepancy in noise levels over the central Amazon Basin appears to exceed normal expectations, which is possibly attributed to the influence of unfitted interannual variations in our uncertainty assessment using the Three-Cornered Hat method. This also suggests that caution should be paid when separating signals and noise using different GRACE/GRACE-FO products for regions with multi-source mass-change effects.
Even though the GRACE/GRACE-FO mascon products provide higher-resolution and easy-to-use data than the SH products, they are still unable to overcome the fundamental limitation on measuring short-wavelength (or small spatial scale) mass variations of the current satellite gravimetry technique. Moreover, the differences among different mascon products are much more significant than those among different SH products. Careful attention should be paid to the impact of small-scale loading effects when using the mascons for loading deformation studies.

Author Contributions

Conceptualization, P.W., S.-Y.W. and J.L.; methodology, P.W., S.-Y.W. and J.C.; software, P.W., S.-Y.W. and J.L.; validation, S.-Y.W., J.L., J.C. and Z.Q.; formal analysis, P.W.; investigation, P.W. and S.-Y.W.; resources, S.-Y.W.; data curation, P.W.; writing—original draft preparation, P.W.; writing—review and editing, S.-Y.W., J.L. and Z.Q.; visualization, P.W.; supervision, Z.Q.; project administration, S.-Y.W.; funding acquisition, S.-Y.W. and Z.Q. All authors have read and agreed to the published version of the manuscript.

Funding

This research was funded by the Natural Science Foundation of China (12003057, 11873075), the Natural Science Foundation of Shanghai (20ZR1467400), and the National Key R&D Program of China (2018YFE0118500). This study was supported by the Opening Project of Shanghai Key Laboratory of Space Navigation and Positioning Techniques.

Institutional Review Board Statement

Not applicable.

Informed Consent Statement

Not applicable.

Data Availability Statement

The NGL GNSS solutions are available at http://geodesy.unr.edu/NGLStationPages/GlobalStationList, The above GNSS data used in this study were accessed on 1 May 2022. The SH and corresponding GAC and GAD data are available via the GFZ ftp website, and the CSR data, GFZ data and JPL data are provided by ftp://rz-vm152.gfz-potsdam.de/grace-fo/Level-2/CSR/RL06/, ftp://rz-vm152.gfz-potsdam.de/grace-fo/Level-2/GFZ/RL06/ and ftp://rz-vm152.gfz-potsdam.de/grace-fo/Level-2/JPL/RL06/, respectively. The CSR mascon data are available at https://www2.csr.utexas.edu/grace/RL06_mascons.html. The GSFC mascon data are available at https://earth.gsfc.nasa.gov/geo/data/grace-mascons. The JPL mascon data are available at https://podaac-tools.jpl.nasa.gov/drive/files/GeodeticsGravity/tellus/L3/mascon/RL06/JPL/v02/CRI/netcdf. The above GRACE/GRACE-FO data used in this study were accessed on 5 July 2022.

Acknowledgments

The authors are thankful to the two anonymous reviewers for providing constructive suggestions to improve their work. The authors are grateful to the Center for Space Research (CSR), GeoForschungsZentrum (GFZ), Jet Propulsion Laboratory (JPL) and Goddard Space Flight Center (GSFC) for providing GRACE/GRACE Follow-on products, and the Nevada Geodetic Laboratory (NGL) for providing GNSS data. This work made use of the High Performance Computing Resource in the Core Facility for Advanced Research Computing at Shanghai Astronomical Observatory, Chinese Academy of Sciences.

Conflicts of Interest

The authors declare no conflict of interest.

References

  1. Longman, I.M. A Green’s Function for Determining the Deformation of the Earth under Surface Mass Loads: 2. Computations and Numerical Results. J. Geophys. Res. 1963, 68, 485–496. [Google Scholar] [CrossRef]
  2. Farrell, W.E. Deformation of the Earth by Surface Loads. Rev. Geophys. 1972, 10, 761. [Google Scholar] [CrossRef]
  3. Abdrakhmatov, K.Y.; Aldazhanov, S.A.; Hager, B.H.; Hamburger, M.W.; Herring, T.A.; Kalabaev, K.B.; Makarov, V.I.; Molnar, P.; Panasyuk, S.V.; Prilepin, M.T.; et al. Relatively Recent Construction of the Tien Shan Inferred from GPS Measurements of Present-Day Crustal Deformation Rates. Nature 1996, 384, 450–453. [Google Scholar] [CrossRef]
  4. Segall, P.; Davis, J.L. GPS Applications for geodynamics and earthquake studies. Annu. Rev. Earth Planet. Sci. 1997, 25, 301–336. [Google Scholar] [CrossRef] [Green Version]
  5. Dong, D.; Fang, P.; Bock, Y.; Cheng, M.K.; Miyazaki, S. Anatomy of Apparent Seasonal Variations from GPS-Derived Site Position Time Series: Seasonal variations from GPS site time series. J. Geophys. Res. Solid Earth 2002, 107, 2075. [Google Scholar] [CrossRef] [Green Version]
  6. Blewitt, G.; Lavallée, D.; Clarke, P.; Nurutdinov, K. A New Global Mode of Earth Deformation: Seasonal Cycle Detected. Science 2001, 294, 2342–2345. [Google Scholar] [CrossRef] [Green Version]
  7. Dam, T.M.; Wahr, J.; Chao, Y.; Leuliette, E. Predictions of Crustal Deformation and of Geoid and Sea-Level Variability Caused by Oceanic and Atmospheric Loading. Geophys. J. Int. 1997, 129, 507–517. [Google Scholar] [CrossRef]
  8. Khan, S.A.; Wahr, J.; Stearns, L.A.; Hamilton, G.S.; van Dam, T.; Larson, K.M.; Francis, O. Elastic Uplift in Southeast Greenland Due to Rapid Ice Mass Loss. Geophys. Res. Lett. 2007, 34, L21701. [Google Scholar] [CrossRef] [Green Version]
  9. Wahr, J.; Swenson, S.; Zlotnicki, V.; Velicogna, I. Time-Variable Gravity from GRACE: First Results: Time-variable gravity from grace. Geophys. Res. Lett. 2004, 31, L11501. [Google Scholar] [CrossRef] [Green Version]
  10. Landerer, F.W.; Swenson, S.C. Accuracy of Scaled GRACE Terrestrial Water Storage Estimates: Accuracy of grace-tws. Water Resour. Res. 2012, 48, 4531. [Google Scholar] [CrossRef]
  11. Chambers, D.P. Observing Seasonal Steric Sea Level Variations with GRACE and Satellite Altimetry. J. Geophys. Res. 2006, 111, C03010. [Google Scholar] [CrossRef]
  12. Chen, J.L.; Wilson, C.R.; Tapley, B.D. Satellite Gravity Measurements Confirm Accelerated Melting of Greenland Ice Sheet. Science 2006, 313, 1958–1960. [Google Scholar] [CrossRef] [PubMed]
  13. van Dam, T.; Wahr, J.; Lavallée, D. A Comparison of Annual Vertical Crustal Displacements from GPS and Gravity Recovery and Climate Experiment (GRACE) over Europe. J. Geophys. Res. 2007, 112, B03404. [Google Scholar] [CrossRef] [Green Version]
  14. Fu, Y.; Freymueller, J.T. Seasonal and Long-Term Vertical Deformation in the Nepal Himalaya Constrained by GPS and GRACE Measurements: GPS/GRACE vertical deformation in nepal. J. Geophys. Res. Solid Earth 2012, 117, 409–421. [Google Scholar] [CrossRef] [Green Version]
  15. Chanard, K.; Fleitout, L.; Calais, E.; Rebischung, P.; Avouac, J. Toward a Global Horizontal and Vertical Elastic Load Deformation Model Derived from GRACE and GNSS Station Position Time Series. J. Geophys. Res. Solid Earth 2018, 123, 3225–3237. [Google Scholar] [CrossRef] [Green Version]
  16. Fu, Y.; Argus, D.F.; Freymueller, J.T.; Heflin, M.B. Horizontal Motion in Elastic Response to Seasonal Loading of Rain Water in the Amazon Basin and Monsoon Water in Southeast Asia Observed by GPS and Inferred from GRACE: Horizontal seasonal motions by GPS/GRACE. Geophys. Res. Lett. 2013, 40, 6048–6053. [Google Scholar] [CrossRef]
  17. Scanlon, B.R.; Zhang, Z.; Save, H.; Wiese, D.N.; Landerer, F.W.; Long, D.; Longuevergne, L.; Chen, J. Global Evaluation of New GRACE Mascon Products for Hydrologic Applications: Global analysis of grace mascon products. Water Resour. Res. 2016, 52, 9412–9429. [Google Scholar] [CrossRef] [Green Version]
  18. Zhang, L.; Yi, S.; Wang, Q.; Chang, L.; Tang, H.; Sun, W. Evaluation of GRACE Mascon Solutions for Small Spatial Scales and Localized Mass Sources. Geophys. J. Int. 2019, 218, 1307–1321. [Google Scholar] [CrossRef]
  19. Zhang, L.; Tang, H.; Chang, L.; Sun, W. Performance of GRACE Mascon Solutions in Studying Seismic Deformations. J. Geophys. Res. Solid Earth 2020, 125, e2020JB019510. [Google Scholar] [CrossRef]
  20. Chen, J.; Tapley, B.; Wilson, C.; Cazenave, A.; Seo, K.; Kim, J. Global Ocean Mass Change From GRACE and GRACE Follow-On and Altimeter and Argo Measurements. Geophys. Res. Lett. 2020, 47, e2020GL090656. [Google Scholar] [CrossRef]
  21. Wang, L.; Chen, C.; Ma, X.; Fu, Z.; Zheng, Y.; Peng, Z. Evaluation of GRACE Mascon Solutions Using In-Situ Geodetic Data: The Case of Hydrologic-Induced Crust Displacement in the Yangtze River Basin. Sci. Total Environ. 2020, 707, 135606. [Google Scholar] [CrossRef] [PubMed]
  22. Gu, Y.; Fan, D.; You, W. Comparison of Observed and Modeled Seasonal Crustal Vertical Displacements Derived from Multi-Institution GPS and GRACE Solutions: GPS-Observed and GRACE-Modeled CVD Data. Geophys. Res. Lett. 2017, 44, 7219–7227. [Google Scholar] [CrossRef]
  23. Blewitt, G. Harnessing the GPS Data Explosion for Interdisciplinary Science. Available online: http://eos.org/science-updates/harnessing-the-gps-data-explosion-for-interdisciplinary-science (accessed on 20 October 2022).
  24. Save, H. CSR GRACE and GRACE-FO RL06 Mascon Solutions v02. 2020. Available online: https://doi.org/10.15781/cgq9-nh24 (accessed on 5 July 2022).
  25. Loomis, B.D.; Felikson, D.; Sabaka, T.J.; Medley, B. High-Spatial-Resolution Mass Rates From GRACE and GRACE-FO: Global and Ice Sheet Analyses. J. Geophys. Res. Solid Earth 2021, 126, e2021JB023024. [Google Scholar] [CrossRef]
  26. Wiese, D.N.; Yuan, D.-N.; Boening, C.; Landerer, F.W.; Watkins, M.M. JPL GRACE Mascon Ocean, Ice, and Hydrology Equivalent Water Height Release 06 Coastal Resolution Improvement (CRI) Filtered Version 1.0. Ver. 1.0. PO.DAAC, CA, USA. 2018. Available online: http://doi.org/10.5067/TEMSC-3MJC6 (accessed on 1 March 2022).
  27. Loomis, B.D.; Rachlin, K.E.; Wiese, D.N.; Landerer, F.W.; Luthcke, S.B. Replacing GRACE/GRACE-FO With Satellite Laser Ranging: Impacts on Antarctic Ice Sheet Mass Change. Geophys. Res. Lett. 2020, 47, e2019GL085488. [Google Scholar] [CrossRef]
  28. Peltier, W.R.; Argus, D.F.; Drummond, R. Comment on “An Assessment of the ICE-6G_C (VM5a) Glacial Isostatic Adjustment Model” by Purcell et al. Available online: https://agupubs.onlinelibrary.wiley.com/doi/epdf/10.1002/2016JB013844 (accessed on 7 July 2022).
  29. Chen, J.L.; Wilson, C.R.; Tapley, B.D.; Blankenship, D.; Young, D. Antarctic Regional Ice Loss Rates from GRACE. Earth Planet. Sci. Lett. 2008, 266, 140–148. [Google Scholar] [CrossRef]
  30. Swenson, S.; Wahr, J. Post-Processing Removal of Correlated Errors in GRACE Data. Geophys. Res. Lett. 2006, 33, L08402. [Google Scholar] [CrossRef]
  31. Jekeli, C. Alternative Methods to Smooth the Earth’s Gravity Field; Report No. 327, Reports of the Department of Geodetic Science and Surveying; Ohio State University: Columbus, OH, USA, 1981. [Google Scholar]
  32. Sun, Y.; Riva, R.; Ditmar, P. Optimizing Estimates of Annual Variations and Trends in Geocenter Motion and J 2 from a Combination of GRACE Data and Geophysical Models. J. Geophys. Res. Solid Earth 2016, 121, 8352–8370. [Google Scholar] [CrossRef] [Green Version]
  33. Swenson, S.; Chambers, D.; Wahr, J. Estimating Geocenter Variations from a Combination of GRACE and Ocean Model Output: Estimating geocenter variations. J. Geophys. Res. Solid Earth 2008, 113, B08410. [Google Scholar] [CrossRef] [Green Version]
  34. Loomis, B.D.; Rachlin, K.E.; Luthcke, S.B. Improved Earth Oblateness Rate Reveals Increased Ice Sheet Losses and Mass-Driven Sea Level Rise. Geophys. Res. Lett. 2019, 46, 6910–6917. [Google Scholar] [CrossRef]
  35. Cheng, M.; Ries, J.C.; Tapley, B.D. Variations of the Earth’s Figure Axis from Satellite Laser Ranging and GRACE. J. Geophys. Res. 2011, 116, B01409. [Google Scholar] [CrossRef]
  36. Kusche, J.; Schrama, E.J.O. Surface Mass Redistribution Inversion from Global GPS Deformation and Gravity Recovery and Climate Experiment (GRACE) Gravity Data: Surface mass redistribution from GPS and GRACE. J. Geophys. Res. Solid Earth 2005, 110, B09409. [Google Scholar] [CrossRef] [Green Version]
  37. Premoli, A.; Tavella, P. A Revisited Three-Cornered Hat Method for Estimating Frequency Standard Instability. IEEE Trans. Instrum. Meas. 1993, 42, 7–13. [Google Scholar] [CrossRef]
  38. Ditmar, P. Conversion of Time-Varying Stokes Coefficients into Mass Anomalies at the Earth’s Surface Considering the Earth’s Oblateness. J. Geod. 2018, 92, 1401–1412. [Google Scholar] [CrossRef] [PubMed] [Green Version]
  39. Watkins, M.M.; Wiese, D.N.; Yuan, D.-N.; Boening, C.; Landerer, F.W. Improved Methods for Observing Earth’s Time Variable Mass Distribution with GRACE Using Spherical Cap Mascons: Improved Gravity Observations from GRACE. J. Geophys. Res. Solid Earth 2015, 120, 2648–2671. [Google Scholar] [CrossRef]
  40. Niu, Y.; Wei, N.; Li, M.; Rebischung, P.; Shi, C.; Chen, G. Quantifying Discrepancies in the Three-Dimensional Seasonal Variations between IGS Station Positions and Load Models. J. Geod. 2022, 96, 31. [Google Scholar] [CrossRef]
  41. Youm, K.; Eom, J.; Seo, K.-W.; Chen, J.; Wilson, C.R.; Oh, S. High-Resolution Surface Mass Loads in the Amazon Basin Combining GRACE and River Routing Model. Geophys. J. Int. 2022, 232, ggac439. [Google Scholar] [CrossRef]
Figure 1. Time series of the vertical displacements at the six selected GNSS stations (a) AMTE, (b) ROGM, (c) AMUA, (d) ROJI, (e) PASM, and (f) MTCO.
Remotesensing 15 00252 g001
Figure 2. Annual amplitudes and phases of vertical deformation from (a) GNSS, and predicted from (b) GRACE/GRACE-FO SH solutions and (c) GRACE/GRACE-FO mascon solutions. The length of vector represents the value of annual amplitude, and the direction represents the peak-value counted counterclockwise from the east (from January to December).
Remotesensing 15 00252 g002
Figure 3. The annual amplitude reductions after removing GRACE/GRACE-FO derived displacements from the GNSS heights at the 22 selected stations, using different products: (a) CSR SH, (b) GFZ SH, (c) JPL SH, (d) CSR mascon, (e) GSFC mascon, and (f) JPL mascon. The gray scales of the round dots represent the values of annual amplitude reductions. The background colors represent the annual amplitudes of vertical loading deformation derived from GRACE/GRACE-FO.
Remotesensing 15 00252 g003
Figure 4. The correlation coefficients between the vertical displacements derived from GRACE/GRACE-FO (a) CSR SH, (b) GFZ SH, (c) JPL SH, (d) CSR mascon, (e) GSFC mascon and (f) JPL mascon, and those observed by GNSS at the 22 GNSS stations. The gray scales of the round dots represent the values of the correlation coefficients. The background colors denote the same as in Figure 3.
Remotesensing 15 00252 g004
Figure 5. The RMS reductions after removing GRACE/GRACE-FO derived displacements from the GNSS heights at the 22 selected stations, using different products: (a) CSR SH, (b) GFZ SH, (c) JPL SH, (d) CSR mascon, (e) GSFC mascon, and (f) JPL mascon. The gray scales of the round dots represent the values of RMS reductions. The background colors denote the same as in Figure 3.
Remotesensing 15 00252 g005
Figure 6. The variances of the noises of the vertical deformation estimated using the TCH method, derived from the 6 GRACE/GRACE-FO products provided by (a) CSR SH, (b) CSR mascon, (c) GFZ SH, (d) GSFC mascon, (e) JPL SH, and (f) JPL mascon. The resolution of the gridded data is 1 ° × 1 ° .
Remotesensing 15 00252 g006
Figure 7. Time series at three specific GNSS stations: (a) AMCO, (b) APS1, and (c) MTCN.
Remotesensing 15 00252 g007
Figure 8. The front and back segments of the time series at the station MTCN in accordance with the time span of GRACE and GRACE-FO: (a) before mid 2017, and (b) after mid 2017.
Remotesensing 15 00252 g008
Table 1. Geographic coordinates and time spans at the 22 Global Navigation Satellite System (GNSS) Stations.
StationLatitudeLongitudeTime Span
(Decimal Year)
AMCO−4.9294.72012.7–2021.1
AMHA−7.5297.02015.1–2020.5
AMPR−2.6303.32015.1–2018.8
AMTE−3.3295.32013.9–2021.2
AMUA−3.1300.02015.2–2021.1
APLJ−0.8307.52014.9–2021.2
APS1−0.1308.82016.1–2021.2
ITAM−3.1301.62015.1–2018.5
MTCN−13.6307.72011.3–2021.2
MTCO−10.8304.52009.5–2019.5
MTJI−11.4301.32014.8–2021.2
MTNX−14.7307.72016.2–2019.9
MTSF−11.6309.32008.3–2018.5
MTSR−12.5304.32011.1–2021.2
PAAR−3.2307.82017.5–2021.2
PAIT−4.3304.02014.6–2021.1
PASM−2.4305.32015.6–2021.2
POVE−8.7296.12006.0–2021.2
RIOB−10.0292.22007.7–2021.2
ROCD−13.1299.52010.3–2019.4
ROGM−10.8294.72008.0–2020.5
ROJI−10.9298.02008.3–2021.2
Table 2. The annual amplitudes and phases of GNSS solutions and 6 GRACE/GRACE-FO products derived displacements at the 22 GNSS Stations.
StationAnnual Amplitudes (mm)Annual Phases (Degree)
GNSSCSR SHGFZ SHJPL SHCSR MasconGSFC MasconJPL MasconGNSSCSR SHGFZ SHJPL SHCSR MasconGSFC MasconJPL Mascon
AMCO12.716.716.216.319.720.219.3314.7304.9303.5303.8301.3301.7301.0
AMHA18.116.416.016.717.518.017.7291.4292.8291.4292.6285.1283.0286.2
AMPR25.218.416.518.321.822.319.3336.9326.8325.8326.6329.7328.4326.8
AMTE19.816.415.816.220.320.619.4317.0314.6313.6313.7314.4315.0313.5
AMUA29.420.019.32025.325.626.0326.8317.9317.7316.8321.8321.7321.8
APLJ14.213.112.513.014.914.715.3335.0321.4320.9319.7321.0322.8319.3
APS19.511.610.911.912.812.313.6333.5317.1315.5316.1316.7316.1315.3
ITAM28.119.117.117.223.023.323.7338.2326326.1332.2332.5330.7334.5
MTCN7.811.010.510.811.611.611.8291.8284.1281.2281.9284.8284.0284.4
MTCO12.913.512.913.413.914.614.1288.5283281.4281.9281.2284.1280.3
MTJI12.813.212.713.313.314.114.0292.6286283.2284.9285.9287.0285.5
MTNX10.210.19.210.210.610.810.6275.7280.8278.5280281.7279.7281.8
MTSF13.511.511.111.312.612.812.9278.7282.2280279.7279.7280.4278.2
MTSR11.912.211.712.213.013.013.2294.9285.9283.8283.6285.8286.6285.2
PAAR14.314.314.314.715.816.316.5316.8307.2307.3306.6308.8311.3307.9
PAIT15.816.715.916.917.718.918.2323.7314.5313.1313.9314.2316.0313.5
PASM24.515.715.115.817.719.017.4332.5323.0323.0321.0323.6324.8319.5
POVE14.815.615.315.616.016.616.1285.4287.0286.2285.8281.3281.4281.0
RIOB10.412.412.112.211.812.712.0283.6284.3283.6282.4282.9285.1280.4
ROCD13.411.911.711.912.613.312.5287.0284.9282.8281.9286.8285.5286.6
ROGM14.113.112.813.113.714.113.9290.7284.1284.1282.1282.9284.5281.7
ROJI12.114.013.613.914.514.814.9292.2285.3284.4283.9283.3284.5283.2
Average15.714.413.814.315.916.316.0305.8299.7298.5298.7299.3299.7298.5
Table 3. Mean values of the correlation coefficients, annual amplitude reductions, and RMS reductions at the 22 GNSS stations calculated in the central and southern parts of the Amazon Basin.
Annual Amplitude Reduction (%)Correlation Coefficient RMS Reduction (%)
Whole BasinCenterSouthWhole BasinCenterSouthWhole BasinCenterSouth
CSR SH77.670.483.60.9440.9630.92863.263.862.7
GFZ SH76.468.583.10.9380.9560.92361.761.561.8
JPL SH76.368.782.60.9410.9590.92662.362.462.2
CSR Mascon78.672.883.40.9440.9630.92864.967.363.0
GSFC mascon78.573.782.60.9470.9660.93265.368.163.0
JPL Mascon76.670.182.00.9430.9610.92863.865.762.3
Disclaimer/Publisher’s Note: The statements, opinions and data contained in all publications are solely those of the individual author(s) and contributor(s) and not of MDPI and/or the editor(s). MDPI and/or the editor(s) disclaim responsibility for any injury to people or property resulting from any ideas, methods, instructions or products referred to in the content.

