Article

Extraction of Micro-Doppler Feature Using LMD Algorithm Combined Supplement Feature for UAVs and Birds Classification

School of Electronics and Communication Engineering, Shenzhen Campus of Sun Yat-sen University, Shenzhen 518107, China
*
Author to whom correspondence should be addressed.
Remote Sens. 2022, 14(9), 2196; https://doi.org/10.3390/rs14092196
Submission received: 19 March 2022 / Revised: 26 April 2022 / Accepted: 28 April 2022 / Published: 4 May 2022
(This article belongs to the Topic Artificial Intelligence in Sensors)

Abstract

:
In the past few decades, the demand for reliable and robust systems capable of monitoring unmanned aerial vehicles (UAVs) increased significantly due to the security threats from its wide applications. During UAVs surveillance, birds are a typical confuser target. Therefore, discriminating UAVs from birds is critical for successful non-cooperative UAVs surveillance. Micro-Doppler signature (m-DS) reflects the scattering characteristics of micro-motion targets and has been utilized for many radar automatic target recognition (RATR) tasks. In this paper, the authors deploy local mean decomposition (LMD) to separate the m-DS of the micro-motion parts from the body returns of the UAVs and birds. After the separation, rotating parts will be obtained without the interference of the body components, and the m-DS features can also be revealed more clearly, which is conducive to feature extraction. What is more, there are some problems in using m-DS only for target classification. Firstly, extracting only m-DS features makes incomplete use of information in the spectrogram. Secondly, m-DS can be observed only for metal rotor UAVs, or large UAVs when they are closer to the radar. Lastly, m-DS cannot be observed when the size of the birds is small, or when it is gliding. The authors thus propose an algorithm for RATR of UAVs and interfering targets under a new system of L band staring radar. In this algorithm, to make full use of the information in the spectrogram and supplement the information in exceptional situations, m-DS, movement, and energy aggregation features of the target are extracted from the spectrogram. On the benchmark dataset, the proposed algorithm demonstrates a better performance than the state-of-the-art algorithms. More specifically, the equal error rate (EER) proposed is 2.56% lower than the existing methods, which demonstrates the effectiveness of the proposed algorithm.

1. Introduction

Over the past decade, the equipment cost and operational complexity of unmanned aerial vehicles (UAVs) has been dramatically decreased while the performance has been increased [1]. Thus, technological advancement fascinates a growing number of civilians. These platforms are used not only for leisure and filming but also for agricultural applications and environmental monitoring. Nevertheless, UAVs have been used by criminals and antisocial groups for unlawful purposes such as violating privacy or transporting explosives. The security threat has become more prevalent both in the military and civilian spheres. Hence, there is a significant demand for reliable and robust detection and classification of UAVs.
Radar is widely used in surveillance systems since it provides fast remote sensing capabilities regardless of weather or lighting conditions. Staring radar provides high Doppler resolution since it enables longer coherent integration. Therefore, staring radar demonstrates more advantages in the scenario of detecting and tracking UAVs with low radar cross section (RCS) and at relatively low speed and altitude. The birds are a kind of typical confusing target during UAVs surveillance. Thus, discriminating UAVs and birds is crucial for non-cooperative UAV surveillance. The discriminating methods are usually based on micro-Doppler signature (m-DS) which is induced by the UAV’s high-speed rotating blades and the flapping oscillation of birds’ wings.
The concept of m-DS, which is proposed by V.C Chen [2], has been utilized for radar automatic target recognition (RATR) tasks [3], such as aircraft classification [4,5,6,7,8,9], ship classification [10], human classification [11,12,13,14,15,16,17,18,19], vehicle classification [20] and other classification tasks [21,22,23,24]. Several researchers have studied the m-DS of UAVs and birds [25,26,27,28,29] and applied it to the classification tasks. Ren et al. [3] developed a system for classifying UAVs from other targets by using a 2-D complex spectrum. Oh et al. [30] proposed an automatic multicategory mini-UAV classification method by the extraction of m-DS features using empirical mode decomposition (EMD). Some researchers proposed various representations for m-DS analysis, including spectrograms and cepstrograms [31,32]. However, the insufficiency of these methods is mainly the performance verifying for measured data in reality. The local mean decomposition (LMD) is applied to separate the micro-motion parts from the main body of the UAVs’ and birds’ echoes in this paper. In this way, the signature can be identified without interference from the body components and the m-DS features are revealed more clearly. LMD was introduced in [33] as an adaptive nonparametric technique for Time and Frequency (T-F) analysis. A complex signal can be decomposed into a series of product functions (PFs) while each one is composed of an envelope signal and a pure frequency modulated signal [34,35].
Target scattering properties also include RCS modulation and polarization techniques. RCS modulation resulting from repetitive wing beat patterns or rotor blade flashes is considered a robust feature for class separation since the RCS is large enough. Detailed information on RCS modulations in X-band for the classification of small targets can be found in the most recent report in the literature [25]. Polarimetric parameters are used to distinguish large birds and UAVs of comparable size in the literature [36]. In addition, the movement characteristic of the target is also an important feature for classification. An alternative method of identifying and classifying UAVs from birds in near fields based on the flight paths and trajectories is presented in the literature [37,38].
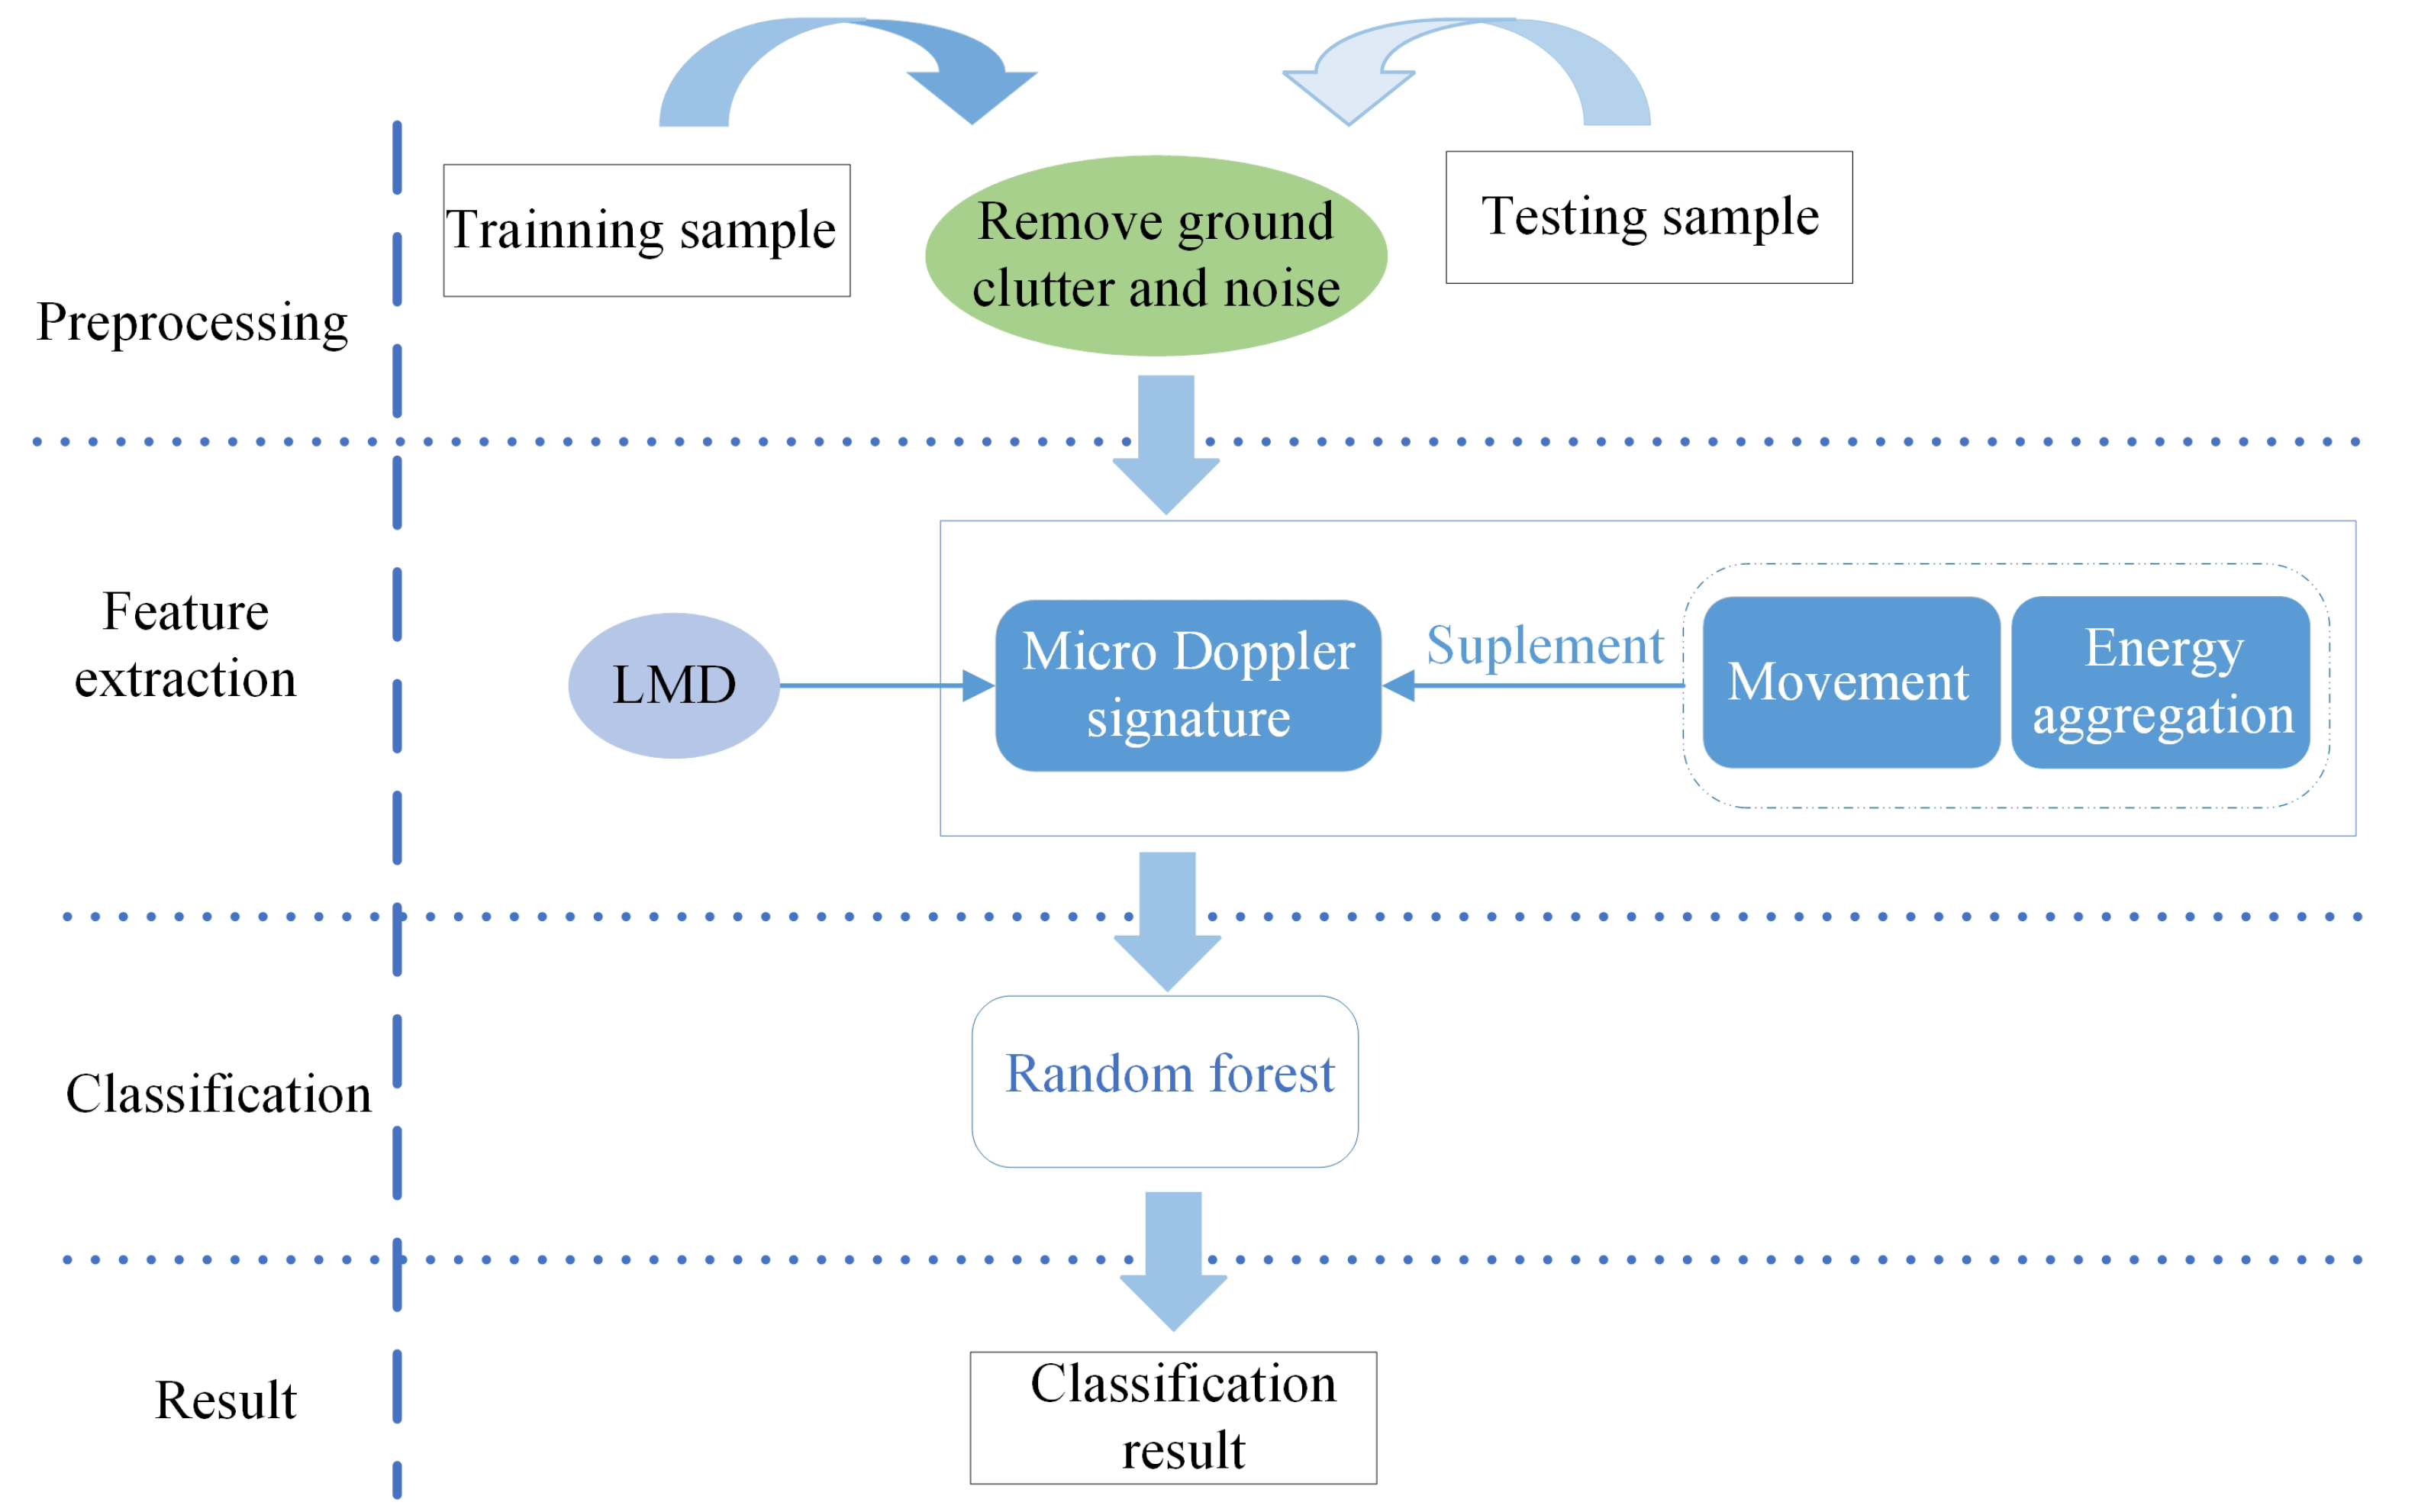
It is evident that the m-DS can be used for target classification, however, there are some problems if using m-DS only. First, m-DS can be observed only for metal rotor UAVs, or large UAVs when they are close to the radar. Moreover, m-DS cannot be observed when the size of the bird is small, or when it is gliding. At the same time, the radar can observe characteristics such as the intensity, position and speed of the echo. Regarding the issues above, an algorithm that extracts m-DS, movement and energy aggregation features from spectrogram to enhance the classification performance is proposed in this paper. Different from the current work, the data collection is obtained by a new staring radar system. It uses 8 × 8 transmitter arrays in azimuth and elevation respectively. Furthermore, the receiver array is arranged in a vertical pattern of 8 × 1. This fixed arrangement of beams allows the radar to continuously stare in all directions to process echoes by forming simultaneous beams covering the entire search area. Through long and controllable dwell times, it induces fine Doppler resolution, which contributes to the long-range and high-precision classification of targets. In addition, for the received target echo spectrogram, the situation that the m-DS may not be observed in reality is also be considered while analyzing and studying the m-DS. Therefore, the movement and energy aggregation features reflected in the spectrogram are extracted to supplement the information in exceptional situations. At the same time, it realizes the full mining of the effective information in the spectrogram, which contributes to more accurate classification of UAVs and birds target.
The main contribution of this paper is as follows:
(1)
LMD is applied to perform m-DS analysis and feature extraction on a single frame sample in the spectrogram. Compared with the currently widely used EMD method, the proposed algorithm can achieve a better m-DS separation rate and higher decomposition efficiency;
(2)
An RATR algorithm of UAVs and interfering targets is proposed under a new system of L band staring radar. In this algorithm, the m-DS, movement, and energy aggregation features of the target are extracted from the spectrogram to make full use of the information in the radar echo spectrogram and supplement the information in special situations;
(3)
Singular value decomposition (SVD) is used to remove ground clutter and noise on the spectrogram for the first time and complete the signal preprocessing part.
This paper is organized as follows. Section 2 introduces the materials and the proposed UAVs and birds classification algorithm. Section 3 presents the experiment results and performance analysis of the proposed algorithm based on measured data. Section 4 describes an experimental summary and prospects for future research. Finally, conclusions are made in Section 5.

2. Materials and Methods

2.1. Spectrogram Characteristic Analysis of Measured Data

Spectrograms are often used as a T-F representation of measurement data, which provides useful information for operators in determining the difference between UAVs and birds. Based on Figure 1, it can be seen that staring radar returned signals from UAVs and birds consists of the m-DS caused by micro-motion induced by UAVs rotating blades or birds flapping wings as well as the body Doppler caused by body movement. In addition, the movement and energy aggregation characteristic over time can be observed in spectrogram. An understanding of the m-DS, movement, and energy aggregation signature is therefore essential for performing a high-quality classification.
This section examines staring radar returned signals from UAVs and birds in terms of the m-DS, movement, and energy aggregation signature. Considering that the target remains in the same resolution cell, hence the received returned signals becomes a 1-D time series s ( t ) , and the s ( t ) is segmented into M overlapping frames x 0 , x 1 , , x M 1 , where each frame x i = x i k , k = 0 , 1 , , K 1 is a column vector consisting of K elements, K = 4096 . Then, the N = 512 dot discrete Fourier transform(DFT) is performed on x i to obtain f i = f i , 0 , f i , 1 , , f i , N 1 , where the discrete Fourier transform is denoted f i = F x i . The DFT calculation formula is shown in (1).
f i , n = k = 0 K 1 x i k e x p j 2 π k n K , n = 0 , 1 , , N 1 .
M frame returns are stacked together after DFT to form the spectrogram S = f i , n , i = 0 , 1 , , M 1 , n = 0 , 1 , , N 1 . To enhance the weak m-DS and reduce the noise, the most common taking a logarithm and using regularization of the spectrogram. The spectrogram modified to S = l o g f i + C i , i = 0 , 1 , , M 1 , Where C i is a constant.
Within the following subsections, we will analyze the characteristics of UAV and bird spectrograms, laying the groundwork for accurate feature extraction.

2.1.1. Characteristic 1: Micro-Doppler Signature

In the General Condition

The m-DS spreading pattern— Based on earlier research [9,15,18,19], it has been observed that the m-DS are visible both on the left and right of the body Doppler as the rotating blades approach and move away from the radar. Specifically, the spectrogram of Inspire2 UAV shown in Figure 1a reveals a linear distribution of m-DS along the velocity axis centered on the body Doppler. The spreading pattern is caused by the fact that the returned signals are superimposed on the rotor speed based on the body speed, and the short dwell time of the staring radar leads to under-sampling. The m-DS are induced by flapping wings the same way that UAVs are. Figure 1d shows the m-DS caused by flapping wings at both ends of the body. The bandwidth of Doppler spread is mainly depending on the wing flapping rate and the distance from the bird body center to the tip of the arm. Researchers have observed and reported Doppler spread of flapping wings for birds [25,28,29,37].
Blade flash pattern—As shown in Figure 1a, a blade flash pattern can be observed. This occurs when the rotation blades exhibit the largest cross-section area relative to the radar, when the blade has the strongest electromagnetic reflectivity [10]. The time interval of the flash pattern is periodic, and the length of this period depends on the rotational speed of the rotor. Since the bird’s wings are flapping and sweeping, there is a difference from the rotor’s rotation. The m-DS of the birds is continuously distributed on both sides of the body Doppler, as shown in Figure 1d. The bird group in Figure 1d consists of multiple birds, so its echoes occupy a wide frequency range in the spectrogram, and m-DS signals are mixed with body returned signals.
Strength of the m-DS—According to [19], the material and target distance from the radar play a crucial role in determining the strength of the m-DS. The Inspir2 UAV is made of carbon fiber, which has stronger electromagnetic reflection ability than the polycarbonate (PC) material of the MAVIC Air2 UAV. When the target is near the staring radar or the material has an excellent electromagnetic reflection capability, we can observe the m-DS.

In the Exceptional Condition

If the target size is small and the radar is far away, or if the bird is in a gliding condition, the m-DS is not visible in the spectrogram. As a result of the measurement distance of 0.3 to 10 km between target and radar, the m-DS from the rotor blades are masked by the noise, so that only the body Doppler is observed in the spectrogram, Figure 1b shows the Inspire2 UAV is close to the radar. Figure 1c,e show the condition of only body Doppler is visible when the targets is far away or when its size is small. As shown in Figure 1d, birds in the gliding state cannot observe the m-DS.

2.1.2. Characteristic 2: Movement Signature

The MAVIC Air2 UAV flight speed reaches 26 m/s and the Inspire2 UAV flight speed reaches 19 m/s. UAVs usually fly smoothly, or there are sharp turns under manual control. The flight speed range of birds is roughly the same as that of UAVs, with the difference that the flight speed of birds fluctuates more. Only the flight speed of birds such as larger seabirds or migratory birds is relatively smoother.

2.1.3. Characteristic 3: Energy Aggregation Signature

The size of UAVs is more significant compared to birds, and their size varies depending on the category. Usually, the larger the size, the higher the energy aggregation of the radar returned signals. The smaller the size, the lower the energy aggregation of the radar returned signals. Target energy aggregation is influenced by the radar angle of view. During continuous observation, the energy aggregation varies with the movement state of the target. Typically, the flight state of the UAVs is more smooth, so the energy aggregation period changes slower. However, the birds are more unstable, so their energy aggregation period varies faster.

2.2. Proposed UAVs and Birds Classification System

This section presents the proposed UAVs and birds classification system for L band staring radar. Unlike the existing UAVs and birds classification techniques [18,19], this paper proposes a classification algorithm based on feature extraction that is promising to be efficient and effective in all cases, in order to exploit to the full extent the information contained in the spectrogram, as shown in Figure 2. As for m-DS feature extraction, in contrast to the widely used EMD [30,39,40], LMD is proposed to perform m-DS analysis and feature extraction to achieve a better m-DS separation rate and higher decomposition efficiency. SVD is used to complete the signal preprocessing part the first time for ground clutter and noise removal on the spectrogram.

2.2.1. Preprocessing of Ground Clutter and Enviroment Noise Removal

According to Figure 1, the spectrograms contain ground clutter lying in zero Doppler, with the maximum energy generated by static clutter such as trees and buildings, that will deteriorate the changing patterns in the spectrogram. Hence, if the features are extracted directly, they will be distorted by noise and ground clutter, and a great deal of detail will be lost. Thus, it is necessary to use signal processing algorithms to remove noise and clutter before obtaining features to enhance the accuracy of feature extraction.
SVD is an important matrix decomposition algorithm with significant applications in digital signal processing. SVD is used to remove ground clutter and noise from signals by setting the singular value of the signal component representing them to zero. After this, the inverse operation is applied to SVD to remove interference.
The matrix of spectrogram can be expressed as follows:
S = f 0 , 0 f 0 , 1 f 0 , N 1 f 1 , 1 f 1 , 2 f 1 , N 1 f M 1 , 1 f M 1 , 2 f M 1 , N 1
Performing SVD on matrix according to (3)
S M × N = U M × M × S M × N × V N × N T
Matrix U and V are singular matrices for matrix S , where U is an M × M matrix and V is an N × N matrix. Matrix S is an M × N matrix, in which the singular values of the diagonal elements are included as λ i i = 1 , 2 , , N ; λ 1 λ 2 λ N , while the rest of the elements are zero. Singular value λ i is positively correlated with energy of signal component represented by it. Energy of clutter is usually the most prominent element in a signal, energy of the target is second, and energy of noise is the least significant element. Setting the most significant singular value to 0 and the smaller singular value to 0 and performing inverse processing. Through this process, the target signal is obtained that suppresses ground clutter and noise.
The suppressed singular values λ k k a , b , 1 a b N are selected. In general, a = 2 , since the first singular value corresponds to ground clutter. b is the corresponding sequence number of the maximum value of the singular value difference spectrum greater than a threshold 0.08× noise energy, where 0.08 is the empirical value. The trajectory matrix can be reconstructed as Equation (4).
S r = U : , : S : , a : b V : , a : b T
In the given matrix, U : , : represents the entire matrix. S : , a : b and V : , a : b are the a-th to b-th columns. The spectrogram in Figure 3. illustrates the results of removing ground clutter and noise from Figure 1.

2.2.2. Extraction Features from Spectrogram

In this subsection, an algorithm is proposed to extract and utilize such unique information from spectrogram for UAVs and birds classification to extract m-DS features, movement features, and energy aggregation features.

M-DS Feature Extraction

LMD is used to decompose a frame signal for the m-DS feature extraction in the spectrograms. Using LMD, the primary purpose is to separate the signals generated by the main and micro-motions since the specific information between the UAVs and birds is mainly contained in the micro-motion. Then extracting features from the micro-motion components for classification. A frame signal in the spectrogram is shown in Figure 3. The spectrogram of the measured data, i.e., S r can be see in the middle subfigure. A frame signal in the spectrogram, i.e., f k k = 1 , , M , is shown in the top subfigure, where M indicates the frame number in the spectrogram.
In recent years, LMD has emerged as a new adaptive method of decomposing multi-component AM and FM signals into a limited number of single-component AM and FM signals according to the characteristics of the signal. Afterwards, the instantaneous frequency (IF) and the instantaneous amplitude (IA) are obtained and combined to produce the complete time-frequency distribution of the original signal [35]. By comparing this algorithm with the EMD, it offers improvements in terms of end effects, spurious components, and over or under envelope issues. In LMD, the time domain signal v, i.e., a frame signal f k inverse Fourier transform, can be calculated by summing the PFs and residual, which is product of envelope and purely FM signal.
v = i = 1 L P F i + u = i = 1 L a i t s i t + u t
where a i t is the envelope signal, s i t is the purely FM signal and u t is the residual.
Observe that the filtering scheme is applied from high to low frequency of the signal, and thus the LMD decomposition is utilized as a filter bank with different frequency passbands.
After applying LMD, the m-DS is present in the first L-1 PFs. Define P 1 and P r as follows:
P 1 = i = 1 L 1 P F i
P r = P F L
Figure 4 highlights some differences in the m-DS modulation in the PF1 component of the signal containing the high-frequency micro-motion decomposed by the LMD algorithm.
The Doppler spectrum of the original signal, FFT P 1 , and FFT P r of the target are shown in Figure 4, where FFT · denotes fast Fourier transformation(FFT).
The decomposition results indicate that the LMD successfully separates the m-DS component from the body component. Among them, P 1 captures some differences in the micro-motion modulation in the high-frequency m-DS component of the LMD decomposition, while the main element is contained in P r . The following five features of the spectrogram of the target describe the differences in m-DS signatures.
Feature1: number of zero crossing feature F 11 .
F 11 = n = 2 N s i g n P 1 n s i g n P 1 n 1
With s i g n P 1 n = 1 , if P 1 n 0 , otherwise 1. F 11 reflects the signal frequency. The higher the frequency, the higher the number of zero-crossing points.
Feature2: normalized signal energy feature F 12 . The normalized signal energy of P 1 and P r can be expressd as E 1 E and E r E , respectively. Which E 1 = n = 1 N P 1 n 2 is the signal energy of P 1 , E r = n = 1 N P r n 2 is the signal energy of P r , E = E 1 + E r . Feature2 is as below
F 12 = E 1 E , E r E T
There are some differences in the micro-motion part and body energy generated by different targets.
Feature3: standard deviation F 13 . The standard deviation of P 1 and P r can be record as s t d P 1 = n = 1 N P 1 n P ¯ 1 2 N and s t d P r = n = 1 N P r n P ¯ r 2 N . Feature3 is as below
F 13 = s t d P 1 , s t d P r T
Feature4: entropy feature F 14 . The entropy of P 1 and P r can be record as En 1 = n = 1 N P 1 ( n ) n = 1 N P 1 ( n ) · log 2 P 1 ( n ) n = 1 N P 1 ( n ) and En r = n = 1 N P r ( n ) n = 1 N P r ( n ) · log 2 P r ( n ) n = 1 N P r ( n ) . Feature4 can be expressed as
F 14 = E n 1 , E n r
Entropy is a measure of how uniformly energy is distributed in space. Entropy increases with uniform energy distribution, and vice versa.
Feature5: peaks related feature F 15 . The feature extracted related to peaks is the distance between two frequency peaks and the number of peaks in this paper. Distance between two frequency peaks is defined as D = a r g m a x F N 2 × 2 N , with F = f = P 1 f 2 , Number of peaks is defined as N = i = 1 m p i , with p = findpeaks P 1 f > T , where T is the threshold determined by the constant false alarm rate (CFAR). So peaks related feature F 15 can be expressed as
F 15 = D , N
The number of peaks and the bandwidth reflect the speed of movement and the length of the micro-motion parts.
The extracted five feature vectors are subsequently concatenated F 1 = [ F 11 , F 12 , F 13 ,
F 14 , F 15 ] T R 9 × 1 .

Movement Feature Extraction

In a spectrogram, the main velocity component is caused by the overall motion of the target. Generally, the target’s body will reflect the strongest electromagnetic emitted by the radar, while the ability of the micro-motion parts to reflect will be relatively weak. The velocity corresponding to the maximum amplitude point as the main frequency velocity and assume that the velocity variation with time extracted from the spectrogram is v = v 1 , v 2 , . v M .
In radar systems, radial velocity assists in distinguishing between targets moving at different speeds. Due to the same radial velocity range of UAVs and birds, radial velocity cannot be used to distinguish UAVs from birds. Additionally, the radial velocity changes according to the target’s movement relative to the radar, so it is not a robust feature. Figure 3 shows the velocity trajectory variation with time extracted from the spectrogram shown in the left subfigure. It is demonstrated that the UAV’s velocity is relatively flat while the bird’s velocity fluctuates more. Therefore, the acceleration a = a 1 , a 2 , , a M 1 , which represents the fluctuation of velocity, can be extracted as the distinguishing feature. In order to describe the velocity fluctuations of various targets, these two characteristics are used.
Feature6: acceleration mean value F 21 .
F 21 = 1 M 1 i = 1 M 1 a i
The mean value of acceleration indicates the average acceleration of the target, and the greater the velocity fluctuation, the greater the average acceleration.
Feature7: acceleration variance F 22 .
F 22 = 1 M 1 i = 1 M 1 a i 1 M 1 i = 1 M 1 a i 2
The acceleration variance indicates the degree of velocity fluctuation. The UAV velocity is smooth, so the degree of acceleration fluctuation is small, and the bird velocity fluctuates more, so the degree of acceleration fluctuation is larger.
The extracted two features are subsequently concatenated F 2 = F 21 , F 22 T R 2 × 1 .

Energy Aggregation Feature Extraction

For class separation, RCS modulation provides a robust option as long as the modulation is large enough. Generally, UAVs have a higher RCS than birds, but it is not a robust feature. According to observations, RCS levels fluctuate significantly according to aspect angle and radar frequency. Since the difference in size and flight status of UAVs and birds leads to different aggregation of energy and changes with flight status. In this subsection, the energy aggregation over time features is extracted to characterize this difference. Suppose s k , n c n c 1 , , N is the maximum value of s k . Record the main component s k , n c n u m 1 , , s k , n c n u m 2 with s k , n c as the center, so s k , n c s k , n c n u m 1 + + s k , n c n u m 2 is the energy aggregation degree of the main component, denoted as P k . The energy aggregation of each frame in the spectrogram is then extracted and the energy aggregation over time is P t , t = 0 , 1 Δ t , , M 1 Δ t , Δ t = 0.8196 s . The extraction process of energy concentration with time is shown in Figure 5. In the spectrograms of the targets, here are the four features that are used to represent the differences in the signatures of energy aggregation.
Feature8: energy aggregation mean feature F 31 .
F 31 = 1 M m = 1 M P m
F 31 represents the average energy aggregation.
Feature9: energy aggregation variance feature F 32 .
F 32 = 1 M m = 1 M P m 1 M m = 1 M P m 2
F 32 represents the fluctuating degree of energy aggregation. The smoother the flight, the smaller the fluctuation, and vice versa.
The energy aggregation extracted from the spectrogram is Variable in time. As the result of the different flight states of the target during the flight, the fluctuation frequency of the energy concentration varies with time. Discrete Fourier transform is usually used for frequency domain analysis of signals, but discrete cosine transform (DCT) has better energy compression, so this section uses DCT to analyze signals whose energy concentration varies with time. DCT on P t is expressed:
F u = c t t = 0 M 1 Δ t p t cos t + 0.5 π N u , u = 0 , c u = 1 N o t h e r s , c u = 2 N
Record F 1 as the maximum value and F 2 as the second largest value of F u . L o c s 2 is the frequency position that corresponds to the second largest value F 2 . Then the periodic energy ratio feature and the undulation cycle energy proportion feature can be extracted from F u .
Feature10: periodic energy ratio feature F 33 .
F 33 = F 2 F 1
The ratio of the maximum periodic component energy to the second largest periodic component energy, the larger the ratio the greater, the fluctuation of the flight state.
Feature11: undulation cycle energy proportion feature F 34 .
F 34 = L o c s 2 M
Feature F 34 reflects the frequency of energy accumulation over time. The greater the frequency, the faster the energy concentration changes, and the greater the flight state changes.
The extracted four features are subsequently concatenated a vector, denoted as F 3 = F 31 , F 32 , F 33 , F 34 T R 4 × 1 .

2.2.3. Feature-Level Confusion

Assume S i , i = 1 , , M , be denoted as the ith sample. M is the number of samples that have been trained. Extracted m-DS feature F 1 , movement feature F 2 , and energy aggregation feature F 3 from the preprocessed spectrogram, and the details of the extracted features and methods are described in Section 2.2. The eight feature vectors are extracted from ith frame signal, which subsequently concatenated F i = [ F i , 11 F i , 12 F i , 13 F i , 14 F i , 15 F i , 21 F i , 22 F i , 31 F i , 32 F i , 33
F i , 34 ] T R 15 × 1 and then stacked into a matrix form F M a g = F 1 , F 2 , , F M R 15 × M .

2.2.4. Random Forest Classification

A random forest classifier is then trained using the feature matrix F M a g , which integrates multiple decision trees with the ID3 algorithm. Random forests use multiple trees to train and predict the samples, and the output class is determined by the plurality of the output classes of individual trees. Random forests can handle high dimensional data without feature selection, and after training, random forests can indicate which features are more important.

3. Results

The primary purpose of Section 3 is to evaluate the effectiveness of the proposed classification system for UAVs and birds under L-band staring radar. Firstly, the data collection and division processing are described. Then, the performance of LMD applied to m-DS feature extraction is compared with that of the widely used EMD algorithm [30,39,40]. Thirdly, the classification performance is evaluated of the proposed classification system in the general condition and in the unobservable m-DS exceptional condition. Finally, the accuracy of the proposed method is compared to state-of-the-art UAVs and birds classification techniques [3,30,41]. The Section 3.1, Section 3.2, Section 3.3 and Section 3.4 provide detailed descriptions of the data set and the experimental results. All experiments were performed on a PC with an Intel(R) Core (TM) i7-9750H 2.6 GHz CPU.

3.1. Collecting and Processing Data

3.1.1. Review of the Staring Radar System

The system used for data collection in this experimental is an L band staring radar designed to achieve staring detection of ‘low, slow and small’ targets because it utilizes full time domain, full frequency domain, full airspace domain, and multi-target information acquisition and integrated processing technology, the operating parameters of staring radar are listed in Table 1. The Doppler resolution of staring radar returns signal improves with a longer integration time, which in turn improves the accuracy of classification. The high Doppler resolution and increased signal-to-noise ratio (SNR) achieved by coherently integrating the returned signals lead to greater detail in the m-DS than hypothetical returns signal from a 2-D scanning radar [1]. Figure 6 depicts the starting radar detection in the field and the trajectory of the tracking target. Figure 6b illustrates the UAV trajectory, with the global positioning system (GPS) track displayed in white. Figure 6c illustrates the bird trajectory, with the GPS track displayed in red. Additionally, the purple curves in both figures show the radar tracks of UAVs and non-UAV targets [42].

3.1.2. Collecting Staring Radar Data

The experimental data presented in this paper were collected at nine radar test sites in China using staring radar. Experimenters flew up UAVs to 0.3–10 km away from the staring radar during the field trials in various states. The experimenters were only able to collect data from two types of UAVs—the Inspire2 and MAVIC Air2—due to limited experimental conditions. A variety of bird species are contained in the collected data, which is due to bird species varying with the time of day, season, and region. The experimental data are also collected in different seasons and at different times of the day at major airports across the country.

3.1.3. Data Preprocessing and Partitioning

The data collected from the staring radar are manually examined, and the errors are minimized using signal processing so that errors caused by the detecting and tracking functions of the radar can be minimized. Table 2 shows that the dataset includes four types of targets, including two types of commercial UAVs and two types of birds. The two types of UAVs in the dataset are the Inspire2 UAV and the MAVIC Air2 UAV. The two types of birds mainly include a single bird and a group of birds, and the bird data contain a variety of species due to the bird species varying with time of day, season, and region. For the division of the dataset, 60% of the data are divided into training samples, and the remaining 40% of the data are divided into test samples for performance evaluation. The following table provides the number of samples for each type of target after the dataset has been divided in the experiment.

3.2. Performance Evaluation of the LMD Algorithm Applied in m-DS Components Separation

Effective separation of the m-DS components is crucial to perform accurate feature extraction. This section compares the improvement in separation performance caused by the LMD algorithm to the EMD [30] algorithm compared to separation ratio and time consumed. Separation ratio of the m-DS components is also analyzed quantitatively, and can be defined as follows:
M s u p p = n E e x t r n n E o r i g n .
E o r i g is the original signal energy, E e x t r is the m-DS components energy. The quantitative analysis of the separation ratio of m-DS components is presented in Table 3.
The time consumption of a frame signal using LMD and EMD for each of the four target categories is presented in Table 4.
Both LMD and EMD can separate the m-DS components from the original signal. According to the quantitative analysis, LMD has a higher separation ratio than EMD. Additionally, LMD consumes much less time than EMD. Since LMD has fewer iterations, the consumption time is shorter. In order to obtain IMF, EMD must be continuously sifting, so that a large number of iterations is required, which results in a lengthy processing time. Considering the above analysis, it can be concluded that LMD performs better in the separation of m-DS components than EMD.

3.3. Performance Evaluation of the Proposed Classification System

The present section presents the classification results under general conditions and under exceptional conditions in which no m-DS is observed in order to evaluate the performance of the classification system presented in this paper.

3.3.1. In the General Condition

This experiment evaluates the accuracy of the proposed algorithm in classifying UAVs and birds. During the classification process, the random forest is a classifier that is composed of multiple decision trees, and the voting mechanism of the multiple decision trees is used to improve the decision performance. More precisely, the random forest is a powerful classifier that is formed by combining multiple weak classifiers. A random forest’s classification performance is affected by the number of decision trees. This section uses the equal error rate (EER) and the false acceptance rate (FAR) with 1% false rejection rate (FRR) ( F A R F R R = 1 % ) as evaluation indicators. FAR represents the percentage of false acceptances. Specifically, it can be defined as the percentage of non-target samples being falsely classified as the target. FRR represents the percentage of false rejection. Specifically, it can be defined as the percentage of the target samples being falsely classified as non-target. When these two error rates are equal, it is referred to as an EER. This article reports the performance in terms of these two criteria because: (1) the EER is commonly used for various verification tasks; (2) the system performs is evaluated at a low missing classification rate that F R R = 1% and hence reports F A R F R R = 1 % . A random forest consisting of between 1 and 3000 decision trees was tested to determine the number of trees that gave the best performance. The classification accuracy, EER, and F A R F R R = 1 % vs. a different number of decision trees are shown in Figure 7. In terms of both error rates and classification accuracy, the proposed algorithm achieves its best performance at 500 decision trees.
In the latter experiment, the random forest classifier consists of 500 decision trees, where the decision trees with the ID3 algorithm. The confusion matrix in Table 5 shows the results obtained by the algorithm presented in this article. Results indicate that the proposed algorithm can achieve high classification accuracy for the four target classes.
The performance of the proposed method is evaluated with EER and F A R F R R = 1 % are both 0.71 and 0.42, it is evident that the proposed method is highly effective.
After evaluating the performance of the proposed algorithm, the next step is to test whether extracting m-DS features in conjunction with movement and energy aggregation features can achieve a complementary effect. In Figure 8, the classification accuracy is shown for different combinations of features, where each feature contains uncorrelated information. An accuracy of 90.46% can be achieved when only m-DS features are extracted. The classification accuracy can reach 99.10% when both movement and energy aggregation features are combined with m-DS features. As a consequence, higher classification accuracy can be achieved by combining the features of movement and energy aggregation.

3.3.2. In the Exceptional Condition

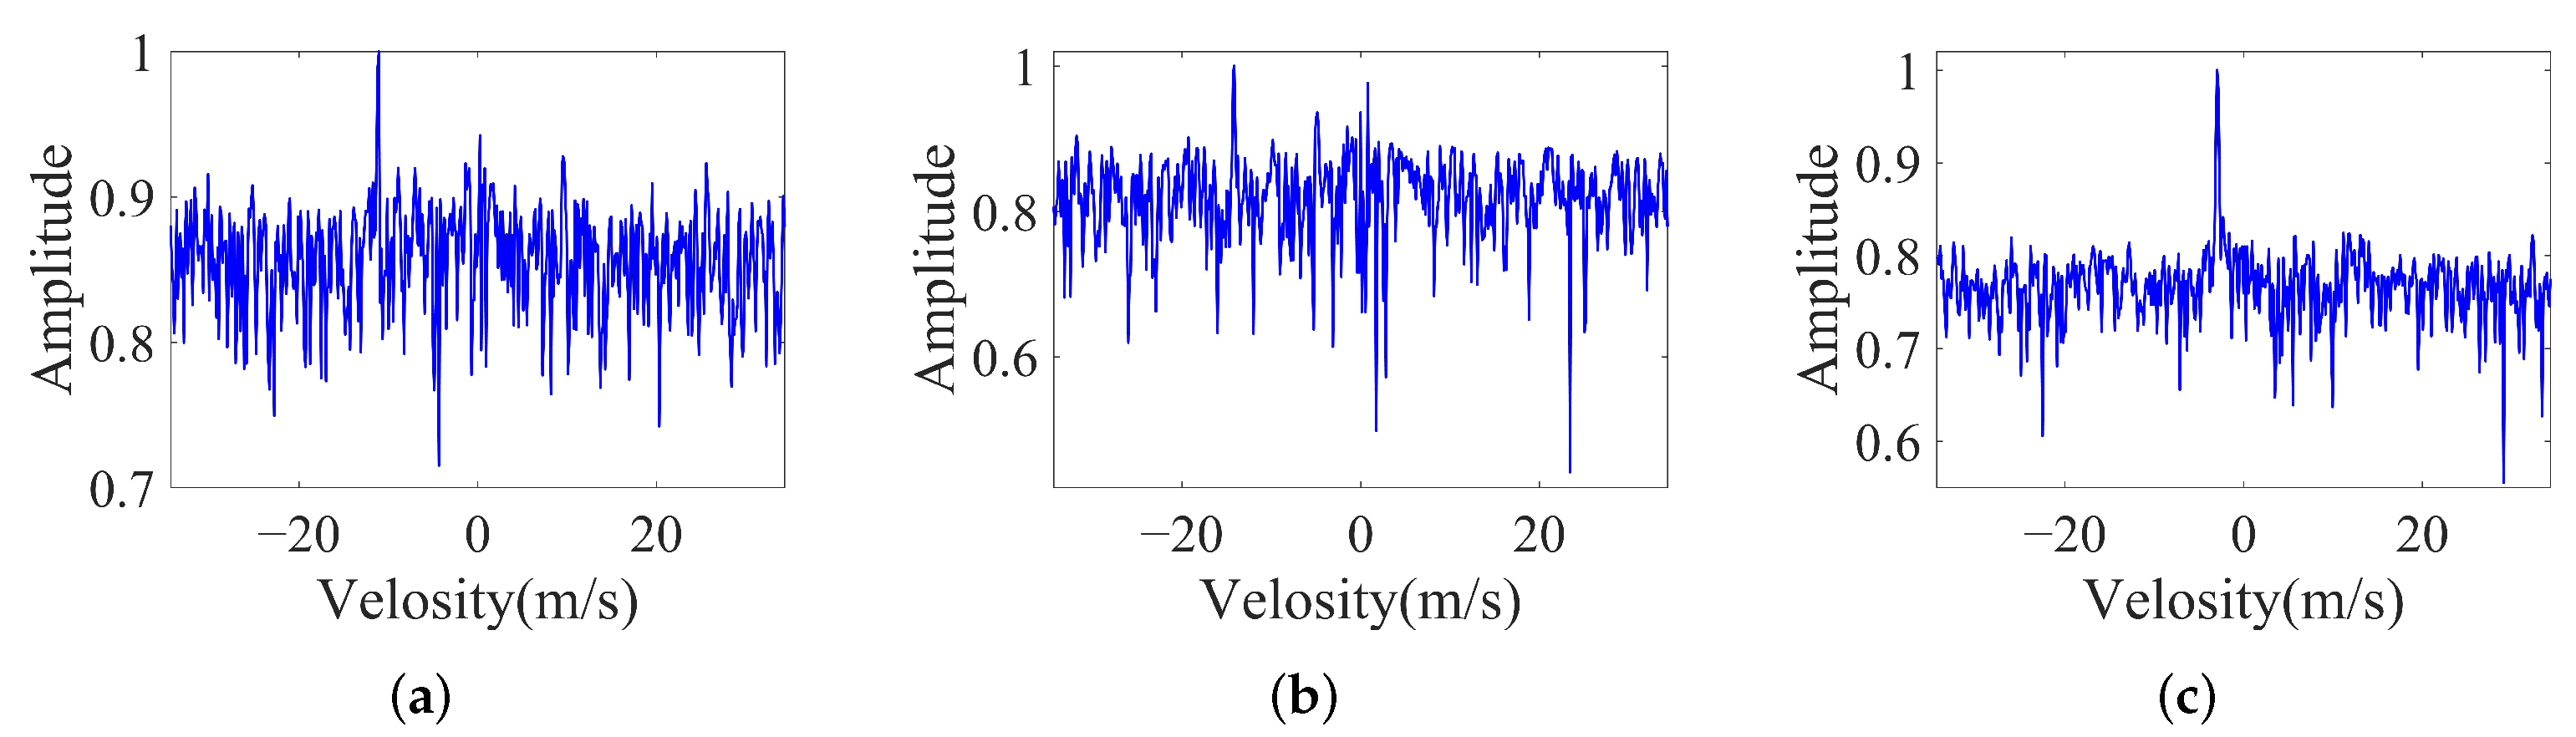
In the exceptional condition, the spectrogram of the Inspire2 UAV and a bird is shown in Figure 1b and Figure 1e, respectively. The experimental take out a frame signal after amplitude normalization, as shown in Figure 9, which shows that only the body energy can be observed. It is impossible to classify the targets by extracting the m-DS features, so it is necessary to classify them by extraction movement and energy aggregation features. In addition, UAVs can mimic certain bird flight patterns to some extent. When the trajectories of UAVs and birds are similar, they can be classified by features such as flight speed range and energy concentration. Additionally, photoelectric sensors may also be utilized for auxiliary recognition.
The confusion matrix is shown in Table 6; the proposed method has achieved promising classification accuracy. It can be concluded that the classification method by extraction m-DS features fails when the UAVs is far from the radar or in the exceptional condition of bird gliding, as this time, the algorithm proposed is also capable of combining movement and energy aggregation features that contribute to a highly classification accuracy.

3.4. Comparison with State-of-the-Arts

This experiment compares the proposed algorithm to that of EMD [30] and SVD [41] for signal decomposition, SRA [3] for subspace analysis in terms of test EER and F A R F R R = 1 % . Table 7 summarizes the classification results obtained by the proposed algorithm in this paper as compared with the state-of-the-art, and the reasons for the differences can be deduced. EMD requires multiple iterations in the decomposition process, which leads to a long time consuming, which mainly carries out time frequency analysis and feature extraction for fretting. SVD projects the spectrogram into a vector and extracts features, but it cannot avoid the interference of body energy, resulting in low classification accuracy. The algorithm of SRA projects the signal into the subspace, which is more dependent on the accurate selection of the projection direction. When there is an outlier, it will lead to inaccurate projection, thus affecting the classification effect. Among them, log-Fourier transforms combined with the SRA can achieve the lowest error rate such that E E R = 3.27%, and a better performance is provided by the proposed algorithm than by reducing the EER by 2.56% compared to log-Fourier transform combined the SRA. In conclusion, based on the above analysis, the algorithm proposed in this paper achieves the optimal performance for the classification of UAVs and birds.

4. Discussion

This section summarizes the experimental and prospects for future work from the above chapters that have verified and analyzed the theoretical and measured data of the UAVs and birds’ classification system proposed in this paper.

4.1. Summary of the Experimental

As summarized in the following paragraphs, the main observations in this paper can be summed up as follows.
(1)
LMD algorithm is proposed to perform m-DS analysis and feature extraction on a frame signal in the spectrogram. Compared with the currently widely used EMD, LMD can achieve a better m-DS separation ratio and higher decomposition efficiency;
(2)
The proposed algorithm has achieved promising classification performance, which extracted the movement and energy aggregation features to supplement the information of the m-DS features reflected in the spectrogram;
(3)
The classification algorithm by extraction m-DS features fails when the targets are far away from the radar or in the exceptional case of bird gliding, while the algorithm in this paper proposed can also extract movement and energy aggregation features and can achieve an outstanding classification performance;
(4)
Different from the current work, this paper is to use a new system of L band staring radar, which achieve long range and high precision classification of targets. According to the performance of the proposed model, it outperforms all other compared techniques in terms of classification accuracy.

4.2. Prospects

This paper discusses a limited range of topics, and future research may focus on one or more of the following four aspects.
(1)
The refined processing of radar returns improves the detection and classification the prerequisites for performance. With the increasingly complex environment and targets, it is necessary to carry out refined analysis and processing from the targets and backgrounds faced by radar detection, and from the clutter interference suppression, detection, tracking and classification included in radar detection to improve the utilization of information, and then obtain the radar classification performance improve;
(2)
The fusion of signal and data features is an effective way to improve the classification accuracy. Fusion the signal and data features of UAVs and birds can expand the feature space and improve the classification probability;
(3)
Deep learning networks provide new means for intelligent target classification of UAVs and birds. Since the m-DS can be regarded as two dimensional characteristic time-frequency data, the target returns and movement trajectory reflected in the radar P display screen are also two dimensional images of distance, which is suitable for the intelligent classification and identification of targets;
(4)
The staring radar system has laid a hardware foundation for the integration of target refinement processing and identification. In a complex environment, the probability of target classification relying on a single radar detection device is low. It is necessary to comprehensively use the information of different sensors, such as photoelectric, acoustic, etc., to make up for the limitations of a single sensor and improve the classification efficiency and accuracy.

5. Conclusions

This paper proposed an algorithm for RATR of UAVs and interfering targets under a new system of L band staring radar. In this algorithm, LMD performs m-DS separation and feature extraction on a frame signal in the spectrogram and outperforms the currently widely used EMD algorithm. The other is to exploit the information contained in the spectrogram and supplement the information in exceptional situations. The m-DS, movement and energy aggregation features of the target are extracted from the spectrogram. In this way, SVD is used to remove ground clutter and noise in the spectrogram. Experimental results demonstrate that the proposed algorithm is effective and efficient. Particularly noteworthy is the fact that there are not enough UAVs to form an entire UAV group due to the limitations of the current experimental conditions. We will consider adding a discussion of a group of UAVs to follow-up research work.

Author Contributions

Data curation, Y.Z.; Funding acquisition, S.X., Z.C., B.T. and Y.Z.; Investigation, T.D.; Supervision, S.X., B.T. and J.H.; Writing—original draft, T.D.; Writing—review & editing, T.D., B.T., J.H. and S.X. All authors have read and agreed to the published version of the manuscript.

Funding

This work was supported in part by National Natural Science Foundation of China (No. 61901481), Shenzhen Science and Technology Program (No. KQTD20190929172704911), Shenzhen Science and Technology Program (No. 2021A05), Hunan Provincial Natural Science Foundation of China (No. 2021JJ20056).

Institutional Review Board Statement

(1) The research meets all applicable standards with regard to the ethics of experimentation and research integrity, and the following is being certified true. (2) As an expert scientist and along with co-authors in the concerned field, the paper has been submitted with full responsibility, following due ethical procedure, and there is no duplicate publication, fraud, plagiarism, or concerns about animal or human experimentation.

Informed Consent Statement

Not applicable.

Data Availability Statement

Not applicable.

Acknowledgments

The authors would like to thank Wenzhen Wu, Zhibo Liu and Xiaobo Yu for their valuable suggestions and technical supports.

Conflicts of Interest

The authors declare no conflict of interest.

References

  1. Chen, V.C.; Ling, H. Time-Frequency Transforms for Radar Imaging and Signal Analysis; Artech House: Boston, MA, USA; London, UK, 2002. [Google Scholar]
  2. Chen, V.C.; Li, F.; Ho, S.S.; Wechsler, H. Micro-Doppler effect in radar: Phenomenon, model, and simulation study. IEEE Trans. Aerosp. Electron. Syst. 2006, 42, 2–21. [Google Scholar] [CrossRef]
  3. Ren, J.; Jiang, X. Regularized 2-D complex-log spectral analysis and subspace reliability analysis of micro-Doppler signature for UAV detection. Pattern Recognit. 2017, 69, 225–237. [Google Scholar] [CrossRef]
  4. Zhou, D.; Liu, G.; Wang, J. Spatio-temporal target identification method of high-range resolution radar. Pattern Recognit. 2000, 33, 1–7. [Google Scholar] [CrossRef]
  5. Sun, G.; Wang, J.; Qin, S.; Na, J. Radar target recognition based on the multi-resolution analysis theory and neural network. Pattern Recognit. Lett. 2008, 29, 2109–2115. [Google Scholar] [CrossRef]
  6. Zhou, D.; Shen, X.; Yang, W. Radar target recognition based on fuzzy optimal transformation using high-resolution range profile. Pattern Recognit. Lett. 2013, 34, 256–264. [Google Scholar] [CrossRef]
  7. Jiang, H.; Xu, L.; Zhan, K. Joint tracking and classification based on aerodynamic model and radar cross section. Pattern Recognit. 2014, 47, 3096–3105. [Google Scholar] [CrossRef]
  8. Du, L.; He, H.; Zhao, L.; Wang, P. Noise robust radar HRRP target recognition based on scatterer matching algorithm. IEEE Sens. J. 2015, 16, 1743–1753. [Google Scholar] [CrossRef]
  9. Feng, B.; Chen, B.; Liu, H. Radar HRRP target recognition with deep networks. Pattern Recognit. 2017, 61, 379–393. [Google Scholar] [CrossRef]
  10. Chen, X.; Guan, J.; Bao, Z.; He, Y. Detection and extraction of target with micromotion in spiky sea clutter via short-time fractional Fourier transform. IEEE Trans. Geosci. Remote Sens. 2013, 52, 1002–1018. [Google Scholar] [CrossRef]
  11. Wang, Y.; Liu, Q.; Fathy, A.E. CW and pulse–Doppler radar processing based on FPGA for human sensing applications. IEEE Trans. Geosci. Remote Sens. 2012, 51, 3097–3107. [Google Scholar] [CrossRef]
  12. Thayaparan, T.; Stanković, L.J.; Djurović, I. Micro-Doppler-based target detection and feature extraction in indoor and outdoor environments. J. Frankl. Inst. 2008, 345, 700–722. [Google Scholar] [CrossRef]
  13. Tahmoush, D.; Silvious, J. Radar micro-Doppler for long range front-view gait recognition. In Proceedings of the 2009 IEEE 3rd International Conference on Biometrics: Theory, Applications, and Systems, Washington, DC, USA, 28–30 September 2009; pp. 1–6. [Google Scholar]
  14. Raj, R.G.; Chen, V.C.; Lipps, R. Analysis of radar human gait signatures. IET Signal Process. 2010, 4, 234–244. [Google Scholar] [CrossRef]
  15. Park, J.; Johnson, J.T.; Majurec, N.; Frankford, M.; Stewart, K.; Smith, G.E.; Westbrook, L. Simulation and analysis of polarimetric radar signatures of human gaits. IEEE Trans. Aerosp. Electron. Syst. 2014, 50, 2164–2175. [Google Scholar] [CrossRef]
  16. Kim, Y.; Ling, H. Human activity classification based on micro-Doppler signatures using a support vector machine. IEEE Trans. Geosci. Remote Sens. 2009, 47, 1328–1337. [Google Scholar]
  17. Björklund, S.; Johansson, T.; Petersson, H. Evaluation of a micro-Doppler classification method on mm-wave data. In Proceedings of the 2012 IEEE Radar Conference, Atlanta, GA, USA, 7–11 May 2012; pp. 0934–0939. [Google Scholar]
  18. Zabalza, J.; Clemente, C.; Di Caterina, G.; Ren, J.; Soraghan, J.J.; Marshall, S. Robust PCA micro-Doppler classification using SVM on embedded systems. IEEE Trans. Aerosp. Electron. Syst. 2014, 50, 2304–2310. [Google Scholar] [CrossRef] [Green Version]
  19. Clemente, C.; Pallotta, L.; De Maio, A.; Soraghan, J.J.; Farina, A. A novel algorithm for radar classification based on Doppler characteristics exploiting orthogonal pseudo-Zernike polynomials. IEEE Trans. Aerosp. Electron. Syst. 2015, 51, 417–430. [Google Scholar] [CrossRef] [Green Version]
  20. Li, Y.; Du, L.; Liu, H. Hierarchical classification of moving vehicles based on empirical mode decomposition of micro-Doppler signatures. IEEE Trans. Geosci. Remote Sens. 2012, 51, 3001–3013. [Google Scholar] [CrossRef]
  21. Smith, G.E.; Woodbridge, K.; Baker, C.J. Naïve Bayesian radar micro-Doppler recognition. In Proceedings of the 2008 International Conference on Radar, Adelaide, Australia, 2–5 September 2008; pp. 111–116. [Google Scholar]
  22. Smith, G.E.; Woodbridge, K.; Baker, C.J. Radar micro-Doppler signature classification using dynamic time warping. IEEE Trans. Aerosp. Electron. Syst. 2010, 46, 1078–1096. [Google Scholar] [CrossRef]
  23. Novak, L.M.; Owirka, G.J.; Netishen, C.M. Radar target identification using spatial matched filters. Pattern Recognit. 1994, 27, 607–617. [Google Scholar] [CrossRef] [Green Version]
  24. Kim, K.T. Application of feature space trajectory classifier to identification of multi-aspect radar signals. Pattern Recognit. 2005, 38, 2159–2173. [Google Scholar] [CrossRef]
  25. Ritchie, M.; Fioranelli, F.; Griffiths, H. Monostatic and bistatic radar measurements of birds and micro-drone. In Proceedings of the 2016 IEEE Radar Conference (RadarConf), Philadelphia, PA, USA, 1–6 May 2016; pp. 1–5. [Google Scholar]
  26. Björklund, S. Target detection and classification of small drones by boosting on radar micro-Doppler. In Proceedings of the 2018 15th European Radar Conference (EuRAD), Madrid, Spain, 26–28 September 2018; pp. 182–185. [Google Scholar]
  27. Park, S.H.; Jung, J.H.; Cha, S.B.; Kim, S.; Youn, S.; Eo, I.; Koo, B. In-depth Analysis of the Micro-Doppler Features to Discriminate Drones and Birds. In Proceedings of the 2020 International Conference on Electronics, Information, and Communication (ICEIC), Barcelona, Spain, 19–22 January 2020; pp. 1–3. [Google Scholar]
  28. Farshchian, M.; Selesnick, I.; Parekh, A. Bird body and wing-beat radar Doppler signature separation using sparse optimization. In Proceedings of the 2016 4th International Workshop on Compressed Sensing Theory and Its Applications to Radar, Sonar and Remote Sensing (CoSeRa), Aachen, Germany, 19–22 September 2016; pp. 71–74. [Google Scholar]
  29. Rahman, S.; Robertson, D.A. Radar micro-Doppler signatures of drones and birds at K-band and W-band. Sci. Rep. 2018, 8, 17396. [Google Scholar] [CrossRef] [PubMed]
  30. Oh, B.S.; Guo, X.; Wan, F.; Toh, K.A.; Lin, Z. Micro-Doppler mini-UAV classification using empirical-mode decomposition features. IEEE Geosci. Remote Sens. Lett. 2017, 15, 227–231. [Google Scholar] [CrossRef]
  31. Harmanny, R.I.A.; De Wit, J.J.M.; Cabic, G.P. Radar micro-Doppler feature extraction using the spectrogram and the cepstrogram. In Proceedings of the 2014 11th European Radar Conference, Rome, Italy, 8–10 October 2014; pp. 165–168. [Google Scholar]
  32. Harmanny, R.I.A.; de Wit, J.J.M.; Premel-Cabic, G. Radar micro-Doppler mini-UAV classification using spectrograms and cepstrograms. Int. J. Microw. Wirel. Technol. 2015, 7, 469–477. [Google Scholar] [CrossRef]
  33. Smith, J.S. The local mean decomposition and its application to EEG perception data. J. R. Soc. Interface 2005, 2, 443–454. [Google Scholar] [CrossRef]
  34. Park, C.; Looney, D.; Van Hulle, M.M.; Mandic, D.P. The complex local mean decomposition. Neurocomputing 2011, 74, 867–875. [Google Scholar] [CrossRef]
  35. Yuan, B.; Chen, Z.; Xu, S. Micro-Doppler analysis and separation based on complex local mean decomposition for aircraft with fast-rotating parts in ISAR imaging. IEEE Trans. Geosci. Remote Sens. 2013, 52, 1285–1298. [Google Scholar] [CrossRef]
  36. Torvik, B.; Olsen, K.E.; Griffiths, H. Classification of birds and UAVs based on radar polarimetry. IEEE Geosci. Remote Sens. Lett. 2016, 13, 1305–1309. [Google Scholar] [CrossRef]
  37. Srigrarom, S.; Chew, K.H.; Da Lee, D.M.; Ratsamee, P. Drone versus bird flights: Classification by trajectories characterization. In Proceedings of the 2020 59th Annual Conference of the Society of Instrument and Control Engineers of Japan (SICE), Chiang Mai, Thailand, 23–26 September 2020; pp. 343–348. [Google Scholar]
  38. Zhang, X.; Mehta, V.; Bolic, M.; Mantegh, I. Hybrid AI-enabled Method for UAS and Bird Detection and Classification. In Proceedings of the 2020 IEEE International Conference on Systems, Man, and Cybernetics (SMC), Toronto, ON, Canada, 11–14 October 2020; pp. 2803–2807. [Google Scholar]
  39. Zhao, Y.; Su, Y. Sparse recovery on intrinsic mode functions for the micro-Doppler parameters estimation of small UAVs. IEEE Trans. Geosci. Remote Sens. 2019, 57, 7182–7193. [Google Scholar] [CrossRef]
  40. Zhao, Y.; Su, Y. The extraction of micro-Doppler signal with EMD algorithm for radar-based small UAVs’ detection. IEEE Trans. Instrum. Meas. 2019, 69, 929–940. [Google Scholar] [CrossRef]
  41. Fioranelli, F.; Ritchie, M.; Griffiths, H. Classification of unarmed/armed personnel using the NetRAD multistatic radar for micro-Doppler and singular value decomposition features. IEEE Geosci. Remote Sens. Lett. 2015, 12, 1933–1937. [Google Scholar] [CrossRef] [Green Version]
  42. Dale, H.; Baker, C.; Antoniou, M.; Jahangir, M. An Initial Investigation into Using Convolutional Neural Networks for Classification of Drones. In Proceedings of the 2020 IEEE International Radar Conference (RADAR), Washington, DC, USA, 27 April–27 May 2020; pp. 618–623. [Google Scholar]
Figure 1. Spectrograms of UAVs and birds. (a) Inspire2 UAV. (b) Inspire2 UAV moves towards the radar from far to near. (c) MAVIC Air2 UAV. (d) a bird. (e) a small bird. (f) a group of birds.
Remotesensing 14 02196 g001
Figure 2. Proposed UAVs and birds classification system for L band staring radar. SVD is used to complete the signal preprocessing part. Subsequently, LMD is offered to perform m-DS analysis and feature extraction to achieve a better m-DS separation rate and higher decomposition efficiency. In addition, movement and energy aggregation features are extracted as a compliment.
Remotesensing 14 02196 g002
Figure 3. Movement and m-DS feature extraction of UAVs and birds from spectrogram. Spectrogram can be seen in the middle subfigure. A frame signal in the spectrogram is shown in the top subfigure for m-DS feature extraction. The subfigure on the left represents the change of the target movement speed over time, which can be used for movement feature extraction. (a) Inspire2 UAV. (b) MAVIC Air2 UAV. (c) a bird. (d) a group of birds.
Remotesensing 14 02196 g003
Figure 4. LMD decomposes a frame signal and then reconstructs its PF1 and PFm components. PF1 represents the main component, and PFm represents the m-DS component. (a) Inspire2 UAV. (b) MAVIC Air2 UAV. (c) A bird. (d) A group of birds.
Remotesensing 14 02196 g004
Figure 5. Energy aggregation feature extraction process demonstration.
Remotesensing 14 02196 g005
Figure 6. Images showing a detect and track by staring radar. (a) Staring radar field detection scene. (b) UAV trajectory (white). (c) A bird trajectory (red).
Remotesensing 14 02196 g006
Figure 7. Performance of the proposed algorithm when using EER and F A R F R R = 1 % for different decision trees. (a) Classification accuracy. (b) EER. (c) FAR.
Remotesensing 14 02196 g007
Figure 8. Impact of the classification accuracy for different combinations of features.
Remotesensing 14 02196 g008
Figure 9. Magnitude normalized single frame signal. (a) Inspire2 UAV. (b) MAVIC Air2 UAV. (c) A bird.
Remotesensing 14 02196 g009
Table 1. Operating parameters of staring radar.
ParameterValue
FrequencyL band
Bandwidth2 MHz
Transmit Power1 kW
Pulse Repetition Frequency5 kHz
Pulse length 2 × 10 6 s
Blind zone0.3 km
Table 2. Dataset specifications.
NO.Target NameTarget TypeNum of Training SampleNum of Testing Sample
1Inspire2 UAVUAVs689460
2MAVIC Air2 UAV681488
3A birdbirds546365
4A group of birds601401
Table 3. Separation ratio of the m-DS components.
MethodSeparation Ratio
Inspire2 UAVMAVIC Air2 UAVA BirdA Group of Birds
LMD0.9660.9310.9440.893
EMD0.9730.8710.9190.836
Table 4. Time consumed by m-DS components separation.
MethodConsuming Time
Inspire2 UAVMAVIC Air2 UAVA BirdA Group of Birds
LMD0.16 s0.12 s0.17 s0.16 s
EMD4.45 s3.82 s4.35 s4.12 s
Table 5. Confusion matrix (%) of the ‘Proposed’.
Predicted Classes
Inspire2 UAVMAVIC Air2 UAVA BirdA Group of Birds
True classesInspire2 UAV98.750.5100
MAVIC Air2 UAV0.4298.2102.30
A bird001000
A group of birds0.831.28097.70
Table 6. Confusion matrix (%) of the ‘Proposed’.
Predicted Classes
Inspire2 UAVMAVIC Air2 UAVA BirdA Group of Birds
True classesInspire2 UAV92.528.4202.65
MAVIC Air2 UAV3.7486.7302.65
A bird001000
A group of birds3.744.85094.70
Table 7. Comparison of the proposed method with state-of-the-arts in terms of EER and F A R F R R = 1 % .
MethodEER (%)FAR (%)
Proposed0.710.42
EMD [30]4.258.64
Log Spectrogram + SVD [41]4.8310.12
Spectrogram + PCA8.9029.80
Log Spectrogram + PCA [3]7.7135.26
Log Spectrogram + SRA [3]3.273.89
Publisher’s Note: MDPI stays neutral with regard to jurisdictional claims in published maps and institutional affiliations.

