
Coseismic Rupture Model and Tectonic Implications of the January 7 2022, Menyuan Mw 6.6 Earthquake Constraints from InSAR Observations and Field Investigation

 , , ,
, , , 
Abstract
:1. Introduction
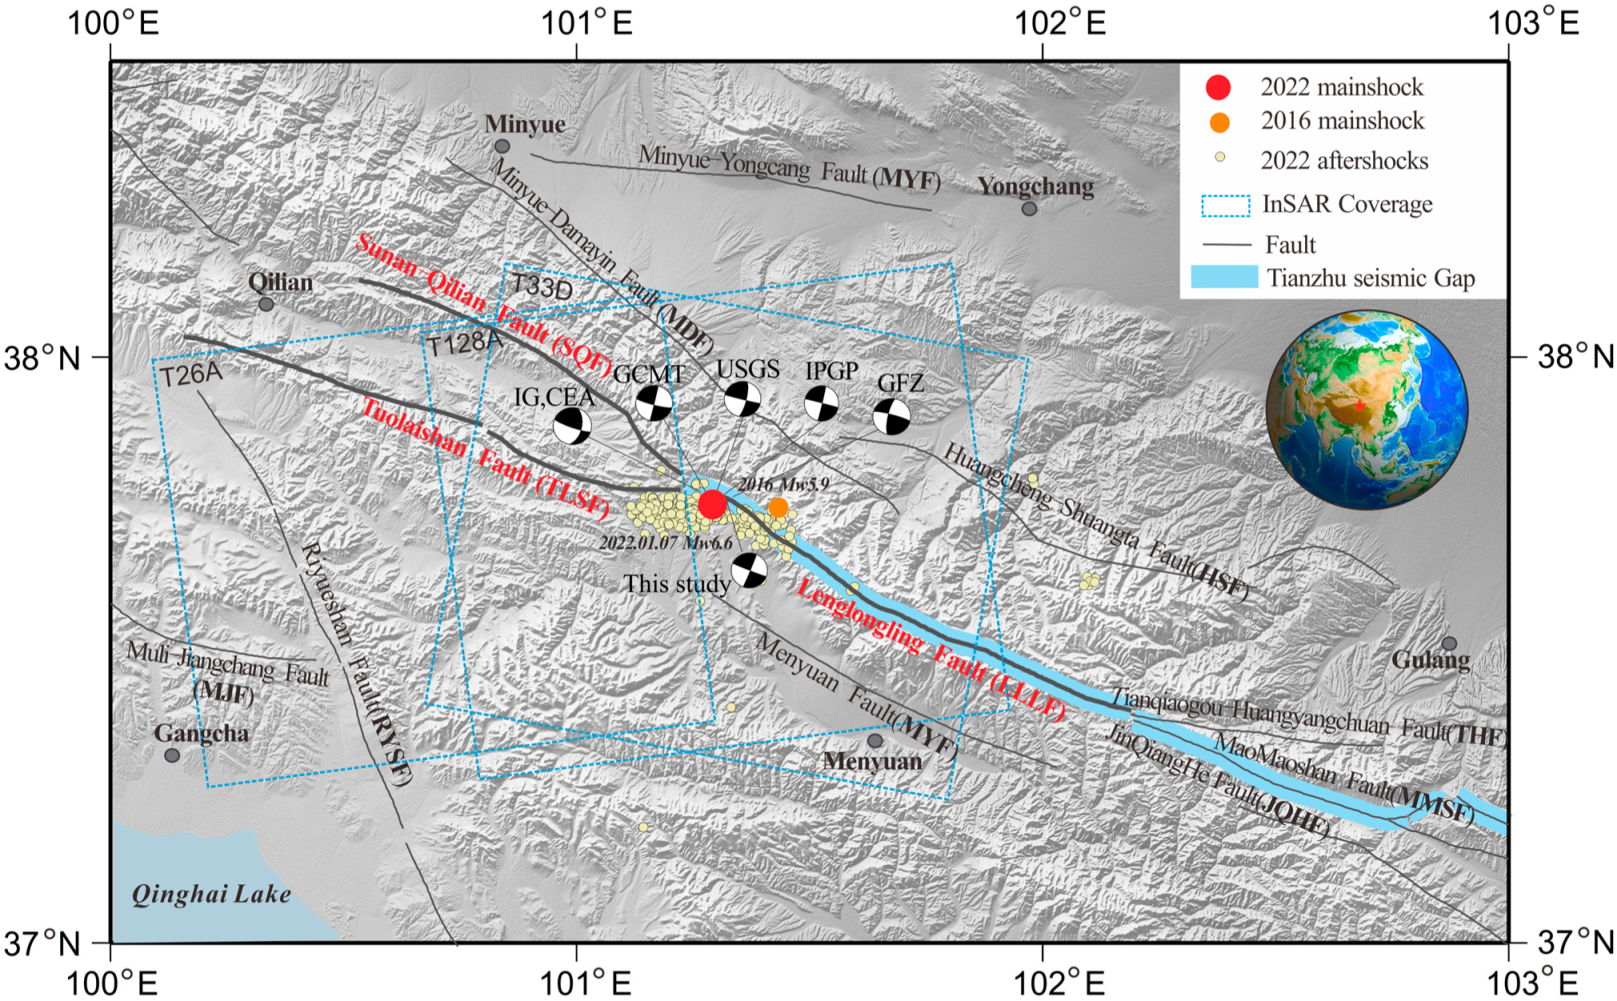
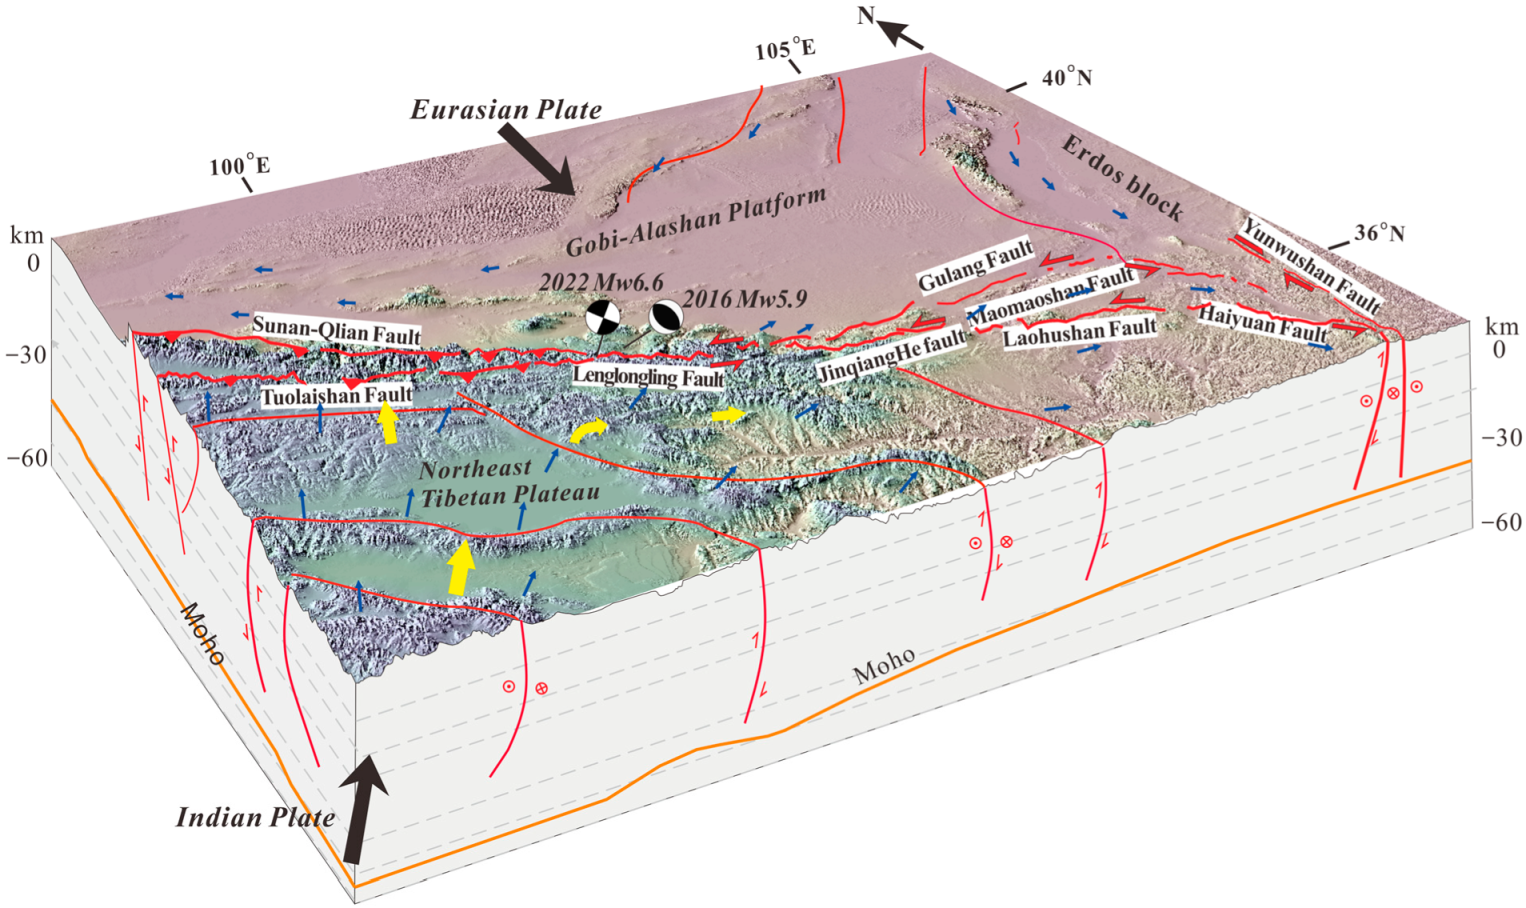
2. Tectonic Setting
3. InSAR Coseismic Deformation
3.1. InSAR Data and Methodology
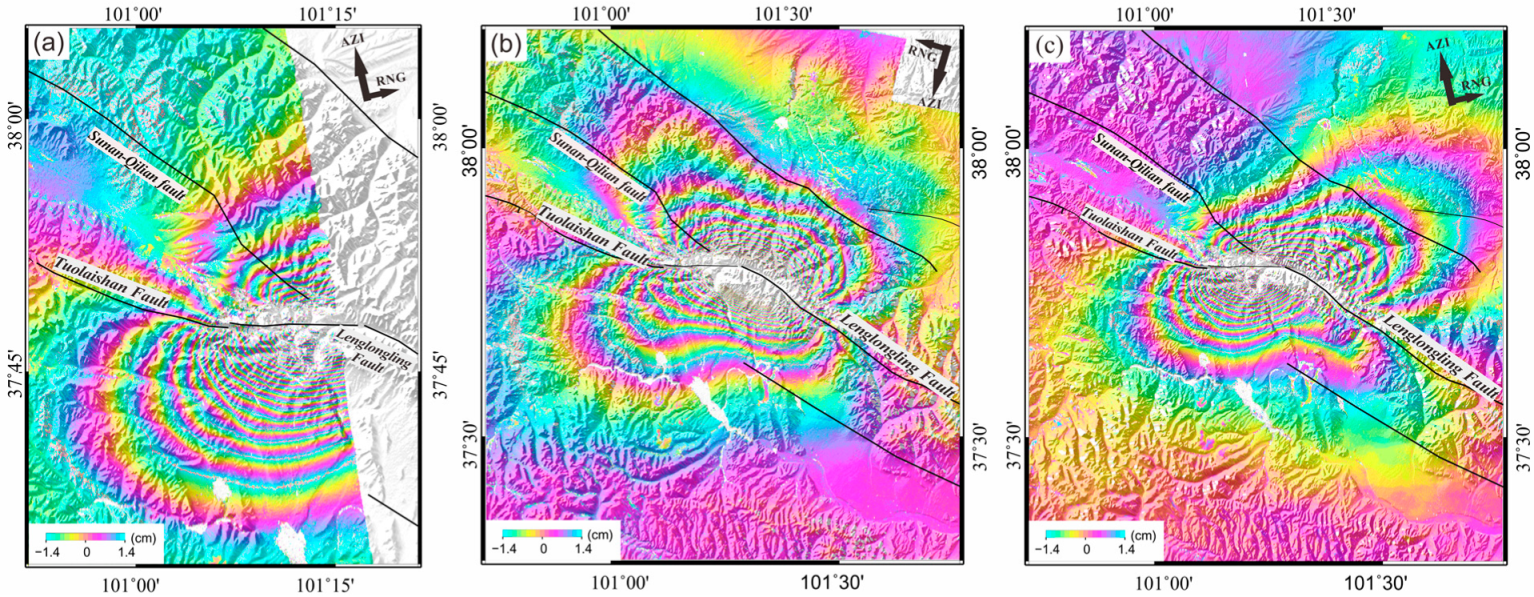
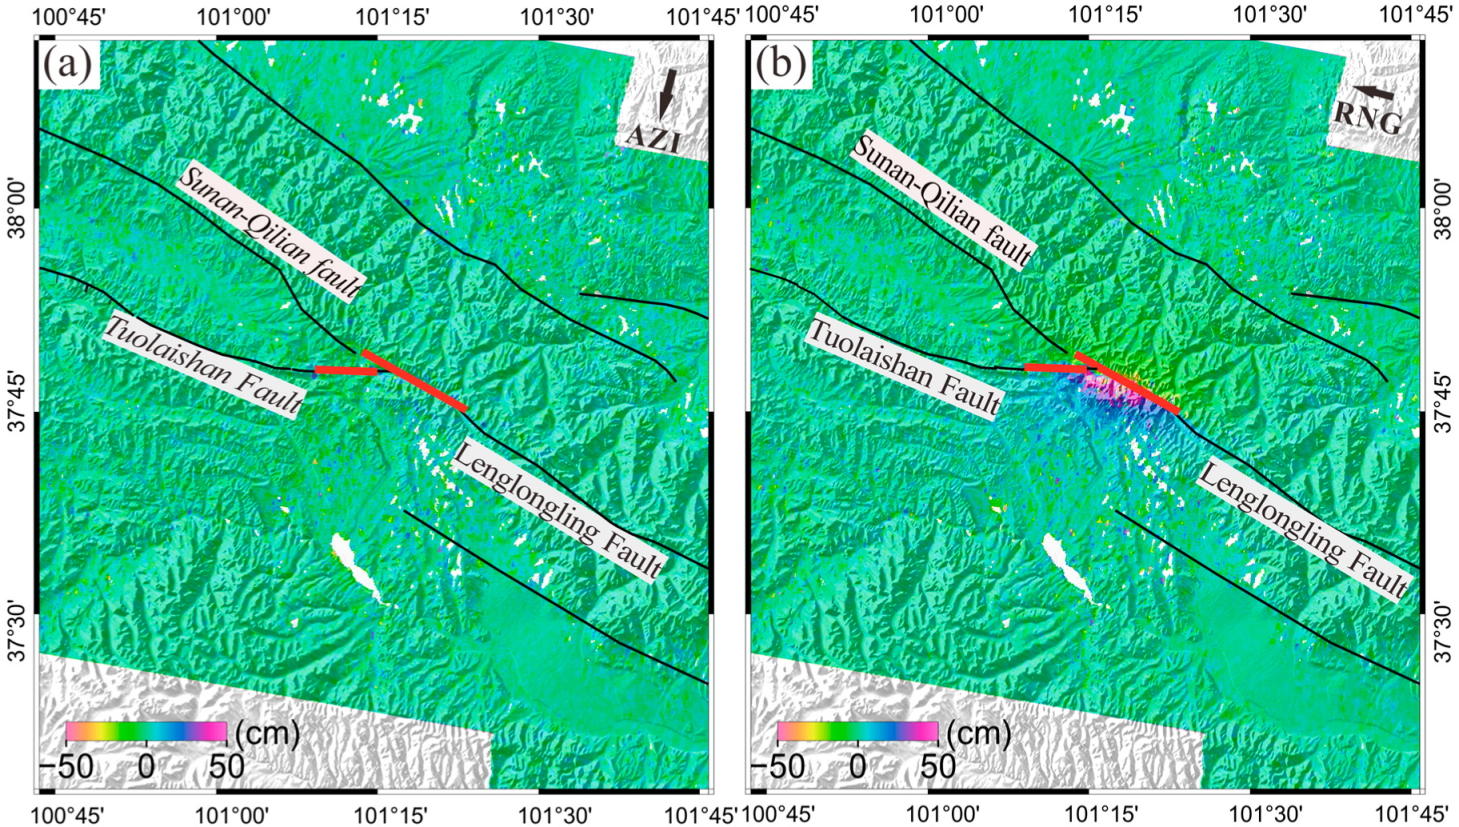
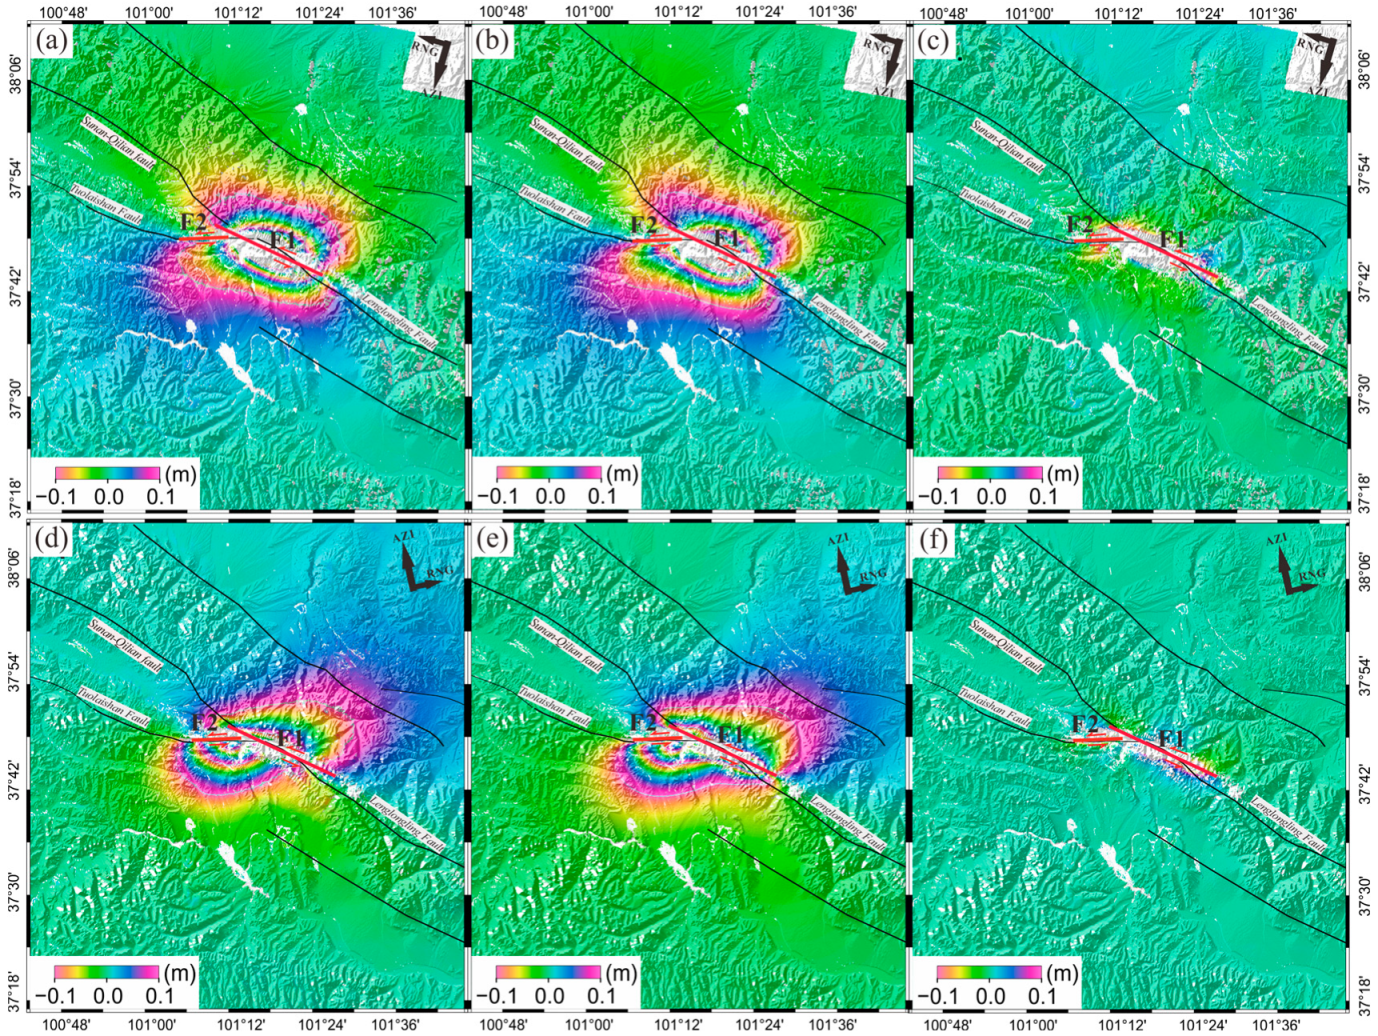
3.2. Coseismic Deformation
4. Focal Mechanism Inversion
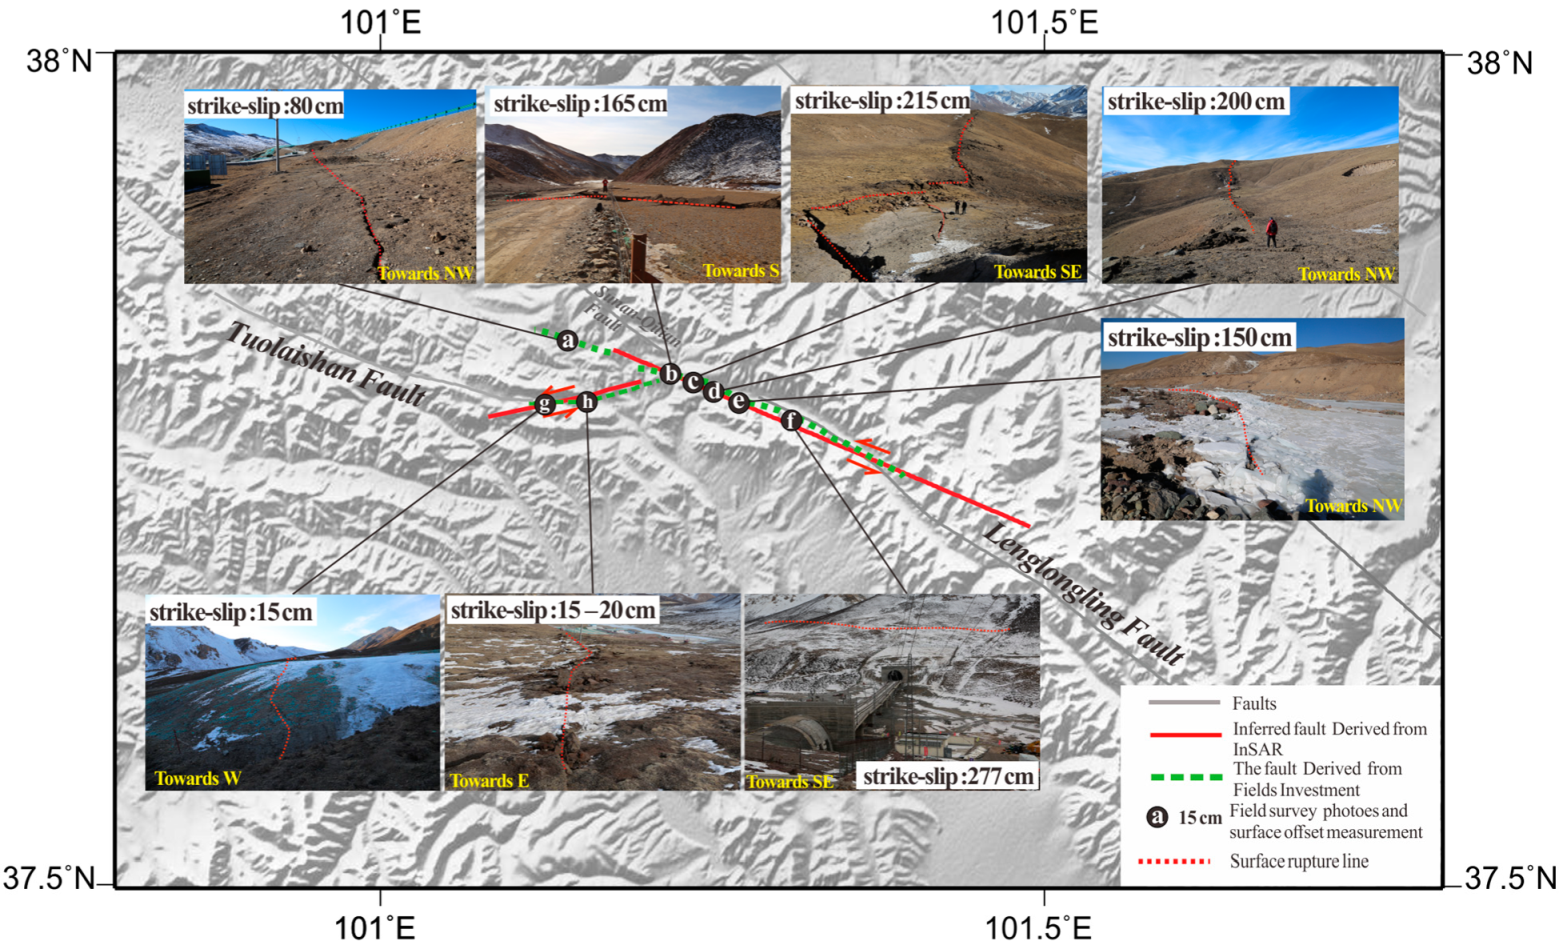
4.1. Determination of the Surface Rupture Fault
4.2. Uniform Slip Model
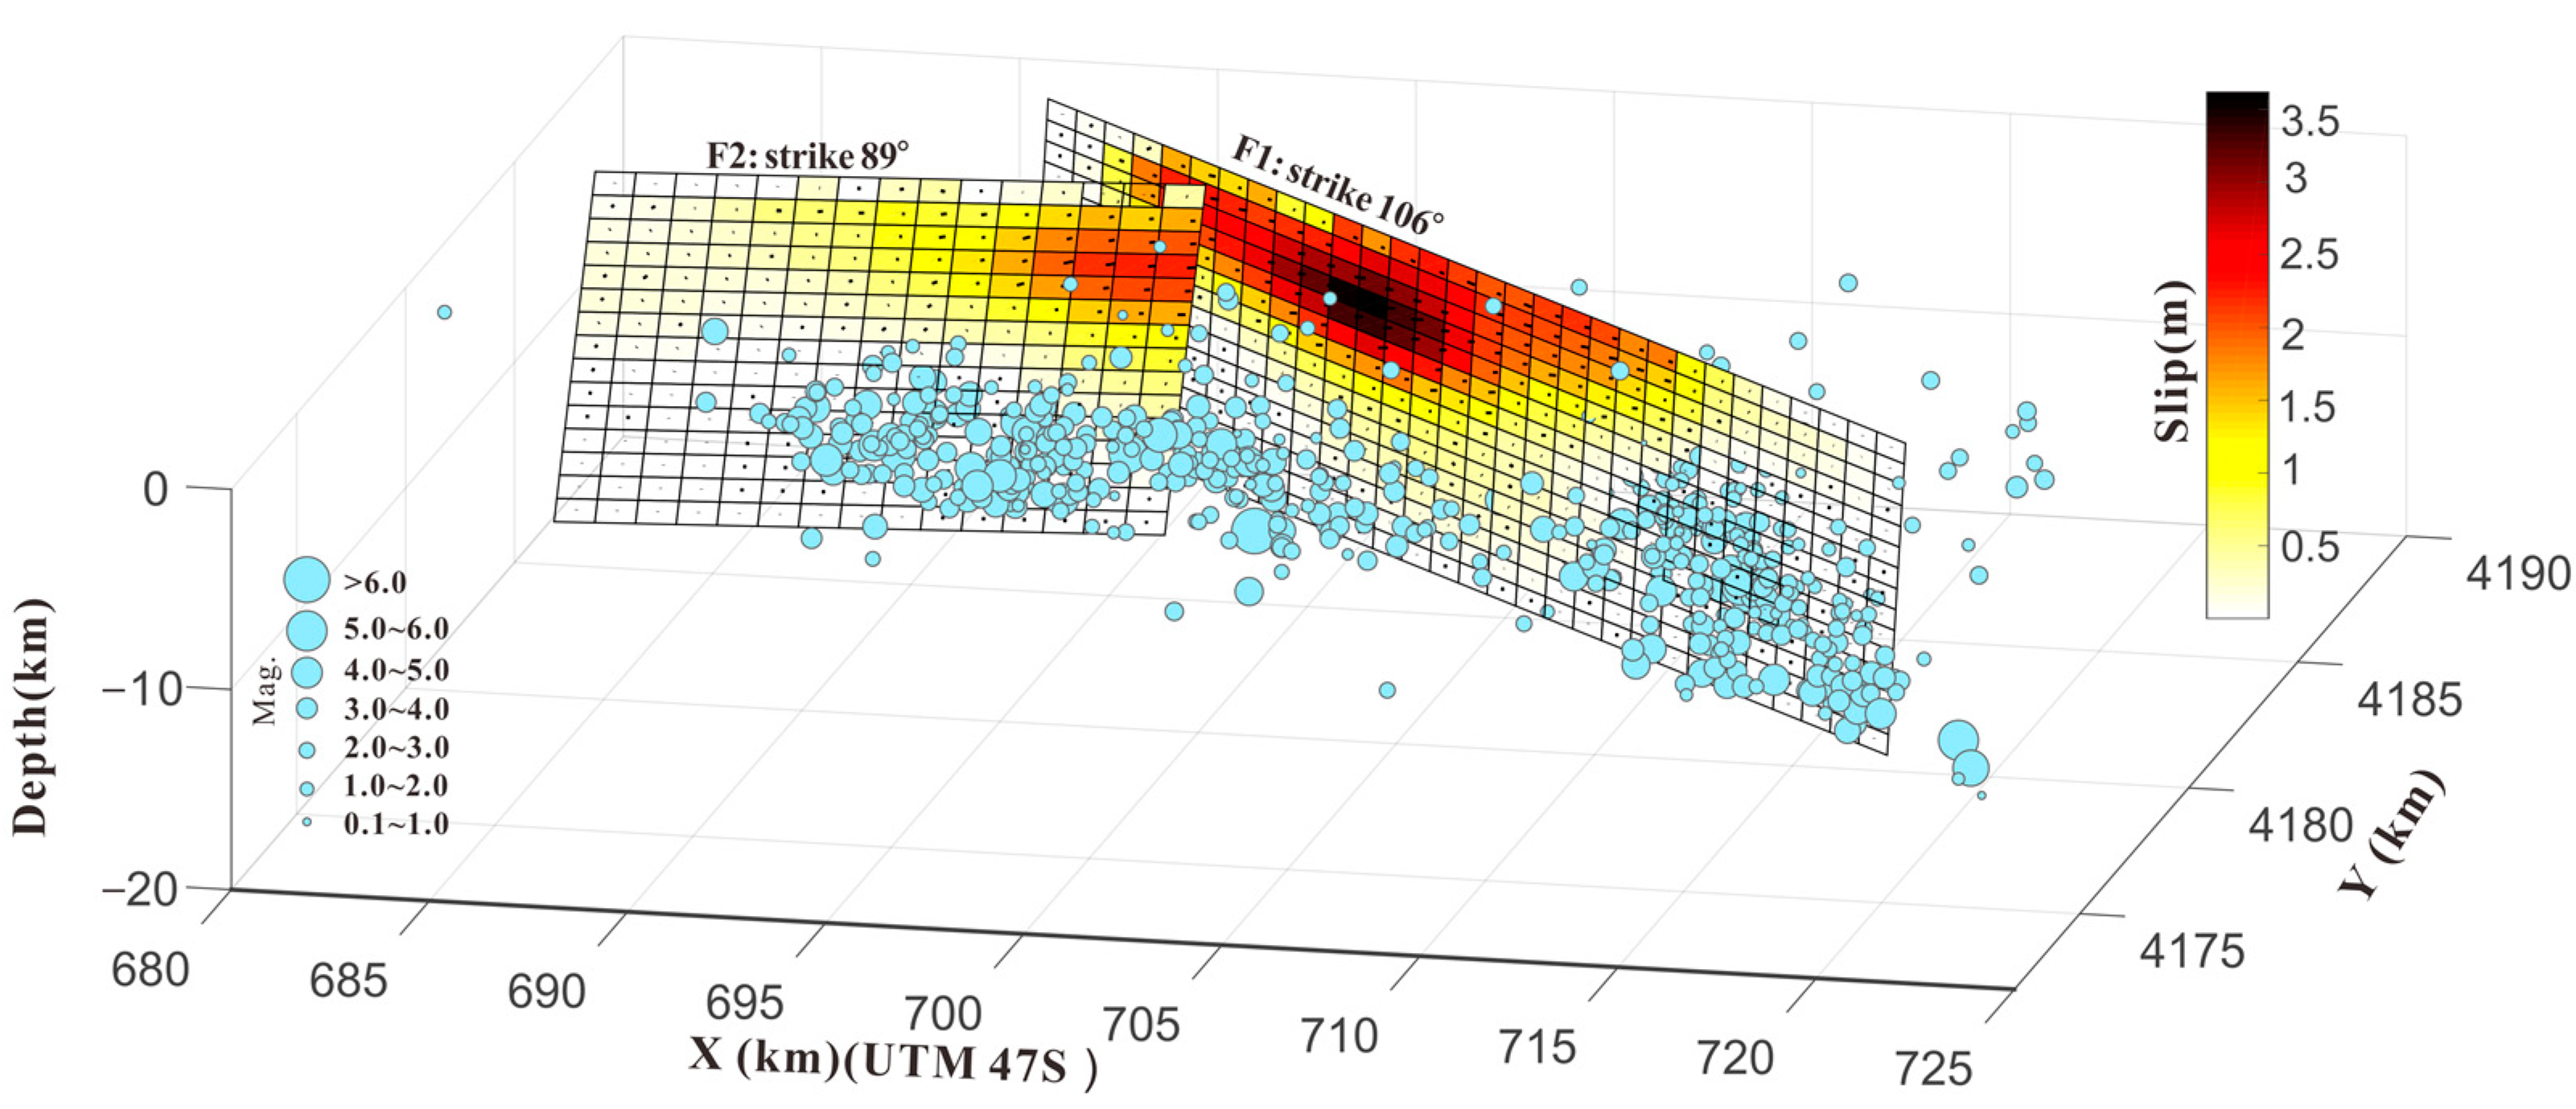
4.3. Distributed Slip Model
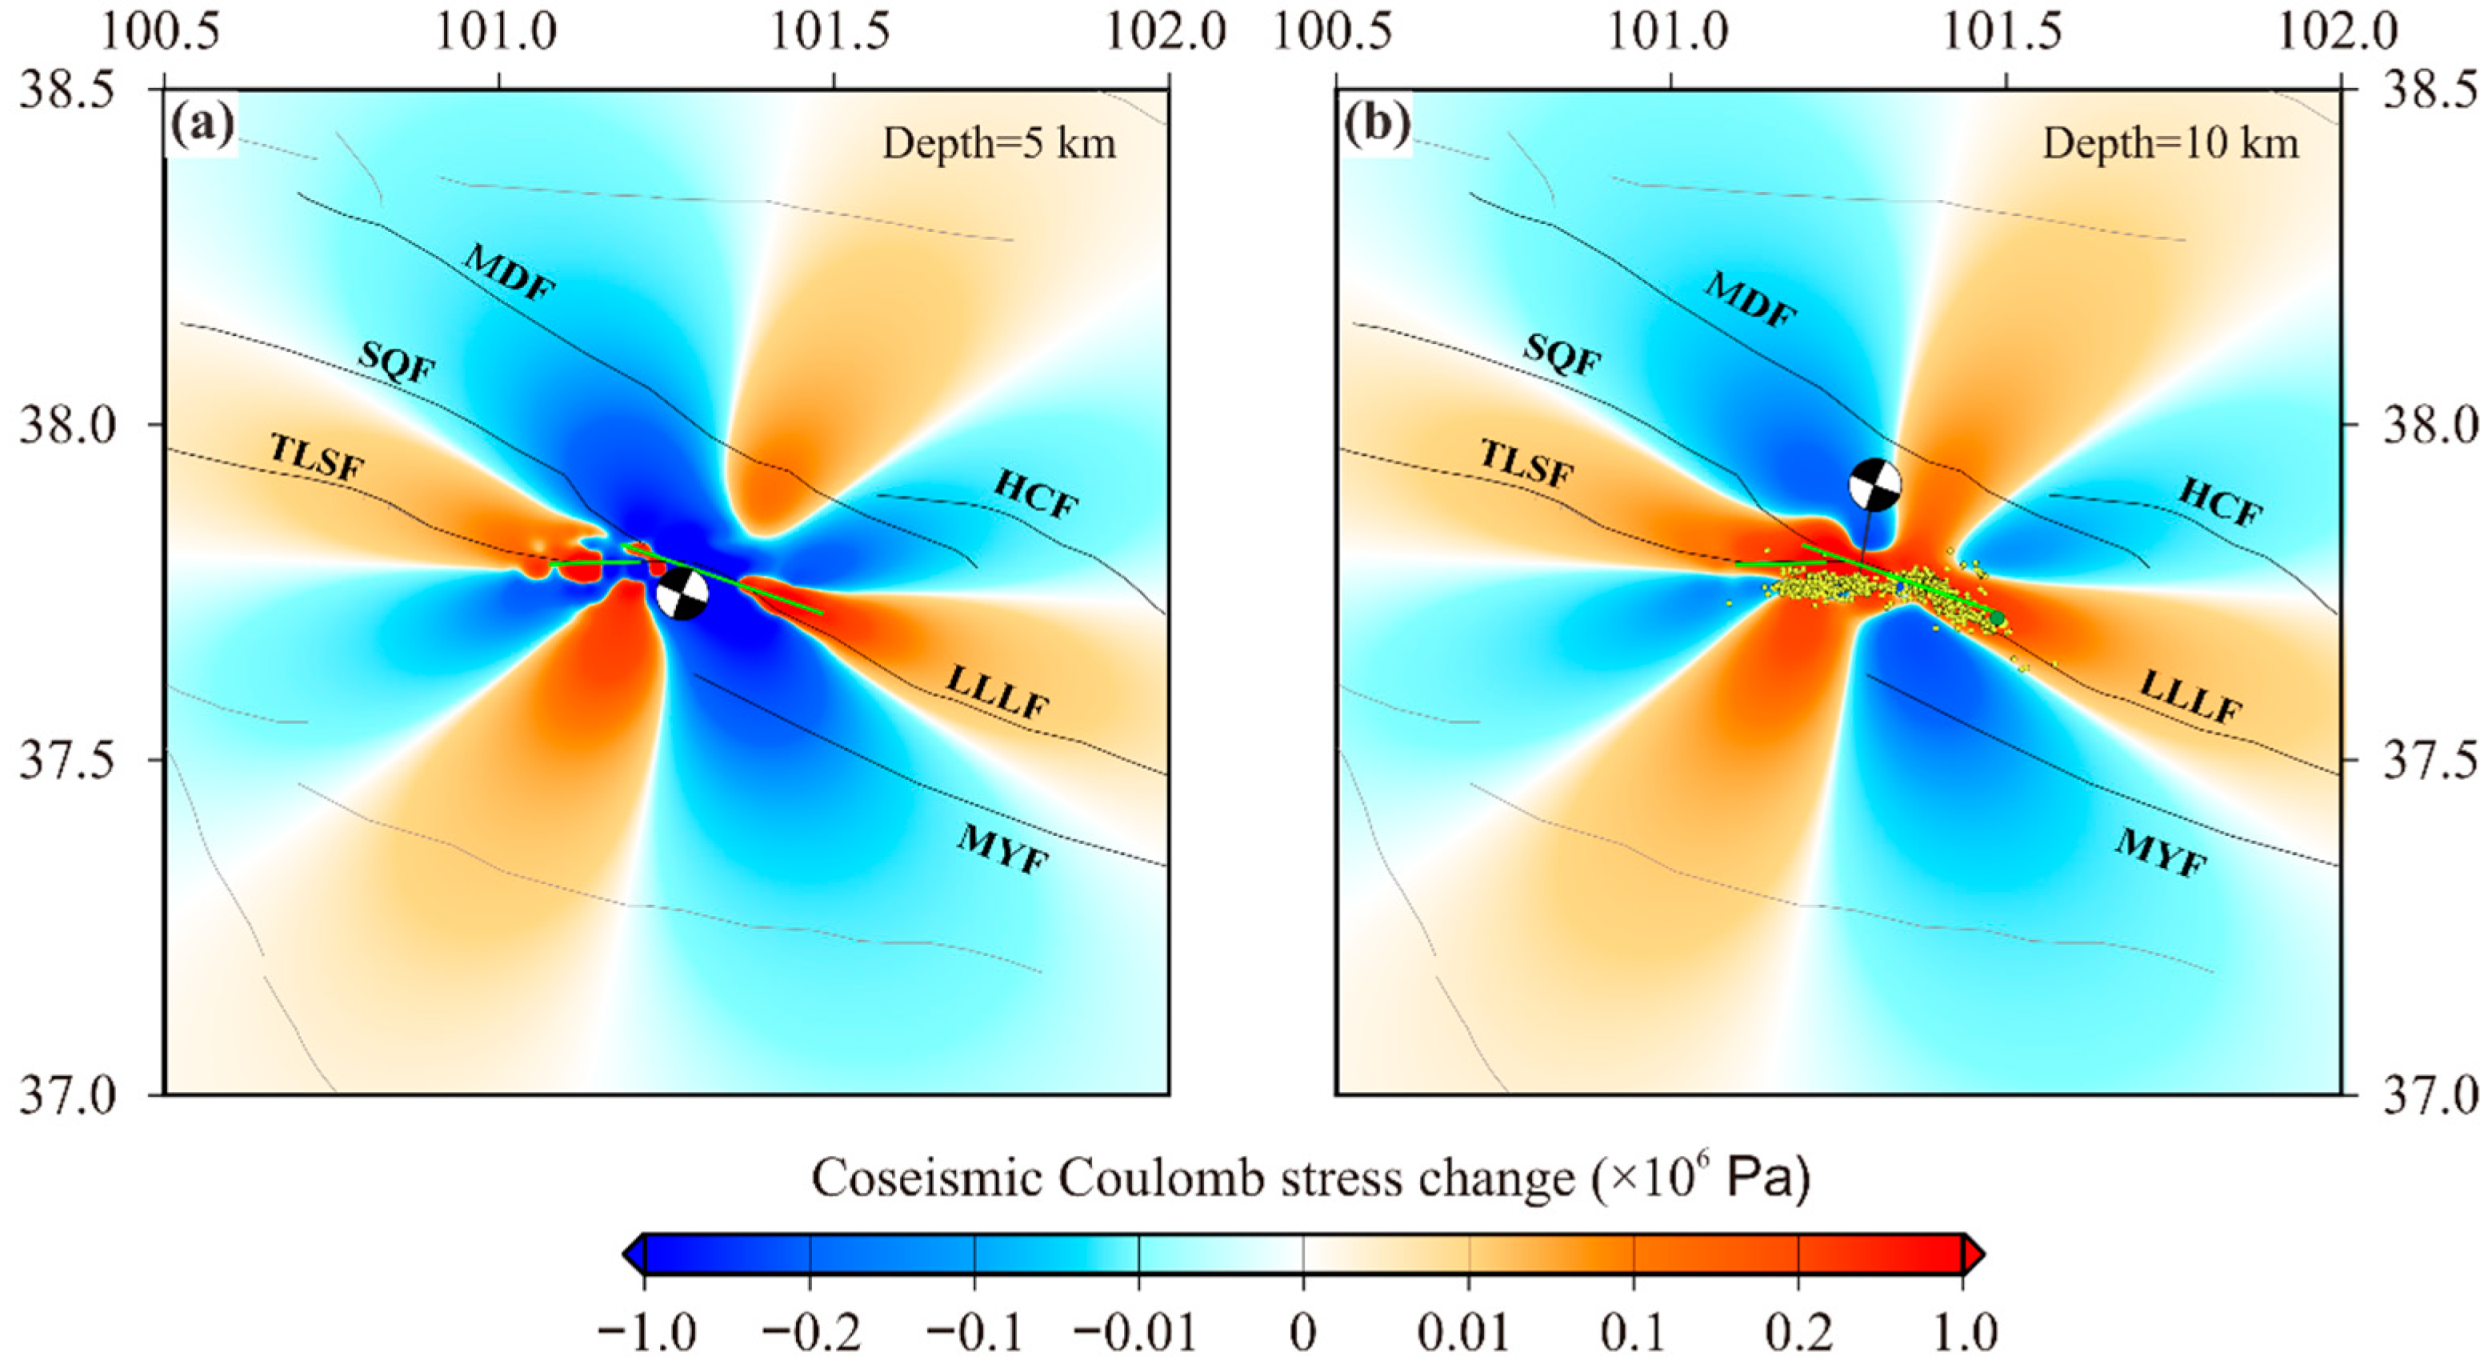
4.4. Coulomb Stress Changes
5. Discussion
5.1. Possible Triggering Effect between the 2016 and 2022 Events
5.2. Was the Coulomb Stress Completely Released by the 2022 Event at Any Depth?
5.3. The Seismic Hazard on the TLSF Derived from Spatial Diversity of the Surface Rupture
6. Conclusions
Supplementary Materials
Author Contributions
Funding
Data Availability Statement
Acknowledgments
Conflicts of Interest
References
- Gaudemer, Y.; Tapponnier, P.; Meyer, B.; Peltzer, G.; Shunmin, G.; Zhitai, C. Partitioning of crustal slip between linked, active faults in the eastern Qilian Shan, and evidence for amajor seismic gap, the Tianzhu gap, on the western Haiyuan fault, Gansu (China). Geophys. J. R. Astron. Soc. 1995, 120, 599–645. [Google Scholar] [CrossRef] [Green Version]
- He, W.; Liu, B.; Yuan, D.; Yang, M. Research on slip rates of the lenglongling active fault zone. China Earthq. Eng. J. 2000, 22, 90–97. [Google Scholar]
- He, W.; Yuan, D.; Ge, W.; Luo, H. Determination of the slip rate of the lenglongling fault in the middle and eastern segment of the Qilian mountain active fault zone. Earthquake 2010, 30, 131–137. [Google Scholar] [CrossRef]
- Jiang, W. Holocene Rupture Pattern, Seismic Recurrence Feature of the Lenglongling Fault Zone and Its Tectonic Implication for the Northeast Tibetan Plateau. Ph.D. Thesis, Institute of Geology, China Earthquake Administration, Beijing, China, 2016. [Google Scholar]
- Guo, P.; Han, Z.; Dong, S. Surface rupture and slip distribution along the Lenglongling fault in the NE Tibetan Plateau: Implications for faulting behavior. J. Asian Earth Sci. 2019, 172, 190–207. [Google Scholar] [CrossRef]
- Xu, X.; Wu, X.; Yu, G.; Tan, X.; Li, K. Seismo-geological signatures for identifying M ≥ 7.0 earthquake risk areas and their preliminary application in mainland China. Seismol. Geol. 2017, 39, 2. (In Chinese) [Google Scholar] [CrossRef]
- Li, Y.; Jiang, W.; Zhang, J.; Luo, Y. Space Geodetic Observations and Modeling of 2016 Mw 5.9 Menyuan Earthquake: Implications on Seismogenic Tectonic Motion. Remote Sens. 2016, 8, 519. [Google Scholar] [CrossRef] [Green Version]
- Xu, Y.; Guo, X.; Feng, L. Relocation and focal mechanism solutions of the MS6.9 Menyuan earthquake sequence on January 8, 2022 in Qinghai Province. Acta Seismol. Sin. 2022, 44, 1–15. [Google Scholar] [CrossRef]
- Guo, P.; Han, Z.; Mao, Z. Paleoearthquakes and Rupture Behavior of the Lenglongling Fault: Implications for Seismic Hazards of the Northeastern Margin of the Tibetan Plateau. J. Geophys. Res. Solid Earth 2019, 124, 1520–1543. [Google Scholar] [CrossRef]
- Deng, Q.; Zhang, P.; Ran, Y.; Min, W.; Yang, X.; Chu, Q. Basic characteristics of active tectonics of China. Sci. China 2003, 46, 356–372. [Google Scholar]
- Zhang, P.; Wang, Q.; Ma, Z. GPS Velocity Field and Active Crustal Blocks of Contenporary Tectonic Deformation In Continental China. Earth Sci. Front. 2002, 9, 430–441. [Google Scholar]
- Fan, L.; Li, B.; Liao, S.; Jiang, C.; Fang, L. Precise relocation of the aftershock sequences of the 2022 M6.9 Menyuanearthquake. Earthq. Sci. 2022, 35, Q20220008. [Google Scholar] [CrossRef]
- Liang, S.; Gan, W.; Shen, C.; Xiao, G.; Liu, J.; Chen, W. Three-dimensional velocity field of present-day crustal motion of the Tibetan Plateau derived from GPS measurements. J. Geophys. Res. Solid Earth 2013, 118, 5722–5732. [Google Scholar] [CrossRef]
- Zheng, W.J.; Zhang, P.Z.; He, W.G.; Yuan, D.Y.; Shao, Y.X.; Zheng, D.W. Transformation of displacement between strike-slip and crustal shortening in the northern margin of the Tibetan Plateau: Evidence from decadal GPS measurements and late quaternary slip rates on faults. Tectonophysics 2013, 584, 267–280. [Google Scholar] [CrossRef]
- Tang, J.; Zhan, Y.; Zhao, G.; Deng, Q.; Wang, J.; Chen, X.; Zhao, J.; Xuan, F. Electrical conductivity structure of the crust and upper mantle in the northeastern margin of the Qinghai_Tibet plateau along the profile Maqên-Lanzhou-Jingbian. Chin. J. Geophys. 2005, 48, 1205–1216. [Google Scholar] [CrossRef]
- Yuan, D.Y.; Ge, W.P.; Chen, Z.W.; Li, C.Y.; Wang, Z.C.; Zhang, H.P. The growth of northeastern Tibet and its relevance to large-scale continental geodynamics: A review of recent studies. Tectonics 2013, 32, 1358–1370. [Google Scholar] [CrossRef]
- Liu, J.; Ren, Z.K.; Zhang, H.; Li, C.; Zhang, Z.; Zheng, W. Slip rates of the Laohushan fault and the along strike-slip rate spatial pattern of the Haiyuan fault zone. Tectonics 2021, 41, e2021TC006992. [Google Scholar] [CrossRef]
- Pan, S.; Niu, F. Large contrasts in crustal structure and composition between the Ordos plateau and the NE Tibetan plateau from receiver function analysis. Earth Planet. Sci. Lett. 2021, 303, 291–298. [Google Scholar] [CrossRef]
- Wang, H.; Gao, R.; Zeng, L.; Kuang, Z.; Xue, A.; Li, W. Crustal structure and Moho geometry of the northeastern Tibetan Plateau as revealed by Sinoprobe-02 deep seismic-reflection profiling. Tectonophysics 2014, 636, 32–39. [Google Scholar] [CrossRef]
- Li, Y.; Jiang, W.; Zhang, J.; Li, B.; Yan, R.; Wang, X. Sentinel-1 SAR-Based coseismic deformation monitoring service for rapid geodetic imaging of global earthquakes. Nat. Hazards Res. 2021, 1, 11–19. [Google Scholar] [CrossRef]
- Tadono, T.; Ishida, H.; Oda, F.; Naito, S.; Minakawa, K.; Iwamoto, H. Precise Global DEM Generation By ALOS PRISM, ISPRS Annals of the Photogrammetry. Remote Sens. Spat. Inf. Sci. 2014, II-4, 71–76. [Google Scholar]
- Chen, C.W.; Zebker, H.A. Network approaches to two-dimensional phase unwrapping: Intractability and two new algorithms. J. Opt. Soc. Am. 2000, 17, 401–414. [Google Scholar] [CrossRef] [PubMed]
- Yu, C.; Penna, N.T.; Li, Z. Generation of real-time mode high-resolution water vapor fields from GPS observations. J. Geophys. Res. Atmos. 2017, 122, 2008–2025. [Google Scholar] [CrossRef]
- Yu, C.; Li, Z.; Penna, N.T. Interferometric synthetic aperture radar atmospheric correction using a GPS-based iterative tropospheric decomposition model. Remote Sens. Environ. 2018, 204, 109–121. [Google Scholar] [CrossRef]
- Li, Y.; Tian, Y.; Yu, C.; Su, Z.; Jiang, W.; Li, Z.; Zhang, J.; Luo, Y.; Li, B. Present-day interseismic deformation characteristics of the Beng Co-Dongqiao conjugate fault system in central Tibet: Implications from InSAR observations. Geophys. J. Int. 2020, 221, 492–503. [Google Scholar] [CrossRef]
- Li, Z.; Han, B.; Liu, Z.; Zhang, M.; Yu, C.; Chen, B.; Liu, H.; Du, J.; Zhang, S.; Zhu, W.; et al. Source Parameters and Slip Distributions of the 2016 and 2022 Menyuan, Qinghai Earthquakes Constrained by InSAR Observations. Geomat. Inf. Sci. Wuhan Univ. 2022. [Google Scholar] [CrossRef]
- Wang, T.; Shi, Q.; Nikkhoo, M.; Wei, S.; Barbot, D.; Dreger, R.; Bürgmann, M.; Motagh, M.; Chen, F. The rise, collapse, and compaction of Mt. Mantap from the September 3 2017 North Korean nuclear test. Science 2018, 361, 166–170. [Google Scholar] [CrossRef] [Green Version]
- Okada, Y. Surface deformation due to shear and tensile faults in a half-space. Bull. Seismol. Soc. Am. 1985, 75, 1135–1154. [Google Scholar] [CrossRef]
- Feng, W.; Li, Z.; Elliott, J.R.; Fukushima, Y.; Hoey, T.; Singleton, A.; Cook, R.; Xu, Z. The 2011 MW6.8 Burma earthquake: Fault constraints provided by multiple SAR techniques. Geophys. J. Int. 2013, 195, 650–660. [Google Scholar] [CrossRef] [Green Version]
- King, G.; Stein, R.; Lin, J. Static stress changes and the triggering of earthquakes. Bull. Seismol. Soc. Am. 1994, 84, 935–953. [Google Scholar]
- Shao, Z.; Xu, J.; Ma, H.; Zhang, L. Coulomb stress evolution over the past 200years and seismic hazard along the Xianshuihe fault zone of Sichuan, China. Tectonophysics 2016, 670, 48–65. [Google Scholar] [CrossRef]
- Li, Y.; Shao, Z.; Shi, F.; Chen, L. Stress evolution on active faults in the southwestern Yunnan region, southeastern Tibetan Plateau, and implications for seismic hazard. J. Asian Earth Sci. 2020, 200, 104470. [Google Scholar] [CrossRef]
- Wang, R.; Lorenzo-Martín, F.; Roth, F. PSGRN/PSCMP—a new code for calculating co-and post-seismic deformation, geoid and gravity changes based on the viscoelastic-gravitational dislocation theory. Comput. Geosci. 2006, 32, 527–541. [Google Scholar] [CrossRef] [Green Version]
- Shao, Z.G.; Fu, R.S.; Xue, T.X.; Huang, J.P. Simulating postseismic viscoelastic deformation based on Burgers model. J. Geod. Geodyn. 2007, 27, 31–37. [Google Scholar]
- He, J.; Lu, S.; Wang, W. Three-dimensional mechanical modeling of the GPS velocity field around the northeastern Tibetan plateau and surrounding regions. Tectonophysics 2013, 584, 257–266. [Google Scholar] [CrossRef]
- Liu, S.; Xu, X.; Klinger, Y.; Nocquet, J.M.; Chen, G.; Yu, G.; Jónsson, S. Lower crustal heterogeneity beneath the northern Tibetan Plateau constrained by GPS measurements following the 2001 Mw7. 8 Kokoxili earthquake. J. Geophys. Res. 2019, 124, 11992–12022. [Google Scholar] [CrossRef] [Green Version]
- Nalbant, S.S.; McCloskey, J.; Steacy, S.; Barka, A.A. Stress accumulation and increased seismic risk in eastern Turkey. Earth Planet. Sci. Lett. 2002, 195, 291–298. [Google Scholar] [CrossRef]
- Xiong, X.; Shan, B.; Zheng, Y.; Wang, R. Stress transfer and its implication for earthquake hazard on the Kunlun Fault, Tibet. Tectonophysics 2010, 482, 216–225. [Google Scholar] [CrossRef] [Green Version]


Publisher’s Note: MDPI stays neutral with regard to jurisdictional claims in published maps and institutional affiliations. |
© 2022 by the authors. Licensee MDPI, Basel, Switzerland. This article is an open access article distributed under the terms and conditions of the Creative Commons Attribution (CC BY) license (https://creativecommons.org/licenses/by/4.0/).
Share and Cite
Li, Y.; Jiang, W.; Li, Y.; Shen, W.; He, Z.; Li, B.; Li, Q.; Jiao, Q.; Tian, Y. Coseismic Rupture Model and Tectonic Implications of the January 7 2022, Menyuan Mw 6.6 Earthquake Constraints from InSAR Observations and Field Investigation. Remote Sens. 2022, 14, 2111. https://doi.org/10.3390/rs14092111
Li Y, Jiang W, Li Y, Shen W, He Z, Li B, Li Q, Jiao Q, Tian Y. Coseismic Rupture Model and Tectonic Implications of the January 7 2022, Menyuan Mw 6.6 Earthquake Constraints from InSAR Observations and Field Investigation. Remote Sensing. 2022; 14(9):2111. https://doi.org/10.3390/rs14092111
Chicago/Turabian StyleLi, Yongsheng, Wenliang Jiang, Yujiang Li, Wenhao Shen, Zhongtai He, Bingquan Li, Qiang Li, Qisong Jiao, and Yunfeng Tian. 2022. "Coseismic Rupture Model and Tectonic Implications of the January 7 2022, Menyuan Mw 6.6 Earthquake Constraints from InSAR Observations and Field Investigation" Remote Sensing 14, no. 9: 2111. https://doi.org/10.3390/rs14092111