Article

Accurate Measurement and Assessment of Typhoon-Related Damage to Roadside Trees and Urban Forests Using the Unmanned Aerial Vehicle

Lab of Environmental and Energy Information Engineering, School of Environment and Energy, Peking University Shenzhen Graduate School, Shenzhen 518055, China
*
Author to whom correspondence should be addressed.
Remote Sens. 2022, 14(9), 2093; https://doi.org/10.3390/rs14092093
Submission received: 21 March 2022 / Revised: 23 April 2022 / Accepted: 24 April 2022 / Published: 27 April 2022

Abstract

:
With drastic changes to the environment arising from global warming, there has been an increase in both the frequency and intensity of typhoons in recent years. Super typhoons have caused large-scale damage to the natural ecological environment in coastal cities. The accurate assessment and monitoring of urban vegetation damage after typhoons is important, as they contribute to post-disaster recovery and resilience efforts. Hence, this study examined the application of the easy-to-use and cost-effective Unmanned Aerial Vehicle (UAV) oblique photography technology and proposed an improved detection and diagnostic measure for the assessment of street-level damage to urban vegetation caused by the super typhoon Mangkhut in Shenzhen, China. The results showed that: (1) roadside trees and artificially landscaped forests were severely damaged; however, the naturally occurring urban forest was less affected by the typhoon. (2) The vegetation height of roadside trees decreased by 20–30 m in most areas, and that of artificially landscaped forests decreased by 5–15 m; however, vegetation height in natural forest areas did not change significantly. (3) The real damage to vegetation caused by the typhoon is better reflected by measuring the change in vegetation height. Our study validates the use of UAV remote sensing to accurately measure and assess the damage caused by typhoons to roadside trees and urban forests. These findings will help city planners to design more robust urban landscapes that have greater disaster coping capabilities.

Graphical Abstract

1. Introduction

Typhoons, a type of tropical cyclone generated in the Pacific Ocean, are commonly occurring extreme climatic events that can adversely impact human societies and natural systems around the world [1,2,3]. Given the propensity for increasing global climate change, typhoon intensity is predicted to increase in the foreseeable future and amplify disaster risks [4,5]. This was ascertained by the super typhoon Mangkhut in 2018, which resulted in the most severe and widespread ecological damage in Hong Kong, China, in the last three decades [6]. It caused a direct economic loss of about HK $4.6 billion.
Typhoons are major natural disturbances to urban vegetation. The strong winds can reduce tree leaves, break branches, and even uproot trees [7]. They not only change the vegetation composition, structure, and spatial patterns [3,8,9], but also cause intense loss of native biomass, further affecting carbon storage and productivity in urban ecosystems [10]. Therefore, it becomes critical to designate effective strategies to mitigate the damage to urban vegetation caused by typhoons. Accurate assessment of urban vegetation damage after typhoons is an important basis for guiding post-disaster recovery and improving resilience to disasters [11].
There is a high degree of heterogeneity in urban surface patterns [12], which makes it difficult to assess the damage caused to vegetation. In most cases, manual ground-based survey methods are applied to analyze the impact of typhoon hazards on trees at the individual level [13,14,15]. While ground survey methods are capable of acquiring land surface data with greater accuracy, it is, however, very labor-intensive and expensive [16]. Furthermore, the inefficiency of the methods is usually in contradiction with the urgent need of cities to recover quickly from disasters. Therefore, it is difficult to provide large-scale, comprehensive, and timely information on typhoon damage.
The application of remote sensing technology can mitigate the problems of scale and cost of vegetation damage assessment to some extent [17,18,19]. Satellite remote sensing data can provide information on vegetation damage at landscape and regional scales at a low cost [16,18]. However, many of the commonly available satellite data have low spatial resolutions (e.g., 500 m for MODIS, 30 m for Landsat-8, and 10 m for Sentinel-2) which makes it challenging to capture the high heterogeneity of urban surface changes [20]. In addition, such methods are unable to immediately collect cloud-free satellite images, which are aggravated by the severe weather conditions pre- and post-typhoon [17,21]. Coupled with the limitations of the satellite re-entry period, it is difficult to obtain accurate vegetation damage information in urban areas within the specified time frame.
The development of Unmanned Aerial Vehicle (UAV) technology offers potential advantages to accurately measure the urban vegetation damage. The UAV-based methods are cheaper and more efficient compared to ground-based survey methods and can provide detailed vegetation damage information at the street level. Other significant advantages of UAV technology are its ability to fly under clouds and its relatively higher spatiotemporal resolution compared to satellite remote sensing [22,23], which are more suitable for complex urban landscapes. UAV technology has already been applied in studies related to vegetation disturbance, such as assessment and recovery after forest fires [24,25], bark beetle damage assessments in urban forests [26], and forest windthrow estimations after strong wind disturbances [27]. Despite its superior advantages in monitoring changes to and disturbance of vegetation, the application of UAV technology in urban vegetation damage assessments after typhoons has remained limited.
The assessment of urban vegetation damage requires more refined and comprehensive indicators as compared to natural vegetation. So far, most prior studies have used the changes in various Vegetation Indices (VIs) or other derived variables pre- and post-typhoon as indicators to estimate the natural vegetation damage [16,17]. For example, the Normalized Difference Infrared Index (NDII) calculated from MODIS remote sensing data were used to study the forest damage caused by hurricane, which is another kind of tropical cyclonic storm generated in the Atlantic Ocean [19]. The change in the Normalized Difference Vegetation Index (NDVI) calculated from Landsat-8 was used to quantify biomass loss [28]. However, the knowledge of typhoon-induced disturbance to natural vegetation may not be applicable to urban environments due to the large differences between urban surfaces and natural landscapes [9]. Meanwhile, some VIs could introduce bias to estimated vegetation damage—for example, NDVI reaches saturation in dense vegetation canopies, which may cause an underestimation of biomass [29]. A reasonable assessment from ecological knowledge such as vegetation structural indicators, i.e., vegetation coverage and height, may bring new insights into the study of urban vegetation damage. UAV technology, with its flexible acquisition and ultra-high-resolution data, offers a possibility to obtain these indicators. In particular, the UAV photogrammetry and mounted LiDAR sensors have the ability to generate three-dimensional point clouds of vegetation [30,31], which can provide more indicators for assessing vegetation damage. However, there are relatively few studies that aim to measure vegetation damage based on such comprehensive parameters as those produced by UAV sensors.
This study aims to test the capability of UAV technology in the assessment of urban vegetation damage after typhoons. The study seeks to achieve this by evaluating the effect of the super typhoon Mangkhut, which hit the city of Shenzhen, China, on 16 September 2018. The UAV oblique photography technology was adopted to collect the data, after which a change detection technique was used to estimate the damage to the urban vegetation caused by the typhoon. The main objectives of this study are: (1) establishing and validating a UAV oblique photography-based method at the street level to assess urban vegetation damage; (2) studying the decimeter-scale resolution to evaluate the reliability of the two indicators (i.e., vegetation coverage and height) used in estimating the damages caused by the typhoon; and (3) using the obtained damage distribution map to analyze the factors affecting urban vegetation.

2. Materials and Methods
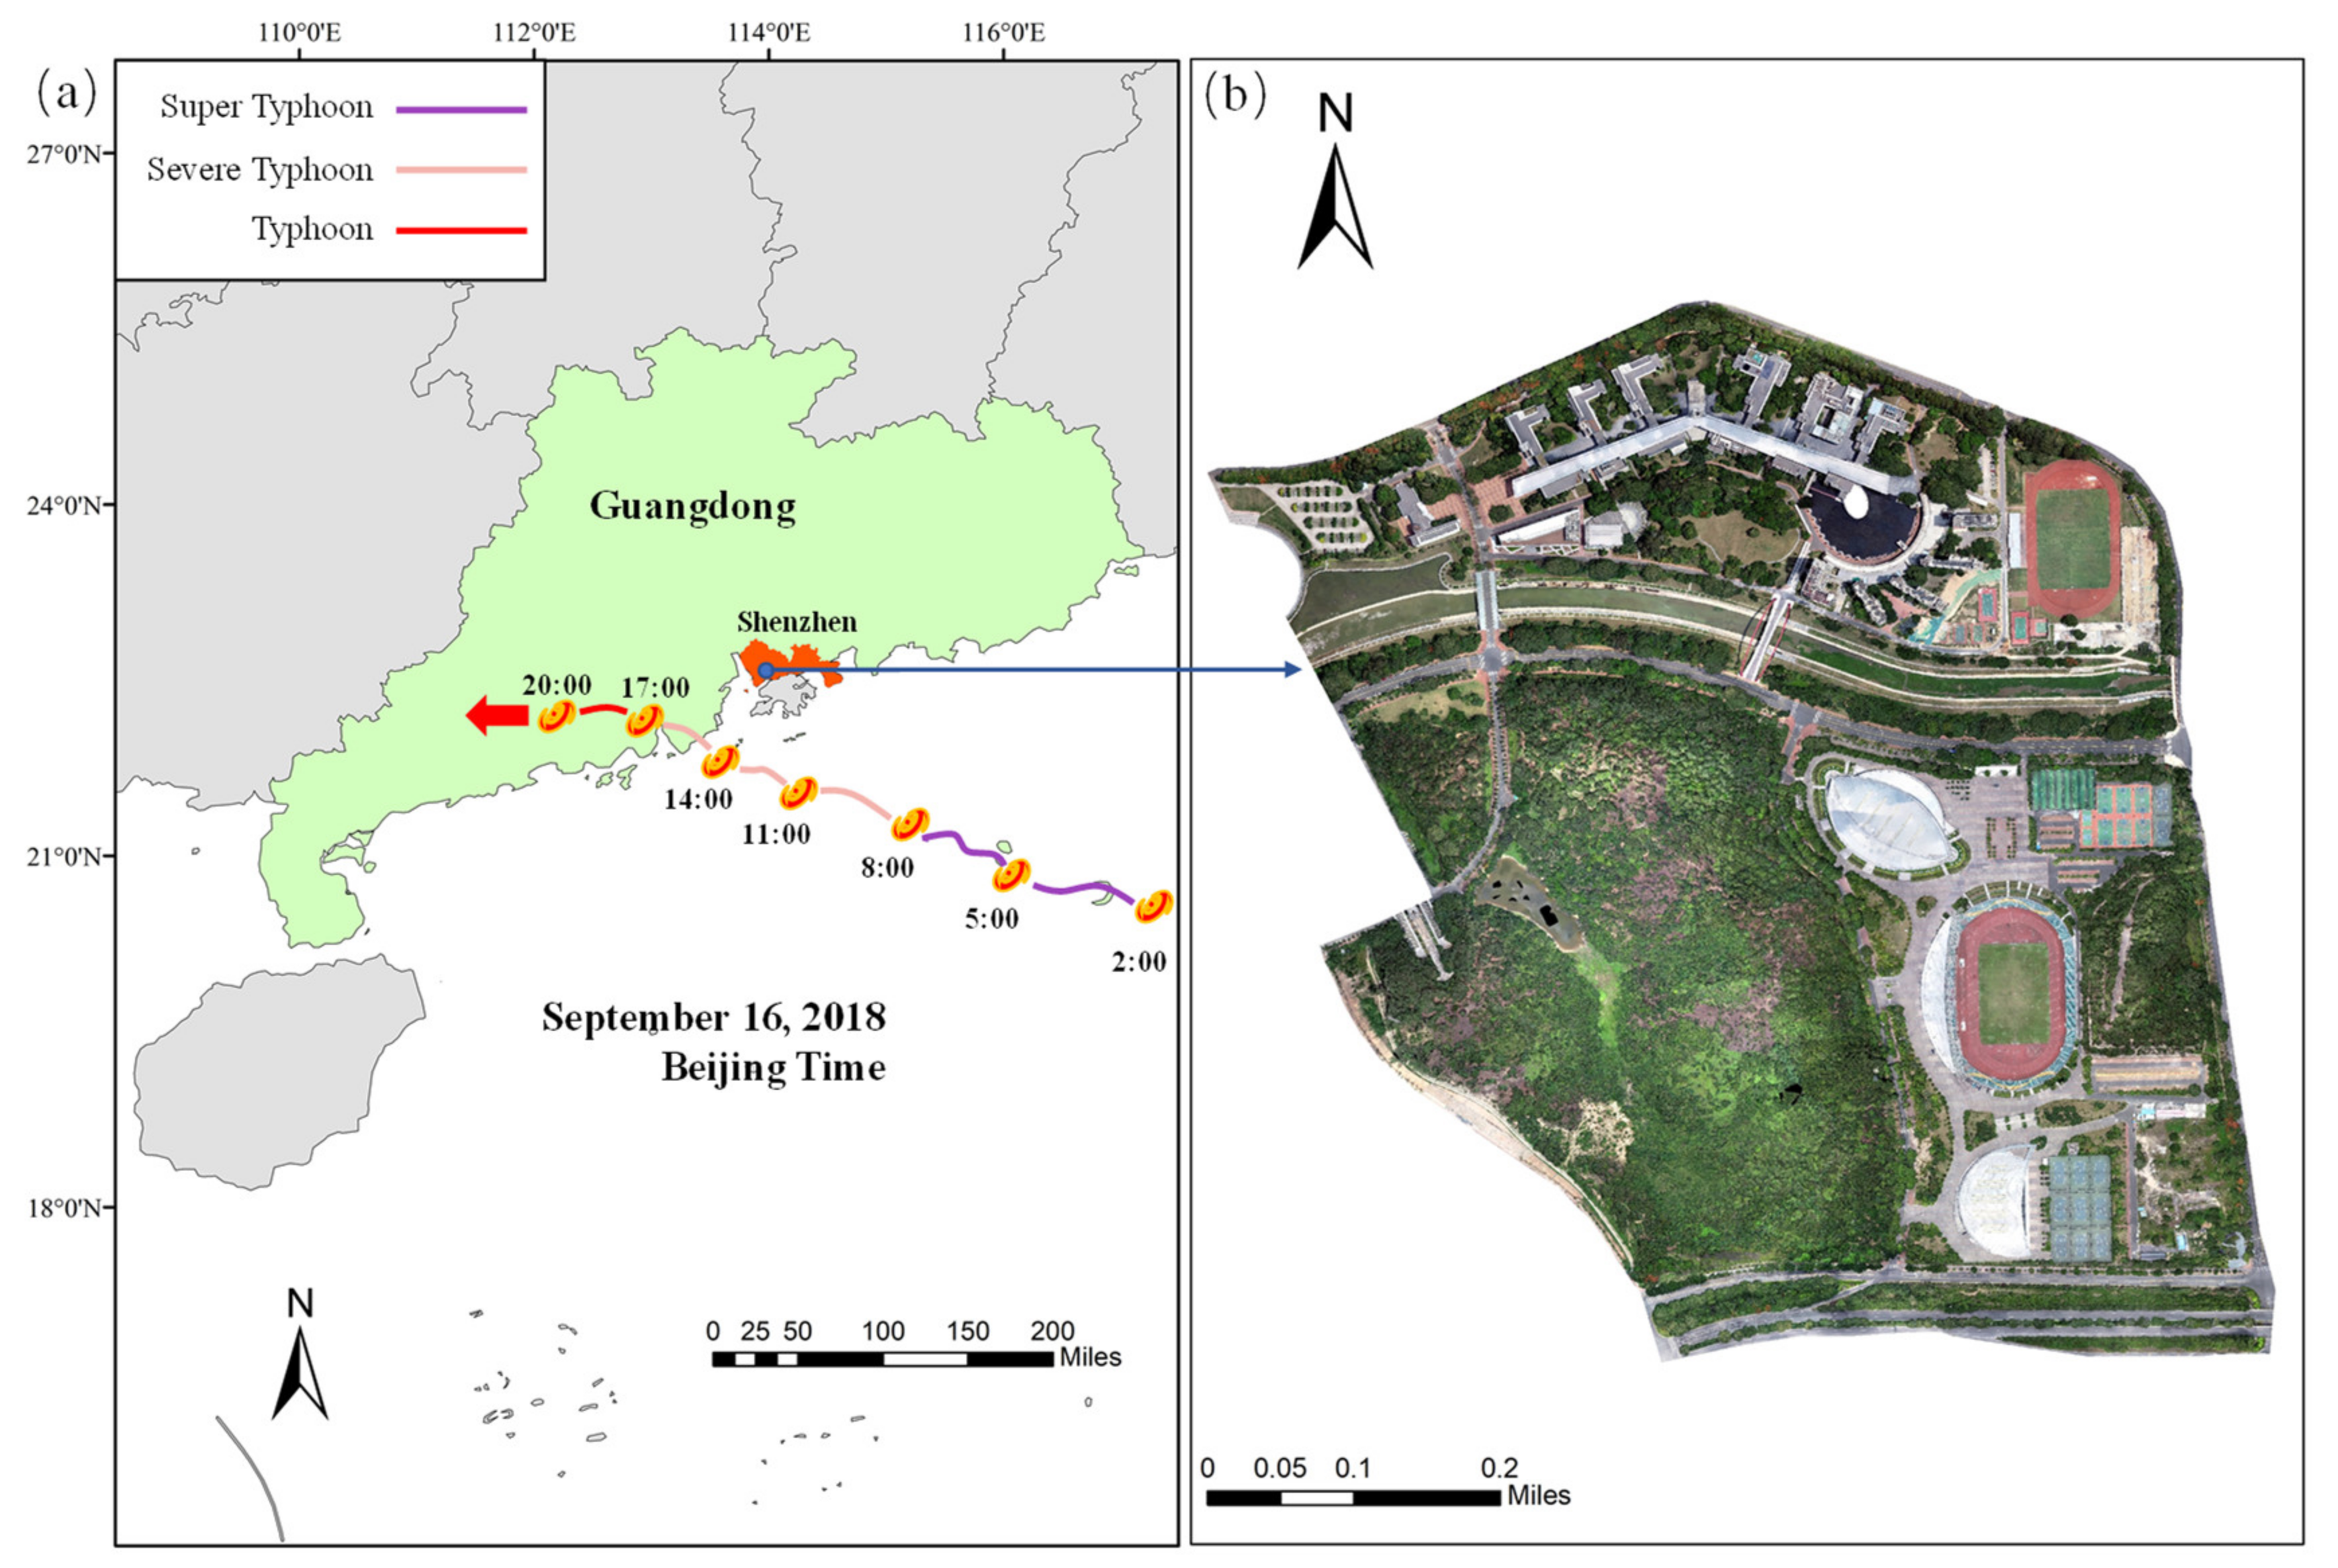
2.1. Study Site

The study site selected for this research is the Shenzhen University Town located in Shenzhen city, Guangdong province, China (113°46′–114°37′E, 22°27′–22°52′N), which has an area of 0.8 km2 (Figure 1). Shenzhen has a typical subtropical maritime climate, with an average temperature and precipitation of 23.0 °C and 1935.8 mm, respectively. It is affected by typhoons on average 4–5 times a year, with the dominant wind direction being South-East to East. There are typical subtropical urban landscape components in the area, including roadside trees, artificial landscape forests, natural forests, buildings, roads, rivers, bridges, and other elements. The vegetation mainly includes arbors, lawns, and few shrubs. In particular, the main species found on the site are Ficus concinna, Bambusa vulgaris, Terminalia neotaliala, Araucaria cunninghamii, and Zoysia matrella. These plant species are commonly used in urban landscaping in subtropical regions. Super typhoon Mangkhut passed through Shenzhen from 20:00 to 14:00 (local standard time) from 16–17 September 2018 and caused various degrees of damage to the vegetation.

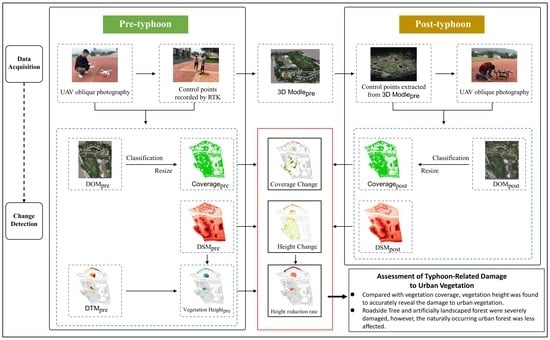
2.2. UAV-Based Methodology for Remote Assessment of Vegetation Damage

The proposed method for assessing typhoon-related damage of urban vegetation includes data collection, using UAV remote sensing and a change detection technique. UAV oblique photography was used to acquire data for pre- and post-typhoon periods. The pre-typhoon ground control points were recorded by handheld RTK equipment. The post-typhoon ground control points were obtained from the pre-typhoon 3D model. The pre- and post-typhoon digital surface models (DSM) and digital orthophotos models (DOM) of the ground were generated and applied to calculate the vegetation coverage and height changes. The level of vegetation damage was then evaluated based on these indicators.

2.3. Data Acquisition and Pre-Processing Procedure

UAV surveys were conducted before and after typhoon Mangkhut hit Shenzhen. Detailed flight parameters are shown in Table 1. The pre-typhoon UAV data were collected by vertical photography using a DJI Phantom 4 Pro camera on 21 May 2018. In order to obtain data results of superior quality, the forward and side overlap rates were set very high. However, the overlap rates decrease at the sides and tops of super tall buildings, which leads to voids in the 3D data of these parts of the buildings. Even though this problem had less impact on this study, it could, however, adversely influence the data quality in areas with large elevation drops or very high vegetation heights. We developed the six-rotor UAV and equipped it with an oblique photography system consisting of two SONY ILCE-6000 cameras, which not only solved the problem of poor modeling of ultra-high buildings, but also achieved higher quality modeling data with a lower data overlap rate. This greatly improved the efficiency of the field data acquisition and pre-processing. The post-typhoon data collection was conducted on 19 September 2018.
The UAV data were pre-processed based on the Structure from Motion (SfM) algorithm. We completed this process using the Context Capture Center software (v10.16.0.75, Exton, PA, USA) [32], including aero triangulation and 3D reconstruction steps. For the pre-typhoon UAV dataset, 11 ground control points were set and recorded by UFO U3 ground RTK equipment (horizontal: ±(8 + 1 × 10⁻⁶ D) mm; vertical: ±(15 + 1 × 10⁻⁶ D) mm), to calibrate the accuracy of the modeling during aero triangulation. A series of products—i.e., 3D scene models, digital orthophoto models (DOMs), and digital surface models (DSMs) with WGS 84 UTM zone 49N—were generated after 3D reconstruction. Finally, we resampled the spatial resolution of both DOMs and DSMs to 10 cm to improve the efficiency of the classification and change detection.

2.4. Estimation of Urban Vegetation Coverage and Their Changes

To detect changes in vegetation coverage, the classification of DOMs before and after typhoons was performed using the Nearest Neighbor classification method (eCognition, v8.9.0, Sunnyvale, CA, USA). The estimation of the segmentation scale was carried out using the Estimation of Scale Parameters tool [33]. The local variance peaks represent the best possible segmentation scales for different surface types. The objective for classification was to identify vegetation areas. The color difference between vegetated and non-vegetated areas was significant. Therefore, the color factor was set to 0.9 and the shape factor was set to 0.1. A high value of the smoothness factor is helpful for identifying objects with smooth boundaries. The boundaries of pre-typhoon vegetation areas were clear, hence, both the factors were set to 0.5. A large amount of vegetation fell down after the typhoon, such that the boundaries of the vegetation areas were no longer smooth, however, the vegetation fell near where it grew, without any long-distance movement or changes to position. The post-typhoon smoothness and tightness were set to 0.3 and 0.7, respectively. The classification results were evaluated using the Kappa coefficient, for which a result greater than 0.85 indicates that the classification result is excellent [34]. Pre- and post-typhoon Kappa coefficients were 0.98 and 0.88, respectively.
The changes in urban vegetation coverage were estimated using the classification results. A grid with a spatial resolution of 1 m for the vegetation area (including both lawns and forestlands) was created, consistent with the geographical system of the study area. The area of the vegetation within each cell was calculated using this grid. The coverage of each cell can be defined as the ratio of the vegetation area to the cell area. The changes in coverage were calculated by subtracting the coverage data before and after the typhoon.

2.5. Calculation of Urban Vegetation Height and Their Changes

The changes to tree heights were calculated by subtracting the post-typhoon DSM from the pre-typhoon DSM in the vegetation area. The pre-typhoon tree heights were used to normalize the tree height changes. Firstly, the ground elevation of the vegetation area, which is also known as the digital terrain model (DTM), was obtained. The ground elevation points near the trees were interpreted from the post-typhoon DSM due to its sparse vegetation. The DTM was then obtained by interpolating these elevation points using the inverse distance weight (IDW) algorithm. The exponent of distance was set to 2, and the number of nearest points was set to 12. Secondly, the tree height was calculated by subtracting the DTM from the pre-typhoon DSM. Finally, the normalized tree height change (i.e., height reduction) was estimated as the ratio of the tree height changes to the tree heights pre-typhoon. The above procedure was performed in ArcGIS Desktop (v.10.6, ESRI, Redlands, CA, USA).

3. Results

3.1. Validation of the UAV Technology

The pre-typhoon dataset was first calibrated based on the 11 ground control points and UFO U3 ground RTK equipment. The comparisons show that the median errors of the pre-typhoon UAV dataset were 0.19 cm in the horizontal x-axis direction, 0.29 cm in the horizontal y-axis direction, and 0.07 cm in the vertical direction. These results indicate the high accuracy of the pre-typhoon dataset. Then, 29 control points were extracted from the pre-typhoon 3D model to validate of the post-typhoon dataset. The median errors of the post-typhoon UAV dataset were 1.11 cm in the horizontal x-axis direction, 0.37 cm in the horizontal y-axis direction, and 0.04 cm in the vertical direction. These results suggest comparably high accuracy of the pre-typhoon and post-typhoon 3D datasets, even when based on different sensors and flight parameters. Because these technical differences produced two different resolutions images (Table 1), we resampled the spatial resolution of the pre- and post-typhoon DOMs and DSMs to 10 cm to assess the changes in urban vegetation coverage and height. To further illustrate the match issue between the two different sensors and flight parameters and to validate the accuracy of the height change assessment, 330 points of roads and building roofs (which suffered little typhoon damage) were selected (Figure 2). The average change in height was −4.27 ± 8.64 cm, indicating that the pre- and post-typhoon datasets (based on different sensors and flight parameters) matched well, and the assessment of typhoon-related damage was deemed sufficiently accurate for detecting changes of several meters.

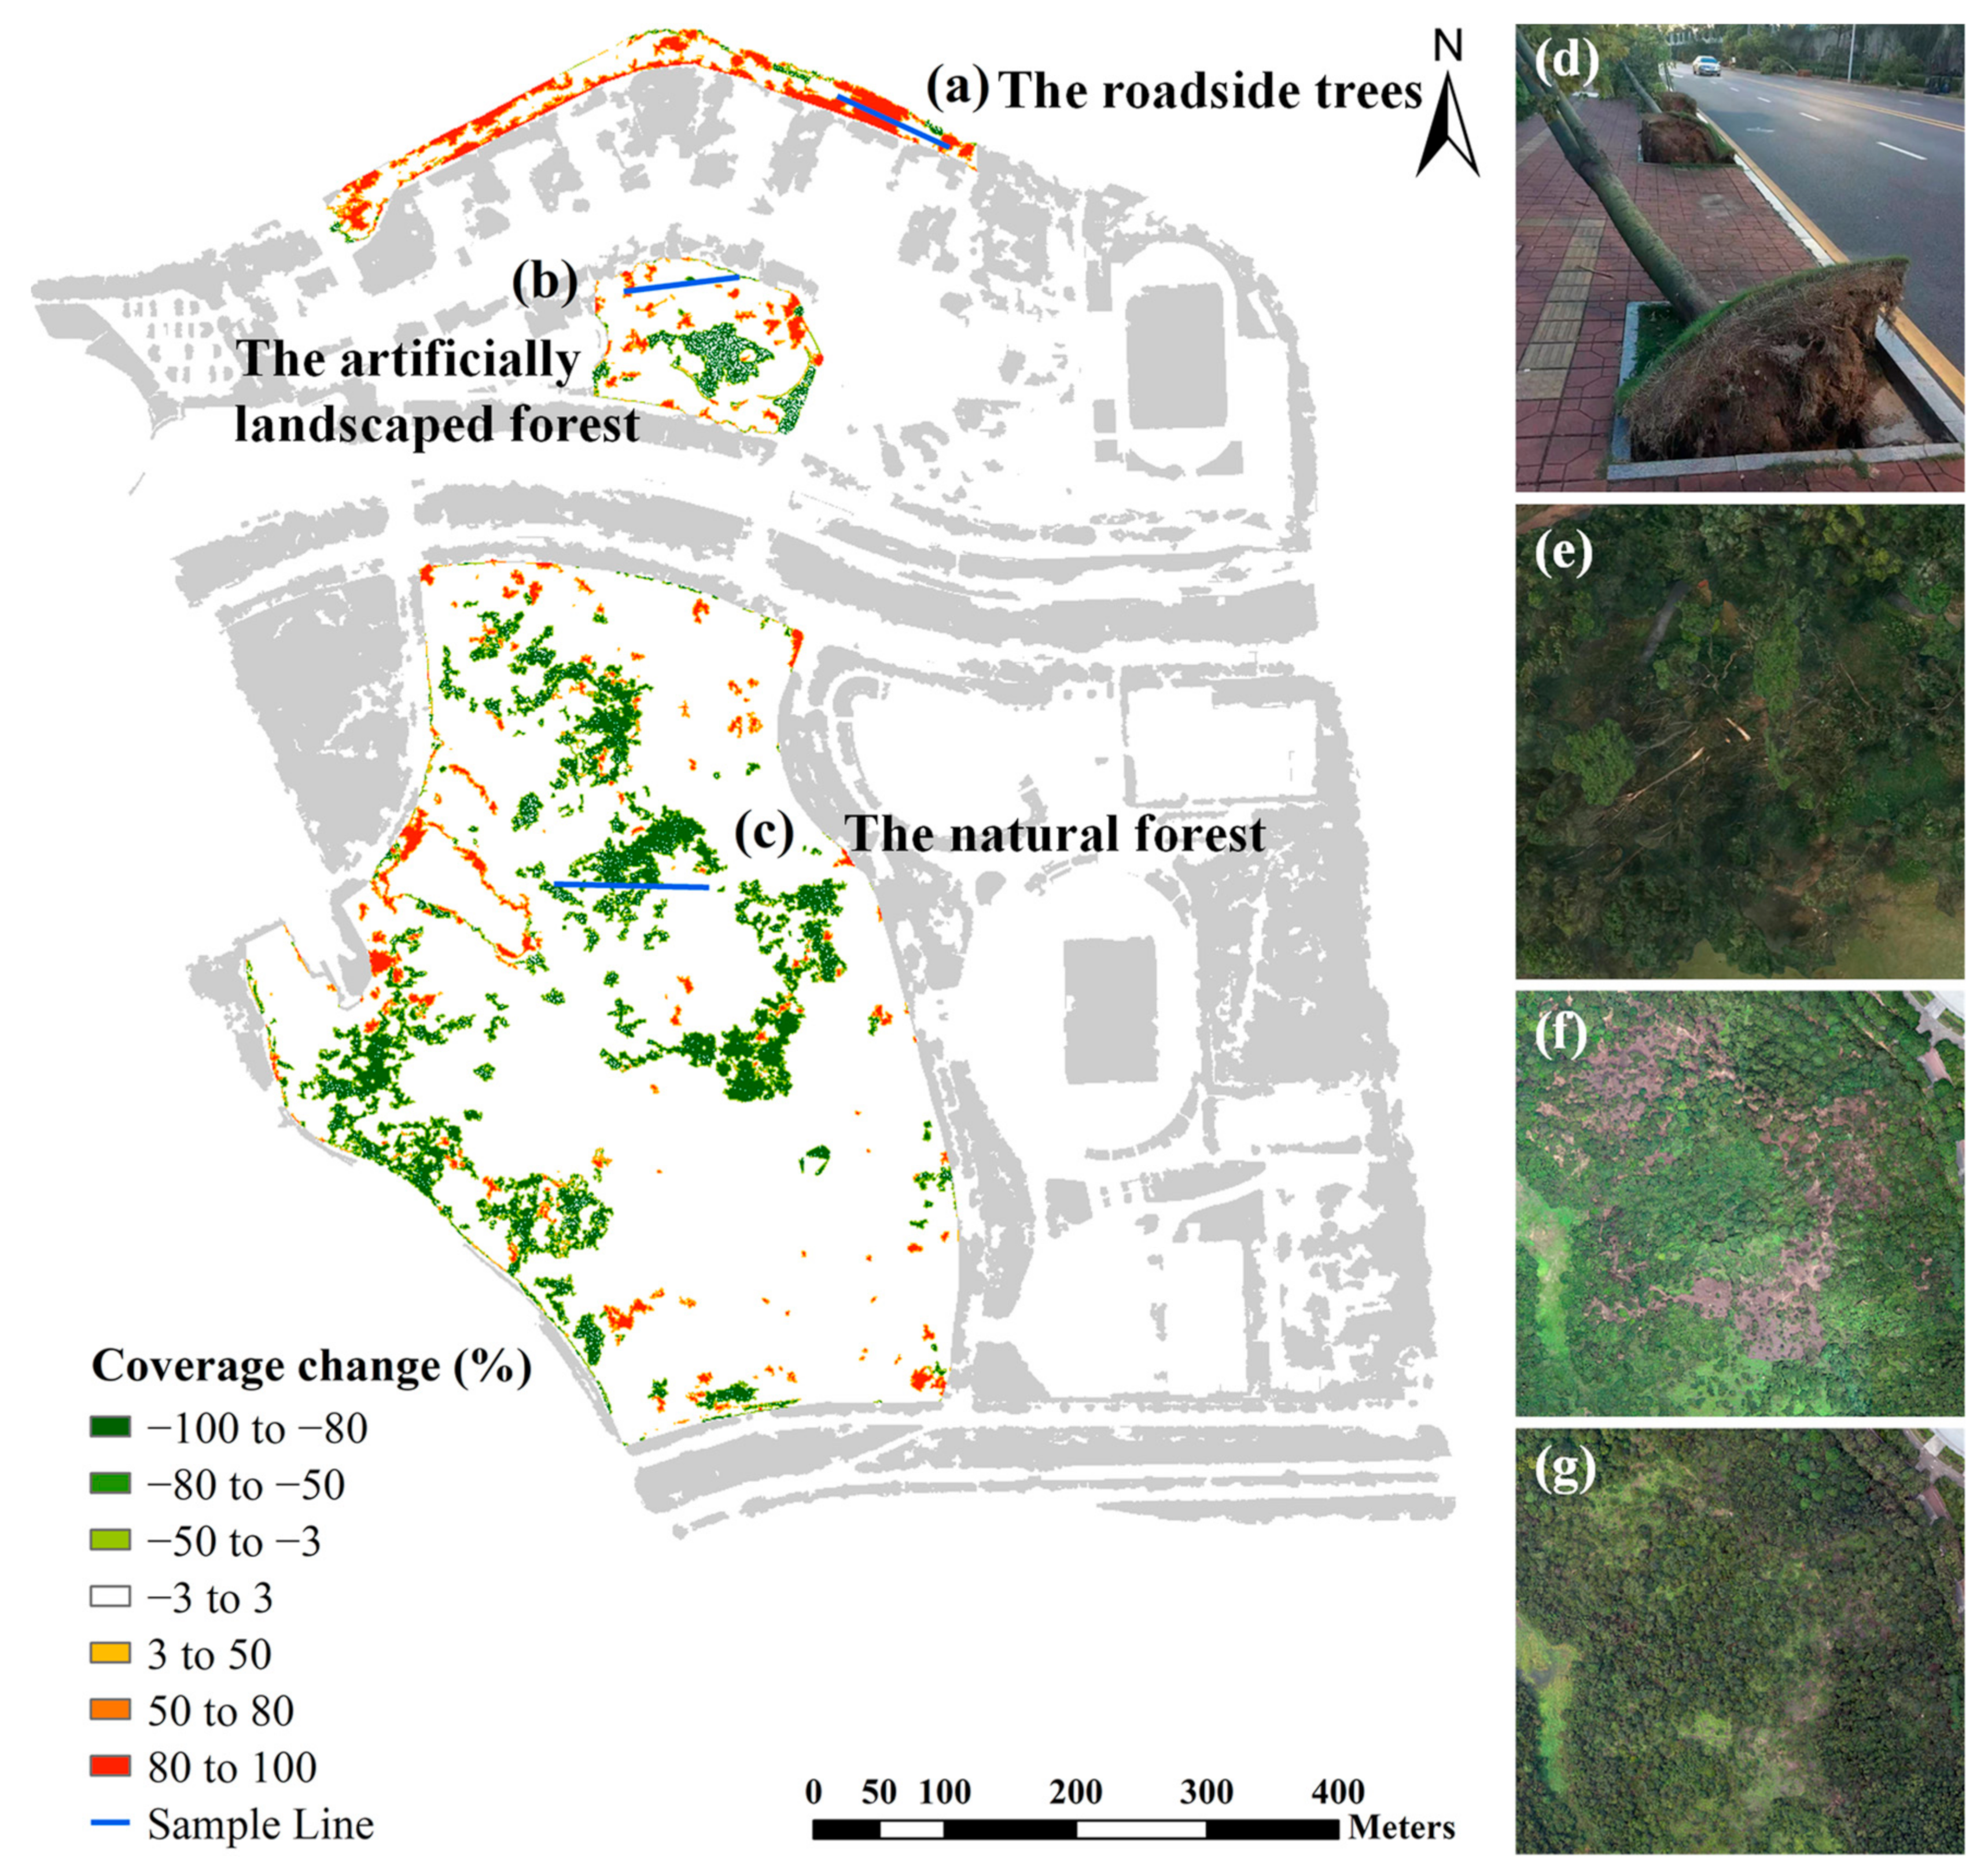
3.2. Estimation of Urban Vegetation Damage Based on Vegetation Coverage Change

In this study, three typical urban vegetation sample plots (i.e., roadside trees, artificially landscaped forests, and natural forests) were selected (Figure 3). The vegetation coverage of roadside trees was severely reduced between 0.8 and 1 (Figure 3a). The main species of roadside trees were Eucalyptus citriodora and Bombax ceiba. They can reach heights of 25–28 m, with a large distance between trees. These species had poor growing conditions on both sides of the road. Most of the underlayment where the roadside trees grew was artificial pavement, which impeded root spreading and growth. As a result, the root systems of roadside trees were often shallow and weak (Figure 3d). Therefore, such trees were easily damaged by super typhoon Mangkhut. Broken and fallen roadside trees adversely impacted urban traffic. To restore transportation access, fallen roadside trees were cleared as a priority. Consequently, there was a serious reduction of coverage for roadside trees after the typhoon.
The second most severe coverage loss occurred in the artificially landscaped forest (Figure 3b). A few areas had coverage loss values of 0.5–1.0, however, most areas had no change in coverage, which are shown as white areas in Figure 3b. The arboreal landscaped forest had experienced severe tree fall (Figure 3e). The post-typhoon data were acquired on the third day after the typhoon. The post-disaster salvage work was carried out mainly on roads and residential areas. As such, at the time of data collection, the clearance of fallen trees in such urban green parks had not yet started. Although most trees had fallen and died, due to their dense growth, the canopies were still continuous at ground level after the trees had fallen. These coverage changes led to the biased conclusion that the artificially landscaped forest, which was damaged by the typhoon, was not severely affected.
The trend in pre- and post-typhoon coverage changes in the natural forest was opposite to both of the two sample plots (e.g., roadside trees and artificially landscaped forests). The post-typhoon coverage of the urban natural forest increased with the range of 0.8–1.0 (Figure 3c). The natural forest had a large area of bare land in May 2018 (Figure 3f). This bare land was covered by herbs and shrubs, leading to an increase in the post-typhoon coverage (Figure 3g). These coverage changes, caused by herb and shrub growth, had no relationship to the typhoon. After excluding the areas exhibiting an increase in vegetation coverage, the vegetation coverage of the natural forest showed no change, indicating that the natural forest was less affected by the typhoon. The natural forest areas with reduced vegetation coverage were sporadically distributed near the roads and were not a significantly large area. The results of vegetation coverage showed that natural forests did not receive significant effects from the typhoon.

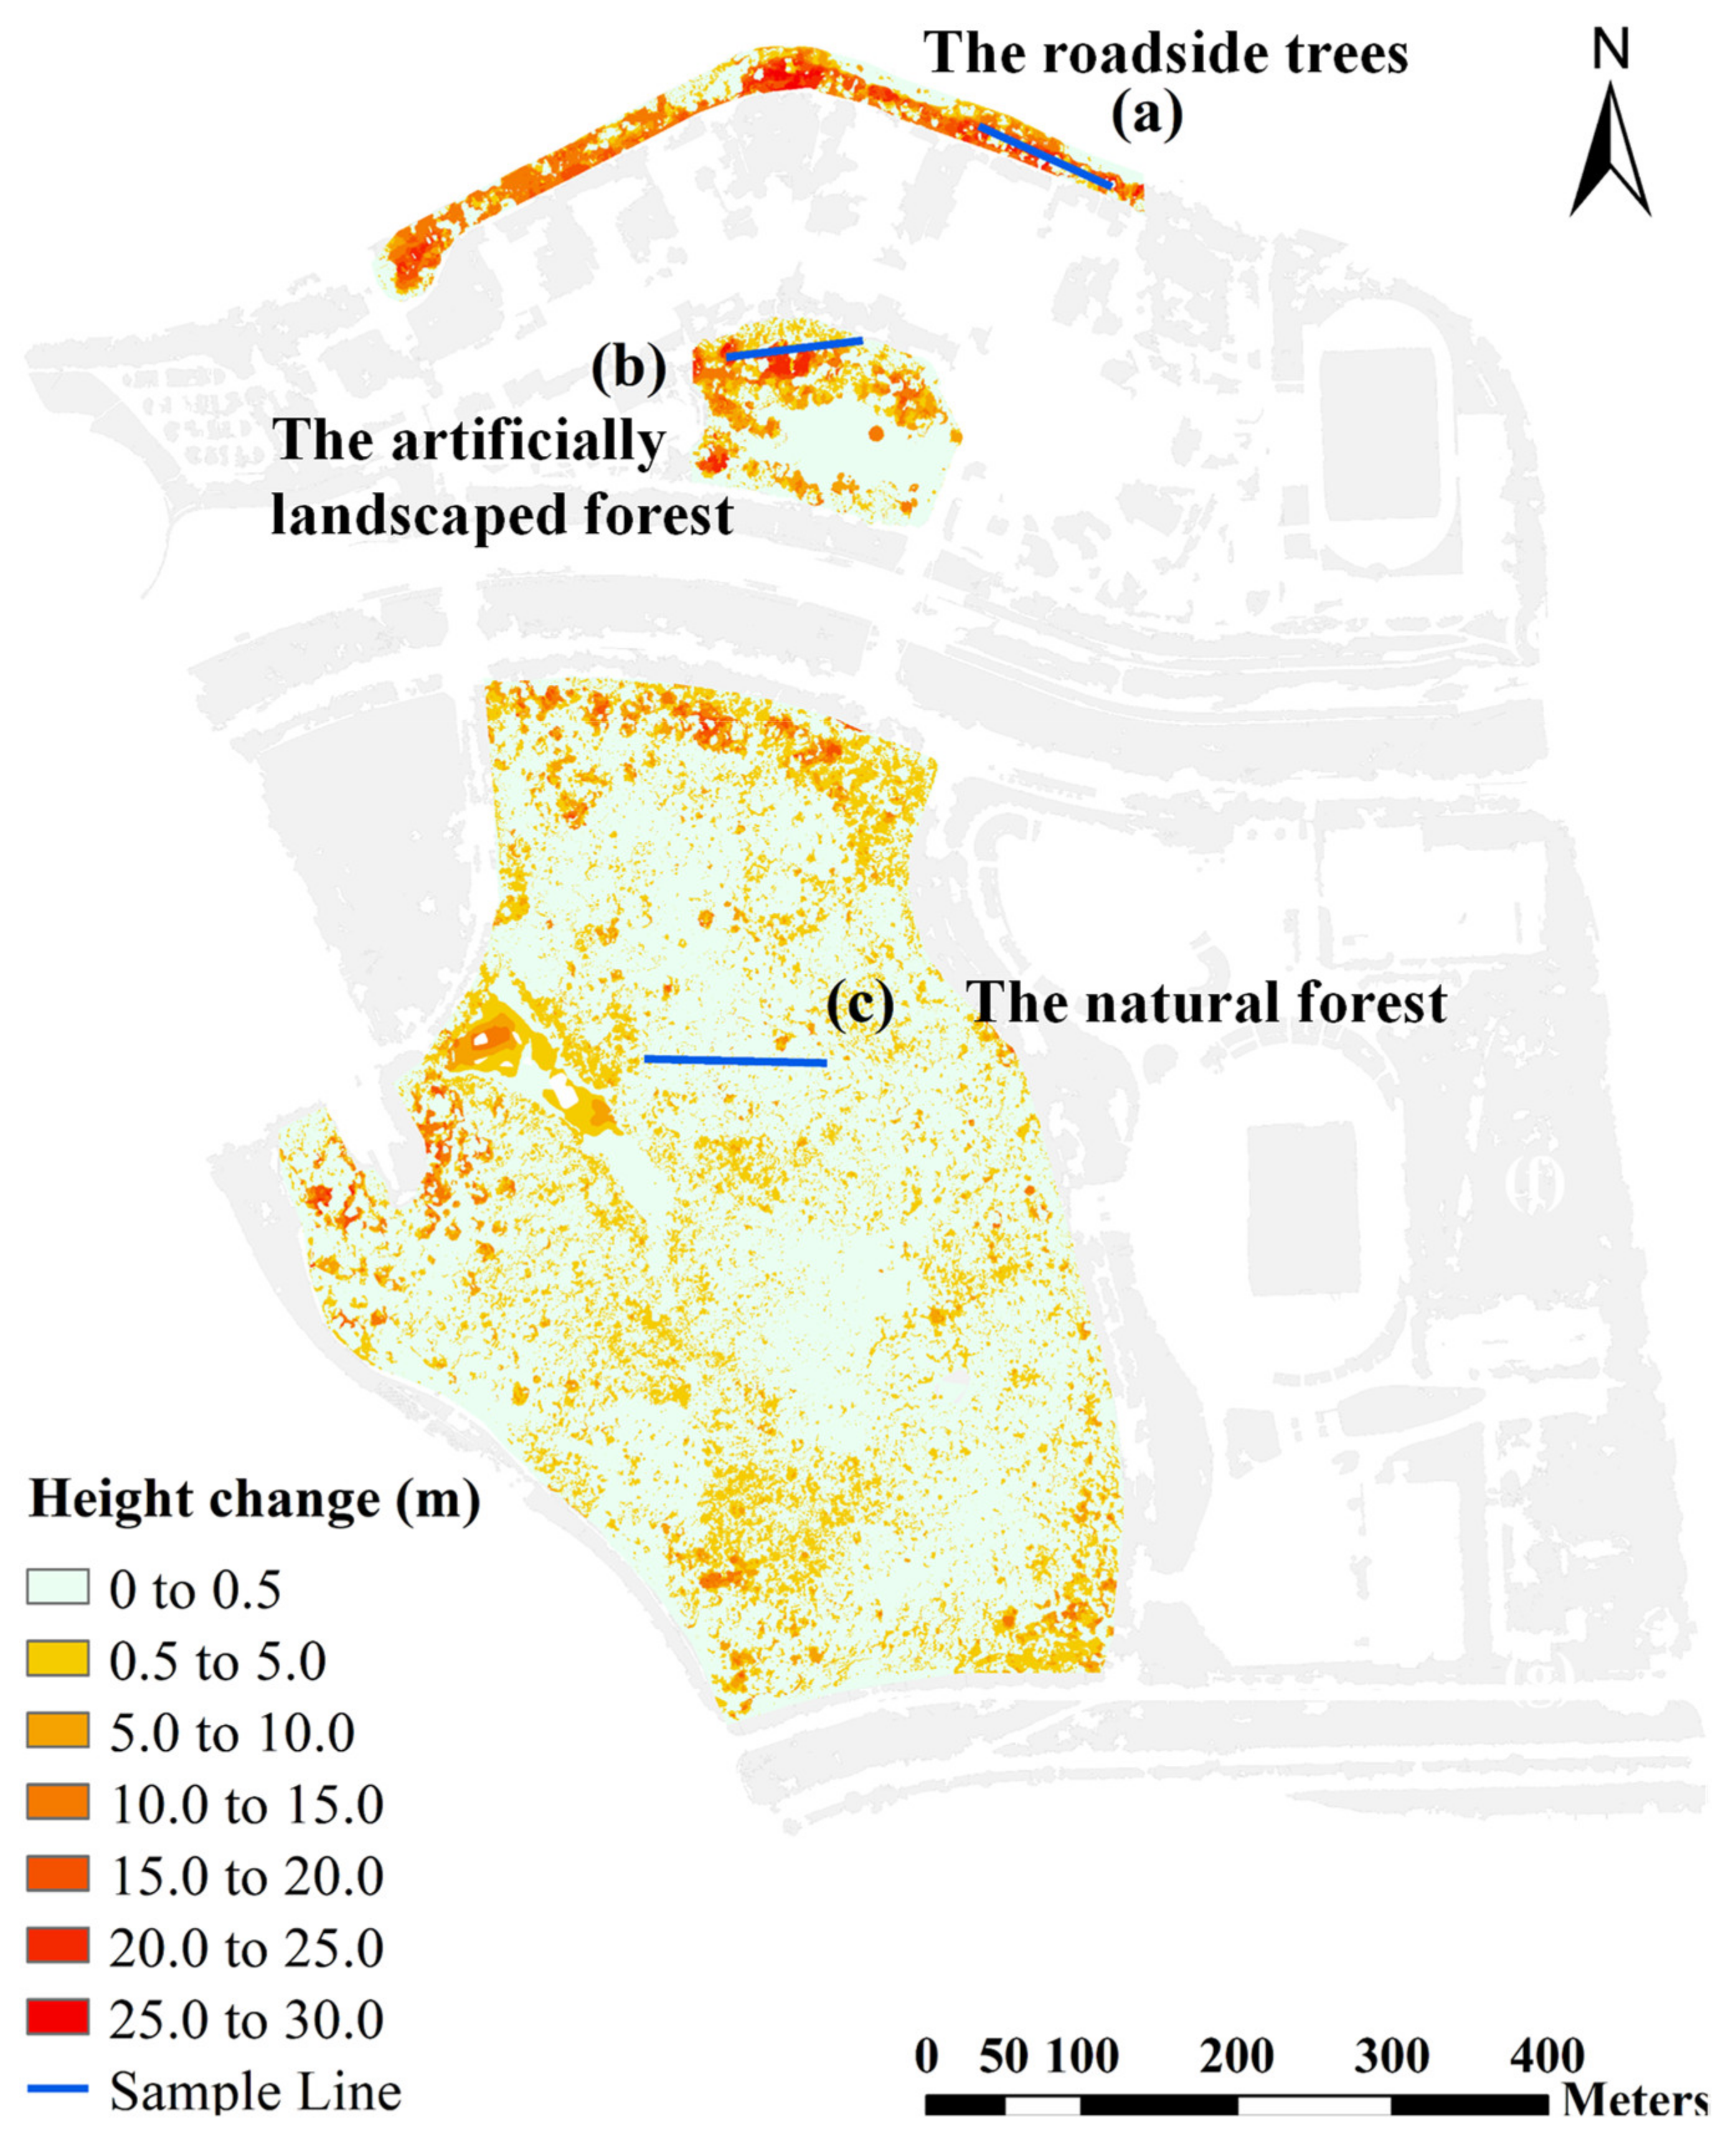
3.3. Estimation of Urban Vegetation Damage Based on Vegetation Height Change

Figure 4 shows the distribution of pre- and post-typhoon changes in vegetation height. The areas in red represent the extent to which tree height was reduced after the typhoon. The reduction of vegetation height was the most severe for roadside trees, which had a drastic reduction of 20–30 m (Figure 4a). The main roadside vegetation species were Eucalyptus citriodora and Bombax ceiba, which reached 25–28 m in height. The damage from the typhoon caused the roadside trees to fall in patches. This result was similar to that obtained using the coverage change indicator to assess the extent of damage caused by typhoons to roadside trees.
The damage to the artificially landscaped forest was also significant (Figure 4b). After the typhoon, the height of the trees in some areas decreased by 20–25 m compared to the pre-typhoon period. In most areas, tree height had decreased by 5–15 m. The reduction in the height of the trees in the artificially landscaped forest after the typhoon was less than that of roadside trees because their average tree height was already lower (e.g., below 15 m). The severity of their fall was the same as that of roadside trees. Compared to vegetation coverage, the change in tree height can more accurately reflect the damage caused to the artificially landscaped forest by the typhoon.
The natural forest areas were less affected by the typhoon. The natural forest showed little change to vegetation height in most of the areas, as indicated by large white areas in Figure 4c. The areas that were severely affected were distributed near the roads, and the canopy height reduction was greater on the windward slopes towards the North and East than on the leeward slopes towards the West and South. This suggests that the typhoon wind direction and topography were the factors influencing vegetation damage. The natural forest is entirely composed of native species, which are more suited to growing in the local area. The vegetation grew vigorously and had stronger wind resistance ability. However, in the areas intersected by roadways, the tree canopies were more exposed to the typhoon due to the empty overhead spaces and therefore experienced a greater amount of damage, with tree height reducing further by 5–15 m.

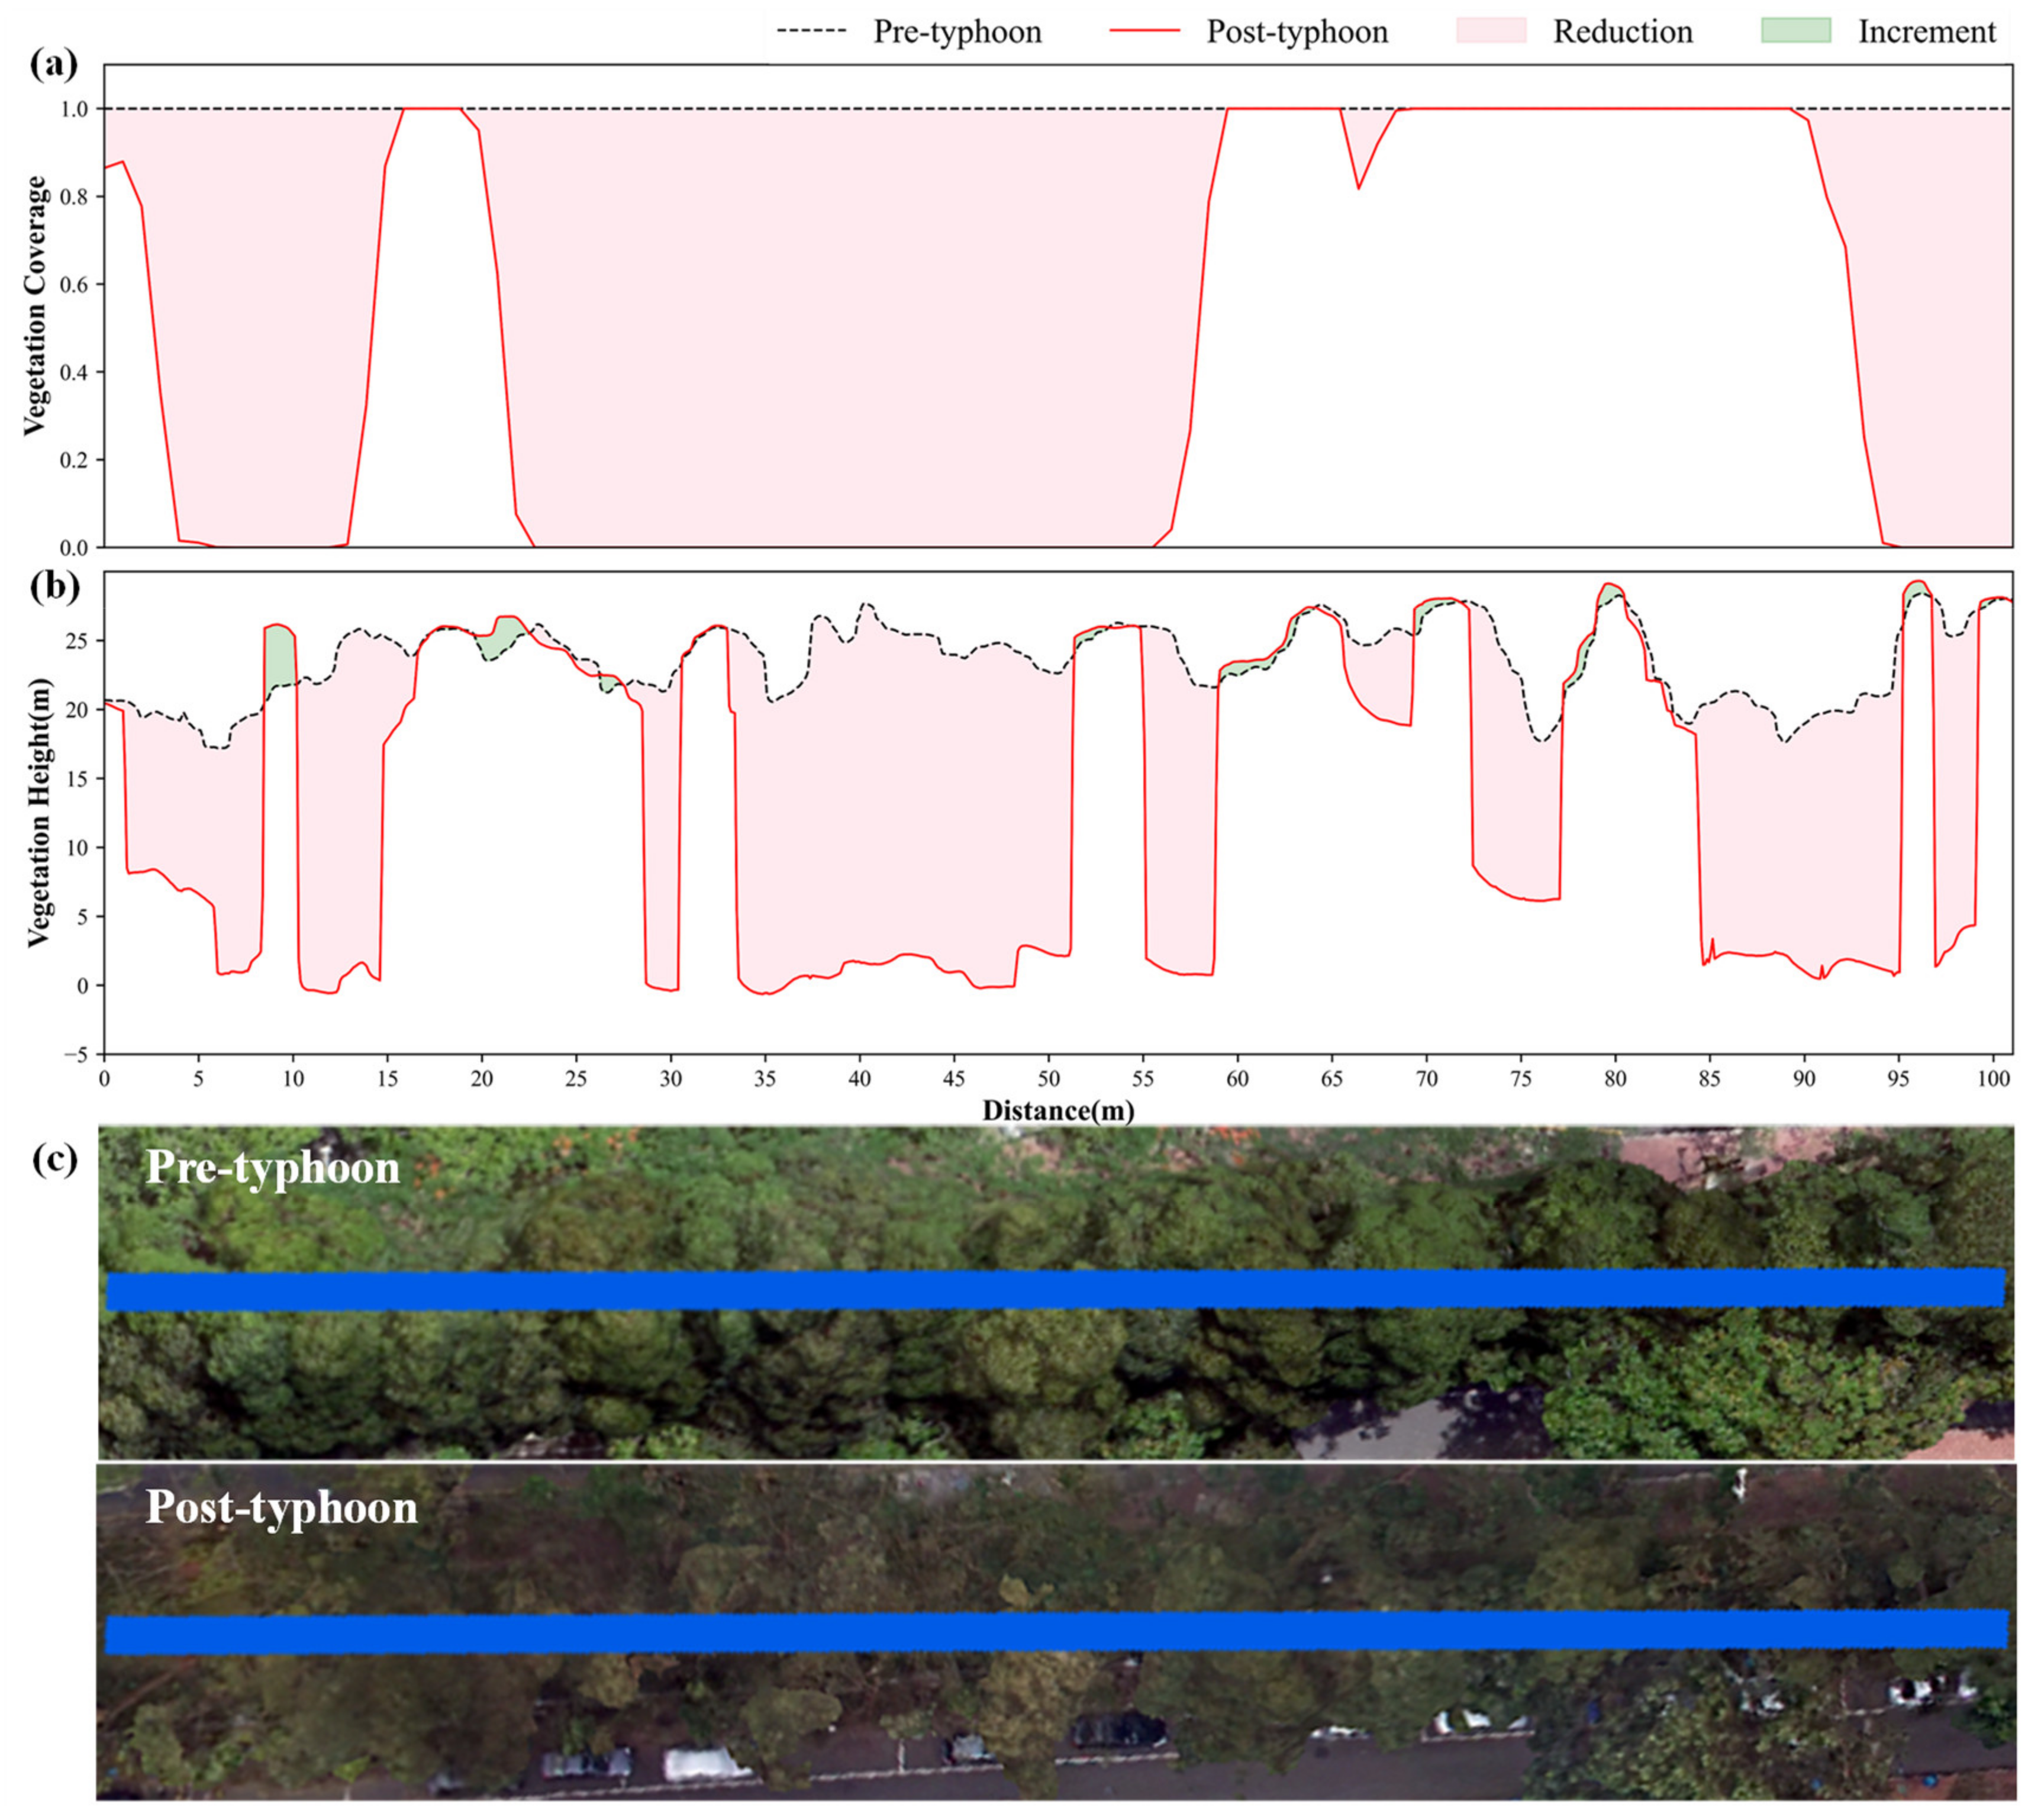
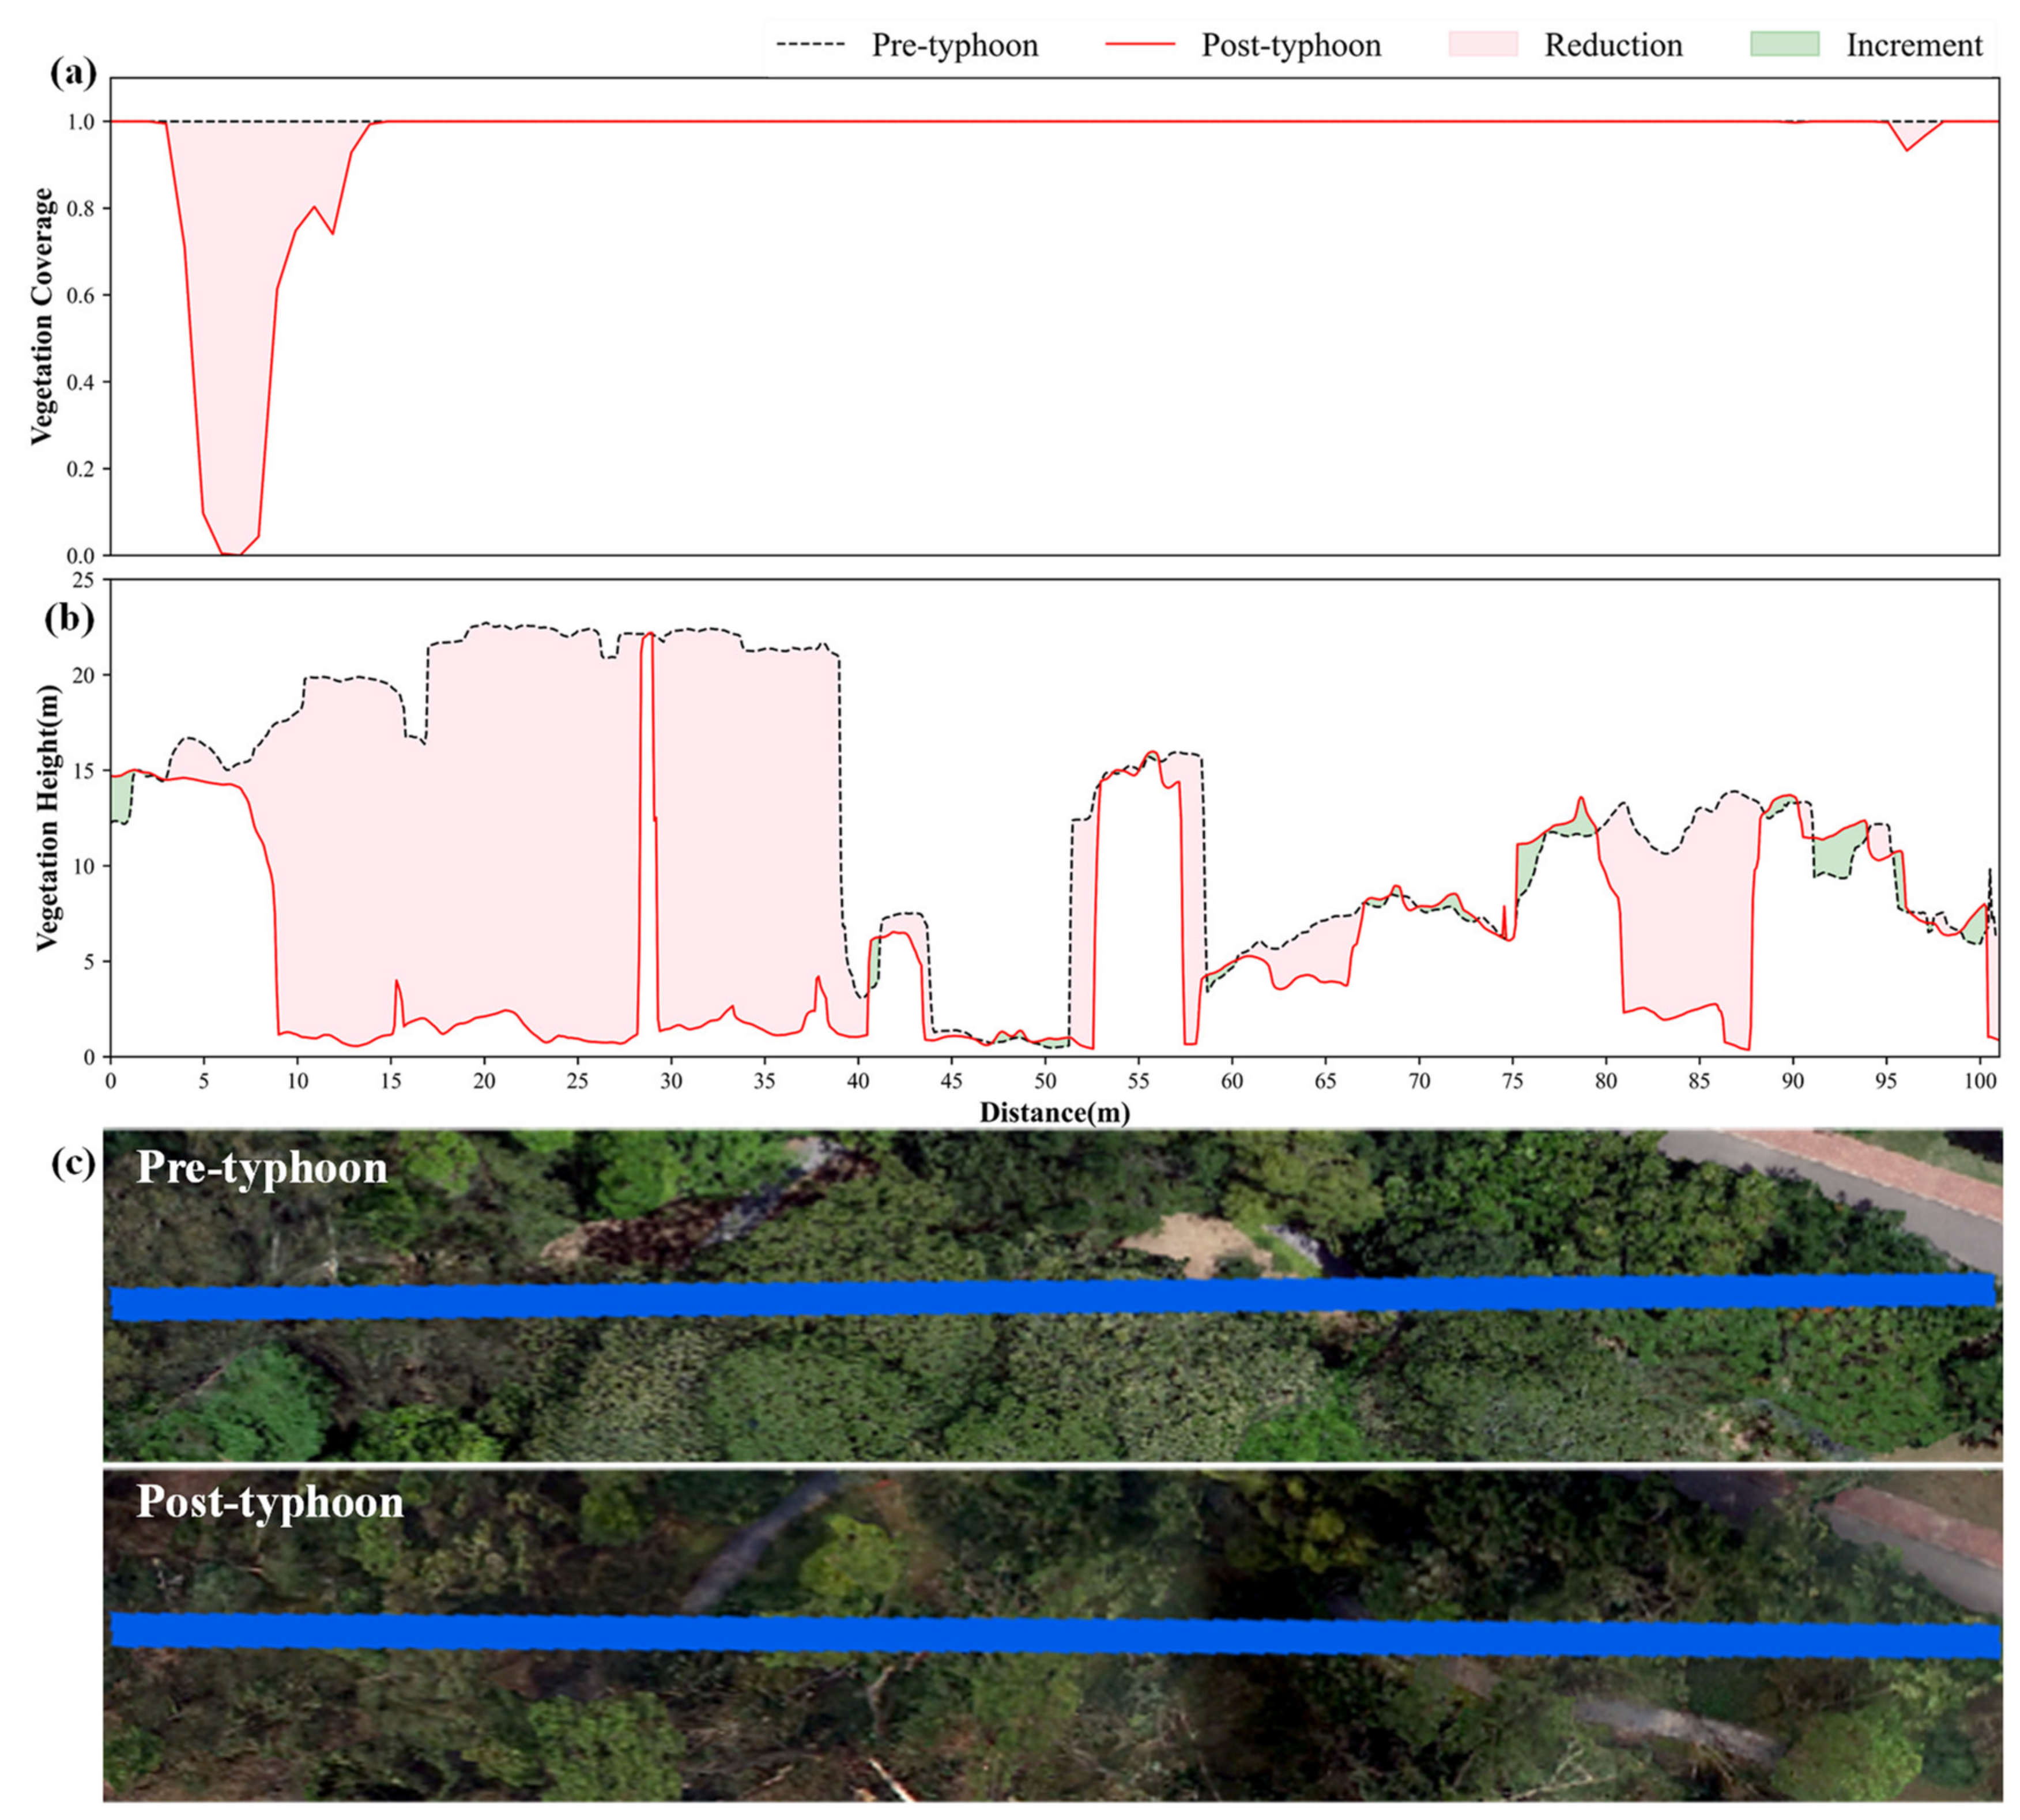
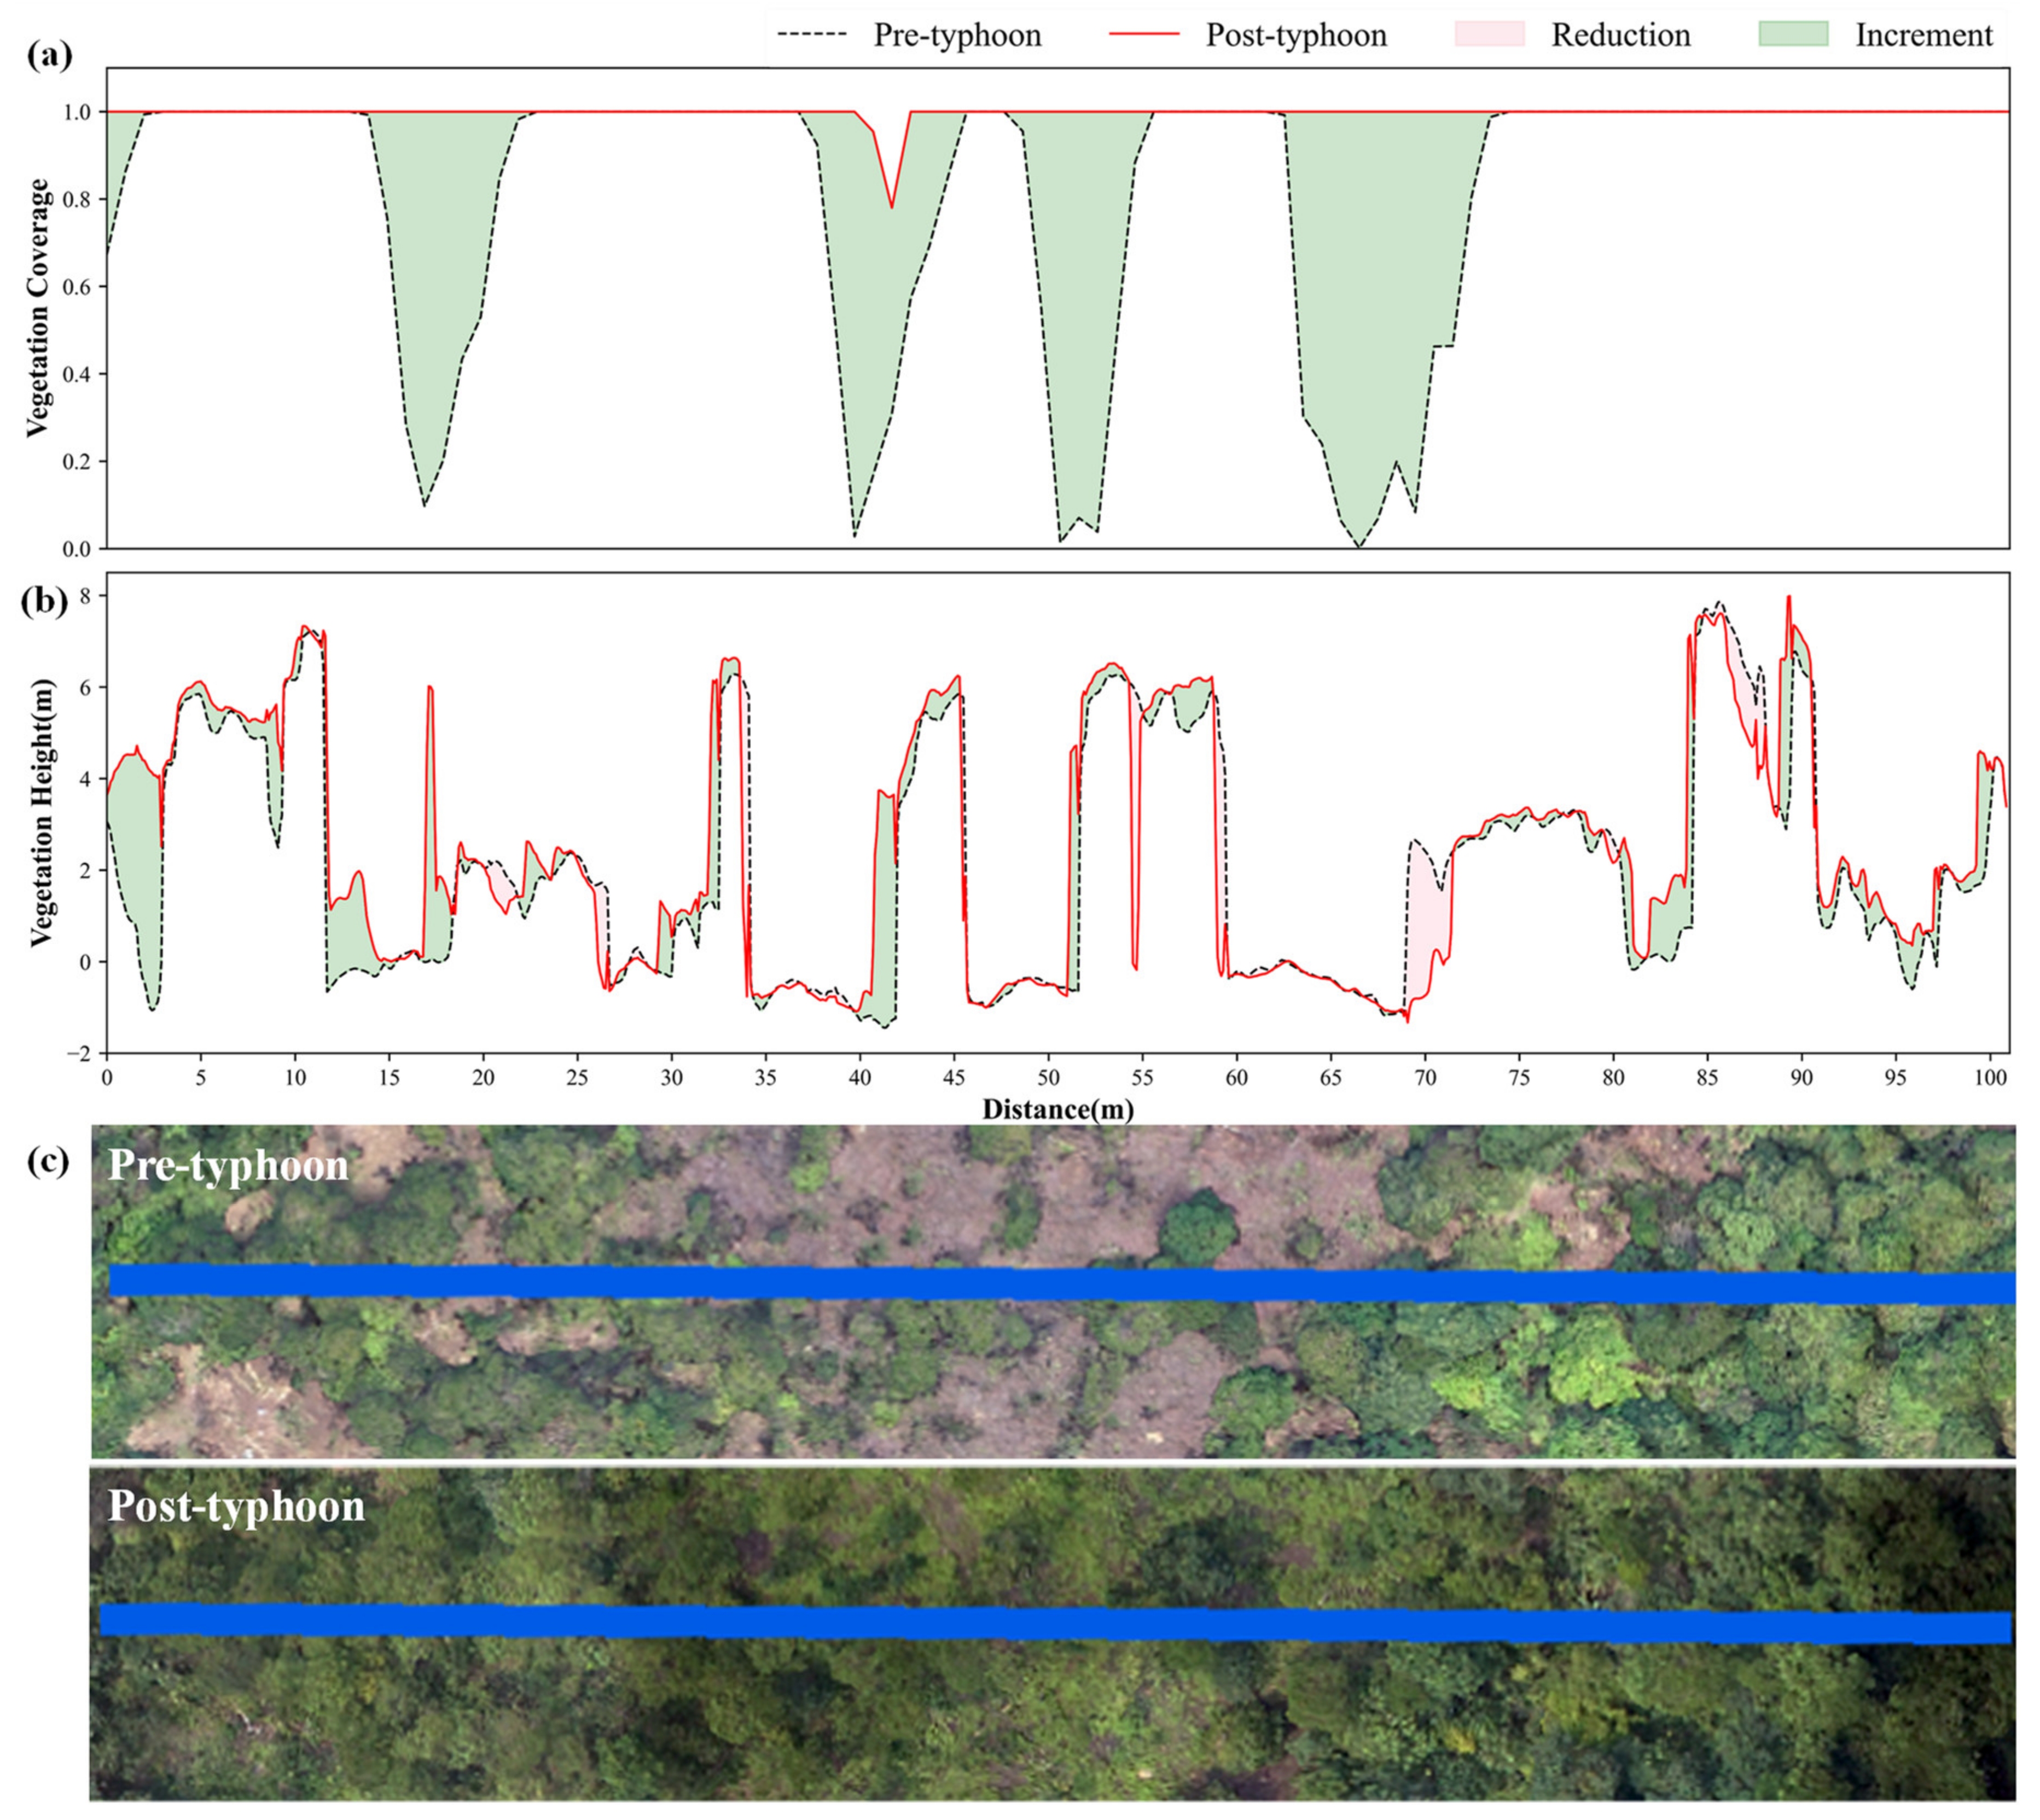
3.4. Line Sampling Damage Assessment for Typical Urban Vegetation

A typical sampling line of 100 m was selected in each site (Figure 3 and Figure 4). The spatial variation patterns of the two indicators (i.e., vegetation coverage and height change) on the sampling line were used to quantitatively estimate the typhoon damage of urban vegetation.
The typhoon caused severe damage to urban roadside trees. The vegetation coverage and height of roadside trees were significantly reduced after the typhoon (Figure 5). However, the two indicators mentioned above showed different patterns. Vegetation coverage showed a greater degree of damage for roadside trees as compared to the damage level estimated by height. This can be attributed to the resilience of the vegetation in the study site, allowing them to flourish better. Even though the spatial resolution was reduced, each pixel was still almost pure vegetation or non-vegetation elements. Hence, the coverage change values were 0 or 1. However, the spatial resolution of height was 10 cm. Therefore, the vegetation height changes can more accurately reflect the details of typhoon-related damages and were consistent with the actual observations on the ground.
The degree of damage to the artificially landscaped forest was similar to that of the roadside trees. However, the vegetation coverage does not accurately reflect the vegetation damage (Figure 6). The vegetation coverage did not demonstrate much change in the sample line. Only the vegetation coverage showed a decrease in the 3–14 m interval. The other intervals of the sample line showed no change in vegetation coverage, which was consistent with the real situation on the ground. This may be because the tree canopy remained laying on the ground after the trees fell and were not cleared in time. There was no change in the pre- and post-typhoon vegetation coverage. Hence, vegetation coverage cannot be used to quantitatively assess the damage caused by the typhoon to the urban landscaped forest.
The vegetation height more accurately reflected the damage of the artificially landscaped forest. The difference in the canopy height before and after the typhoon was significant. In the 8–40 m interval of the sampling line, the canopy height was reduced by 15–24 m (Figure 6b). This indicated the overall collapse and death of the trees. These fallen trees could only be removed and disposed of afterward. At 52 and 57 m of the sampling line, the height of the trees was reduced to about 1 m above the ground. However, the lengths of the intervals were very short, indicating that the height reduction in this area was caused by the partial breakage of the tree canopy. These trees could be maintained by trimming. Consequently, the height changes of the vegetation in the artificial forest better reflected the damage caused by the typhoon.
The natural forest area was less affected by the typhoon, and this result was reflected in both the vegetation coverage and height changes (Figure 3 and Figure 4). The changes in the natural forest coverage were also significantly different from the first two sites. Many areas showed an increase in vegetation coverage and height (Figure 7). The four intervals of the sampling line were 14–20, 37–45, 47–55 and 63–73 m, where the natural forest showed an increase in vegetation coverage (Figure 7a). The reason for this increase is that the pre-typhoon data were collected in May 2018, when the natural forest had large bare ground patches. The post-typhoon data were collected in September 2018, on the third day after the typhoon. At this time, the original bare land patches were full of herbs and shrubs, thus leading to an increase in the vegetation coverage. Vegetation height also increased in many places on the sample line. In the 4–8, 22–25, 30–33 m and other areas, the height increased within 0.5 m due to the growth of vegetation. In the 0–4, 40–42 m and other areas, the height increased by 2 m due to changes in the position of some canopy areas caused by the typhoon. In summary, the changes in both vegetation coverage and height revealed that vegetation in the natural forest was less affected by the typhoon. The vegetation coverage reflected the change of surface type of the natural forest, indicating that vegetation grew in formerly bare soil areas. Tree height showed the changes to the vertical structures of vegetation in natural forests (i.e., tree growth and canopy displacement).

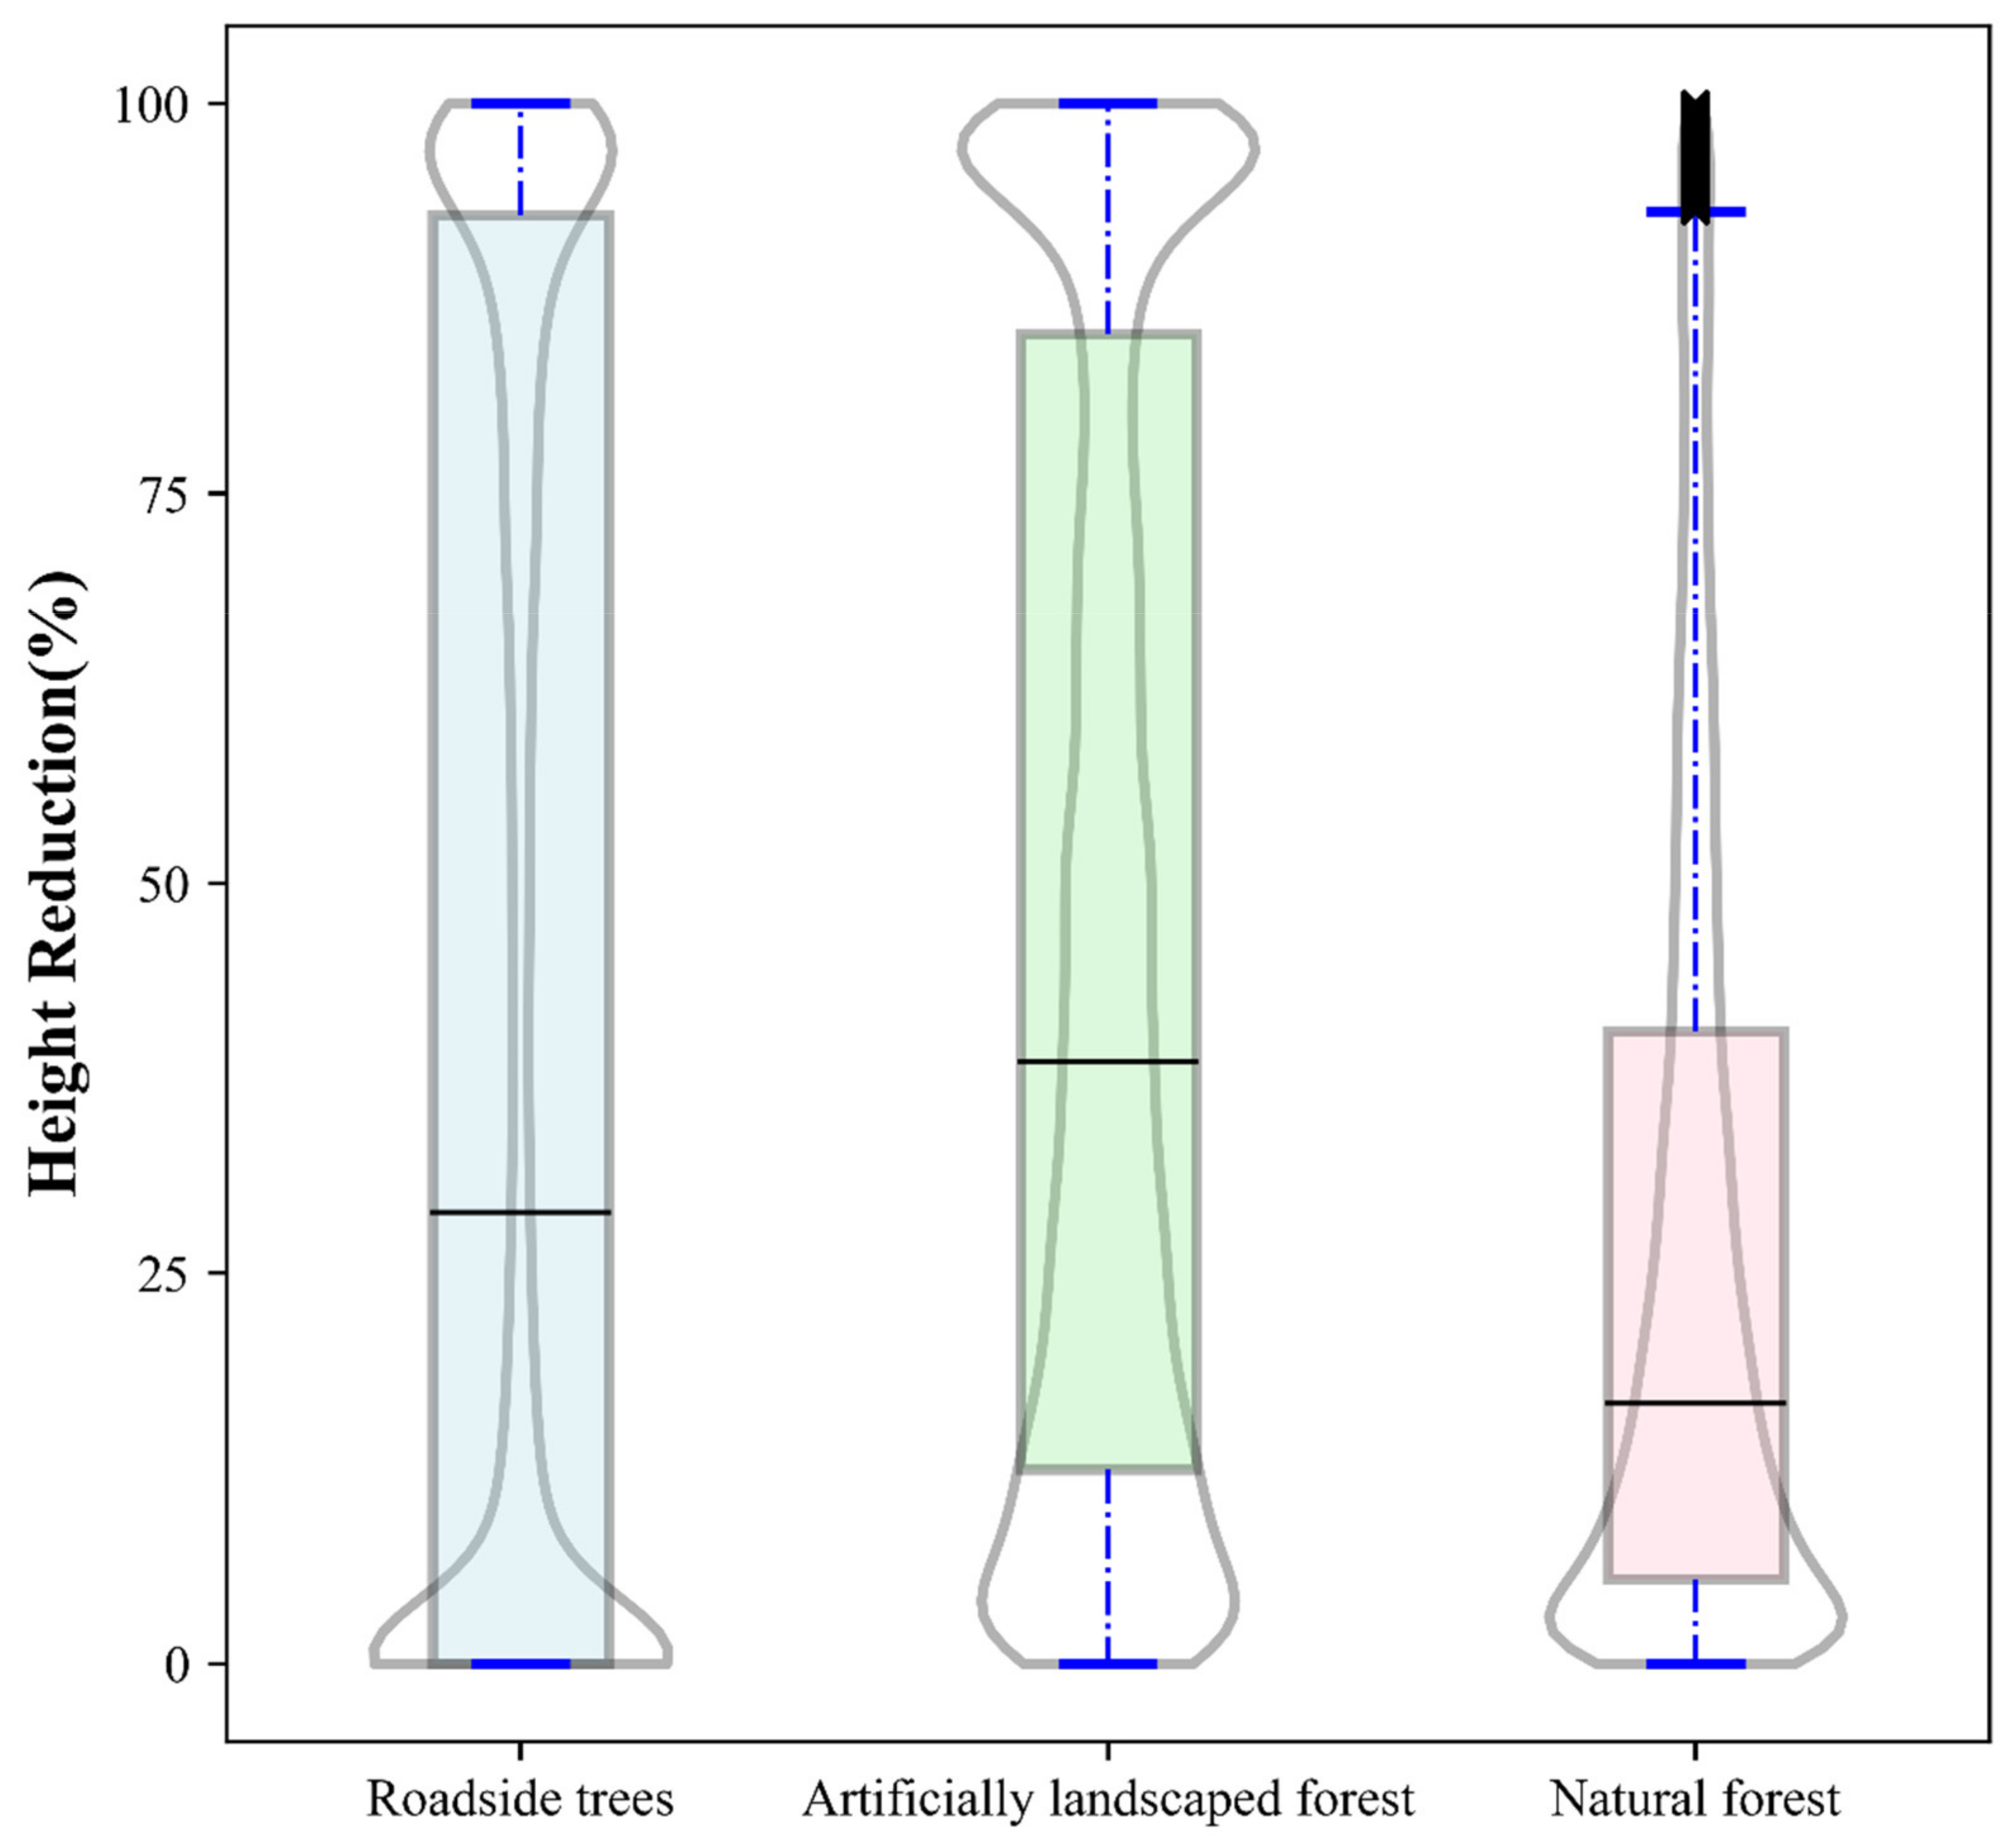
3.5. Quantitative Statistics of Vegetation Damage Level

To compare the changes in roadside trees, artificially landscaped forests, and natural forests, we randomly selected the same number of samples from the three sites. A total of 700,000 samples were extracted from each site. The statistical results of the height reduction rates are shown in Figure 8.
The height reduction rate of the natural forest was concentrated around 20%, indicating that the natural forest was less affected by the typhoon and the vegetation was not significantly damaged. The artificially landscaped forest was severely affected, with tree height reduction rates concentrated between 20–80%. The roadside trees were the most severely affected, with tree height reduction rates up to 100%. The height reduction rate of the roadside trees was significantly higher because the fallen vegetation was moved away to allow vehicle traffic to resume.
Above all, the results indicated that native species in urban areas—which were not subjected to frequent human disturbance—were the most resistant to the typhoon. The introduced species in the artificially landscaped forest were very vulnerable to typhoon damage, and the higher the height of trees, the more severely they were affected by the typhoon.

4. Discussion

4.1. The Advantages of the Method

Current vegetation damage surveys comprise mainly traditional ground surveys and regional surveys based on satellite remote sensing technology [28,35]. However, the high spatial heterogeneity of urban underlying surfaces makes it difficult to carry out rapid and accurate vegetation damage assessments [9,35,36]. Hence, a typhoon damage assessment technique that is not labor-intensive, has a high spatial resolution, and is flexible and inexpensive, is an urgently needed solution for urban managers [36,37].
UAVs can rapidly acquire data after a disaster and can avoid cloud effects [17]. This study proposes a vegetation damage assessment method based on UAV oblique photography and a change detection method. Data acquisition is easy and low-cost [38]. For example, one DJI Phantom 4 Pro drone and 10 batteries cost about $3142. Operators can become proficient in using it with just three days of training. Ground control points, recorded by ground RTK and extracted from the pre-typhoon 3D model, were used to achieve more accurate geo-alignment between pre- and post-typhoon digital products. The DOM and DSM products obtained after data processing can accurately assess vegetation damage by simple steps, such as classifying features and extracting vegetation structural indicators before and after typhoons [27]. This study validated the capability of UAV technology in the assessment of typhoon-related damage of urban vegetation. The median errors of the products were 0.04–0.37 cm, except for the pre-typhoon horizontal error in the x-axis direction (viz. 1.11 cm). Even for the pre- and post-typhoon observations with different sensors, the results can be well matched and compared by resampling to a slightly coarser resolution, or by including a good plan with suitable flight parameters for the second survey. It would have been easier and more convenient with the same sensor. This method is well suited for urban managers as it allows them to quickly conduct vegetation damage assessments at the street level and provide scientific guidance suggestions for disaster relief actions.

4.2. Indicators for Estimating Typhoon-Related Damage

The vegetation coverage can reflect the horizontal structure. The prerequisite for obtaining an accurate vegetation coverage distribution map is to obtain precise vegetation classification results [18]. In this study, the vegetation areas were accurately identified using DOM with a spatial resolution of 10 cm. However, the results from using changes to vegetation coverage to assess vegetation damage were still inaccurate. The reasons for this are that: (1) fallen trees were easily regarded as normal trees if they were not cleared away in time, leading to underestimation of the vegetation damage caused by the typhoon; and (2) vegetation growth on bare ground, especially herbaceous growth, could lead to the erroneous conclusion that vegetation coverage increased after the typhoon. One study that used Sentinel-2 to obtain pre- and post-hurricane vegetation basal area maps to spatially quantify forest loss, found the same results when assessing vegetation with moderate levels of damage [18].
However, changes in vegetation height before and after the typhoon can provide a good reflection of the level of the vegetation damage. The results of vegetation height change distributions can be obtained very easily using pre- and post-typhoon DSMs [31]. The vegetation height reduction rate can also be calculated and reveal whether the trees had fallen as a whole or if only a part of the canopy was damaged by the change interval. In addition, vegetation canopy height data, combined with allometric growth equations, can be further used to assess biomass and carbon stock changes [39,40], which are important for studying the impact of extreme climate on carbon cycling in urban systems.
However, because of differences in sensors and shooting patterns, the data obtained before and after typhoons can still produce spatial matching errors despite the corrections that have been made using control points. Spatial matching errors may affect the quality of the model and influence the accuracy of change detection, which can affect the tree height change results [31,41]. Therefore, data collection for all flights, utilizing the same equipment and flight parameters, will streamline the data pre-processing efforts.

4.3. Factors Affecting the Extent of Urban Vegetation Damage by Typhoon

A typhoon’s wind speed, wind direction, and other meteorological factors are highly correlated with the extent of the vegetation damage [42]. Catastrophic damage to vegetation is generally caused by unusually high wind speeds [43]. Buildings, forest edges, topography, and other open areas can affect wind speeds [42], and thus, influence the extent of typhoon damage to urban vegetation.
The height and layout of urban buildings can affect wind speed and change the wind direction, which in turn can affect the extent of urban vegetation damage [44]. The vegetation species of the roadside trees and in urban green parks in this study were mainly introduced arbors with poor anti-wind abilities. There were fewer buildings on both sides of the roadside trees. However, there were more buildings on the windward side of the artificially landscaped forest, which effectively reduced the intensity of the typhoon. This study observed lighter damage to the trees in the artificially landscaped forest compared to the roadside trees.
The vegetation at the edge of the forest was more severely affected than the vegetation within the forest [9]. The urban natural forest in this study area was less affected by the typhoon. The areas with reduced vegetation height were distributed in the perimeter of the natural forest.
Topography usually influences the extent of vegetation damage by typhoons through elevation and slope orientation [45]. The elevation difference in this study area was small, about 46 m. The elevation is not an influential factor in the extent of vegetation damage by typhoons when there is little variation in terrain height [46]. Topography can also determine the extent of vegetation damage depending on whether vegetation grows on the windward slope [21]. In the urban natural forest area selected in this study, the area where the windward slope intersected the urban road had a greater reduction in vegetation height than the north wind slope because the wind speed on the leeward slope was less than the windward slope [47].
The arbors in roadside trees and the landscaped forest were mostly introduced species that are intended to increase the species diversity and aesthetics of the city [48,49,50]. However, these introduced species, with characteristics of large canopies and shallow, underdeveloped root systems, are more vulnerable to typhoons. The natural forest was less damaged because most of the trees are native species with well-developed root systems, significantly shorter tree heights, and smaller canopies, consequently making them more resistant to typhoons.

4.4. Future Study

Research on UAV remote sensing is a relatively new field, hence its use in rapid assessment of typhoon damage to urban vegetation has room for significant improvement. Firstly, multispectral [25,51] or hyperspectral techniques [52] could resolve the difficulty of identifying fallen trees. Secondly, changes to canopy height may be better detected with LiDAR techniques [53]. Finally, some other issues that can be evaluated include studying the impact of UAV flight parameters on the quality of 3D modeling [54] and measuring of the vegetation growth between and during the two observation periods.

5. Conclusions

Contemporary urban planning has necessitated the development of a fast and simplified method for estimating typhoon-related windthrow with horizontal and vertical heterogeneity. This study verified the feasibility of a low-cost and easily implemented UAV oblique photography technique and a change detection method to assess typhoon-related damage to urban vegetation at the street level. The street trees and the artificially landscaped forests, both of which dominated the amount of introduced species, were severely affected. The heights of both were reduced by 20–30 m and 5–15 m, respectively. On the other hand, the natural urban forests, predominantly composed of native species, were less affected by the typhoon. Hence, we suggest that city managers try to use native species in urban planning. When assessing typhoon-related damage using centimeter-scale or decimeter-scale vegetation 3D structure data, the vegetation height (representing the vertical structures of the vegetation) was found to accurately reveal the damage to urban vegetation. Using vegetation coverage (representing the horizontal structures of the vegetation) as a parameter leads to the severe underestimation of typhoon-related damage to vegetation, as its coverage also includes fallen vegetation. However, fallen vegetation from broken and collapsed trees are often not cleared in a timely manner. Thus, the real damage to vegetation caused by the typhoon is better reflected by the change in vegetation height. This study validates the use of UAV remote sensing for accurately measuring and assessing damage caused by typhoons. Considering the noticeably superior advantages of employing UAV technology in vegetation damage assessments, we recommend a wider application of UAVs in urban vegetation surveys in the future.

Author Contributions

Conceptualization, G.-Y.Q.; Funding acquisition, C.Y. and G.-Y.Q.; Investigation, L.Q.; Methodology, P.M. and G.-Y.Q.; Project administration, L.Q.; Visualization, Z.X. and Y.H.; Writing—original draft, L.Q. and P.M.; Writing—review & editing, C.Y., M.H. and G.-Y.Q. All authors have read and agreed to the published version of the manuscript.

Funding

This study was funded by the Shenzhen Science and Technology Project (JCYJ20180504165440088 and GXWD20201231165807007-20200827105738001) and the National Natural Science Foundation of China (42001022).

Data Availability Statement

Correspondence and requests for materials should be addressed to G.-Y.Q. (qiugy@pkusz.edu.cn).

Acknowledgments

The authors are grateful to the Shenzhen Science and Technology Project and the National Natural Science Foundation of China for providing financial support for this study. The authors would also like to thank Zhiyuan Niu and Junxiang Tan for their assistance in the field experiment, as well as Trimble Inc. for providing a free trial of eCognition on their website.

Conflicts of Interest

The authors declare that they have no known competing financial interests or personal relationships that may influence the work reported in this paper.

References

  1. Blackwell, C. Power law or lognormal? Distribution of normalized hurricane damages in the United States, 1900–2005. Nat. Hazards Rev. 2015, 16, 04014024. [Google Scholar] [CrossRef]
  2. Gallina, V.; Torresan, S.; Critto, A.; Sperotto, A.; Glade, T.; Marcomini, A. A review of multi-risk methodologies for natural hazards: Consequences and challenges for a climate change impact assessment. J. Environ. Manag. 2016, 168, 123–132. [Google Scholar] [CrossRef] [PubMed]
  3. Ibanez, T.; Keppel, G.; Menkes, C.; Gillespie, T.W.; Lengaigne, M.; Mangeas, M.; Rivas-Torres, G.; Birnbaum, P. Globally consistent impact of tropical cyclones on the structure of tropical and subtropical forests. J. Ecol. 2019, 107, 279–292. [Google Scholar] [CrossRef]
  4. Elsner, J.B.; Kossin, J.P.; Jagger, T.H. The increasing intensity of the strongest tropical cyclones. Nature 2008, 455, 92–95. [Google Scholar] [CrossRef] [PubMed]
  5. Peduzzi, P.; Chatenoux, B.; Dao, H.; De Bono, A.; Herold, C.; Kossin, J.; Mouton, F.; Nordbeck, O. Global trends in tropical cyclone risk. Nat. Clim. Chang. 2012, 2, 289–294. [Google Scholar] [CrossRef]
  6. Choy, C.-W.; Wu, M.-C.; Lee, T.-C. Assessment of the damages and direct economic loss in Hong Kong due to Super Typhoon Mangkhut in 2018. Trop. Cyclone Res. Rev. 2020, 9, 193–205. [Google Scholar] [CrossRef]
  7. Lin, T.-C.; Hamburg, S.P.; Lin, K.-C.; Wang, L.-J.; Chang, C.-T.; Hsia, Y.-J.; Vadeboncoeur, M.A.; McMullen, C.M.M.; Liu, C.-P. Typhoon disturbance and forest dynamics: Lessons from a northwest Pacific subtropical forest. Ecosystems 2011, 14, 127–143. [Google Scholar] [CrossRef]
  8. Boutet, J.C.; Weishampel, J.F. Spatial pattern analysis of pre-and post-hurricane forest canopy structure in North Carolina, USA. Landsc. Ecol. 2003, 18, 553–559. [Google Scholar] [CrossRef]
  9. Xu, S.; Zhu, X.; Helmer, E.H.; Tan, X.; Tian, J.; Chen, X. The damage of urban vegetation from super typhoon is associated with landscape factors: Evidence from Sentinel-2 imagery. Int. J. Appl. Earth Obs. Geoinf. 2021, 104, 102536. [Google Scholar] [CrossRef]
  10. Hutley, L.B.; Evans, B.J.; Beringer, J.; Cook, G.D.; Maier, S.W.; Razon, E. Impacts of an extreme cyclone event on landscape-scale savanna fire, productivity and greenhouse gas emissions. Environ. Res. Lett. 2013, 8, 045023. [Google Scholar] [CrossRef]
  11. Dale, V.H.; Joyce, L.A.; McNulty, S.; Neilson, R.P.; Ayres, M.P.; Flannigan, M.D.; Hanson, P.J.; Irland, L.C.; Lugo, A.E.; Peterson, C.J. Climate change and forest disturbances: Climate change can affect forests by altering the frequency, intensity, duration, and timing of fire, drought, introduced species, insect and pathogen outbreaks, hurricanes, windstorms, ice storms, or landslides. BioScience 2001, 51, 723–734. [Google Scholar] [CrossRef] [Green Version]
  12. Cadenasso, M.L.; Pickett, S.T.A.; Schwarz, K. Spatial heterogeneity in urban ecosystems: Reconceptualizing land cover and a framework for classification. Front. Ecol. Environ. 2007, 5, 80–88. [Google Scholar] [CrossRef]
  13. Hogan, J.A.; Zimmerman, J.K.; Thompson, J.; Uriarte, M.; Swenson, N.G.; Condit, R.; Hubbell, S.; Johnson, D.J.; Sun, I.F.; Chang-Yang, C.-H. The frequency of cyclonic wind storms shapes tropical forest dynamism and functional trait dispersion. Forests 2018, 9, 404. [Google Scholar] [CrossRef] [Green Version]
  14. Paz, H.; Vega-Ramos, F.; Arreola-Villa, F. Understanding hurricane resistance and resilience in tropical dry forest trees: A functional traits approach. For. Ecol. Manag. 2018, 426, 115–122. [Google Scholar] [CrossRef]
  15. Piermattei, A.; von Arx, G.; Avanzi, C.; Fonti, P.; Gärtner, H.; Piotti, A.; Urbinati, C.; Vendramin, G.G.; Büntgen, U.; Crivellaro, A. Functional relationships of wood anatomical traits in Norway Spruce. Front. Plant Sci. 2020, 11, 683. [Google Scholar] [CrossRef] [PubMed]
  16. Hernandez, J.O.; Maldia, L.S.J.; Park, B.B. Research Trends and Methodological Approaches of the Impacts of Windstorms on Forests in Tropical, Subtropical, and Temperate Zones: Where Are We Now and How Should Research Move Forward? Plants 2020, 9, 1709. [Google Scholar] [CrossRef]
  17. Hoque, M.A.-A.; Phinn, S.; Roelfsema, C.; Childs, I. Tropical cyclone disaster management using remote sensing and spatial analysis: A review. Int. J. Disaster Risk Reduct. 2017, 22, 345–354. [Google Scholar] [CrossRef] [Green Version]
  18. St. Peter, J.; Anderson, C.; Drake, J.; Medley, P. Spatially Quantifying Forest Loss at Landscape-scale Following a Major Storm Event. Remote Sens. 2020, 12, 1138. [Google Scholar] [CrossRef] [Green Version]
  19. Wang, W.; Qu, J.J.; Hao, X.; Liu, Y.; Stanturf, J.A. Post-hurricane forest damage assessment using satellite remote sensing. Agric. For. Meteorol. 2010, 150, 122–132. [Google Scholar] [CrossRef]
  20. Qian, Y.; Zhou, W.; Yu, W.; Pickett, S.T. Quantifying spatiotemporal pattern of urban greenspace: New insights from high resolution data. Landsc. Ecol. 2015, 30, 1165–1173. [Google Scholar] [CrossRef]
  21. Wang, F.G.; Xu, Y.J. Hurricane Katrina-induced forest damage in relation to ecological factors at landscape scale. Environ. Monit. Assess. 2008, 156, 491–507. [Google Scholar] [CrossRef] [PubMed]
  22. De Castro, A.I.; Shi, Y.; Maja, J.M.; Peña, J.M. UAVs for Vegetation Monitoring: Overview and Recent Scientific Contributions. Remote Sens. 2021, 13, 2139. [Google Scholar] [CrossRef]
  23. Müllerová, J.; Gago, X.; Bučas, M.; Company, J.; Estrany, J.; Fortesa, J.; Manfreda, S.; Michez, A.; Mokroš, M.; Paulus, G.; et al. Characterizing vegetation complexity with unmanned aerial systems (UAS)—A framework and synthesis. Ecol. Indic. 2021, 131, 108156. [Google Scholar] [CrossRef]
  24. Larrinaga, A.R.; Brotons, L. Greenness indices from a low-cost UAV imagery as tools for monitoring post-fire forest recovery. Drones 2019, 3, 6. [Google Scholar] [CrossRef] [Green Version]
  25. Shin, J.-I.; Seo, W.-W.; Kim, T.; Park, J.; Woo, C.-S. Using UAV multispectral images for classification of forest burn severity—A case study of the 2019 Gangneung forest fire. Forests 2019, 10, 1025. [Google Scholar] [CrossRef] [Green Version]
  26. Näsi, R.; Honkavaara, E.; Blomqvist, M.; Lyytikäinen-Saarenmaa, P.; Hakala, T.; Viljanen, N.; Kantola, T.; Holopainen, M. Remote sensing of bark beetle damage in urban forests at individual tree level using a novel hyperspectral camera from UAV and aircraft. Urban For. Urban Green. 2018, 30, 72–83. [Google Scholar] [CrossRef]
  27. Mokroš, M.; Výbošťok, J.; Merganič, J.; Hollaus, M.; Barton, I.; Koreň, M.; Tomaštík, J.; Čerňava, J. Early Stage Forest Windthrow Estimation Based on Unmanned Aircraft System Imagery. Forests 2017, 8, 306. [Google Scholar] [CrossRef] [Green Version]
  28. Abbas, S.; Nichol, J.E.; Fischer, G.A.; Wong, M.S.; Irteza, S.M. Impact assessment of a super-typhoon on Hong Kong’s secondary vegetation and recommendations for restoration of resilience in the forest succession. Agric. For. Meteorol. 2020, 280, 107784. [Google Scholar] [CrossRef]
  29. Wang, H.; Liu, H.Y.; Huang, N.; Bi, J.; Ma, X.L.; Ma, Z.Y.; Shangguan, Z.J.; Zhao, H.F.; Feng, Q.S.; Liang, T.G.; et al. Satellite-derived NDVI underestimates the advancement of alpine vegetation growth over the past three decades. Ecology 2021, 102, e03518. [Google Scholar] [CrossRef]
  30. Camarretta, N.; Harrison, P.A.; Bailey, T.; Potts, B.; Lucieer, A.; Davidson, N.; Hunt, M. Monitoring forest structure to guide adaptive management of forest restoration: A review of remote sensing approaches. New For. 2020, 51, 573–596. [Google Scholar] [CrossRef]
  31. Renaud, J.-P.; Vega, C.; Durrieu, S.; Lisein, J.; Magnussen, S.; Lejeune, P.; Fournier, M. Stand-level wind damage can be assessed using diachronic photogrammetric canopy height models. Ann. For. Sci. 2017, 74, 74. [Google Scholar] [CrossRef] [Green Version]
  32. Mao, P.; Qin, L.J.; Hao, M.Y.; Zhao, W.L.; Luo, J.Y.; Qiu, X.; Xu, L.J.; Xiong, Y.J.; Ran, Y.L.; Yan, C.H.; et al. An improved approach to estimate above-ground volume and biomass of desert shrub communities based on UAV RGB images. Ecol. Indic. 2021, 125, 107494. [Google Scholar] [CrossRef]
  33. Dragut, L.; Csillik, O.; Eisank, C.; Tiede, D. Automated parameterisation for multi-scale image segmentation on multiple layers. ISPRS J. Photogramm. Remote Sens. 2014, 88, 119–127. [Google Scholar] [CrossRef] [Green Version]
  34. Chiu, C.A.; Lin, P.H.; Hsu, C.K.; Shen, Z.H. A novel thermal index improves prediction of vegetation zones: Associating temperature sum with thermal seasonality. Ecol. Indic. 2012, 23, 668–674. [Google Scholar] [CrossRef]
  35. Mitchell, M.G.; Johansen, K.; Maron, M.; McAlpine, C.A.; Wu, D.; Rhodes, J.R. Identification of fine scale and landscape scale drivers of urban aboveground carbon stocks using high-resolution modeling and mapping. Sci. Total Environ. 2018, 622, 57–70. [Google Scholar] [CrossRef]
  36. Sun, C.; Lin, T.; Zhao, Q.; Li, X.; Ye, H.; Zhang, G.; Liu, X.; Zhao, Y. Spatial pattern of urban green spaces in a long-term compact urbanization process—A case study in China. Ecol. Indic. 2019, 96, 111–119. [Google Scholar] [CrossRef]
  37. Shahtahmassebi, A.R.; Li, C.; Fan, Y.; Wu, Y.; Lin, Y.; Gan, M.; Wang, K.; Malik, A.; Blackburn, G.A. Remote sensing of urban green spaces: A review. Urban For. Urban Green. 2021, 57, 126946. [Google Scholar] [CrossRef]
  38. Iglhaut, J.; Cabo, C.; Puliti, S.; Piermattei, L.; O’Connor, J.; Rosette, J. Structure from motion photogrammetry in forestry: A review. Curr. For. Rep. 2019, 5, 155–168. [Google Scholar] [CrossRef] [Green Version]
  39. Chave, J.; Andalo, C.; Brown, S.; Cairns, M.A.; Chambers, J.Q.; Eamus, D.; Fölster, H.; Fromard, F.; Higuchi, N.; Kira, T.; et al. Tree allometry and improved estimation of carbon stocks and balance in tropical forests. Oecologia 2005, 145, 87–99. [Google Scholar] [CrossRef]
  40. Davies, Z.G.; Edmondson, J.L.; Heinemeyer, A.; Leake, J.R.; Gaston, K.J. Mapping an urban ecosystem service: Quantifying above-ground carbon storage at a city-wide scale. J. Appl. Ecol. 2011, 48, 1125–1134. [Google Scholar] [CrossRef] [Green Version]
  41. Tian, J.; Reinartz, P.; d’Angelo, P.; Ehlers, M. Region-based automatic building and forest change detection on Cartosat-1 stereo imagery. ISPRS J. Photogramm. Remote Sens. 2013, 79, 226–239. [Google Scholar] [CrossRef]
  42. Suvanto, S.; Henttonen, H.M.; Nöjd, P.; Mäkinen, H. Forest susceptibility to storm damage is affected by similar factors regardless of storm type: Comparison of thunder storms and autumn extra-tropical cyclones in Finland. For. Ecol. Manag. 2016, 381, 17–28. [Google Scholar] [CrossRef]
  43. Gardiner, B.; Byrne, K.; Hale, S.; Kamimura, K.; Mitchell, S.J.; Peltola, H.; Ruel, J.C. A review of mechanistic modelling of wind damage risk to forests. Forestry 2008, 81, 447–463. [Google Scholar] [CrossRef] [Green Version]
  44. Du, Y.; Mak, C.M. Improving pedestrian level low wind velocity environment in high-density cities: A general framework and case study. Sustain. Cities Soc. 2018, 42, 314–324. [Google Scholar] [CrossRef] [PubMed]
  45. Schmoeckel, J.; Kottmeier, C. Storm damage in the Black Forest caused by the winter storm “Lothar”—Part 1: Airborne damage assessment. Nat. Hazards Earth Syst. Sci. 2008, 8, 795–803. [Google Scholar] [CrossRef] [Green Version]
  46. Saarinen, N.; Vastaranta, M.; Honkavaara, E.; Wulder, M.A.; White, J.C.; Litkey, P.; Holopainen, M.; Hyyppa, J. Using multi-source data to map and model the predisposition of forests to wind disturbance. Scand. J. For. Res. 2016, 31, 66–79. [Google Scholar] [CrossRef]
  47. Dupont, S.; Brunet, Y.; Finnigan, J.J. Large-eddy simulation of turbulent flow over a forested hill: Validation and coherent structure identification. Q. J. R. Meteorol. Soc. 2008, 134, 1911–1929. [Google Scholar] [CrossRef]
  48. Jim, C.Y.; Liu, H. Species diversity of three major urban forest types in Guangzhou City, China. For. Ecol. Manag. 2001, 146, 99–114. [Google Scholar] [CrossRef]
  49. Li, Y.Y.; Wang, X.R.; Huang, C.L. Key street tree species selection in urban areas. Afr. J. Agric. Res. 2011, 6, 3539–3550. [Google Scholar]
  50. Ng, W.-Y.; Chau, C.-K.; Powell, G.; Leung, T.-M. Preferences for street configuration and street tree planting in urban Hong Kong. Urban For. Urban Green. 2015, 14, 30–38. [Google Scholar] [CrossRef]
  51. Minařík, R.; Langhammer, J. Use of a multispectral UAV photogrammetry for detection and tracking of forest disturbance dynamics. Int. Arch. Photogramm. Remote Sens. Spat. Inf. Sci. 2016, 41, 711–718. [Google Scholar] [CrossRef] [Green Version]
  52. Miyoshi, G.T.; Arruda, M.D.S.; Osco, L.P.; Marcato Junior, J.; Gonçalves, D.N.; Imai, N.N.; Tommaselli, A.M.G.; Honkavaara, E.; Gonçalves, W.N. A novel deep learning method to identify single tree species in UAV-based hyperspectral images. Remote Sens. 2020, 12, 1294. [Google Scholar] [CrossRef] [Green Version]
  53. Wu, J.; Yao, W.; Polewski, P. Mapping individual tree species and vitality along urban road corridors with LiDAR and imaging sensors: Point density versus view perspective. Remote Sens. 2018, 10, 1403. [Google Scholar] [CrossRef] [Green Version]
  54. Guimarães, N.; Pádua, L.; Marques, P.; Silva, N.; Peres, E.; Sousa, J.J. Forestry Remote Sensing from Unmanned Aerial Vehicles: A Review Focusing on the Data, Processing and Potentialities. Remote Sens. 2020, 12, 1046. [Google Scholar] [CrossRef] [Green Version]
Figure 1. Study site. (a) Shenzhen city in Guangdong province, China, and the route of the super typhoon Mangkhut across Guangdong province. (b) Orthophoto map of the study area (GSD: 10 cm).
Remotesensing 14 02093 g001
Figure 2. Height differences of 330 points, distributed across roads and building roofs before and after the typhoon.
Remotesensing 14 02093 g002
Figure 3. Distribution of changes to urban vegetation coverage in the study area (GSD: 1 m). (a) Roadside trees; (b) artificially landscaped forest; (c) urban natural forest; (d) typhoon-damaged fallen roadside trees—mainly newly planted Bombax ceiba; (e) damage caused to artificially landscaped forest; (f) pre-typhoon area of bare soil in an urban natural forest; and (g) post-typhoon area of bare soil covered by grasses. Note that urban vegetation coverage changes are the differences between pre- and post-typhoon vegetation coverage. The positive values indicate a decrease in urban vegetation coverage, while the negative values indicate an increase in urban vegetation coverage.
Remotesensing 14 02093 g003
Figure 4. Distribution of urban vegetation canopy height changes in the study area (GSD: 10 cm). (a) The roadside trees; (b) the artificially landscaped forest; and (c) the natural forest.
Remotesensing 14 02093 g004
Figure 5. Changes in coverage and canopy height of the roadside trees on the sampling line before and after the typhoon. (a) The vegetation coverage; (b) the canopy height; and (c) the sampling line.
Remotesensing 14 02093 g005
Figure 6. Changes in coverage and canopy height of the artificially landscaped forest on the sampling line before and after the typhoon. (a) The vegetation coverage; (b) the canopy height; and (c) the sampling line.
Remotesensing 14 02093 g006
Figure 7. Changes in coverage and canopy height of the natural forest on the sampling line before and after the typhoon. (a) The vegetation coverage; (b) the canopy height; and (c) the sampling line.
Remotesensing 14 02093 g007
Figure 8. Height reduction rates.
Remotesensing 14 02093 g008
Table 1. The parameters of UAV flight before and after typhoon Mangkhut hit Shenzhen.
Collection ParameterBefore TyphoonAfter Typhoon
UAVDJI-Phantom 4 ProSelf-developed six-rotor UAV
Flight altitude above ground level120 m120 m
Forward overlap90%80%
Side overlap80%60%
Average ground resolution3.93 cm4.43 cm
Photography methodVertical photography using a single cameraOblique photography using double cameras
Capture time21 May 201819 September 2018
Publisher’s Note: MDPI stays neutral with regard to jurisdictional claims in published maps and institutional affiliations.

