
Predicting Landslides Susceptible Zones in the Lesser Himalayas by Ensemble of Per Pixel and Object-Based Models


Abstract
:
1. Introduction
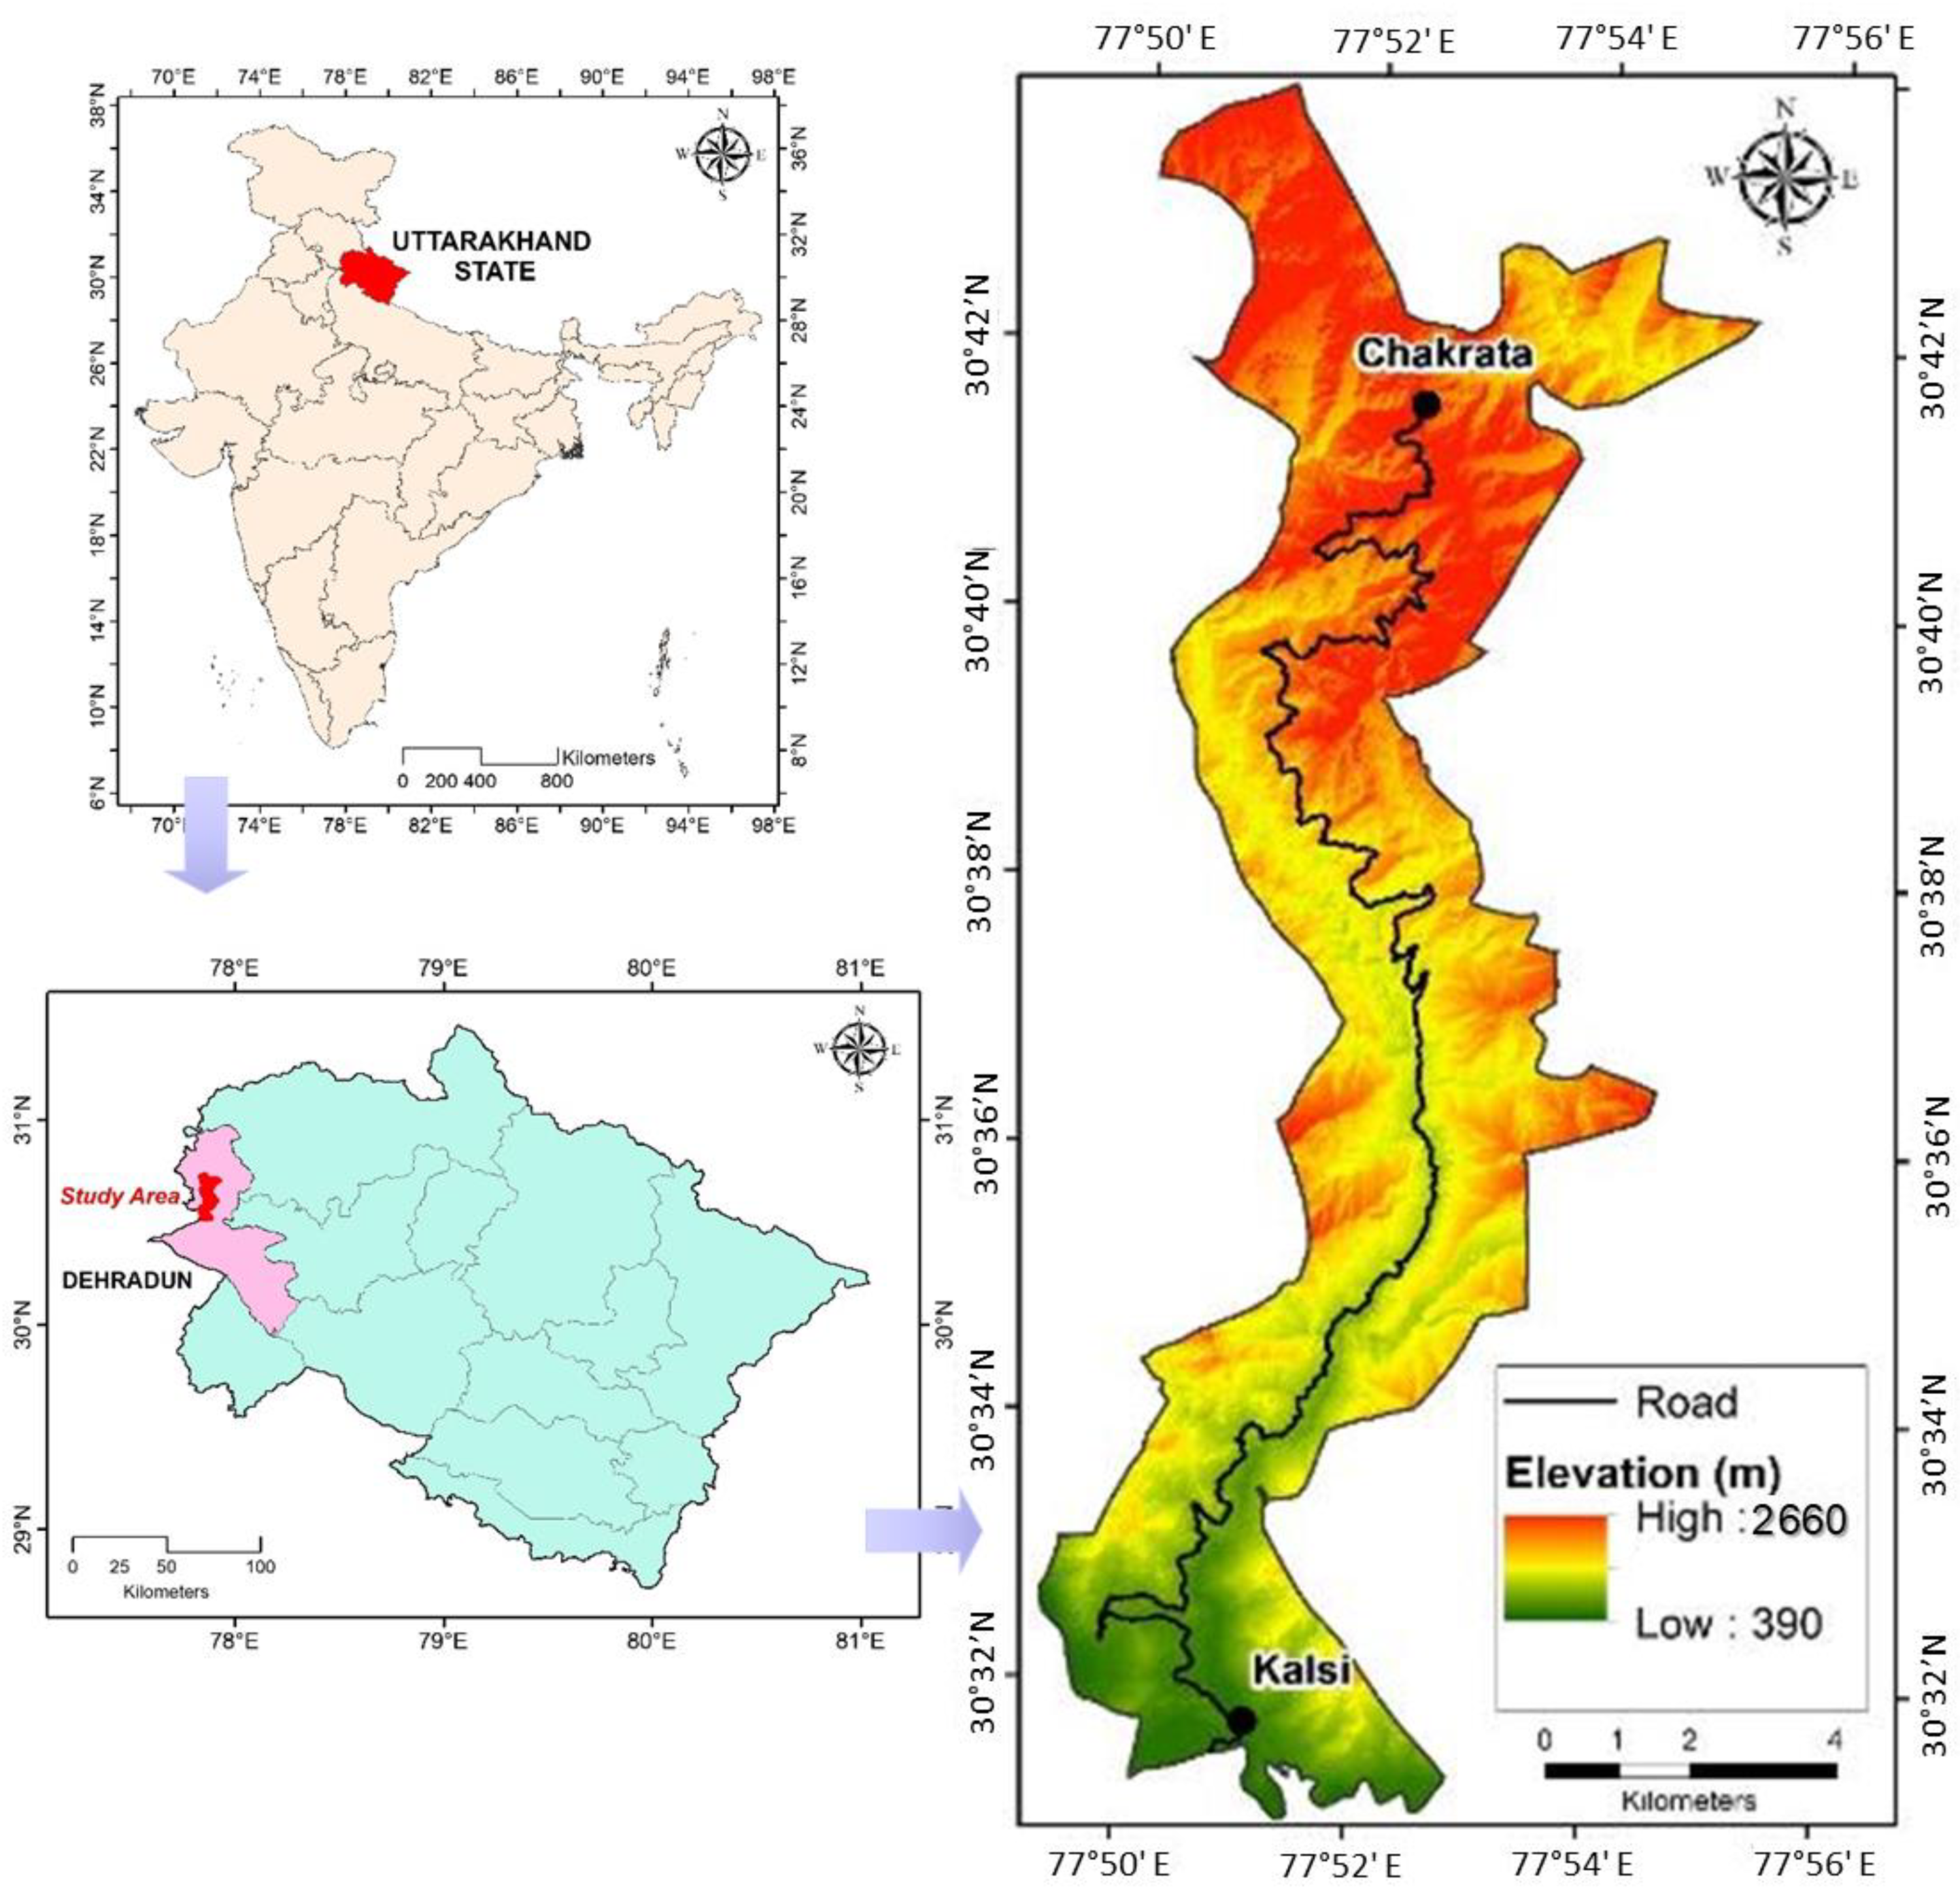
2. Study Area
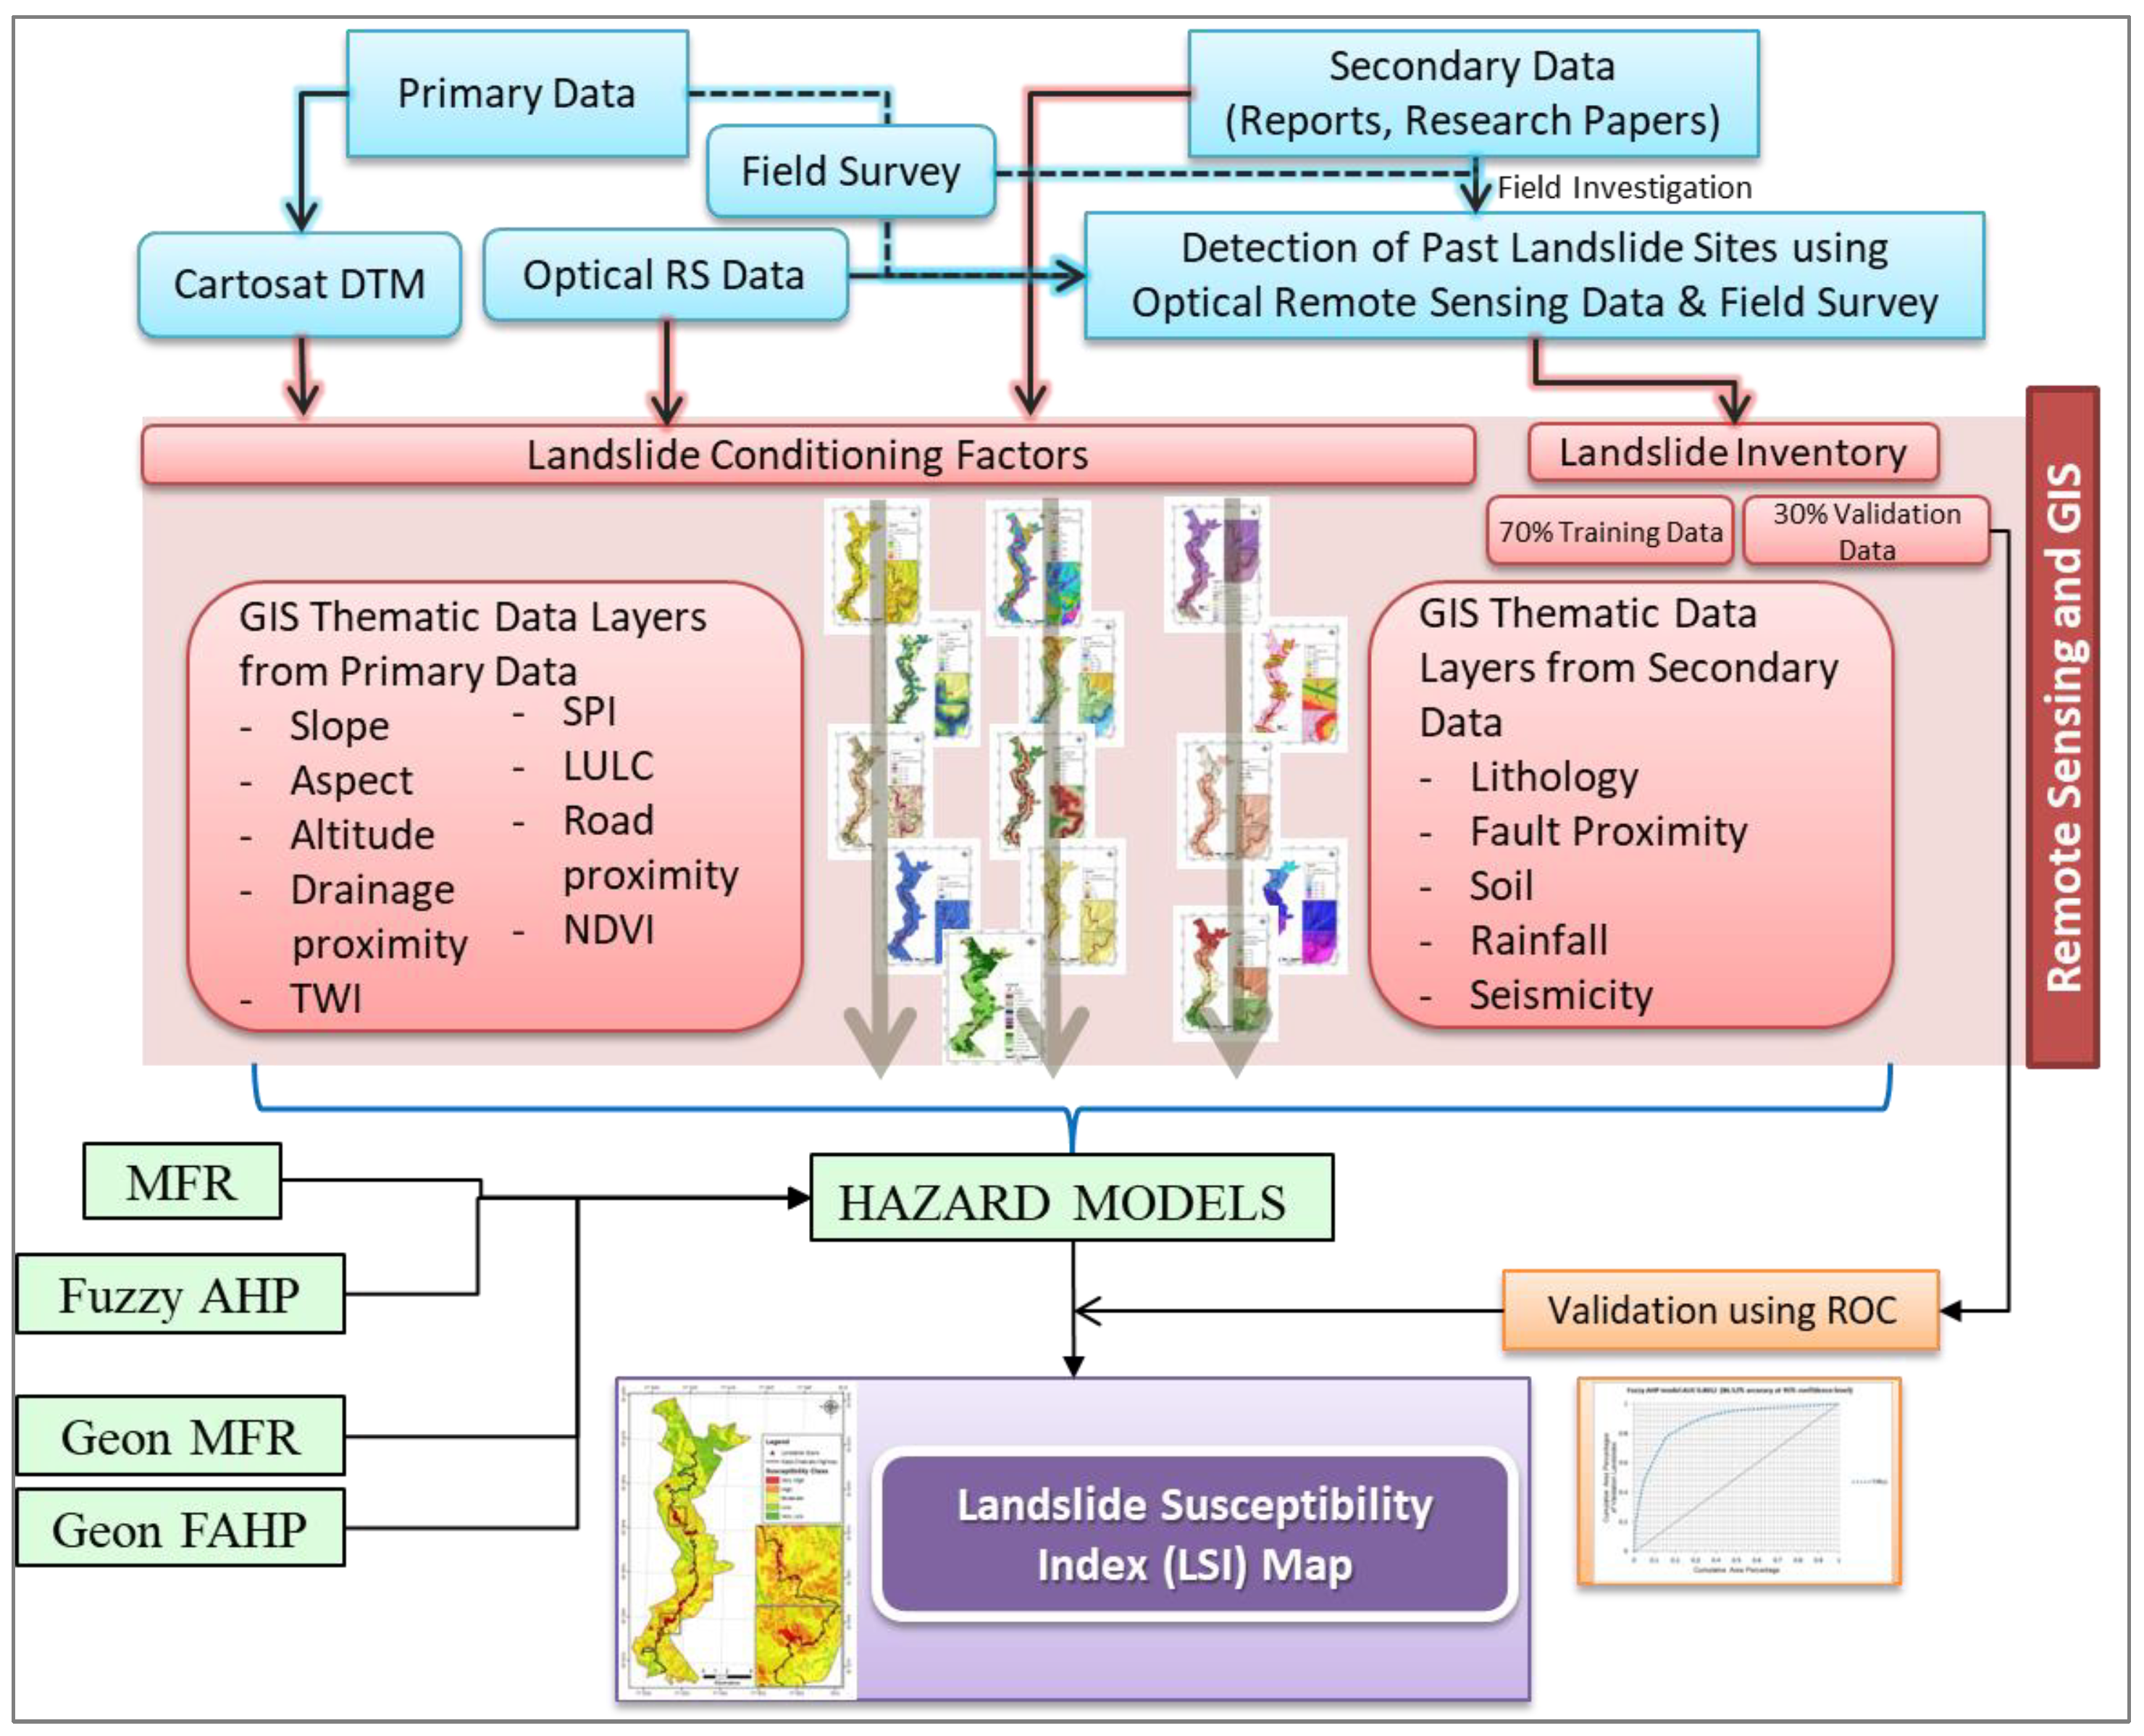
3. Materials and Methods
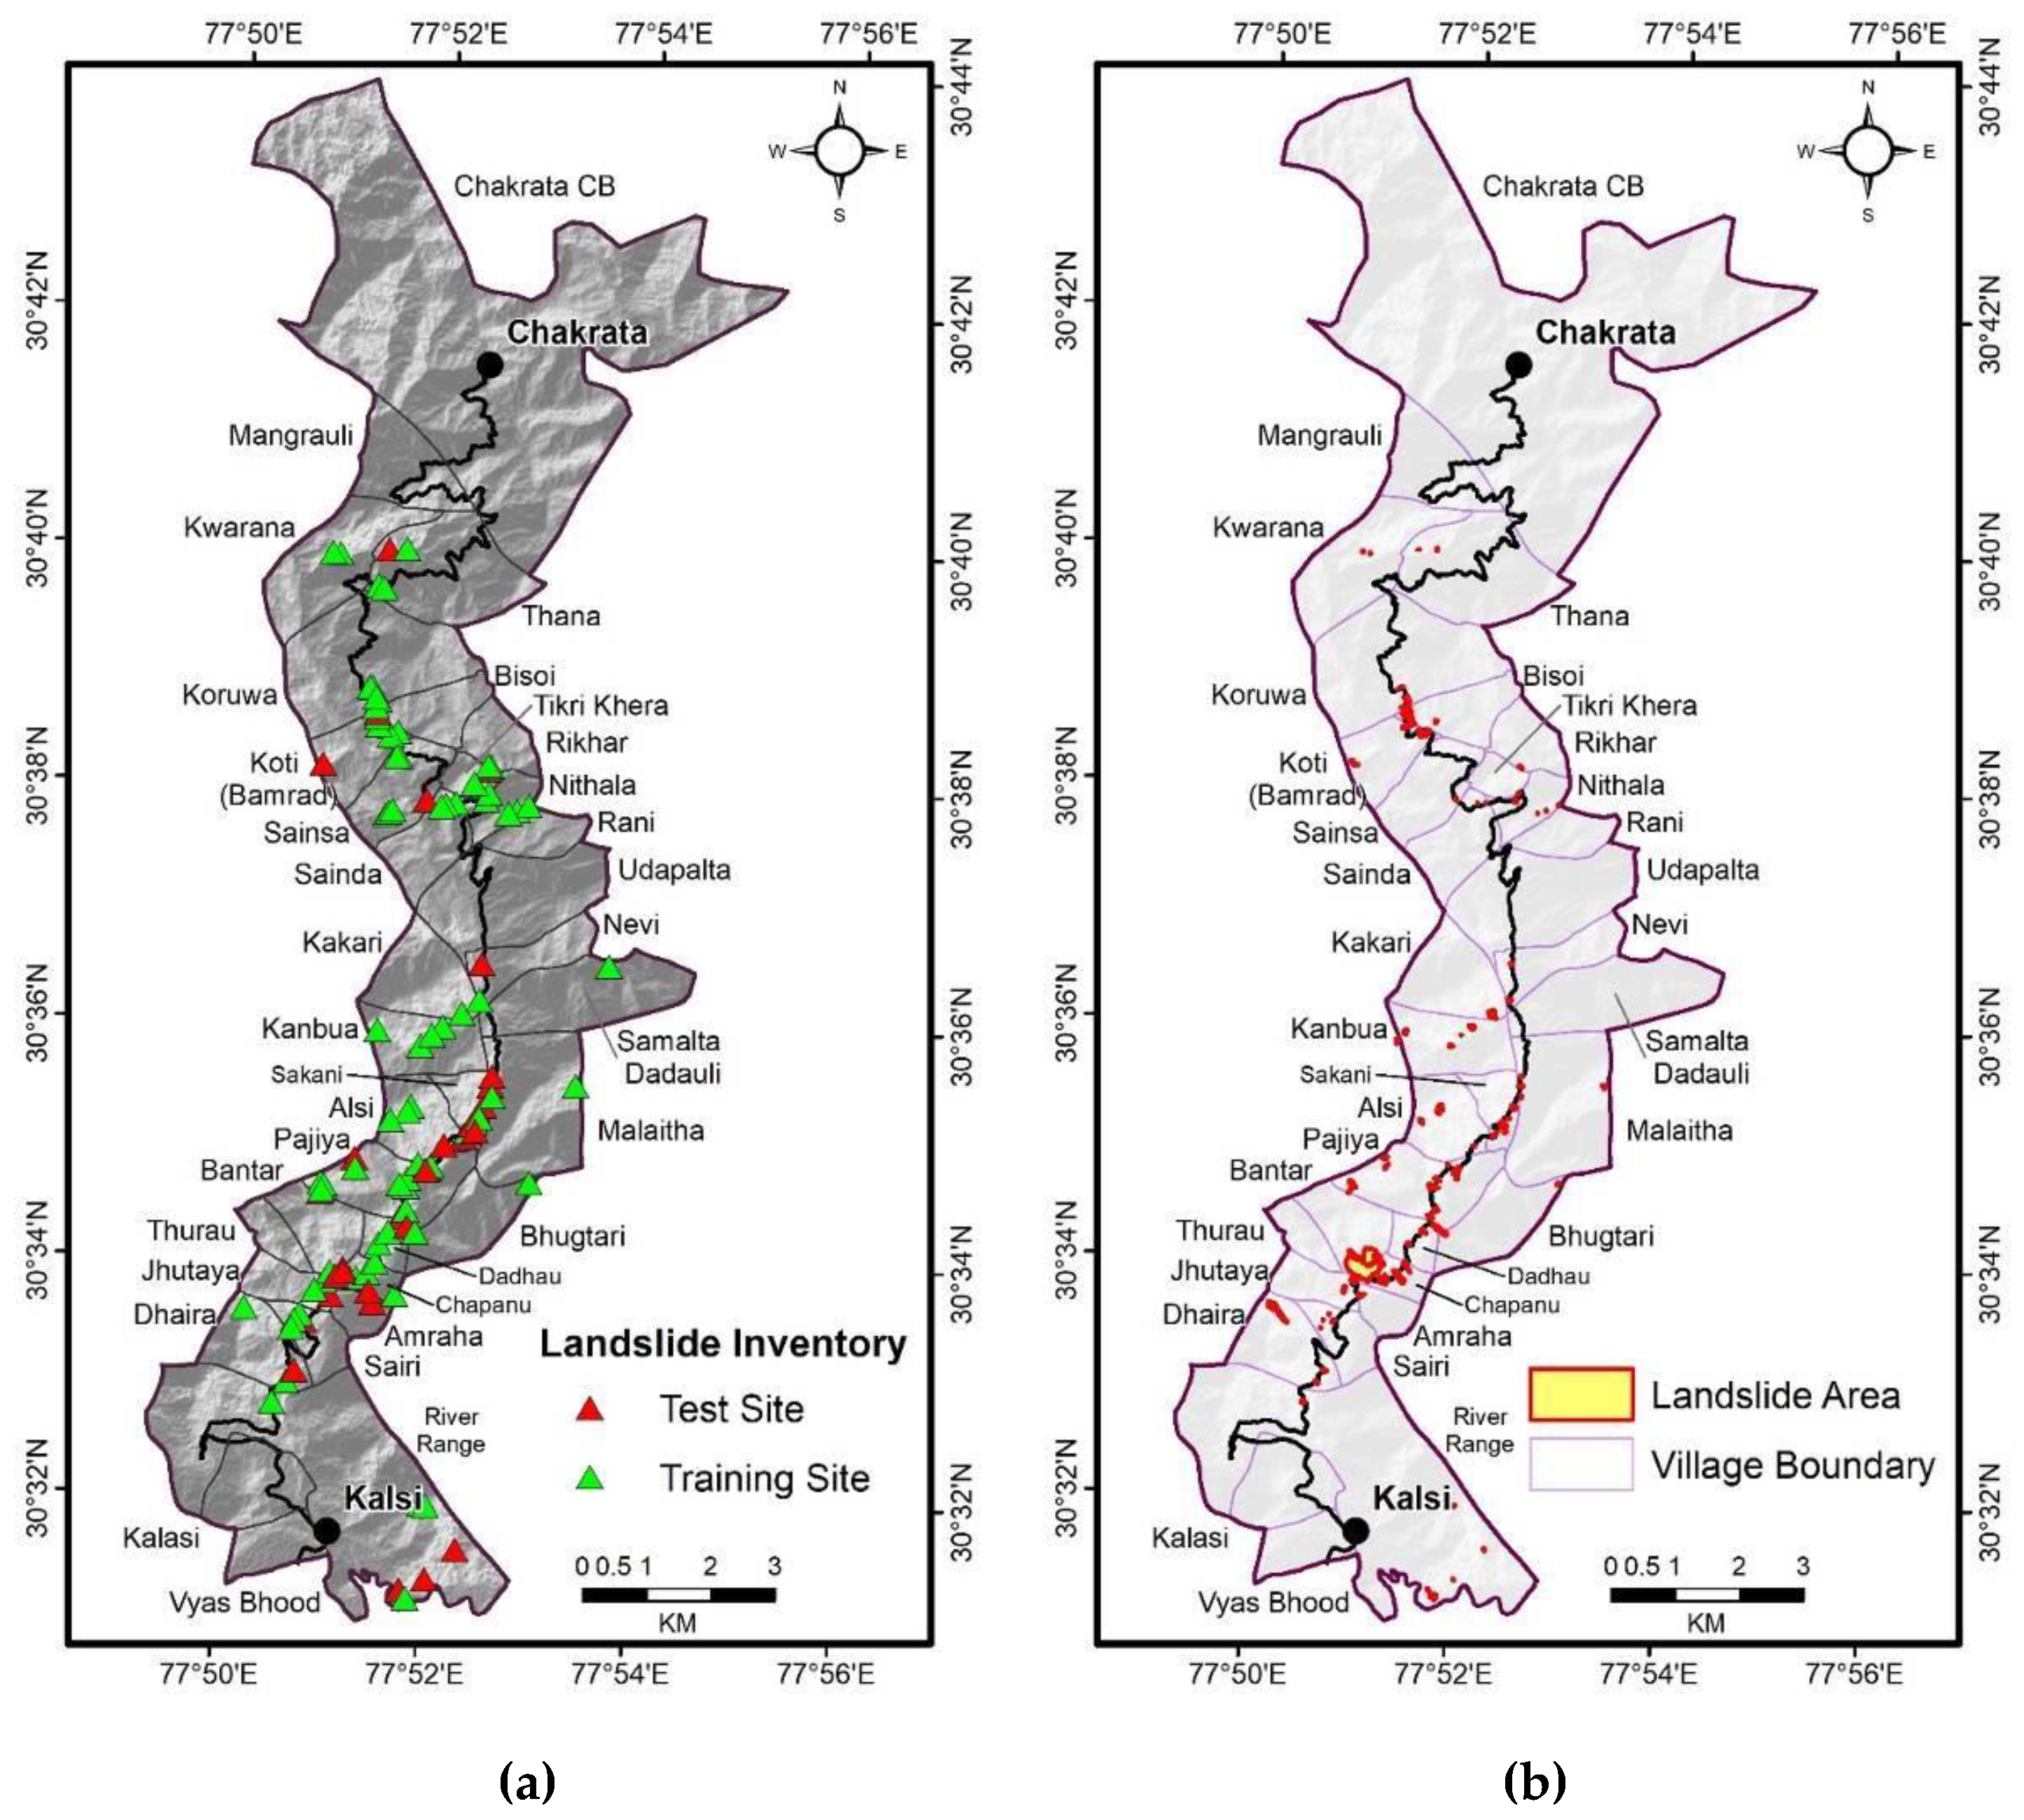
3.1. Mapping of Landslide Inventory
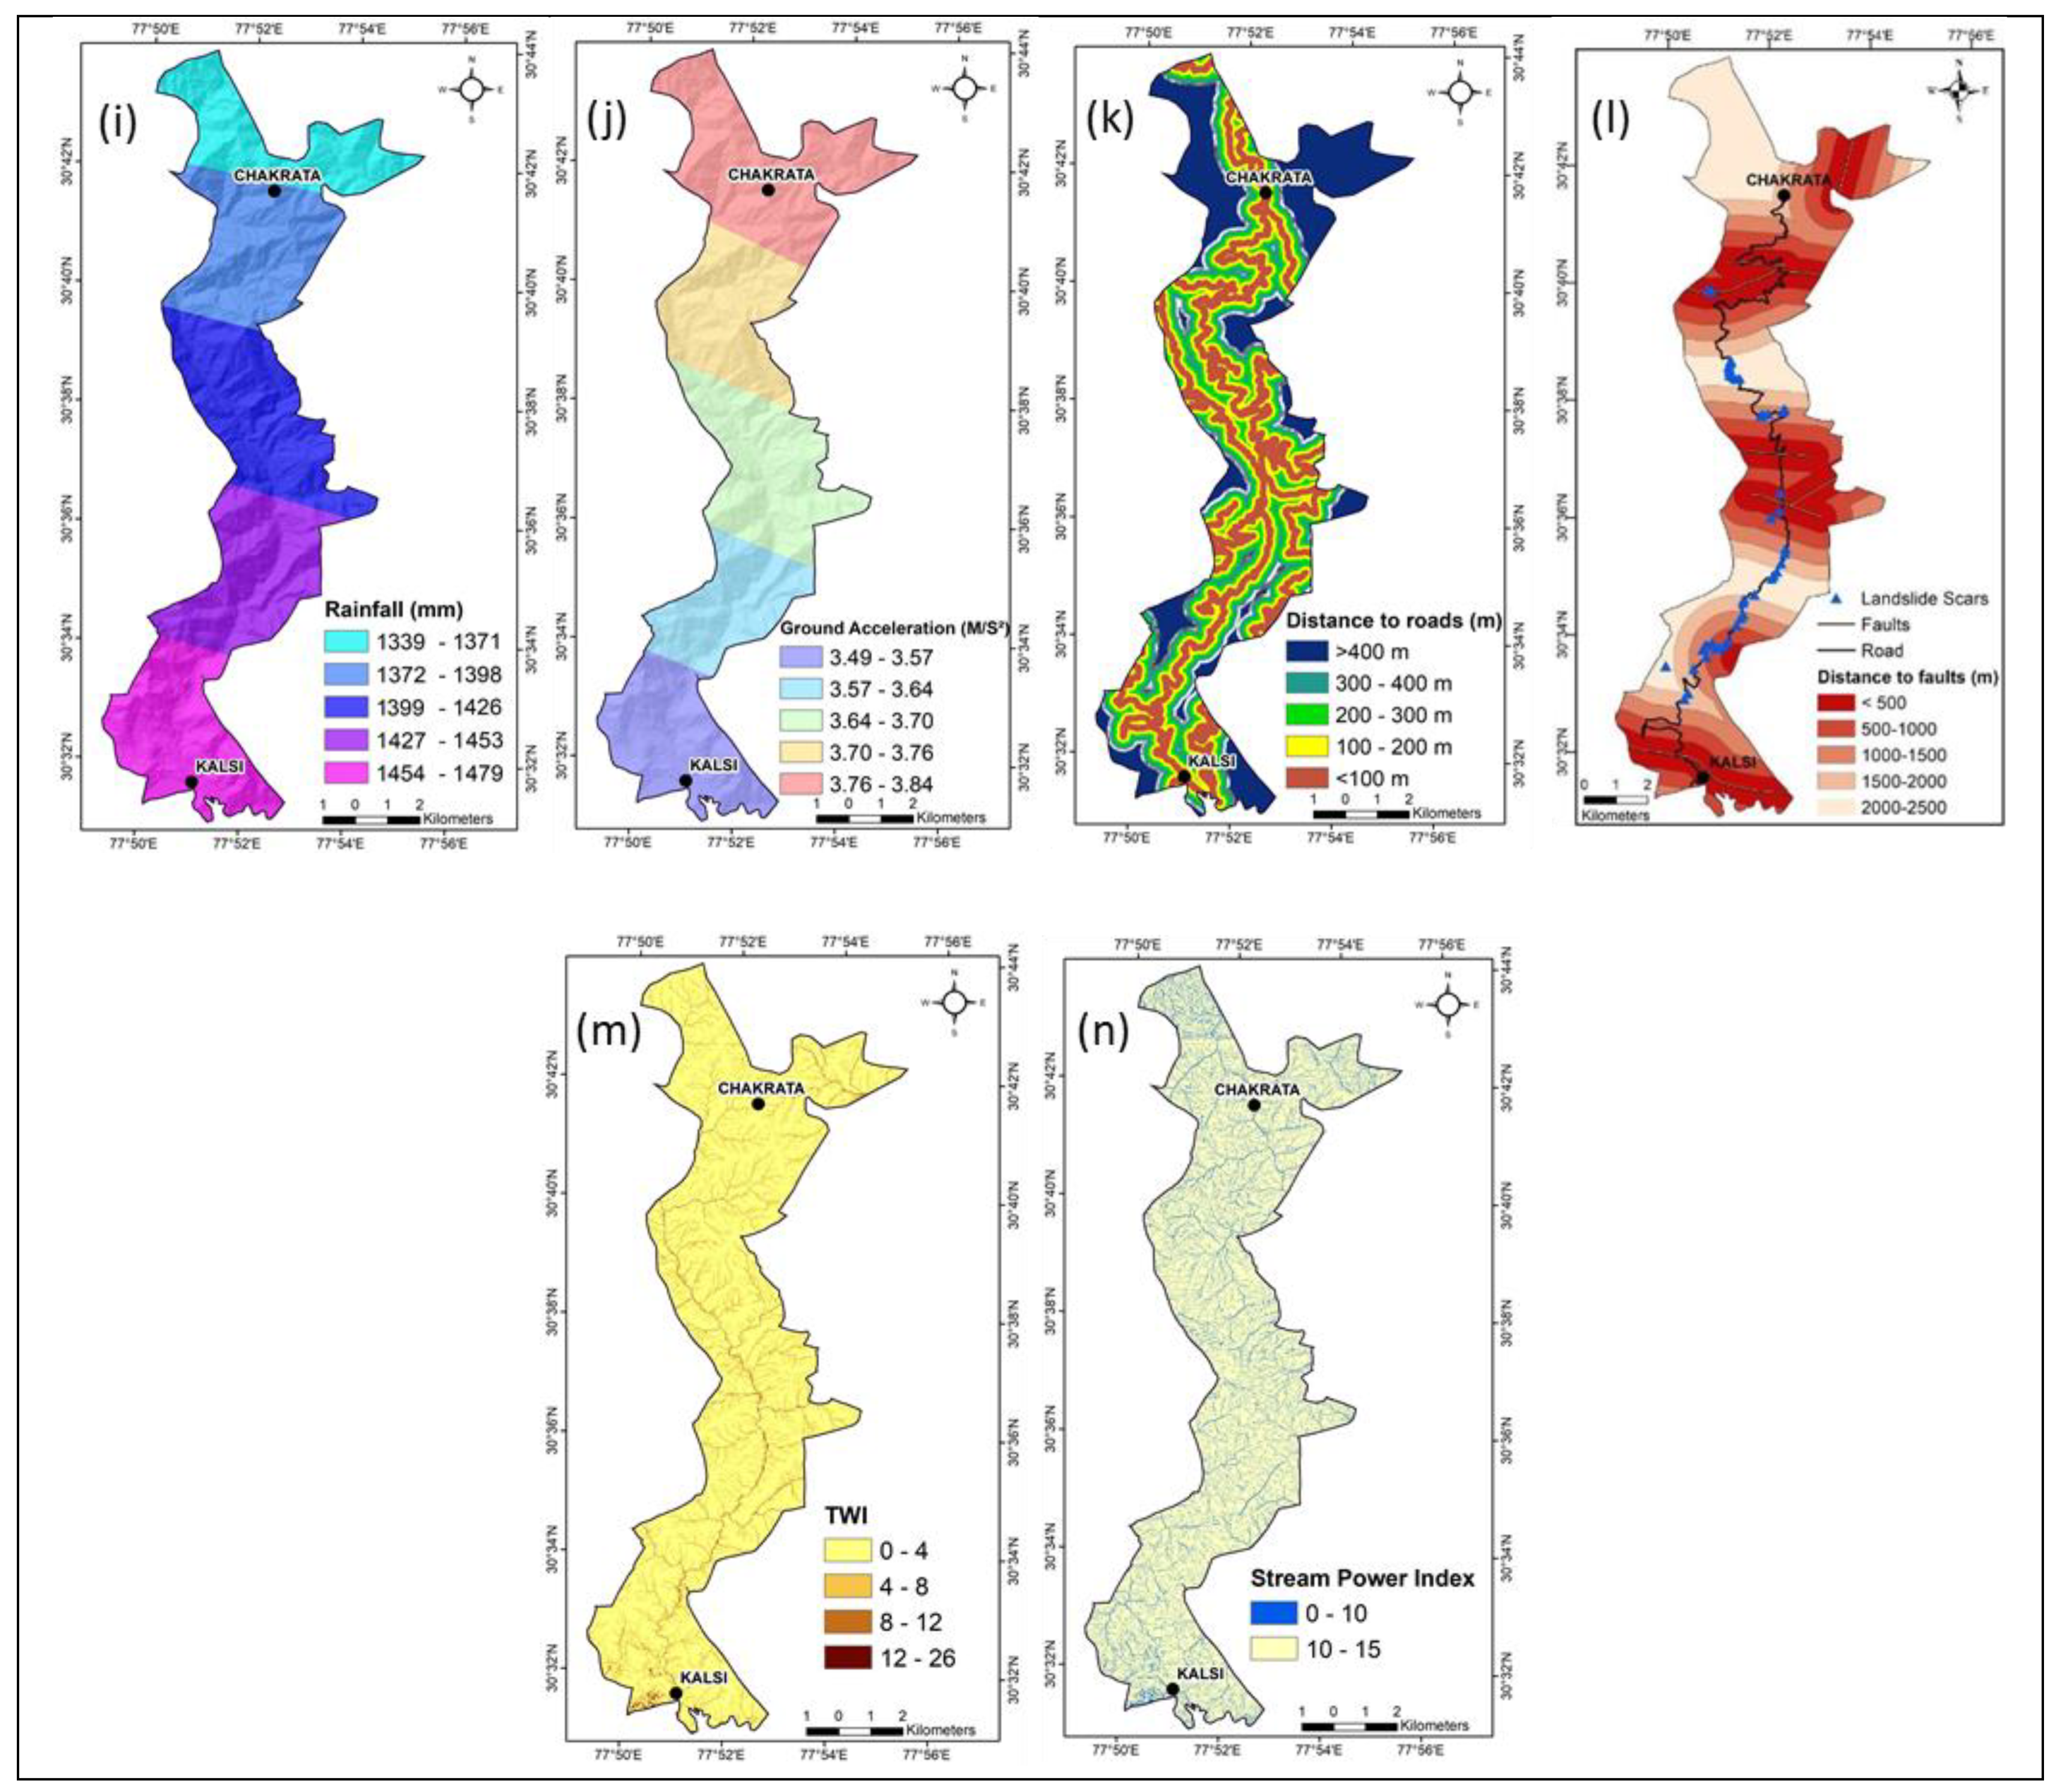
3.2. Landslide Conditioning Factors
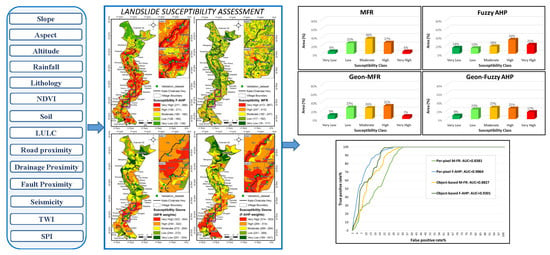
3.3. Landslide Susceptibility Mapping (LSM)
- (1)
- Landslide inventory preparation
- (2)
- Identification of conditioning factors for landslide and generation of thematic layers
- (3)
- Overlay of raster layers, conditioning factors, and past landslide events
- (4)
- Calculation of FR values weightages/Computation of AHP weightages for the conditioning factors based on landslide cells and non-landslide occurrence cells.
- (5)
- Calculation of MFR by normalizing the FR values/Computation of FAHP normalized weightages at the per-pixel level
- (6)
- Generation of LSI maps by aggregating MFR/FAHP values
- (7)
- Image segmentation using geons and aggregation of landslide susceptible zones
- (8)
- Generation of object-based landslide susceptible zones applying geons approach
- (9)
- Validation of the model results (refer to Section 5 for details)
3.3.1. Weighting Approaches
Modified Frequency Ratio (MFR) Model
Fuzzy Analytic Hierarchy (FAHP) Process
- (1)
- Development of hierarchical structure: A judgment matrix was constructed for pairwise comparison of the linguistic variables on a scale of 1 to 9 where value 1 signifies ‘equally important, while values of 3, 5, 7 and 9 denote ‘slightly important, ‘important, ‘strongly important’ and ‘extremely important’ hierarchies, respectively. The scale values, i.e., 2, 4, 6, 8, represented intermediate values between 1 and 3, 3 and 5, 5 and 7, 7 and 9, respectively. The decision-makers/scholars provided their judgments on a fuzzy triangular scale for selected criteria [11,98]. The consistency of the matrix judgments was thoroughly checked.
- (2)
- Degree of membership and fuzzy matrix calculation: In this step, the scores of pairwise comparisons were converted into linguistic variables for determining the alternatives under the fuzzy environment.
- (3)
- Computation of degree of possibility value: The fuzzy index weights, also known as degree of possibility value, were calculated at this step.
- (4)
- Normalized fuzzy decision matrix: The normalized weights were calculated based on the maximum likelihood function.
3.3.2. Aggregation Approaches for Landslide Susceptibility Mapping
Geons (Object-Based Aggregation)
3.4. Model Validation and Evaluation
3.4.1. Receiver Operating Characteristics (ROC)
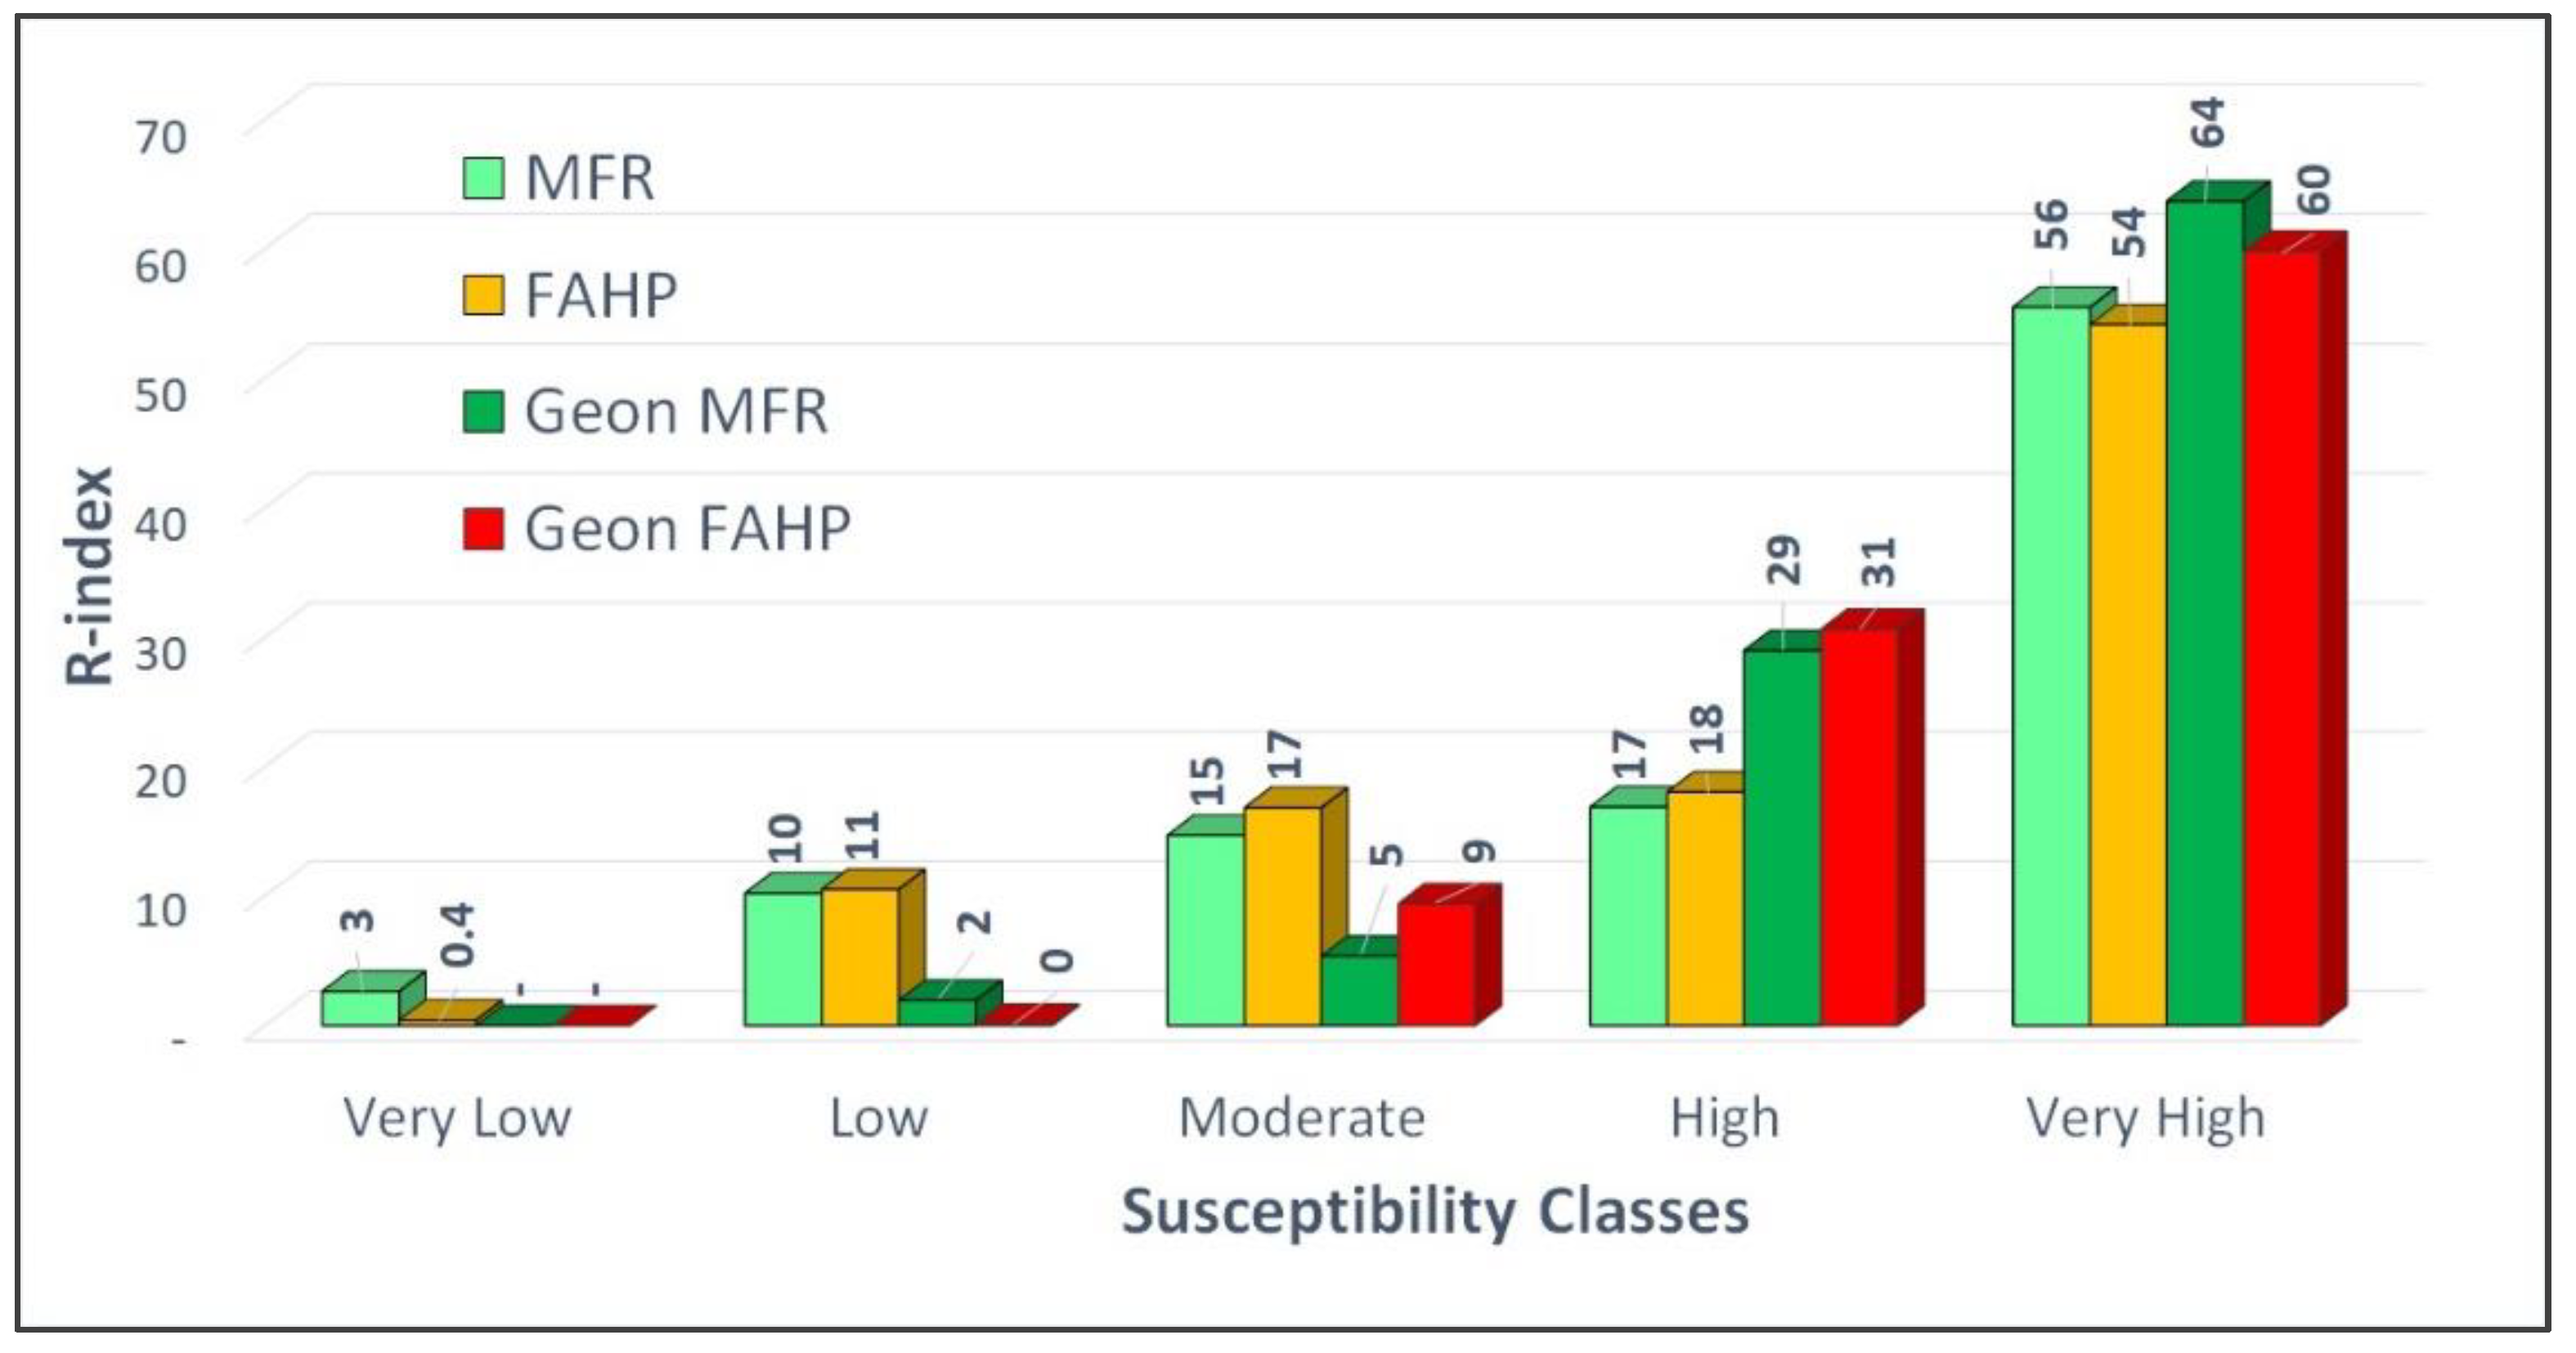
3.4.2. R-Index (Relative Landslide Density)
4. Results and Analysis
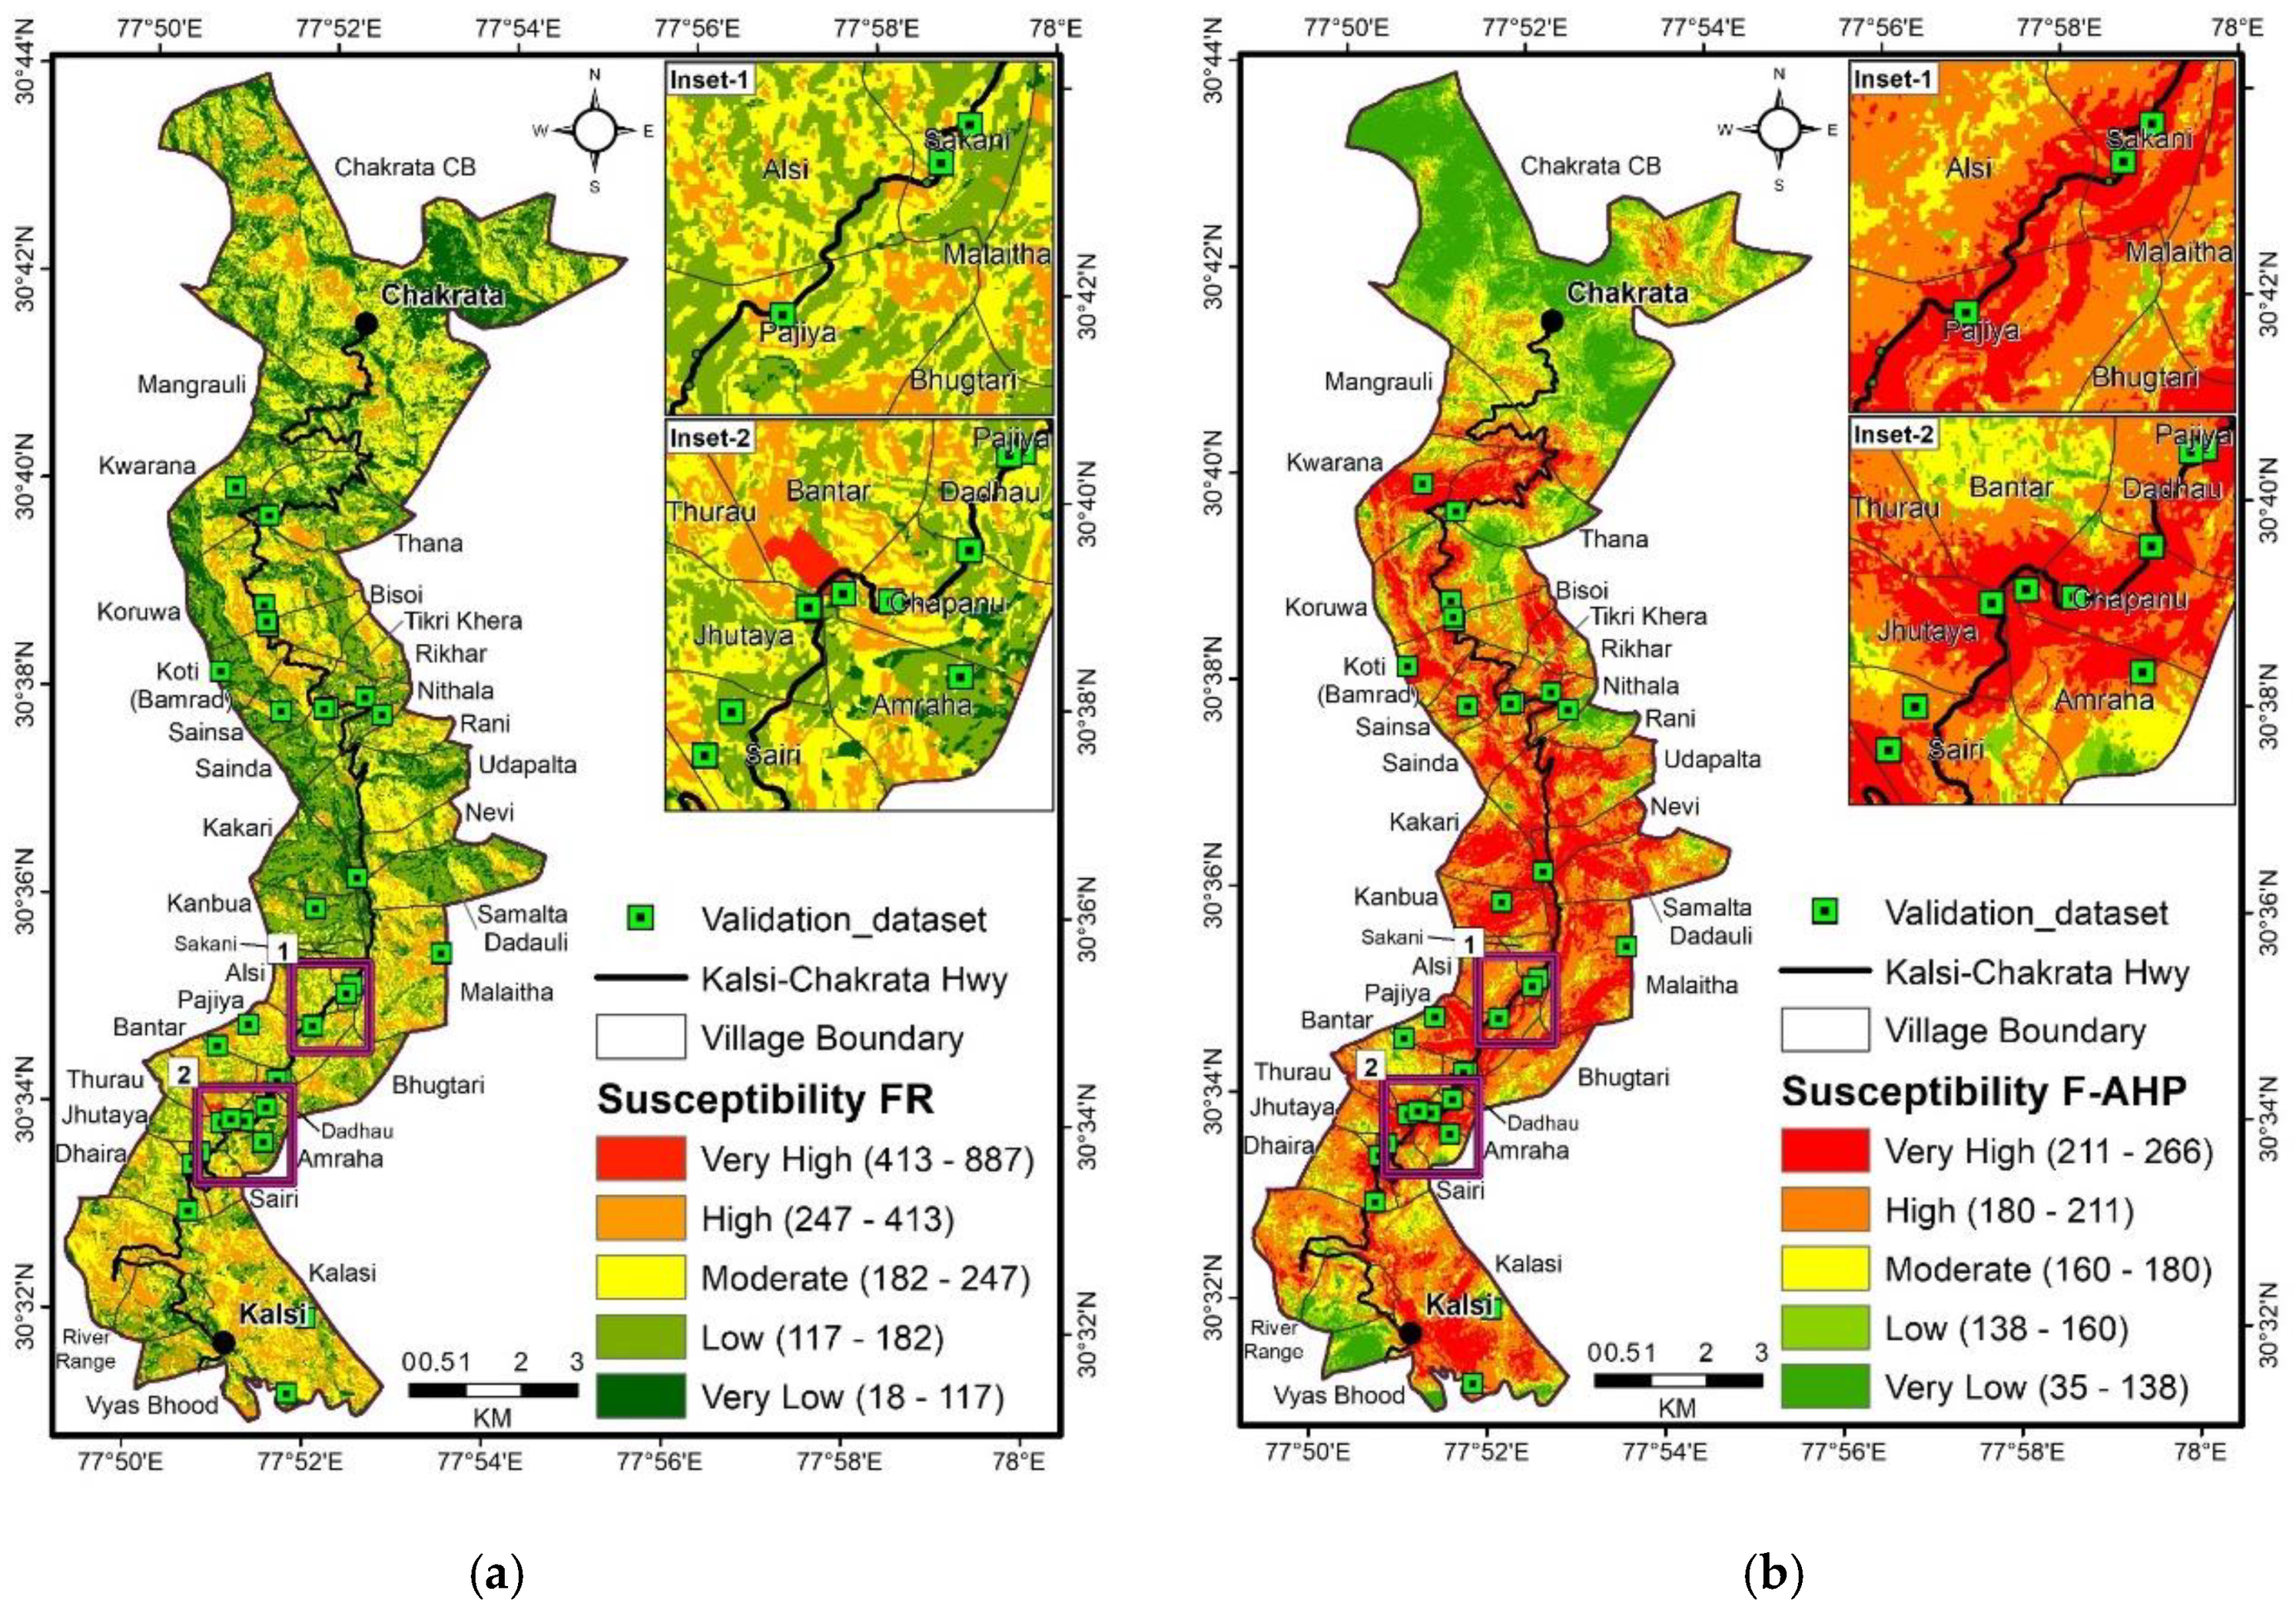
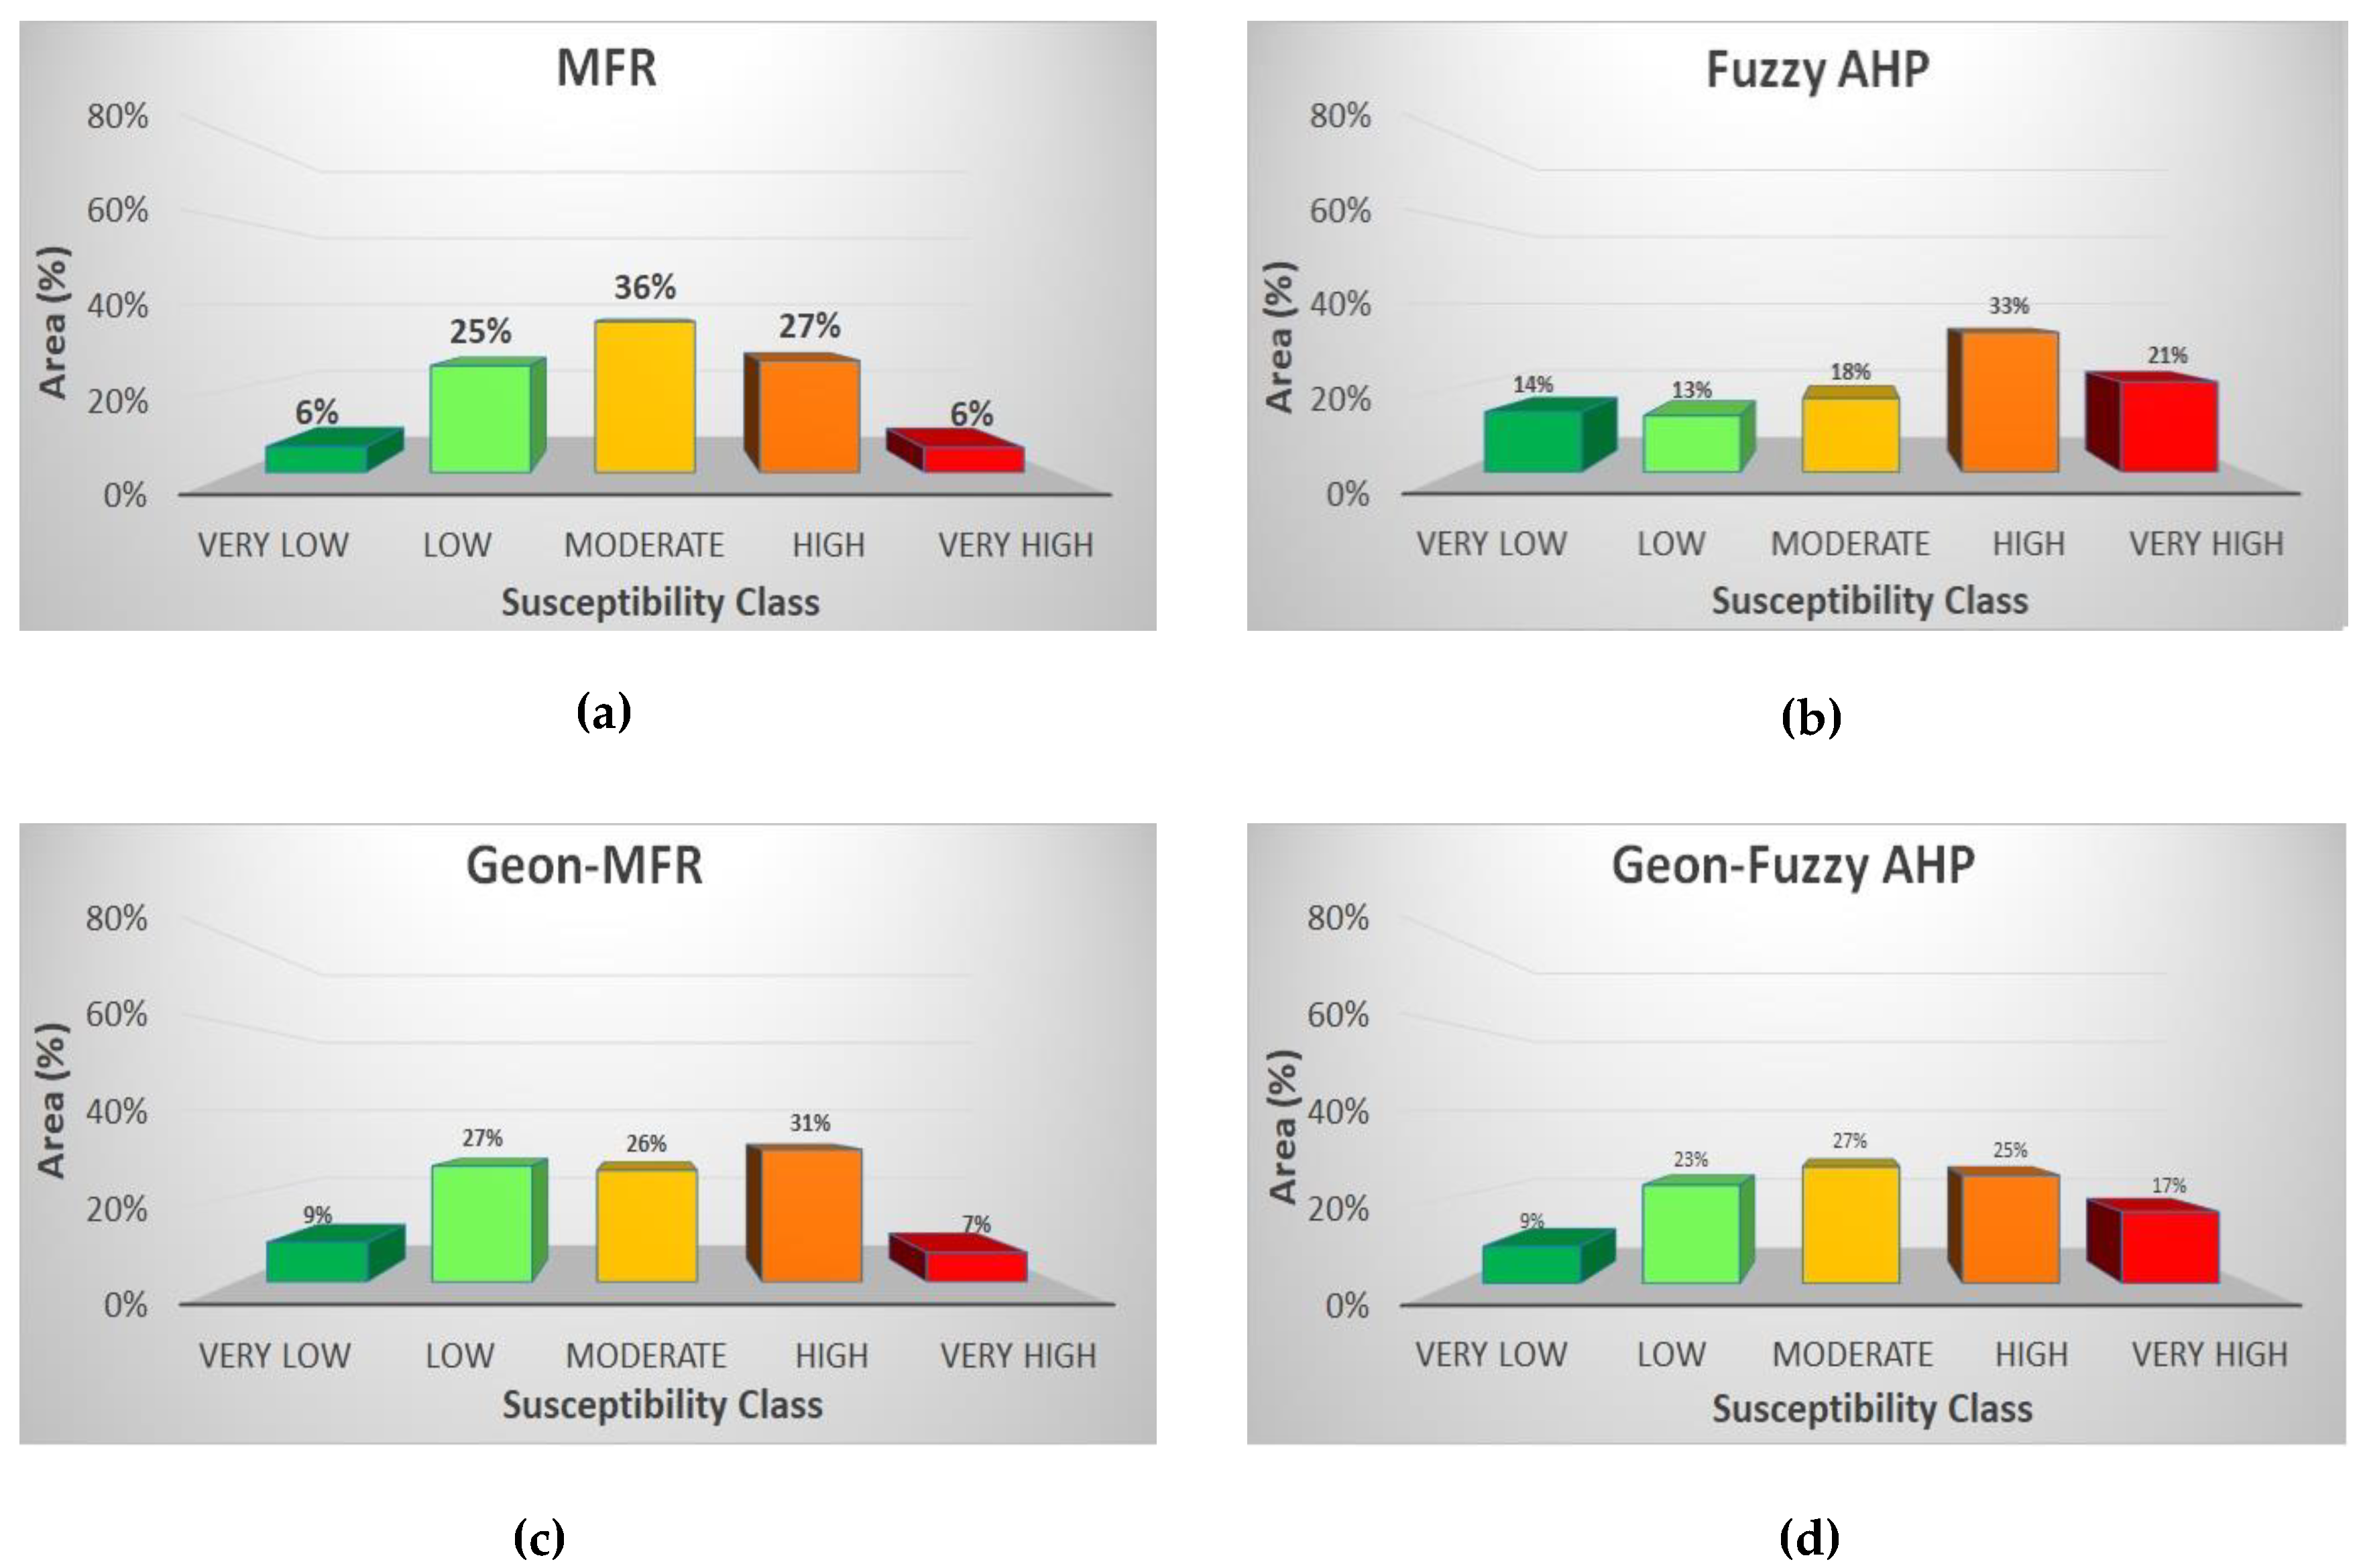
4.1. Per-Pixel Based MFR and FAHP Analysis
4.2. Per-Pixel and Object-Based Geons Result Analysis
4.3. Model Validation and Evaluation
4.3.1. Receiver Operating Characteristics (ROC)
4.3.2. R-Index (Relative Landslide Density)
5. Discussion
6. Conclusions
Author Contributions
Funding
Institutional Review Board Statement
Informed Consent Statement
Data Availability Statement
Acknowledgments
Conflicts of Interest
References
- Mathew, J.; Jha, V.K.; Rawat, G.S. Weights of evidence modeling for landslide hazard zonation mapping in part of Bhagirathi valley, Uttarakhand. Curr. Sci. 2007, 92, 628–637. [Google Scholar]
- Hong, H.; Pradhan, B.; Xu, C.; Bui, D.T. Spatial prediction of landslide hazard at the Yihuang area (China) using two-class kernel logistic regression, alternating decision tree and support vector machines. Catena 2015, 133, 266–281. [Google Scholar] [CrossRef]
- Nadim, F.; Kjekstad, O.; Peduzzi, P.; Herold, C.; Jaedicke, C. Global landslide and avalanche hotspots. Landslides 2006, 3, 159–173. [Google Scholar] [CrossRef]
- Geological Survey of India, Geological Map. Available online: https://www.gsi.gov.in/webcenter/portal/OCBIS?_afrLoop=50017052507508016&_adf.ctrl-state=1bmlw2iaje_1#!%40%40%3F_afrLoop%3D50017052507508016%26_adf.ctrl-state%3D1bmlw2iaje_5 (accessed on 11 January 2022).
- Thai Pham, B.; Tien Bui, D.; Prakash, I. Landslide susceptibility modelling using different advanced decision trees methods. Civ. Eng. Environ. Syst. 2019, 35, 139–157. [Google Scholar] [CrossRef]
- Kaur, H.; Gupta, S.; Parkash, S. Comparative Evaluation of Various Approaches for Landslide Hazard Zoning: A Critical Review in Indian Perspectives. Spat. Inf. Res. 2017, 25, 389–398. [Google Scholar] [CrossRef]
- Ambrosi, C.; Strozzi, T.; Scapozza, C.; Wegmuller, U. Landslide hazard assessment in the Himalayas (Nepal and Bhutan) based on Earth-Observation data. J. Eng. Geol. 2018, 237, 217–228. [Google Scholar] [CrossRef]
- Li, Y.; Zhou, R.; Zhao, G.; Li, H.; Su, D.; Ding, H.; Yan, Z.; Yan, L.; Yun, K.; Ma, C. Tectonic uplift and landslides triggered by the Wenchuan earthquake and constraints on orogenic growth: A case study from Hongchun Gully, Longmen Mountains, Sichuan, China. Quat. Int. 2014, 349, 142–152. [Google Scholar] [CrossRef]
- Kwan, J.S.H.; Chan, S.L.; Cheuk, J.C.Y.; Koo, R.C.H. A case study on an open hillside landslide impacting on a flexible rock fall barrier at Jordan Valley, Hong Kong. Landslides 2014, 11, 1037–1050. [Google Scholar] [CrossRef]
- Haque, U.; Da Silva, A.P.F.; Devoli, G.; Pilz, J.; Zhao, B.; Khaloua, A.; Wilopo, W.; Anderson, P.; Ping, L.; Lee, J.; et al. The human cost of global warming: Deadly landslides and their triggers (1995–2014). Sci. Total Environ. 2019, 682, 673–684. [Google Scholar] [CrossRef]
- Sur, U.; Singh, P.; Meena, S.R. Landslide susceptibility assessment in a lesser Himalayan road corridor (India) applying fuzzy AHP technique and earth-observation data. Geomat. Nat. Hazards Risk 2020, 11, 2176–2209. [Google Scholar] [CrossRef]
- Rai, P.K.; Mohan, K.; Kumra, V.K. Landslide hazard and its mapping using Remote Sensing & GIS techniques. J. Sci. Res. 2014, 58, 1–13. [Google Scholar]
- Singh, P.; Sharma, A.; Sur, U.; Rai, P.K. Comparative landslide susceptibility assessment using statistical information value and index of entropy model in Bhanupali-Beri region, Himachal Pradesh, India. Environ. Dev. Sustain. 2020, 23, 5233–5250. [Google Scholar] [CrossRef]
- NASA. Climate change could trigger more landslides in High Mountain Asia. Science News, 11 February 2020. Available online: https://www.sciencedaily.com/releases/2020/02/200211121512.htm (accessed on 14 February 2022).
- Varnes, D.J. Landslide Hazard Zonation: A Review of Principles and Practice; Natural Hazards; UNESCO: Paris, France, 1984; Available online: https://www.scirp.org/(S(351jmbntvnsjt1aadkposzje))/reference/ReferencesPapers.aspx?ReferenceID=1768332 (accessed on 11 January 2022).
- Sur, U.; Singh, P. Landslide Susceptibility Indexing using geospatial and geostatistical techniques along Chakrata-Kalsi road corridor, India. J. Indian Natl. Cartogr. Assoc. INCA 2019, 38, 2018. [Google Scholar]
- Pellicani, R.; van Westen, C.J.; Spilotro, G. Assessing landslide exposure in areas with limited landslide information. Landslides 2014, 11, 463–480. [Google Scholar] [CrossRef]
- Singh, P.; Sharma, A. Probabilistic Landslide susceptibility mapping using binary logistic regression model and Geospatial Techniques: A case study of Uttarakhand. In Proceedings of the 16th ESRI User Conference, New Delhi, India, 2–4 December 2015. [Google Scholar]
- Glade, T. Landslide Hazard Assessment and Historical Landslide Data—An Inseparable Couple? The Use of Historical Data in Natural Hazard Assessments. Adv. Nat. Technol. Hazards Res. 2001, 17, 153–168. [Google Scholar] [CrossRef]
- Wang, Y.; Huiming, T.; Wen, T.; Ma, J. Direct Interval Prediction of Landslide Displacements Using Least Squares Support Vector Machines. Complexity 2020, 2020, 7082594. [Google Scholar] [CrossRef]
- Ghorbanzadeh, O.; Blaschke, T.; Aryal, J.; Gholaminia, K. A new GIS-based technique using an adaptive neuro-fuzzy inference system for land subsidence susceptibility mapping. J. Spat. Sci. 2018, 401–418. [Google Scholar] [CrossRef] [Green Version]
- Van Westen, C.J.; Rengers, N.; Soeters, R. Use of geomorphological information in indirect landslide susceptibility assessment. Nat. Hazards 2003, 30, 399–419. [Google Scholar] [CrossRef]
- Hasekioğulları, G.D.; Ercanoglu, M. A new approach to use AHP in landslide susceptibility mapping: A case study at Yenice (Karabuk, NW Turkey). Nat. Hazards 2012, 63, 1157–1179. [Google Scholar] [CrossRef]
- Yan, T.; Shen, S.; Zhou, A.; Chen, J. A Brief Report of Pingdi Landslide (23 July 2019) in Guizhou Province, China. Geosciences 2019, 9, 368. [Google Scholar] [CrossRef] [Green Version]
- Tavakkoli Piralilou, S.; Shahabi, H.; Jarihani, B.; Ghorbanzadeh, O.; Blaschke, T.; Gholamnia, K.; Meena, S.R.; Aryal, J. Landslide Detection Using Multi-Scale Image Segmentation and Different Machine Learning Models in the Higher Himalayas. Remote Sens. 2019, 11, 2575. [Google Scholar] [CrossRef] [Green Version]
- Dao, D.V.; Jaafari, A.; Bayat, M.; Mafi-Gholami, D.; Qi, C.; Moayedi, H.; van Phong, T.; Ly, H.-B.; Le, T.-T.; Trinh, P.T.; et al. A spatially explicit deep learning neural network model for the prediction of landslide susceptibility. Catena 2020, 188, 104451. [Google Scholar] [CrossRef]
- Meena, S.R.; Mishra, B.; Tavakkoli, P.S. A hybrid spatial multi-criteria evaluation method for mapping landslide susceptible areas in Kullu Valley, Himalayas. Geosciences 2019, 9, 156. [Google Scholar] [CrossRef] [Green Version]
- Sameen, M.I.; Pradhan, B.; Lee, S. Application of convolutional neural networks featuring Bayesian optimization for landslide susceptibility assessment. Catena 2020, 186, 104249. [Google Scholar] [CrossRef]
- Lee, S.; Pradhan, B. Landslide hazard mapping at Selangor, Malaysia using frequency ratio and logistic regression models. Landslides 2007, 4, 33–41. [Google Scholar] [CrossRef]
- Althuwaynee, O.F.; Pradhan, B.; Lee, S. Application of an evidential belief function model in landslide susceptibility mapping. Comput. Geosci. 2012, 44, 120–135. [Google Scholar] [CrossRef]
- Pourghasemi, H.R.; Pradhan, B.; Gokceoglu, C. Application of fuzzy logic and analytical hierarchy process (AHP) to landslide susceptibility mapping at Haraz watershed, Iran. Nat. Hazards 2012, 63, 965–996. [Google Scholar] [CrossRef]
- Nampak, H.; Pradhan, B.; Manap, M.A. Application of GIS based data driven evidential belief function model to predict groundwater potential zonation. J. Hydrol. 2014, 513, 283–300. [Google Scholar] [CrossRef]
- Meena, S.R.; Ghorbanzadeh, O.; Blaschke, T. A Comparative Study of Statistics-Based Landslide Susceptibility Models: A Case Study of the Region Affected by the Gorkha Earthquake in Nepal. ISPRS Int. J. Geo-Inf. 2019, 8, 94. [Google Scholar] [CrossRef] [Green Version]
- Salvatici, T.; Tofani, V.; Rossi, G.; D’Ambrosio, M.; Tacconi Stefanelli, C.; Masi, E.B.; Rosi, A.; Pazzi, V.; Vannocci, P.; Petrolo, M.; et al. Application of a physically based model to forecast shallow landslides at a regional scale. Nat. Hazards Earth Syst. Sci. 2018, 18, 1919–1935. [Google Scholar] [CrossRef] [Green Version]
- Wang, Q.; Guo, Y.; Li, W.; He, J.; Wu, Z. Predictive modeling of landslide hazards in Wen County, northwestern China based on information value, weights-of-evidence, and certainty factor. Geomat. Nat. Hazards Risk 2019, 10, 820–835. [Google Scholar] [CrossRef] [Green Version]
- Medina, V.; Hürlimann, M.; Guo, Z.; Lloret, A.; Vaunat, J. Fast physically-based model for rainfall-induced landslide susceptibility assessment at regional scale. Catena 2021, 201, 105213. [Google Scholar] [CrossRef]
- Hürlimann, M.; Guo, Z.; Puig-Polo, C.; Medina, V. Impacts of future climate and land cover changes on landslide susceptibility: Regional scale modelling in the Val d’Aran region (Pyrenees, Spain). Landslides 2022, 19, 99–118. [Google Scholar] [CrossRef]
- Kalantar, B.; Pradhan, B.; Naghibi, S.A.; Motevalli, A.; Mansor, S. Assessment of the effects of training data selection on the landslide susceptibility mapping: A comparison between support vector machine (SVM), logistic regression (LR) and artificial neural networks (ANN). Geomat. Nat. Hazards Risk 2018, 9, 49–69. [Google Scholar] [CrossRef]
- Catani, F.; Lagomarsino, D.; Segoni, S.; Tofani, V. Landslide susceptibility estimation by random forests technique: Sensitivity and scaling issues. Nat. Hazard Earth Syst. Sci. 2013, 13, 2815–2831. [Google Scholar] [CrossRef] [Green Version]
- Althuwaynee, O.F.; Pradhan, B.; Ahmad, N. Landslide susceptibility mapping using decision-tree based CHi-squared automatic interaction detection (CHAID) and Logistic regression (LR) integration. IOP Conf. Ser. Earth Environ. Sci. 2014, 20, 012032. [Google Scholar] [CrossRef] [Green Version]
- Althuwaynee, O.F.; Pradhan, B.; Park, H.-J.; Lee, J.H. A novel ensemble decision tree-based CHi-squared Automatic Interaction Detection (CHAID) and multivariate logistic regression models in landslide susceptibility mapping. Landslides 2014, 11, 1063–1078. [Google Scholar] [CrossRef]
- Bi, R.; Schleier, M.; Rohn, J.; Ehret, D.; Xiang, W. Landslide susceptibility analysis based on ArcGIS and Artificial Neural Network for a large catchment in Three Gorges region, China. Environ. Earth Sci. 2014, 72, 1925–1938. [Google Scholar] [CrossRef]
- Park, S.; Choi, C.; Kim, B.; Kim, J. Landslide susceptibility mapping using frequency ratio, analytic hierarchy process, logistic regression, and artificial neural network methods at the Inje area, Korea. Environ. Earth Sci. 2013, 68, 1443–1464. [Google Scholar] [CrossRef]
- Mondal, S.; Maiti, R. Integrating the analytical hierarchy process (AHP) and the frequency ratio (FR) model in landslide susceptibility mapping of Shiv-khola watershed, Darjeeling Himalaya. Int. J. Disaster Risk Sci. 2013, 4, 200–212. [Google Scholar] [CrossRef] [Green Version]
- Razandi, Y.; Pourghasemi, H.R.; Neisani, N.S.; Rahmati, O. Application of analytical hierarchy process, frequency ratio, and certainty factor models for groundwater potential mapping using GIS. Earth Sci. Inform. 2015, 8, 867–883. [Google Scholar] [CrossRef]
- Hay, G.J.; Castilla, G. Geographic Object-Based Image Analysis (GEOBIA): A new name for a new discipline. In Object-Based Image Analysis; Springer: Berlin/Heidelberg, Germany, 2008. [Google Scholar]
- Li, Y.; Chen, W. Landslide susceptibility evaluation using hybrid integration of evidential belief function and machine learning techniques. Water 2020, 12, 113. [Google Scholar] [CrossRef] [Green Version]
- Zhao, X.; Chen, W. Optimization of computational intelligence models for landslide susceptibility evaluation. Remote Sens. 2020, 12, 2180. [Google Scholar] [CrossRef]
- Banerjee, P.; Ghose, M.K.; Pradhan, R. Analytic Hierarchy Process and Information Value Method based Landslide Susceptibility Mapping and Vehicle Vulnerability Assessment along a highway in Sikkim Himalaya. Arab. J. Geosci. 2018, 11, 1–18. [Google Scholar] [CrossRef]
- Zhao, F.; Meng, X.; Zhang, Y.; Chen, G.; Su, X.; Yue, D. Landslide Susceptibility Mapping of Karakorum Highway Combined with the Application of SBAS-InSAR Technology. Sensors 2019, 19, 2685. [Google Scholar] [CrossRef] [Green Version]
- Hussain, G.; Singh, Y.; Singh, K.; Bhat, G.M. Landslide susceptibility mapping along national highway-1 in Jammu and Kashmir State (India). Innov. Infrastruct. Solut. 2019, 4, 59. [Google Scholar] [CrossRef]
- Anis, Z.; Wissem, G.; Vali, V.; Smida, H.; Essghaier, G.M. GIS-based landslide susceptibility mapping using bivariate statistical methods in North-western Tunisia. Open Geosci. 2019, 11, 708–726. [Google Scholar] [CrossRef]
- Rashid, B.; Iqbal, J. Landslide susceptibility analysis of Karakoram highway using analytical hierarchy process and scoops 3D. J. Mt. Sci. 2020, 17, 1596–1612. [Google Scholar] [CrossRef]
- Pasang, S.; Kubíček, P. Landslide Susceptibility Mapping Using Statistical Methods along the Asian Highway, Bhutan. Geosciences 2020, 10, 430. [Google Scholar] [CrossRef]
- Panchal, S.; Shrivastava, A.K. Landslide hazard assessment using analytic hierarchy process (AHP): A case study of National Highway 5 in India. Ain Shams Eng. J. 2021, 13, 101626. [Google Scholar] [CrossRef]
- Thai Pham, B.; Tien Bui, D.; Prakash, I.; Dholakia, M.B. Landslide Susceptibility Assessment at a Part of Uttarakhand Himalaya, India using GIS–based Statistical Approach of Frequency Ratio Method. Int. J. Eng. Res. Technol. 2015, 4, 338–344. [Google Scholar] [CrossRef]
- Baral, N.; Karna, A.K.; Gautam, S. Landslide Susceptibility Assessment Using Modified Frequency Ratio Model in Kaski District, Nepal. Int. J. Eng. Manag. Res. 2021, 11, 167–177. [Google Scholar] [CrossRef]
- Sur, U.; Singh, P.; Rai, P.K.; Thakur, J.K. Landslide probability mapping by considering fuzzy numerical risk factor (FNRF) and landscape change for road corridor of Uttarakhand, India. Environ. Dev. Sustain. 2021, 23, 13526–13554. [Google Scholar] [CrossRef]
- Das, S.; Sarkar, S.; Kanungo, D.P. GIS-based landslide susceptibility zonation mapping using the analytic hierarchy process (AHP) method in parts of Kalimpong Region of Darjeeling Himalaya. Environ. Monit. Assess. 2022, 194, 234. [Google Scholar] [CrossRef] [PubMed]
- Pradhan, B.; Lee, S. Landslide susceptibility assessment and factor effect analysis: Back propagation artificial neural networks and their comparison with frequency ratio and bivariate logistic regression modeling. Environ. Model. Softw. 2010, 25, 747–759. [Google Scholar] [CrossRef]
- Kumar, R.; Anbalagan, R. Landslide susceptibility zonation in part of Tehri reservoir region using frequency ratio, fuzzy logic and GIS. J. Earth Syst. Sci. 2015, 124, 431–448. [Google Scholar] [CrossRef]
- Khan, H.; Shafique, M.; Khan, M.A.; Bacha, M.A.; Shah, S.U.; Calligaris, C. Landslide susceptibility assessment using frequency ratio, a case study of northern Pakistan. Egypt. J. Remote Sens. Space Sci. 2019, 22, 11–24. [Google Scholar] [CrossRef]
- Mallick, J.; Singh, R.K.; AlAwadh, M.A.; Islam, S.; Khan, R.A.; Qureshi, M.N. GIS-based landslide susceptibility evaluation using fuzzy-AHP multi-criteria decision-making techniques in the Abha Watershed, Saudi Arabia. Environ. Earth Sci. 2018, 77, 276. [Google Scholar] [CrossRef]
- Noorollahi, Y.; Sadeghi, S.; Yousefi, H.; Nohegar, A. Landslide modeling and susceptibility mapping using AHP and fuzzy approaches. Int. J. Hydrol. 2018, 2, 137–148. [Google Scholar] [CrossRef]
- Nachappa, T.G.; Kienberger, S.; Meena, S.R.; Hölbling, D.; Blaschke, T. Comparison and validation of per-pixel and object-based approaches for landslide susceptibility mapping. Geomat. Nat. Hazards Risk 2020, 11, 572–600. [Google Scholar] [CrossRef]
- Chang, D.Y. Application of the extent analysis method on fuzzy AHP. Eur. J. Oper. Res. 1996, 95, 649–655. [Google Scholar] [CrossRef]
- Benz, U.C.; Hofmann, P.; Willhauck, G.; Lingenfelder, I.; Heynen, M. Multi-resolution, object-oriented fuzzy analysis of remote sensing data for GIS-ready information. ISPRS J. Photogramm. Remote Sens. 2004, 58, 239–258. [Google Scholar] [CrossRef]
- Blaschke, T.; Hay, G.J.; Kelly, M.; Lang, S.; Hofmann, P.; Addink, E.; Feitosa, R.Q.; van der Meer, F.; van der Werff, H.; van Coillie, F.; et al. Geographic object-based image analysis–towards a new paradigm. ISPRS J. Photogramm. Remote Sens. 2014, 87, 180–191. [Google Scholar] [CrossRef] [PubMed] [Green Version]
- Lang, S.; Kienberger, S.; Tiede, D.; Hagenlocher, M.; Pernkopf, L. Geons—domain-specific regionalization of space. Cartogr. Geogr. Inf. Sci. 2014, 41, 214–226. [Google Scholar] [CrossRef] [Green Version]
- Khosravi, K.; Panahi, M.; Bui, D.T. Spatial prediction of groundwater spring potential mapping based on an adaptive neuro-fuzzy inference system and metaheuristic optimization. Hydrol. Earth Syst. Sci. 2018, 22, 4771–4792. [Google Scholar] [CrossRef] [Green Version]
- Guzzetti, F.; Mondini, A.C.; Cardinali, M.; Fiorucci, F.; Santangelo, M.; Chang, K.T. Landslide inventory maps: New tools for an old problem. Earth-Sci. Rev. 2012, 112, 42–66. [Google Scholar] [CrossRef] [Green Version]
- Deng, X.; Li, L.; Tan, Y. Validation of spatial prediction models for landslide susceptibility mapping by considering structural similarity. ISPRS Int. J. Geogr. Inf. Syst. 2017, 6, 103. [Google Scholar] [CrossRef] [Green Version]
- Steger, S.; Mair, V.; Kofler, C.; Pittore, M.; Zebisch, M.; Schneiderbauer, S. Correlation does not imply geomorphic causation in data-driven landslide susceptibility modelling—Benefits of exploring landslide data collection effects. Sci. Total Environ. 2021, 776, 145935. [Google Scholar] [CrossRef]
- Marinos, V.; Stoumpos, G.; Papazachos, C. Landslide hazard and risk assessment for a natural gas pipeline project: The case of the Trans Adriatic Pipeline, Albania Section. Geosciences 2019, 9, 61. [Google Scholar] [CrossRef] [Green Version]
- National Remote Sensing Centre (NRSC) Database. Available online: https://www.nrsc.gov.in/EOP_irsdata_DOI/page_1 (accessed on 20 February 2017).
- Indian Meteorological Department (IMD) Database. Available online: https://mausam.imd.gov.in/ (accessed on 15 June 2016).
- National Bureau of Soil Survey (NBSS) Database. Available online: https://nbsslup.icar.gov.in/soil-resource-studiessrs/ (accessed on 20 February 2017).
- Bureau of Indian Standards (BIS) Database. Available online: https://pib.gov.in/PressReleasePage.aspx?PRID=1740656 (accessed on 20 February 2017).
- U.S. Geological Survey (USGS) Database. Available online: https://earthquake.usgs.gov/data/vs30/ (accessed on 15 June 2016).
- Sur, U.; Singh, P. Assessment of Landscape Change of Lesser Himalayan Road Corridor of Uttarakhand, India. J. Landsc. Ecol. 2020, 13, 1–22. [Google Scholar] [CrossRef]
- Zhang, J.; He, P.; Xiao, J.; Xu, F. Risk assessment model of expansive soil slope based on Fuzzy-AHP method and its engineering application. Geomat. Nat. Hazards Risk 2018, 9, 389–402. [Google Scholar] [CrossRef]
- Tien Bui, D.; Pradhan, B.; Revhaug, I.; Nguyen, D.B.; Pham, H.V.; Bui, Q.N. A novel hybrid evidential belief function-based fuzzy logic model in spatial prediction of rainfall-induced shallow landslides in the Lang Son city area (Vietnam). Geomat. Nat. Hazards Risk 2015, 6, 243–271. [Google Scholar] [CrossRef]
- Xu, C.; Xu, X.; Shen, L.; Yao, Q.; Tan, X.; Kang, W.; Ma, S.; Wu, X.; Cai, J.; Gao, M.; et al. Optimized volume models of earthquake-triggered landslides. Sci. Rep. 2016, 6, 29797. [Google Scholar] [CrossRef] [PubMed] [Green Version]
- Liu, S.; Yin, K.; Zhou, C.; Gui, L.; Liang, X.; Lin, W.; Zhao, B. Susceptibility Assessment for Landslide Initiated along Power Transmission Lines. Remote Sens. 2021, 13, 5068. [Google Scholar] [CrossRef]
- Meena, S.R.; Ghorbanzadeh, O.; van Westen, C.J.; Nachappa, T.G.; Blaschke, T.; Singh, R.P.; Sarkar, R. Rapid mapping of landslides in the Western Ghats (India) triggered by 2018 extreme monsoon rainfall using a deep learning approach. Landslides 2021, 18, 1937–1950. [Google Scholar] [CrossRef]
- Chen, W.; Chai, H.; Sun, X.; Wang, Q.; Ding, X.; Hong, H. A GIS-based comparative study of frequency ratio, statistical index and weights-of-evidence models in landslide susceptibility mapping. Arab. J. Geosci. 2016, 9, 1–16. [Google Scholar] [CrossRef]
- Abedini, M.; Tulabi, S. Assessing LNRF, FR, and AHP models in landslide susceptibility mapping index: A comparative study of Nojian watershed in Lorestan province, Iran. Environ. Earth Sci. 2018, 77, 405. [Google Scholar] [CrossRef]
- Li, L.; Lan, H.; Guo, C.; Zhang, Y.; Li, Q.; Wu, Y. A modified frequency ratio method for landslide susceptibility assessment. Landslides 2016, 14, 727–741. [Google Scholar] [CrossRef]
- Althuwaynee, O.F.; Pradhan, B.; Lee, S. A novel integrated model for assessing landslide susceptibility mapping using CHAID and AHP pair-wise comparison. Remote Sens. 2016, 37, 1190–1209. [Google Scholar] [CrossRef]
- Sifa, S.F.; Mahmud, T.; Tarin, M.A.; Haque, D.M.E. Event-based landslide susceptibility mapping using weights of evidence (WoE) and modified frequency ratio (MFR) model: A case study of Rangamati district in Bangladesh. Geol. Ecol. Landsc. 2019, 222–235. [Google Scholar] [CrossRef]
- Saaty, T.L. How to make a decision: The analytic hierarchy process. Eur. J. Oper. Res. 1990, 48, 9–26. [Google Scholar] [CrossRef]
- Ayhan, M.B. A Fuzzy AHP approach for supplier selection problem: A case study in a Gearmotor Company. Intl. J. Manag. Value Supply Chains IJMVSC 2013, 4. [Google Scholar] [CrossRef]
- Laarhoven, P.V.; Pedrycz, W. A fuzzy extension of Saaty’s priority theory. Fuzzy Sets Syst. 1983, 11, 199–227. [Google Scholar] [CrossRef]
- Chen, V.Y.C.; Lien, H.P.; Liu, C.H.; Liou, J.J.H.; Tzeng, G.H.; Yang, L.S. Fuzzy MCDM approach for selecting the best environment-watershed plan. Appl. Soft Comput. 2011, 11, 265–275. [Google Scholar] [CrossRef]
- Feizizadeh, B.; Roodposhti, M.S.; Jankowski, P.; Blaschke, T. A GIS-based extended fuzzy multi-criteria evaluation for landslide susceptibility mapping. Comput. Geosci. 2014, 73, 208–221. [Google Scholar] [CrossRef] [Green Version]
- Shu, H.; Guo, Z.; Qi, S.; Song, D.; Pourghasemi, H.R.; Ma, J. Integrating Landslide Typology with Weighted Frequency Ratio Model for Landslide Susceptibility Mapping: A Case Study from Lanzhou City of Northwestern China. Remote Sens. 2021, 13, 3623. [Google Scholar] [CrossRef]
- Abdi, A.; Bouamrane, A.; Karech, T.; Dahri, N.; Kaouachi, A. Landslide Susceptibility Mapping Using GIS-based Fuzzy Logic and the Analytical Hierarchical Processes Approach: A Case Study in Constantine (North-East Algeria). Geotech. Geol. Eng. 2021, 39, 5675–5691. [Google Scholar] [CrossRef]
- Li, L.; Shi, Z.; Yin, W.; Zhu, D.; Ng, S.L.; Cai, C.; Lei, A. A fuzzy analytic hierarchy process (FAHP) approach to eco-environmental vulnerability assessment for the Danjiangkou Reservoir area, China. Ecol. Model. 2009, 220, 3439–3447. [Google Scholar] [CrossRef]
- Hagenlocher, M.; Kienberger, S.; Lang, S.; Blaschke, T. Implications of spatial scales and reporting units for the spatial modelling of vulnerability to vector-borne diseases. GI_Forum 2014, 197. [Google Scholar]
- Tiede, D.; Lang, S.; Albrecht, F.; Hölbling, D. Object-Based Class Modeling for Cadastre Constrained Delineation of Geo-Objects. Photogramm. Eng. Remote Sens. 2010, 2, 193–202. [Google Scholar] [CrossRef]
- Baatz, M.; Schäpe, A. Multiresolution Segmentation: An Optimization Approach for High Quality Multi-scale Image Segmentation. In Angewandte Geographische Informationsverarbeitung XII; Herbert Wichmann: Heidelberg, Germany, 2000. [Google Scholar]
- Blaschke, T. Object Based Image Analysis for Remote Sensing. ISPRS J. Photogramm. Remote Sens. 2010, 65, 2–16. [Google Scholar] [CrossRef] [Green Version]
- Drăguţ, L.; Csillik, O.; Eisank, C.; Tiede, D. Automated Parameterisation for Multi-Scale Image Segmentation on Multiple Layers. ISPRS J. Photogramm. Remote Sens. 2014, 88, 119–127. [Google Scholar] [CrossRef] [PubMed] [Green Version]
- Kienberger, S.; Lang, S.; Zeil, P. Spatial Vulnerability Units—Expert-Based Spatial Modelling of Socio-Economic Vulnerability in the Salzach Catchment, Austria. Nat. Hazards Earth Syst. Sci. 2009, 9, 767–778. [Google Scholar] [CrossRef]
- Drăguţ, L.; Tiede, D.; Levick, S.R. ESP: A tool to estimate scale parameter for multiresolution image segmentation of remotely sensed data. Int. J. Geogr. Inf. Sci. 2010, 24, 859–871. [Google Scholar] [CrossRef]
- Pourghasemi, H.R.; Rahmati, O. Prediction of the landslide susceptibility: Which algorithm, which precision? Catena 2018, 162, 177–192. [Google Scholar] [CrossRef]
- Qianqian, B.; Yumin, C.; Susa, D.; Qianjiao, W.; Jiaxin, Y.; Jingyi, Z. An improved information value model based on gray clustering for landslide susceptibility mapping. ISPRS Int. J. Geo-Inf. 2017, 6, 18. [Google Scholar] [CrossRef]
- Froude, M.J.; Petley, D. Global fatal landslide occurrence from 2004 to 2016. Nat. Hazards Earth Syst. Sci. 2018, 18, 2161–2181. [Google Scholar] [CrossRef] [Green Version]
- Dikshit, A.; Sarkar, R.; Pradhan, B.; Segoni, S.; Alamri, A.M. Rainfall Induced Landslide Studies in Indian Himalayan Region: A Critical Review. Appl. Sci. 2020, 10, 2466. [Google Scholar] [CrossRef] [Green Version]
- Kanungo, D.P.; Sharma, S. Rainfall thresholds for prediction of shallow landslides around Chamoli-Joshimath region, Garhwal Himalayas, India. Landslides 2014, 11, 629–638. [Google Scholar] [CrossRef]
- Dikshit, A.; Satyam, D.N. Estimation of rainfall thresholds for landslide occurrences in Kalimpong, India. Innov. Infrastruct. Solut. 2018, 3, 24. [Google Scholar] [CrossRef]
- Kumar, V.; Gupta, V.; Jamir, I. Hazard evaluation of progressive Pawari landslide zone, Satluj valley, Himachal Pradesh, India. Nat. Hazards 2018, 93, 1029–1047. [Google Scholar] [CrossRef]
- Anbalagan, R. Landslide hazard evaluation and zonation mapping in mountainous terrain. Eng. Geol. 1992, 32, 269–277. [Google Scholar] [CrossRef]
- Banerjee, A.; Dimri, A.P. Comparative analysis of two rainfall retrieval algorithms during extreme rainfall event: A case study on cloudburst, 2010 over Ladakh (Leh), Jammu and Kashmir. Nat. Hazards 2019, 97, 1357–1374. [Google Scholar] [CrossRef]
- Gupta, P.; Anbalagan, R. Slope stability of Tehri Dam Reservoir Area, India, using landslide hazard zonation (LHZ) mapping. Q. J. Eng. Geol. 1997, 30, 27–36. [Google Scholar] [CrossRef]
- Mathew, J.; Kundu, S.; Kumar, K.V.; Pant, C.C. Hydrologically complemented deterministic slope stability analysis in part of Indian Lesser Himalaya. Geomat. Nat. Hazards Risk 2016, 7, 1557–1576. [Google Scholar] [CrossRef] [Green Version]
- Sarkar, S.; Roy, A.K.; Raha, P. Deterministic approach for susceptibility assessment of shallow debris slide in the Darjeeling Himalayas, India. Catena 2016, 142, 36–46. [Google Scholar] [CrossRef]
- Kanungo, D.; Arora, M.; Gupta, R.; Sarkar, S. Landslide risk assessment using concepts of danger pixels and fuzzy set theory in Darjeeling Himalayas. Landslides 2008, 5, 407–416. [Google Scholar] [CrossRef]
- Ghosh, S.; Carranza, E.J.M.; van Westen, C.J.; Jetten, V.G.; Bhattacharya, D.N. Selecting and weighting spatial predictors for empirical modeling of landslide susceptibility in the Darjeeling Himalayas (India). Geomorphology 2011, 131, 35–56. [Google Scholar] [CrossRef]
- Das, I.; Stein, A.; Kerle, N.; Dadhwal, V.K. Landslide susceptibility mapping along road corridors in the Indian Himalayas using Bayesian logistic regression models. Geomorphology 2012, 179, 116–125. [Google Scholar] [CrossRef]
- Mandal, S.; Mandal, K. Modeling and mapping landslide susceptibility zones using GIS based multivariate binary logistic regression (LR) model in the Rorachu river basin of eastern Sikkim Himalaya, India. Modeling Earth Syst. Environ. 2018, 4, 69–88. [Google Scholar] [CrossRef]
- Ramakrishnan, D.; Singh, T.N.; Verma, A.K.; Gulati, A.; Tiwari, K.C. Soft computing and GIS for landslide susceptibility assessment in Tawaghat area, Kumaon Himalaya, India. Nat. Hazards 2013, 65, 315–330. [Google Scholar] [CrossRef]
- Roy, J.; Saha, S.; Arabameri, A.; Blaschke, T.; Tien Bui, D. A Novel Ensemble Approach for Landslide Susceptibility Mapping (LSM) in Darjeeling and Kalimpong Districts, West Bengal, India. Remote Sens. 2019, 11, 2866. [Google Scholar] [CrossRef] [Green Version]
- Batar, A.K.; Watanabe, T. Landslide Susceptibility Mapping and Assessment Using Geospatial Platforms andWeights of Evidence (WoE) Method in the Indian Himalayan Region: Recent Developments, Gaps, and Future Directions. ISPRS Int. J. Geo-Inf. 2021, 10, 114. [Google Scholar] [CrossRef]
- Ram, P.; Gupta, V. Landslide hazard, vulnerability, and risk assessment (HVRA), Mussoorie township, lesser himalaya, India. Environ. Dev. Sustain. 2022, 24, 473–501. [Google Scholar] [CrossRef]
- Meghanadh, D.; Mauriya, V.K.; Tiwari, A.; Dwivedi, R. A multi-criteria landslide susceptibility mapping using deep multi-layer perceptron network: A case study of Srinagar-Rudraprayag region (India). Adv. Space Res. 2022, 69, 1883–1893. [Google Scholar] [CrossRef]
- Meena, S.R.; Soares, L.P.; Grohmann, C.H.; van Westen, C.; Bhuyan, K.; Singh, R.P.; Floris, M.; Catani, F. Landslide detection in the Himalayas using machine learning algorithms and U-Net. Landslides 2022, 19, 1209–1229. [Google Scholar] [CrossRef]
- Goetz, J.; Brenning, A.; Petschko, H.; Leopold, P. Evaluating machine learning and statistical prediction techniques for landslide susceptibility modeling. Comput. Geosci. 2015, 81, 1–11. [Google Scholar] [CrossRef]
- Schicker, R.; Moon, V. Comparison of bivariate and multivariate statistical approaches in landslide susceptibility mapping at a regional scale. Geomorphology 2012, 161, 40–57. [Google Scholar] [CrossRef]
- Donati, L.; Turrini, M.C. An objective method to rank the importance of the factors pre- disposing to landslides with the GIS methodology: Application to an area of the Apennines (Valnerina; Perugia, Italy). Eng. Geol. 2002, 63, 277–289. [Google Scholar] [CrossRef]


| Thematic Layers | Categories | Data and Sensor (Resolution/Scale/Vintage) | Data Source (Vintage) |
|---|---|---|---|
| Landslide inventory | Landslide records | Cartosat Satellite Image (2.5 m) | National Remote Sensing Centre (NRSC), [75] |
| Linear Imaging Self-Scanning System IV (LISS-IV) (5.8 m), Resourcesat-2 | |||
| Google Earth (2001–2017), Secondary data | Public Works Department (PWD), Geological Survey of India (GSI) portal [4] | ||
| DTM | Digital terrain model (DTM) | Cartosat 2.5 m, LISS IV (5.8 m) | NRSC (2017) [75] |
| Slope | Topographical | DTM (10 m) | NRSC (2017) [75] |
| Slope Aspect | |||
| Altitude/Elevation | |||
| TWI (Topographical wetness index) | |||
| Lithology | Geology | Geological map (1:25,000) | GSI (2015) [4] |
| Proximity to faults | |||
| Proximity to drainages | Hydrological | DTM (10 m), Toposheet (1:50,000) | NRSC (2017), SOI (2010) [75] |
| Stream power index (SPI) | DTM (10 m) | NRSC (2017) [75] | |
| Rainfall | Meteorological | Rainfall records (past 60 years daily rainfall data) | Indian Meteorological Department (IMD) (1947–2017) [76] |
| Soil | Soil | Soil map (1:25,000) | National Bureau of Soil Survey (NBSS) (2010) [77] |
| Seismicity | Seismic | Seismic Zonation map (BIS), Average shear wave velocity at 30 m depth (Vs30) | Bureau of Indian Standards (BIS) (2002) [78] U.S. Geological Survey (2017) [79] |
| NDVI (Normalized Differential Vegetation Index) | Vegetation | LISS4 (5.8 m) | NRSC (2017) [75] |
| Land-use/Land-cover (LULC) | Anthropogenic | ||
| Proximity to road |
| Factor | Unit | Class | Class | Landslide | Frequency Ratio (FR) | MFR | FAHP | Consistency Ratio | |
|---|---|---|---|---|---|---|---|---|---|
| % | % | Weights | Factor Weights | ||||||
| Slope | Degree | 0–10 | 34% | 1% | 0.03 | 0 | 0 | 0.11 | 0.0067 |
| 10–20 | 29% | 7% | 0.23 | 0.02 | 0.01 | ||||
| 20–35 | 4% | 2% | 0.56 | 0.06 | 0.03 | ||||
| 35–50 | 27% | 46% | 1.74 | 0.18 | 0.03 | ||||
| 50–89 | 6% | 44% | 7.26 | 0.74 | 0.04 | ||||
| Aspect | Class | Flat | 5% | 0% | 0 | 0 | 0.003 | 0.093 | 0.003 |
| North | 13% | 0% | 0 | 0 | 0.01 | ||||
| NE and NW | 33% | 1% | 0.02 | 0 | 0.014 | ||||
| S and SW | 5% | 54% | 10.18 | 0.82 | 0.025 | ||||
| E and SE | 23% | 9% | 0.38 | 0.03 | 0.018 | ||||
| SE | 20% | 37% | 1.8 | 0.15 | 0.023 | ||||
| 39–500 | 8% | 0% | 0.014 | 0 | 0.006 | ||||
| Altitude | Meter | 500–1000 | 21% | 44% | 2.056 | 0.64 | 0.008 | 0.055 | 0.002 |
| 1000–1500 | 51% | 56% | 1.103 | 0.34 | 0.013 | ||||
| 1500–2000 | 8% | 0% | 0.032 | 0.01 | 0.013 | ||||
| 2000–2660 | 12% | 0% | 0 | 0 | 0.015 | ||||
| Road Buffer | Meter | <100 | 53% | 60% | 1.12 | 0.15 | 0.03 | 0.09 | 0.004 |
| 100–200 | 6% | 21% | 3.54 | 0.49 | 0.03 | ||||
| 200–300 | 7% | 16% | 2.28 | 0.31 | 0.02 | ||||
| 300–400 | 9% | 3% | 0.33 | 0.05 | 0.01 | ||||
| 400–500 | 11% | 0% | 0 | 0 | 0 | ||||
| >500 | 14% | 0% | 0.02 | 0 | 0 | ||||
| Drainage Buffer | Meter | <100 | 31% | 17% | 0.539 | 0.1 | 0.031 | 0.077 | 0.003 |
| 100–200 | 14% | 24% | 1.704 | 0.31 | 0.026 | ||||
| 200–300 | 16% | 20% | 1.22 | 0.22 | 0.016 | ||||
| 300–400 | 18% | 17% | 0.96 | 0.17 | 0.004 | ||||
| >400 | 20% | 22% | 1.079 | 0.2 | 0 | ||||
| Seismicity | m/s2 | 3.5–3.58 | 17% | 16% | 0.96 | 0.18 | 0 | 0.03 | 0.002 |
| 3.59–3.64 | 19% | 53% | 2.76 | 0.52 | 0 | ||||
| 3.65–3.71 | 19% | 11% | 0.59 | 0.11 | 0.01 | ||||
| 3.72–3.77 | 20% | 20% | 0.98 | 0.19 | 0.01 | ||||
| 3.78–3.84 | 25% | 0% | 0 | 0 | 0.01 | ||||
| SPI | Ratio | 10–20 | 86% | 93% | 1.08 | 0.67 | 0.007 | 0.01 | 0.002 |
| 0–10 | 14% | 7% | 0.53 | 0.33 | 0.003 | ||||
| Distance to faults(m) | Meter | 300–400 | 32% | 21% | 0.66 | 0.14 | 0.03 | 0.069 | 0.003 |
| <100 | 7% | 5% | 0.72 | 0.16 | 0.024 | ||||
| 100–200 | 15% | 2% | 0.13 | 0.03 | 0.013 | ||||
| 200–300 | 23% | 8% | 0.37 | 0.08 | 0.002 | ||||
| >400 | 23% | 63% | 2.73 | 0.59 | 0 | ||||
| Rainfall | mm | 1297–1325 | 24% | 0% | 0 | 0 | 0.002 | 0.104 | 0.003 |
| 1326–1350 | 17% | 6% | 0.37 | 0.07 | 0.011 | ||||
| 1351–1374 | 20% | 19% | 0.94 | 0.19 | 0.022 | ||||
| 1375- 1397 | 17% | 14% | 0.81 | 0.17 | 0.032 | ||||
| 1398–1419 | 22% | 61% | 2.8 | 0.57 | 0.037 | ||||
| TWI | Ratio | 0–4 | 71% | 83% | 1.16 | 0.51 | 0.019 | 0.029 | 0.004 |
| 4–8 | 25% | 16% | 0.65 | 0.29 | 0.01 | ||||
| 8–12 | 2% | 1% | 0.29 | 0.13 | 0 | ||||
| 12–16 | 2% | 0% | 0.16 | 0.07 | 0 | ||||
| NDVI | Ratio | 0.50–0.76 | 11% | 0% | 0.02 | 0 | 0 | 0.099 | 0.005 |
| 0.40–0.50 | 21% | 0% | 0.02 | 0 | 0.011 | ||||
| 0.3–0.40 | 36% | 9% | 0.26 | 0.02 | 0.021 | ||||
| 0.2–0.3 | 28% | 57% | 2.01 | 0.16 | 0.03 | ||||
| <0.20 | 3% | 33% | 10.52 | 0.82 | 0.037 | ||||
| Soil | Class | Moderately shallow loamy skeletal soils (excessively drained found on moderately steep slopes) | 14% | 0% | 0.02 | 0.01 | 0.001 | 0.047 | 0.002 |
| Moderately deep loamy skeletal soils (excessively drained found on moderately steep slopes) | 18% | 0% | 0 | 0 | 0.009 | ||||
| Moderately deep coarse loamy soils (well drained found on moderate slopes) | 3% | 3% | 0.89 | 0.37 | 0.016 | ||||
| Moderately shallow coarse loamy soils (excessively drained found on steep slopes) | 65% | 97% | 1.5 | 0.62 | 0.021 | ||||
| Lithology | Class | Slates (carbonaceous), Quartzite, Stomatolite, Dolomite, and Limestone, micaceous sand with pebbles | 9% | 3% | 0.29 | 0.15 | 0.028 | 0.104 | 0.004 |
| Carbonaceous shale, Slate, Greywacke, Clay, Sand, Gravel and Boulders | 29% | 6% | 0.2 | 0.1 | 0.007 | ||||
| Greywacke, Quartzite, Dolomite, Shale, Dolerite, Limestone, greywacke Conglomerate | 62% | 92% | 1.48 | 0.75 | 0.069 | ||||
| LULC | Class | River | 0% | 0% | 0 | 0 | 0 | 0.083 | 0.007 |
| Sandy area | 0% | 0% | 0 | 0 | 0.001 | ||||
| Settlement | 1% | 0% | 0 | 0 | 0 | ||||
| Dense Veg | 34% | 0% | 0.01 | 0 | 0.007 | ||||
| Plantation | 0% | 0% | 0 | 0 | 0.008 | ||||
| Agriculture | 9% | 0% | 0 | 0 | 0.003 | ||||
| Sparse Veg | 17% | 13% | 0.76 | 0.02 | 0.013 | ||||
| Rocky and Barren land | 0% | 5% | 22.1 | 0.63 | 0.019 | ||||
| Mining | 0% | 0% | 9.95 | 0.29 | 0.02 | ||||
| Open and Scrub land | 39% | 82% | 2.08 | 0.06 | 0.012 | ||||
Publisher’s Note: MDPI stays neutral with regard to jurisdictional claims in published maps and institutional affiliations. |
© 2022 by the authors. Licensee MDPI, Basel, Switzerland. This article is an open access article distributed under the terms and conditions of the Creative Commons Attribution (CC BY) license (https://creativecommons.org/licenses/by/4.0/).
Share and Cite
Sur, U.; Singh, P.; Meena, S.R.; Singh, T.N. Predicting Landslides Susceptible Zones in the Lesser Himalayas by Ensemble of Per Pixel and Object-Based Models. Remote Sens. 2022, 14, 1953. https://doi.org/10.3390/rs14081953
Sur U, Singh P, Meena SR, Singh TN. Predicting Landslides Susceptible Zones in the Lesser Himalayas by Ensemble of Per Pixel and Object-Based Models. Remote Sensing. 2022; 14(8):1953. https://doi.org/10.3390/rs14081953
Chicago/Turabian StyleSur, Ujjwal, Prafull Singh, Sansar Raj Meena, and Trilok Nath Singh. 2022. "Predicting Landslides Susceptible Zones in the Lesser Himalayas by Ensemble of Per Pixel and Object-Based Models" Remote Sensing 14, no. 8: 1953. https://doi.org/10.3390/rs14081953