Article

Performance Evaluation of Feature Matching Techniques for Detecting Reinforced Soil Retaining Wall Displacement

Department of Ocean Engineering, Pukyong National University, Busan 48513, Korea
*
Author to whom correspondence should be addressed.
Remote Sens. 2022, 14(7), 1697; https://doi.org/10.3390/rs14071697
Submission received: 22 February 2022 / Revised: 23 March 2022 / Accepted: 30 March 2022 / Published: 31 March 2022
(This article belongs to the Topic Computational Intelligence in Remote Sensing)

Abstract

:
Image registration technology is widely applied in various matching methods. In this study, we aim to evaluate the feature matching performance and to find an optimal technique for detecting three types of behaviors—facing displacement, settlement, and combined displacement—in reinforced soil retaining walls (RSWs). For a single block with an artificial target and a multiblock structure with artificial and natural targets, five popular detectors and descriptors—KAZE, SURF, MinEigen, ORB, and BRISK—were used to evaluate the resolution performance. For comparison, the repeatability, matching score, and inlier matching features were analyzed based on the number of extracted and matched features. The axial registration error (ARE) was used to verify the accuracy of the methods by comparing the position between the estimated and real features. The results showed that the KAZE method was the best detector and descriptor for RSWs (block shape target), with the highest probability of successfully matching features. In the multiblock experiment, the block used as a natural target showed similar matching performance to that of the block with an artificial target attached. Therefore, the behaviors of RSW blocks can be analyzed using the KAZE method without installing an artificial target.

1. Introduction

Since the concept of reinforced earth was proposed by Vidal in the late 1950s [1], reinforced soil retaining walls (RSWs) have been widely used, owing to their low cost and rapid construction. A general safety inspection is carried out at least two times a year, and a precision safety inspection is conducted once every 1–3 years, according to the Special Acts On Safety Control And Maintenance Of Establishments [2], to inspect the physical condition of RSWs. However, RSWs frequently collapse, owing to heavy rainfall or dynamic loads, such as those produced during earthquakes. It is very difficult to detect the risk of an unexpected collapse of RSWs through a periodic safety inspection. Several RSWs that were diagnosed as safe (Grade B—no risk of collapse, management required) collapsed within 6 months after safety inspections (e.g., one in Gwangju in 2015 and one in Busan in 2020 [3,4]). Therefore, a real-time or continuous safety monitoring system is necessary for detecting RSW collapse, which is hard to detect with only periodic safety inspections [5,6].
Various studies have been conducted to analyze the behavior of RSWs using a strain gauge, displacement sensor, inclinometer, and pore water pressure sensor [7,8,9,10]. However, these experimental approaches only monitor a specific location in RSWs where sensors were installed. In addition, numerous sensors and considerable effort are required to measure the overall behavior of RSWs, resulting in inefficiency in terms of cost and labor. Therefore, this study was carried out as a pilot-phase experiment to analyze the overall behavior of structures based on images and to overcome the abovementioned disadvantages of current monitoring methods. The analysis of the RSW behavior can be divided into the matching procedure of the target and the calculation procedure of the displacement based on the matching result. The matching procedure finds and matches identical points between image pairs, and the calculation procedure calculates displacement from the changes in the pixels. In this study, we focused on the matching procedure. A feature matching technique was applied to accurately match the target before and after the behavior.
With the continuous development of image processing technologies, feature matching techniques have been widely applied across various fields, such as biomedical image registration [11,12,13,14], unmanned aerial vehicle (UAV) image registration [15], and geographic information systems (GISs) [16,17,18]). Additionally, a fusion study of feature and machine learning technology was performed in the field of vehicle matching [19]. Feature matching techniques show high-resolution image pairing performance between different scales, transformations, rotations, and three-dimensional (3D) projections of transformed objects in images. Tareen and Saleem [20] matched buildings and background images with overlapping parts using this technique. Image matching results were evaluated based on the changes in size, rotation, and viewpoint. SIFT, SURF, and BRISK are scale-invariant feature detectors. ORB and BRISK were invariant to affine change, and SIFT had the highest overall accuracy. Pieropan et al. [21] applied several methods to track moving elements in images based on specificity, tracking accuracy, and tracking performance. Here, AKAZE and SIFT showed high performance when detecting the deformations of small objects. Moreover, ORB and BRISK showed high performance when sequences with significant motion blur were matched. Mikolajczyk and Schmid [22] evaluated the performance of descriptors based on various image states, targets, and transforms. Their results showed that GLOH and SIFT had excellent performance. Chien et al. [23] evaluated feature performance on KITTI benchmark datasets produced using monocular visual odometry. SURF, AKAZE, and SIFT showed excellent performances in each condition of the interframe and accumulated drift errors and the segmented motion error on the translational and rotational components. Previous studies indicated that different feature matching methods should be applied according to the feature extraction and matching conditions (i.e., type of target, change of scale, and rotation). In addition, various studies have been conducted to select optimal feature matching techniques with different types of targets and transforms. Therefore, it is necessary to select an optimal feature detector and descriptor with the best performance to accurately evaluate RSW behavior through image processing.
The use of remote sensing methods in combination with high-resolution image recording technology could allow for the continuous evaluation of structure movement and displacement behavior. Feng et al. [24] used a template matching method to analyze the time-lapse displacement of attached arbitrary targets on railway and pedestrian bridges. Apparent targets (i.e., patterns, features, and textures) of the surrounding features enable easier comparison of structure images in different states and times. Lee and Shinozuka [25] measured the dynamic displacement of target panels attached to bridges and piers through texture recognition techniques from motion pictures. Choi et al. [26] carried out deformation interpretation of the artificial target (AT) to reference two-story steel frames taken by a dynamic displacement vision system. However, a critical limitation of these techniques was that only a local movement near the AT could be detected.
Therefore, in this study, the RSW behavior was simulated through single- and multiblock laboratory experiments to determine the most efficient feature matching method for the RSW structure. A facing of a block with a sheet target was defined as the AT, and a block face without an additional pattern was defined as the natural target (NT). Five feature matching methods were applied to the single-block experiment with ATs and the multiblock experiment with ATs and NTs. Furthermore, the usability of NTs in the multiblock experiment was evaluated by comparing the performance of four NTs with that of ATs. Through this analysis, we determined a feature matching technique that analyzes NTs similar to the performance of analyzing ATs.

2. Background and Objectives

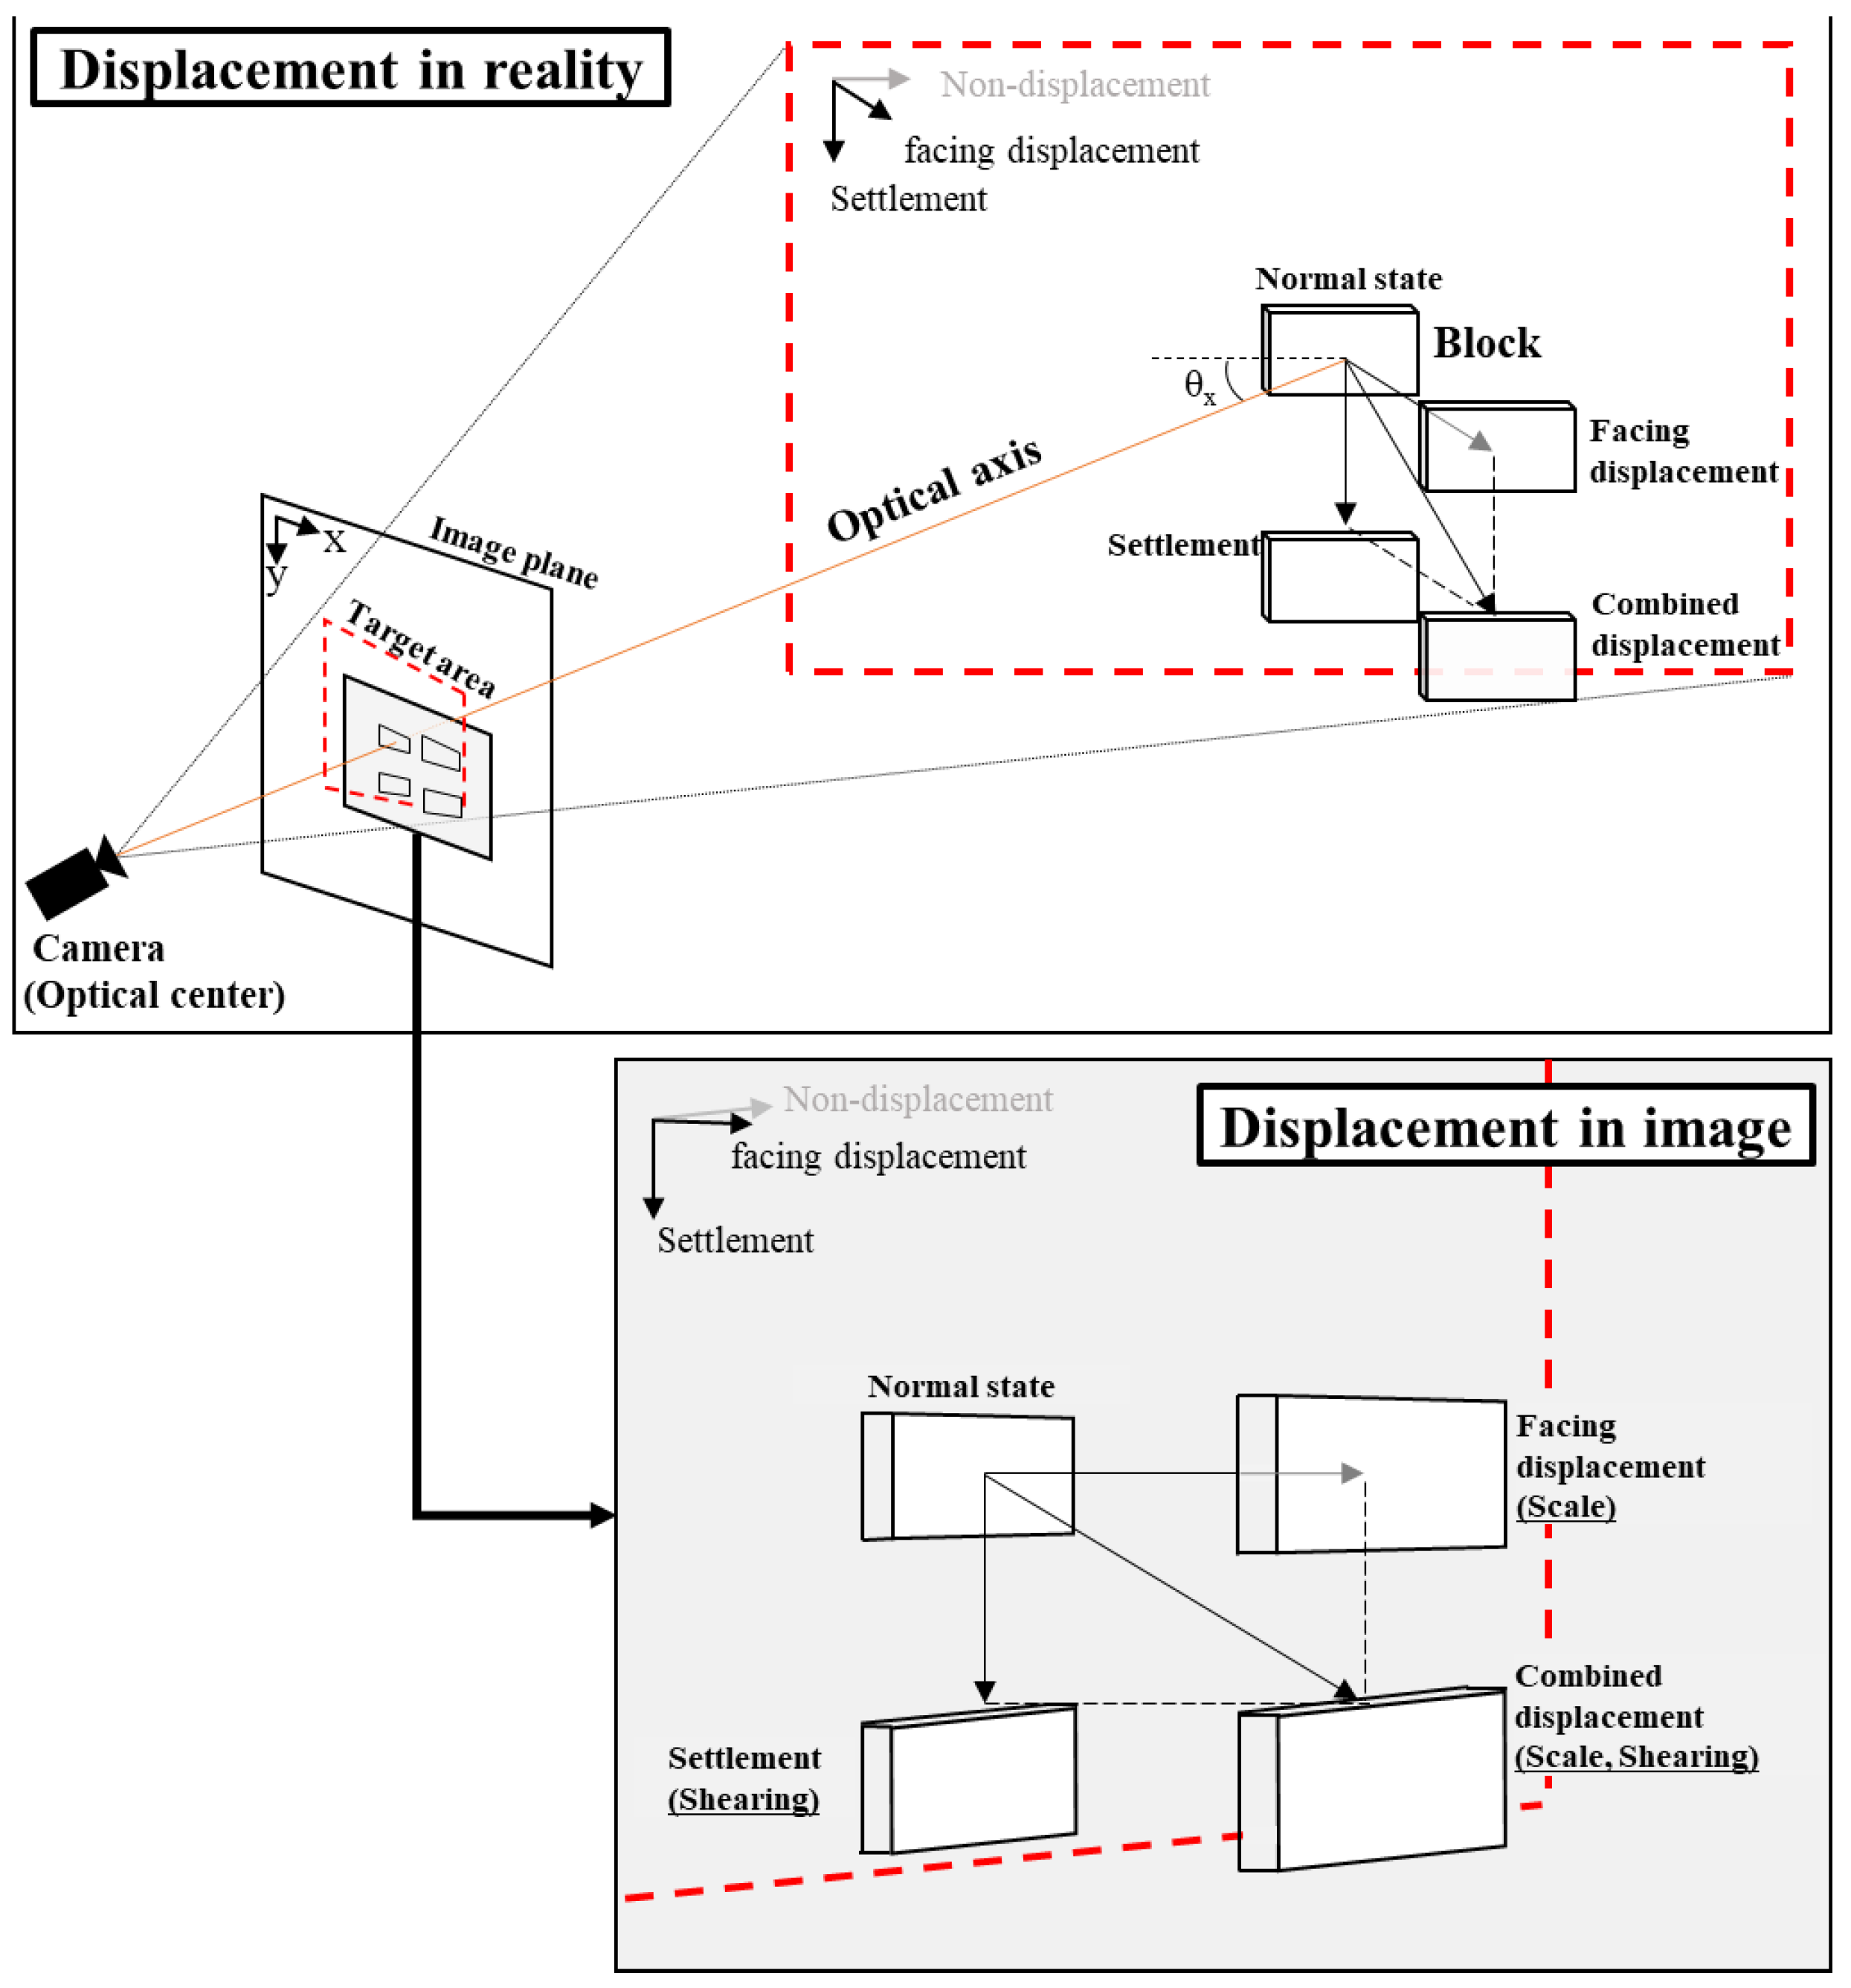
2.1. Behavior of RSW

A single point existing in the 3D space can be moved in all directions. However, a specific behavior only occurs predominantly in the case of a geotechnical structure, such as an RSW, that was constructed continuously in the lateral direction. Berg et al. [27] specified the measurement of the facing displacement and settlement of RSWs to evaluate both the internal and external stabilities during the design and construction stage. Koerner and Koerner [28] investigated the collapse of 320 geosynthetically reinforced, mechanically stabilized earth (MSE) walls worldwide due to facing displacement and settlement caused by surcharge and infiltration. Therefore, facing displacement (corresponding to the bulging type), settlement, and their combined displacement were considered in this study. Horizontal displacements in the lateral direction were excluded because they hardly occurred based on the nature of the RSW.

2.2. Feature Detection and Matching

Feature detection and matching techniques were used to detect the features of target regions in image pairs and to match the features presumed to be identical to the detected features, respectively. These technologies are widely used in various computer machine vision fields, such as object detection, object tracking, and augmented reality [20]. As applications expand, various methods for detecting and matching features have been developed and improved to provide higher accuracy. Feature detection and matching techniques consist of a detector and a descriptor. The detector is used to discover and locate areas of interest in a given image, such as edge and junction. The areas should contain strong signal changes and were used to identify the same area in images captured with different view angles and movement of objects in the image. By contrast, the descriptor provides robust characterization of the detected features. It provides high matching performance through high invariance, even for changes in scale, rotation, and partial affine image transformation of each feature in the image pairs [29].
In this study, we used five methods—MinEigen [30], SURF [31], BRISK [32], ORB [33], and KAZE [34]—provided in MATLAB to evaluate the performance of each feature detector and description algorithm. Feature detection and matching for images before and after the behavior was performed in the following order: (1) set a target for detection and matching analysis in the image, (2) detect target features using each detector and express each feature as a feature vector through each descriptor, and (3) calculate pairwise distances for each feature vector in image pairs. Each feature was matched when the distance between two feature vectors was less than the matching threshold (a matching threshold of 10 was applied to binary feature vectors, such as MinEigen, ORB, and BRISK, and a matching threshold of 1 was employed for KAZE and SURF). Moreover, the sum of squared differences (SSD) method was used to evaluate the feature matching metric for KAZE and SURF, and the Hamming distance was used for binary features, such as MinEigen, ORB, and BRISK. The MSAC algorithm with 100,000 iterations and 99% confidence was used to exclude the outliers and determine the 3 × 3 transformation matrix. The inlier-matched features had to exist within two pixels of the position of the point projected through the transformation matrix.

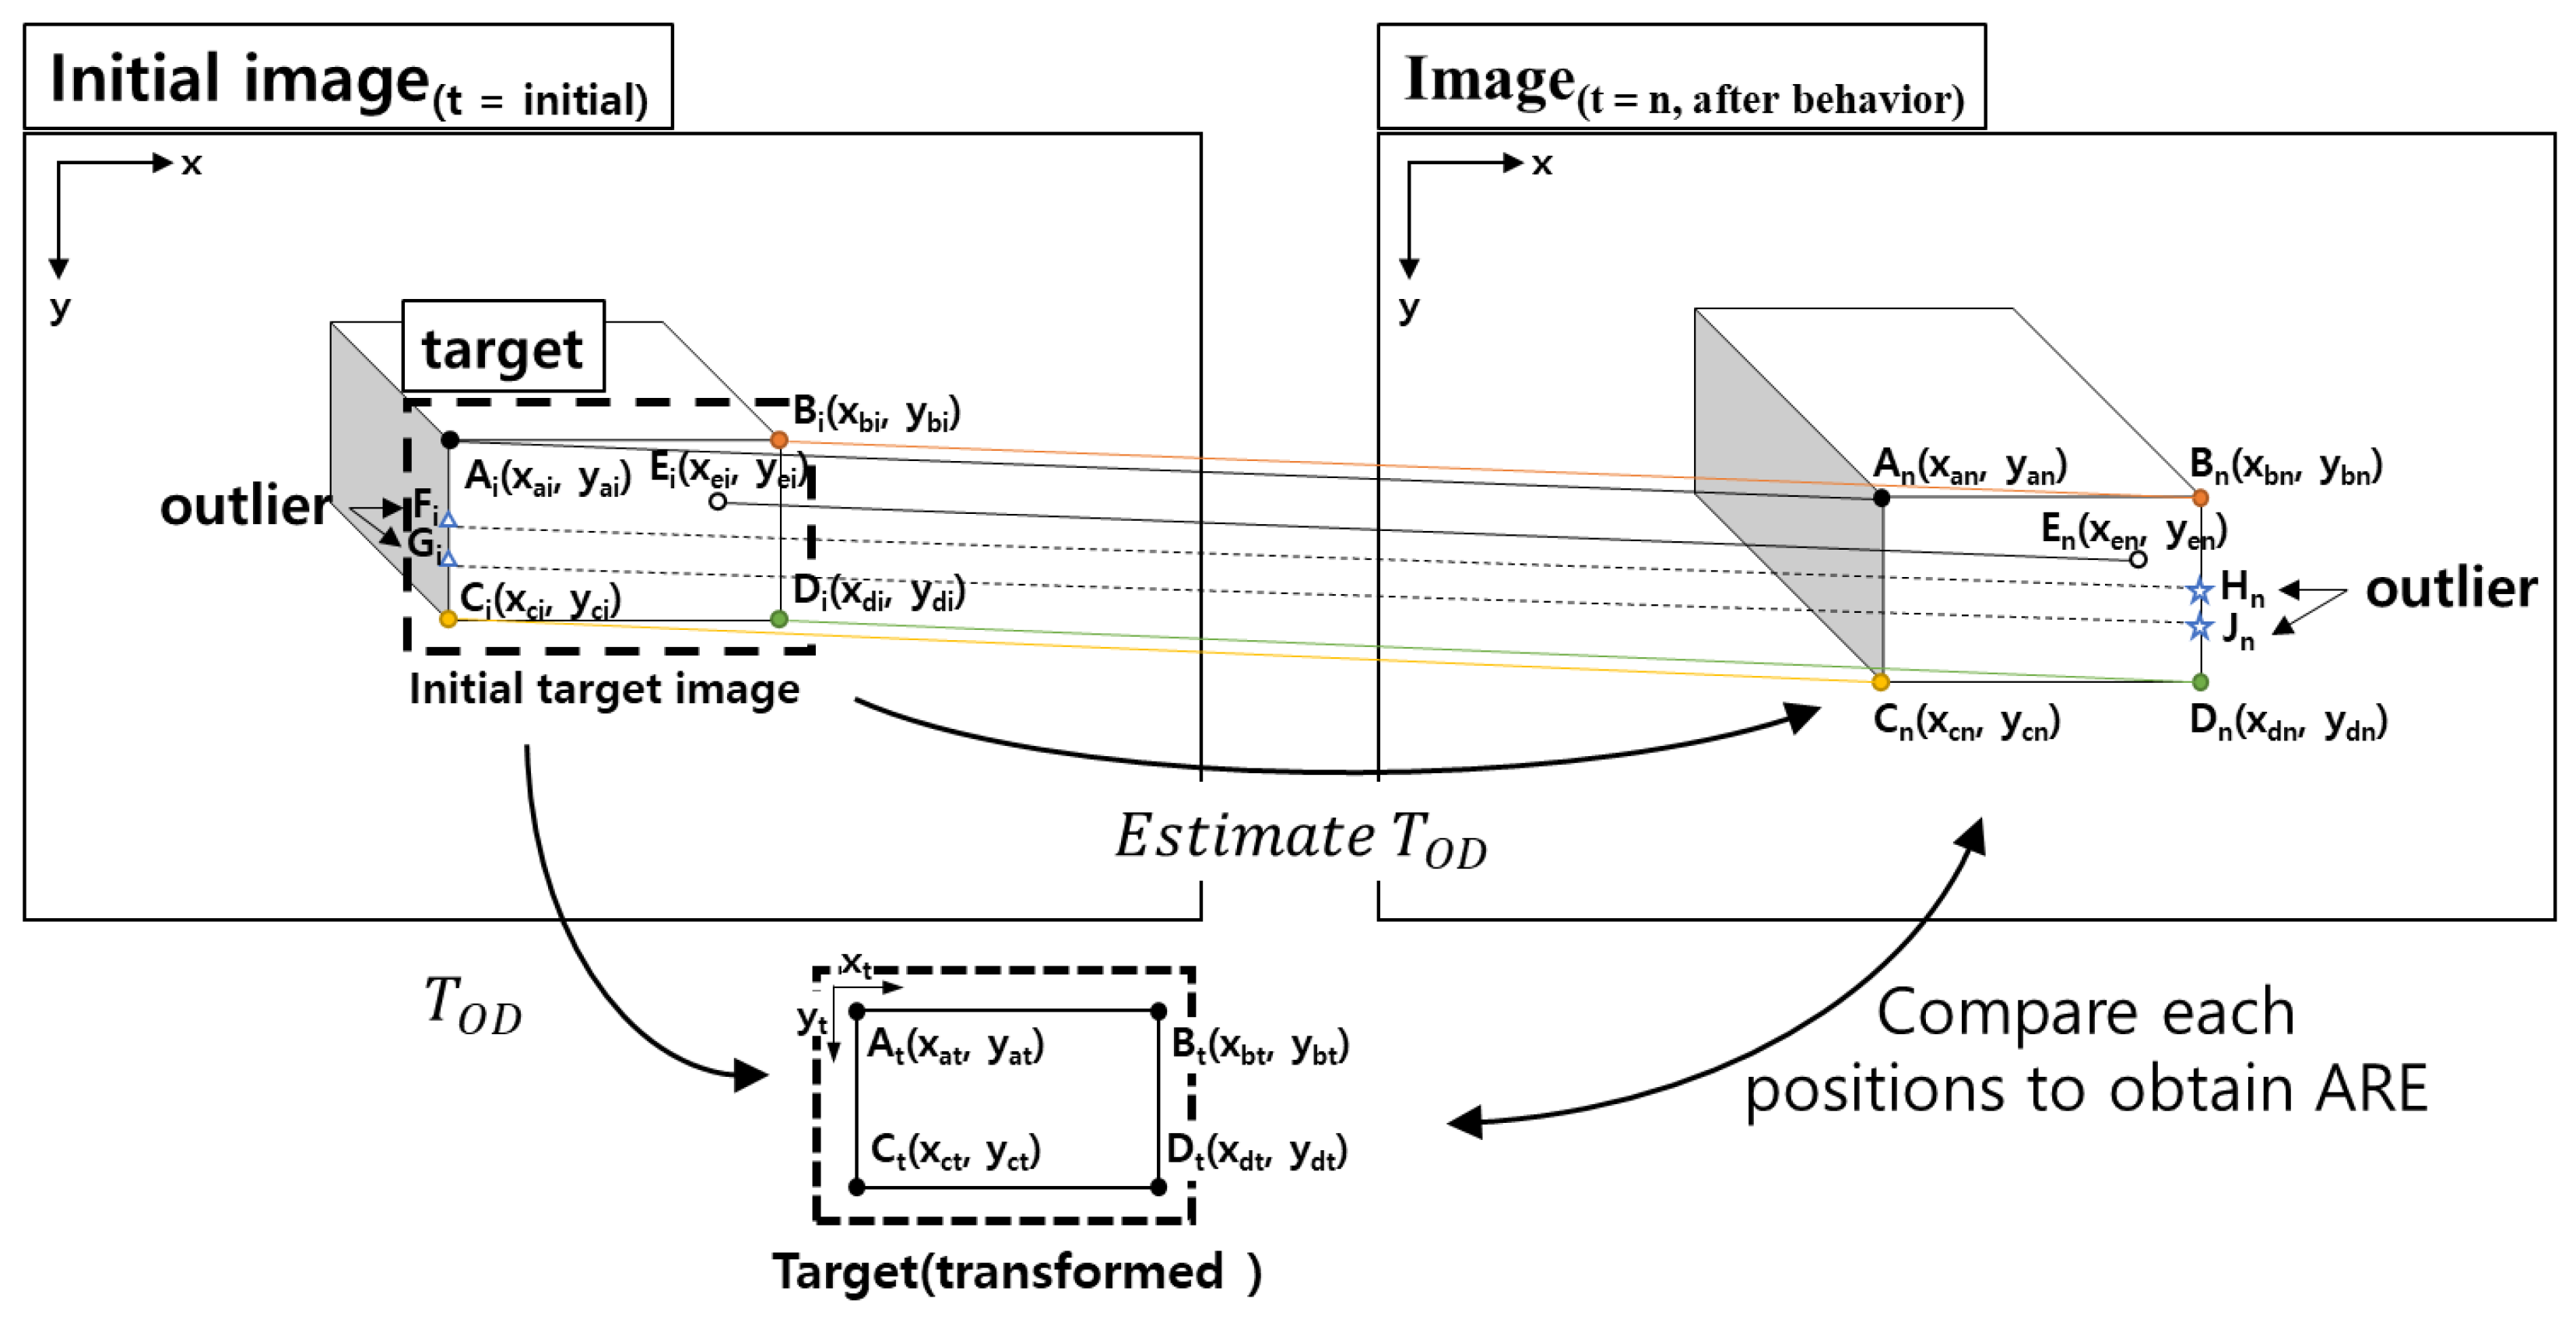
2.3. Feature Performance Evaluation

Various evaluation methods have been suggested to evaluate the performance of feature detection and matching techniques. We analyzed the repeatability and matching score, which were widely used for quantitative evaluation based on features. In addition, the number of inlier features was evaluated to avoid image distortion. Image distortion may occur when the matching technology is not suitable for the image features and matching conditions. Even if the extracted and actual feature vectors have high similarity, distortion may occur if the number of exact matching features is insufficient. Therefore, for successful feature matching, two solutions are used to reduce the matching error and distortion: (1) matching with more precisely matching feature vectors that result in higher similarity and (2) selecting proper feature detectors and descriptors to obtain highly consistent transformation matrices with a large number of inlier matching features. However, the feature vectors of the first solution are inherent properties that do not change unless the image changes. Therefore, in this study, it was not possible to arbitrarily add more feature vectors with higher similarity because specific targets were already selected as the facing of the block. Instead, the second solution could be used by selecting the optimal feature detector and descriptor to obtain a highly consistent transformation matrix with many inlier matching features for the given target.
The repeatability for a pair of images is the number of feature correspondences found between the pair of images divided by a minimum number of features detected in the image pair [35,36]. In this study, feature matching was performed on the target image extracted from the initial state and the entire image in which the behavior occurs. Because the minimum number of features were always detected in the former, the number of features in the target image at initial was used as the denominator.
Repeatability = No .   of   matching   features No .   of   detected   features ( in   target   image   at   initial )
The matching score is the average ratio between ground truth correspondences and the number of detected features in a shared viewpoint region [36,37,38]. Moreover, repeatability focuses on finding the same feature in two image pairs. Further, the matching score indicates how accurate matching is performed by excluding outliers. Matching scores of 1 and 0 indicate that the matched features are perfectly inlier and perfectly outlier, respectively.
Matching   score   = No .   of   inlier   matching   features No .   of   detected   features ( in   target   image   at   initial )
The number of inlier matching features represents the number of features from which the outlier matching features have been removed among the matching features. More accurate matching can be performed when estimating the transformation using more inlier matching features.
Registration error is used to quantify the error when images (e.g., CT and MRI images) are matched [39,40]. It is used as a criterion for evaluating the matching performance in various forms, such as target registration error (TRE), landmark registration error (LRE), and mean of target registration error (mTRE). All registration errors calculate the error for each feature in the image plane based on their locations. However, it is difficult to express the error in a shape change of a block occurring in 3D space. Therefore, in this study, we proposed ARE to quantify the error of the x-axis (upper and lower edges of block) and y-axis (left and right edges of the block) during the matching between the images before and after the behavior. Figure 1 shows an example of the features and vertices for calculating TRE and ARE. The inlier matching features (in the initial imaget=initial) at the front of the block were defined as Ai, Bi, Ci, Di, and Ei. Meanwhile, the inlier matching features (in the imaget=n) at the front of the block were defined as An, Bn, Cn, Dn, and En. The transformation matrix (TOD) was calculated using the pairs of the inlier matching features in the image pair, and the transformed target was derived by applying the transformation matrix to the target in the initial image. The outlier matching features were defined as Fi, Gi, Hn, and Jn in the images. Ai,n, Bi,n, Ci,n, Di,n, and Ei,n in the image pair are correctly estimated and matched inlier features by feature matching, and Fi, Gi, Hn, and Jn are the mismatched outlier features. The TRE calculates the registration error for each matching point as follows:
TRE ( A ) = | T O D A i A n |   TRE ( B ) = | T O D B i B n |   TRE ( C ) = | T O D C i C n |   TRE ( D ) = | T O D D i D n |   TRE ( E ) = | T O D E i E n |   ]
Different features may be extracted and matched depending on the type of feature detector and descriptor. Thus, the features may not be extracted and matched at the desired location, such as vertices, and it is difficult to quantify the registration error for the block shape with TRE. Therefore, ARE must be used to calculate the registration error for the block shape based on locations of vertices. All vertices were manually selected to exactly represent the block shape. The derivation of the ARE is given by Equations (4) and (5).
ARE h 1 = | T O D A i T O D B i | | A n B n | = | A t B t | | A n B n | ARE v 1 = | A t C t | | A n C n | ARE h 2 = | C t D t | | C n D n | ARE v 2 = | B t D t | | B n D n | ]
ARE h = ARE h 1 + ARE h 2 2 ,   ARE v = ARE v 1 + ARE v 2 2 ,   ARE = ARE h + ARE v 2 .
where TOD is the transformation matrix; A, B, C, and D are the target block vertices of top left, top right, bottom left, and bottom right, respectively; subscripts i, n, and t represent initial image, subsequent image, and transformed image, respectively, as shown in Figure 1; Ei and En are the detected features of the block image at the initial condition and after behavior, respectively; and TOD is estimated through the relationship between imaget=initial and imaget=n of the target. In addition, the transformed target image is obtained by applying TOD to the initial target image, as shown in Figure 1. AREh, AREv, and ARE were calculated by applying Equations (4) and (5) to four vertices in the transformed target and target after the behavior. AREh1 and AREh2 were calculated at the top and bottom sides of the block, respectively, and AREv1 and AREv2 were calculated at the left and right sides of the block, respectively. Based on these values, we quantitatively evaluated the horizontal and vertical errors of the target block. The conversion registration error of the block type can be analyzed intuitively. ARE was calculated by comparing the positions where the transformation matrix was applied and the position of the block after the behavior. The location of each vertex was extracted based on the pixel information of the block in each image.

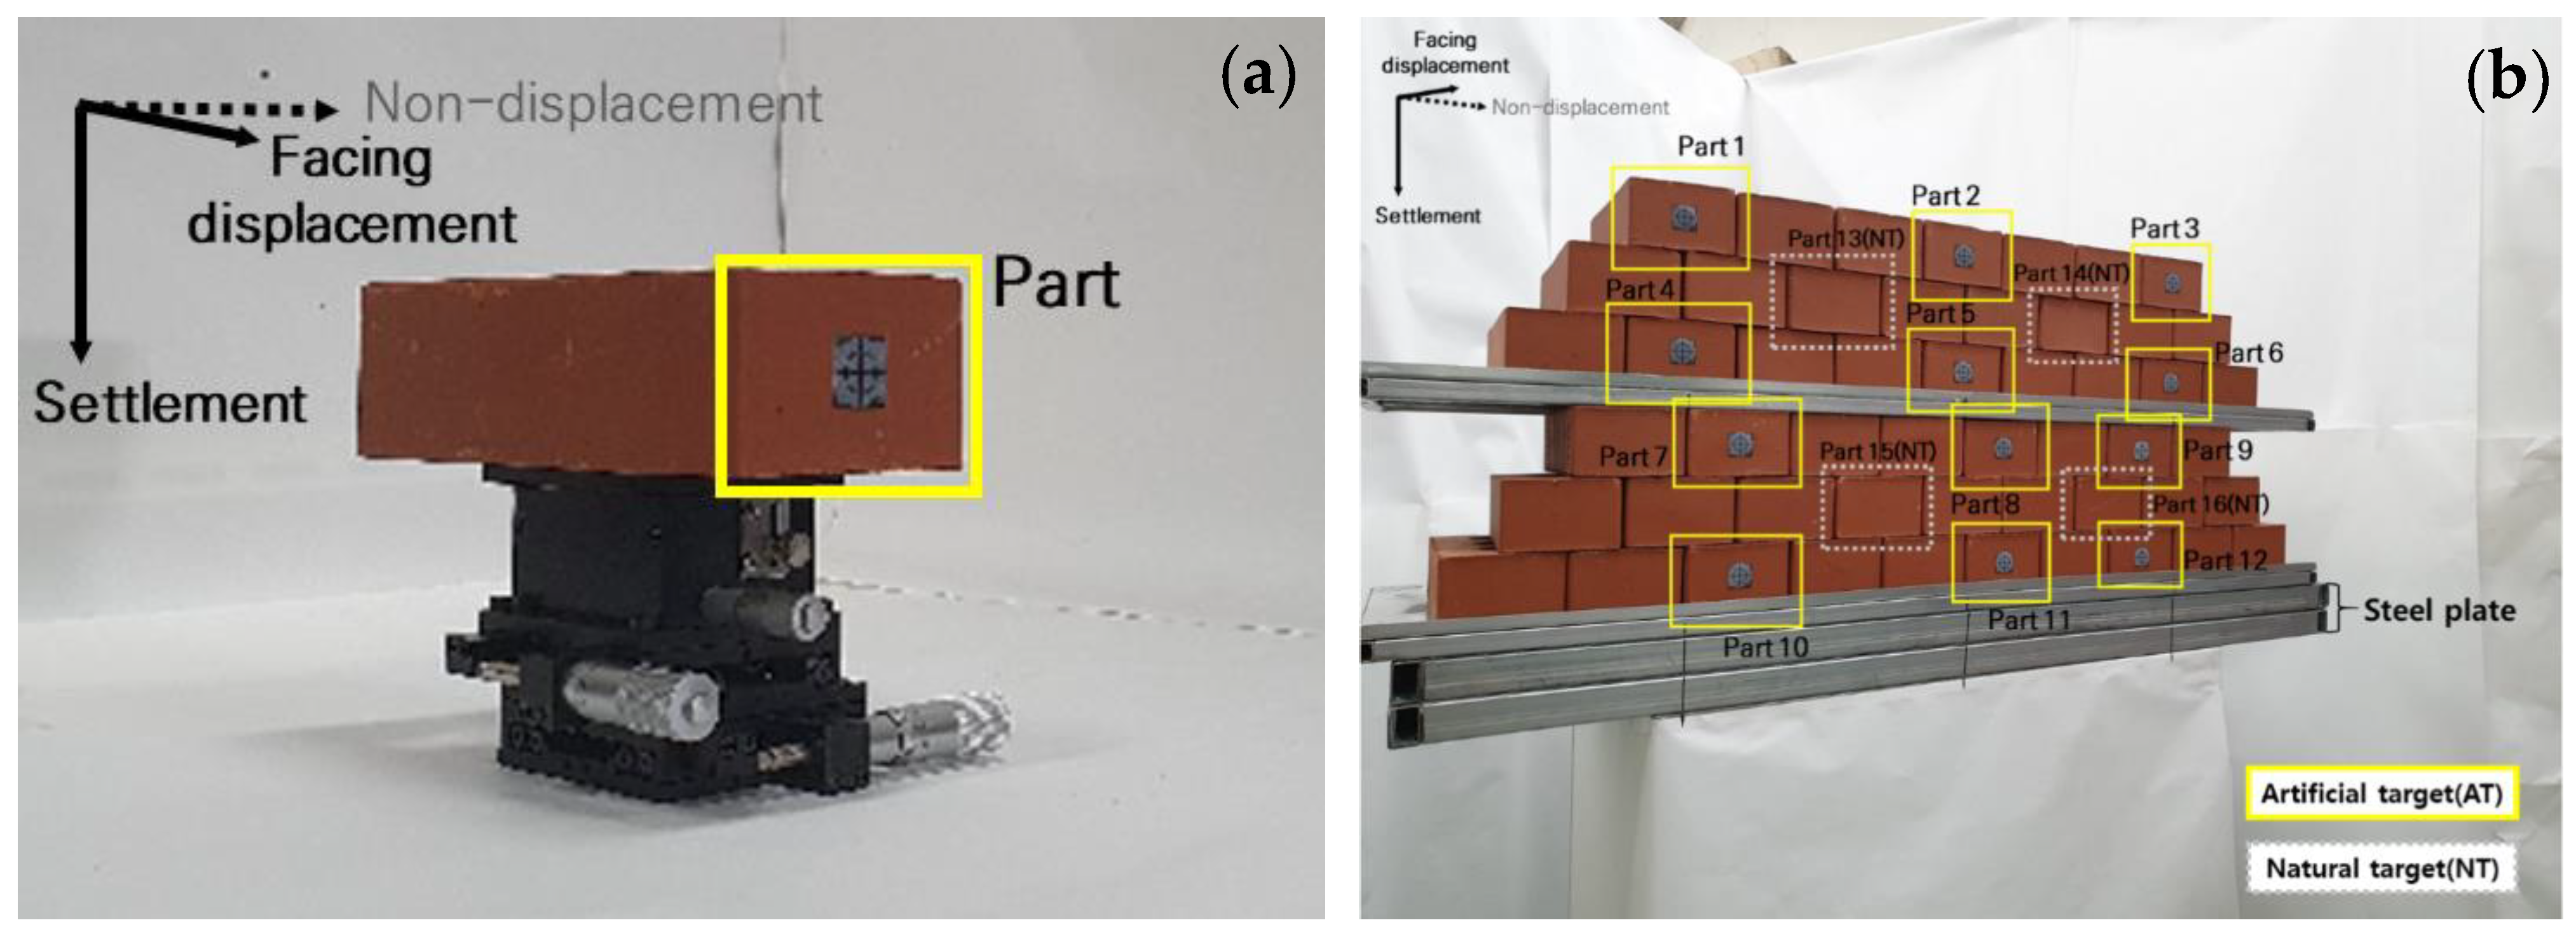
3. Laboratory Experiment

In this study, two experiments were performed to evaluate the performance of feature detection and matching based on the behavior of blocks. Figure 2a,b show the single-block experimental setup for constant displacement on a linear stage and multiblock experiments on a moving table, respectively. In the experiments, a block with a height of 56.5 mm, a width of 89 mm, and a length of 190 mm was used to simulate the facing of the RSW.
The three types of behavior were generated in a single-block experiment, as shown in Figure 2a. Images were taken and analyzed before and after each displacement occurred. Subsequently, the matching performance was analyzed for 12 incident angles between 5° and 85°. The analyses were repeated 10 times under identical conditions to quantify the error. In the multiblock experiment presented in Figure 2b, three types of behaviors were generated similar to that in the single-block experiment. Images were taken and analyzed at the incidence angle that indicated excellent performance in the single-block experiment. To analyze the matching performance of blocks evenly distributed in the image among 51 blocks, 12 block facings with artificial targets were evaluated as AT (parts 1–12). In the case of the RSW structure, the features of a specific target could be confused with those of other blocks in the RSW structure because similar feature vectors are detected in the same blocks. Therefore, AT could be applied for reliable point identification and matching in the image matching method [41]. In addition, several studies reported that specific types of ATs (i.e., metal plate, black circle centered at a cross, roundel, concentric circles, cross, and speckle patterns) should be used to obtain sufficient intensity variations when a region of interest (ROI) is not sufficient [25,26,42,43]. However, because an object with sufficient strength change can be used as an NT without installing a sheet target, four NTs were assigned in the multiblock experiment to verify the usability, as shown in Figure 2b. The matching performance of four NTs was evaluated by comparing the 12 ATs. The best detector and descriptor and the usability of the block as NTs were evaluated when matching based on the behavior of the SRW structure.

4. Experimental Results and Discussion

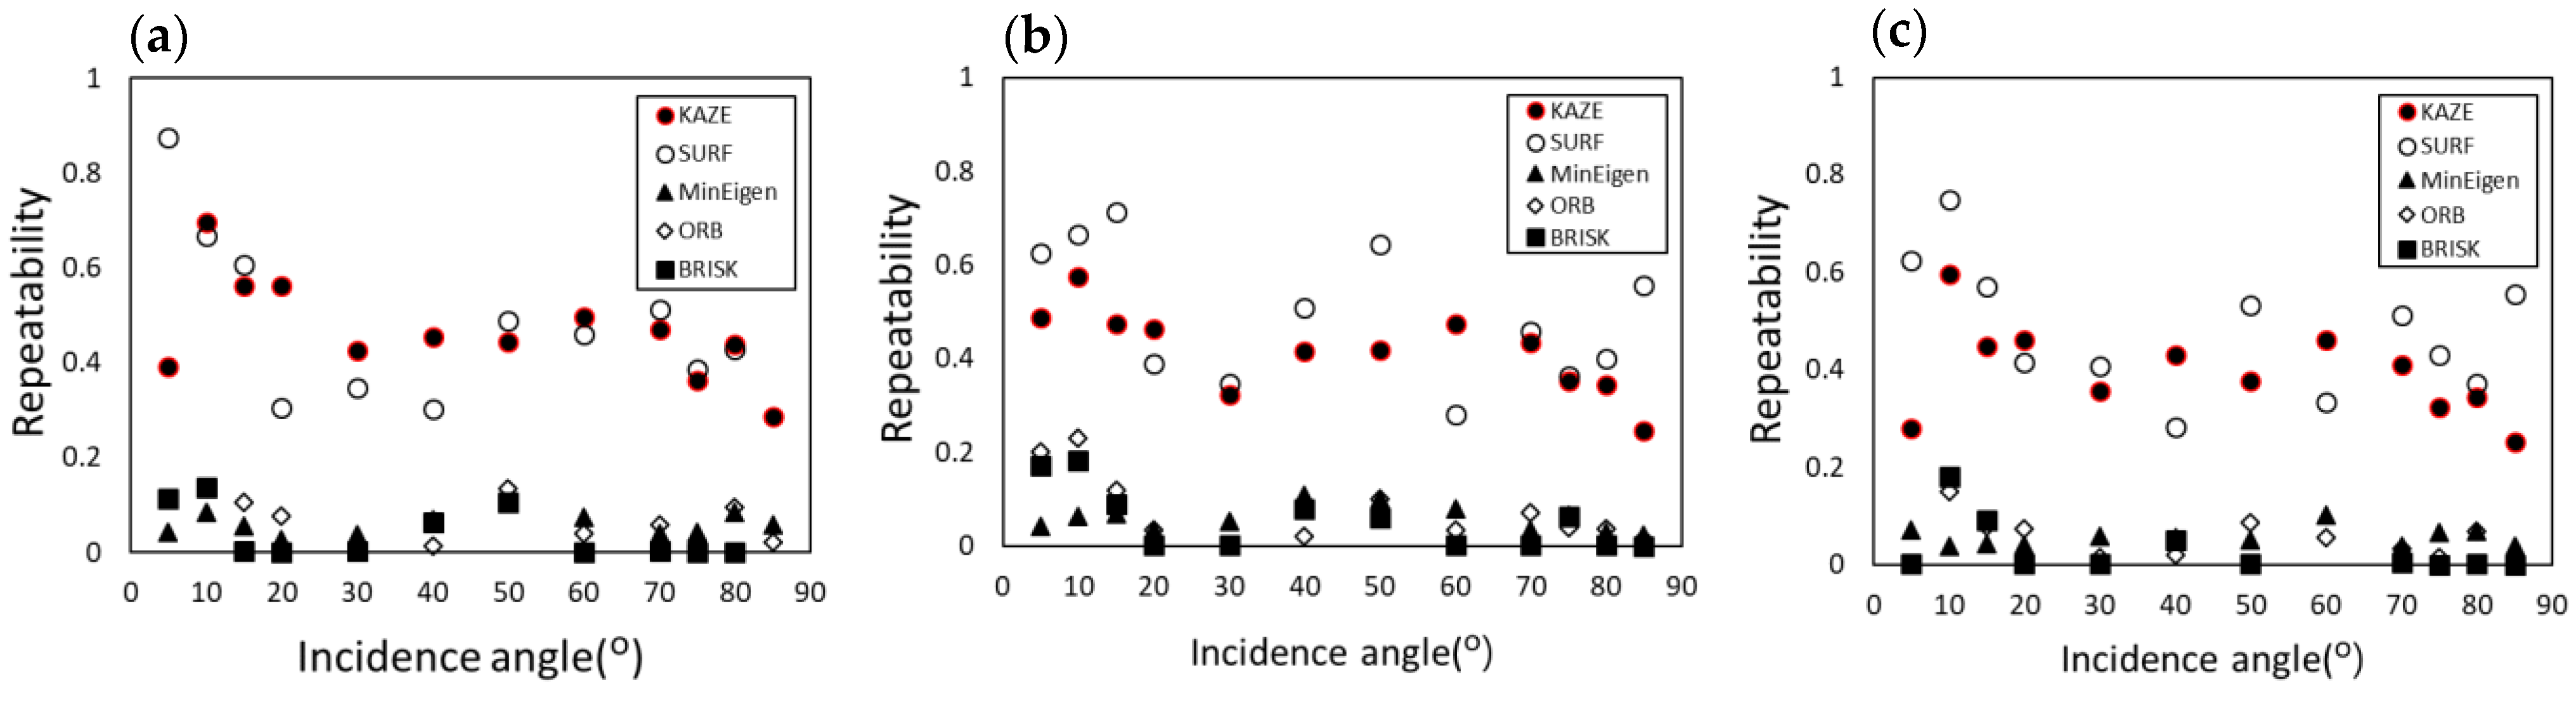
4.1. Single-Block Experiment

In the single-block experiment, images were taken and analyzed for 12 incidence angles distributed from 5° to 85° to evaluate the performance of five feature matching methods. Figure 3 shows the repeatability of each method for a single block with an AT. MinEigen, ORB, and BRISK have repeatabilities of less than 0.2 to the block facing. KAZE and SURF have relatively high repeatabilities of 0.288–0.875 based on the results of 10 repetitions. Moreover, KAZE and SURF showed better matching performance compared to other methods for a single block, although the repeatabilities fluctuated as the incidence angle changed. The repeatability of three different behaviors was relatively high in the section with low incidence angles, such as 5–15°, indicating that it was effective in matching because high-intensity variations were expressed in the facing of the blocks captured at low incidence angles.
The accurately detected and matched features were used to calculate the matching score, as shown in Figure 4. For all types of displacement, KAZE and SURF have better matching scores than MinEigen, ORB, and BRISK. We obtained more inlier matching features on the facing displacement than the settlement and combined displacements because the facing displacement in the image causes a relatively small shape deformation. In addition, the average matching scores for the overall incidence angle gradually decrease in the order of facing, settlement, and combined displacements. The changes in the image of the facing of the block, settlement, and combined displacements were compared with the normal state, as shown in Figure 5. The displacement in reality shows the actual behavior in the target area (dotted line) when the displacements (facing displacement, settlement, and combined displacement) of the block, which is located in the center of the target area, were generated. The displacement in the image shows what types of deformation appear in the image plane when actual behavior occurs from the normal state. Then, we described the scale transformation in the facing displacement, shearing transformation in the settlement, and scale and shearing transformation in the combined displacement. Compared to the shearing transformation, the scale transformation shows relatively better matching performance because it appears more similar to the existing feature vectors of the block in a normal state. Furthermore, the feature vector appears differently when both types of transformations occur together. Therefore, higher repeatability and matching scores were obtained in the order of facing, settlement, and combined displacement. Both KAZE and SURF have excellent repeatabilities and matching scores. Furthermore, KAZE shows less deviation of the matching score at all incidence angles, making it more appropriate than SURF for the images before and after the behavior of a single block.
Figure 6 presents the number of inlier features with respect to the incidence angle for five feature matching methods. KAZE detects a remarkably large number of inlier features compared to other methods. The number of inlier matching features tends to increase with the number of matching features. However, it does not increase significantly compared to the increase in the number of detected features when the incidence angle increases. For better matching performance, more inlier matching features are required, as described previously. Therefore, images taken and used at incident angles of 50–80° were recommended to extract features with sufficient resolution in the registration process. There must be at least four 2D inlier matching features to be converted to a 3D projection transformation geometry (x-, y-, and z-axis with perspective) [37].
Although all methods performed matching based on four or more matching features, the matching results of images appeared in various forms, as shown in Figure 7. The KAZE and SURF methods were successfully transformed, as shown in Figure 7a,b. The MinEigen, ORB, and BRISK methods were transformed with distortion, even if more than four matched features were used. Figure 7c–e shows examples of each image transformation. This problem occurred when the transformation matrix was estimated and matched through insufficient evidence in pairs of features. The KAZE and SURF methods did not result in distorted matching cases.
For KAZE, SURF, and MinEigen, the x-axis registration error (AREh), y-axis registration error (AREv), and combined axial registration error (ARE) were evaluated for different incidence angles and each method in facing displacement (Figure 8), settlement (Figure 9), and combined displacement (Figure 10). In ORB, features were not detected for several angles of incidence, and BRISK matched less than four inlier matching features, even though features were extracted at most incident angles. Therefore, we found that BRISK and ORB could not perform ARE analysis and were inappropriate for detection and matching based on the behavior of blocks. Therefore, the results for BRISK and ORB were excluded from subsequent analysis. Moreover, KAZE has a registration error lower than 2 at an incident angle of 50–80° and has less deviation compared to other methods, as shown in Figure 8, Figure 9 and Figure 10. To calculate the ARE, the x-y coordinates of the vertices of the block where the actual behavior occurred and the block where the behavior is estimated should be extracted and compared. However, the vertices of the block appear in various shapes as the behavior occurs. In addition, it is difficult to equally define the vertices with different shapes of blocks according to the matching methods. Moreover, vertices are not clearly present in one pixel and are distributed within two or more pixels, owing to the characteristics of an image composed of pixel units. Therefore, each vertex must be manually selected for the same behavioral shape, and ARE contains minor errors by default. Even if minor errors are included, the performance of each method could be relatively compared because the coordinates of the vertices after the actual behavior occurs were similar in each method. Table 1 lists the average and standard deviation of AREh, AREv, and ARE estimated in the behavior of each method. Specifically, KAZE showed better performance than SURF and MinEigen, and the matching performance of KAZE was consistently superior at all incidence angles, as shown in the repeated results. The KAZE method resulted in an ARE of less than 2 pixels between 50° and 80° (AREh: 0.3–1.86 pixels, AREv: 0.22–1.69 pixels, and ARE: 0.4–1.4 pixels). Based on the above results, the optical feature matching method for three types of behaviors for RSW was determined as KAZE, and the subsequent analyses were performed.

4.2. Multiblock Experiment

Figure 11 presents an example of images of the same size (800 × 640 pixels) for the multiblock experiment and graffiti images taken from well-known datasets from the University of Oxford [44]. In addition, 3138 and 8638 features were extracted from the laboratory experiment images and graffiti images, respectively. In the laboratory experiment images, relatively fewer features were detected because the facing of blocks was smooth and simple. Specific patterns (edges, corners, and blobs) were not included in the multiblock structure in which blocks with low-feature-intensity variation were repeatedly arranged. Therefore, repeated feature vectors with low-intensity variations may be disadvantageous in the image matching procedure. Therefore, the KAZE method, which was verified as the technique with the best performance in the single-block experiment, was applied and validated in this experiment. We analyzed how the aforementioned phenomenon affected the feature matching procedure and whether it exhibited excellent performance for RSW structures simulated with multiple blocks.
An experiment was performed to verify the matching performance of KAZE for a multiblock structure, where same-sized blocks, including 12 ATs and 4 NTs, were repeatedly arranged, as shown in Figure 2b. The multiblock experiment was analyzed by taking images at an incident angle of 60° (targeting the center of the multiple blocks) included in the range of 50–80° with the highest resolution in the single-block experiment. Figure 12 shows the repeatability, matching score, and number of inlier matching features in the multiblock experiment. The results of ATs showed that the repeatability, matching score, and inlier matching features were 0.36–0.83, 0.15–0.47, and 90–440, respectively. This was a sufficient result for high-resolution feature matching compared with the result of the single-block experiment. Moreover, relatively high feature matching performance was detected in blocks collinear in the gravitational direction of the optical axis of the camera under all types of displacement (i.e., parts 2, 5, 8, and 11). Furthermore, the resolution decreased slightly as the angle decreased or increased. In particular, parts 3, 6, 9, and 12 exhibited low inlier matching performances with incidence angles lower than 60°. However, these parts also had 90–218 inlier matching features, which is sufficient for 3D projected geometry transformations. Based on the results of NTs, the repeatability, matching score, and inlier matching features were 0.38–0.65, 0.22–0.43, and 126–327, respectively, with a similar distribution to that reported for ATs at similar incidence angles. Furthermore, there was an adequate number of inlier matching features for 3D transformation. This shows a sufficient potential for NTs to replace ATs when analyzed using the KAZE method as a feature matching technique in RSW structures.
Table 2 lists the minimum and maximum values for the feature performance evaluation measured from the single- and multiblock experiments, including ATs and NTs. Each value of the multiblock experiment was distributed similarly to the results of the single-block experiment. Therefore, the repetitive arrangement of blocks in the image is not a disadvantage if the ROI region is properly set in the process of extracting and matching features. Further, light casts a shadow on the block boundaries when the blocks are repeatedly arranged, allowing for more feature extraction than the edges of the single block. This phenomenon allows for more successful feature matching in the image after the behavior occurs. Figure 13 reveals the feature extraction results used as targets in single- and multiblock experiments. The single-block features were not extracted at the left edge of the facing, owing to the low color contrast, as shown in Figure 13a. However, the features of continuous blocks in the RSW structure were extracted from all corners by the color contrast between block and shadow, as shown in Figure 13b. As a result, 570 and 789 features were extracted for a single and multiple blocks, respectively, showing a significant difference. The ratio of inlier matching features and total extracted features was 35.09% (200/570) for the single block and 49.68% (392/789) for multiple blocks, indicating the relatively higher resolution of the matching performance of the latter compared to that of the former. Therefore, multiple repeatedly arranged blocks constituted an advantage rather than a disadvantage in the feature detection and matching procedure. In the multi-block experiment, multiple blocks were variously distributed in the image. Therefore, size and feature vector characteristics appeared differently depending on the location of the target. Therefore the performances of feature matching were slightly different.
Figure 14 shows the distributions of AREh, AREv, and ARE for each displacement type of RSW structure. The distributions of AREh, AREv, and ARE for ATs in each behavior type were approximately 0.18–1.11, 0.12–1.32, and 0.15–1.27 pixels, respectively, for facing displacement; 0.10–1.55, 0.40–1.70, and 0.32–1.27 pixels, respectively, for settlement; and 0.39–1.84, 0.16–1.68, and 0.54–1.29 pixels, respectively, for combined displacement. Moreover, the distributions of AREh, AREv, and ARE for NTs in each behavior type were 0.38–1.58, 0.29–1.31, and 0.49–1.27 pixels, respectively, for facing displacement; 0.58–1.03, 0.40–1.70, and 0.49–1.16 pixels, respectively, for settlement; and 0.78–1.56, 0.31–1.01, and 0.54–1.29 pixels, respectively, for combined displacement. The averages of AREh, AREv, and ARE were 0.86, 0.74, and 0.80 for the ATs and 0.92, 0.83, and 0.87, respectively, for the NTs. Although the results of NTs were slightly higher, they were similar to those of single-block experiments at incidence angles between 50° and 80° (0.99, 0.88, and 0.94). In addition, maximum AREh, AREv and ARE values were obtained in AT (1.84), NT (1.68), and AT (1.29), respectively. The behavior of the entire section in the image could be analyzed at ATs and NTs by using KAZE; these results are compared in Table 3. The repeatability, matching score, number of inlier matching features, and ARE between ATs and NTs show similar performance. Therefore, we confirmed that NTs are a suitable target for feature matching and behavior analysis based on the feature performance evaluation, even if it does not attach a sheet target to the center of the block like AT. In addition, NTs can overcome the limitation of ATs that a specific target must be manually installed and detected.

5. Conclusions

Experiments were conducted to find the optimal feature matching method (detector and descriptor) to detect behaviors of blocks. Two laboratory experiments (i.e., single- and multiblock experiments) were analyzed. In the single-block experiment, the best feature matching method was selected by analyzing the values for feature performance evaluation. In contrast, in the multiblock experiment, the applicability and performance of the primarily simplified feature matching method were evaluated. Subsequently, the feature matching performance of NTs and ATs were compared to confirm the applicability of NTs for RSW structures. The main findings of this study are as follows:
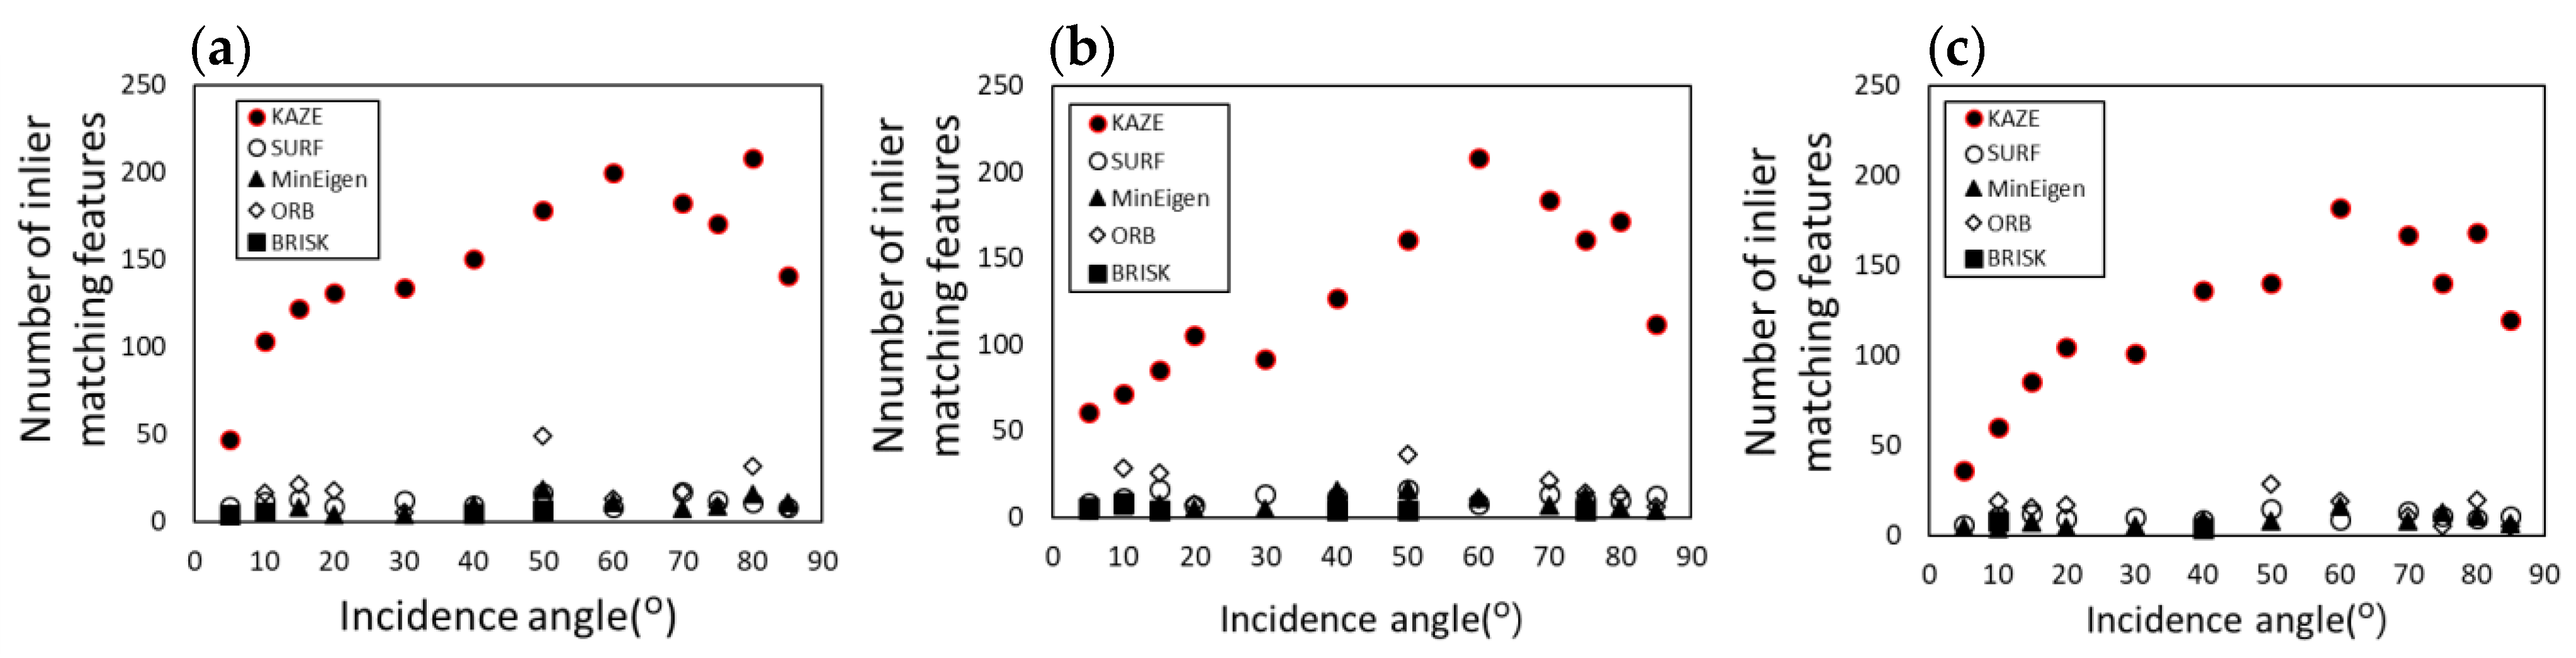
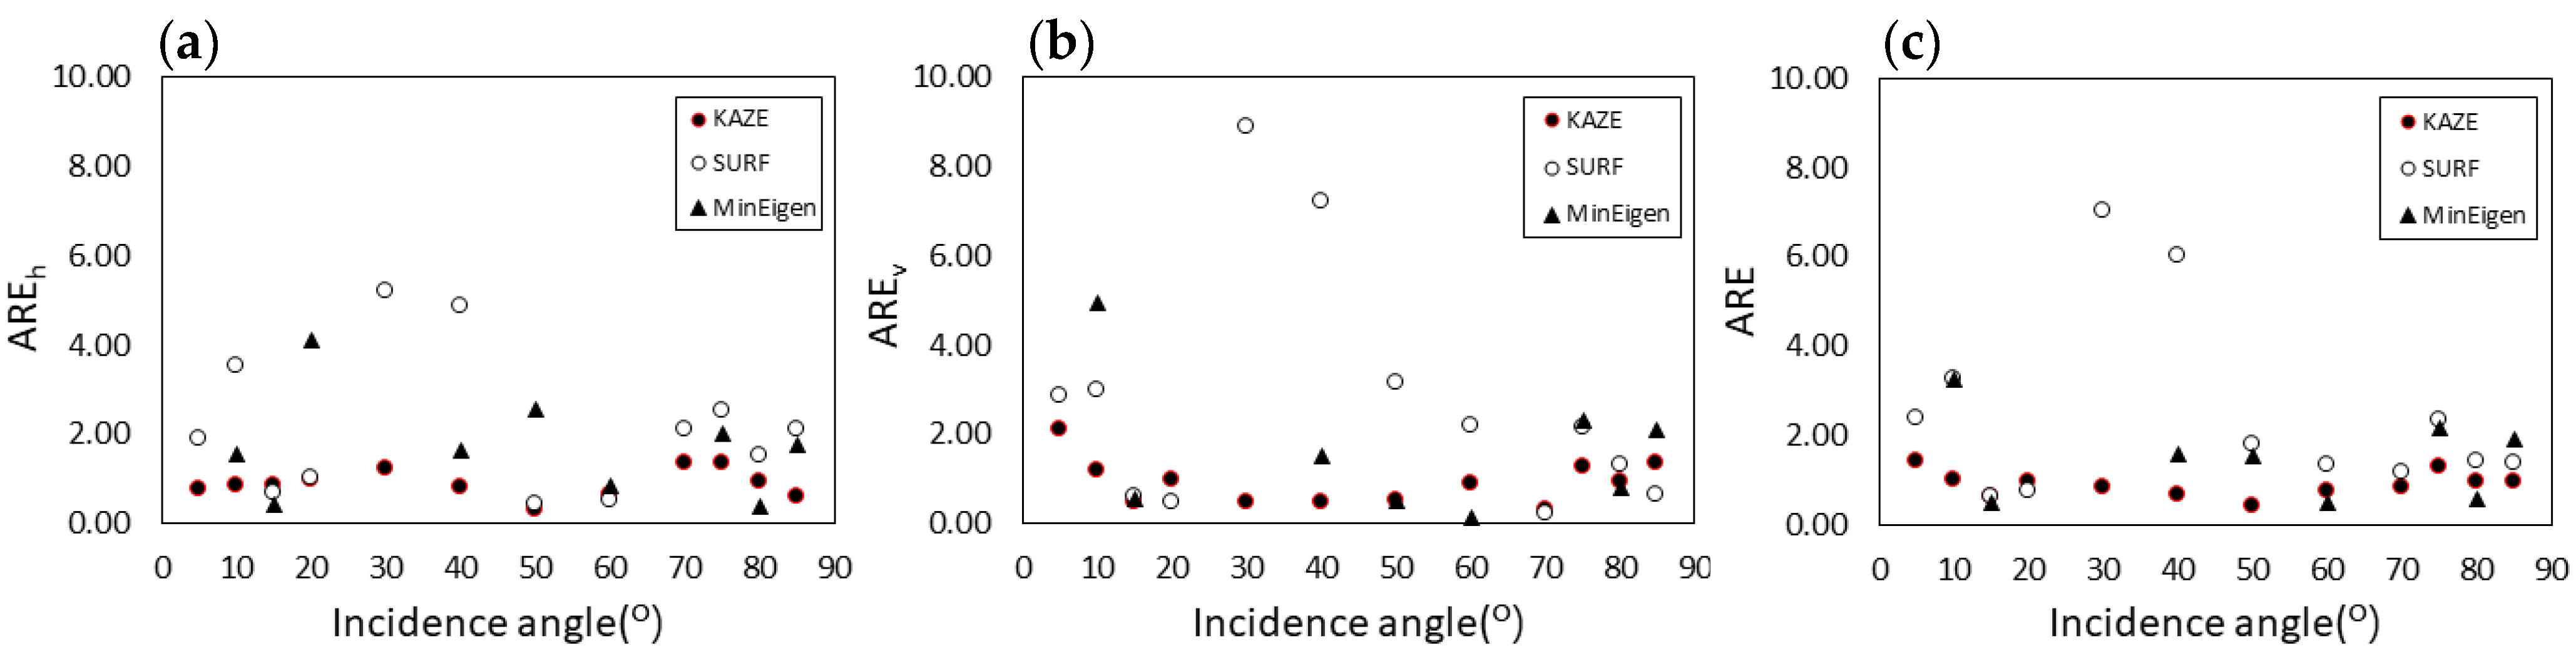
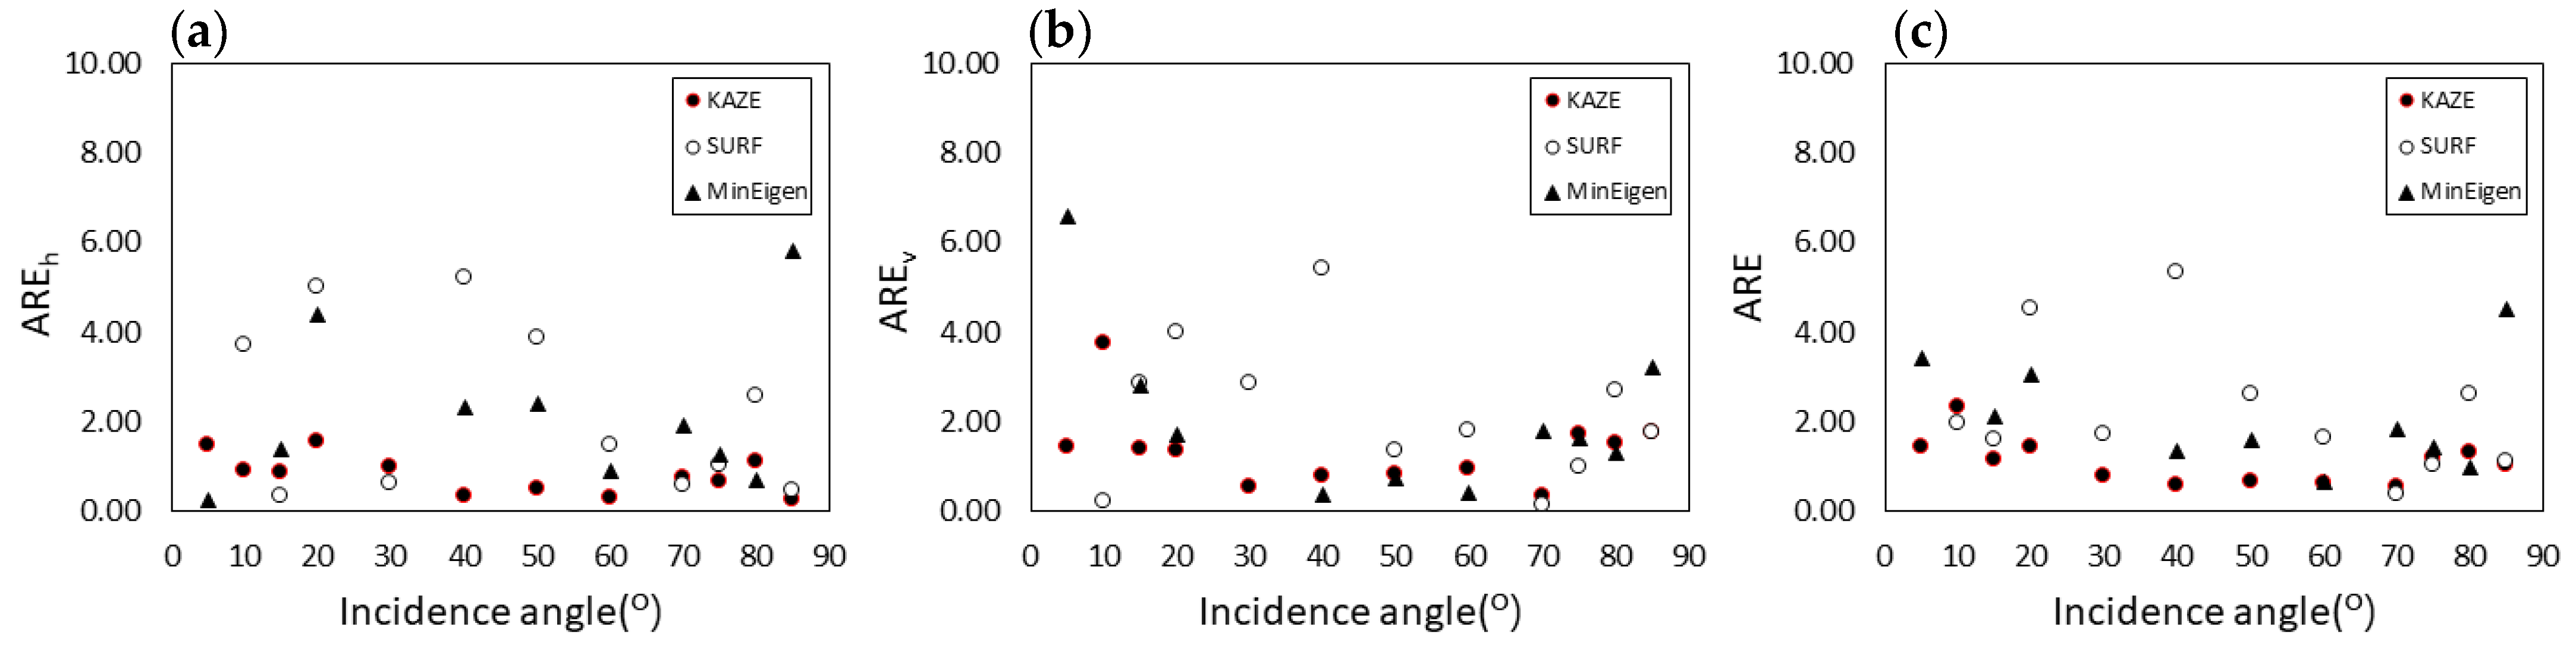
  • Feature matching technology was applied to detect and match target changes in image pairs according to block behavior. Both the KAZE and SURF methods showed excellent performance in repeatability and matching score, which were based on the number of features. In particular, the KAZE method showed a remarkably large number of inlier matching features and obtained stable results at all incidence angles compared to other methods. In addition, ARE based on the position of the vertices of the block in the image pair (original image, transformed image) was the best in KAZE. Therefore, the KAZE method was selected as the best feature matching method, owing to its great ability (among the compared methods) to detect and match image changes based on the behavior of the block type.
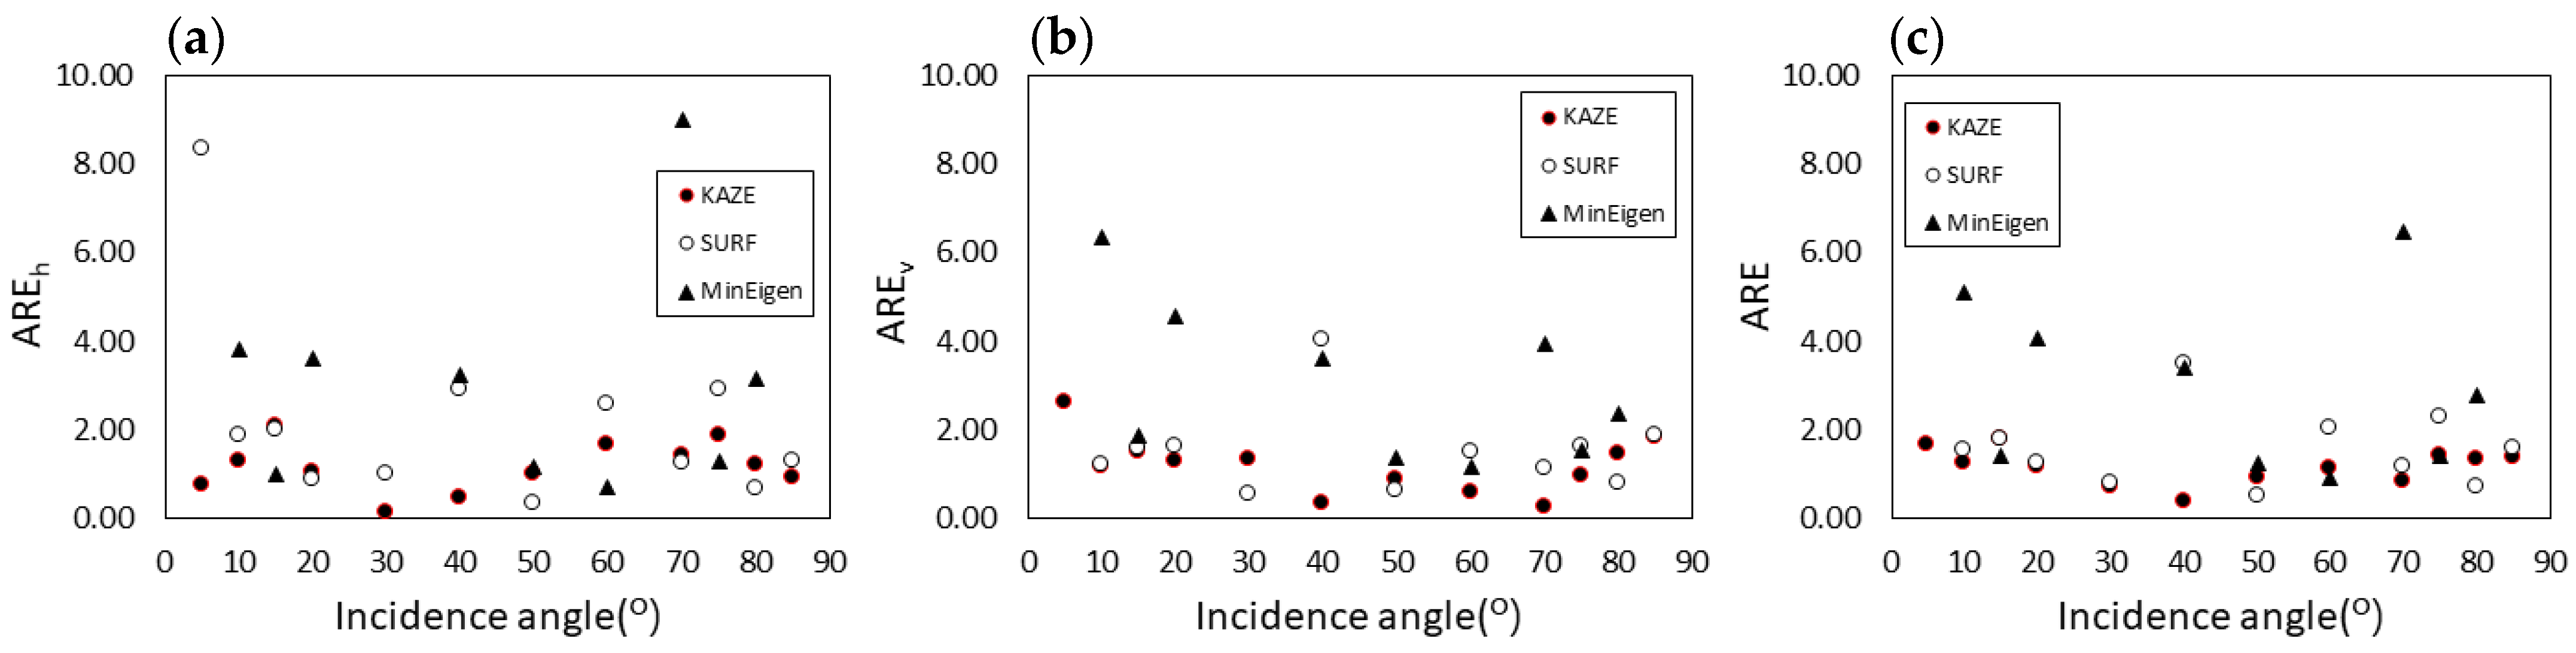
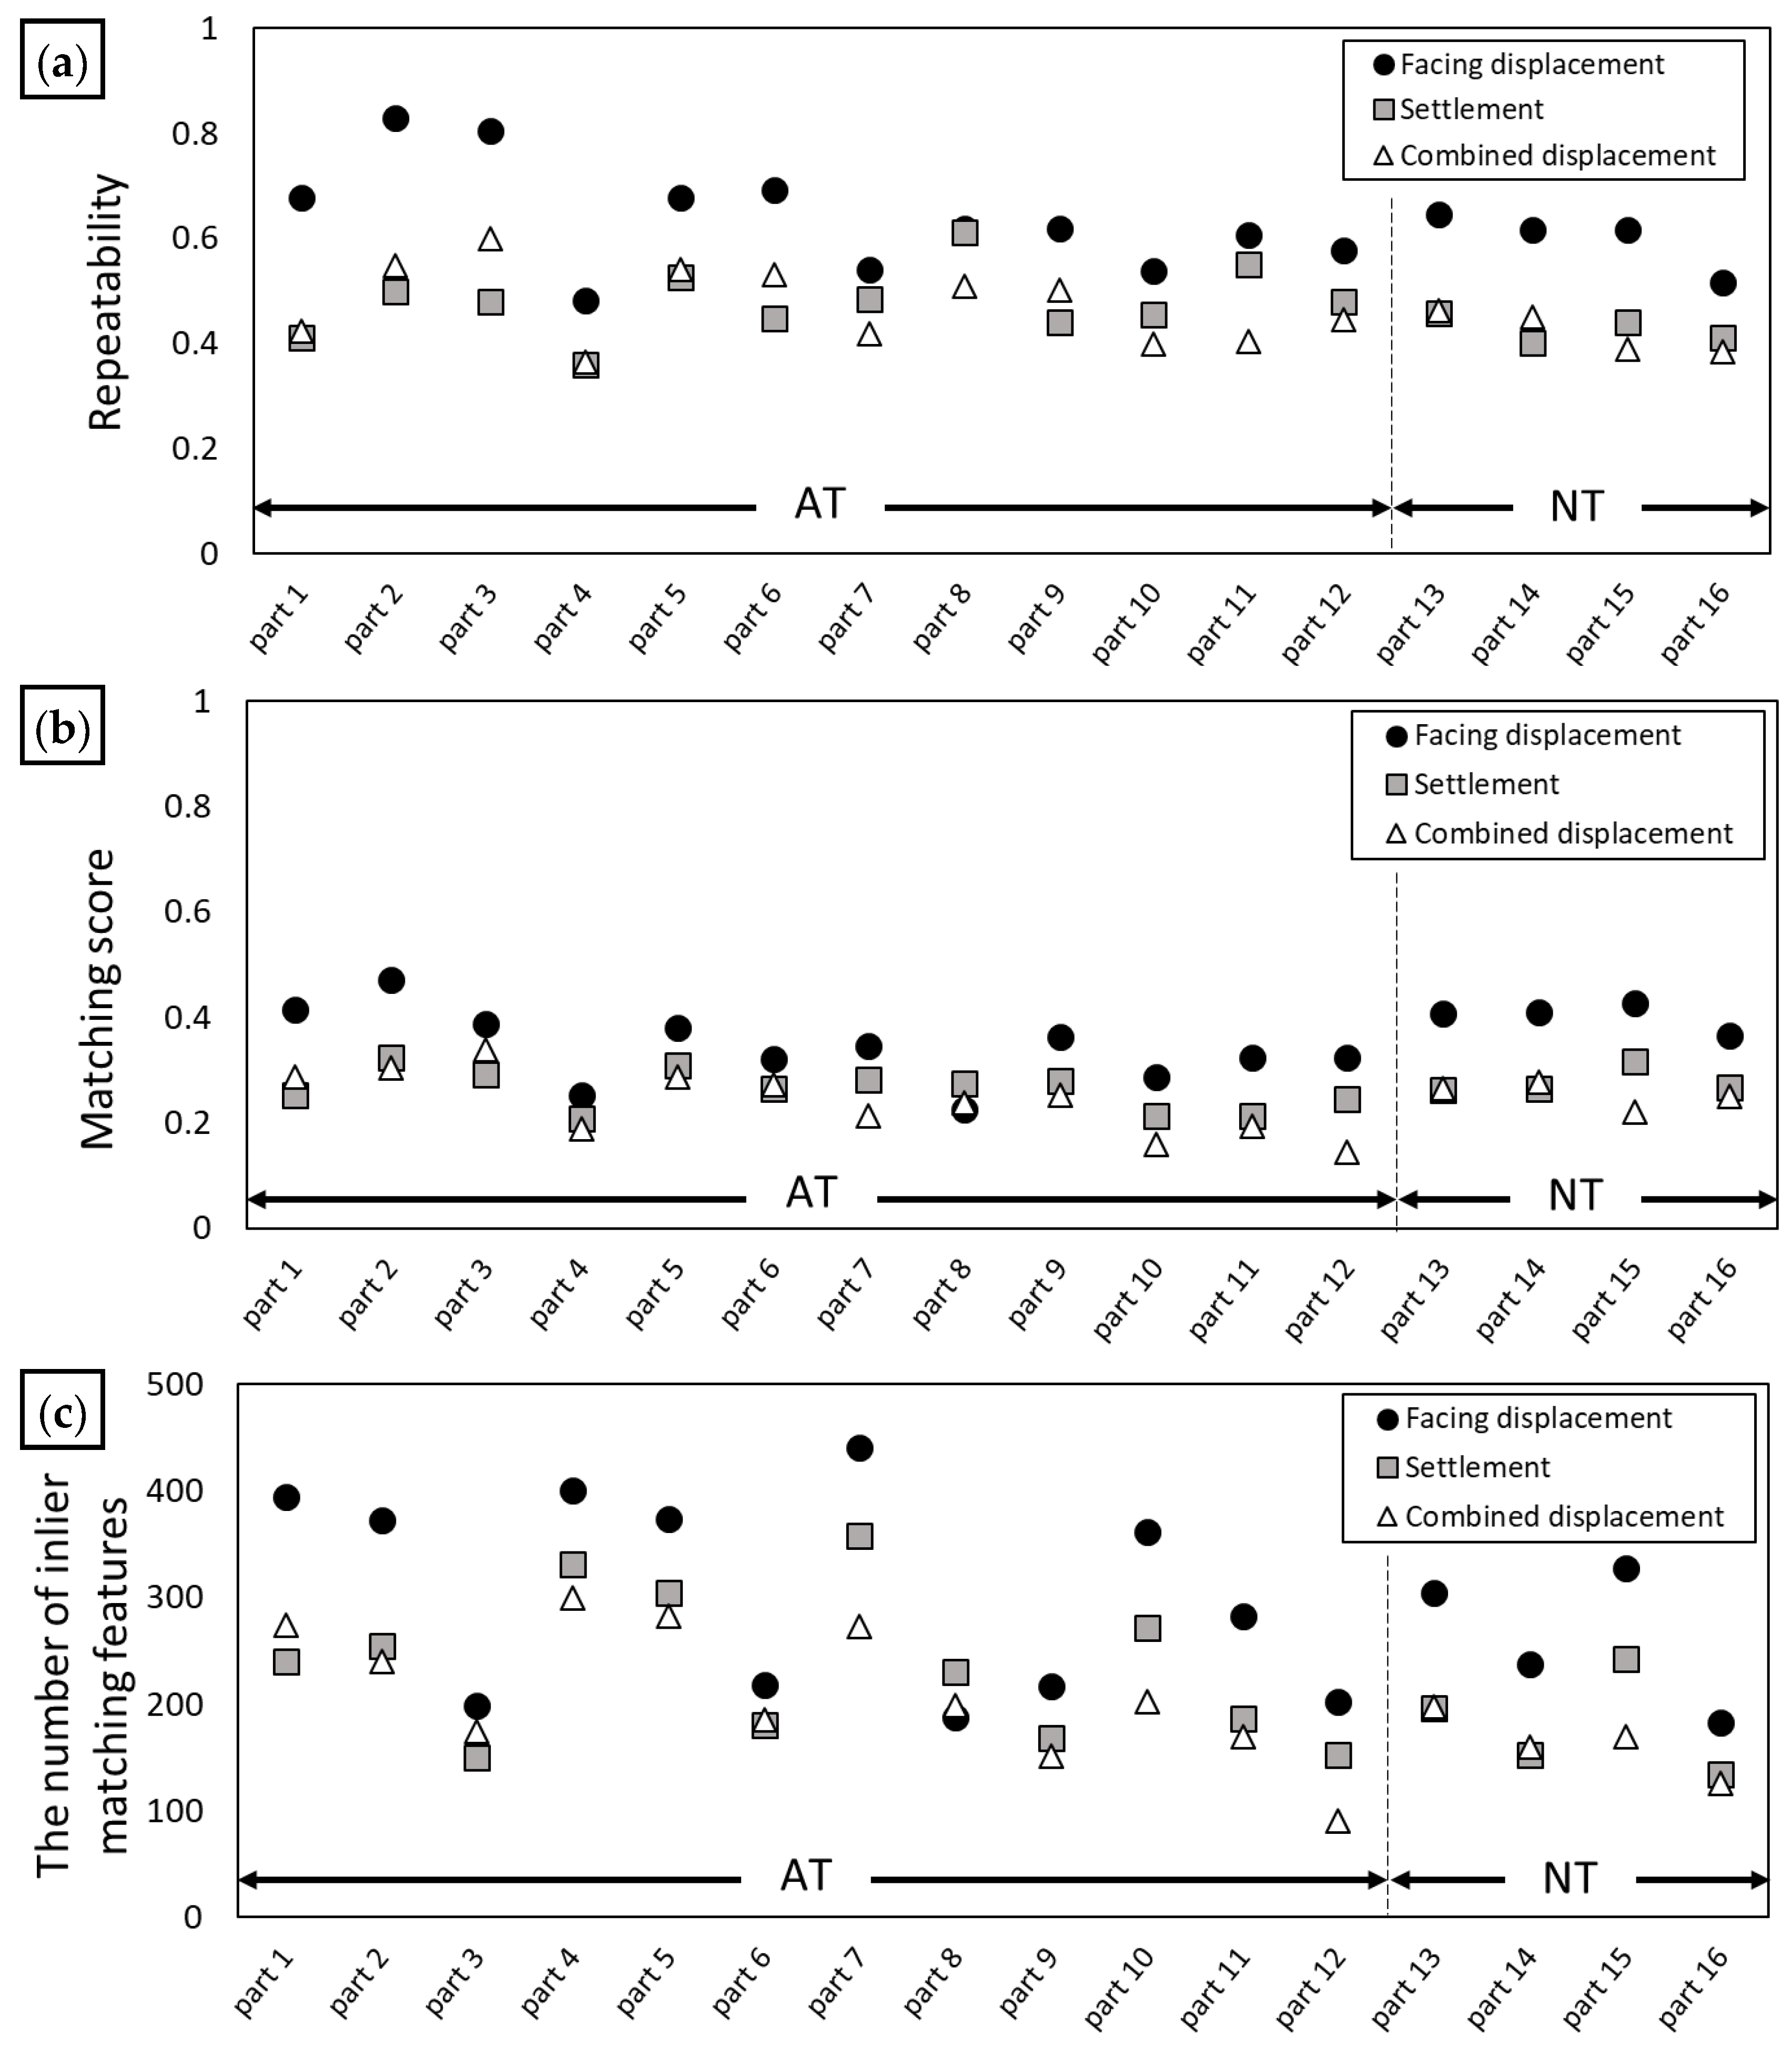
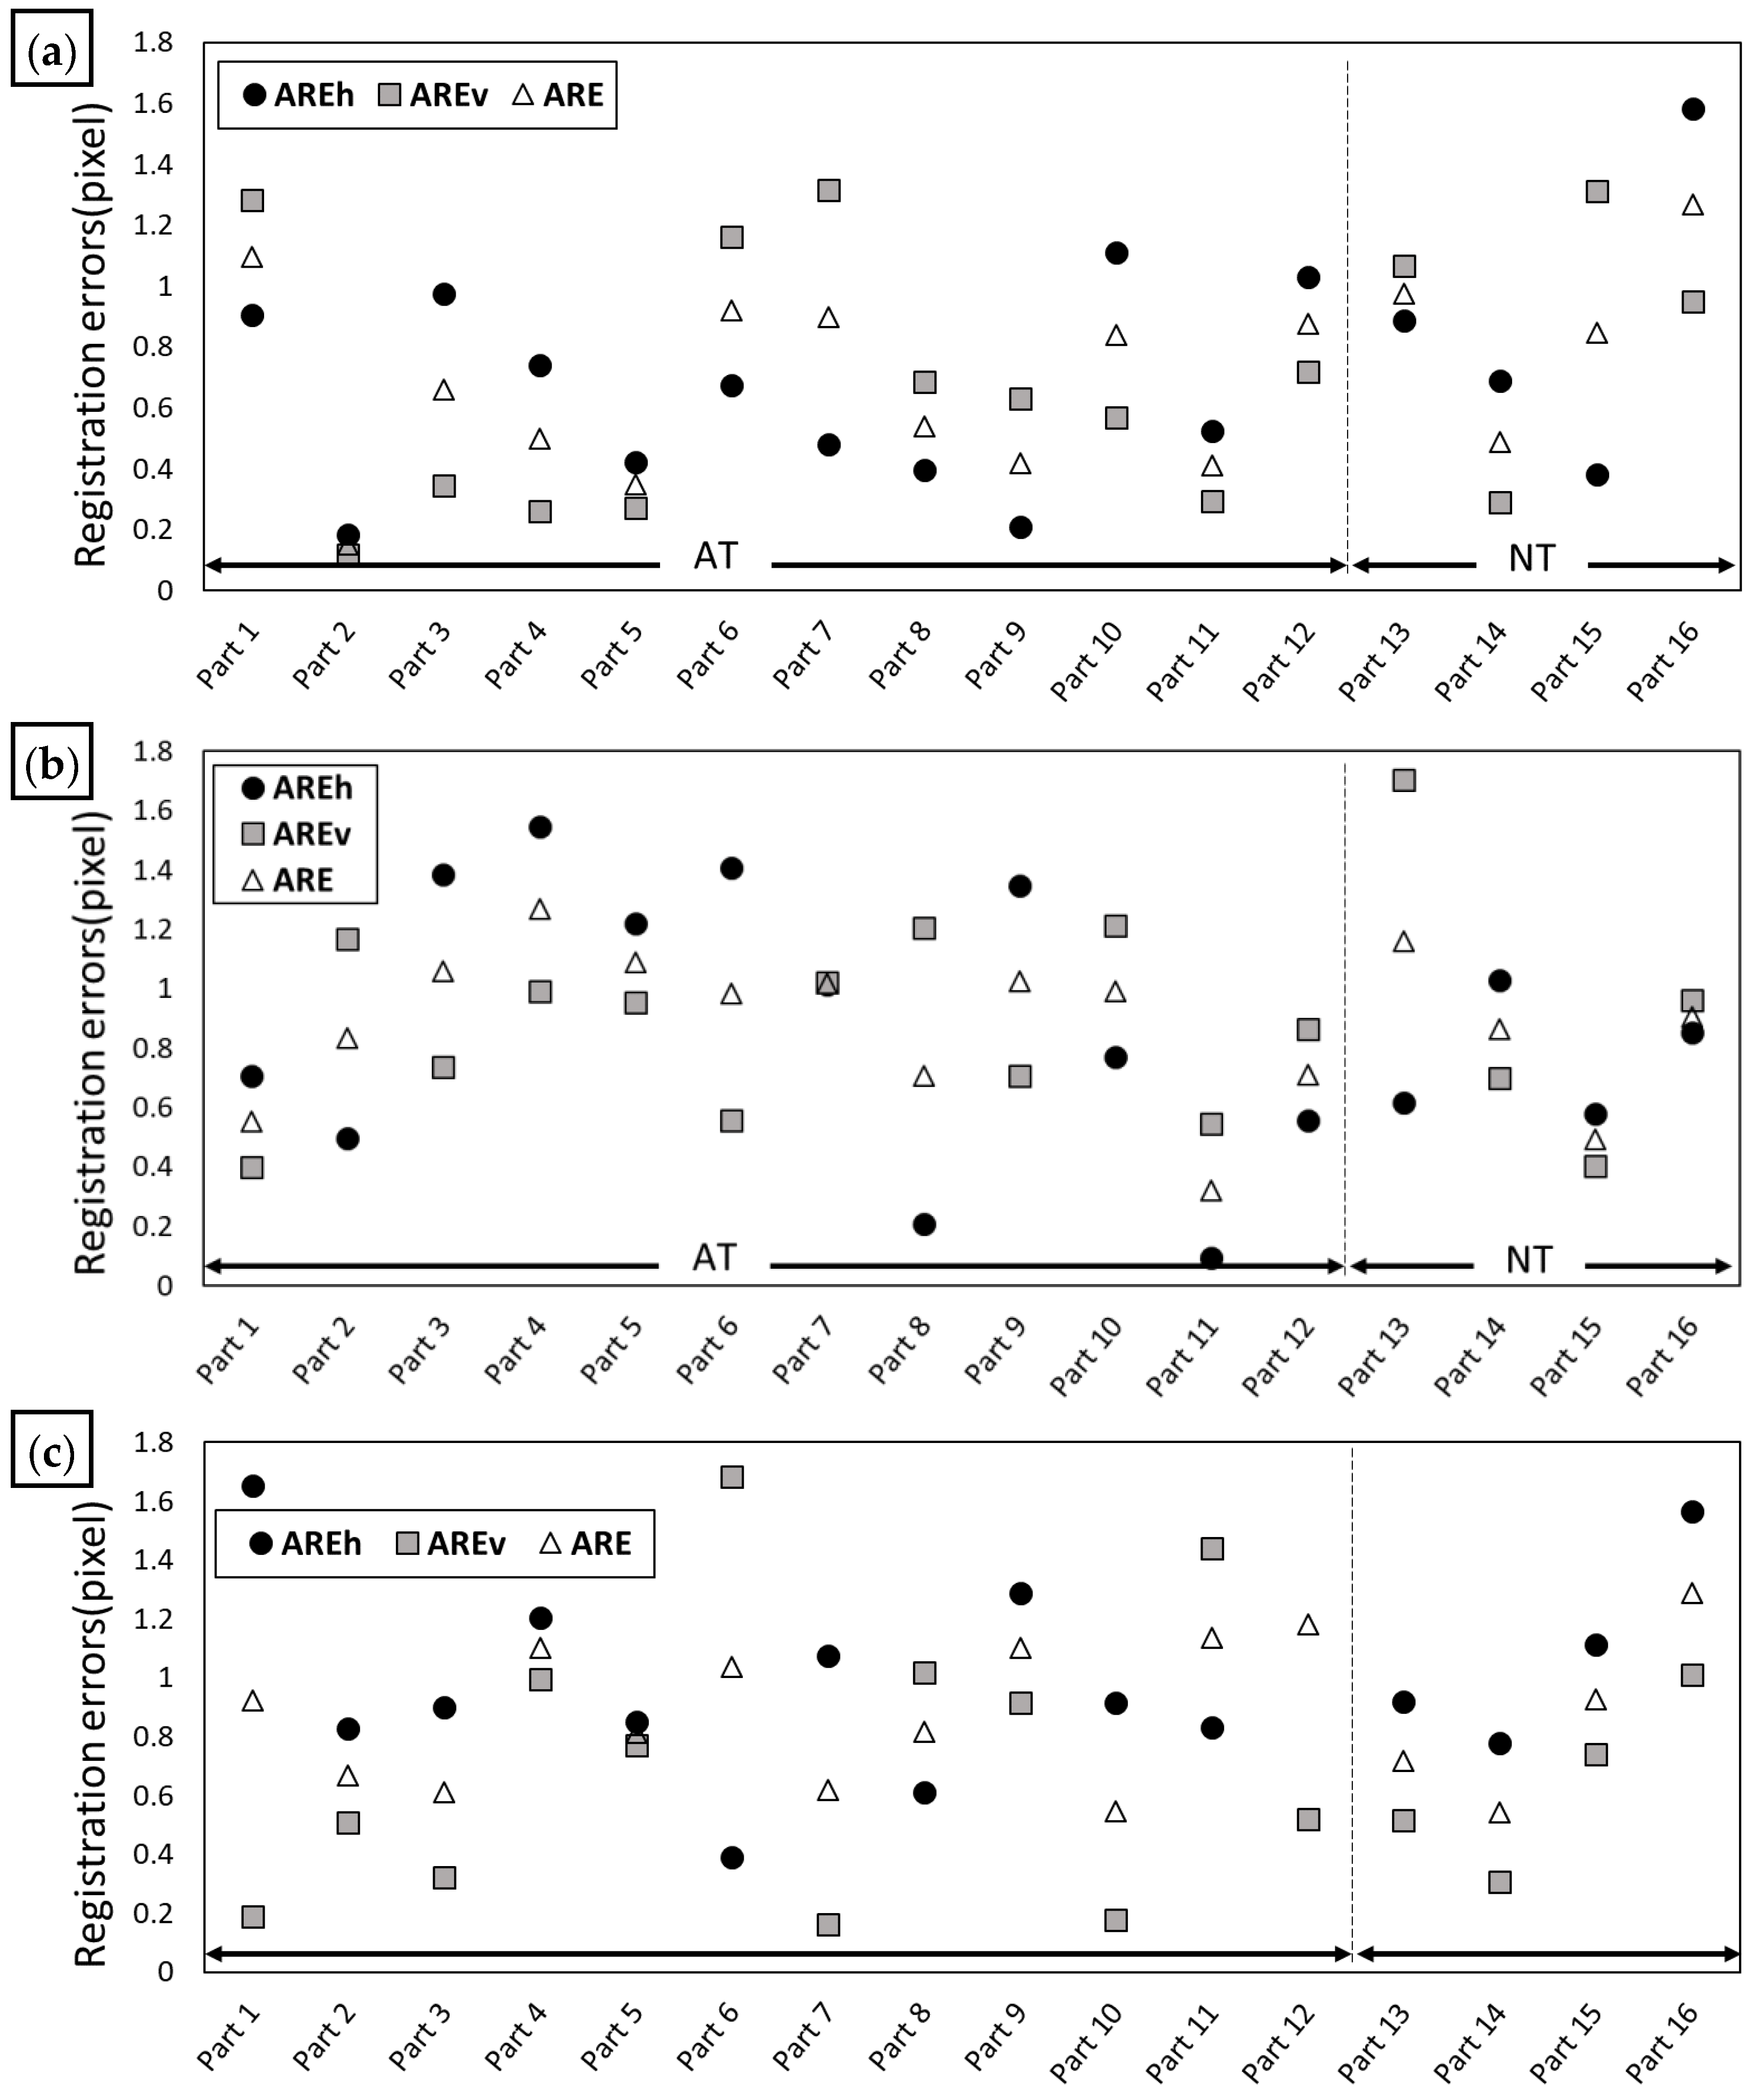
  • The feature matching performance of the KAZE method was evaluated according to the behavior of multiple blocks where blocks were consecutively arranged. The repeatability, matching score, number of inlier matching features, and ARE showed excellent performance. All these results are similar to the single-block experiment results listed in Table 2. The KAZE results show that the matching performance of NTs (parts 13–16) was similar to that of ATs (parts 1–12). Therefore, the KAZE method could be applied to perform feature matching when evaluating the behavior of blocks in RSWs without installing ATs.
The ability to accurately match the 3D behavior of multiple blocks can be used as a basic step to quantitatively analyze the behavior of RSW structures in three-dimensional space. Therefore, if the KAZE technique is applied to RSWs, it can be used to accurately analyze the behavior of the retaining wall through high-accuracy behavior matching performance.

Author Contributions

Conceptualization, Y.-S.H.; methodology, Y.-S.H.; formal analysis, Y.-S.H.; investigation, Y.-S.H.; data curation, Y.-S.H.; writing—original draft preparation, Y.-S.H.; writing—review and editing, J.L. and Y.-T.K.; supervision, Y.-T.K.; project administration, Y.-S.H. and Y.-T.K.; funding acquisition, Y.-T.K. All authors have read and agreed to the published version of the manuscript.

Funding

This work is supported by a Korea Agency for Infrastructure Technology Advancement(KAIA) grant funded by the Ministry of Land, Infrastructure and Transport (Grant 22TSRD-C151228-04).

Data Availability Statement

Not applicable.

Conflicts of Interest

The authors declare no conflict of interest.

References

  1. Anastasopoulos, I.; Georgarakos, T.; Georgiannou, V.; Drosos, V.; Kourkoulis, R. Seismic Performance of Bar-Mat Reinforced-Soil Retaining Wall: Shaking Table Testing Versus Numerical Analysis with Modified Kinematic Hardening Constitutive Model. Soil Dyn. Earthquake Eng. 2010, 30, 1089–1105. [Google Scholar] [CrossRef]
  2. KISTEC. Safety Inspection Manual for National Living Facilities; Korea Infrastructure Safety Corporation: Seoul, Korea, 2019; p. 6. [Google Scholar]
  3. Jang, D.J. Gwangju Apartment Retaining Wall Collapse, Dozens of Vehicles Sunk and Damaged, Yonhap News. 2015. Available online: https://www.yna.co.kr/view/AKR20150205012552054 (accessed on 5 February 2015).
  4. Kim, Y.R. Retaining Wall With ‘Good’ Safety Rating Also Collapsed, Korean Broadcasting System News. 2020. Available online: https://news.kbs.co.kr/news/view.do?ncd=5009697 (accessed on 22 September 2020).
  5. Laefer, D.; Lennon, D. Viability Assessment of Terrestrial LiDAR for Retaining Wall Monitoring. In Proceedings of the GeoCongress 2008, Orleans, LA, USA, 9–12 March 2008; pp. 247–254. [Google Scholar] [CrossRef] [Green Version]
  6. Hain, A.; Zaghi, A.E. Applicability of Photogrammetry for Inspection and Monitoring of Dry-Stone Masonry Retaining Walls. Transp. Res. Rec. 2020, 2674, 287–297. [Google Scholar] [CrossRef]
  7. Bathurst, R.J. Case study of a monitored propped panel wall. In Proceedings of the International Symposium on Geosynthetic-Reinforced Soil Retatining Walls, Denver, CO, USA, 8–9 August 1992; pp. 214–227. [Google Scholar]
  8. Sadrekarimi, A.; Ghalandarzadeh, A.; Sadrekarimi, J. Static and Dynamic Behavior of Hunchbacked Gravity Quay Walls. Soil Dyn. Earthq. Eng. 2008, 28, 2564–2571. [Google Scholar] [CrossRef]
  9. Yoo, C.S.; Kim, S.B. Performance of a Two-Tier Geosynthetic Reinforced Segmental Retaining Wall Under a Surcharge Load: Full-Scale Load Test and 3D Finite Element Analysis. Geotext. Geomembr. 2008, 26, 460–472. [Google Scholar] [CrossRef]
  10. Yang, G.; Zhang, B.; Lv, P.; Zhou, Q. Behaviour of Geogrid Reinforced Soil Retaining Wall With Concrete-Rigid Facing. Geotext. Geomembr. 2009, 27, 350–356. [Google Scholar] [CrossRef]
  11. Datteri, R.D.; Liu, Y.; D’Haese, P.F.; Dawant, B.M. Validation of a Nonrigid Registration Error Detection Algorithm Using Clinical MRI Brain Data. IEEE Trans. Med. Imaging 2015, 34, 86–96. [Google Scholar] [CrossRef] [Green Version]
  12. Gupta, S.; Chakarvarti, S.K.; Zaheeruddin, N.A. Medical Image Registration Based on Fuzzy c-means Clustering Segmentation Approach Using SURF. Int. J. Biomed. Eng. Technol. 2016, 20, 33–50. [Google Scholar] [CrossRef]
  13. Kaucha, D.P.; Prasad, P.W.C.; Alsadoon, A.; Elchouemi, A.; Sreedharan, S. Early Detection of Lung Cancer Using SVM Classifier in Biomedical Image Processing. In Proceedings of the IEEE International Conference on Power, Control, Signals and Instrumentation Engineering (ICPCSI), Chennai, India, 21–22 September 2017; pp. 3143–3148. [Google Scholar] [CrossRef]
  14. Yang, W.; Zhong, L.; Chen, Y.; Lin, L.; Lu, Z.; Liu, S.; Wu, Y.; Feng, Q.; Chen, W. Predicting CT Image From MRI Data Through Feature Matching With Learned Nonlinear Local Descriptors. IEEE Trans. Med. Imaging 2018, 37, 977–987. [Google Scholar] [CrossRef]
  15. Wei, C.; Xia, H.; Qiao, Y. Fast Unmanned Aerial Vehicle Image Matching Combining Geometric Information and Feature Similarity. IEEE Geosci. Remote Sens. Lett. 2020, 18, 1731–1735. [Google Scholar] [CrossRef]
  16. Regmi, K.; Shah, M. Bridging the Domain Gap for Ground-to-Aerial Image Matching. In Proceedings of the IEEE International Conference on Computer Vision (ICCV), Seoul, Korea, 27 October–2 November 2019; pp. 470–479. [Google Scholar] [CrossRef] [Green Version]
  17. Song, F.; Dan, T.T.; Yu, R.; Yang, K.; Yang, Y.; Chen, W.Y.; Gao, X.Y.; Ong, S.H. Small UAV-Based Multi-Temporal Change Detection for Monitoring Cultivated Land Cover Changes in Mountainous Terrain. Remote Sens. Lett. 2019, 10, 573–582. [Google Scholar] [CrossRef]
  18. Shao, Z.; Li, C.; Li, D.; Altan, O.; Zhang, L.; Ding, L. An Accurate Matching Method for Projecting Vector Data Into Surveillance Video to Monitor and Protect Cultivated Land. ISPRS Int. J. Geo Inf. 2020, 9, 448. [Google Scholar] [CrossRef]
  19. Thornton, S.; Dey, S. Machine Learning Techniques for Vehicle Matching with Non-Overlapping Visual Features. In Proceedings of the 2020 IEEE 3rd Connected and Automated Vehicles Symposium (CAVS), Victoria, BC, Canada, 18 November-16 December 2020; pp. 1–6. [Google Scholar] [CrossRef]
  20. Tareen, S.A.K.; Saleem, Z. A Comparative Analysis of SIFT, SURF, KAZE, AKAZE, ORB, and BRISK. In Proceedings of the 2018 IEEE International Conference on Computing, Mathematics and Engineering Technologies (iCoMET), Sukkur, Pakistan, 3–4 March 2018; pp. 1–10. [Google Scholar] [CrossRef]
  21. Pieropan, A.; Bjorkman, M.; Bergstrom, N.; Kragic, D. Feature Descriptors for Tracking by Detection: A Benchmark. arXiv 2016, arXiv:1607.06178. [Google Scholar]
  22. Mikolajczyk, K.; Schmid, C. A Performance Evaluation of Local Descriptors. IEEE Trans. Pattern Anal. Mach. Intell. 2005, 27, 1615–1630. [Google Scholar] [CrossRef] [PubMed] [Green Version]
  23. Chien, H.J.; Chuang, C.C.; Chen, C.Y.; Klette, R. When to Use What Feature? SIFT, SURF, ORB, or A-KAZE Features for Monocular Visual Odometry. In Proceedings of the IEEE International Conference on Image and Vision Computing, Palmerston North, New Zealand, 21–22 November 2016; pp. 1–6. [Google Scholar] [CrossRef]
  24. Feng, D.; Feng, M.Q.; Ozer, E.; Fukuda, Y. A Vision-Based Sensor for Noncontact Structural Displacement Measurement. Sensors 2015, 15, 16557–16575. [Google Scholar] [CrossRef] [PubMed]
  25. Lee, J.J.; Shinozuka, M. Real-Time Displacement Measurement of a Flexible Bridge Using Digital Image Processing Techniques. Exp. Mech. 2006, 46, 105–114. [Google Scholar] [CrossRef]
  26. Choi, H.S.; Cheung, J.H.; Kim, S.H.; Ahn, J.H. Structural Dynamic Displacement Vision System Using Digital Image Processing. NDT E Int. 2011, 44, 597–608. [Google Scholar] [CrossRef]
  27. Berg, R.R.; Christopher, B.R.; Samtani, N.C. Design of MSE walls. In Design and Construction of Mechanically Stabilized Earth Walls and Reinforced Soil Slopes; US Department of Transportation Federal Highway Administration: New Jersey, DC, USA, 2009; Volume 1, pp. 4.1–4.80. [Google Scholar]
  28. Koerner, R.M.; Koerner, G.R. An Extended Data Base and Recommendations Regarding 320 Failed Geosynthetic Reinforced Mechanically Stabilized Earth (MSE) Walls. Geotext. Geomembr. 2018, 46, 904–912. [Google Scholar] [CrossRef]
  29. Ji, R.; Gao, Y.; Duan, L.Y.; Hongxun, Y.; Dai, Q. Learning-Based Local Visual Representation and Indexing; Morgan Kaufmann: Burlington, MA, USA, 2015; pp. 17–40. [Google Scholar]
  30. Shi, J.; Tomasi, C. Good Features to Track. In Proceedings of the IEEE Computer Society Conference on Computer Vision and Pattern Recognition (CVPR’94), Seattle, WA, USA, 21–23 June 1994; pp. 593–600. [Google Scholar] [CrossRef]
  31. Bay, H.; Tuytelaars, T.; Van Gool, L. SURF: Speeded up Robust Features. In Proceedings of the 9th European Conference on Computer Vision (ECCV 2006), Graz, Austria, 7–13 May 2006; Volume 3951, pp. 404–417. [Google Scholar] [CrossRef]
  32. Leutenegger, S.; Chli, M.; Siegwart, R.Y. BRISK: Binary Robust Invariant Scalable Keypoints. In Proceedings of the 2011 IEEE International Conference on Computer Vision, Barcelona, Spain, 6–13 November 2011; pp. 2548–2555. [Google Scholar] [CrossRef] [Green Version]
  33. Rublee, E.; Rabaud, V.; Konolige, K.; Bradski, G. ORB: An Efficient Alternative to SIFT or SURF. In Proceedings of the IEEE International Conference on Computer Vision, Barcelona, Spain, 6–13 November 2011; pp. 2564–2571. [Google Scholar] [CrossRef]
  34. Alcantarilla, P.F.; Bartoli, A.; Davison, A.J. KAZE Features. In Proceedings of the European Conference on Computer Vision, Florence, Italy, 7–13 October 2012; pp. 214–227. [Google Scholar] [CrossRef]
  35. Mikolajczyk, K.; Mikolajczyk, K. Scale & Affine Invariant Interest Point Detectors. Int. J. Comput. Vis. 2004, 60, 63–86. [Google Scholar] [CrossRef]
  36. Revaud, J.; Weinzaepfel, P.; de Souza, C.R.; Pion, N.; Csurka, G.; Cabon, Y.; Humenberger, M. R2D2: Repeatable and Reliable Detector and Descriptor. arXiv 2019, arXiv:1906.06195. [Google Scholar]
  37. Yi, K.M.; Trulls, E.; Lepetit, V.; Fua, P. Lift: Learned Invariant Feature Transform. In European Conference on Computer Vision; Springer: Cham, Switzerland, 2016; pp. 467–483. [Google Scholar] [CrossRef] [Green Version]
  38. DeTone, D.; Malisiewicz, T.; Rabinovich, A. Superpoint: Self-Supervised Interest Point Detection and Description. In Proceedings of the IEEE Conference on Computer Vision and Pattern Recognition Workshops, Salt Lake City, UT, USA, 18–22 June 2018; pp. 224–236. [Google Scholar] [CrossRef] [Green Version]
  39. Forsberg, D.; Farnebäck, G.; Knutsson, H.; Westin, C.F. Multi-Modal Image Registration Using Polynomial Expansion and Mutual Information. In Proceedings of the International Workshop on Biomedical Image Registration, Nashville, TN, USA, 7–8 July 2012; pp. 40–49. [Google Scholar] [CrossRef]
  40. Schmidt-Richberg, A.; Ehrhardt, J.; Werner, R.; Handels, H. Fast Explicit Diffusion for Registration With Direction-Dependent Regularization. In Proceedings of the International Workshop on Biomedical Image Registration, Nashville, TN, USA, 7–8 July 2012; pp. 220–228. [Google Scholar] [CrossRef]
  41. Wang, Z.; Kieu, H.; Nguyen, H.; Le, M. Digital Image Correlation in Experimental Mechanics and Image Registration in Computer Vision: Similarities, Differences and Complements. Opt. Lasers Eng. 2015, 65, 18–27. [Google Scholar] [CrossRef]
  42. Esmaeili, F.; Varshosaz, M.; Ebadi, H. Displacement Measurement of the Soil Nail Walls by Using Close Range Photogrammetry and Introduction of CPDA Method. Measurement 2013, 46, 3449–3459. [Google Scholar] [CrossRef]
  43. Zhao, S.; Kang, F.; Li, J. Displacement Monitoring for Slope Stability Evaluation Based on Binocular Vision Systems. Optik 2018, 171, 658–671. [Google Scholar] [CrossRef]
  44. Visual Geometry Group. Affine Covariant Regions Datasets. 2004. Available online: http://www.robots.ox.ac.uk/~vgg/data (accessed on 15 July 2007).
Figure 1. Example of features and vertices to determine TRE and ARE.
Remotesensing 14 01697 g001
Figure 2. Experimental setups and target parts for single block and multiple blocks. (a) Single-block experiment on linear stage; (b) Multiblock experiment on steel plate.
Remotesensing 14 01697 g002
Figure 3. Repeatability of five feature matching methods. (a) Facing displacement; (b) Settlement; (c) Combined displacement.
Remotesensing 14 01697 g003
Figure 4. Matching scores of five feature matching methods. (a) Facing displacement; (b) Settlement; (c) Combined displacement.
Remotesensing 14 01697 g004
Figure 5. Block shape in reality and in the image according to the occurrence of three types of behaviors.
Remotesensing 14 01697 g005
Figure 6. Number of inlier matching features of five feature matching methods. (a) Facing displacement; (b) Settlement; (c) Combined displacement.
Remotesensing 14 01697 g006
Figure 7. Successful and failed transformed image results. (a) Successful result with KAZE (incidence angle = 60°, combined displacement); (b) successful result with SURF (incidence angle = 60°, combined displacement); (c) failed result with MinEigen (incidence angle = 70°, facing displacement); (d) failed result with ORB (incidence angle = 30°, facing displacement); (e) failed result with BRISK (incidence angle = 40°, combined displacement).
Remotesensing 14 01697 g007
Figure 8. Distribution of AREh, AREv, and ARE with different feature matching methods at facing displacement. (a) AREh; (b) AREv; (c) ARE.
Remotesensing 14 01697 g008
Figure 9. Distribution of AREh, AREv, and ARE with different feature matching methods at settlement. (a) AREh; (b) AREv; (c) ARE.
Remotesensing 14 01697 g009
Figure 10. Distribution of AREh, AREv, and ARE with different feature matching methods at combined displacement. (a) AREh; (b) AREv; (c) ARE.
Remotesensing 14 01697 g010
Figure 11. Detected features with different types of images. (a) Laboratory experiment; (b) Graffiti.
Remotesensing 14 01697 g011
Figure 12. Comparison metrics in multiblock experiment with KAZE method (incidence angle = 60°). (a) Repeatability; (b) Matching score; (c) The number of inlier matching features.
Remotesensing 14 01697 g012
Figure 13. Examples of extracting features at facing displacement. (a) Single block (pixel size: 350 × 268); (b) Block (part 2) in multiple blocks (pixel size: 330 × 298).
Remotesensing 14 01697 g013
Figure 14. Distribution of AREh, AREv, and ARE for three types of behaviors. (a) Facing displacement; (b) Settelemt; (c) Combined displacement.
Remotesensing 14 01697 g014
Table 1. Average and standard deviation of AREh, AREv, and ARE with different feature matching methods.
MethodFacing DisplacementSettlementCombined Displacement
AverageStandard DeviationAverageStandard DeviationAverageStandard Deviation
AREhKAZE0.870.311.140.570.800.43
SURF2.191.592.162.133.354.21
MinEigen24.4542.2671.77226.519.3417.52
AREvKAZE0.890.511.170.661.360.88
SURF2.712.722.353.134.558.35
MinEigen24.9250.2567.76195.7411.5922.77
AREKAZE0.880.281.150.401.080.52
SURF2.452.052.252.603.956.17
MinEigen24.6842.7669.76210.8910.4719.59
Table 2. Minimum and maximum values for the feature performance evaluation measured from the single- and multiblock experiments.
Comparison MatrixSingle-Block Experiment
(at Incidence Angle = 50–80°)
Multiblock Experiment
Min.Max.Min.Max.
Repeatability0.32470.49650.35990.8289
Matching score0.21310.36540.14490.4715
Number of inlier matching features139.9208.490440
Table 3. Average values for feature performance evaluation of KAZE method with ATs and NTs.
Average of All Displacement TypesRepeatabilityMatching ScoreNo. of Inlier Matching PointsARE
AT
(Parts 1–12)
0.530.282500.8
NT
(Parts 13–16)
0.480.312030.87
Publisher’s Note: MDPI stays neutral with regard to jurisdictional claims in published maps and institutional affiliations.

