Article

Soil Salinity Detection and Mapping in an Environment under Water Stress between 1984 and 2018 (Case of the Largest Oasis in Africa-Morocco)

1
International Water Research Institute (IWRI), Mohammed VI Polytechnic University, Ben Guerir 43150, Morocco
2
L3G, Laboratory of Geoscience, Geo-Environment and Civil Engineering, Faculty of Sciences and Techniques (P.B. 549), Cadi Ayyad University, Marrakech 40000, Morocco
3
DTO/DDZO/ANDZOA, Rabat 10170, Morocco
4
IMED-Lab, Department of Applied Physics, Faculty of Sciences and Techniques (P.B. 549), Cadi Ayyad University, Marrakech 40000, Morocco
5
ORMVA-Tf, Errachidia BP 17, Morocco
6
Centre for Remote Sensing Applications (CRSA), Mohammed VI Polytechnic University, Ben Guerir 43150, Morocco
7
High Energy and Astrophysics Laboratory, Faculty of Sciences Semlalia, Cadi Ayyad University, Marrakech 40000, Morocco
8
Centre D’études Spatiales de la Biosphère (Cesbio), Institut de Recherche Pour le Développement (IRD), Unité Mixte de Recherche (UMR), 31401 Toulouse, France
*
Author to whom correspondence should be addressed.
Remote Sens. 2022, 14(7), 1606; https://doi.org/10.3390/rs14071606
Submission received: 23 February 2022 / Revised: 22 March 2022 / Accepted: 23 March 2022 / Published: 27 March 2022
(This article belongs to the Special Issue Remote Sensing in Irrigated Crop Water Stress Assessment)

Abstract

:
Water stress is one of the factors controlling agricultural land salinization and is also a major problem worldwide. According to FAO and the most recent estimates, it already affects more than 400 million hectares. The Tafilalet plain in Southeastern Morocco suffers from soil salinization. In this regard, the GIS tools and remote sensing were used in the processing of 19 satellite images acquired from Landsat 4–5, (Landsat 7), (Landsat 8), and (Sentinel 2) sensors. The most used indices in the literature were (16 indices) tested and correlated with the results obtained from 25 samples taken from the first soil horizon at a constant depth of 0.20 m from the 2018 campaign. The linear model, at first, allows the selection of five better indices of the soil salinity discrimination (SI-Khan, VSSI, BI, S3, and SI-Dehni). These last indices were the subject of the application of a logarithmic model and polynomial models of degree two and four to increase the prediction of saline soil.. After studies and analysis, we concluded that the second-degree polynomial model of the salinity index (SI-KHAN) is the most efficient one for detecting and mapping soil salinity in the Tafilalet oasis, with a coefficient of determination (R2) and the Nash–Sutcliffe efficiency (NSE) equal to 0.93 and 0.86, respectively. Percent bias (PBIAS) calculated for this model equal was 1.868% < 10%, and the low value of the root mean square error (RMSE) confirms its very good performance. The drought cyclicity led to the intensification of the soil salinization process and accelerated soil degradation. The standardized precipitation anomaly index (SPAI) is strongly correlated to soil salinity. The hydroclimate condition is the factor that further controls this phenomenon. An increase in salinized surfaces is observed during the periods of 1984–1996 and 2000–2005, which cover a surface of 11.50 and 24.20 km2, respectively, while a decrease of about 50% is observed during the periods of 1996–2000 and 2005–2018.

1. Introduction

Agriculture remains the main economic activity in Tafilalet (90%), for a population of around 600,000 inhabitants, 71% of whom are rural, according to the Regional Office of Agricultural Development of Tafilalet (ORMVA/TF). This requires the protection of soil resources from all the phenomena that threaten it to ensure economic, social, and environmental stability in the Tafilalet plain. In order to do this, a diagnosis of changes in the natural environment (namely, the condition of the soil, plant cover and water surfaces, etc.) is needed. Soil salinity is a limiting factor in agricultural production in the world in general and in Morocco specifically. However, climatic risks are not the only phenomena responsible for the weakness of agricultural production, but they are associated with the risks of salinization and silting up of the soils. The most threatened areas are those under arid to semi-arid climates, which are characterized by a high degree of water stress. Morocco is an example with more than 5% of the soils that are already affected by salinization to different degrees [1]. Soils salinization is characterized by its evolution in both time and space. Given its extent, the use of traditional methods (laboratory analysis, field) to monitor soil salinity is insufficient and unsuited to catch the fast evolution of this phenomenon. This leads us to think about exploring other, faster, less expensive, and fairly reliable methods of investigation. The Erfoud–Errissani Oasis is a very delicate ecosystem given its geographical position classified in a desert area controlled by: low precipitation, high evaporation values, and silting up. In this region, soil salinization threatens food and water security and the stability of biodiversity [2,3,4,5,6].
Salinization is the process of enriching the soil with soluble salts, which results in the formation of saline soil. Furthermore, it can be defined as a process of accumulation of soluble salts. According to [7,8], soil salinization is the process of accumulation of salts on the soil surface and in the root zone, which causes harmful effects on plants and soils. This leads to a reduction of yields and impacts soil fertility (sterilization of the soil). Salinization generally occurs when the amount of water lost from the soil through evapotranspiration exceeds the infiltration rate. Salinization results in an increase in osmotic pressure, which makes the water more difficult to mobilize by plants, the toxicity of certain ions for plants (Cl, Na+, etc.), and soil degradation (changes in structural state, reduction of hydraulic conductivity, etc.). Climate change is a catalyst for the salinization processes, which are originally linked to agricultural practices, the dissolution of facies crossed by water, the conditions of permeability and drainage, the quality of irrigation water and the nature of crops, the quality and nature of soils, and topography [9,10,11,12,13]. In different climates and geographical contexts, this phenomenon manifests itself on vast spatio-temporal scales and intensifies in periods of water stress, which is characterized by high values of temperature and evaporation and also a rarity or even absence of precipitation, thus generating a concentration of salts on the soils [14,15]. According to previous studies [16,17], soil salinity affects about 40 to 45% of the world’s land and causes massive economic losses. The monitoring of soil salinization is a necessity for the authorities to produce knowledge on the state of the soil at all times. Traditional methods such as the measurement of the electrical conductivity of saturated soil pulp [18,19,20] and require sampling missions, preparation, treatment, and analysis in the laboratory, which is costly in resources and in time. Hence, remote sensing and processing satellite images show as promising tools for monitoring soil conditions over large areas and over long periods. Over the past decades, the field of remote sensing and the GIS (geographic information system) has evolved considerably and provides an opportunity to map the spatio-temporal evolution of soil salinity as well as the extraction of instantaneous information on large perimeters [18,21,22,23,24,25,26,27,28,29,30,31,32,33,34,35,36,37,38,39,40,41,42].
In this work, we aim to explore the potential of satellite imagery to detect the spatio-temporal variation of soil salinity in the Tafilalet plain. This is investigated over a period of 34 years using spectral indices, regression models, and a time series of 19 satellite images from four sensors: Thematic Mapper (TM), Enhanced Thematic Mapper Plus (ETM+), Operational Land Imager (OLI), and Multispectral Instrument (MSI). Soil salinity is mainly controlled by the cyclicity of droughts in desert regions such as the Tafilalet plain; in this sense, the precipitation data over a period of 36 years (1983–2019) are used to calculate SPAI (Standardized precipitation anomaly index) [43], which will allow us to assess the impact of water stress on the soil salinization phenomenon. Following the multi-sensor data preprocessing and validation steps, maps of the spatio-temporal variation in soil salinity are derived using linear, logarithmic, and polynomial degree two and four regression models. The present study will certainly allow us to deepen our understanding of the occupation and the spatio-temporal variability of soil salinity in a desert environment, as well as the understanding of the impact of water stress on this phenomenon. It will also make it possible to provide relevant information to the authorities concerned on the state of the soils in this vast oasis.

2. Materials and Methods
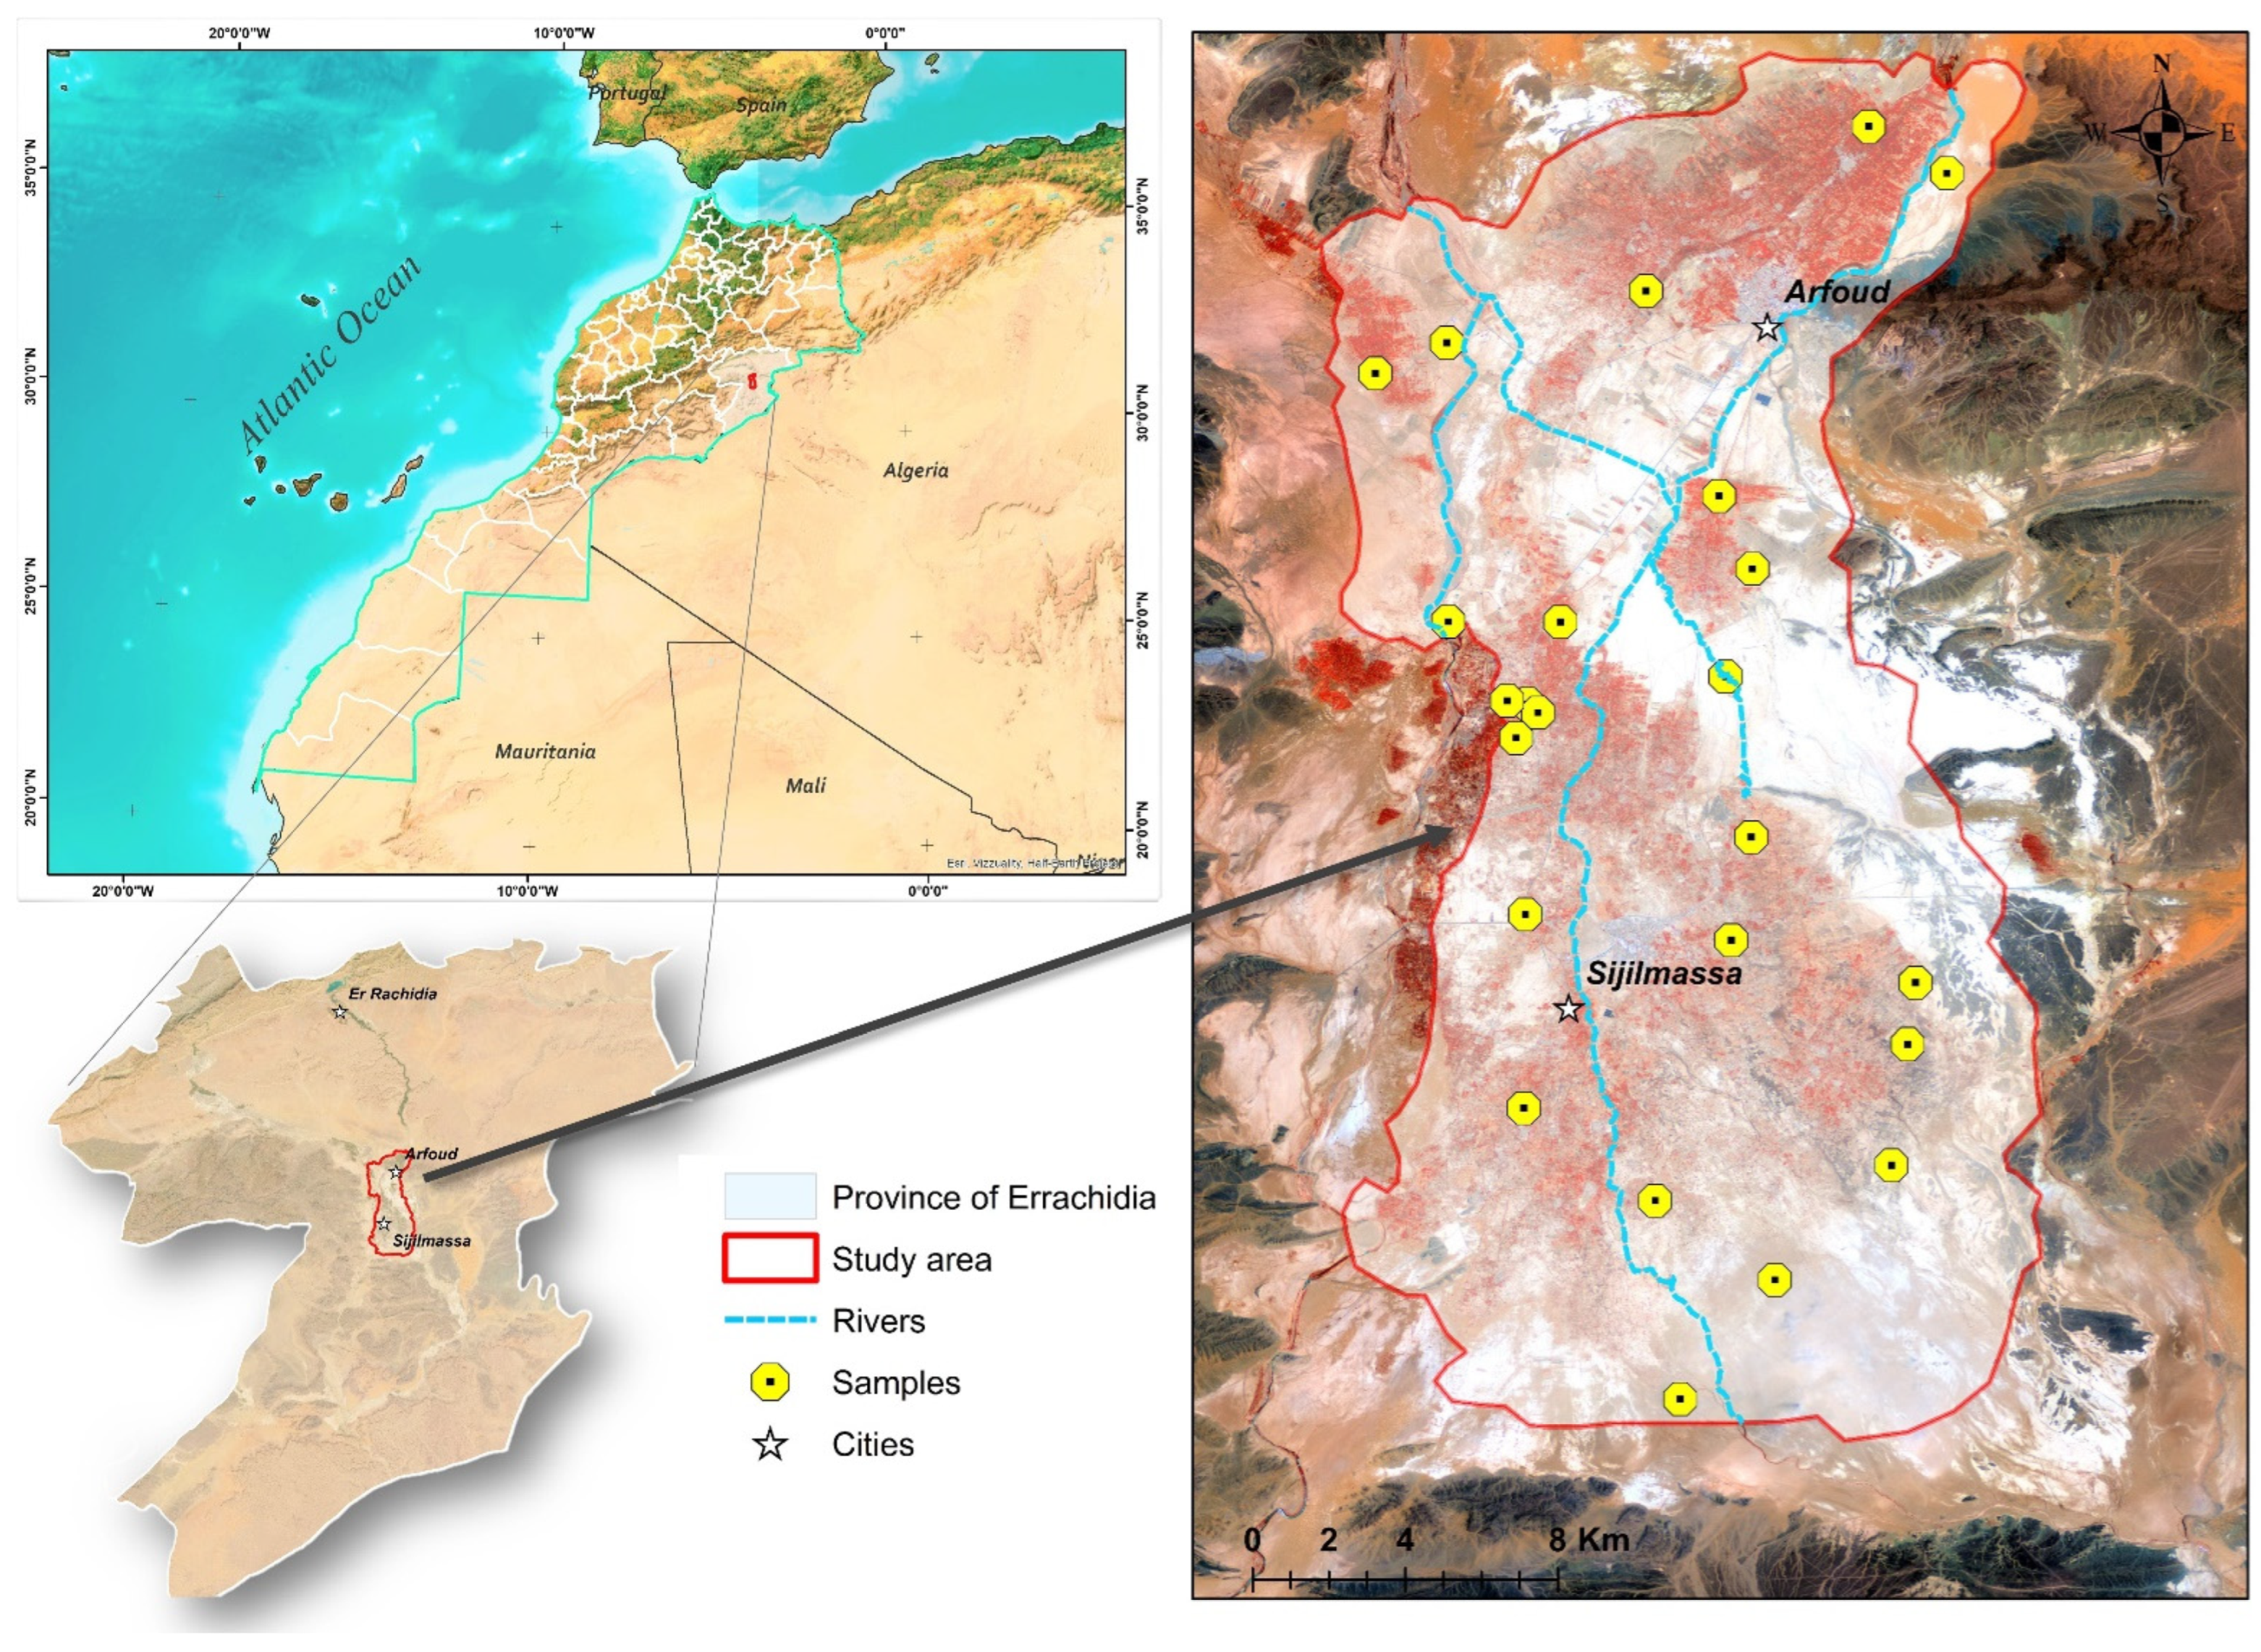
2.1. Study Area

The Tafilalet plain is located in the Errachidia region (southeast of Morocco, Figure 1). It covers an area of 421 km2, limited between latitudes 31°10′ and 31°30′ north and between longitudes 4°10′ and 4 °21′ west. Hydrologically, the study area includes 2 large watersheds: the Ziz and the Gheris, supplied respectively by Ziz and Gheris Rivers, oriented in the north–south directions. These basins are limited to the north by the High Atlas Mountain, to the south and east by Algeria, and to the west by the Maider watershed. At the municipal level, there are 7 municipalities in two circles: Erfoud and Errissani, 5 of them are rural, and 2 are urban. The prevailing climate in the region is arid to semi-desert climate according to the Koppen classification. This region is known by a strong continental influence and is marked by variable altitudes from 800 to 1200 m, which decrease from north to south. It is characterized by strong variations of temperature and seasonal distribution of rains, which are scarce and very irregular, going from 270 mm on the reliefs of the High Atlas to 130 mm in the Errachidia area to drop to less than 70 mm at the level of the Tafilalet plain. The rainfall is controlled by the geographical position, the presence of the Atlas barrier culminating at altitudes above 3200 m, and by the intrusion of hot winds of Saharan origin, but also by climate change [44,45,46,47,48,49]. The temperatures generally show significant seasonal variations with a very hot summer, and a very cold winter, the opening of the plain on the Saharan domain to the south and the east allows summer temperatures sometimes to reach daily maximums of 50 °C, which explains the intense values of the evapotranspiration, that reaches a total of approximately 1159 mm/year.
Apart from cultivated soils of alluvial origin, the soils of the Tafilalet plain are of the little developed class because of the climatic factor, which has hampered their development. These soils are subject to intense wind and water erosion, which is due, above all, to the lack of plant cover capable of providing effective protection against erosion. According to [50], several classes of soils are found in the north of the province and in mountain areas. These are mainly calcimagnesic soils, comprising brown calcareous soils on limestone or shale substrate and calcareous xerorankers on shale. In the south, there are rough mineral soils, little evolved soils, and salsodic soils [50,51].

2.2. Field Measurement of Soil and Analysis

The soil samples were collected during a field survey, which lasted 8 days (from 15 to 22 May 2018) and carried out in the Tafilalet plain. The sampling points are distributed in such a way as to cover the entire study area so that the results are representative of the whole area; the choice of this mesh is also made to represent the different soils types of the region which are generally homogeneous and slightly different. The terrain is also very rugged and difficult to access, which imposes very limited sampling. The 25 samples were taken from the first soil horizon at a constant depth of 0.20 m using an agronomic auger (Hand Auger; AK, USA); the soils sampled are mostly Fluvisols, genetically young soils deposited by the Ziz and Ghéris wadis during floods, and Durisols, typical of arid and semi-arid environments and containing secondary silica. The samples were placed in sealable plastic bags and numbered with GPS (Garmin GPSMAP 64S, USA) coordinates. Electrical conductivity (EC1:5) is directly proportional to the salt content of soil, and the 1/5 extract gives a rough idea of the electrical conductivity (EC1:5) value. In order to prepare the 1/5 extract, 5 g of the sieved 2 mm soil cleaned of residues and roots are weighed, 25 mL of distilled water are added, stirred for one hour to mobilize the ions, and finally, the electrical conductivity is measured with a conductivity meter (PCE-CM 41; France).

2.3. Images Data and Processing

The satellite images (Table 1) used in the work were acquired using equipment that captures information in the form of signals recorded from the Landsat (4–5, 7, and 8) and Sentinel 2 satellites in the range of 10 to 60 m. The images are freely downloaded from the United States Geological Survey (USGS) Earth Explorer and the Copernicus Open Access Hub of European Space Agency Signature (ESA). The acquisition is controlled firstly by the availability of images at the sites, by the state of the atmosphere, namely the release of dust and clouds, which makes viewing and interpreting the image sometimes difficult. The choice of the time interval between 1984 and 2018 aims to visualize the climatic effect such as drought periods and agricultural programs on soil salinization. The images undergo atmospheric and radiometric corrections using the ENVI 5.3 software. For the mapping of soil salinity, 16 different indices as the most used and cited in the bibliography (Table 2), which give good results and which seem useful for the adapted ones on our study area, are applied. The images processing is carried out by ArcGis 10.3 and the R programming language software.
Table 1. Characteristics of Landsat and sentinel images used in the present study.
SatellitesSensorsAverage AltitudeSwathAcquisition DateSpatial Resolution
Landsat 4/5TM705 km185 km10 July 198430 m
9 June 1990
24 May 1996
30 March 2005
4 September 2010
Landsat 7ETM+705 km185 km13 August 199930 m
27 May 2000
Landsat 8OLI705 Km185 km7 March 201430 m
15 m for the panchromatic
19 April 2018
Sentinel 2MSI786 km290 km26 November 201510, 20 and30
24 May 2016
13 July 2016
20 November 2016
29 May 2017
13 July 2017
20 November 2017
14 May 2018
8 July 2018
10 November 2018
Table 2. Formula of the used and tested indices to analyze soil salinity.
IndexAbbreviationFormulasSatellite/SensorContextReferences
Salinity indexSI-KHAN(B1 ∗ B3)0.5IRS-1B LISS-IIdesertic[52]
Normalized Salinity IndexNDSI_KHAN1(B3 − B4)/(B3 + B4)IRS-1B LISS-IIdesertic[52]
Brightness IndexBI(B3 + B4)0.5IRS-1B LISS-IIdesertic[52]
Normalized Difference Salinity IndexNDSI_KHAN2(B2 − B3)/(B2+B3)IRS-1B LISS-IIdesertic[52]
Normalized Difference Salinity IndexNDSI(B4 − B5)/(B4 + B5)ASTERsemi-arid[14]
visible infrared salinity indexSIvir2 ∗ V − (R + PIR)ASTERarid[53]
Salinity index 4SI(B12 + B22)0.5SPOT2Semi-arid[54]
Salinity index 1SI-1(B4/B5)Landsat 5- TMSemi-arid[55]
Salinity index 2SI-2(B7 − B4)/(B7 + B4)Landsat 5- TMSemi-arid[55]
Soil salinity and sodicity index 1SSSI-1(B5 − B6)EO-1 ALISemi-arid[56]
Soil salinity and sodicity index 2SSSI-2(B5 ∗ B6 − B6 ∗ B6)/B5EO-1 ALISemi-arid[56]
Salinity indexS1(B1/B3)IRS-1B LISS-IIdesertic[57]
Salinity indexS2(B1 − B3)/(B1 + B3)IRS-1B LISS-IIdesertic[57]
Vegetation index and soil salinityVSSI2 ∗ B2 − 5(B3 + B4)Landsat TMtemperate[58]
Salinity indexSI(B3 ∗ B4)0.5Landsat TMtemperate[58]
Salinity rationSR(B3 − B4)/(B2 + B4)Landsat TMtemperate[58]

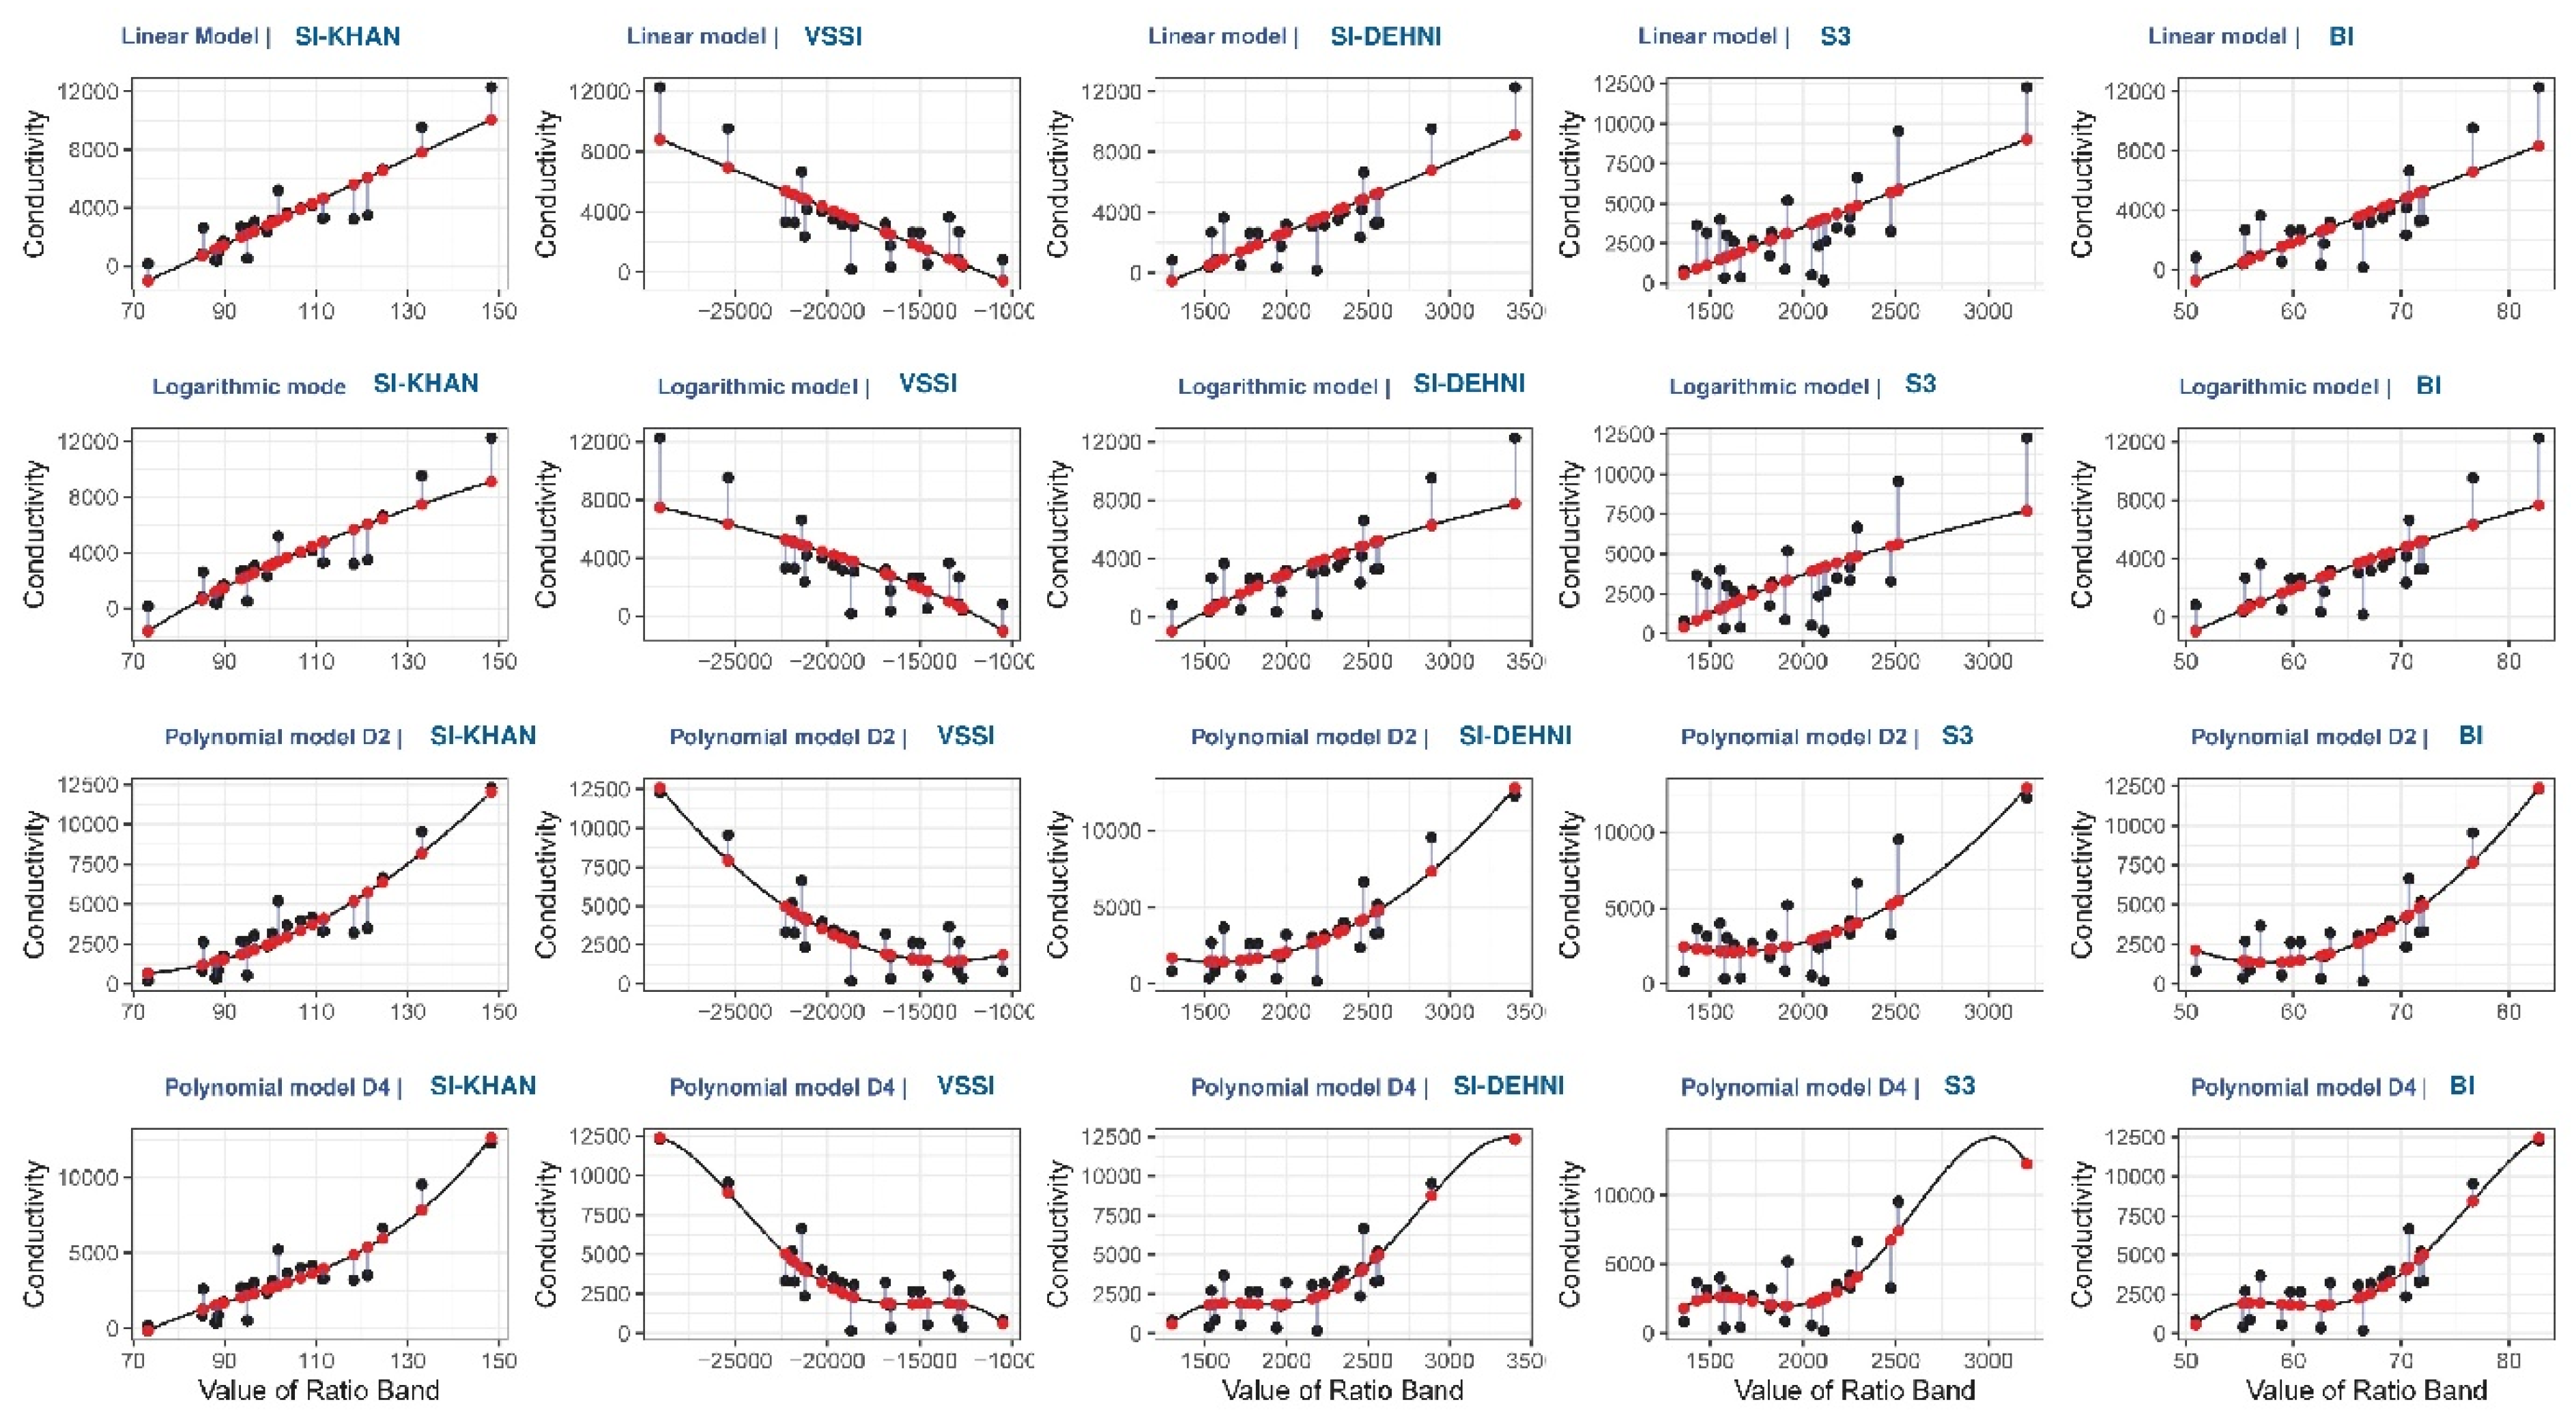
2.4. Model Construction and Evaluation

The 25 soil samples were collected to occupy the entire study area, the linear (ML), logarithmic (Mlog), polynomial D2 (MP2) and polynomial D4 (MP4) model were used to build a predictive relationship between the measured and the predicted electrical conductivity of the soil [59,60,61,62]: The associated formulas are as follow:
Y = a + b ∗ X,
Y = a + b ∗ ln (X),
Y = β0 + β1X + β22 +… + βhXh,
where:
1.
Linear model
2.
Logarithmic model
3.
Polynomial model, where (h) is called the degree of the polynomial (in our case, we have used h = 2 “quadratic” and h = 4 “quartic”).
(a)
The ordinate of the point of intersection of the line with the vertical axis in X = 0
(b)
The slope of the line, which passes through the cloud of points.
(Y)
The predicted electrical conductivity.
(X)
The measured electrical conductivity.
The coefficient of determination (R2), root mean square error (RMSE), Nash–Sutcliffe efficiency (NSE), and percent bias (PBIAS) were calculated to evaluate the performance of each model. The associated formulas are as follow [59,60,61,62]:
R 2 = ( i = 1 N ( O i Ō ) ( P i   P ¯   ) i = 1 N ( O i Ō ) 2 i = 1 N ( P i   P ¯   ) 2 ) 2 ,
NSE = 1 i = 1 N ( O i P i ) 2 i = 1 N ( O i Ō ) 2 ,
RMSE = i = 1 N ( O i P i ) 2 N ,
P B I A S = i = 1 n ( O i P i ) 100 i = 1 n O i
where:
N is the number of data samples; Pi and Oi are the predicted and observed values, and   P ¯     and Ō are their means, respectively. The RMSE is independent of the units, and the smaller the RMSE value, the more accurate. The more R2 and NSE close to one, the more efficient the model is. The optimal value of PBIAS is 0.0, which indicates that the model is performing well, for positive PBIAS indicates model underestimation bias, and vice versa for negative PBIAS values.
The standardized precipitation anomaly index SPAI (Equation (8)) is used to explain and validate the variation in soil salinity in the Tafilalet plain. The SPAI was developed by McKee et al. [43]. It is a statistical indicator used for the characterization of local or regional droughts. Based on a long-term precipitation history, the SPAI makes it possible to quantify the difference in precipitation for a period, deficit or surplus, compared to the historical average precipitation for the period. Long-term monthly rainfall data (1983–2019) were collected from the regional office for agricultural development of Tafilalet.
S P A I = P i P m S ,
where:
Pi: the monthly rainfall of year i; Pm: the average rainfall of the series on the considered time scale; S: the standard deviation of rainfall calculated from the whole time series. In our case, the temporal series of precipitations is spread over a period of 36 years from 1983 to 2019.

3. Results and Discussion

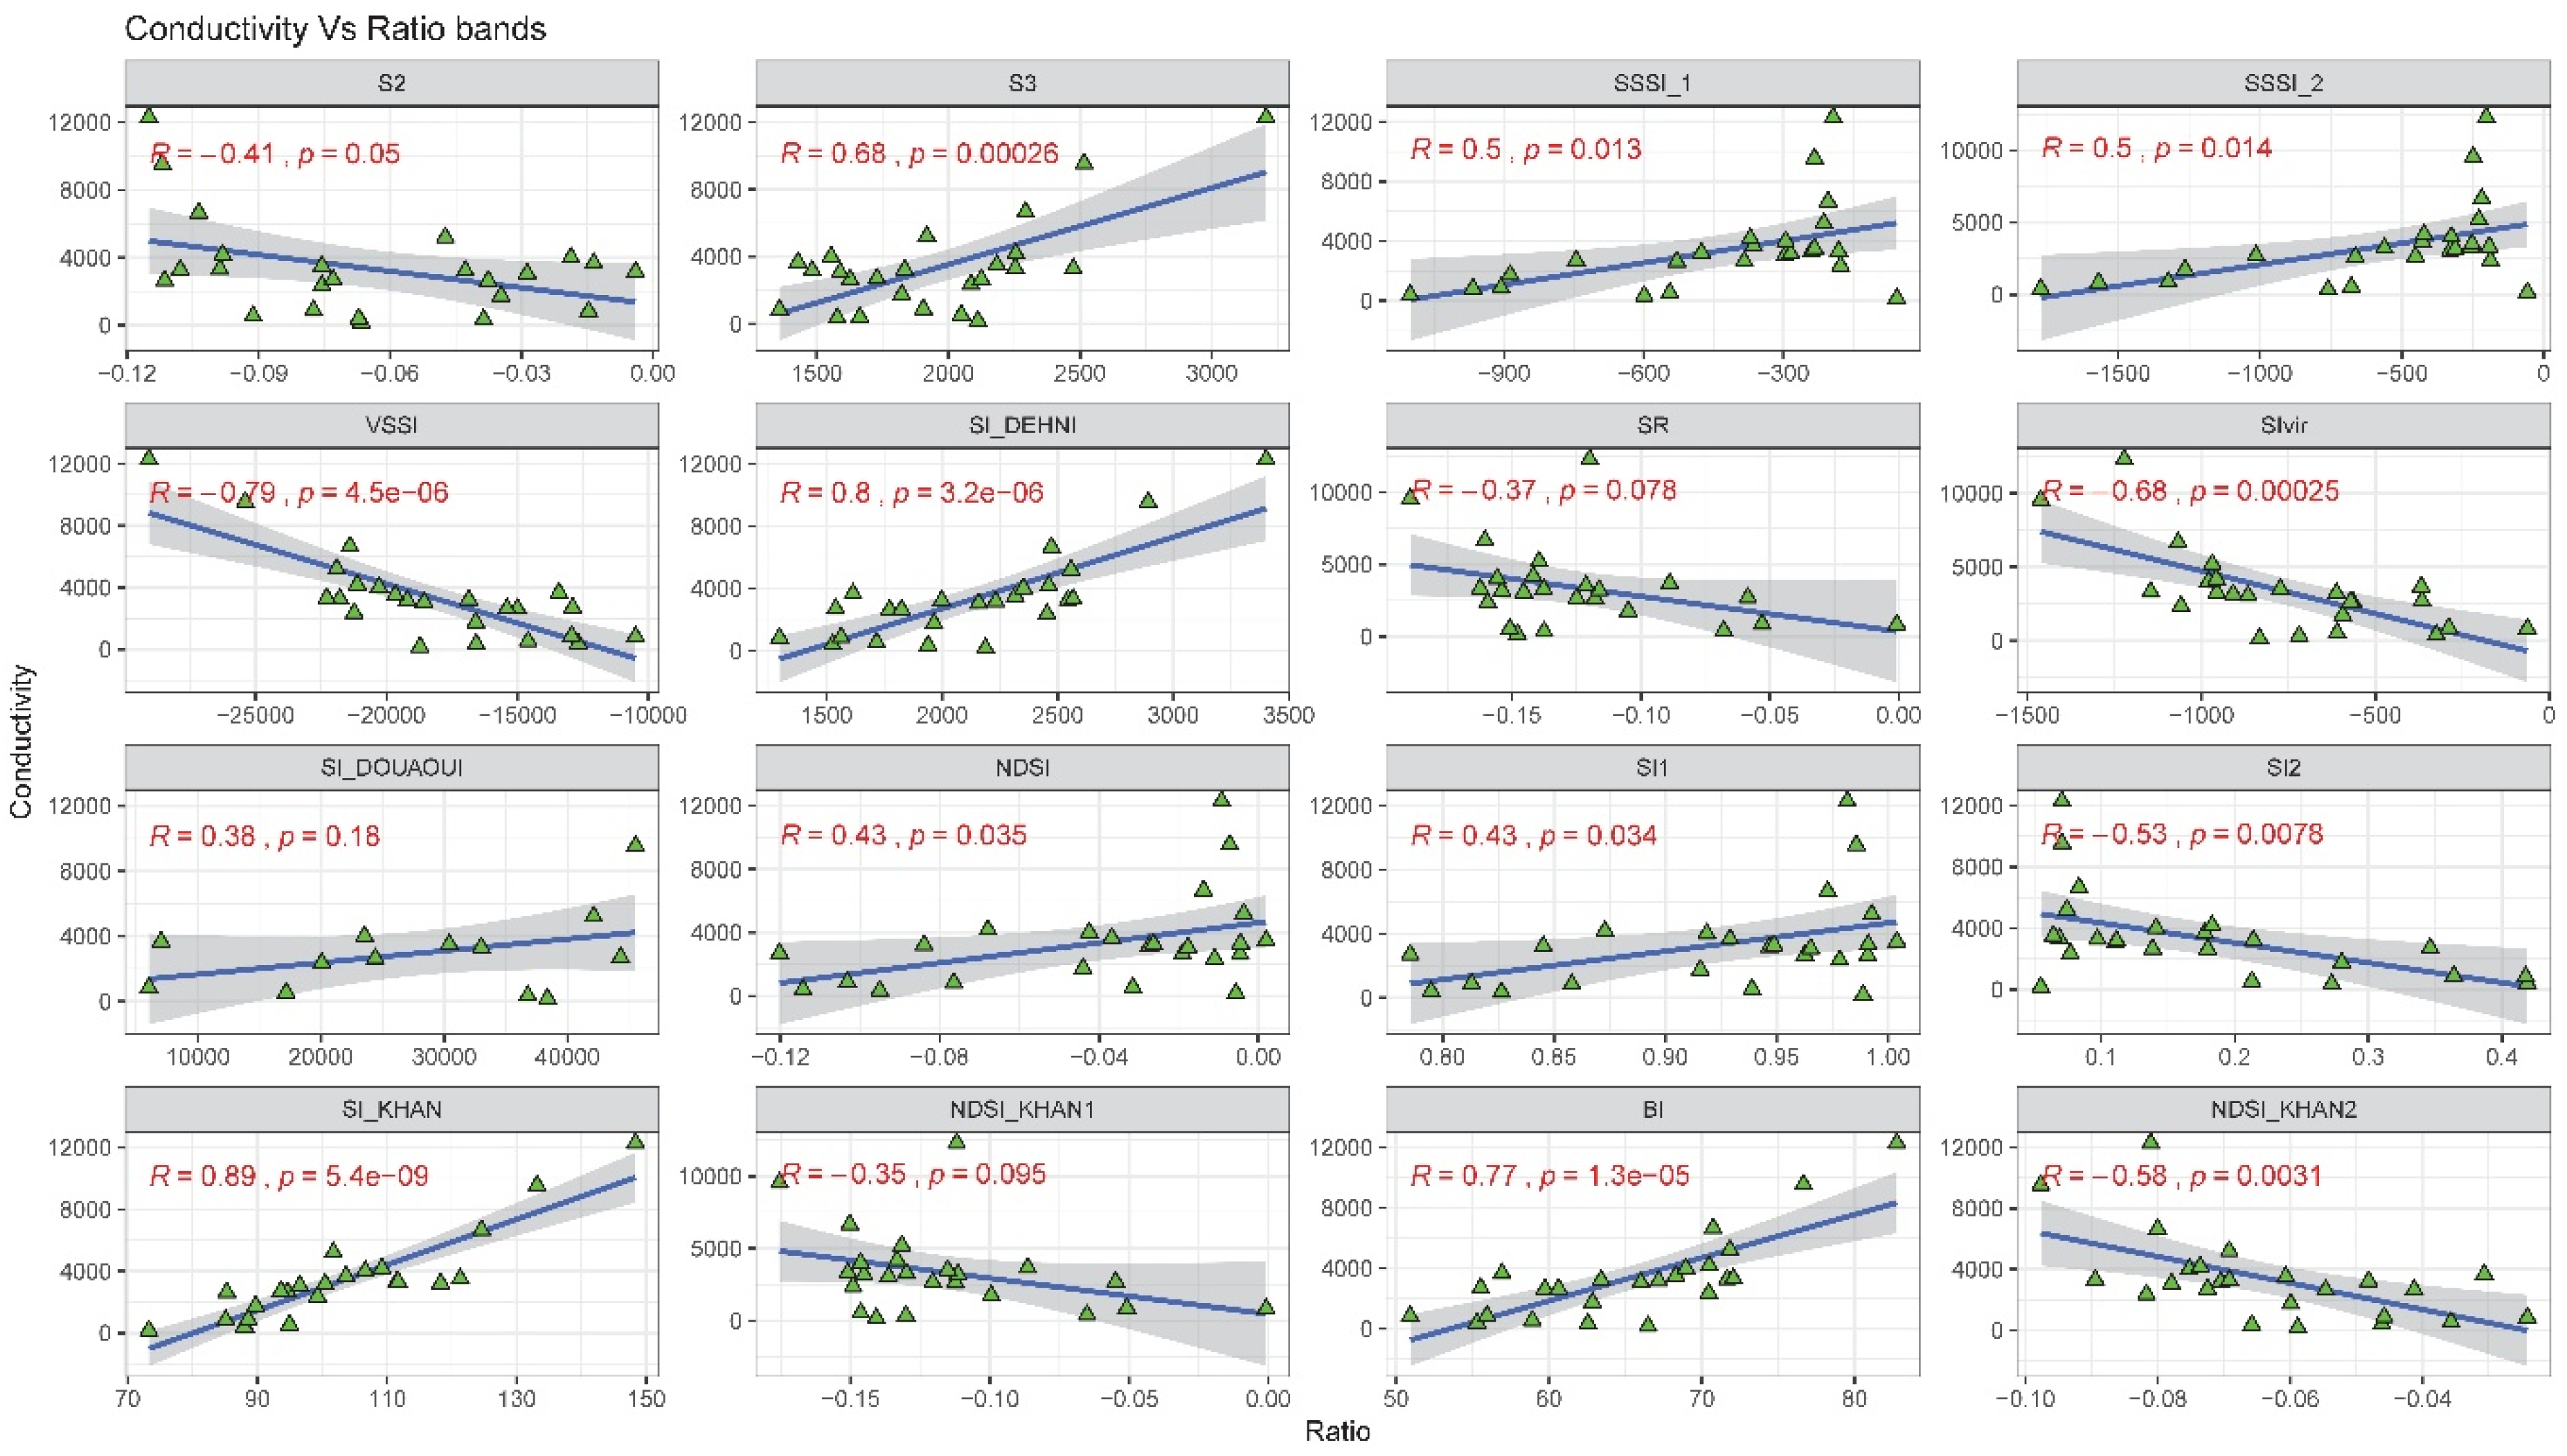
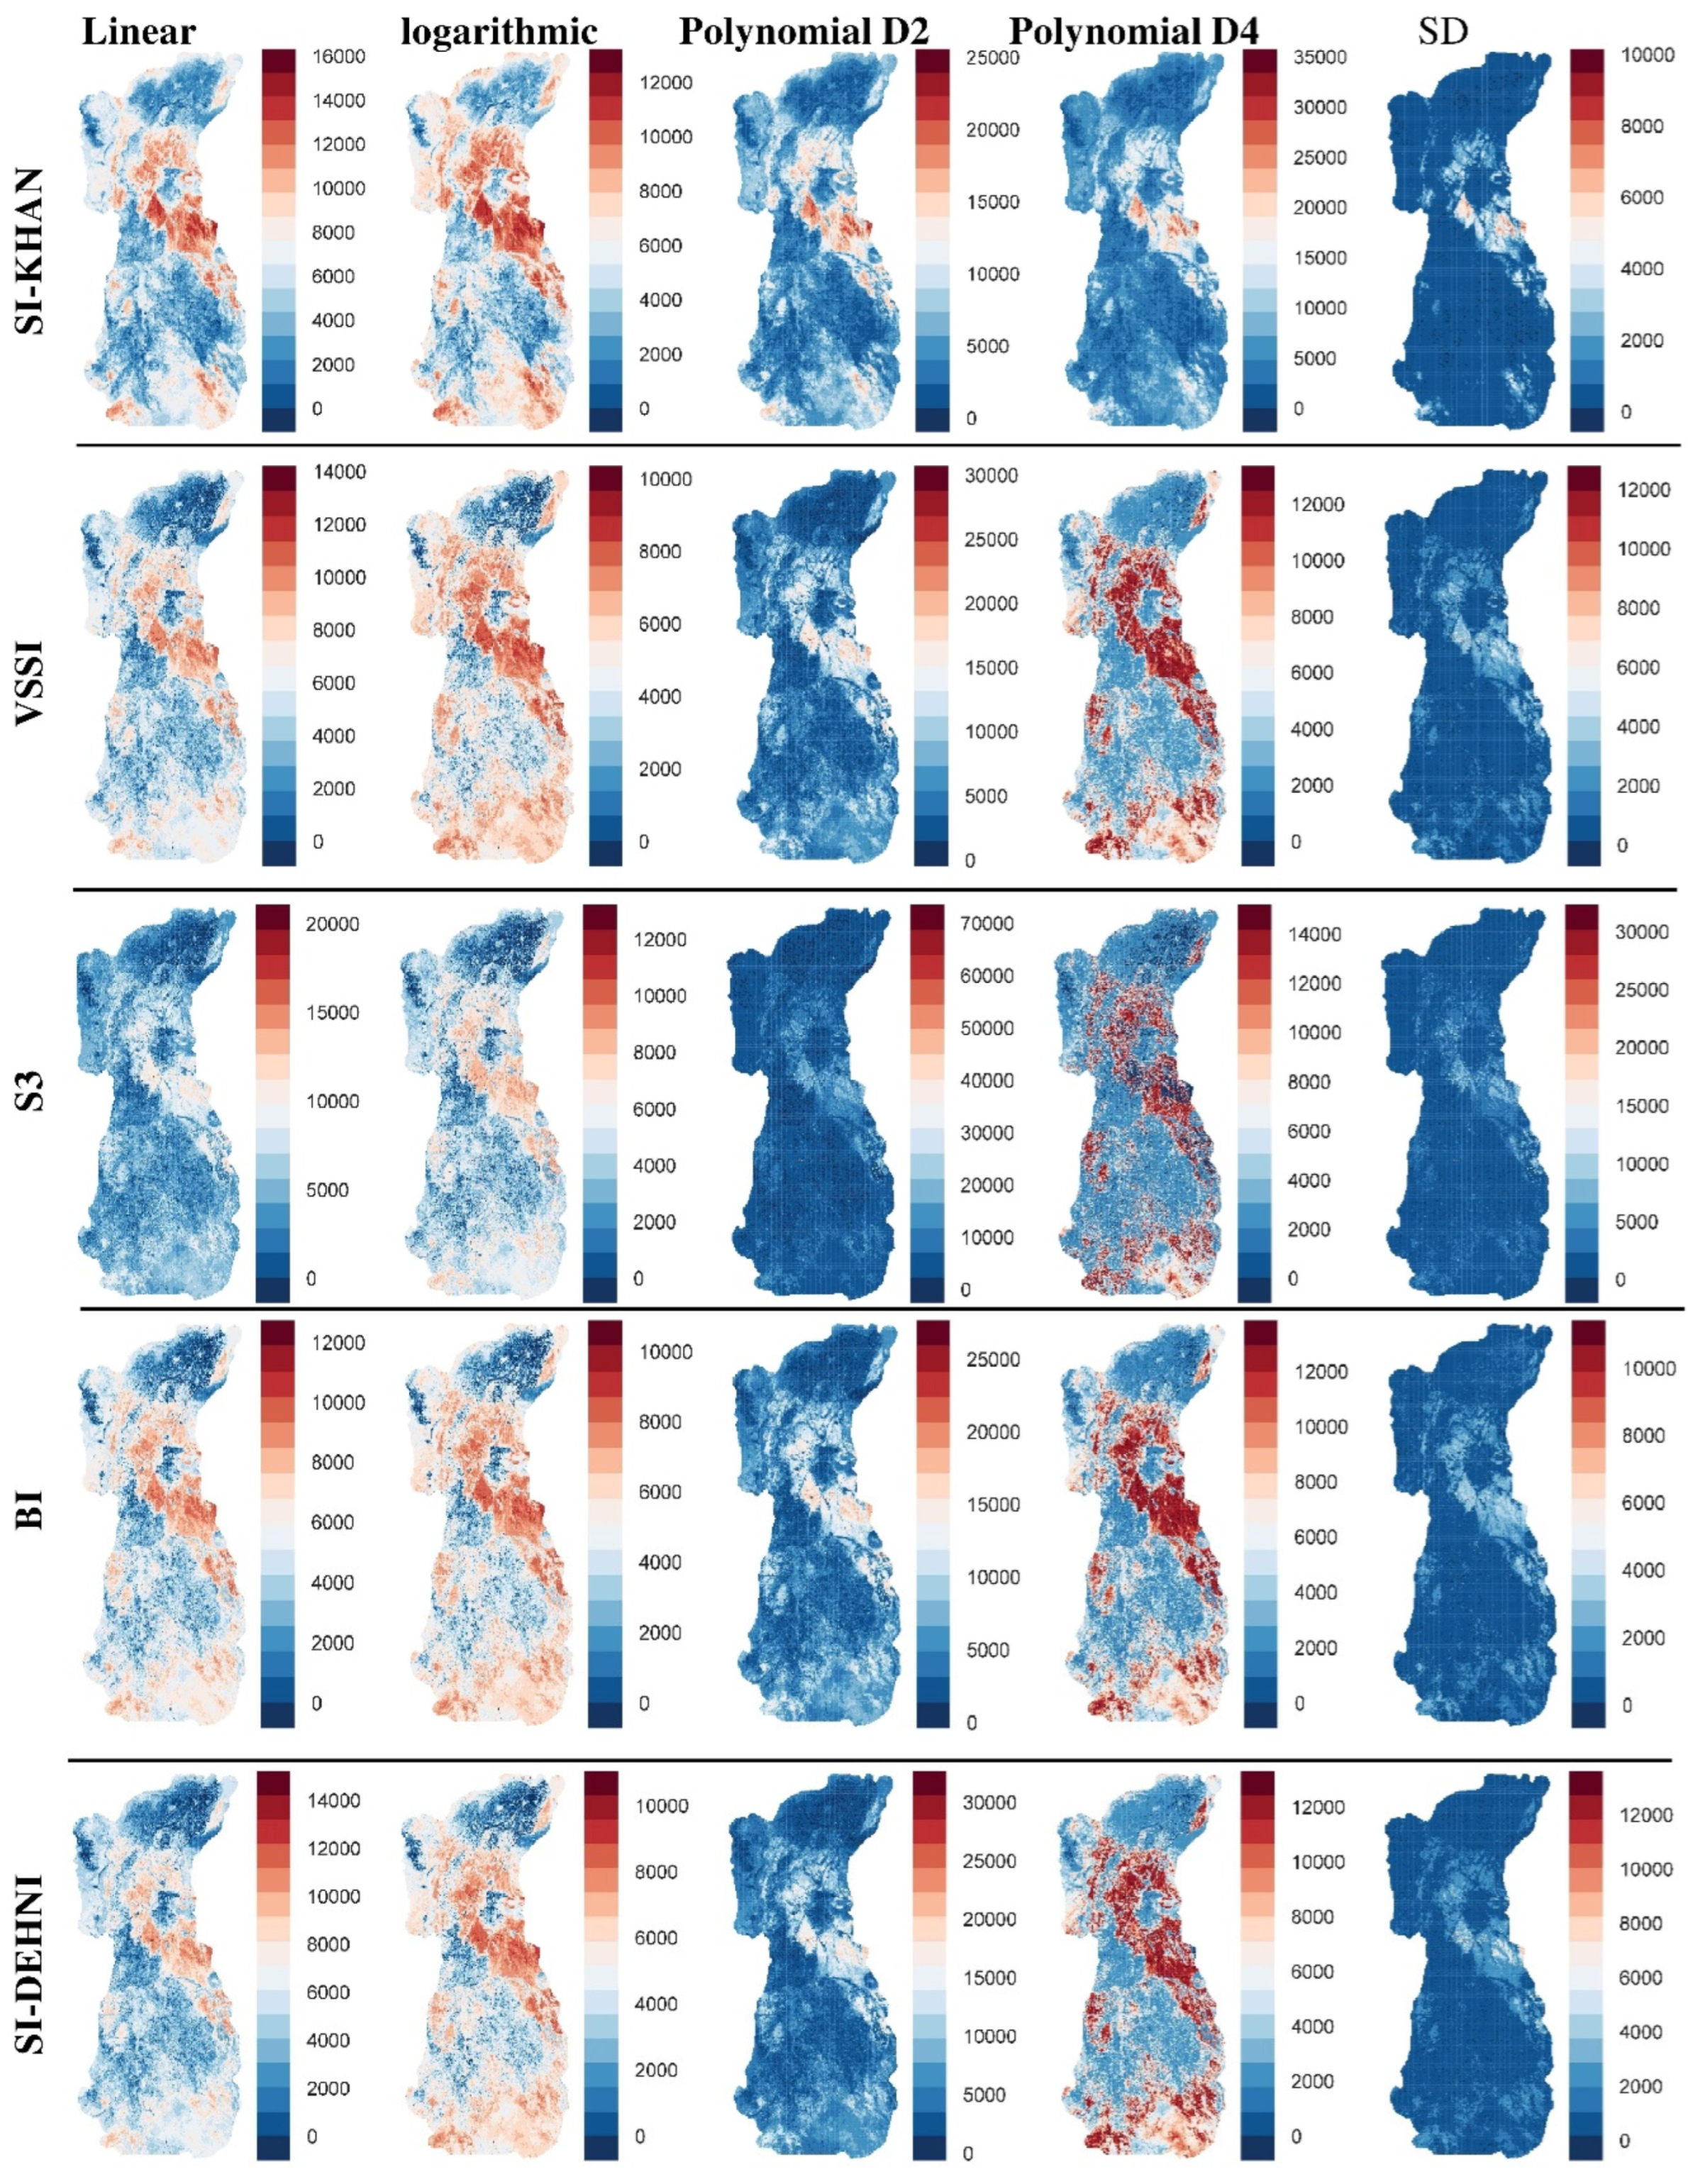
3.1. Salinity Model Validation: Visual and Statistical Analysis

In order to understand if the applied models are relevant and reliable to accurately predict soil salinity classes in this desert landscape, a validation procedure was carried out to examine its ability to predict results against ground truth. In order to achieve this step, the analysis and validation of the map derived from soil salinity were performed visually with reference to field observations and auxiliary data.
Figure 2 corresponds to the presentation of the linear correlation between the values of the indices, which represent the soil salinity estimated by each index used in this work, and the values of the real salinity resulting from the measurements of the electrical conductivity (EC1:5) in the laboratory. The p-values and the correlation coefficient (R) brought out the most appropriate indices for monitoring soil salinity by remote sensing in this environment with a high water stress index. The linear model application is presented in Figure 2, and the statistical results are also shown in the graphs to show how the spatial variation of soil salinity can be predicted by applying the linear regression model. SI-KHAN, VSSI, BI, S3, and SI-DEHNI indices were highly significant in predicting the spatial variation of soil salinity, as they met all of the model selection criteria such as low p-value and high R (Figure 2), which reflects the reliability of these indices in detecting soils affected by the phenomenon of salinization. The maps (Figure 3) show the result of applying all the indices on the reference scene after normalization (Equation (9)).
N V = X min ( X ) max ( X ) min ( X ) ,
where:
NV is the normalized value of the index; X is the proper value of each index at a given point.
The detection of soils salinity, in this area classified under water stress, and which suffers from a multitude of environmental problems, such as silting up and the scarcity of water resources, or even zero except for contributions from Hassan Addakhil dam. It is a priority to correct and prevent the definitive destruction of the structure and texture of the soils in the Tafilalet Oasis, which consequently disrupts the socio-economic stability of the population in the Tafilalet area.
The development of a regression model between the soil salinity predicted by the spectral indices and the measured one is not easy given the confusion between the different entities detected. The suggestion of a more efficient model will make it possible to estimate the values of the electrical conductivity (salinity) precisely from the indices values. The indices accepted by the linear model and which have correlation coefficients between 0.68 and 0.89 and p-values between 2.6 (10−4) and 5.4 (10−9) are the object of the logarithmic application, the polynomial D2 and the polynomial D4 models to increase the precision and performance of the soil salinity estimation techniques (Figure 4). The application of the models for each index, as shown in Figure 4, gives an idea of the reliability of the models that compare the deviation between the estimated and observed values. The more the deviation and the smaller, the more reliable the model. Except for VSSI, all the indices are positively correlated with the ground measurements. This difference is presented by the line between the values observed in each sample (black dots) and the estimated values obtained by the model (red dots).
The representation of the models in the form of maps (Figure 5) helps to visualize the interval of variation of the electrical conductivities (EC1:5) values (salinity) instead of the indices intervals. Saline lands are generally observed in the southern and western parts of the study area.
From the obtained statistical results (Table 3) and the correlation between the soil salinity estimated on the reference scene and the salinity observed in the field, the polynomial model D2 of SI-KHAN index [52] is more suited to our study context. The performance of this model is very good, validated by the low value of RMSE and PBIAS, which is equal to 1.868% (<10%). Equation (10) linked to this model will allow better discrimination and mapping saline lands by its application to the entire time series of satellite images acquired for the study interval.
EC 1 : 5   ( Predicted ) =   8038.211   +   [ ( ( 2.248254   ×   10 2 )   ×   S I K H A N )   +   ( 1.697257   ×   ( S I K H A N ) 2 ) ] , With   S I K H A N = B 1 × B 3

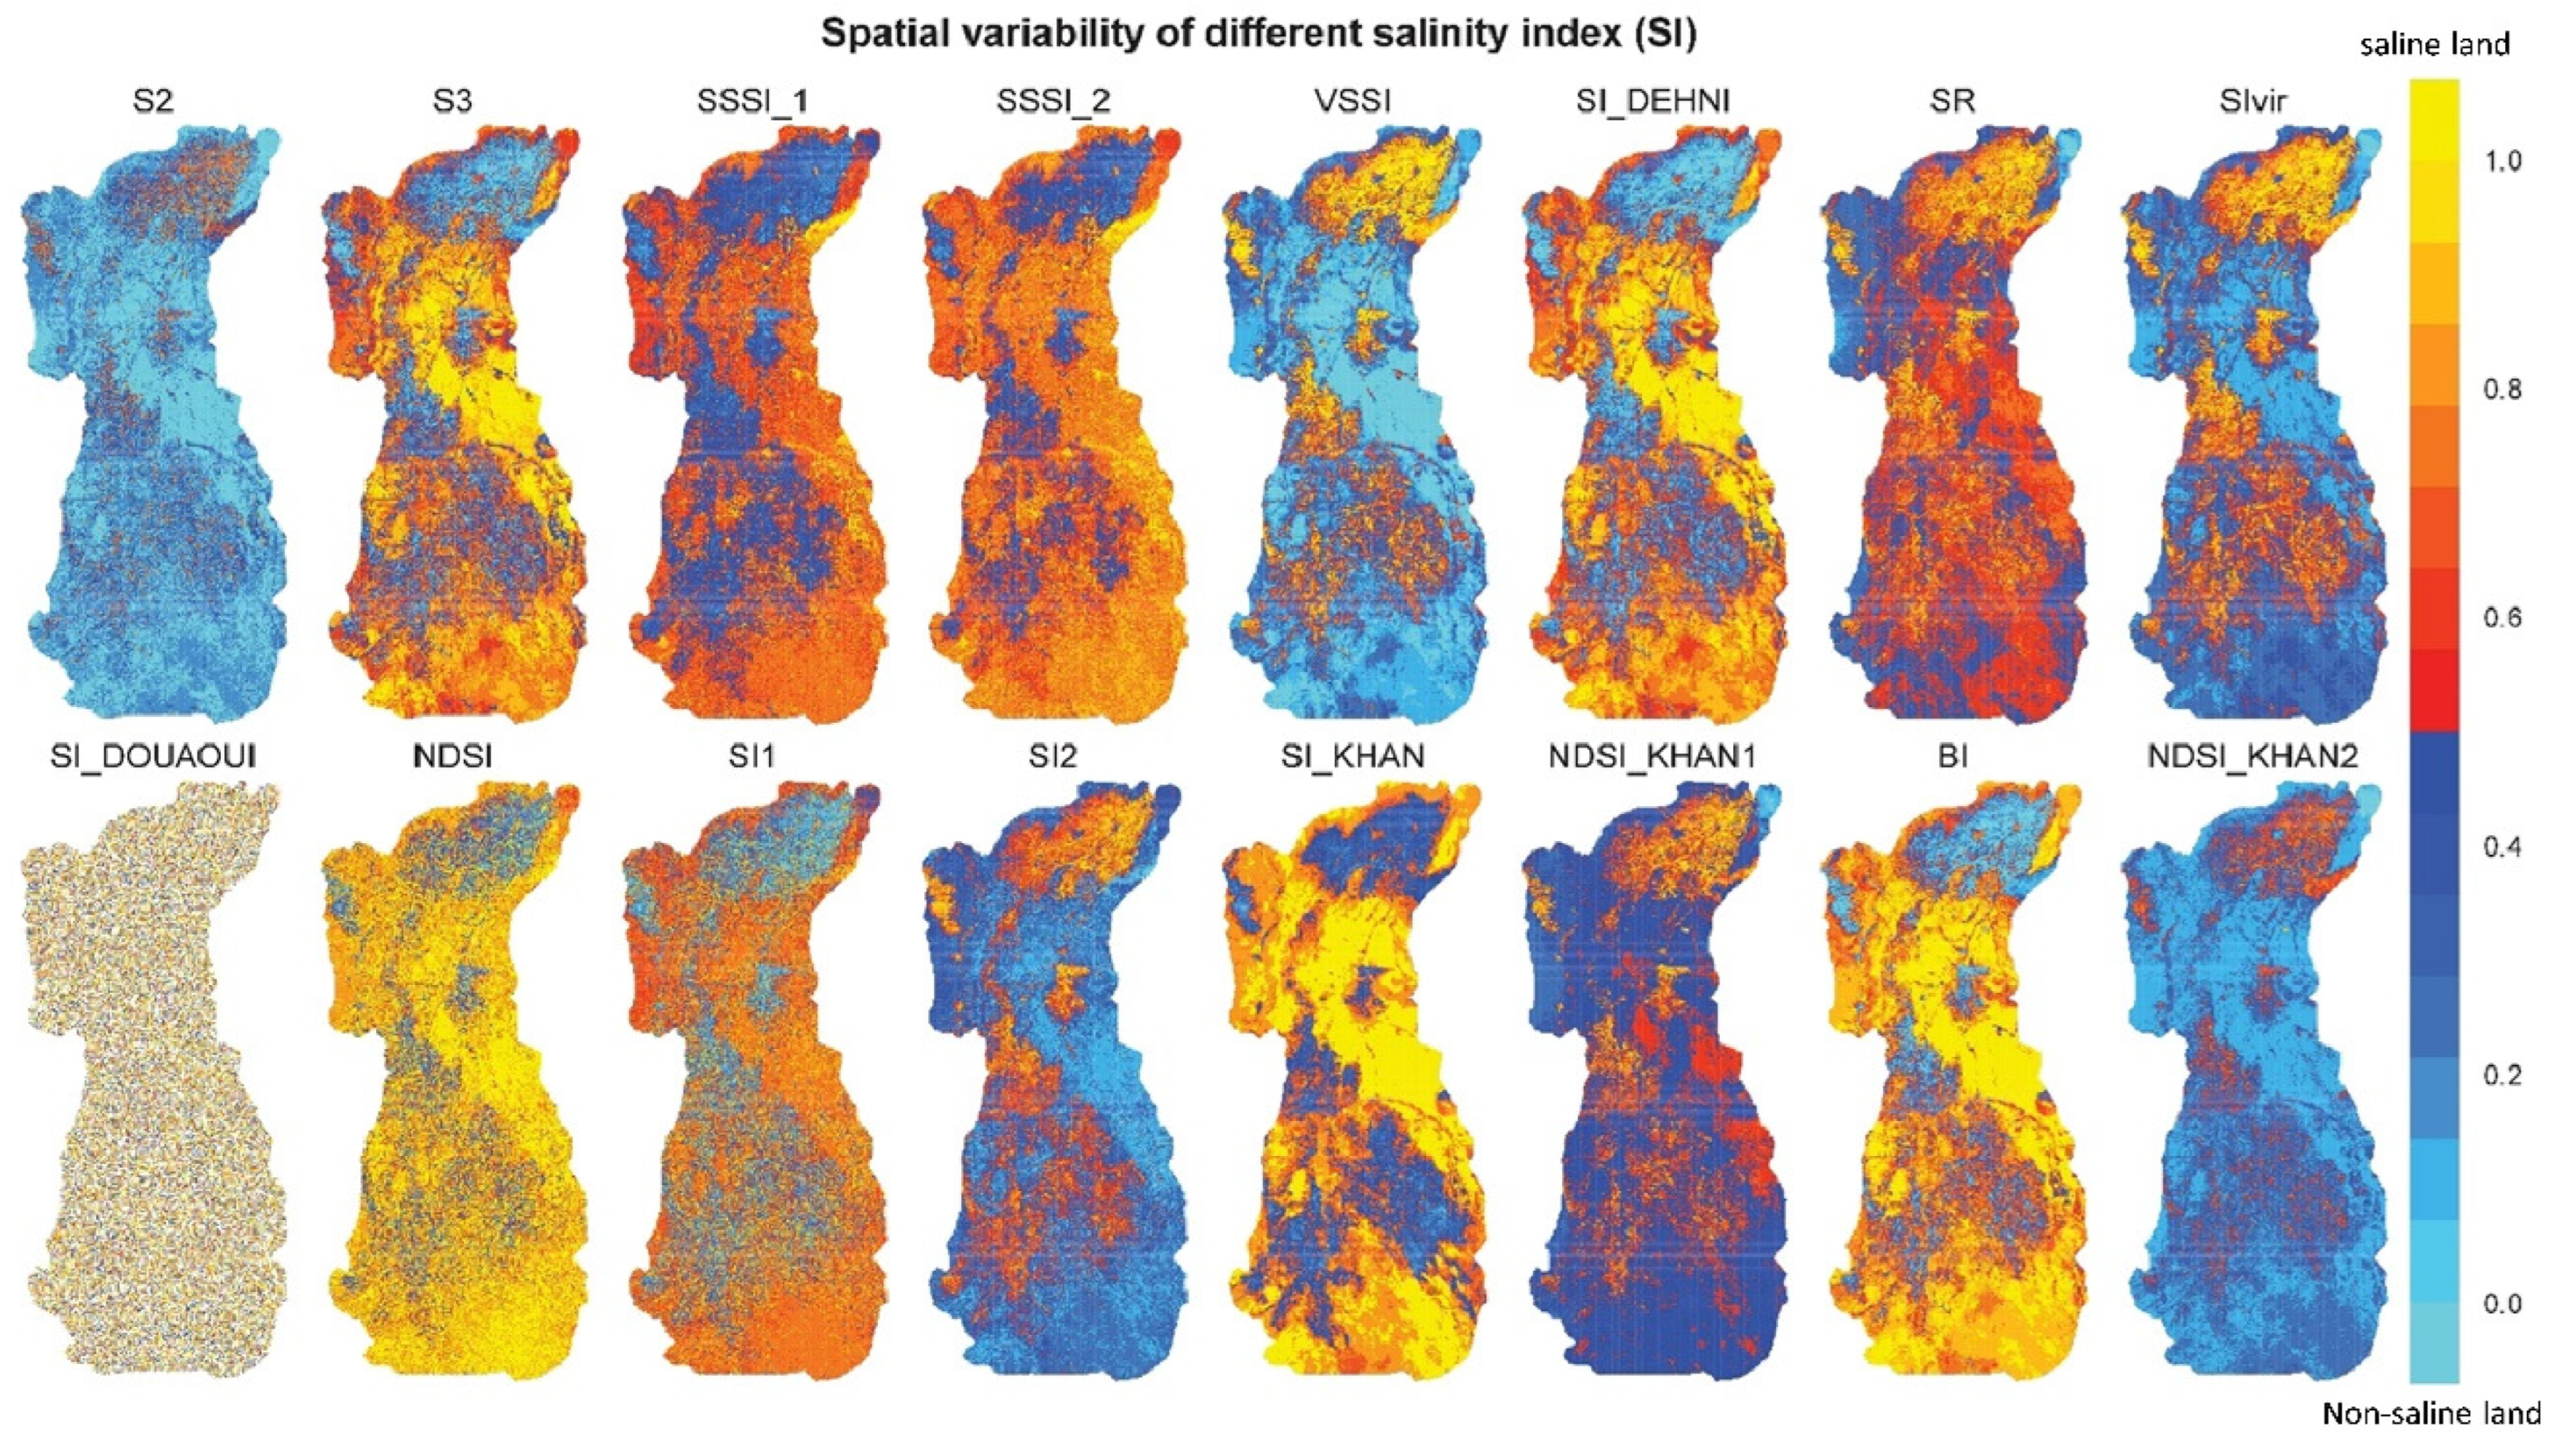
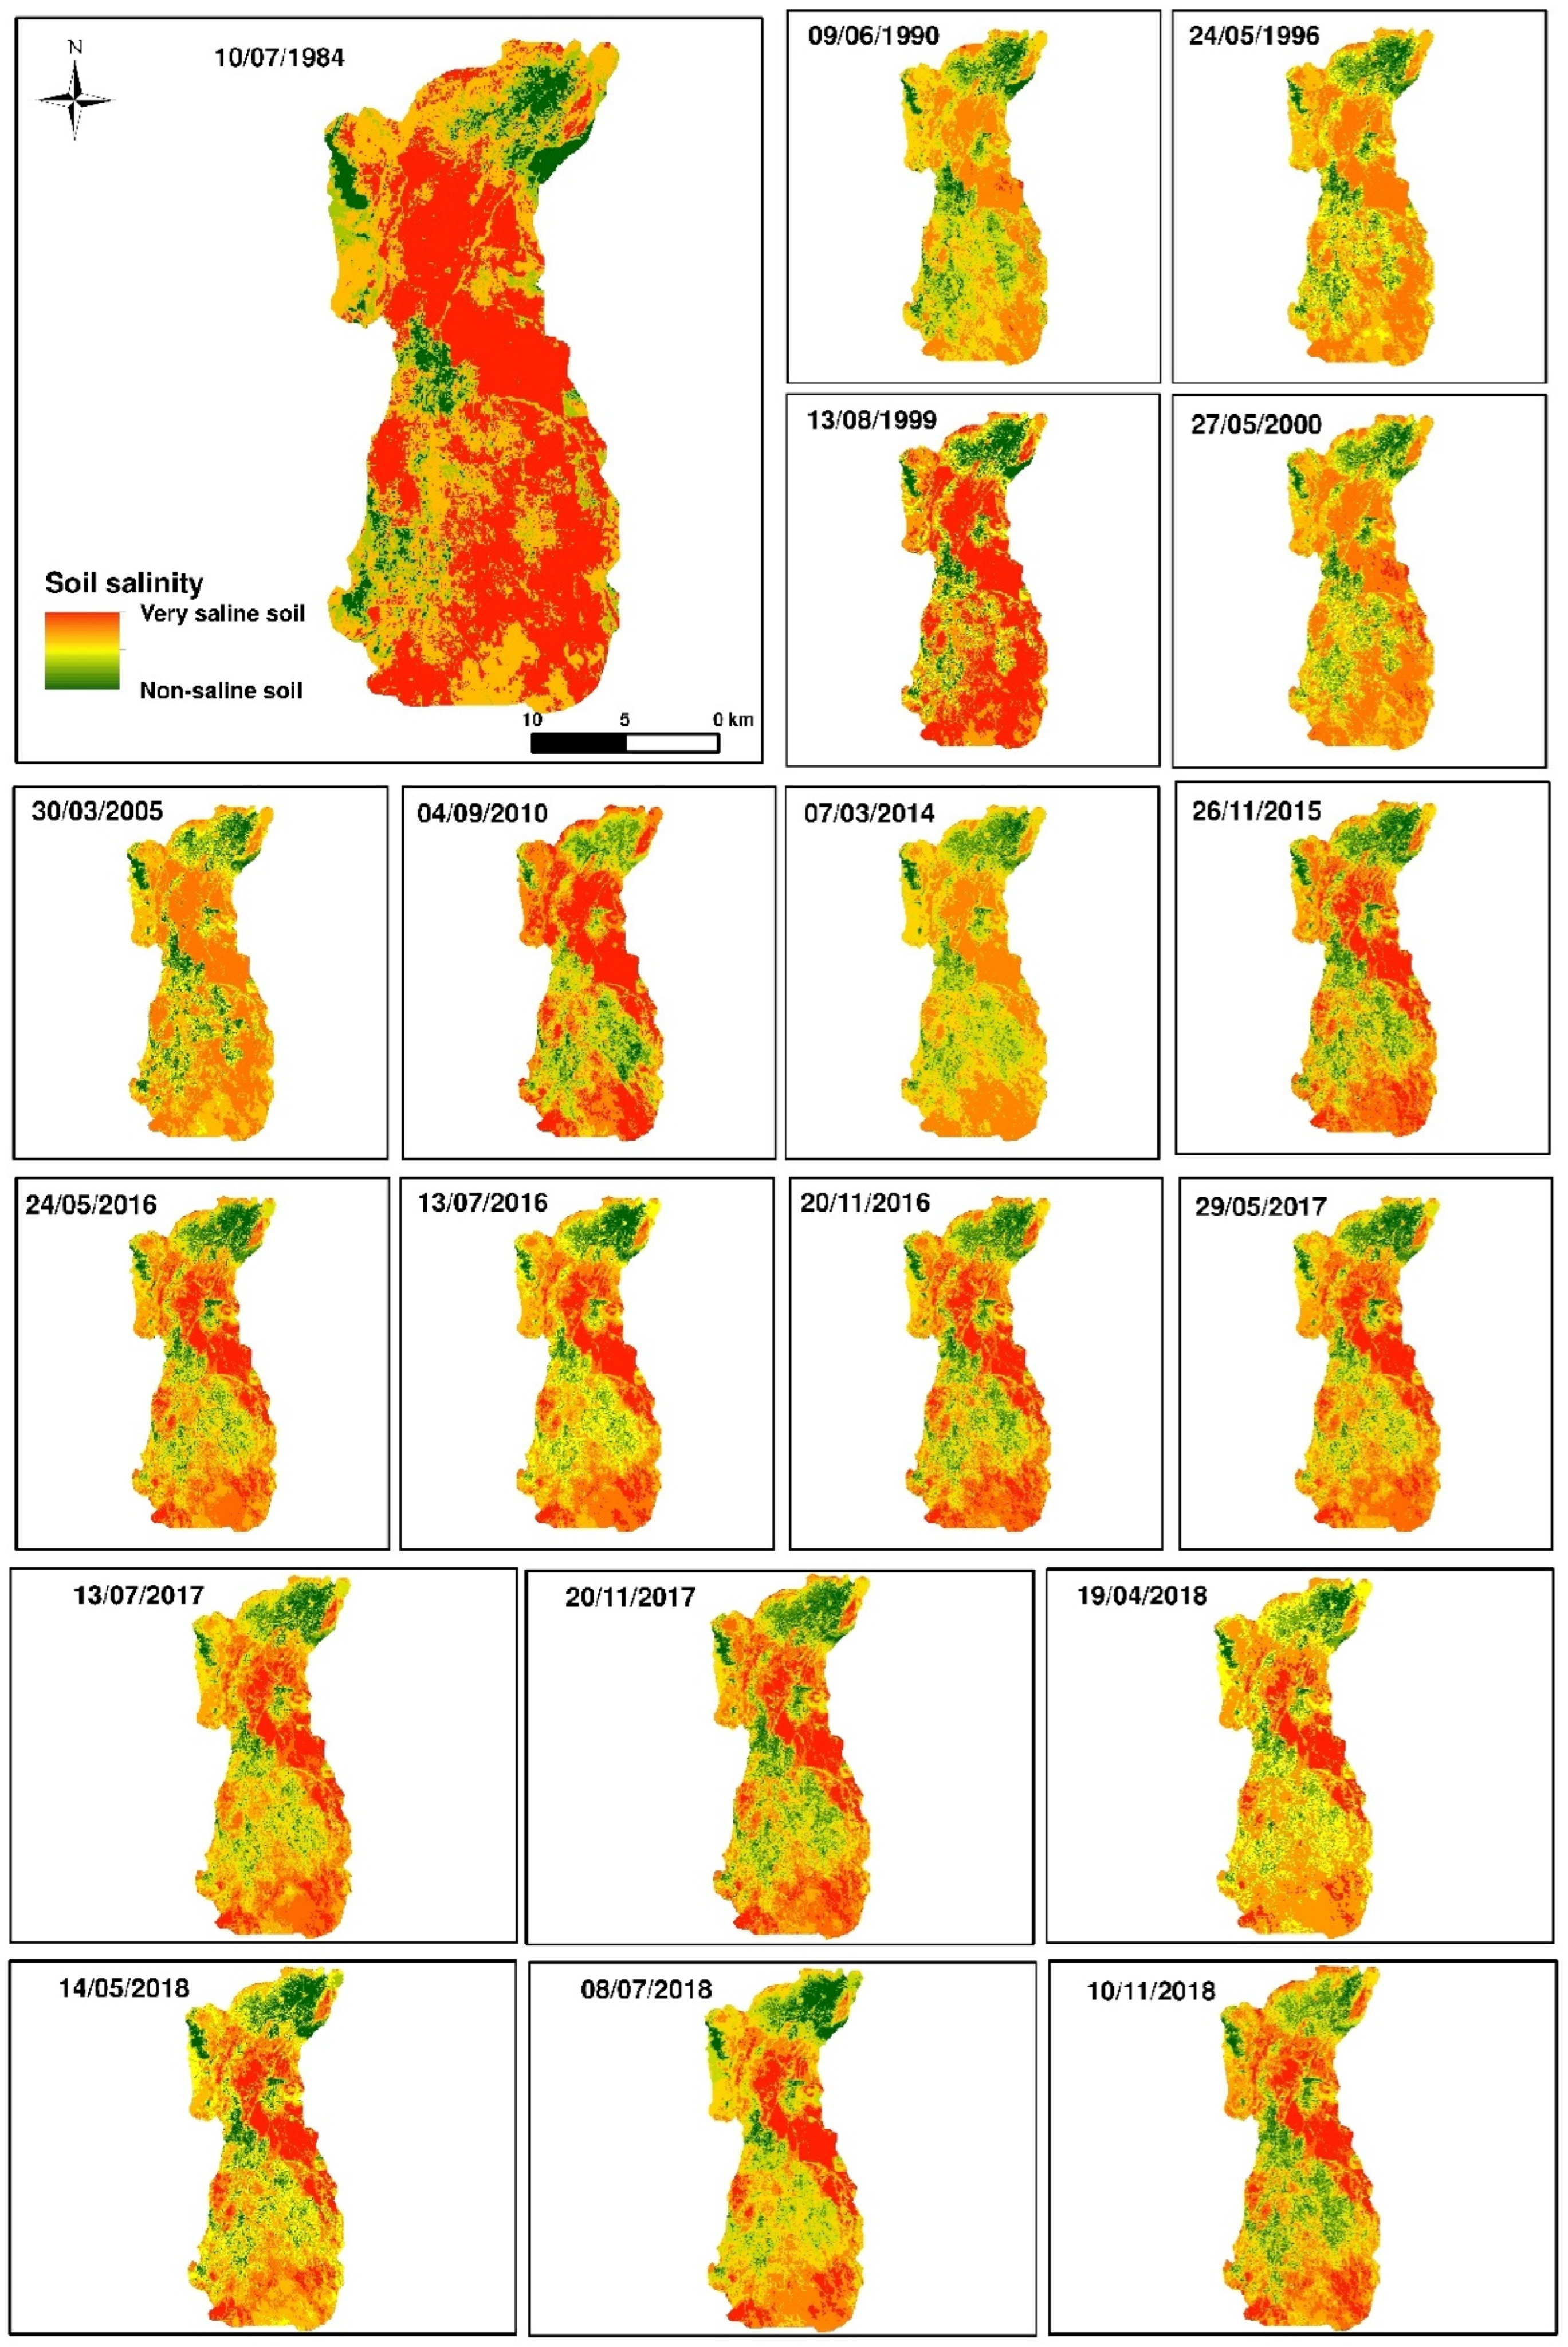
3.2. Spatio-Temporal Change Trend Analysis of Soil Salinity Correlated with Drought Index

The salinity of the soils in the Tafilalet plain is a hazard that threatens the development of vegetation, in particular date palms. In addition, salinity affects the living organisms in the soil, where soil renewal is a very slow process, which requires monitoring to prevent its degradation. Table 4 shows the spatio-temporal variation of salinity and the rate of change over a 34-year period. The salinity of soils is controlled by two major factors, natural and anthropogenic, which contains several sub-factors; this makes it a complex problem. The first factors include the nature and soil types, topography, precipitation, temperature, soil permeability, depth of the water table in relation to the soil, the shape of the watershed, and the speed of the wind. For the anthropogenic factors which control the salinity, we cite the nature of the cultures, the system adopted in the irrigation, the nature of the water exploited in the irrigation, the type of fertilizers, and the direct or indirect polluting discharges.
The area treated in this work is classified under hyper-arid climate [49], which is characterized by low precipitation and high temperature that contribute to anthropogenic activities to catalyze soil salinization. The standardized precipitation index, which is a meteorological indicator of drought applied to a time series of precipitation from 1983 to 2019, shows that the plain has experienced several periods of drought, including the famous one in 1984 (Table 4).
Table 4 shows the results of applying polynomial model D2 of the salinity index on a series of satellite images as well as the SPAI values, which define the drought intensity for each period. The variation of the SPAI is negatively correlated with the variation of saline land surfaces with a correlation coefficient equal to −0.65, which is acceptable given the existence of other factors which control the soil salinization phenomenon. The availability of precipitation plays a primordial role in controlling the soil’s chemical composition for periods of excess water circulation in the soils, leading to their leaching and consequently the reduction of soil mineralization through infiltration processes and leading towards that for deficit periods.
The spatio-temporal distribution of saline soils (Figure 6) in the Tafilalet plain is very variable. The monthly variations are more important than the annual ones. In 1984, the saline surface was estimated at 36.02 km2, which is the maximum value of the time series. This is explained by the severe regional drought recorded in the same period. The return of favorable climatic conditions such as precipitation generates a fall in saline surfaces between 1990 and 2000 estimated at 1.52 km2 via the leaching of soils by the influx of meteoric water. From the year 2000 until 2010, the impact of drought is observed by the increase in soils affected by the phenomenon of salinization with an estimated area of 2.24 km2. The salinity intensity is low compared to that of 1984, given the difference in drought intensities recorded in these two periods.
From 2010 to 2015, the surfaces occupied by salinity remained more or less unchanged, this is explained by the stability of the drought index and by the Green Morocco strategy launched in 2013, which changed the way lands were used in agriculture and the use of irrigation water in the Tafilalet plain. Beyond 2015, the temporal resolution is increased to detect the effect of seasonality on soil salinity. We observe sudden changes from one month to another, November is a month where soils salinity is regulated, and the plain receives precipitation in the form of thunderstorms, which leaches the accumulated excess of mineralization along the months of the year. The saline soils in the plain, as shown in Table 4, have a general tendency to decrease’ the decrease is estimated by 17.02 km2 between 1984 and 11 October 2018, the values occupied in the eighties and nineties are higher compared to other years of study (Figure 6). The increased surfaces go from 1984 (36.02 km2) until 1996 (30.17 km2), registering an estimated change rate of −5.85 km2. In 2005 and 2014, two peaks were observed reflecting the increase in saline surfaces, which respectively represent 32.32 and 35.67 km2. From 19 April 2018 until 11 October 2018, the decrease is quite remarkable, going from 25.22 km2 to 19 km2.
The spatial distribution of salinity varies from year to year. Maps represented in Figure 6 show that the most affected places by salinity are in the non-vegetated part of the plain. The vegetation cover ensures a humid microclimate at the level of the superficial part of the soils, which decreases the intensity of evaporation and consequently the reduction of soils salinity. Over the vegetated area, crops performed as a soil protector (shadow), where the portion of the exposed area into the net radiation is small, which decreases evaporation and lowers the concentration of salinity.

4. Conclusions

The present study focuses on the detection mapping of saline lands in the Tafilalet plain (Morocco) and on the evaluation of the drought cyclicity impact on soil salinity dynamics and its spatio-temporal trend over a period of 34 years (1984–2018). Based on a time series of Landsat (TM, ETM+, and OLI) and sentinel 2 (MSI) satellite images, as well as rainfall data archived over 35 years and in situ measurements, this study made it possible to detect and maps soil salinity in Africa’s largest oasis. We have concluded that the second-degree polynomial model of salinity index (SI-KHAN) is the most efficient in detecting and mapping soil salinity in our context, with a coefficient of determination (R2) and the Nash–Sutcliffe Efficiency (NSE) equal to 0.93 and 0.86 respectively. Percent bias (PBIAS) calculated for this model is equal to 1.868% < 10%, and the low value of the root mean square error (RMSE) confirms its very good performance compared to the 16 indices tested. Water stress is a factor that leads to the intensification of the land salinization process in the Tafilalet plain, as shown by the standardized precipitation anomaly index (SPAI), which is strongly correlated with soil salinity.
The spatio-temporal distribution of soil salinity in the Tafilalet plain is highly variable and negatively correlated with the standardized precipitation anomaly index (r2 = −0.65). Deficit periods lead to an accumulation of mineralization in soils favored by the high values of evapotranspiration governing the desert domain and vice versa for excess periods, which favors the infiltration of salts in the soil. Saline soils occupied an estimated area of 36.02 km2 during the famous national drought of 1984. The fall of saline surfaces is observed between 1990 and 2000, thus reflecting favorable climatic conditions, such as the contributions of meteoric waters that wash the soils. The drought impact is also recorded during the period 2000–2010 with less intensity than that of 1984. From 2010 to 2015, the areas occupied by salinity remained more or less unchanged. This is explained by the stability of the drought index and by the Green Morocco strategy launched in 2013. Beyond 2015, the effect of seasonality on soil salinity is observed in the abrupt changes in soil salinity from month to month. The month of November is the regulating month of the salinity of the soils because, in this period, the plain receives precipitation in the form of thunderstorms that leach excess mineralization accumulated throughout the months of the year. However, this study gives an idea of the state of soils with respect to salinity and allows us to map saline soils via remote sensing techniques. The soils in the plain of Tafilalet are very sensitive because of the climate that reigns the region. The protection of soils leads to the protection of agriculture and consequently the economy of the region.

Author Contributions

A.R. performed the paper concept, data collection, data preprocessing and processing, field mission, soil laboratory analyses. Methodology, software A.R., H.I. and A.E.A.E.F.; writing—original draft preparation, A.R.; review and editing H.I., A.E.A.E.F., L.E., D.M., M.B. (Mohamed Bousfoul), A.A., S.O., M.B. (Mohammed Bahir), A.G., D.D. and A.C. supervision, A.C. and H.I. All authors have read and agreed to the published version of the manuscript.

Funding

This work is carried out within the framework of the partnership agreement between ORMVA-Tf and UCAM in the field of training, research and development applied to agriculture and by the International Water research Institute/Mohammed VI Polytechnic University: 25 February 2019.

Institutional Review Board Statement

Non applicable.

Informed Consent Statement

Not applicable.

Data Availability Statement

The data presented in this study are available on request from the corresponding author.

Acknowledgments

The authors wish to thank ORMVA/Tf for the material support during the field mission, Especially Director BOUSFOUL Mohammed, for their logistical support, which made it possible to carry out this work. The Head of the Equipment Department, ABAOUZ Ali, was very committed to facilitating travel providing accommodation during the field campaign, and MY Lhassan E for his supervision of the entire field campaign. They also address their immense gratitude to the staff of ORMVA/TF, EL HAFI Abdelkrim, OMARI Khlafa, AIT LHAJ Abdelkader, BELKAID Jilali, and BOUALI Mohamed for their helpfulness and commitment during the field campaign. They acknowledge the NASA-USGS datasets for Landsat and ESA for Sentinel as well as the anonymous reviewers for their constructive comments.

Conflicts of Interest

The authors declare no conflict of interest.

References

  1. Bleu, P.; Antipolis, S. Les Menaces Sur Les Sols Dans Les Pays Méditerranéens Méditerranéens. 2003. Available online: https://side.developpement-durable.gouv.fr/NVAQ/doc/SYRACUSE/38318/les-menaces-sur-les-sols-dans-les-pays-mediterraneens-etude-bibliographique (accessed on 22 February 2022).
  2. McBratney, A.; Field, D.J.; Koch, A. The dimensions of soil security. Geoderma 2014, 213, 203–213. [Google Scholar] [CrossRef] [Green Version]
  3. Bannari, A.; Al-Ali, Z.M. Assessing climate change impact on soil salinity dynamics between 1987–2017 in arid landscape using Landsat TM, ETM+ and OLI data. Remote Sens. 2020, 12, 2794. [Google Scholar] [CrossRef]
  4. El hafyani, M.; Essahlaoui, A.; El baghdadi, M.; Teodoro, A.C.; Mohajane, M.; El hmaidi, A.; El ouali, A. Modeling and mapping of soil salinity in Tafilalet plain (Morocco). Arab. J. Geosci. 2019, 12, 35. [Google Scholar] [CrossRef]
  5. Peng, J.; Biswas, A.; Jiang, Q.; Zhao, R.; Hu, J.; Hu, B.; Shi, Z. Estimating soil salinity from remote sensing and terrain data in southern Xinjiang Province, China. Geoderma 2019, 337, 1309–1319. [Google Scholar] [CrossRef]
  6. Shahid, S.A.; Zaman, M.; Heng, L. Introduction to soil salinity, sodicity and diagnostics techniques. In Guideline for Salinity Assessment, Mitigation and Adaptation Using Nuclear and Related Techniques; Springer: Berlin/Heidelberg, Germany, 2018; pp. 1–42. [Google Scholar]
  7. Mermoud, A. Cours de Physique du Sol. Etat l’eau du Sol. Ec. Polytech. Fédérale Lausanne. 2007. Available online: https://www.academia.edu/28701179/%C3%89COLE_POLYTECHNIQUE_F%C3%89D%C3%89RALE_DE_LAUSANNE_Section_Sciences_et_Ing%C3%A9nierie_de_lEnvironnement_Assainissement_du_sol (accessed on 22 February 2022).
  8. Aragüés, R.; Medina, E.T.; Martínez-Cob, A.; Faci, J. Effects of deficit irrigation strategies on soil salinization and sodification in a semiarid drip-irrigated peach orchard. Agric. Water Manag. 2014, 142, 1–9. [Google Scholar] [CrossRef] [Green Version]
  9. Allbed, A.; Kumar, L.; Sinha, P. Mapping and modelling spatial variation in soil salinity in the Al Hassa Oasis based on remote sensing indicators and regression techniques. Remote Sens. 2014, 6, 1137–1157. [Google Scholar] [CrossRef] [Green Version]
  10. Nosetto, M.D.; Acosta, A.M.; Jayawickreme, D.H.; Ballesteros, S.I.; Jackson, R.B.; Jobbágy, E.G. Land-use and topography shape soil and groundwater salinity in central Argentina. Agric. Water Manag. 2013, 129, 120–129. [Google Scholar] [CrossRef]
  11. Mashimbye, Z.E. Remote Sensing of Salt-Affected Soils. Ph.D. Thesis, Stellenbosch University, Stellenbosch, South Africa, 2013. [Google Scholar]
  12. Meimei, Z.; Ping, W. Using HJ-I satellite remote sensing data to surveying the Saline soil distribution in Yinchuan Plain of China. African J. Agric. Res. 2011, 6, 6592–6597. [Google Scholar]
  13. Rafik, A.; Bahir, M.; Beljadid, A.; Ouazar, D.; Chehbouni, A.; Dhiba, D.; Ouhamdouch, S. Surface and Groundwater Characteristics within a Semi-Arid Environment Using Hydrochemical and Remote Sensing Techniques. Water 2021, 13, 277. [Google Scholar] [CrossRef]
  14. Al-Khaier, F. Soil Salinity Detection Using Satellite Remote Sensing. Master’s Thesis, International Institute for Geo-Information Science and Earth Observation, Enschede, The Netherlands, 2003; 61p. [Google Scholar]
  15. Kurylyk, B.L.; MacQuarrie, K.T.B. The uncertainty associated with estimating future groundwater recharge: A summary of recent research and an example from a small unconfined aquifer in a northern humid-continental climate. J. Hydrol. 2013, 492, 244–253. [Google Scholar] [CrossRef]
  16. Oo, A.N.; Iwai, C.B.; Saenjan, P. Food security and socio-economic impacts of soil salinization in northeast Thailand. Environ. Rural Dev. 2013, 4, 76–81. [Google Scholar]
  17. Teh, S.Y.; Koh, H.L. Climate change and soil salinization: Impact on agriculture, water and food security. Int. J. Agric. For. Plant. 2016, 2, 1–9. [Google Scholar]
  18. Zhang, H.; Schroder, J.L.; Pittman, J.J.; Wang, J.J.; Payton, M.E. Soil salinity using saturated paste and 1: 1 soil to water extracts. Soil Sci. Soc. Am. J. 2005, 69, 1146–1151. [Google Scholar] [CrossRef]
  19. Burt, R. Soil Survey Laboratory Methods Manual, Soil Survey Investigation Report; U.S. Department of Agriculture Natural Resources Conservation Service National Soil Survey Center: Lincoln, NE, USA, 2004.
  20. VALLEY, I.N.S. Relations Entre Les Mesures de Conductivités Sur des Extraits de Sols de Rapports Sol/Solwtion Variables, Dans la Vallée du Fleuve SENEGAL. 1982. Available online: https://horizon.documentation.ird.fr/exl-doc/pleins_textes/cahiers/PTP/3202.PDF (accessed on 22 February 2022).
  21. Fan, X.; Weng, Y.; Tao, J. Towards decadal soil salinity mapping using Landsat time series data. Int. J. Appl. Earth Obs. Geoinf. 2016, 52, 32–41. [Google Scholar] [CrossRef]
  22. Bannari, A.; Guédon, A.M.; El-Ghmari, A. Mapping slight and moderate saline soils in irrigated agricultural land using advanced land imager sensor (EO-1) data and semi-empirical models. Commun. Soil Sci. Plant. Anal. 2016, 47, 1883–1906. [Google Scholar] [CrossRef]
  23. Abuelgasim, A.; Ammad, R. Mapping soil salinity in arid and semi-arid regions using Landsat 8 OLI satellite data. Remote Sens. Appl. Soc. Environ. 2019, 13, 415–425. [Google Scholar] [CrossRef]
  24. Lhissoui, R.; El Harti, A.; Chokmani, K. Mapping soil salinity in irrigated land using optical remote sensing data. Eurasian J. Soil Sci. 2014, 3, 82–88. [Google Scholar] [CrossRef] [Green Version]
  25. Scudiero, E.; Corwin, D.; Anderson, R.; Yemoto, K.; Clary, W.; Wang, Z.; Skaggs, T. Remote sensing is a viable tool for mapping soil salinity in agricultural lands. Calif. Agric. 2017, 71, 231–238. [Google Scholar] [CrossRef] [Green Version]
  26. Wu, W.; Mhaimeed, A.S.; Al-Shafie, W.M.; Ziadat, F.; Dhehibi, B.; Nangia, V.; De Pauw, E. Mapping soil salinity changes using remote sensing in Central Iraq. Geoderma Reg. 2014, 2, 21–31. [Google Scholar] [CrossRef]
  27. Zhu, K.; Sun, Z.; Zhao, F.; Yang, T.; Tian, Z.; Lai, J.; Zhu, W.; Long, B. Relating hyperspectral vegetation indices with soil salinity at different depths for the diagnosis of winter wheat salt stress. Remote Sens. 2021, 13, 250. [Google Scholar] [CrossRef]
  28. Sun, H.; Xu, L.; Wang, J.; Fu, X. Remote Sensing Monitoring of Spatial–Temporal Variation of Soil Salinization before and after Irrigation in the Yellow River Delta. J. Coast. Res. 2020, 105, 56–60. [Google Scholar] [CrossRef]
  29. Besma, Z.; Christian, W.; Didier, M.; Pierre, M.J.; Mohamed, H. Soil salinization monitoring method evolution at various spatial and temporal scales in arid context: A review. Arab. J. Geosci. 2021, 14, 283. [Google Scholar] [CrossRef]
  30. Wang, F.; Yang, S.; Wei, Y.; Shi, Q.; Ding, J. Characterizing soil salinity at multiple depth using electromagnetic induction and remote sensing data with random forests: A case study in Tarim River Basin of southern Xinjiang, China. Sci. Total Environ. 2021, 754, 142030. [Google Scholar] [CrossRef] [PubMed]
  31. Delavar, M.A.; Naderi, A.; Ghorbani, Y.; Mehrpouyan, A.; Bakhshi, A. Soil salinity mapping by remote sensing south of Urmia Lake, Iran. Geoderma Reg. 2020, 22, e00317. [Google Scholar] [CrossRef]
  32. Habibi, V.; Ahmadi, H.; Jafari, M.; Moeini, A. Quantitative assessment of soil salinity using remote sensing data based on the artificial neural network, case study: Sharif Abad Plain, Central Iran. Model. Earth Syst. Environ. 2021, 7, 1373–1383. [Google Scholar] [CrossRef]
  33. Teshaev, N.; Mamadaliyev, B.; Ibragimov, A.; Khasanov, S. The Soil-Adjusted Vegetation Indexfor Soil Salinity Assessment in Uzbekistan. ИнтерКартo. ИнтерГИС 2020, 26, 324–333. [Google Scholar]
  34. Fathizad, H.; Ali, M.; Ardakani, H.; Sodaiezadeh, H.; Kerry, R.; Taghizadeh-Mehrjardi, R. Investigation of the spatial and temporal variation of soil salinity using random forests in the central desert of Iran. Geoderma 2020, 365, 114233. [Google Scholar] [CrossRef]
  35. Wang, Z.; Zhang, F.; Zhang, X.; Chan, N.W.; Kung, H.; Zhou, X.; Wang, Y. Quantitative Evaluation of Spatial and Temporal Variation of Soil Salinization Risk Using GIS-Based Geostatistical Method. Remote Sens. 2020, 12, 2405. [Google Scholar] [CrossRef]
  36. Kulmatov, R.; Khasanov, S.; Odilov, S.; Li, F. Assessment of the Space-Time Dynamics of Soil Salinity in Irrigated Areas under Climate Change: A Case Study in Sirdarya Province, Uzbekistan. Water Air Soil Pollut. 2021, 232, 216. [Google Scholar] [CrossRef]
  37. Al-Ismaili, A.M. GIS and remote sensing techniques in Controlled Environment Agriculture: A review. J. Agric. Mar. Sci. 2021, 26, 10–23. [Google Scholar] [CrossRef]
  38. Mohd Ruhaizi, S.N.H.; Daliman, S. Spatiotemporal Analysis of Environmental Changes Based On Integrated Remote Sensing Indexes in River Basin of Kelantan. IOP Conf. Ser. Earth Environ. Sci. 2021, 842, 12001. [Google Scholar] [CrossRef]
  39. Youssef, Y.M.; Gemail, K.S.; Sugita, M.; AlBarqawy, M.; Teama, M.A.; Koch, M.; Saada, S.A. Natural and Anthropogenic Coastal Environmental Hazards: An Integrated Remote Sensing, GIS, and Geophysical-based Approach. Surv. Geophys. 2021, 42, 1109–1141. [Google Scholar] [CrossRef]
  40. Han, L.; Ding, J.; Zhang, J.; Chen, P.; Wang, J.; Wang, Y.; Wang, J.; Ge, X.; Zhang, Z. Precipitation events determine the spatiotemporal distribution of playa surface salinity in arid regions: Evidence from satellite data fused via the enhanced spatial and temporal adaptive reflectance fusion model. CATENA 2021, 206, 105546. [Google Scholar] [CrossRef]
  41. Farah, A.; Algouti, A.; Algouti, A.; Ifkirne, M.; Rafik, A. Remote Sensing for Spatio-temporal Mapping of Land surface temperature and Surface Energy Fluxes in the Bouregreg-Chaouia Region of Morocco. J. Environ. Agric. Stud. 2021, 2, 23–35. [Google Scholar] [CrossRef]
  42. Bahir, M.; Ouhamdouch, S.; Ouazar, D.; Rafik, A.; Chehbouni, A. An assessment of groundwater from semi-arid environment of Morocco for drinking and agricultural uses with reference to water quality indices technique. Carbonates Evaporites 2021, 36, 62. [Google Scholar] [CrossRef]
  43. McKee, T.B.; Doesken, N.J.; Kleist, J. The relationship of drought frequency and duration to time scales. In Proceedings of the 8th Conference on Applied Climatology, Boston, MA, USA, 17–22 January 1993; Volume 17, pp. 179–183. [Google Scholar]
  44. Ouhamdouch, S.; Bahir, M.; Ouazar, D.; Carreira, P.M.; Zouari, K. Evaluation of climate change impact on groundwater from semi-arid environment (Essaouira Basin, Morocco) using integrated approaches. Environ. Earth Sci. 2019, 78, 449. [Google Scholar] [CrossRef]
  45. Bahir, M.; Ouazar, D.; Ouhamdouch, S. Hydrogeochemical investigation and groundwater quality in Essaouira region, Morocco. Mar. Freshw. Res. 2019, 70, 1317–1332. [Google Scholar] [CrossRef]
  46. Ouhamdouch, S.; Bahir, M. Climate change impact on future rainfall and temperature in semi-arid areas (Essaouira Basin, Morocco). Environ. Process. 2017, 4, 975–990. [Google Scholar] [CrossRef]
  47. Bahir, M.; Ouazar, D.; Ouhamdouch, S. Characterization of mechanisms and processes controlling groundwater salinization in coastal semi-arid area using hydrochemical and isotopic investigations (Essaouira basin, Morocco). Environ. Sci. Pollut. Res. 2018, 25, 24992–25004. [Google Scholar] [CrossRef]
  48. Bahir, M.; Ouhamdouch, S.; Ouazar, D.; Chehbouni, A. Assessment of groundwater quality from semi-arid area for drinking purpose using statistical, water quality index (WQI) and GIS technique. Carbonates Evaporites 2020, 35, 27. [Google Scholar] [CrossRef]
  49. Driouech, F. Distribution des Précipitations Hivernales Sur le MAROC Dans le Cadre D’un Changement Climatique: Descente D’échelle et Incertitudes. Ph.D. Thesis, Université Fédérale Toulouse Midi-Pyrénées, Toulouse, France, 2010. [Google Scholar]
  50. Paré, S. Contribution à la Détermination D’un Terme du Bilan Hydrologique Dans la Région D’errachidia-Tafilalet: Evaluation de L’évapotranspiration de Référence et de L’évaporation à Travers la Zone Non Saturée de la Plaine de Tafilalet. 2009. Available online: https://thesesenafrique.imist.ma/handle/123456789/133 (accessed on 22 February 2022).
  51. Alali, A.; Benmohammadi, A. La plaine du Tafilalet (Sud-est, Maroc) face aux problèmes d’environnement. Rev. Marocaine des Sci. Agron. Vétérinaires 2013, 1, 47–51. [Google Scholar]
  52. Khan, S.; Abbas, A. Using remote sensing techniques for appraisal of irrigated soil salinity. In Proceedings of the International Congress on Modelling and Simulation (MODSIM), Christchurch, New Zealand, 10–13 December 2007; pp. 2632–2638. [Google Scholar]
  53. Nicolas, H.; Walter, C. Detecting salinity hazards within a semiarid context by means of combining soil and remote-sensing Data. Geoderma 2006, 134, 217–230. [Google Scholar]
  54. Douaoui, A.; Hartani, T.; Lakehal, M. La salinisation dans la plaine du Bas-Cheliff: Acquis et perspectives. In Proceedings of the Economies d’eau en Systèmes IRrigués au Maghreb. Deuxième Atelier Régional du Projet Sirma, Marrakech, Morocco, 29–31 May 2006. [Google Scholar]
  55. IDNP Indo-Dutch Network Project: A Methodology for Identification of Waterlogging and Soil Salinity Conditions Using Remote Sensing. 2002. Available online: https://edepot.wur.nl/87639 (accessed on 22 February 2022).
  56. Bannari, A.; Khurshid, K.S.; Staenz, K.; Schwarz, J. Potential of Hyperion EO-1 hyperspectral data for wheat crop chlorophyll content estimation. Can. J. Remote Sens. 2008, 34, S139–S157. [Google Scholar] [CrossRef]
  57. Abbas, A.; Khan, S.; Hussain, N.; Hanjra, M.A.; Akbar, S. Characterizing soil salinity in irrigated agriculture using a remote sensing approach. Phys. Chem. Earth Parts A/B/C 2013, 55, 43–52. [Google Scholar] [CrossRef]
  58. Dehni, A.; Lounis, M. Remote sensing techniques for salt affected soil mapping: Application to the Oran region of Algeria. Procedia Eng. 2012, 33, 188–198. [Google Scholar] [CrossRef] [Green Version]
  59. Taylor, R. Interpretation of the correlation coefficient: A basic review. J. Diagnostic Med. Sonogr. 1990, 6, 35–39. [Google Scholar] [CrossRef]
  60. Nash, J.E.; Sutcliffe, J. V River flow forecasting through conceptual models part I—A discussion of principles. J. Hydrol. 1970, 10, 282–290. [Google Scholar] [CrossRef]
  61. Nagelkerke, N.J.D. A note on a general definition of the coefficient of determination. Biometrika 1991, 78, 691–692. [Google Scholar] [CrossRef]
  62. Moriasi, D.N.; Arnold, J.G.; Van Liew, M.W.; Bingner, R.L.; Harmel, R.D.; Veith, T.L. Model Evaluation Guidelines for Systematic Quantification of Accuracy in Watershed Simulations. Trans. ASABE 2007, 50, 885–900. [Google Scholar] [CrossRef]
Figure 1. Map showing the study area and sampling point’s locations.
Remotesensing 14 01606 g001
Figure 2. Scatter plots of indices values vs. measured EC1:5 (µS/cm) using linear regression models.
Remotesensing 14 01606 g002
Figure 3. Spatial variability of the different normalized salinity indices.
Remotesensing 14 01606 g003
Figure 4. Scatter plots of indices values vs. EC1:5 measured by different models (µS/cm), showing the difference between values observed (black dots) in the field and values estimated (red dots) by the model.
Remotesensing 14 01606 g004
Figure 5. Spatial distribution of soil salinity values by different indices and models (the unit is microsiemens per centimeter [µS/cm]).
Remotesensing 14 01606 g005
Figure 6. Maps of spatio-temporal variability of soils salinity from 10 July 1984 to 10 November 2018.
Remotesensing 14 01606 g006
Table 3. Statistical results of the evaluation of models performance (R2 in Blue color, NSE in Green color and RMSE (µS/cm) in black color, ML: Linear Model, Mlog: Logarithmic Model, MP: Polynomial Model).
SI-KHANVSSIS3BISI-DEHNI
ML0.794
0.891
1363.160
0.623
0.789
1613.641
0.461
0.679
3849.202
0.585
0.765
1698.066
0.634
0.796
1586.838
Mlog0.847
0.920
1108.005
0.789
0.888
1191.479
0.626
0.791
4012.786
0.777
0.882
1228.093
0.781
0.884
1216.199
MP20.857
0.926
1119.833
0.813
0.901
1132.108
0.682
0.826
4066.773
0.806
0.898
1152.354
0.809
0.899
1143.353
MP40.746
0.864
1519.815
0.525
0.725
1827.096
0.380
0.616
3766.247
0.538
0.733
1800.108
0.542
0.736
1791.024
Table 4. Variation of saline lands in correlation with the drought index over a time series of 34 years (green color: decrease, red color: increase, yellow color: unchanged).
TimeArea (km2)Dynamics of Change%/Total AreaSPAIDrought Intensity
10 July 198436.02 8.56−0.99severely dry
9 June 199034.06−1.968.09−0.96
24 May 199630.17−3.897.17−0.13moderately dry
13 August 199926.15−4.026.21−0.02
27 May 200032.546.397.73−0.37
30 March 200532.32−0.227.68−0.13
4 September 201034.782.468.26−0.55
7 March 201435.670.898.47−0.63
26 November 201536.070.408.57−0.64
24 May 201632.01−4.067.60−0.15
13 July 201634.432.428.18−0.85
20 November 201615.35−19.083.651.86very wet
29 May 201726.0410.696.18−0.65moderately dry
13 July 201727.231.206.47−1.01severely dry
20 November 201720.37−6.864.84−0.70moderately dry
19 April 201825.224.855.991.59very wet
14 May 201828.192.986.701.52
8 July 201835.557.368.44−0.82moderately dry
10 November 201819.00−16.554.510.94
Publisher’s Note: MDPI stays neutral with regard to jurisdictional claims in published maps and institutional affiliations.

