
Remote Sensing in Studies of the Growing Season: A Bibliometric Analysis


Abstract
:1. Introduction
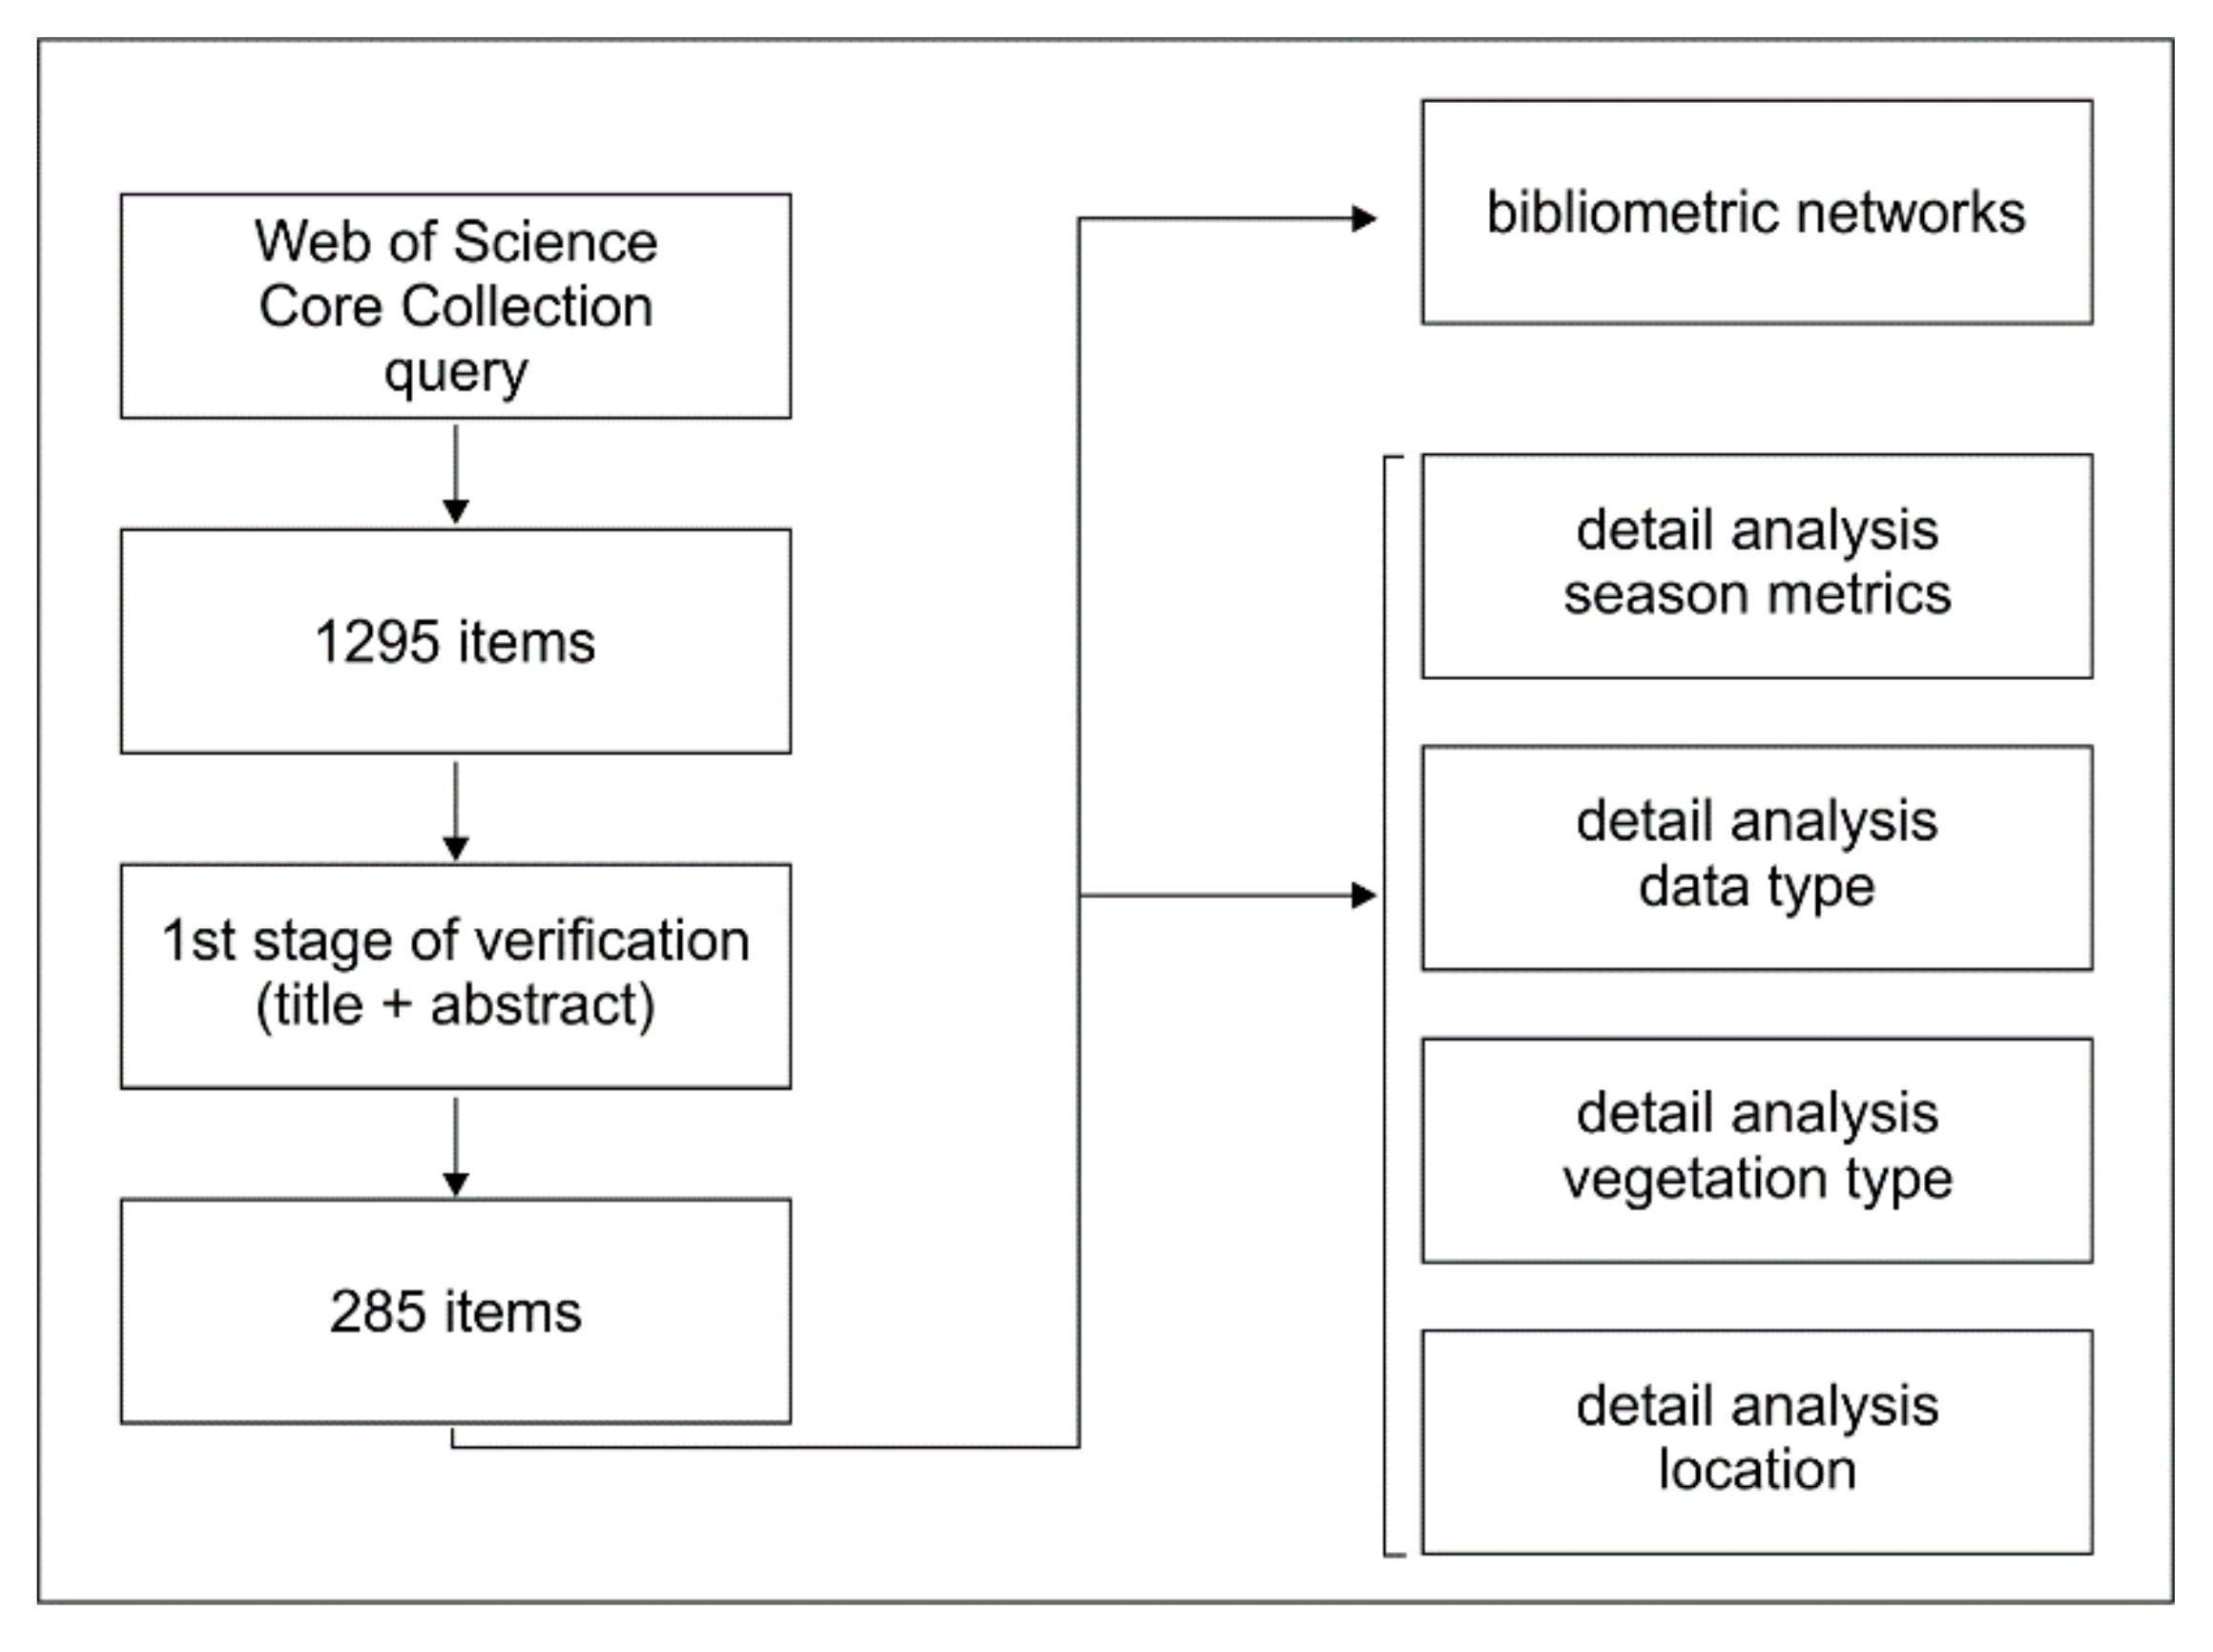
2. Materials and Methods
- abstract: “remote sensing” + “growing season”, keyword plus: “phenology”, “satellite”, “ground”;
- abstract: “remote sensing” + “growing season” + “airplane”, “UAV”, “ground-based”, “flux”, “crop monitoring”, “forest”, “optical”, “radar”, “thermal”, “microwave”; and
- abstract: “remote sensing”; keywords: “start of season”, “end of season”.
- (a)
- Does the paper fall within the scope of phenological research?
- (b)
- Does the paper address the issue of the plant growing season?
- (c)
- Were the remote sensing data used in the study satellite, low-altitude, or ground-based?
- (a)
- localization of the research taking into account climatic zones;
- (b)
- scales of studies;
- (c)
- types of input data used; and
- (d)
- types of plant communities studied.
3. Results
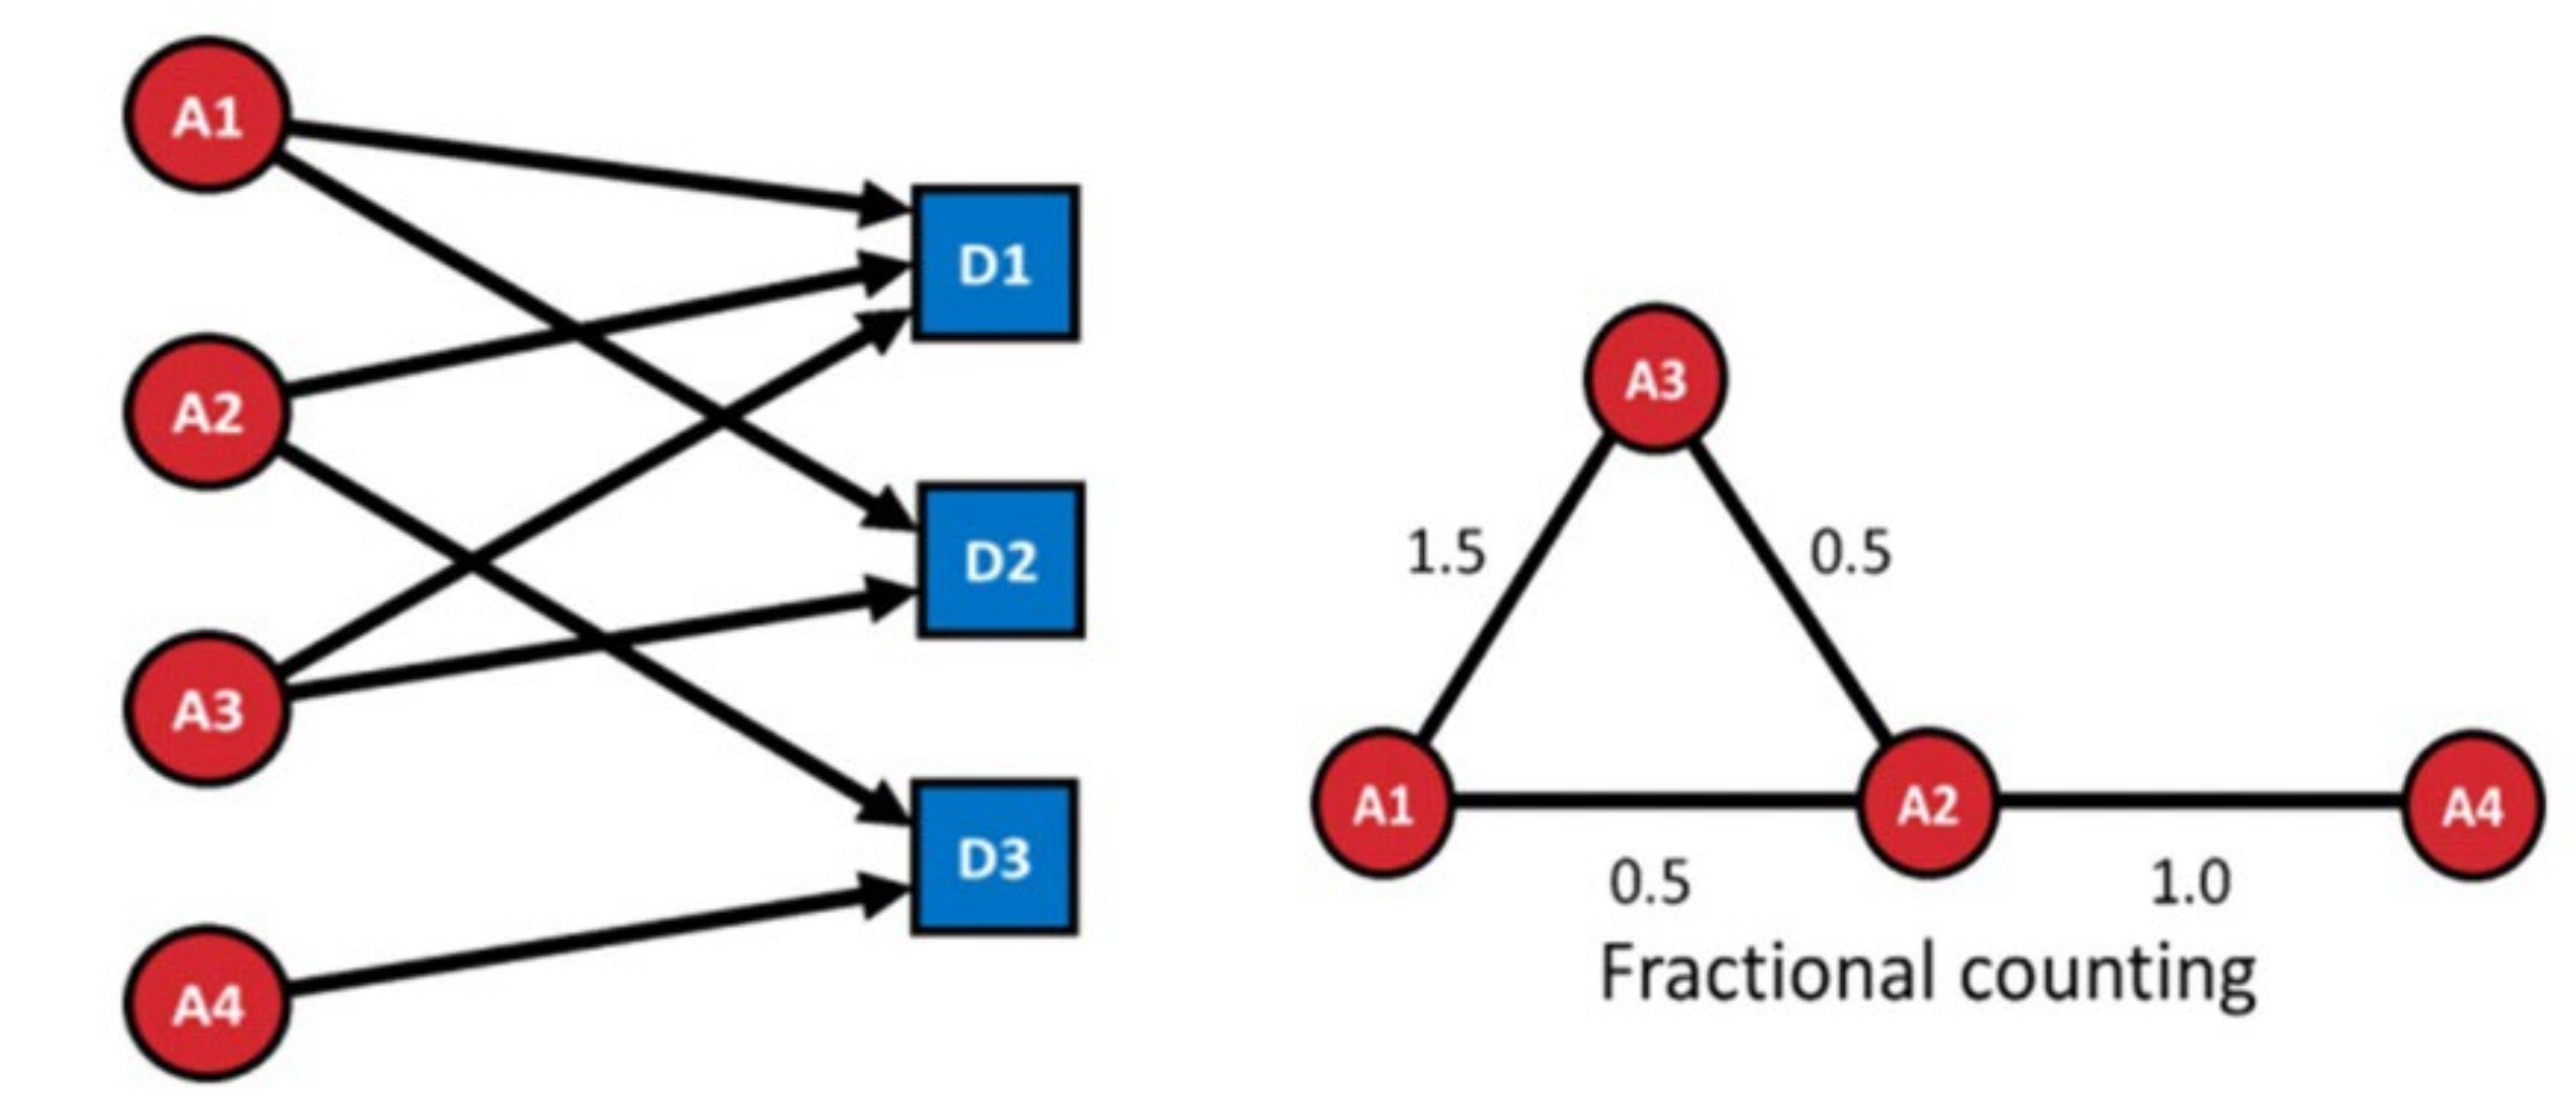
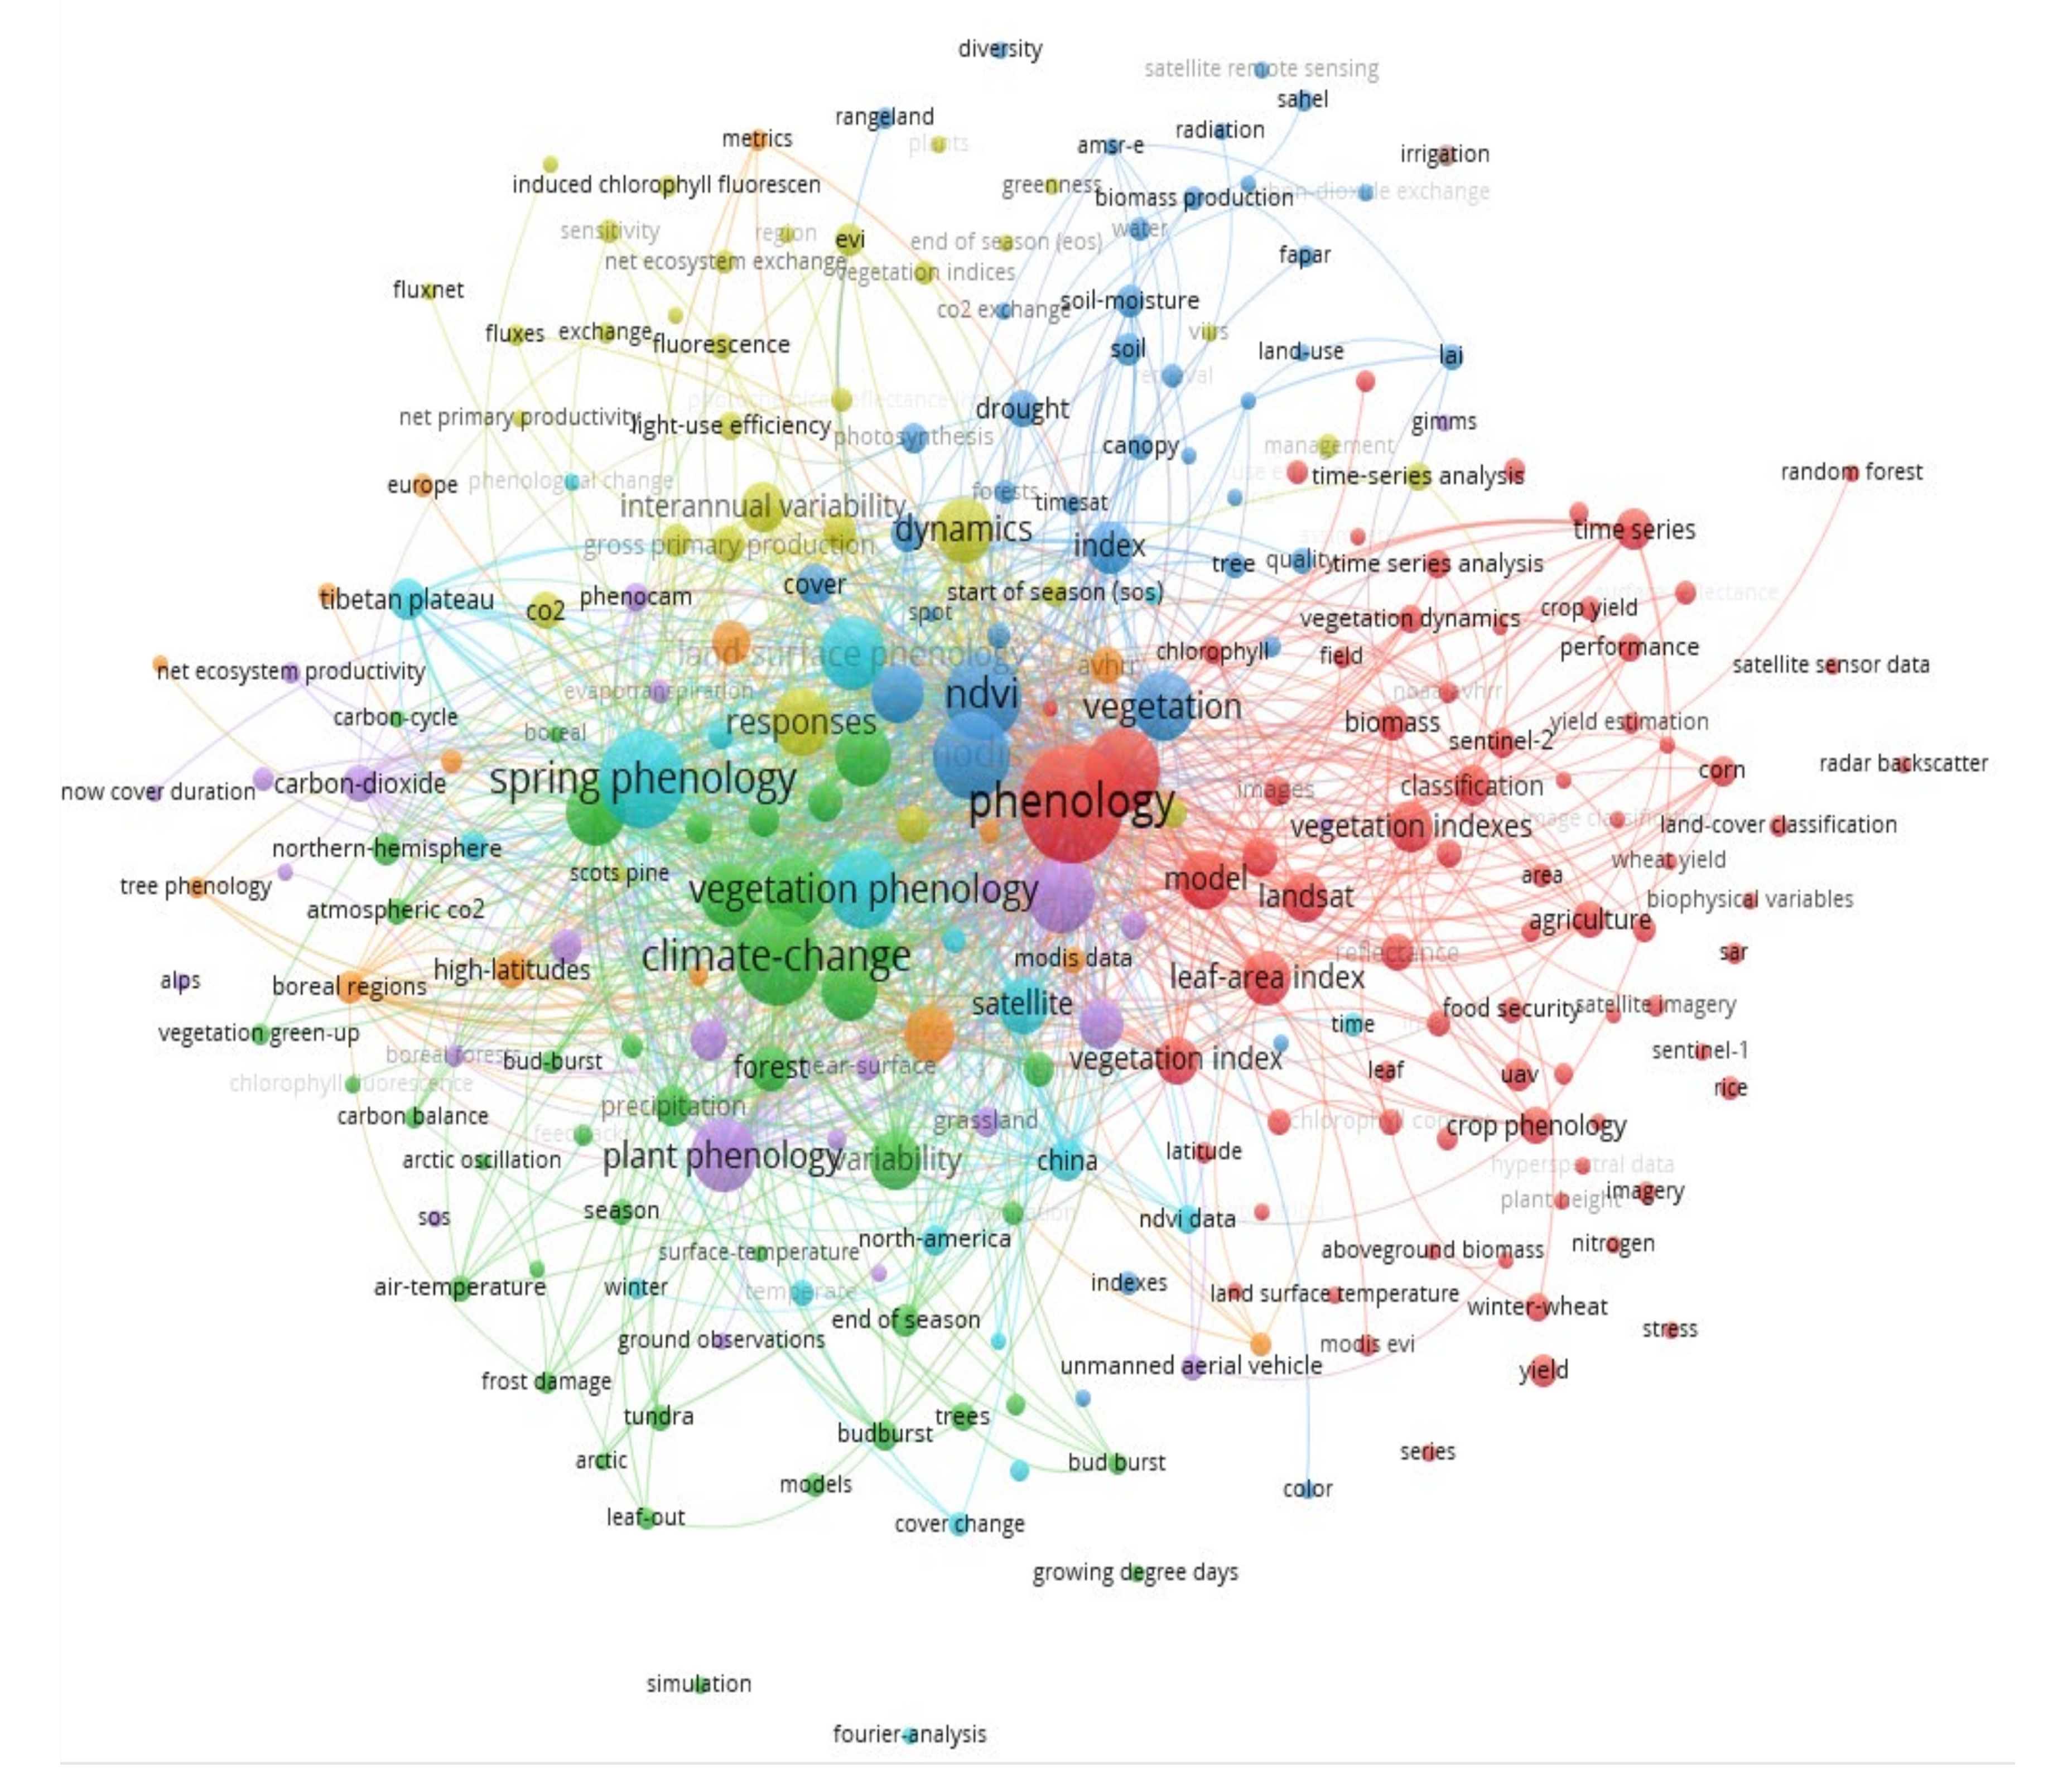
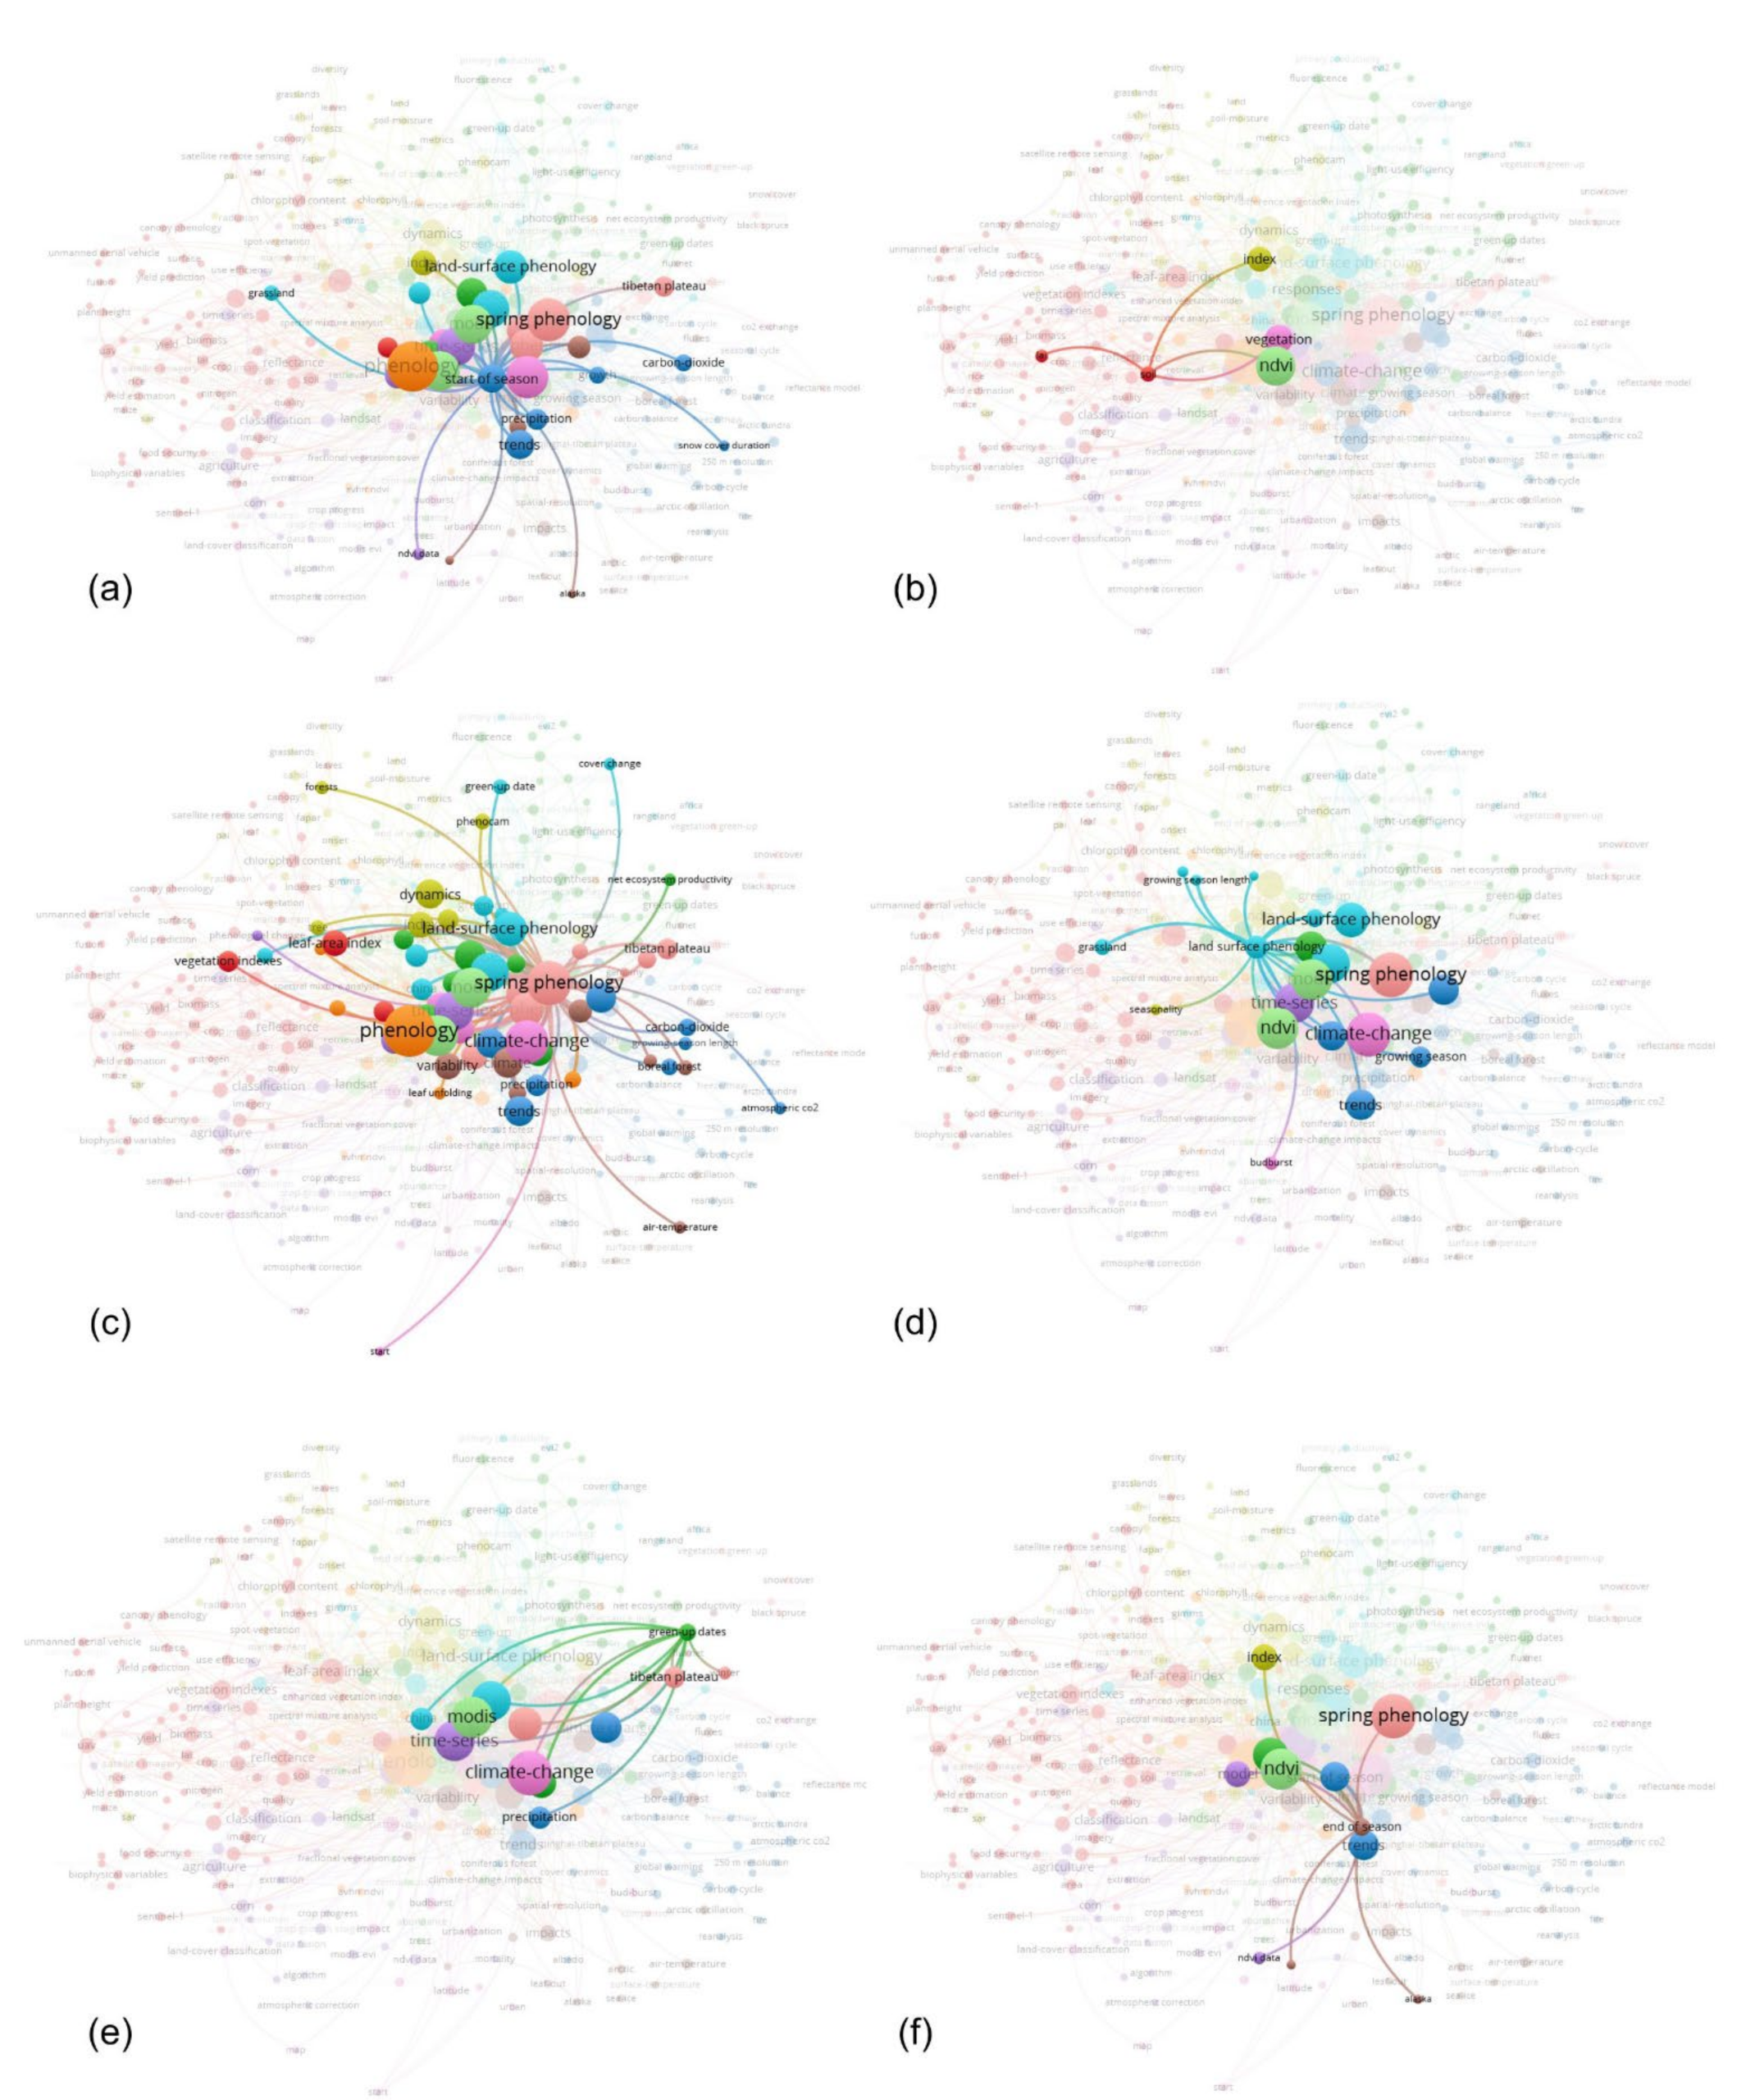
3.1. Link Analysis
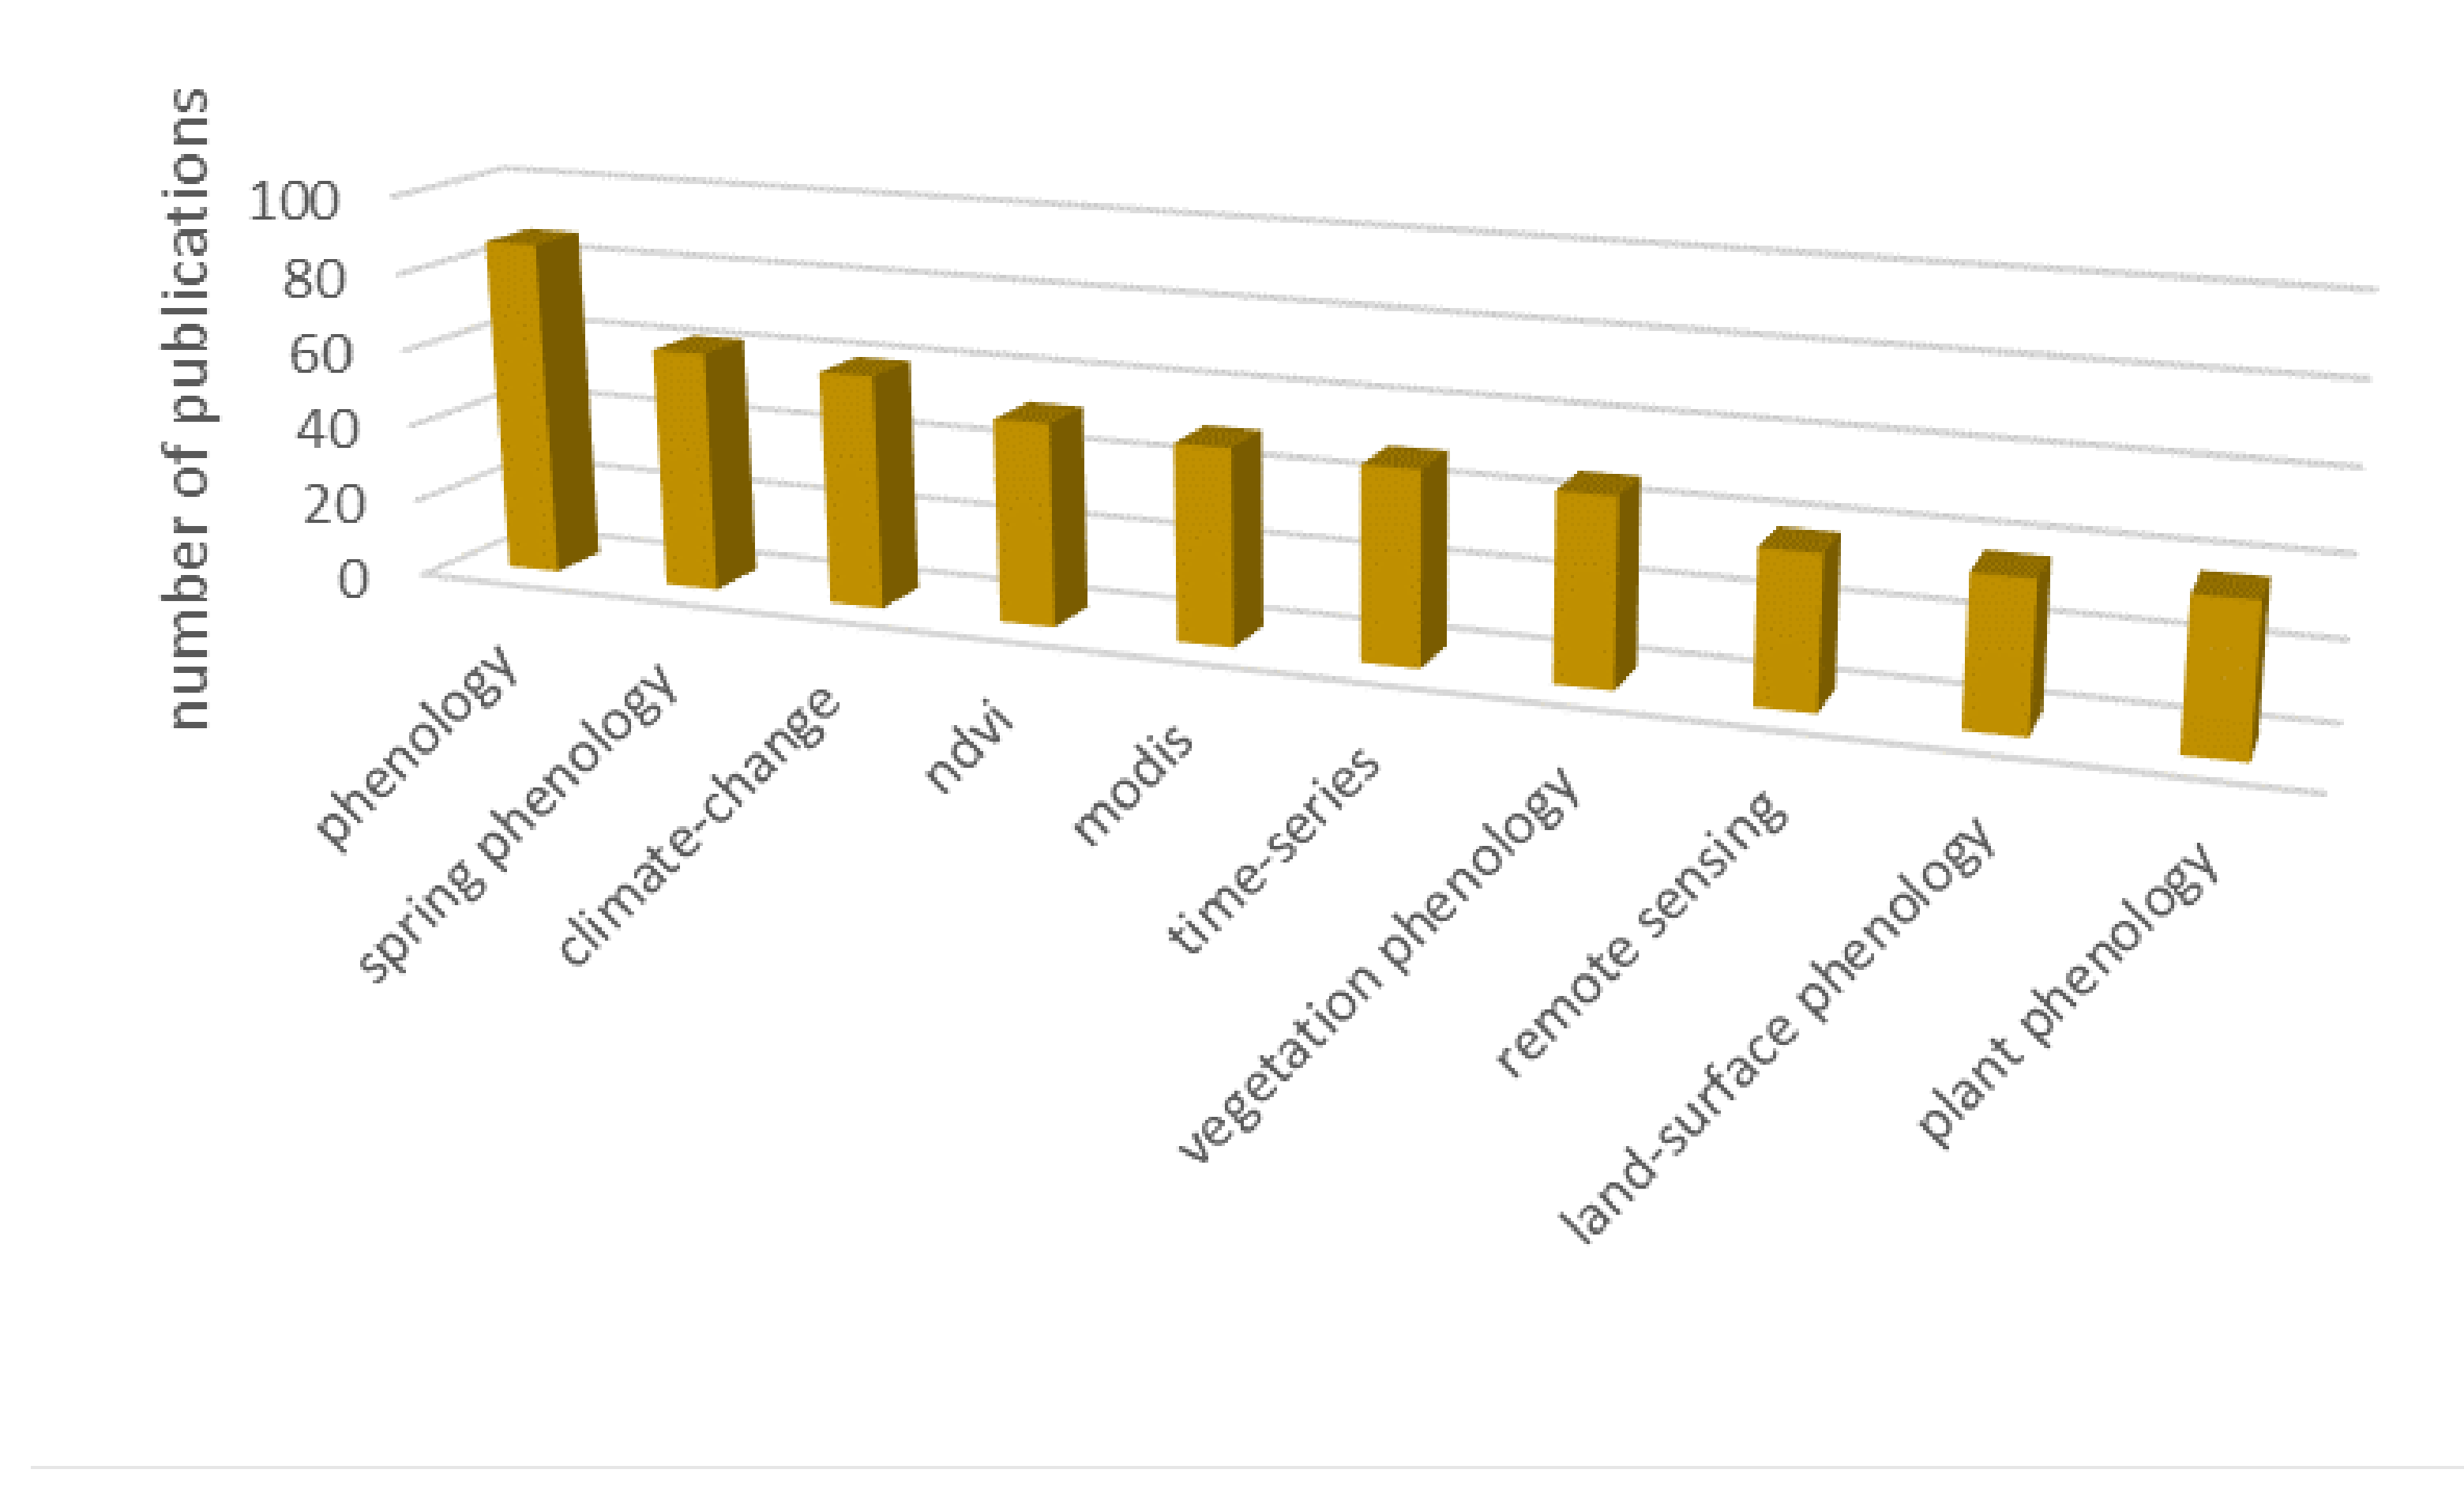
3.2. Main Research Topics
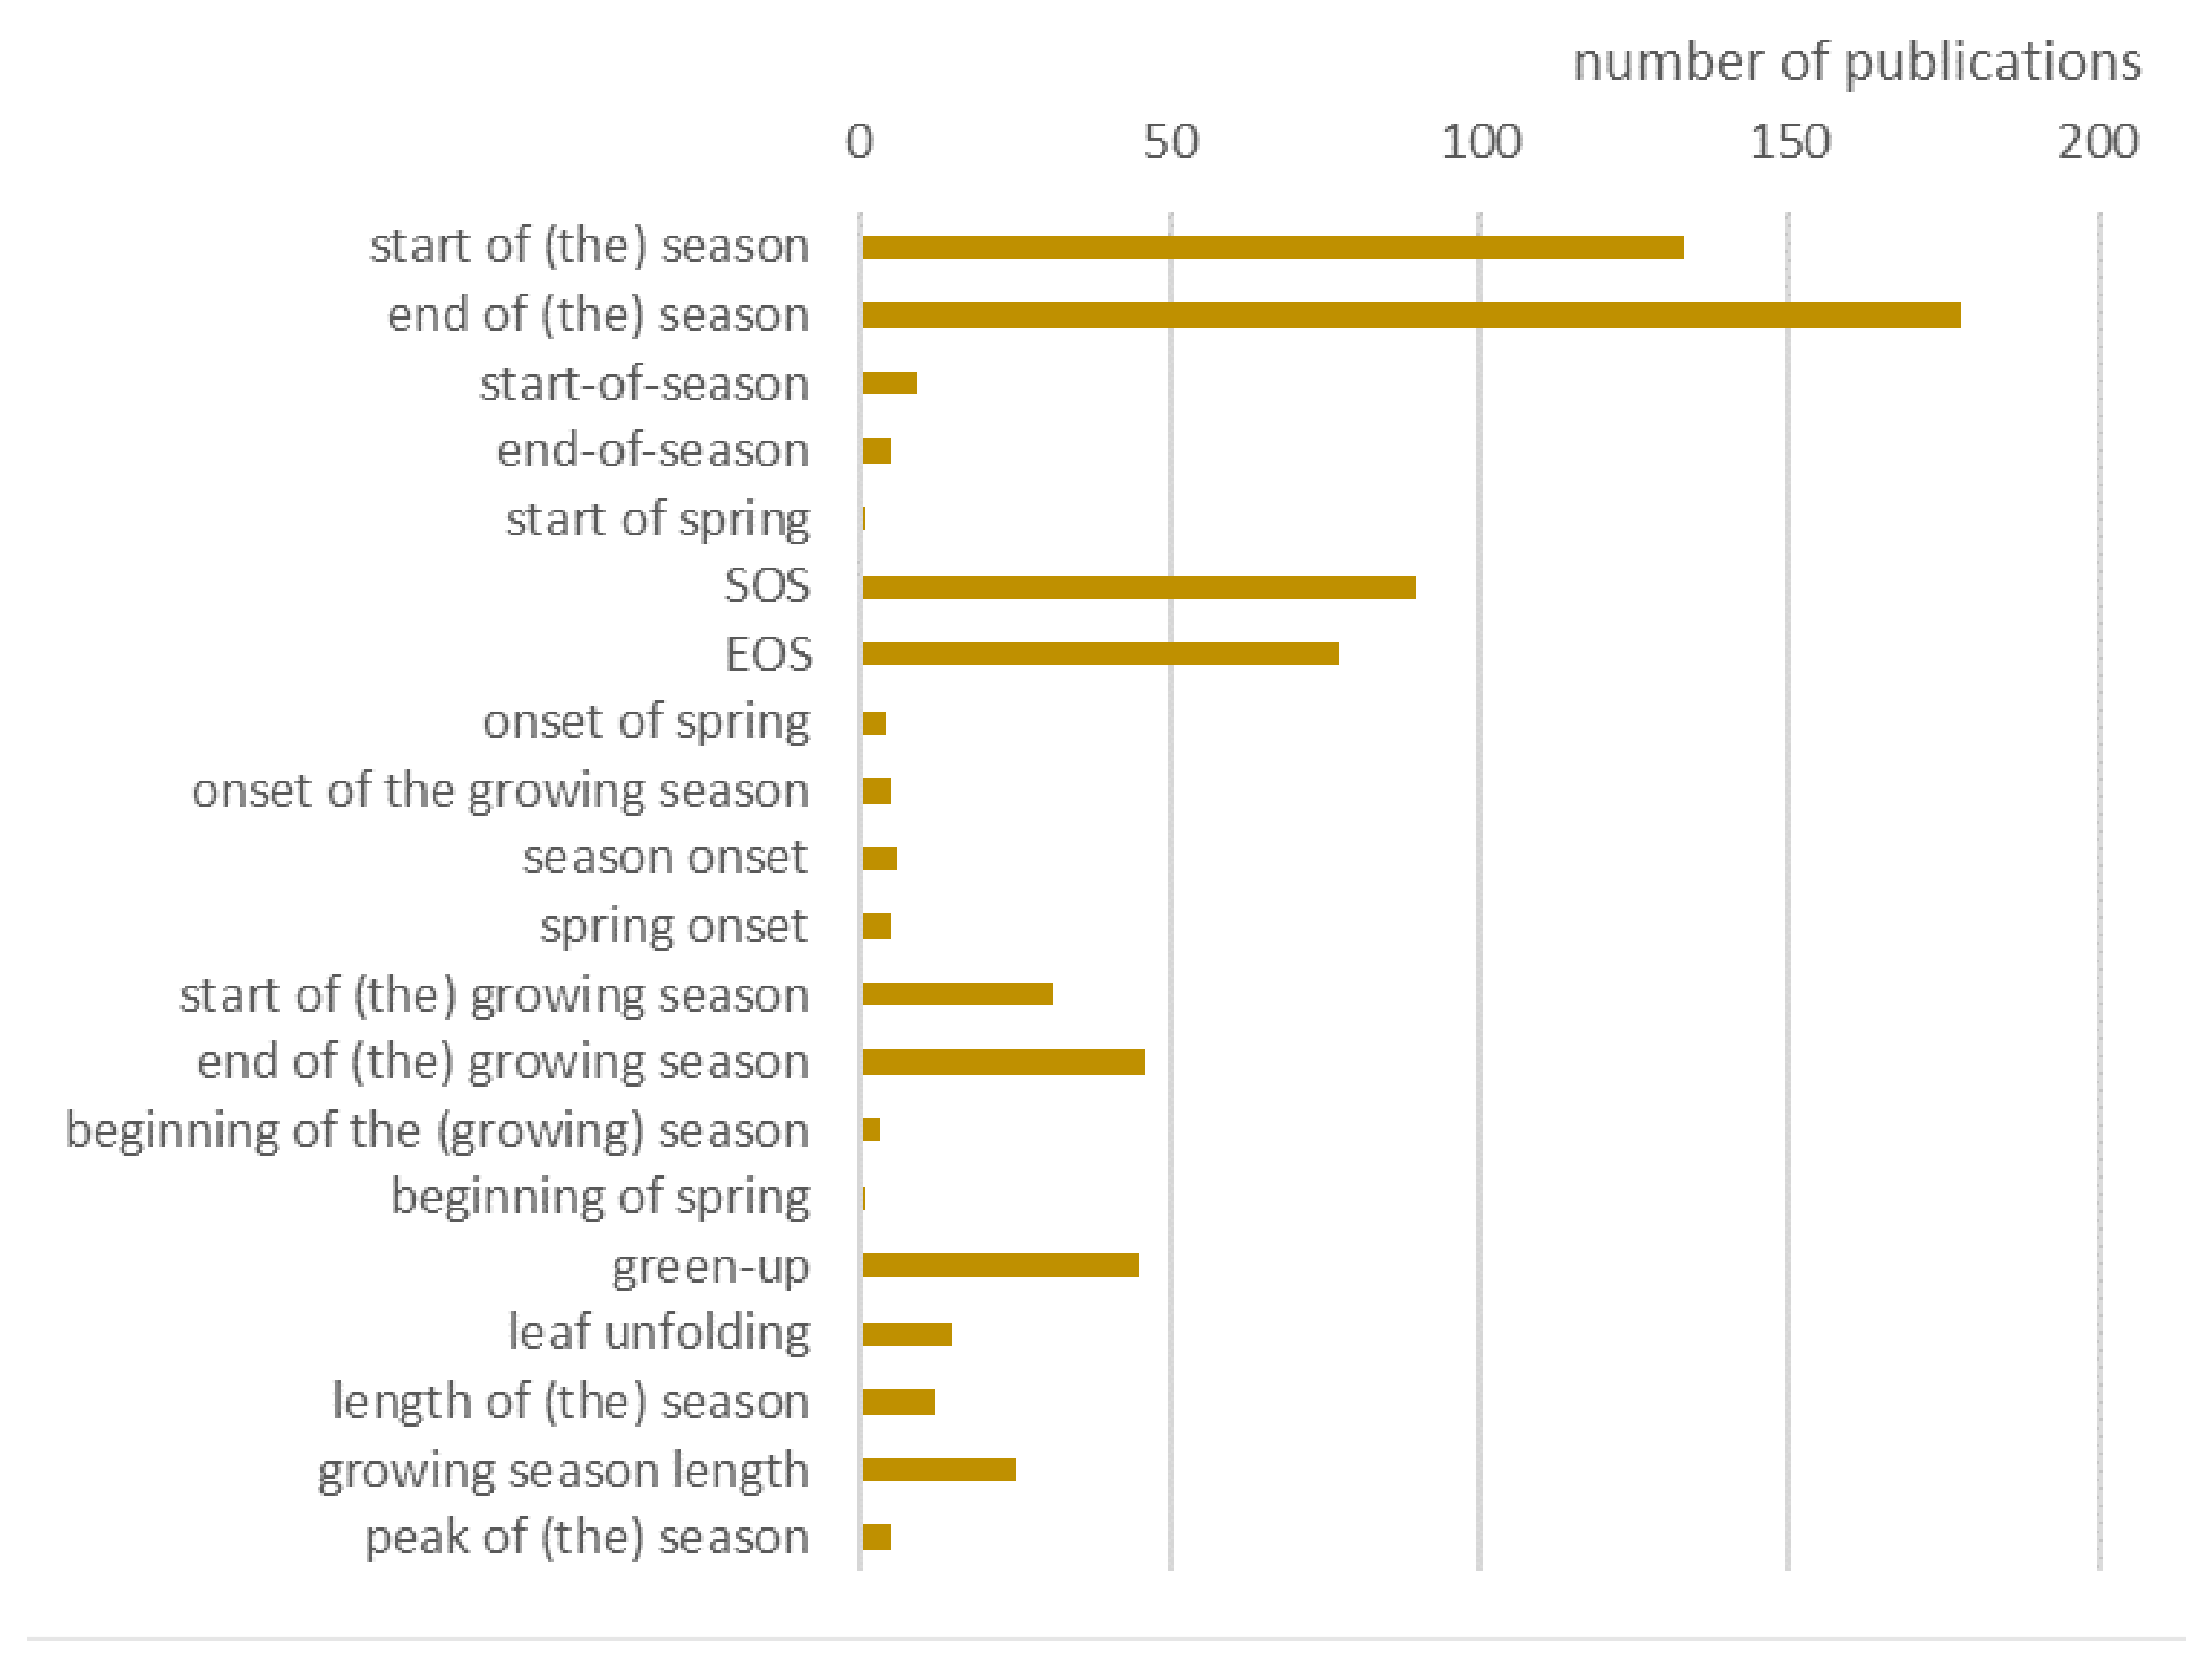
3.2.1. Season Metrics
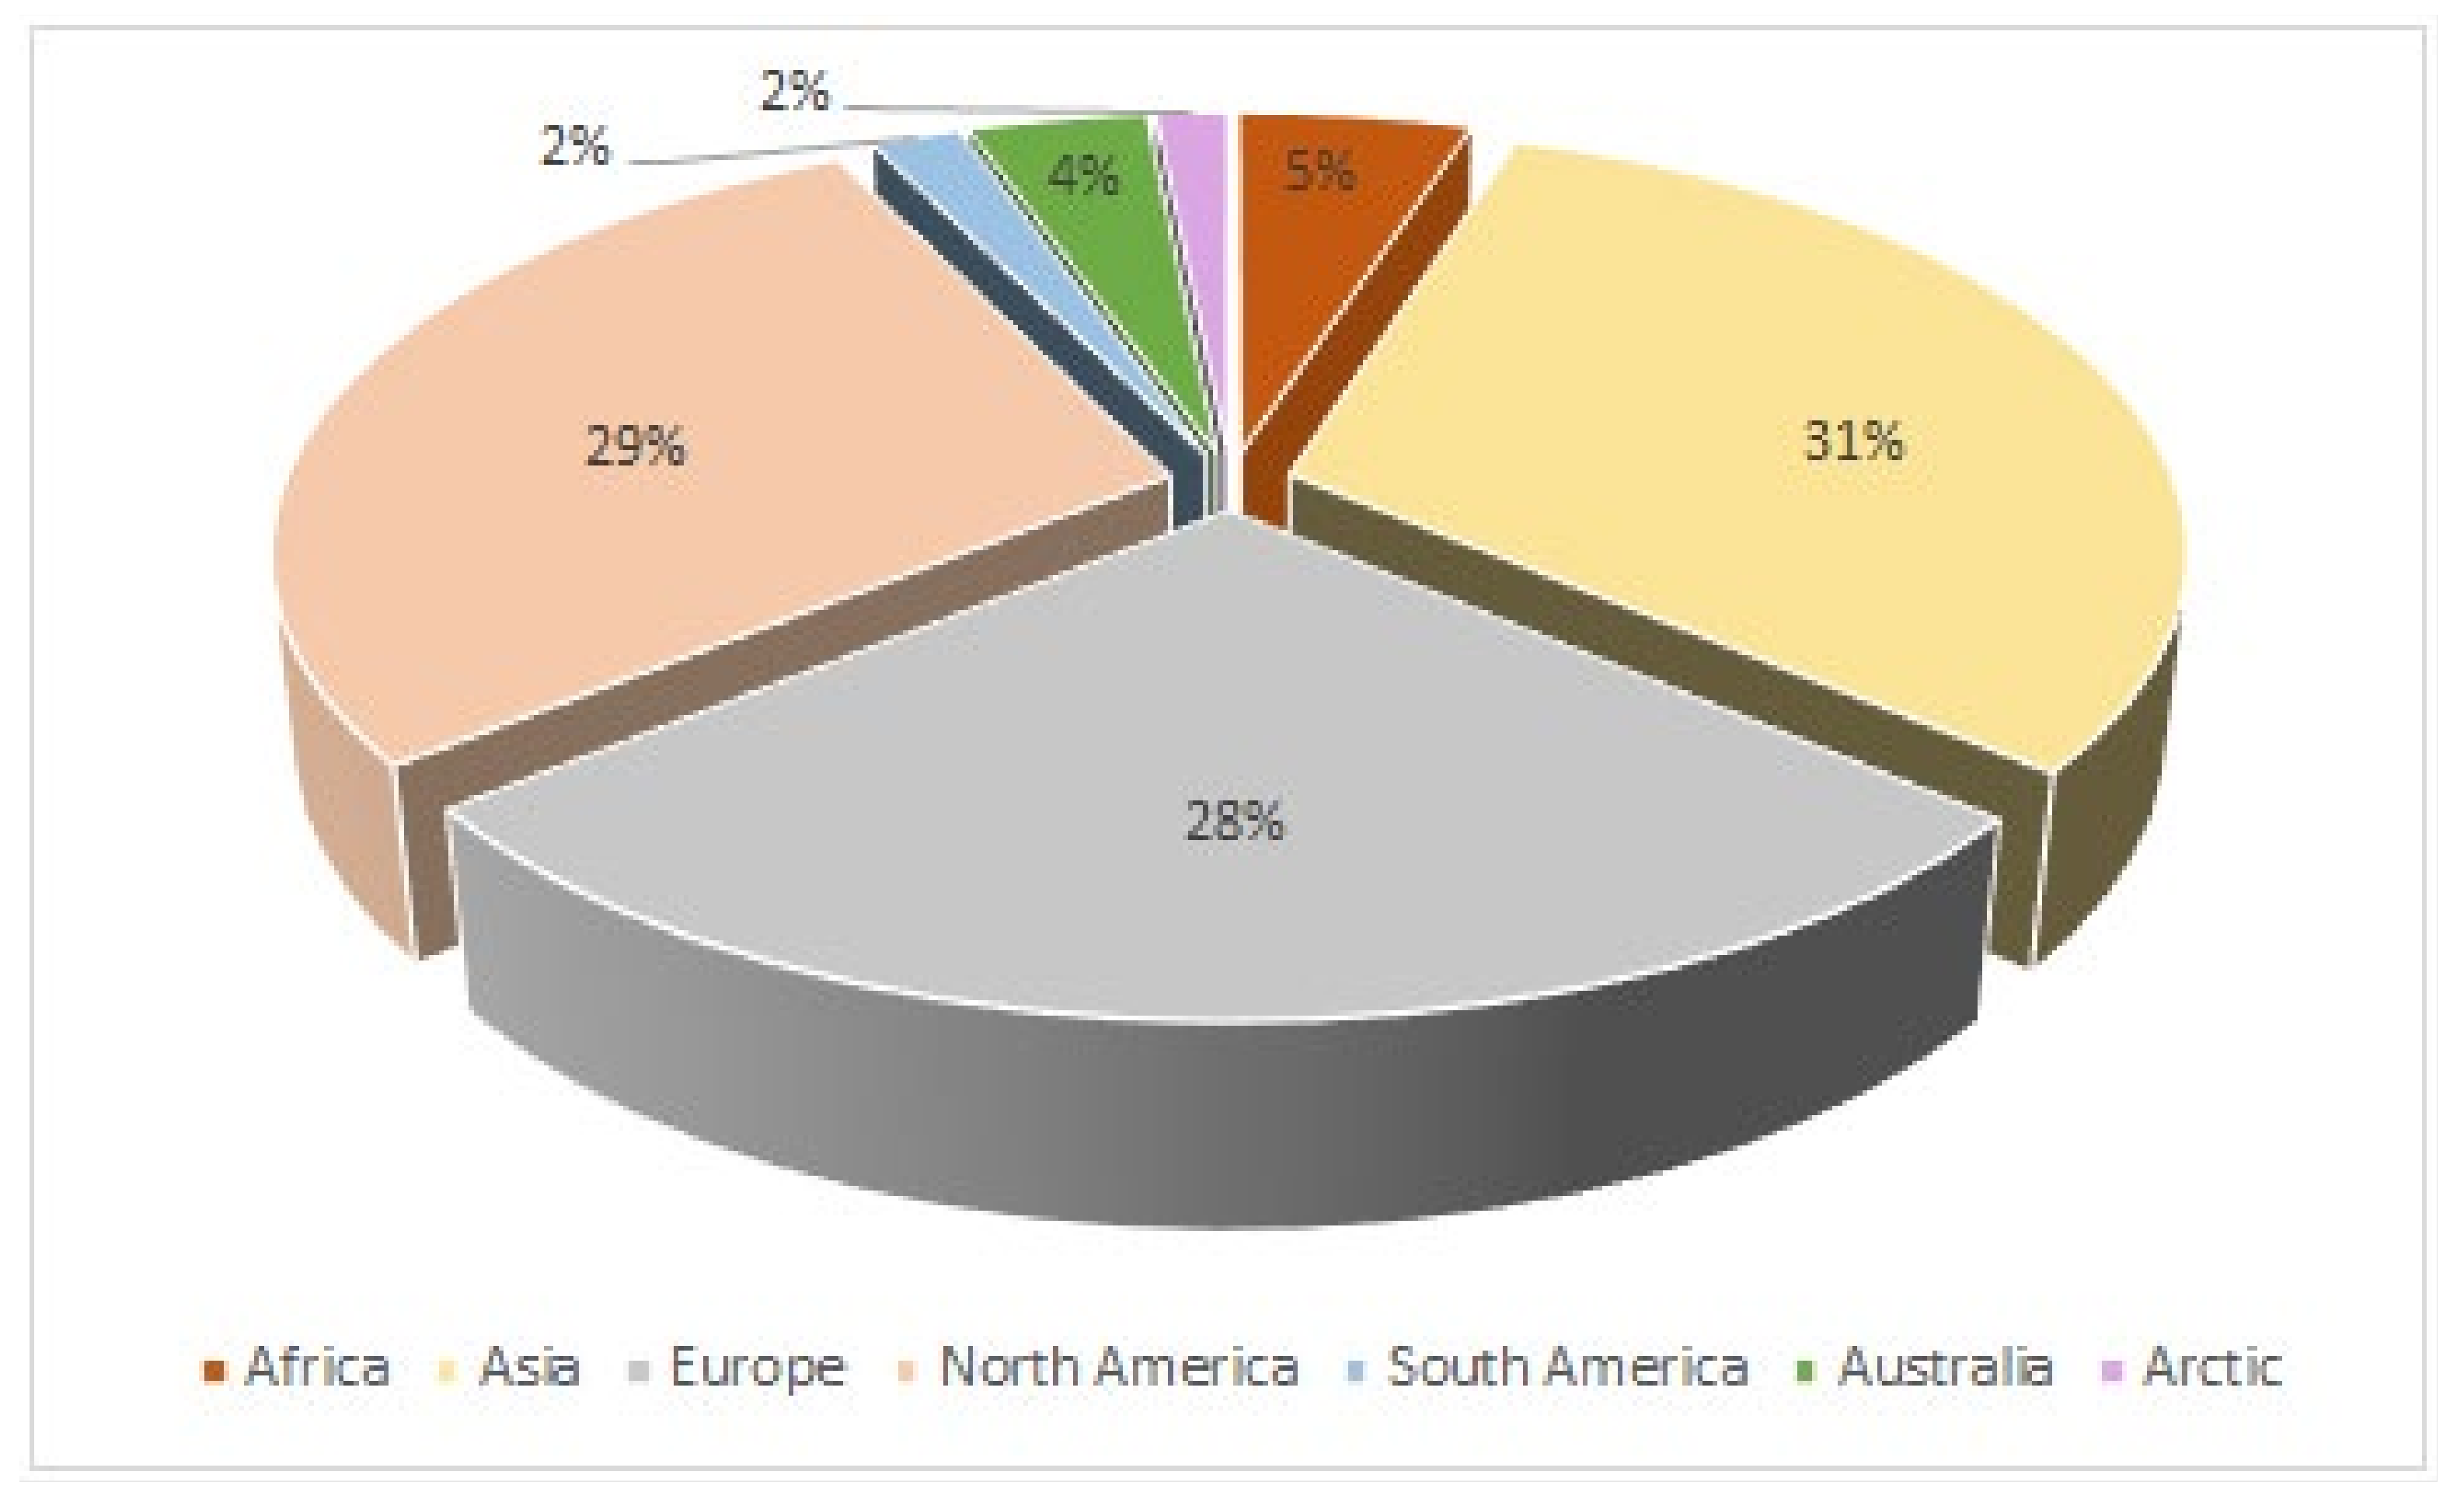
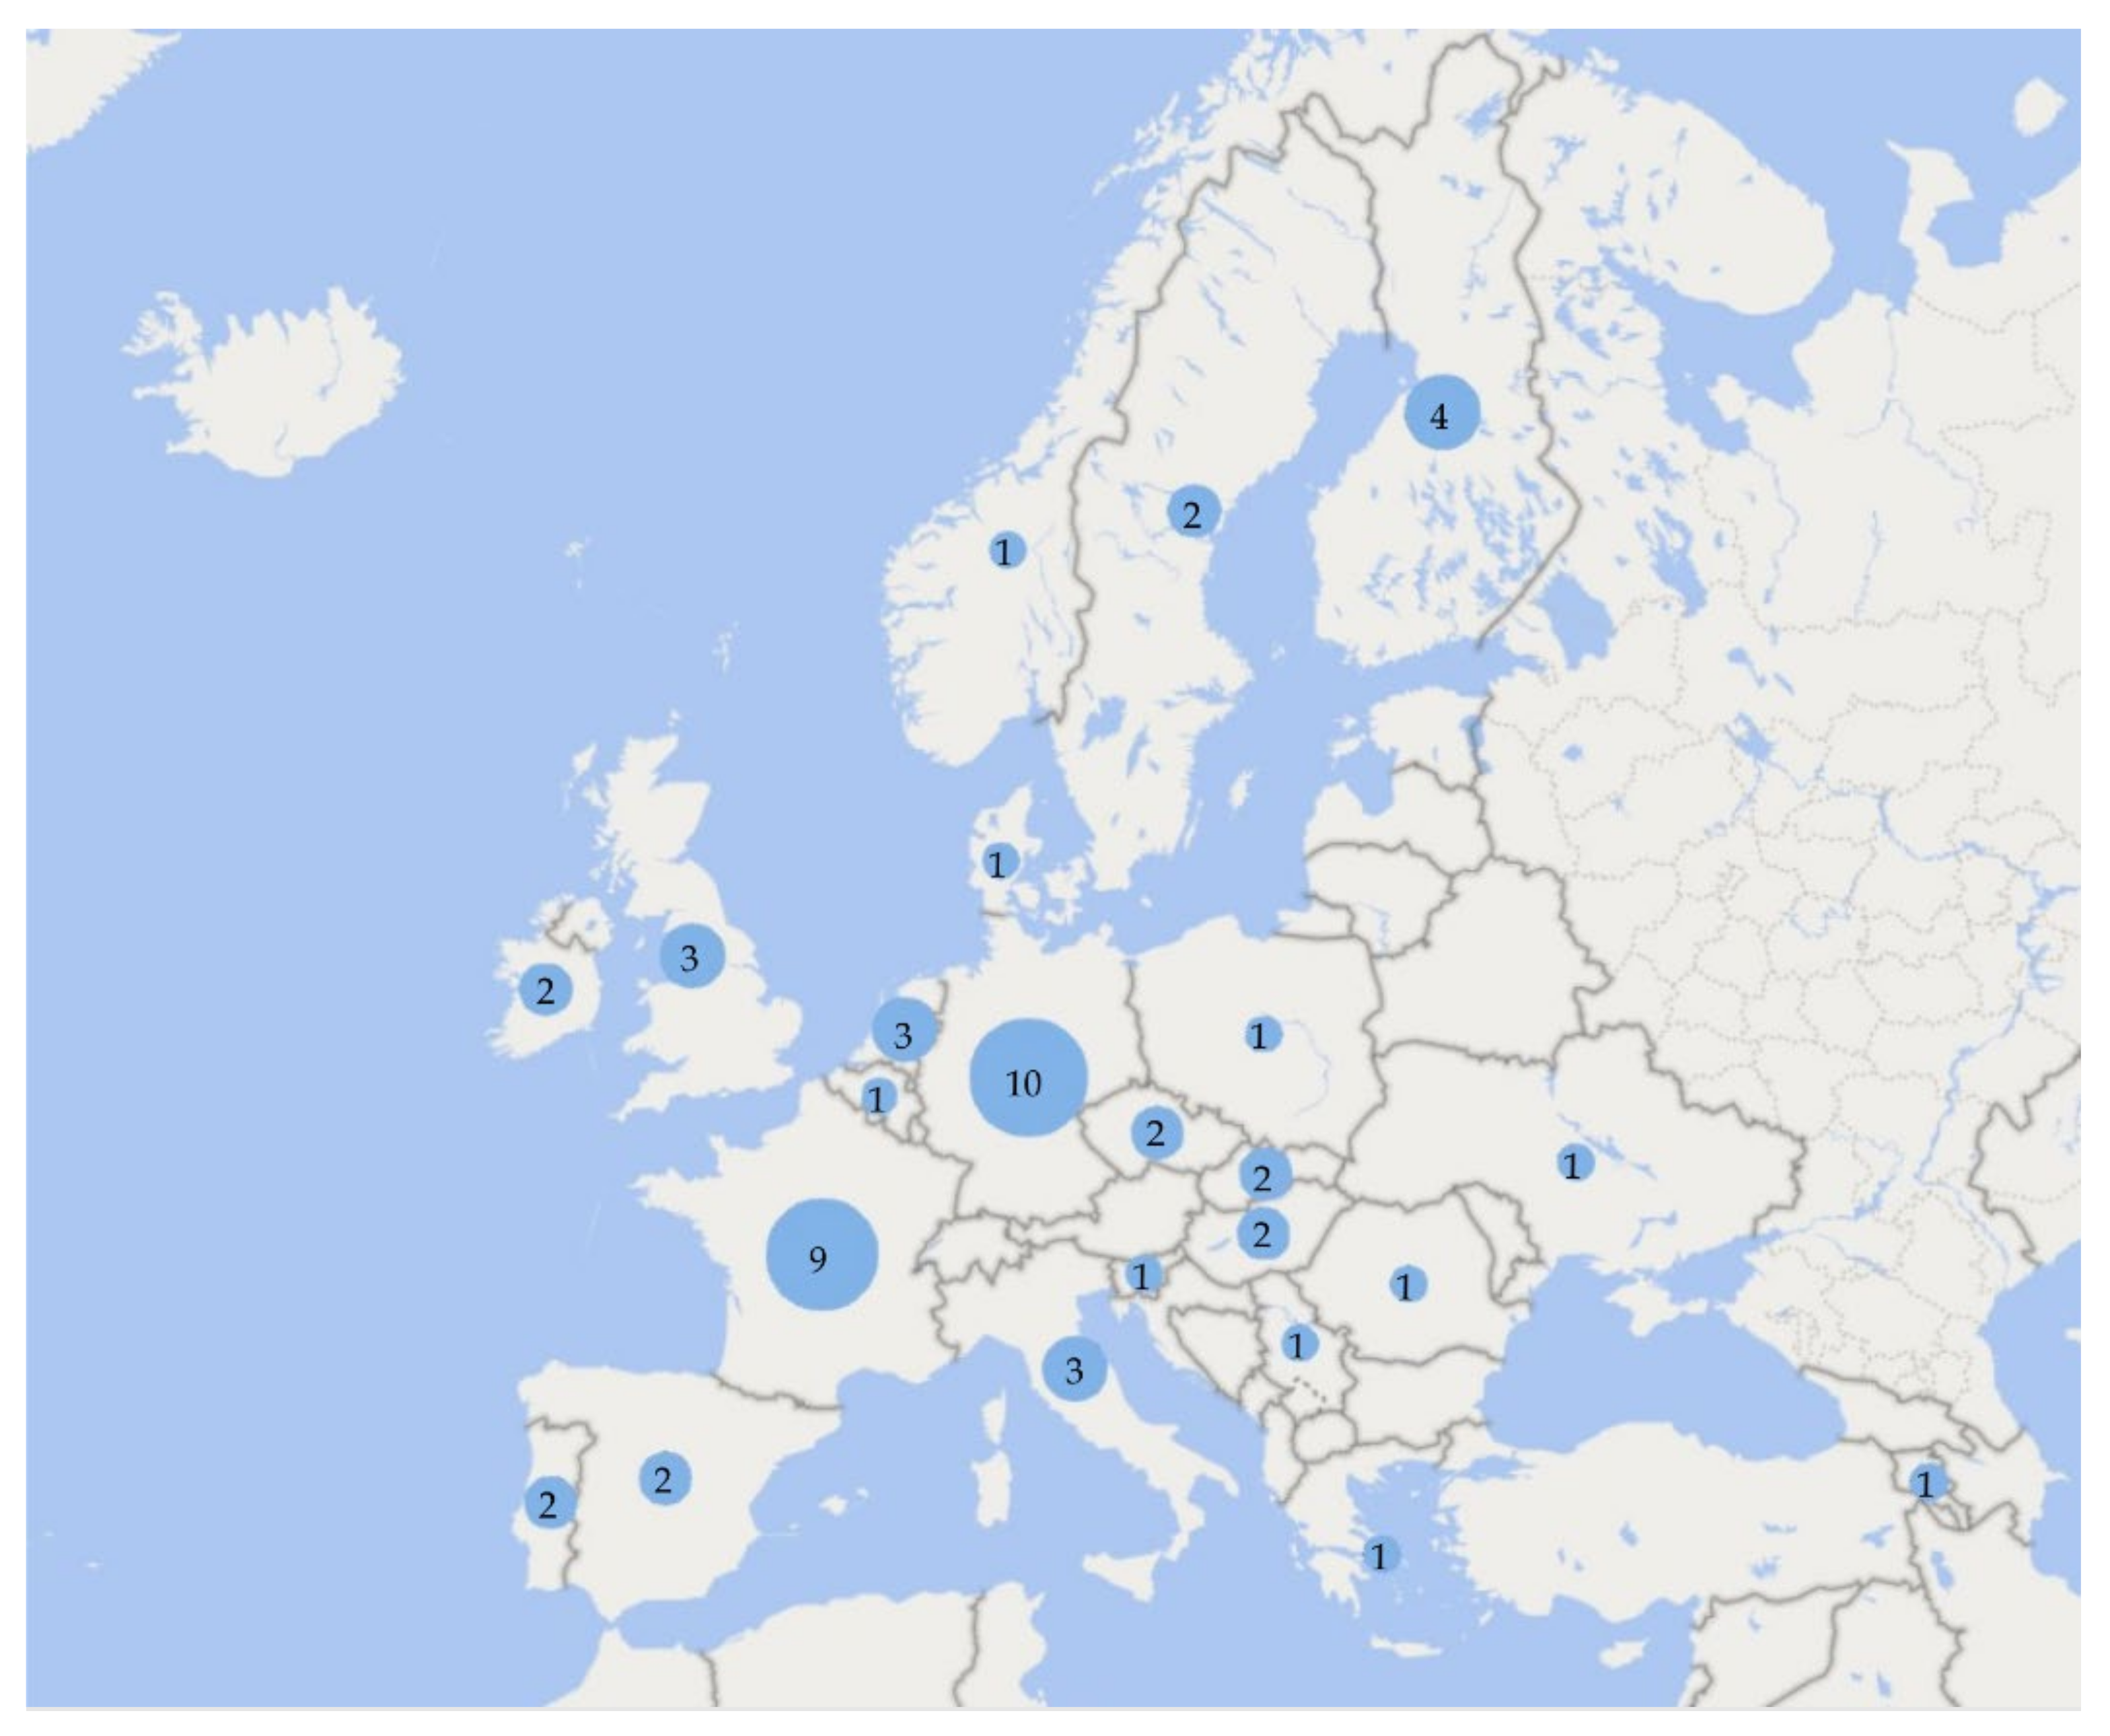
3.2.2. Location of Research
3.2.3. Research Scale
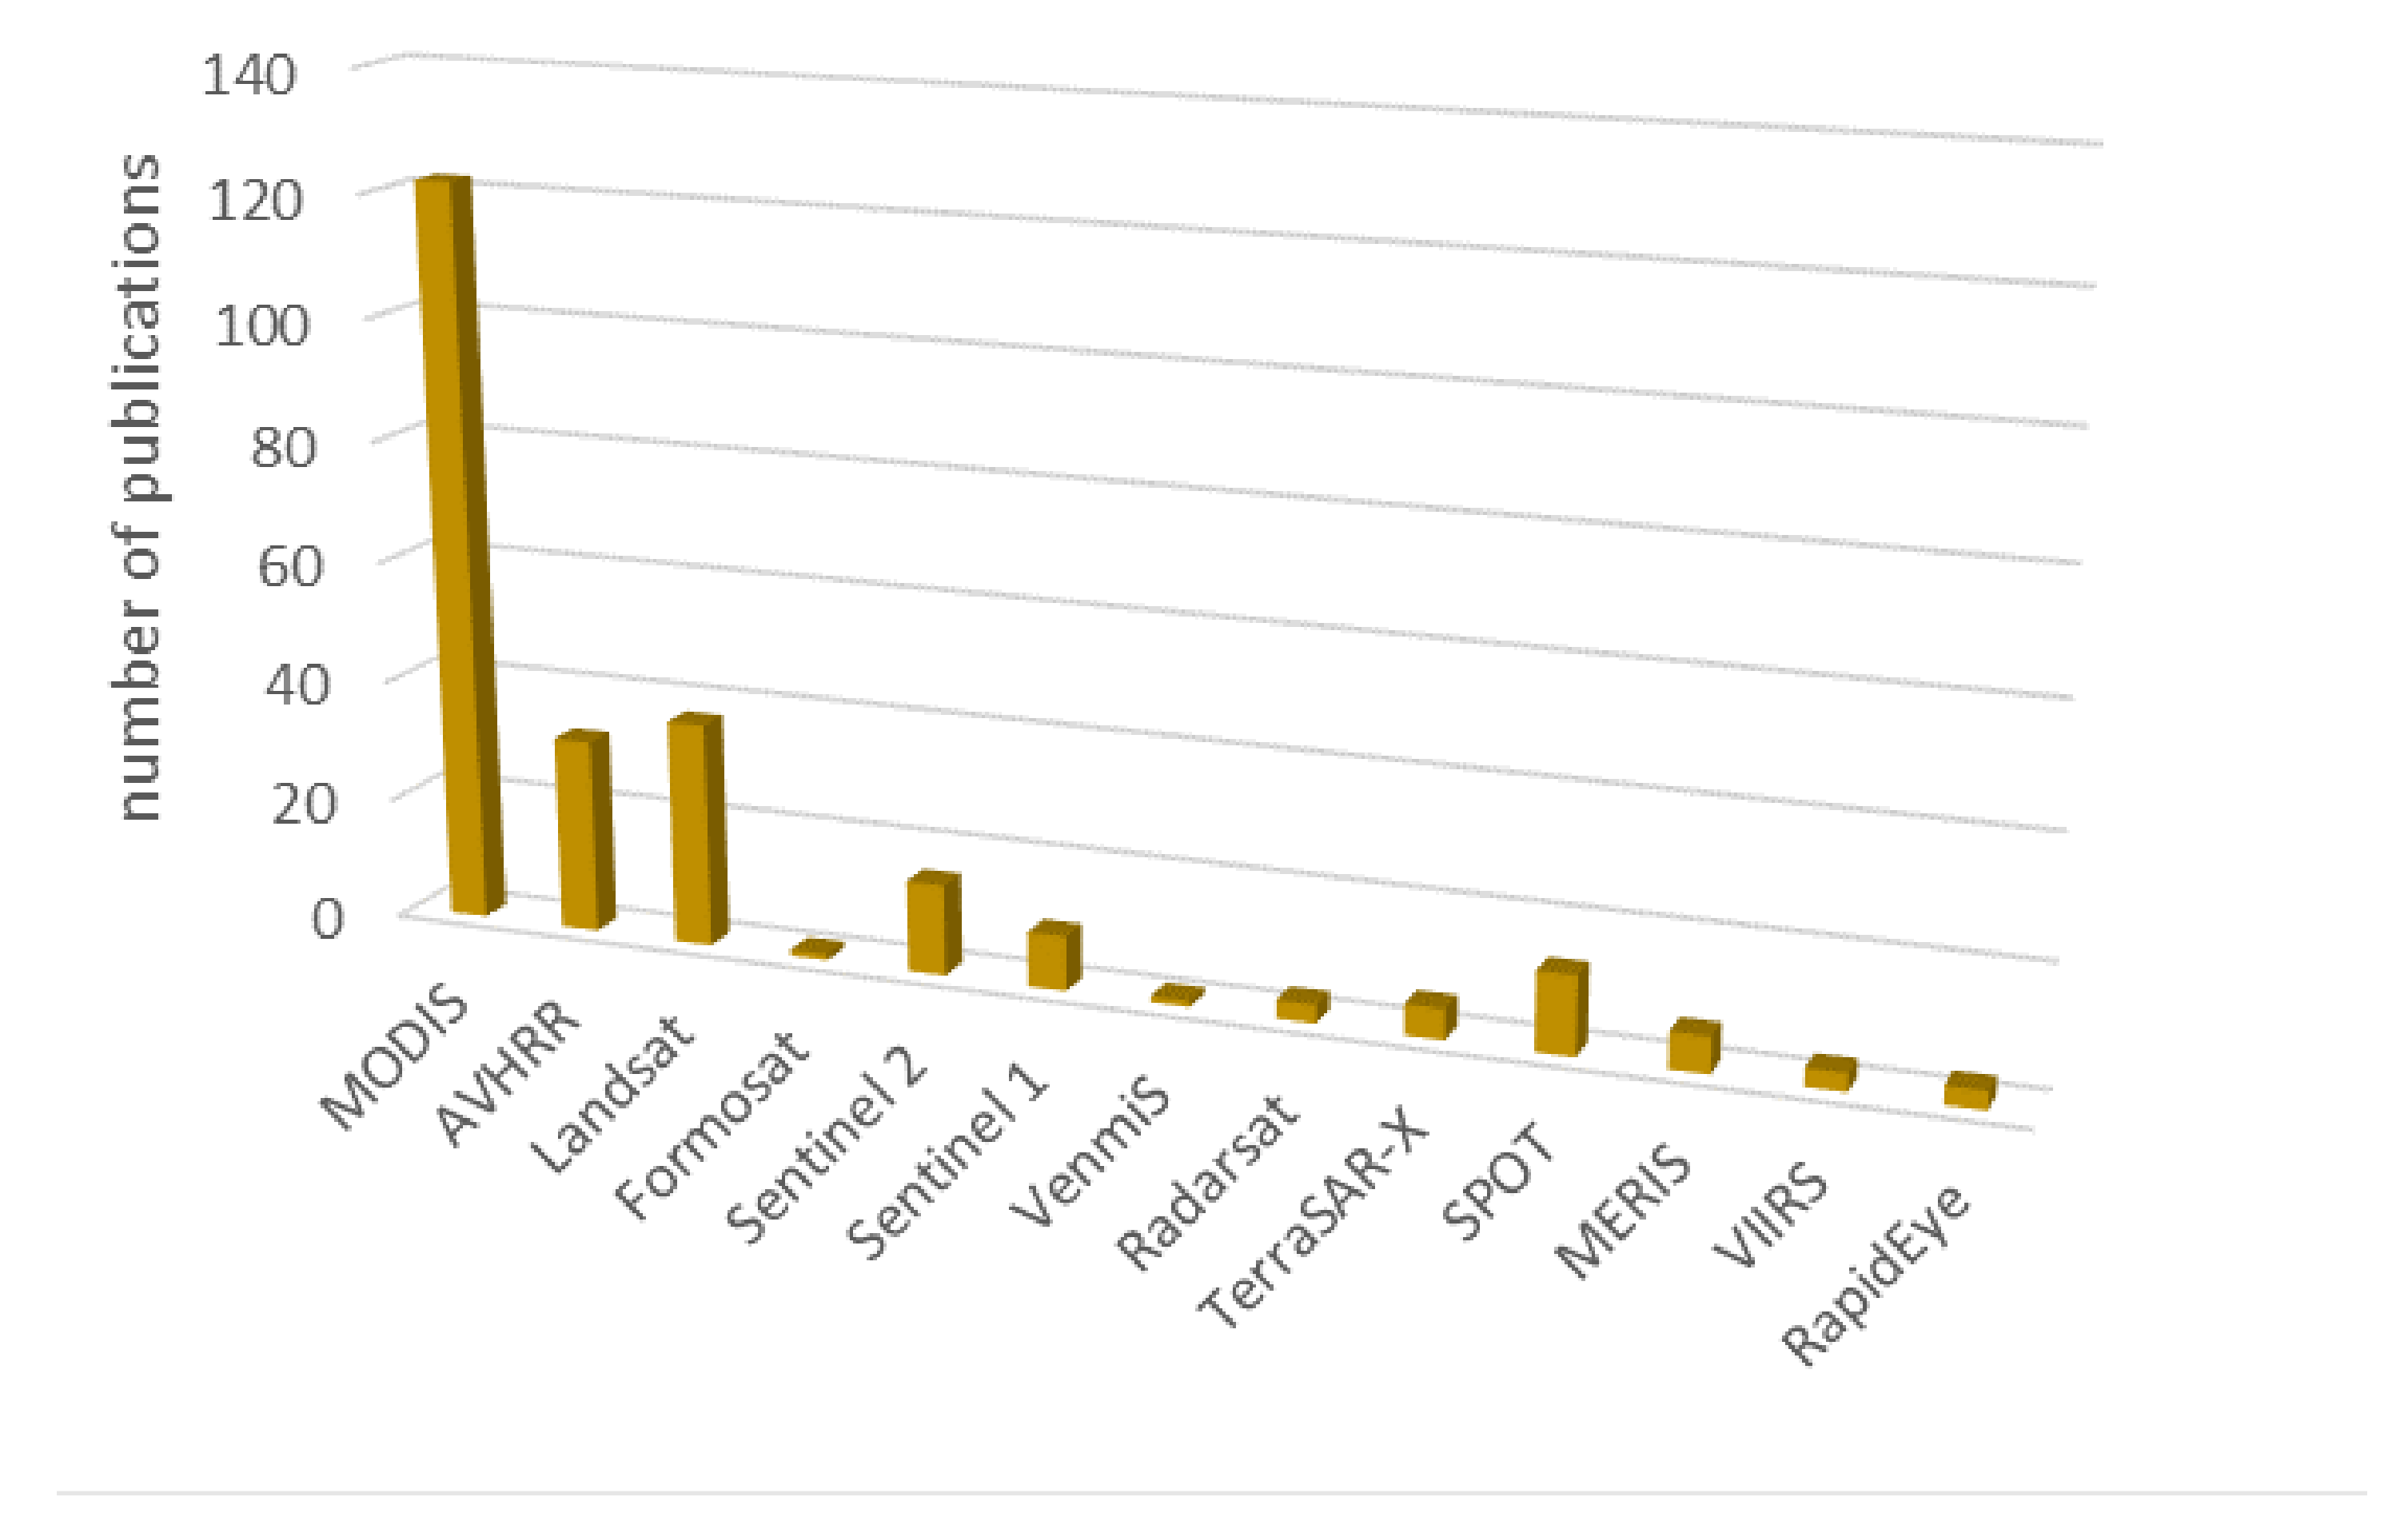
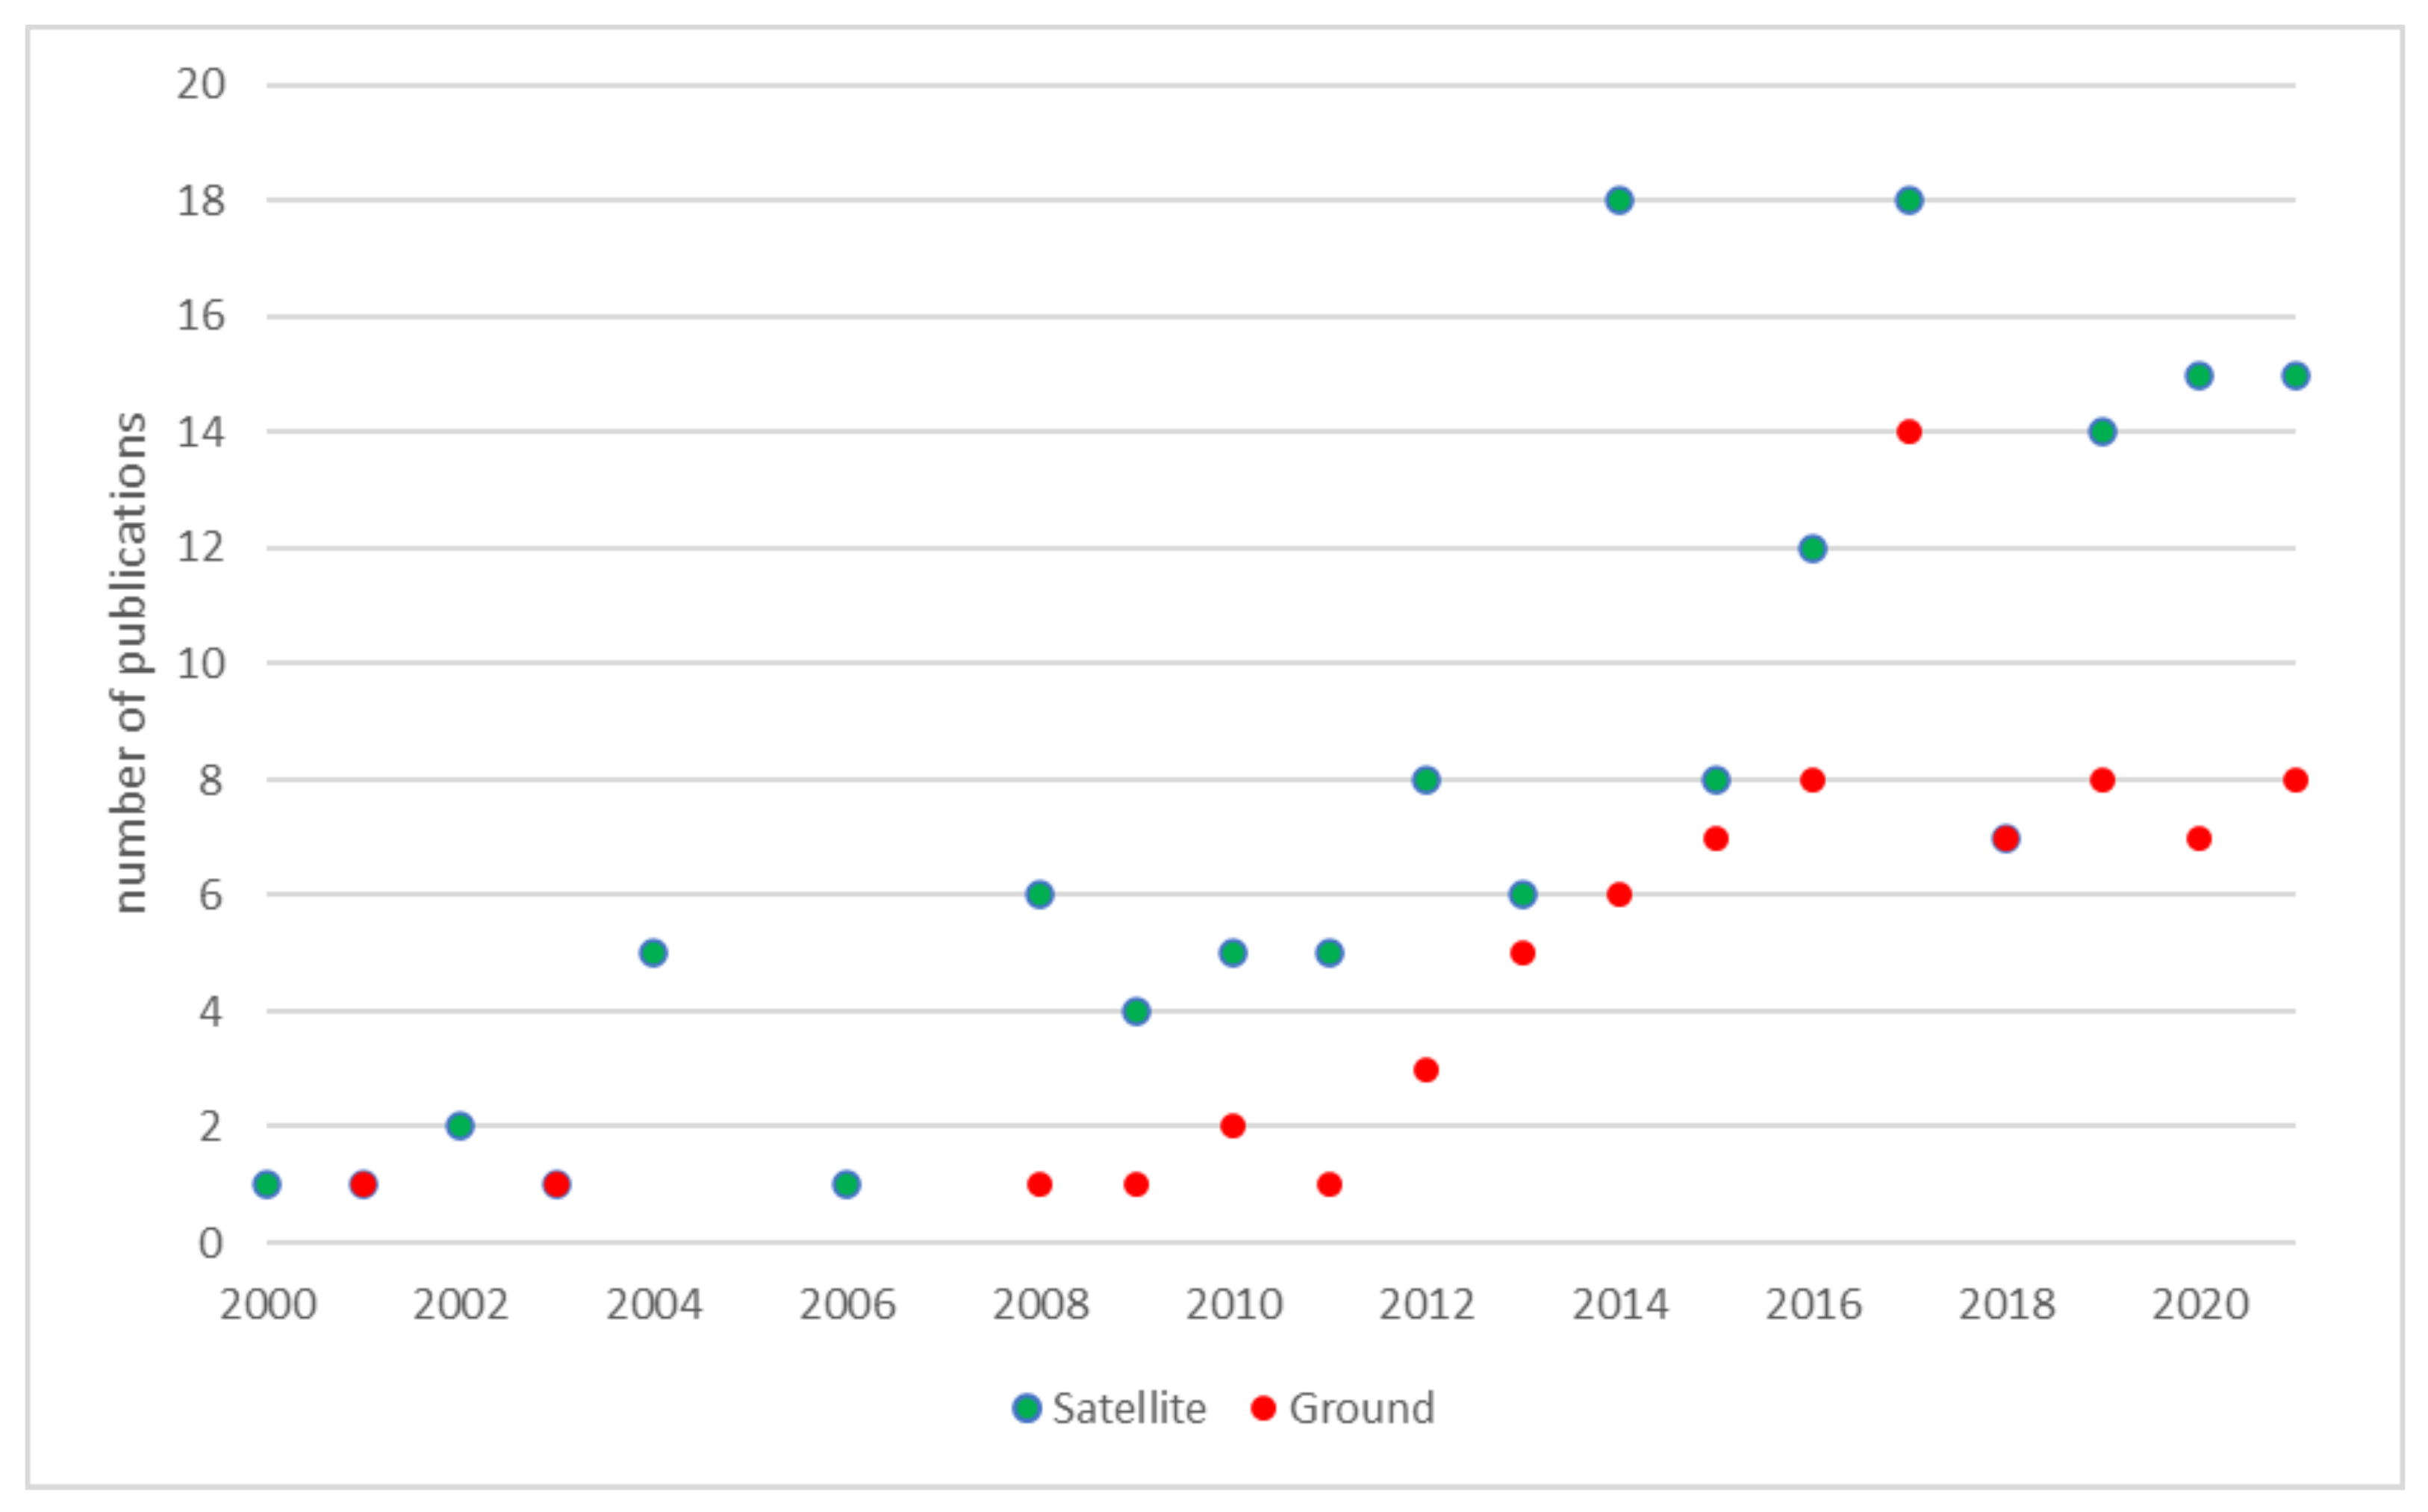
3.2.4. Source Data
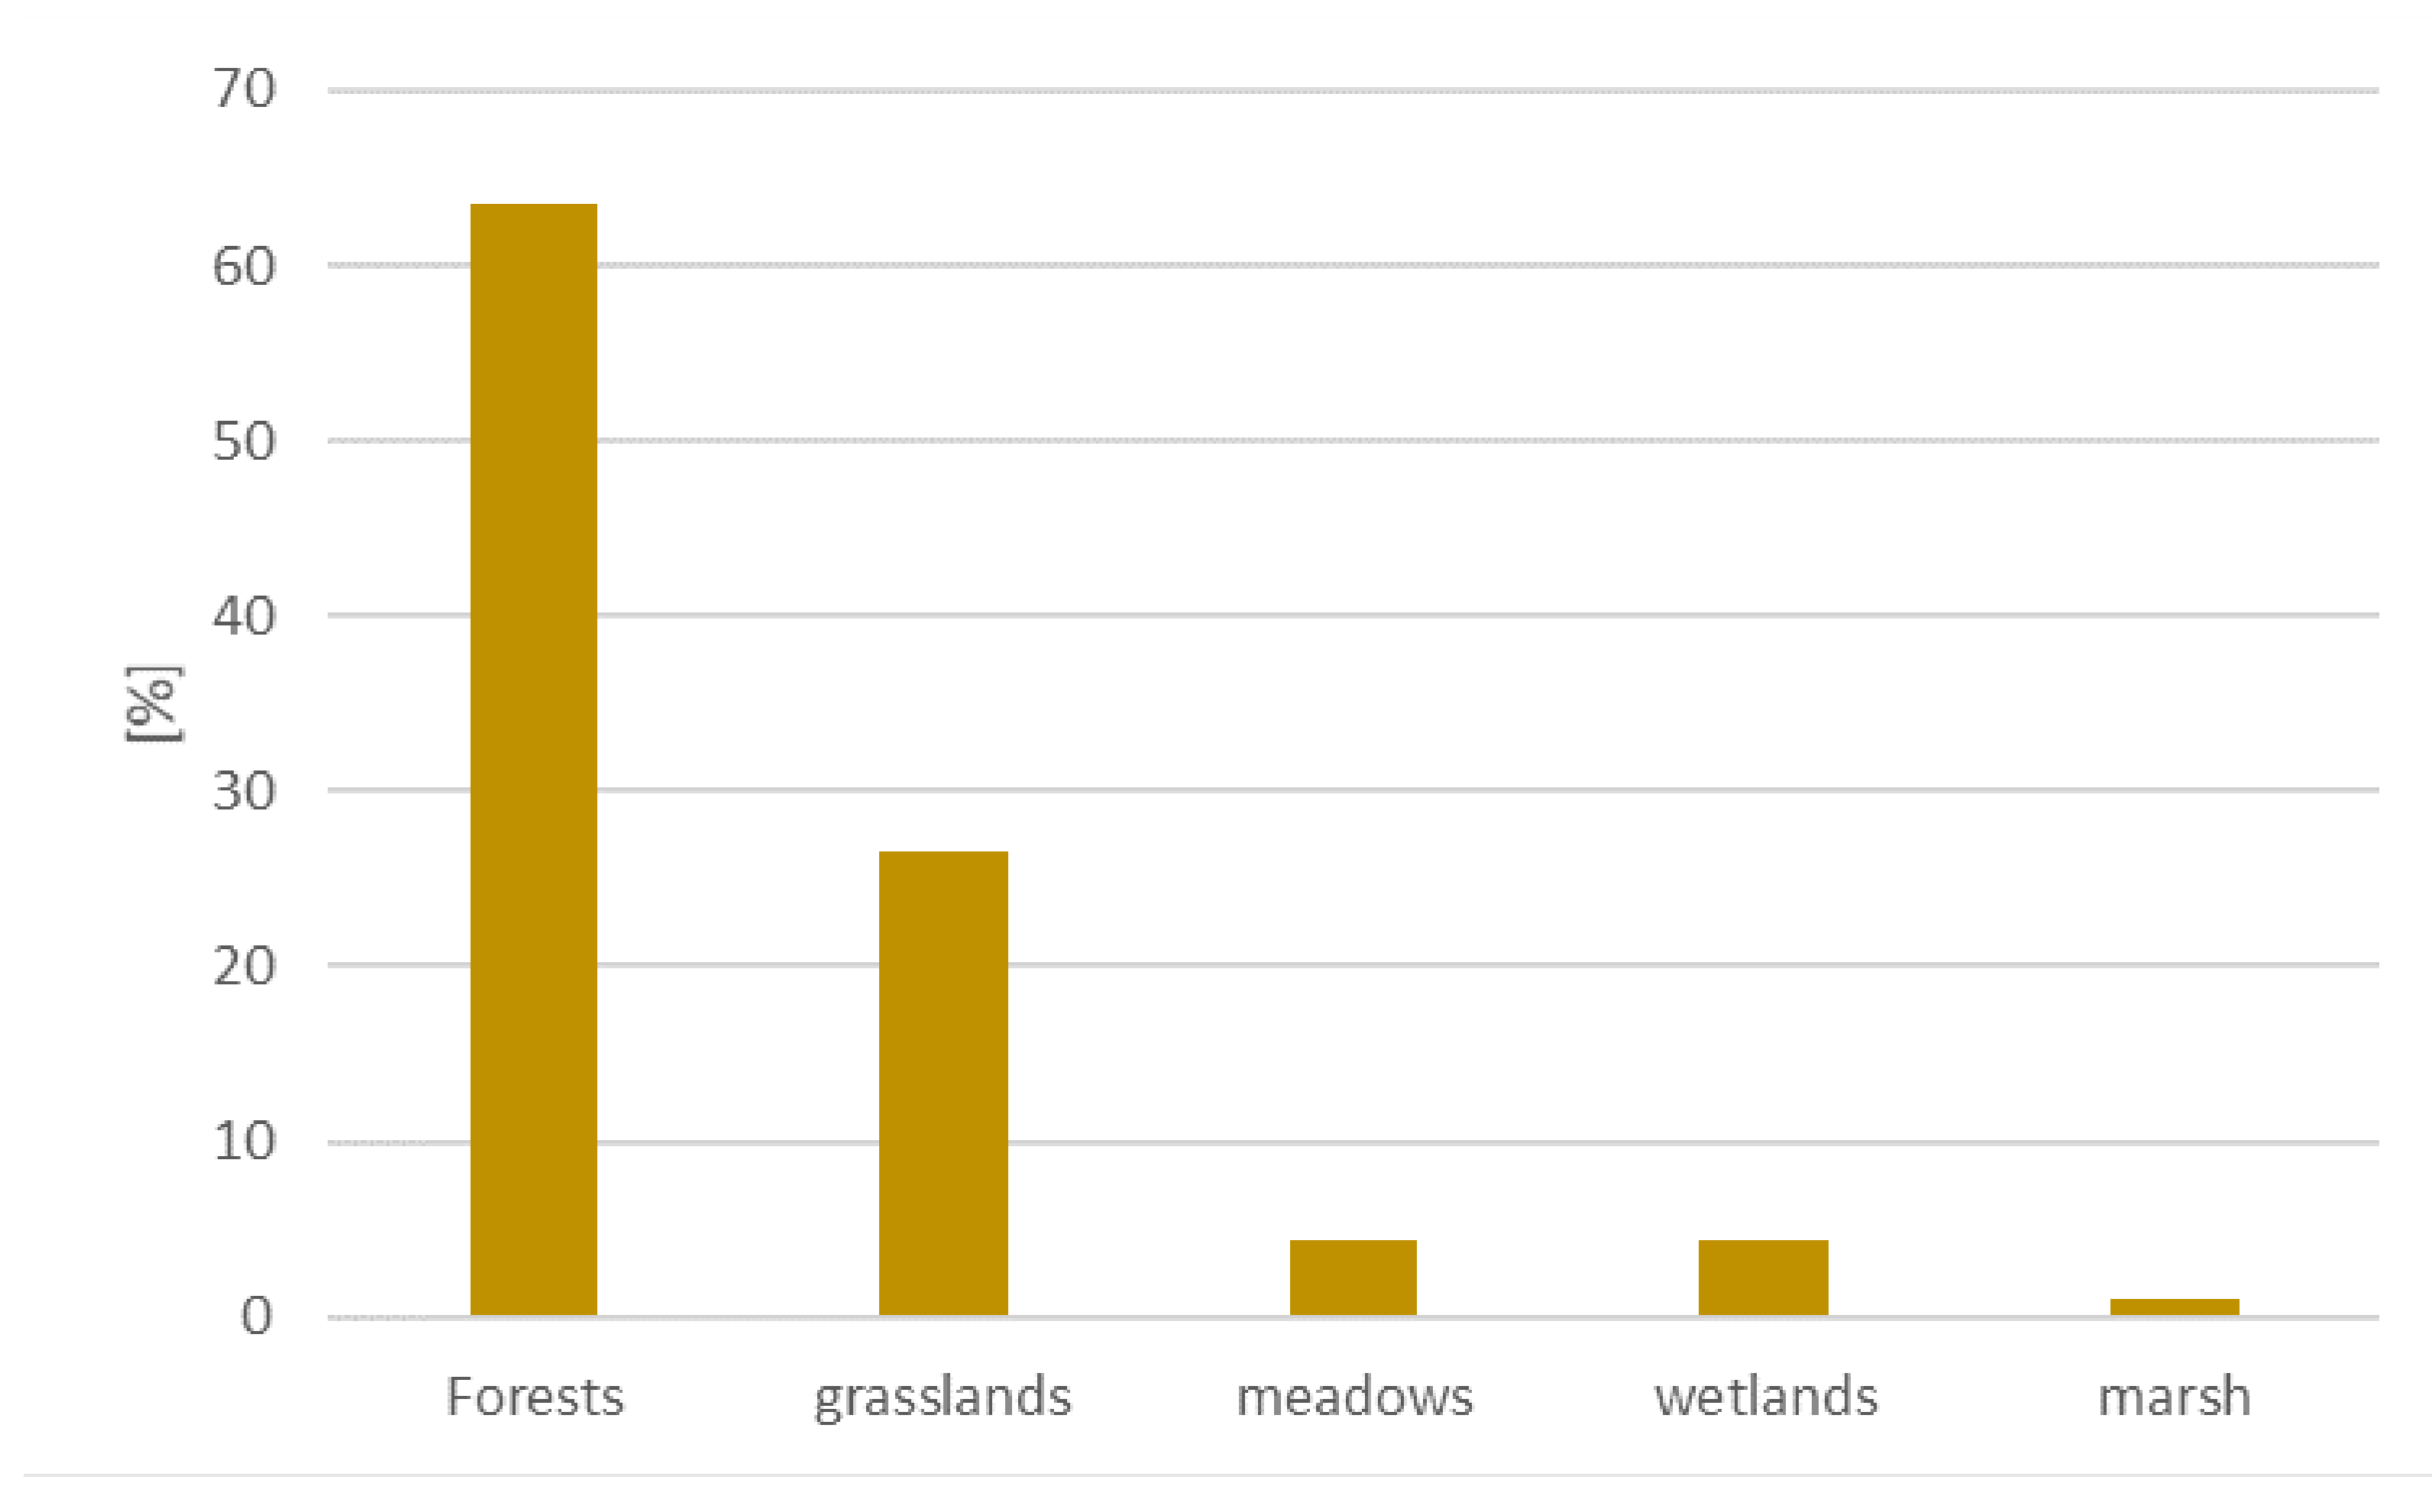
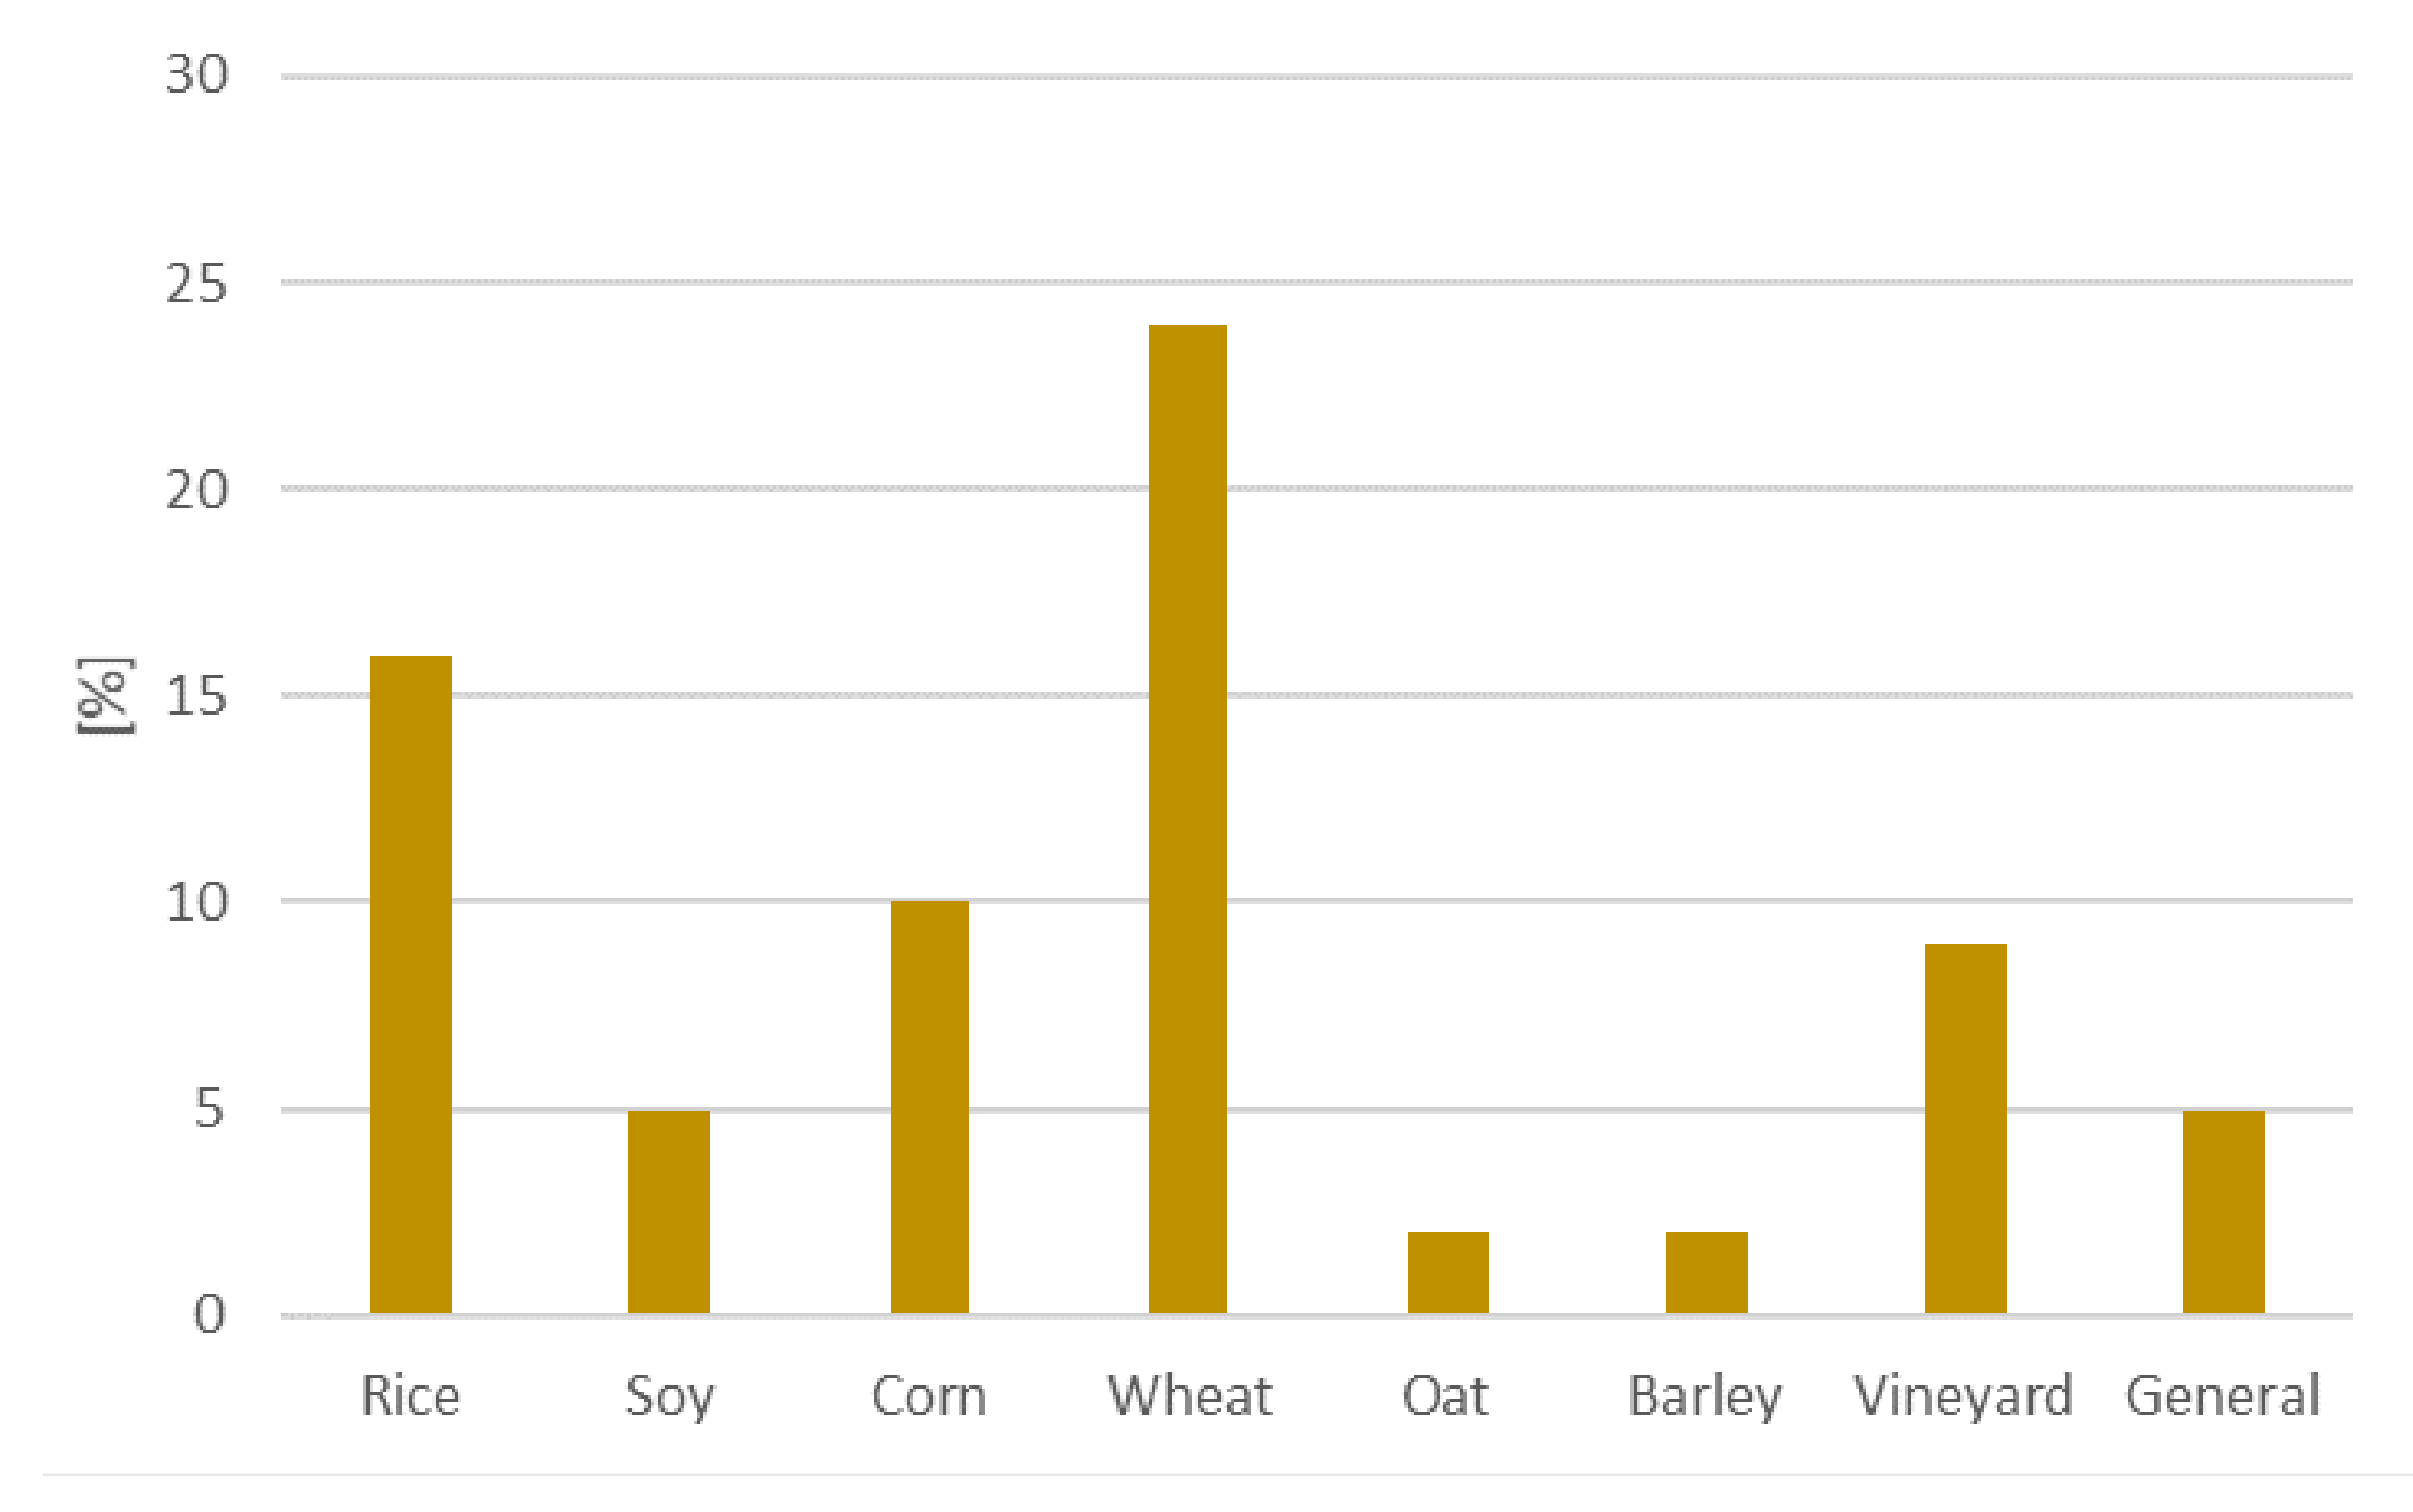
3.2.5. Vegetation Types
4. Discussion
5. Conclusions
Author Contributions
Funding
Institutional Review Board Statement
Informed Consent Statement
Data Availability Statement
Acknowledgments
Conflicts of Interest
References
- Morellato, L.P.C.; Abernethy, K.; Mendoza, I. Rethinking Tropical Phenology: Insights from Long-Term Monitoring and Novel Analytical Methods. Biotropica 2018, 50, 371–373. [Google Scholar] [CrossRef] [Green Version]
- Kunkel, K.E.; Easterling, D.R.; Hubbard, K.; Redmond, K. Temporal Variations in Frost-Free Season in the United States: 1895–2000. Geophys. Res. Lett. 2004, 31. [Google Scholar] [CrossRef]
- Hawkins, E.; Fricker, T.E.; Challinor, A.J.; Ferro, C.A.T.; Ho, C.K.; Osborne, T.M. Increasing Influence of Heat Stress on French Maize Yields from the 1960s to the 2030s. Glob. Chang. Biol. 2013, 19, 937–947. [Google Scholar] [CrossRef] [PubMed] [Green Version]
- Kukal, M.S.; Irmak, S.U.S. Agro-Climate in 20th Century: Growing Degree Days, First and Last Frost, Growing Season Length, and Impacts on Crop Yields. Sci. Rep. 2018, 8, 6977. [Google Scholar] [CrossRef]
- Lobell, D.B.; Hammer, G.L.; McLean, G.; Messina, C.; Roberts, M.J.; Schlenker, W. The Critical Role of Extreme Heat for Maize Production in the United States. Nat. Clim. Chang. 2013, 3, 497–501. [Google Scholar] [CrossRef]
- Olesen, J.E.; Trnka, M.; Kersebaum, K.C.; Skjelvåg, A.O.; Seguin, B.; Peltonen-Sainio, P.; Rossi, F.; Kozyra, J.; Micale, F. Impacts and Adaptation of European Crop Production Systems to Climate Change. Eur. J. Agron. 2011, 34, 96–112. [Google Scholar] [CrossRef]
- Semenov, M.A.; Shewry, P.R. Modelling Predicts That Heat Stress, Not Drought, Will Increase Vulnerability of Wheat in Europe. Sci. Rep. 2011, 1, 66. [Google Scholar] [CrossRef]
- Bale, J.S.; Masters, G.J.; Hodkinson, I.D.; Awmack, C.; Bezemer, T.M.; Brown, V.K.; Butterfield, J.; Buse, A.; Coulson, J.C.; Farrar, J.; et al. Herbivory in Global Climate Change Research: Direct Effects of Rising Temperature on Insect Herbivores. Glob. Chang. Biol. 2002, 8, 1–16. [Google Scholar] [CrossRef]
- Bellard, C.; Bertelsmeier, C.; Leadley, P.; Thuiller, W.; Courchamp, F. Impacts of Climate Change on the Future of Biodiversity. Ecol. Lett. 2012, 15, 365–377. [Google Scholar] [CrossRef] [Green Version]
- Ren, S.; Peichl, M. Enhanced Spatiotemporal Heterogeneity and the Climatic and Biotic Controls of Autumn Phenology in Northern Grasslands. Sci. Total Environ. 2021, 788, 147806. [Google Scholar] [CrossRef]
- Walther, G.-R.; Post, E.; Convey, P.; Menzel, A.; Parmesan, C.; Beebee, T.J.C.; Fromentin, J.-M.; Hoegh-Guldberg, O.; Bairlein, F. Ecological Responses to Recent Climate Change. Nature 2002, 416, 389–395. [Google Scholar] [CrossRef] [PubMed]
- Crocker, R.L. Past Climatic Fluctuations and Their Influence Upon Australian Vegetation. In Biogeography and Ecology in Australia; Keast, A., Crocker, R.L., Christian, C.S., Eds.; Monographiae Biologicae; Springer: Dordrecht, The Netherlands, 1959; pp. 283–290. ISBN 978-94-017-6295-3. [Google Scholar]
- Walck, J.L.; Hidayati, S.N.; Dixon, K.W.; Thompson, K.; Poschlod, P. Climate Change and Plant Regeneration from Seed. Glob. Chang. Biol. 2011, 17, 2145–2161. [Google Scholar] [CrossRef]
- Zhou, L.; Tucker, C.J.; Kaufmann, R.K.; Slayback, D.; Shabanov, N.V.; Myneni, R.B. Variations in Northern Vegetation Activity Inferred from Satellite Data of Vegetation Index during 1981 to 1999. J. Geophys. Res. Atmos. 2001, 106, 20069–20083. [Google Scholar] [CrossRef]
- Challinor, A.J.; Watson, J.; Lobell, D.B.; Howden, S.M.; Smith, D.R.; Chhetri, N. A Meta-Analysis of Crop Yield under Climate Change and Adaptation. Nat. Clim. Chang. 2014, 4, 287–291. [Google Scholar] [CrossRef]
- Chandio, A.A.; Ozturk, I.; Akram, W.; Ahmad, F.; Mirani, A.A. Empirical Analysis of Climate Change Factors Affecting Cereal Yield: Evidence from Turkey. Environ. Sci. Pollut. Res. 2020, 27, 11944–11957. [Google Scholar] [CrossRef] [PubMed]
- Hijmans, R.J. The Effect of Climate Change on Global Potato Production. Am. J. Potato Res. 2003, 80, 271–279. [Google Scholar] [CrossRef]
- Müller, C.; Bondeau, A.; Popp, A.; Waha, K.; Fader, M. Climate Change Impacts on Agricultural Yields; World Bank: Washington, DC, USA, 2010. [Google Scholar]
- Roudier, P.; Sultan, B.; Quirion, P.; Berg, A. The Impact of Future Climate Change on West African Crop Yields: What Does the Recent Literature Say? Glob. Environ. Chang. 2011, 21, 1073–1083. [Google Scholar] [CrossRef] [Green Version]
- Post, E.; Forchhammer, M.C.; Bret-Harte, M.S.; Callaghan, T.V.; Christensen, T.R.; Elberling, B.; Fox, A.D.; Gilg, O.; Hik, D.S.; Høye, T.T.; et al. Ecological Dynamics Across the Arctic Associated with Recent Climate Change. Science 2009, 325, 1355–1358. [Google Scholar] [CrossRef] [Green Version]
- Shaver, G.R.; Canadell, J.; Chapin, F.S.; Gurevitch, J.; Harte, J.; Henry, G.; Ineson, P.; Jonasson, S.; Melillo, J.; Pitelka, L.; et al. Global Warming and Terrestrial Ecosystems: A Conceptual Framework for Analysis: Ecosystem Responses to Global Warming Will Be Complex and Varied. Ecosystem Warming Experiments Hold Great Potential for Providing Insights on Ways Terrestrial Ecosystems Will Respond to Upcoming Decades of Climate Change. Documentation of Initial Conditions Provides the Context for Understanding and Predicting Ecosystem Responses. BioScience 2000, 50, 871–882. [Google Scholar] [CrossRef]
- Traill, L.W.; Lim, M.L.M.; Sodhi, N.S.; Bradshaw, C.J.A. Mechanisms Driving Change: Altered Species Interactions and Ecosystem Function through Global Warming. J. Anim. Ecol. 2010, 79, 937–947. [Google Scholar] [CrossRef]
- Reed, B.C.; Brown, J.F.; VanderZee, D.; Loveland, T.R.; Merchant, J.W.; Ohlen, D.O. Measuring Phenological Variability from Satellite Imagery. J. Veg. Sci. 1994, 5, 703–714. [Google Scholar] [CrossRef]
- Nilsson, H. Remote Sensing and Image Analysis in Plant Pathology. Annu. Rev. Phytopathol. 1995, 33, 489–528. [Google Scholar] [CrossRef] [PubMed]
- Gitelson, A.A.; Merzlyak, M.N. Signature Analysis of Leaf Reflectance Spectra: Algorithm Development for Remote Sensing of Chlorophyll. J. Plant Physiol. 1996, 148, 494–500. [Google Scholar] [CrossRef]
- Yang, L.; Wylie, B.K.; Tieszen, L.L.; Reed, B.C. An Analysis of Relationships among Climate Forcing and Time-Integrated NDVI of Grasslands over the U.S. Northern and Central Great Plains. Remote Sens. Environ. 1998, 65, 25–37. [Google Scholar] [CrossRef]
- Chong, C.S.; Basart, J.P.; Nutter, F.W., Jr.; Tylka, G.L.; Guan, J. Use of Remote Sensing to Determine Plant Health and Productivity. In Infrared Spaceborne Remote Sensing IX; SPIE: Bellingham, WA, USA, 2002; Volume 4486, pp. 484–493. [Google Scholar]
- Hogda, K.; Karlsen, S.; Solheim, I.; Tommervik, H.; Ramfjord, H. The Start Dates of Birch Pollen Seasons in Fennoscandia Studied by NOAA AVHRR NDVI Data. In IEEE International Geoscience and Remote Sensing Symposium; IEEE: Piscataway, NJ, USA, 2002; pp. 3299–3301. [Google Scholar]
- Díaz, B.M.; Blackburn, G.A. Remote Sensing of Mangrove Biophysical Properties: Evidence from a Laboratory Simulation of the Possible Effects of Background Variation on Spectral Vegetation Indices. Int. J. Remote Sens. 2003, 24, 53–73. [Google Scholar] [CrossRef]
- Johnson, L.; Roczen, D.; Youkhana, S.; Nemani, R.; Bosch, D. Mapping Vineyard Leaf Area with Multispectral Satellite Imagery. Comput. Electron. Agric. 2003, 38, 33–44. [Google Scholar] [CrossRef]
- Kimball, J.; McDonald, K.; Running, S.; Frolking, S. Satellite Radar Remote Sensing of Seasonal Growing Seasons for Boreal and Subalpine Evergreen Forests. Remote Sens. Environ. 2004, 90, 243–258. [Google Scholar] [CrossRef]
- Kimball, J.; Zhao, M.; McDonald, K.; Heinsch, F.; Running, S. Satellite Observations of Annual Variability in Terrestrial Carbon Cycles and Seasonal Growing Seasons at High Northern Latitudes; Jackson, G., Uratsuka, S., Eds.; Microwave Remote Sensing of the Atmosphere and Environment IV; SPIE: Honolulu, HI, USA, 2004; Volume 5654, pp. 244–254. [Google Scholar]
- McDonald, K.; Kimball, J.; Njoku, E.; Zimmermann, R.; Zhao, M. Variability in Springtime Thaw in the Terrestrial High Latitudes: Monitoring a Major Control on the Biospheric Assimilation of Atmospheric CO2 with Spaceborne Microwave Remote Sensing. Earth Interact. 2004, 8, 1–23. [Google Scholar] [CrossRef] [Green Version]
- Stockli, R.; Vidale, P. European Plant Phenology and Climate as Seen in a 20-Year AVHRR Land-Surface Parameter Dataset. Int. J. Remote Sens. 2004, 25, 3303–3330. [Google Scholar] [CrossRef]
- Fisher, J.I.; Mustard, J.F.; Vadeboncoeur, M.A. Green Leaf Phenology at Landsat Resolution: Scaling from the Field to the Satellite. Remote Sens. Environ. 2006, 100, 265–279. [Google Scholar] [CrossRef]
- Schwartz, M.; Ahas, R.; Aasa, A. Onset of Spring Starting Earlier across the Northern Hemisphere. Glob. Chang. Biol. 2006, 12, 343–351. [Google Scholar] [CrossRef]
- Zhang, X.; Friedl, M.; Schaaf, C. Global Vegetation Phenology from Moderate Resolution Imaging Spectroradiometer (MODIS): Evaluation of Global Patterns and Comparison with in Situ Measurements. J. Geophys. Res.-Biogeosci. 2006, 111. [Google Scholar] [CrossRef]
- Balzter, H.; Gerard, F.; Weedon, G.; Grey, W.; Los, S.; Combal, B.; Bartholome, E.; Bartalev, S. Climate, Vegetation Phenology and Forest Fires in Siberia; IEEE: Piscataway, NJ, USA, 2007; pp. 3843–3846. [Google Scholar]
- Bao, Y.; Gao, W.; Gao, Z.; Gao, W. Estimating Winter Wheat Biomass Based on LANDSAT TM and MODIS Data; Gao, W., Wang, H., Eds.; Remote Sensing and Modeling of Ecosystems for Sustainability V; SPIE: San Diego, CA, USA, 2008; Volume 7083. [Google Scholar]
- Brown, M.; de Beurs, K. Evaluation of Multi-Sensor Semi-Arid Crop Season Parameters Based on NDVI and Rainfall. Remote Sens. Environ. 2008, 112, 2261–2271. [Google Scholar] [CrossRef]
- Zhang, J.; Tong, X.; Zhang, J.; Meng, P.; Li, J.; Liu, P. Dynamics of Phenology and Its Response to Climatic Variables in a Warm-Temperate Mixed Plantation. For. Ecol. Manag. 2021, 483, 118785. [Google Scholar] [CrossRef]
- Younes, N.; Joyce, K.; Maier, S. All Models of Satellite-Derived Phenology Are Wrong, but Some Are Useful: A Case Study from Northern Australia. Int. J. Appl. Earth Obs. Geoinf. 2021, 97, 102285. [Google Scholar] [CrossRef]
- Yang, K.; Gong, Y.; Fang, S.; Duan, B.; Yuan, N.; Peng, Y.; Wu, X.; Zhu, R. Combining Spectral and Texture Features of UAV Images for the Remote Estimation of Rice LAI throughout the Entire Growing Season. Remote Sens. 2021, 13, 3001. [Google Scholar] [CrossRef]
- Wen, L.; Guo, M.; Yin, S.; Huang, S.; Li, X.; Yu, F. Vegetation Phenology in Permafrost Regions of Northeastern China Based on MODIS and Solar-Induced Chlorophyll Fluorescence. Chin. Geogr. Sci. 2021, 31, 459–473. [Google Scholar] [CrossRef]
- Tian, F.; Cai, Z.; Jin, H.; Hufkens, K.; Scheifinger, H.; Tagesson, T.; Smets, B.; Van Hoolst, R.; Bonte, K.; Ivits, E.; et al. Calibrating Vegetation Phenology from Sentinel-2 Using Eddy Covariance, PhenoCam, and PEP725 Networks across Europe. Remote Sens. Environ. 2021, 260, 112456. [Google Scholar] [CrossRef]
- Soudani, K.; Delpierre, N.; Berveiller, D.; Hmimina, G.; Vincent, G.; Morfin, A.; Dufrene, E. Potential of C-Band Synthetic Aperture Radar Sentinel-1 Time-Series for the Monitoring of Phenological Cycles in a Deciduous Forest. Int. J. Appl. Earth Obs. Geoinf. 2021, 104, 102505. [Google Scholar] [CrossRef]
- Smigaj, M.; Gaulton, R. Capturing Hedgerow Structure and Flowering Abundance with UAV Remote Sensing. Remote Sens. Ecol. Conserv. 2021, 7, 521–533. [Google Scholar] [CrossRef]
- Shen, Y.; Shen, G.; Zhai, H.; Yang, C.; Qi, K. A Gaussian Kernel-Based Spatiotemporal Fusion Model for Agricultural Remote Sensing Monitoring. IEEE J. Sel. Top. Appl. Earth Obs. Remote Sens. 2021, 14, 3533–3545. [Google Scholar] [CrossRef]
- Ruan, Y.; Zhang, X.; Xin, Q.; Sun, Y.; Ao, Z.; Jiang, X. A Method for Quality Management of Vegetation Phenophases Derived from Satellite Remote Sensing Data. Int. J. Remote Sens. 2021, 42, 5801–5820. [Google Scholar] [CrossRef]
- Pang, Y.; Huang, Y.; He, L.; Zhou, Y.; Sui, J.; Xu, J. Remote Sensing Phenology of Two Chinese Northern Sphagnum Bogs under Climate Drivers during 2001 and 2018. Ecol. Indic. 2021, 129, 107968. [Google Scholar] [CrossRef]
- Noumonvi, K.; Oblisar, G.; Zust, A.; Vilhar, U. Empirical Approach for Modelling Tree Phenology in Mixed Forests Using Remote Sensing. Remote Sens. 2021, 13, 3015. [Google Scholar] [CrossRef]
- Nandy, S.; Ghosh, S.; Singh, S. Assessment of Sal (Shorea Robusta) Forest Phenology and Its Response to Climatic Variables in India. Environ. Monit. Assess. 2021, 193, 1–14. [Google Scholar] [CrossRef]
- Mishra, B.; Busetto, L.; Boschetti, M.; Laborte, A.; Nelson, A. RICA: A Rice Crop Calendar for Asia Based on MODIS Multi Year Data. Int. J. Appl. Earth Obs. Geoinf. 2021, 103, 102471. [Google Scholar] [CrossRef]
- Marzialetti, F.; Frate, L.; De Simone, W.; Frattaroli, A.; Acosta, A.; Carranza, M. Unmanned Aerial Vehicle (UAV)-Based Mapping of Acacia Saligna Invasion in the Mediterranean Coast. Remote Sens. 2021, 13, 3361. [Google Scholar] [CrossRef]
- Lou, H.; Wu, X.; Ren, X.; Yang, S.; Cai, M.; Wang, P.; Guan, Y. Quantitative Assessment of the Influences of Snow Drought on Forest and Grass Growth in Mid-High Latitude Regions by Using Remote Sensing. Remote Sens. 2021, 13, 668. [Google Scholar] [CrossRef]
- Li, X.; Du, H.; Zhou, G.; Mao, F.; Zhang, M.; Han, N.; Fan, W.; Liu, H.; Huang, Z.; He, S.; et al. Phenology Estimation of Subtropical Bamboo Forests Based on Assimilated MODIS LAI Time Series Data. ISPRS J. Photogramm. Remote Sens. 2021, 173, 262–277. [Google Scholar] [CrossRef]
- Li, R.; Xu, M.; Chen, Z.; Gao, B.; Cai, J.; Shen, F.; He, X.; Zhuang, Y.; Chen, D. Phenology-Based Classification of Crop Species and Rotation Types Using Fused MODIS and Landsat Data: The Comparison of a Random-Forest-Based Model and a Decision-Rule-Based Model. Soil Tillage Res. 2021, 206, 104838. [Google Scholar] [CrossRef]
- Ibrahim, S.; Kaduk, J.; Tansey, K.; Balzter, H.; Lawal, U. Detecting Phenological Changes in Plant Functional Types over West African Savannah Dominated Landscape. Int. J. Remote Sens. 2021, 42, 567–594. [Google Scholar] [CrossRef]
- Huang, K.; Zhang, Y.; Tagesson, T.; Brandt, M.; Wang, L.; Chen, N.; Zu, J.; Jin, H.; Cai, Z.; Tong, X.; et al. The Confounding Effect of Snow Cover on Assessing Spring Phenology from Space: A New Look at Trends on the Tibetan Plateau. Sci. Total Environ. 2021, 756, 144011. [Google Scholar] [CrossRef] [PubMed]
- Hua, X.; Sirguey, P.; Ohlemüller, R. Recent Trends in the Timing of the Growing Season in New Zealand’s Natural and Semi-Natural Grasslands. GISci. Remote Sens. 2021, 58, 1090–1111. [Google Scholar] [CrossRef]
- He, W.; Ju, W.; Jiang, F.; Parazoo, N.; Gentine, P.; Wu, X.; Zhang, C.; Zhu, J.; Viovy, N.; Jain, A.; et al. Peak Growing Season Patterns and Climate Extremes-Driven Responses of Gross Primary Production Estimated by Satellite and Process Based Models over North America. Agric. For. Meteorol. 2021, 298, 108292. [Google Scholar] [CrossRef]
- Donnelly, A.; Yu, R.; Liu, L. Comparing in Situ Spring Phenology and Satellite-Derived Start of Season at Rural and Urban Sites in Ireland. Int. J. Remote Sens. 2021, 42, 7821–7841. [Google Scholar] [CrossRef]
- Cong, N.; Huang, K.; Zhang, Y. Unsynchronized Driving Mechanisms of Spring and Autumn Phenology Over Northern Hemisphere Grasslands. Front. For. Glob. Chang. 2021, 3, 144. [Google Scholar] [CrossRef]
- Chianucci, F.; Bajocco, S.; Ferrara, C. Continuous Observations of Forest Canopy Structure Using Low-Cost Digital Camera Traps. Agric. For. Meteorol. 2021, 307, 108516. [Google Scholar] [CrossRef]
- Ballesteros, R.; Moreno, M.; Barroso, F.; Gonzalez-Gomez, L.; Ortega, J. Assessment of Maize Growth and Development with High- and Medium-Resolution Remote Sensing Products. Agronomy 2021, 11, 940. [Google Scholar] [CrossRef]
- Azizan, F.; Astuti, I.; Aditya, M.; Febbiyanti, T.; Williams, A.; Young, A.; Aziz, A. Using Multi-Temporal Satellite Data to Analyse Phenological Responses of Rubber (Hevea Brasiliensis) to Climatic Variations in South Sumatra, Indonesia. Remote Sens. 2021, 13, 2932. [Google Scholar] [CrossRef]
- Akinyemi, F. Vegetation Trends, Drought Severity and Land Use-Land Cover Change during the Growing Season in Semi-Arid Contexts. Remote Sens. 2021, 13, 836. [Google Scholar] [CrossRef]
- Zheng, J.; Xu, X.; Jia, G.; Wu, W. Understanding the Spring Phenology of Arctic Tundra Using Multiple Satellite Data Products and Ground Observations. Sci. China-Earth Sci. 2020, 63, 1599–1612. [Google Scholar] [CrossRef]
- Zhang, Y.; Parazoo, N.; Williams, A.; Zhou, S.; Gentine, P. Large and Projected Strengthening Moisture Limitation on End-of-Season Photosynthesis. Proc. Natl. Acad. Sci. USA 2020, 117, 9216–9222. [Google Scholar] [CrossRef] [PubMed]
- Zhang, X.; Cui, Y.; Qin, Y.; Xia, H.; Lu, H.; Liu, S.; Li, N.; Fu, Y. Evaluating the Accuracy of and Evaluating the Potential Errors in Extracting Vegetation Phenology through Remote Sensing in China. Int. J. Remote Sens. 2020, 41, 3592–3613. [Google Scholar] [CrossRef]
- Zeng, L.; Wardlow, B.D.; Xiang, D.; Hu, S.; Li, D. A Review of Vegetation Phenological Metrics Extraction Using Time-Series, Multispectral Satellite Data. Remote Sens. Environ. 2020, 237, 111511. [Google Scholar] [CrossRef]
- Yu, M.; Gao, Q. Increasing Summer Rainfall and Asymmetrical Diurnal and Seasonal Warming Enhanced Vegetation Greenness in Temperate Deciduous Forests and Grasslands of Northern China. Remote Sens. 2020, 12, 2569. [Google Scholar] [CrossRef]
- Xu, X.; Zhou, G.; Du, H.; Mao, F.; Xu, L.; Li, X.; Liu, L. Combined MODIS Land Surface Temperature and Greenness Data for Modeling Vegetation Phenology, Physiology, and Gross Primary Production in Terrestrial Ecosystems. Sci. Total Environ. 2020, 726, 137948. [Google Scholar] [CrossRef]
- Xiao, Y.; Dong, Y.; Huang, W.; Liu, L.; Ma, H.; Ye, H.; Wang, K. Dynamic Remote Sensing Prediction for Wheat Fusarium Head Blight by Combining Host and Habitat Conditions. Remote Sens. 2020, 12, 3046. [Google Scholar] [CrossRef]
- Wang, X.; Dannenberg, M.; Yan, D.; Jones, M.; Kimball, J.; Moore, D.; van Leeuwen, W.; Didan, K.; Smith, W. Globally Consistent Patterns of Asynchrony in Vegetation Phenology Derived From Optical, Microwave, and Fluorescence Satellite Data. J. Geophys. Res.-Biogeosci. 2020, 125, e2020JG005732. [Google Scholar] [CrossRef]
- Wang, H.; Ghosh, A.; Linquist, B.; Hijmans, R. Satellite-Based Observations Reveal Effects of Weather Variation on Rice Phenology. Remote Sens. 2020, 12, 1522. [Google Scholar] [CrossRef]
- Tomaszewska, M.; Nguyen, L.; Henebry, G. Land Surface Phenology in the Highland Pastures of Montane Central Asia: Interactions with Snow Cover Seasonality and Terrain Characteristics. Remote Sens. Environ. 2020, 240, 111675. [Google Scholar] [CrossRef]
- Proietti, R.; Antonucci, S.; Monteverdi, M.; Garfi, V.; Marchetti, M.; Plutino, M.; Di Carlo, M.; Germani, A.; Santopuoli, G.; Castaldi, C.; et al. Monitoring Spring Phenology in Mediterranean Beech Populations through in Situ Observation and Synthetic Aperture Radar Methods. Remote Sens. Environ. 2020, 248, 111978. [Google Scholar] [CrossRef]
- Oerke, E.-C. Remote Sensing of Diseases. Annu. Rev. Phytopathol. 2020, 58, 225–252. [Google Scholar] [CrossRef] [PubMed]
- Morozumi, T.; Sugimoto, A.; Suzuki, R.; Nagai, S.; Kobayashi, H.; Tei, S.; Takano, S.; Shakhmatov, R.; Maximov, T. Photographic Records of Plant Phenology and Spring River Flush Timing in a River Lowland Ecosystem at the Taiga-Tundra Boundary, Northeastern Siberia. Ecol. Res. 2020, 35, 717–723. [Google Scholar] [CrossRef]
- Millard, K.; Kirby, P.; Nandlall, S.; Behnamian, A.; Banks, S.; Pacini, F. Using Growing-Season Time Series Coherence for Improved Peatland Mapping: Comparing the Contributions of Sentinel-1 and RADARSAT-2 Coherence in Full and Partial Time Series. Remote Sens. 2020, 12, 2465. [Google Scholar] [CrossRef]
- Maleki, M.; Arriga, N.; Barrios, J.; Wieneke, S.; Liu, Q.; Penuelas, J.; Janssens, I.; Balzarolo, M. Estimation of Gross Primary Productivity (GPP) Phenology of a Short-Rotation Plantation Using Remotely Sensed Indices Derived from Sentinel-2 Images. Remote Sens. 2020, 12, 2104. [Google Scholar] [CrossRef]
- Maldonado-Enriquez, D.; Ortega-Rubio, A.; Camara, A.; Diaz-Castro, S.; Sosa-Ramirez, J.; Martinez-Rincon, R. Trend and Variability of NDVI of the Main Vegetation Types in the Cape Region of Baja California Sur. Rev. Mex. Biodivers. 2020, 91. [Google Scholar] [CrossRef]
- Maimaitiyiming, M.; Sagan, V.; Sidike, P.; Maimaitijiang, M.; Miller, A.; Kwasniewski, M. Leveraging Very-High Spatial Resolution Hyperspectral and Thermal UAV Imageries for Characterizing Diurnal Indicators of Grapevine Physiology. Remote Sens. 2020, 12, 3216. [Google Scholar] [CrossRef]
- Lukes, P.; Neuwirthova, E.; Lhotakova, Z.; Janoutova, R.; Albrechtova, J. Upscaling Seasonal Phenological Course of Leaf Dorsiventral Reflectance in Radiative Transfer Model. Remote Sens. Environ. 2020, 246, 111862. [Google Scholar] [CrossRef]
- Li, P.; Zhu, Q.; Peng, C.; Zhang, J.; Wang, M.; Zhang, J.; Ding, J.; Zhou, X. Change in Autumn Vegetation Phenology and the Climate Controls From 1982 to 2012 on the Qinghai-Tibet Plateau. Front. Plant Sci. 2020, 10, 1677. [Google Scholar] [CrossRef] [Green Version]
- Li, N.; Zhan, P.; Pan, Y.; Zhu, X.; Li, M.; Zhang, D. Comparison of Remote Sensing Time-Series Smoothing Methods for Grassland Spring Phenology Extraction on the Qinghai-Tibetan Plateau. Remote Sens. 2020, 12, 3383. [Google Scholar] [CrossRef]
- Huang, X.; Zhu, W.; Wang, X.; Zhan, P.; Liu, Q.; Li, X.; Sun, L. A Method for Monitoring and Forecasting the Heading and Flowering Dates of Winter Wheat Combining Satellite-Derived Green-up Dates and Accumulated Temperature. Remote Sens. 2020, 12, 3536. [Google Scholar] [CrossRef]
- Furbank, R.T.; Tester, M. Phenomics—Technologies to Relieve the Phenotyping Bottleneck. Trends Plant Sci. 2011, 16, 635–644. [Google Scholar] [CrossRef] [PubMed]
- Li, L.; Zhang, Q.; Huang, D. A Review of Imaging Techniques for Plant Phenotyping. Sensors 2014, 14, 20078–20111. [Google Scholar] [CrossRef] [PubMed]
- Gitelson, A.A.; Keydan, G.P.; Merzlyak, M.N. Three-Band Model for Noninvasive Estimation of Chlorophyll, Carotenoids, and Anthocyanin Contents in Higher Plant Leaves. Geophys. Res. Lett. 2006, 33. [Google Scholar] [CrossRef] [Green Version]
- Lausch, A.; Pause, M.; Merbach, I.; Zacharias, S.; Doktor, D.; Volk, M.; Seppelt, R. A New Multiscale Approach for Monitoring Vegetation Using Remote Sensing-Based Indicators in Laboratory, Field, and Landscape. Environ. Monit. Assess. 2013, 185, 1215–1235. [Google Scholar] [CrossRef]
- Asner, G.P.; Martin, R.E. Spectranomics: Emerging Science and Conservation Opportunities at the Interface of Biodiversity and Remote Sensing. Glob. Ecol. Conserv. 2016, 8, 212–219. [Google Scholar] [CrossRef] [Green Version]
- Fu, Y.H.; Zhou, X.; Li, X.; Zhang, Y.; Geng, X.; Hao, F.; Zhang, X.; Hanninen, H.; Guo, Y.; De Boeck, H.J. Decreasing Control of Precipitation on Grassland Spring Phenology in Temperate China. Glob. Ecol. Biogeogr. 2021, 30, 490–499. [Google Scholar] [CrossRef]
- David, R.; Barcza, Z.; Kern, A.; Kristof, E.; Hollos, R.; Kis, A.; Lukac, M.; Fodor, N. Sensitivity of Spring Phenology Simulations to the Selection of Model Structure and Driving Meteorological Data. Atmosphere 2021, 12, 963. [Google Scholar] [CrossRef]
- Shi, M.; Parazoo, N.; Jeong, S.; Birch, L.; Lawrence, P.; Euskirchen, E.; Miller, C. Exposure to Cold Temperature Affects the Spring Phenology of Alaskan Deciduous Vegetation Types. Environ. Res. Lett. 2020, 15, 025006. [Google Scholar] [CrossRef]
- Gao, F.; Anderson, M.; Hively, W. Detecting Cover Crop End-Of-Season Using VEN Mu S and Sentinel-2 Satellite Imagery. Remote Sens. 2020, 12, 3524. [Google Scholar] [CrossRef]
- Gao, F.; Anderson, M.; Daughtry, C.; Karnieli, A.; Hively, D.; Kustas, W. A Within-Season Approach for Detecting Early Growth Stages in Corn and Soybean Using High Temporal and Spatial Resolution Imagery. Remote Sens. Environ. 2020, 242, 111752. [Google Scholar] [CrossRef]
- Descals, A.; Verger, A.; Filella, I.; Baldocchi, D.; Janssens, I.; Fu, Y.; Piao, S.; Peaucelle, M.; Ciais, P.; Penuelas, J. Soil Thawing Regulates the Spring Growth Onset in Tundra and Alpine Biomes. Sci. Total Environ. 2020, 742, 140637. [Google Scholar] [CrossRef] [PubMed]
- De Lemos, H.; Verstraete, M.; Scholes, M. Parametric Models to Characterize the Phenology of the Lowveld Savanna at Skukuza, South Africa. Remote Sens. 2020, 12, 3927. [Google Scholar] [CrossRef]
- Bandaru, V.; Yaramasu, R.; Koutilya, P.; He, J.; Fernando, S.; Sahajpal, R.; Wardlow, B.; Suyker, A.; Justice, C. PhenoCrop: An Integrated Satellite-Based Framework to Estimate Physiological Growth Stages of Corn and Soybeans. Int. J. Appl. Earth Obs. Geoinf. 2020, 92, 102188. [Google Scholar] [CrossRef]
- Zuo, L.; Liu, R.; Liu, Y.; Shang, R. Effect of Mathematical Expression of Vegetation Indices on the Estimation of Phenology Trends from Satellite Data. Chin. Geogr. Sci. 2019, 29, 756–767. [Google Scholar] [CrossRef] [Green Version]
- Xia, J.; Yi, G.; Zhang, T.; Zhou, X.; Miao, J.; Bie, X. Interannual Variation in the Start of Vegetation Growing Season and Its Response to Climate Change in the Qinghai-Tibet Plateau Derived from MODIS Data during 2001 to 2016. J. Appl. Remote Sens. 2019, 13, 048506. [Google Scholar] [CrossRef]
- Wang, J.; Wu, C.; Wang, X.; Zhang, X. A New Algorithm for the Estimation of Leaf Unfolding Date Using MODIS Data over China’s Terrestrial Ecosystems. ISPRS J. Photogramm. Remote Sens. 2019, 149, 77–90. [Google Scholar] [CrossRef]
- Stendardi, L.; Karlsen, S.; Niedrist, G.; Gerdol, R.; Zebisch, M.; Rossi, M.; Notarnicola, C. Exploiting Time Series of Sentinel-1 and Sentinel-2 Imagery to Detect Meadow Phenology in Mountain Regions. Remote Sens. 2019, 11, 542. [Google Scholar] [CrossRef] [Green Version]
- Seyednasrollah, B.; Young, A.M.; Hufkens, K.; Milliman, T.; Friedl, M.A.; Frolking, S.; Richardson, A.D. Tracking Vegetation Phenology across Diverse Biomes Using Version 2.0 of the PhenoCam Dataset. Sci. Data 2019, 6, 222. [Google Scholar] [CrossRef] [Green Version]
- Setiyono, T.; Quicho, E.; Holecz, F.; Khan, N.; Romuga, G.; Maunahan, A.; Garcia, C.; Rala, A.; Raviz, J.; Collivignarelli, F.; et al. Rice Yield Estimation Using Synthetic Aperture Radar (SAR) and the ORYZA Crop Growth Model: Development and Application of the System in South and South-East Asian Countries. Int. J. Remote Sens. 2019, 40, 8093–8124. [Google Scholar] [CrossRef]
- Sagan, V.; Maimaitijiang, M.; Sidike, P.; Maimaitiyiming, M.; Erkbol, H.; Hartling, S.; Peterson, K.T.; Peterson, J.; Burken, J.; Fritschi, F. UAV/satellite multiscale data fusion for crop monitoring and early stress detection. In Proceedings of the 4th ISPRS Geospatial Week 2019, Enschede, The Netherlands, 10–14 June 2019; Volume XLII-2-W13, pp. 715–722. [Google Scholar]
- Prey, L.; Schmidhalter, U. Simulation of Satellite Reflectance Data Using High-Frequency Ground Based Hyperspectral Canopy Measurements for in-Season Estimation of Grain Yield and Grain Nitrogen Status in Winter Wheat. ISPRS J. Photogramm. Remote Sens. 2019, 149, 176–187. [Google Scholar] [CrossRef]
- Pichon, L.; Leroux, C.; Macombe, C.; Taylor, J.; Tisseyre, B. What Relevant Information Can Be Identified by Experts on Unmanned Aerial Vehicles’ Visible Images for Precision Viticulture? Precis. Agric. 2019, 20, 278–294. [Google Scholar] [CrossRef]
- Mohapatra, J.; Singh, C.; Tripathi, O.; Pandya, H. Remote Sensing of Alpine Treeline Ecotone Dynamics and Phenology in Arunachal Pradesh Himalaya. Int. J. Remote Sens. 2019, 40, 7986–8009. [Google Scholar] [CrossRef]
- Mo, Y.; Chen, S.; Jin, J.; Lu, X.; Jiang, H. Temporal and Spatial Dynamics of Phenology along the North-South Transect of Northeast Asia. Int. J. Remote Sens. 2019, 40, 7922–7940. [Google Scholar] [CrossRef]
- Ma, X.; Huete, A.; Tran, N. Interaction of Seasonal Sun-Angle and Savanna Phenology Observed and Modelled Using MODIS. Remote Sens. 2019, 11, 1398. [Google Scholar] [CrossRef] [Green Version]
- Dong, T.; Shang, J.; Qian, B.; Liu, J.; Chen, J.; Jing, Q.; McConkey, B.; Huffman, T.; Daneshfar, B.; Champagne, C.; et al. Field-Scale Crop Seeding Date Estimation from MODIS Data and Growing Degree Days in Manitoba, Canada. Remote Sens. 2019, 11, 1760. [Google Scholar] [CrossRef] [Green Version]
- Devaux, N.; Crestey, T.; Leroux, C.; Tisseyre, B. Potential of Sentinel-2 Satellite Images to Monitor Vine Fields Grown at a Territorial Scale. Oeno One 2019, 53, 52–59. [Google Scholar] [CrossRef]
- Peltoniemi, M.; Aurela, M.; Bottcher, K.; Kolari, P.; Loehr, J.; Hokkanen, T.; Karhu, J.; Linkosalmi, M.; Tanis, C.; Metsamaki, S.; et al. Networked Web-Cameras Monitor Congruent Seasonal Development of Birches with Phenological Field Observations. Agric. For. Meteorol. 2018, 249, 335–347. [Google Scholar] [CrossRef] [Green Version]
- Lim, C.; An, J.; Jung, S.; Nam, G.; Cho, Y.; Kim, N.; Lee, C. Ecological Consideration for Several Methodologies to Diagnose Vegetation Phenology. Ecol. Res. 2018, 33, 363–377. [Google Scholar] [CrossRef]
- Klosterman, S.; Melaas, E.; Wang, J.A.; Martinez, A.; Frederick, S.; O’Keefe, J.; Orwig, D.A.; Wang, Z.; Sun, Q.; Schaaf, C.; et al. Fine-Scale Perspectives on Landscape Phenology from Unmanned Aerial Vehicle (UAV) Photography. Agric. For. Meteorol. 2018, 248, 397–407. [Google Scholar] [CrossRef]
- Guo, W.; Liu, H.; Wu, X. Vegetation Greening Despite Weakening Coupling Between Vegetation Growth and Temperature Over the Boreal Region. J. Geophys. Res.-Biogeosci. 2018, 123, 2376–2387. [Google Scholar] [CrossRef] [Green Version]
- Gallant, A.; Sadinski, W.; Brown, J.; Senay, G.; Roth, M. Challenges in Complementing Data from Ground-Based Sensors with Satellite-Derived Products to Measure Ecological Changes in Relation to Climate-Lessons from Temperate Wetland-Upland Landscapes. Sensors 2018, 18, 880. [Google Scholar] [CrossRef] [PubMed] [Green Version]
- Chang, Q.; Zhang, J.; Jiao, W.; Yao, F. A Comparative Analysis of the NDVIg and NDVI3g in Monitoring Vegetation Phenology Changes in the Northern Hemisphere. Geocarto Int. 2018, 33, 1–20. [Google Scholar] [CrossRef]
- Zheng, Z.; Zhu, W. Uncertainty of Remote Sensing Data in Monitoring Vegetation Phenology: A Comparison of MODIS C5 and C6 Vegetation Index Products on the Tibetan Plateau. Remote Sens. 2017, 9, 1288. [Google Scholar] [CrossRef] [Green Version]
- Yang, H.; Yang, X.; Zhang, Y.; Heskel, M.; Lu, X.; Munger, J.; Sun, S.; Tang, J. Chlorophyll Fluorescence Tracks Seasonal Variations of Photosynthesis from Leaf to Canopy in a Temperate Forest. Glob. Chang. Biol. 2017, 23, 2874–2886. [Google Scholar] [CrossRef]
- Xie, J.; Kneubuhler, M.; Garonna, I.; Notarnicola, C.; De Gregorio, L.; De Jong, R.; Chimani, B.; Schaepman, M. Altitude-Dependent Influence of Snow Cover on Alpine Land Surface Phenology. J. Geophys. Res.-Biogeosci. 2017, 122, 1107–1122. [Google Scholar] [CrossRef] [Green Version]
- Wang, X.; Xiao, J.; Li, X.; Cheng, G.; Ma, M.; Che, T.; Dai, L.; Wang, S.; Wu, J. No Consistent Evidence for Advancing or Delaying Trends in Spring Phenology on the Tibetan Plateau. J. Geophys. Res.-Biogeosci. 2017, 122, 3288–3305. [Google Scholar] [CrossRef]
- Wang, C.; Li, J.; Liu, Q.; Zhong, B.; Wu, S.; Xia, C. Analysis of Differences in Phenology Extracted from the Enhanced Vegetation Index and the Leaf Area Index. Sensors 2017, 17, 1982. [Google Scholar] [CrossRef] [Green Version]
- Vrieling, A.; Skidmore, A.K.; Wang, T.; Meroni, M.; Ens, B.J.; Oosterbeek, K.; O’Connor, B.; Darvishzadeh, R.; Heurich, M.; Shepherd, A.; et al. Spatially Detailed Retrievals of Spring Phenology from Single-Season High-Resolution Image Time Series. Int. J. Appl. Earth Obs. Geoinf. 2017, 59, 19–30. [Google Scholar] [CrossRef]
- Ulsig, L.; Nichol, C.; Huemmrich, K.; Landis, D.; Middleton, E.; Lyapustin, A.; Mammarella, I.; Levula, J.; Porcar-Castell, A. Detecting Inter-Annual Variations in the Phenology of Evergreen Conifers Using Long-Term MODIS Vegetation Index Time Series. Remote Sens. 2017, 9, 49. [Google Scholar] [CrossRef] [Green Version]
- Skakun, S.; Franch, B.; Vermote, E.; Roger, J.; Becker-Reshef, I.; Justice, C.; Kussul, N. Early Season Large-Area Winter Crop Mapping Using MODIS NDVI Data, Growing Degree Days Information and a Gaussian Mixture Model. Remote Sens. Environ. 2017, 195, 244–258. [Google Scholar] [CrossRef]
- Rankine, C.; Sanchez-Azofeifa, G.; Guzman, J.; Espirito-Santo, M.; Sharp, I. Comparing MODIS and Near-Surface Vegetation Indexes for Monitoring Tropical Dry Forest Phenology along a Successional Gradient Using Optical Phenology Towers. Environ. Res. Lett. 2017, 12, 105007. [Google Scholar] [CrossRef] [Green Version]
- Mullerova, J.; Bruna, J.; Bartalos, T.; Dvorak, P.; Vitkova, M.; Pysek, P. Timing Is Important: Unmanned Aircraft vs. Satellite Imagery in Plant Invasion Monitoring. Front. Plant Sci. 2017, 8, 887. [Google Scholar] [CrossRef] [PubMed] [Green Version]
- Maimaitijiang, M.; Ghulam, A.; Sidike, P.; Hartling, S.; Maimaitiyiming, M.; Peterson, K.; Shavers, E.; Fishman, J.; Peterson, J.; Kadam, S.; et al. Unmanned Aerial System (UAS)-Based Phenotyping of Soybean Using Multi-Sensor Data Fusion and Extreme Learning Machine. ISPRS J. Photogramm. Remote Sens. 2017, 134, 43–58. [Google Scholar] [CrossRef]
- Khwarahm, N.; Dash, J.; Skjoth, C.; Newnham, R.; Adams-Groom, B.; Head, K.; Caulton, E.; Atkinson, P. Mapping the Birch and Grass Pollen Seasons in the UK Using Satellite Sensor Time-Series. Sci. Total Environ. 2017, 578, 586–600. [Google Scholar] [CrossRef] [Green Version]
- Karkauskaite, P.; Tagesson, T.; Fensholt, R. Evaluation of the Plant Phenology Index (PPI), NDVI and EVI for Start-of-Season Trend Analysis of the Northern Hemisphere Boreal Zone. Remote Sens. 2017, 9, 485. [Google Scholar] [CrossRef] [Green Version]
- Donnelly, A.; Yu, R.; Caffarra, A.; Hanes, J.; Liang, L.; Desai, A.; Liu, L.; Schwartz, M. Interspecific and Interannual Variation in the Duration of Spring Phenophases in a Northern Mixed Forest. Agric. For. Meteorol. 2017, 243, 55–67. [Google Scholar] [CrossRef]
- Chen, X.; Chen, X. Spatial and Temporal Validation of Remote Sensing Phenology. In Spatiotemporal Processes of Plant Phenology: Simulation and Prediction; Springer: Berlin, Germany, 2017; pp. 67–80. ISBN 2211-4165. [Google Scholar]
- Browning, D.; Karl, J.; Morin, D.; Richardson, A.; Tweedie, C. Phenocams Bridge the Gap between Field and Satellite Observations in an Arid Grassland Ecosystem. Remote Sens. 2017, 9, 1071. [Google Scholar] [CrossRef] [Green Version]
- Brown, L.; Dash, J.; Ogutu, B.; Richardson, A. On the Relationship between Continuous Measures of Canopy Greenness Derived Using Near-Surface Remote Sensing and Satellite-Derived Vegetation Products. Agric. For. Meteorol. 2017, 247, 280–292. [Google Scholar] [CrossRef] [Green Version]
- Zheng, H.; Cheng, T.; Yao, X.; Deng, X.; Tian, Y.; Cao, W.; Zhu, Y. Detection of Rice Phenology through Time Series Analysis of Ground-Based Spectral Index Data. Field Crops Res. 2016, 198, 131–139. [Google Scholar] [CrossRef]
- Lelong, C.; Burger, P.; Jubelin, G.; Roux, B.; Labbe, S.; Baret, F. Assessment of Unmanned Aerial Vehicles Imagery for Quantitative Monitoring of Wheat Crop in Small Plots. Sensors 2008, 8, 3557–3585. [Google Scholar] [CrossRef] [PubMed]
- Dandois, J.; Ellis, E. High Spatial Resolution Three-Dimensional Mapping of Vegetation Spectral Dynamics Using Computer Vision. Remote Sens. Environ. 2013, 136, 259–276. [Google Scholar] [CrossRef] [Green Version]
- Colomina, I.; Molina, P. Unmanned Aerial Systems for Photogrammetry and Remote Sensing: A Review. ISPRS J. Photogramm. Remote Sens. 2014, 92, 79–97. [Google Scholar] [CrossRef] [Green Version]
- Van Iersel, W.; Straatsma, M.; Addink, E.; Middelkoop, H. Monitoring Phenology of Floodplain Grassland and Herbaceous Vegetation with Uav Imagery; Halounova, L., Sunar, F., Potuckova, M., Patkova, L., Yoshimura, M., Soergel, U., BenDor, E., Smit, J., Bareth, G., Zhang, J., et al., Eds.; ISPRS—International Archives of the Photogrammetry, Remote Sensing and Spatial Information Science: Prague, Czech Republic, 2016; Volume 41, pp. 569–571. [Google Scholar]
- Willkomm, M.; Bolten, A.; Bareth, G. Non-Destructive Monitoring of Rice by Hyperspectral In-Field Spectrometry and Uav-Based Remote Sensing: Case Study of Field Grown Rice in North Rhine-Westphalia, Germany. Halounova, L., Safar, V., Toth, C., Karas, J., Huadong, G., Haala, N., Habib, A., Reinartz, P., Tang, X., Li, J., et al., Eds.; SPRS—International Archives of the Photogrammetry, Remote Sensing and Spatial Information Science: Prague, Czech Republic, 2016; Volume 41, pp. 1071–1077. [Google Scholar]
- Lee, D.; Park, J.; Shin, K.; Park, J. Using the UAV-Derived NDVI to Evaluate Spatial and Temporal Variation of Crop Phenology at Crop Growing Season in South Korea; Land Surface and Cryosphere Remote Sensing IV; Goldberg, M., Chen, J., Khanbilvardi, R., Eds.; SPIE: Honolulu, HI, USA, 2018; Volume 10777. [Google Scholar]
- Ziliani, M.; Parkes, S.; Hoteit, I.; McCabe, M. Intra-Season Crop Height Variability at Commercial Farm Scales Using a Fixed-Wing UAV. Remote Sens. 2018, 10, 2007. [Google Scholar] [CrossRef] [Green Version]
- Gruner, E.; Astor, T.; Wachendorf, M. Biomass Prediction of Heterogeneous Temperate Grasslands Using an SfM Approach Based on UAV Imaging. Agronomy 2019, 9, 54. [Google Scholar] [CrossRef] [Green Version]
- Olson, D.; Chatterjee, A.; Franzen, D. Can We Select Sugarbeet Harvesting Dates Using Drone-Based Vegetation Indices? Agron. J. 2019, 111, 2619–2624. [Google Scholar] [CrossRef]
- Sagan, V.; Maimaitijiang, M.; Sidike, P.; Eblimit, K.; Peterson, K.T.; Hartling, S.; Esposito, F.; Khanal, K.; Newcomb, M.; Pauli, D.; et al. UAV-Based High Resolution Thermal Imaging for Vegetation Monitoring, and Plant Phenotyping Using ICI 8640 P, FLIR Vue Pro R 640, and ThermoMap Cameras. Remote Sens. 2019, 11, 330. [Google Scholar] [CrossRef] [Green Version]
- Atkins, J.; Stovall, A.; Yang, X. Mapping Temperate Forest Phenology Using Tower, UAV, and Ground-Based Sensors. Drones 2020, 4, 56. [Google Scholar] [CrossRef]
- Yang, Q.; Shi, L.; Han, J.; Yu, J.; Huang, K. A near Real-Time Deep Learning Approach for Detecting Rice Phenology Based on UAV Images. Agric. For. Meteorol. 2020, 287, 107938. [Google Scholar] [CrossRef]
- Zhou, M.; Ma, X.; Wang, K.; Cheng, T.; Tian, Y.; Wang, J.; Zhu, Y.; Hu, Y.; Niu, Q.; Gui, L.; et al. Detection of Phenology Using an Improved Shape Model on Time-Series Vegetation Index in Wheat. Comput. Electron. Agric. 2020, 173, 105398. [Google Scholar] [CrossRef]
- Granzig, T.; Fassnacht, F.; Kleinschmit, B.; Forster, M. Mapping the Fractional Coverage of the Invasive Shrub Ulex Europaeus with Multi-Temporal Sentinel-2 Imagery Utilizing UAV Orthoimages and a New Spatial Optimization Approach. Int. J. Appl. Earth Obs. Geoinf. 2021, 96, 102281. [Google Scholar] [CrossRef]
- Soudani, K.; Hmimina, G.; Delpierre, N.; Pontailler, J.; Aubinet, M.; Bonal, D.; Caquet, B.; de Grandcourt, A.; Burban, B.; Flechard, C.; et al. Ground-Based Network of NDVI Measurements for Tracking Temporal Dynamics of Canopy Structure and Vegetation Phenology in Different Biomes. Remote Sens. Environ. 2012, 123, 234–245. [Google Scholar] [CrossRef]
- Menzel, A. Trends in Phenological Phases in Europe between 1951 and 1996. Int. J. Biometeorol. 2000, 44, 76–81. [Google Scholar] [CrossRef] [PubMed]
- Lucht, W.; Prentice, I.; Myneni, R.; Sitch, S.; Friedlingstein, P.; Cramer, W.; Bousquet, P.; Buermann, W.; Smith, B. Climatic Control of the High-Latitude Vegetation Greening Trend and Pinatubo Effect. Science 2002, 296, 1687–1689. [Google Scholar] [CrossRef] [PubMed] [Green Version]
- Yu, X.; Zhuang, D.; Chen, S.; Hou, X.; Chen, H. Vegetation Phenology from Multi-Temporal EOS MODIS Data; VonderHaar, T., Huang, H., Eds.; SPIE: Denver, CO, USA, 2004; Volume 5549, pp. 185–193. [Google Scholar]
- Euskirchen, E.S.; McGUIRE, A.D.; Kicklighter, D.W.; Zhuang, Q.; Clein, J.S.; Dargaville, R.J.; Dye, D.G.; Kimball, J.S.; McDONALD, K.C.; Melillo, J.M.; et al. Importance of Recent Shifts in Soil Thermal Dynamics on Growing Season Length, Productivity, and Carbon Sequestration in Terrestrial High-Latitude Ecosystems. Glob. Chang. Biol. 2006, 12, 731–750. [Google Scholar] [CrossRef] [Green Version]
- Hunt, E.; Williams, A. Detection of Flowering Leafy Spurge with Satellite Multispectral Imagery. Rangel. Ecol. Manag. 2006, 59, 494–499. [Google Scholar] [CrossRef]
- Reed, B.C. Trend Analysis of Time-Series Phenology of North America Derived from Satellite Data. GISci. Remote Sens. 2006, 43, 24–38. [Google Scholar] [CrossRef]
- Bradley, B.; Mustard, J. Comparison of Phenology Trends by Land Cover Class: A Case Study in the Great Basin, USA. Glob. Chang. Biol. 2008, 14, 334–346. [Google Scholar] [CrossRef] [Green Version]
- Gilmore, M.; Wilson, E.; Barrett, N.; Civco, D.; Prisloe, S.; Hurd, J.; Chadwick, C. Integrating Multi-Temporal Spectral and Structural Information to Map Wetland Vegetation in a Lower Connecticut River Tidal Marsh. Remote Sens. Environ. 2008, 112, 4048–4060. [Google Scholar] [CrossRef]
- Islam, A.; Bala, S. Assessment of Potato Phenological Characteristics Using MODIS-Derived NDVI and LAI Information. GISci.Remote Sens. 2008, 45, 454–470. [Google Scholar] [CrossRef]
- Stockli, R.; Rutishauser, T.; Dragoni, D.; O’Keefe, J.; Thornton, P.; Jolly, M.; Lu, L.; Denning, A. Remote Sensing Data Assimilation for a Prognostic Phenology Model. J. Geophys. Res.-Biogeosci. 2008, 113. [Google Scholar] [CrossRef]
- Vrieling, A.; de Beurs, K.; Brown, M.; Neale, C. Recent Trends in Agricultural Production of Africa Based on AVHRR NDVI Time Series; Neale, C., Owe, M., DUrso, G., Eds.; SPIE: Cardiff, UK, 2008; Volume 7104. [Google Scholar]
- Boschetti, M.; Stroppiana, D.; Brivio, P.; Bocchi, S. Multi-Year Monitoring of Rice Crop Phenology through Time Series Analysis of MODIS Images. Int. J. Remote Sens. 2009, 30, 4643–4662. [Google Scholar] [CrossRef]
- Doktor, D.; Bondeau, A.; Koslowski, D.; Badeck, F. Influence of Heterogeneous Landscapes on Computed Green-up Dates Based on Daily AVHRR NDVI Observations. Remote Sens. Environ. 2009, 113, 2618–2632. [Google Scholar] [CrossRef]
- Karlsen, S.; Ramfjord, H.; Hogda, K.; Johansen, B.; Danks, F.; Brobakk, T. A Satellite-Based Map of Onset of Birch (Betula) Flowering in Norway. Aerobiologia 2009, 25, 15–25. [Google Scholar] [CrossRef]
- Wright, C.; de Beurs, K.; Akhmadieva, Z.; Groisman, P.; Henebry, G. Reanalysis Data Underestimate Significant Changes in Growing Season Weather in Kazakhstan. Environ. Res. Lett. 2009, 4, 045020. [Google Scholar] [CrossRef]
- Busetto, L.; Colombo, R.; Migliavacca, M.; Cremonese, E.; Meroni, M.; Galvagno, M.; Rossini, M.; Siniscalco, C.; Di Cella, U.; Pari, E. Remote Sensing of Larch Phenological Cycle and Analysis of Relationships with Climate in the Alpine Region. Glob. Chang. Biol. 2010, 16, 2504–2517. [Google Scholar] [CrossRef]
- Dash, J.; Jeganathan, C.; Atkinson, P. The Use of MERIS Terrestrial Chlorophyll Index to Study Spatio-Temporal Variation in Vegetation Phenology over India. Remote Sens. Environ. 2010, 114, 1388–1402. [Google Scholar] [CrossRef]
- Donald, G.; Gherardi, S.; Edirisinghe, A.; Gittins, S.; Henry, D.; Mata, G. Using MODIS Imagery, Climate and Soil Data to Estimate Pasture Growth Rates on Farms in the South-West of Western Australia. Anim. Prod. Sci. 2010, 50, 611–615. [Google Scholar] [CrossRef]
- Jonsson, A.; Eklundh, L.; Hellstrom, M.; Barring, L.; Jonsson, P. Annual Changes in MODIS Vegetation Indices of Swedish Coniferous Forests in Relation to Snow Dynamics and Tree Phenology. Remote Sens. Environ. 2010, 114, 2719–2730. [Google Scholar] [CrossRef]
- Tadesse, T.; Wardlow, B.; Hayes, M.; Svoboda, M.; Brown, J. The Vegetation Outlook (VegOut): A New Method for Predicting Vegetation Seasonal Greenness. GISci Remote Sens. 2010, 47, 25–52. [Google Scholar] [CrossRef] [Green Version]
- Dhami, I.; Arano, K.; Warner, T.; Gazal, R.; Joshi, S. Phenology of Trees and Urbanization: A Comparative Study between New York City and Ithaca, New York. Geocarto Int. 2011, 26, 507–526. [Google Scholar] [CrossRef]
- Dunn, A.; de Beurs, K. Land Surface Phenology of North American Mountain Environments Using Moderate Resolution Imaging Spectroradiometer Data. Remote Sens. Environ. 2011, 115, 1220–1233. [Google Scholar] [CrossRef]
- Guyon, D.; Guillot, M.; Vitasse, Y.; Cardot, H.; Hagolle, O.; Delzon, S.; Wigneron, J. Monitoring Elevation Variations in Leaf Phenology of Deciduous Broadleaf Forests from SPOT/VEGETATION Time-Series. Remote Sens. Environ. 2011, 115, 615–627. [Google Scholar] [CrossRef]
- Jeong, S.-J.; Ho, C.-H.; Gim, H.-J.; Brown, M.E. Phenology Shifts at Start vs. End of Growing Season in Temperate Vegetation over the Northern Hemisphere for the Period 1982–2008. Glob. Chang. Biol. 2011, 17, 2385–2399. [Google Scholar] [CrossRef]
- Kross, A.; Fernandes, R.; Seaquist, J.; Beaubien, E. The Effect of the Temporal Resolution of NDVI Data on Season Onset Dates and Trends across Canadian Broadleaf Forests. Remote Sens. Environ. 2011, 115, 1564–1575. [Google Scholar] [CrossRef]
- Wenwen, C.; Jinling, S.; Jindi, W.; Zhiqiang, X. High Spatial-and Temporal-Resolution NDVI Produced by the Assimilation of MODIS and HJ-1 Data. Can. J. Remote Sens. 2011, 37, 612-327. [Google Scholar] [CrossRef]
- Brandysova, V.; Bucha, T. Effect of understory vegetation and undergrowth on course of phenological curve of beech forests derived from MODIS. Cent. Eur. For. J. 2012, 58, 231–242. [Google Scholar]
- Dragoni, D.; Rahman, A. Trends in Fall Phenology across the Deciduous Forests of the Eastern USA. Agric. For. Meteorol. 2012, 157, 96–105. [Google Scholar] [CrossRef]
- Fraser, R.; Olthof, I.; Carriere, M.; Deschamps, A.; Pouliot, D. A Method for Trend-Based Change Analysis in Arctic Tundra Using the 25-Year Landsat Archive. Polar Rec. 2012, 48, 83–93. [Google Scholar] [CrossRef]
- Gonsamo, A.; Chen, J.; Price, D.; Kurz, W.; Wu, C. Land Surface Phenology from Optical Satellite Measurement and CO2 Eddy Covariance Technique. J. Geophys. Res.-Biogeosci. 2012, 117. [Google Scholar] [CrossRef]
- Jones, M.; Kimball, J.; Jones, L.; McDonald, K. Satellite Passive Microwave Detection of North America Start of Season. Remote Sens. Environ. 2012, 123, 324–333. [Google Scholar] [CrossRef]
- O’Connor, B.; Dwyer, E.; Cawkwell, F.; Eklundh, L. Spatio-Temporal Patterns in Vegetation Start of Season across the Island of Ireland Using the MERIS Global Vegetation Index. ISPRS J. Photogramm. Remote Sens. 2012, 68, 79–94. [Google Scholar] [CrossRef]
- Bargiel, D. Capabilities of High Resolution Satellite Radar for the Detection of Semi-Natural Habitat Structures and Grasslands in Agricultural Landscapes. Ecol. Inform. 2013, 13, 9–16. [Google Scholar] [CrossRef]
- Chapman, D. Greater Phenological Sensitivity to Temperature on Higher Scottish Mountains: New Insights from Remote Sensing. Glob. Chang. Biol. 2013, 19, 3463–3471. [Google Scholar] [CrossRef] [Green Version]
- Ivits, E.; Cherlet, M.; Mehl, W.; Sommer, S. Ecosystem Functional Units Characterized by Satellite Observed Phenology and Productivity Gradients: A Case Study for Europe. Ecol. Indic. 2013, 27, 17–28. [Google Scholar] [CrossRef]
- Luo, X.; Chen, X.; Xu, L.; Myneni, R.; Zhu, Z. Assessing Performance of NDVI and NDVI3g in Monitoring Leaf Unfolding Dates of the Deciduous Broadleaf Forest in Northern China. Remote Sens. 2013, 5, 845–861. [Google Scholar] [CrossRef] [Green Version]
- You, X.; Meng, J.; Zhang, M.; Dong, T. Remote Sensing Based Detection of Crop Phenology for Agricultural Zones in China Using a New Threshold Method. Remote Sens. 2013, 5, 3190–3211. [Google Scholar] [CrossRef] [Green Version]
- Zillmann, E.; Weichelt, H.; Herrero, E.; Esch, T.; Keil, M.; van Wolvelaer, J. Mapping of Grassland Using Seasonal Statistics Derived from Multi-Temporal Satellite Images; IEEE: Piscataway, NJ, USA, 2013. [Google Scholar]
- Brandao, Z.; Grego, C.; Inamasu, R.; Jorge, L. Spectral Reflectance of Satellite Images Using Geostatistics Methods to Estimate Growth and Cotton Yield; Neale, C., Maltese, A., Eds.; Cambridge University Press: Cambridge, UK, 2014; Volume 9239. [Google Scholar]
- Chen, W.; Foy, N.; Olthof, I.; Zhang, Y.; Fraser, R.; Latifovic, R.; Poitevin, J.; Zorn, P.; McLennan, D. A Biophysically Based and Objective Satellite Seasonality Observation Method for Applications over the Arctic. Int. J. Remote Sens. 2014, 35, 6742–6763. [Google Scholar] [CrossRef]
- Duarte, L.; Teodoro, A.; Goncalves, H. Deriving Phenological Metrics from NDVI through an Open Source Tool Developed in QGIS; Michel, U., Schulz, K., Ehlers, M., Nikolakopoulos, K., Civco, D., Eds.; SPIE: Amsterdam, The Netherlands, 2014; Volume 9245. [Google Scholar]
- Fraga, H.; Amraoui, M.; Malheiro, A.; Moutinho-Pereira, J.; Eiras-Dias, J.; Silvestre, J.; Santos, J. Examining the Relationship between the Enhanced Vegetation Index and Grapevine Phenology. Eur. J. Remote Sens. 2014, 47, 753–771. [Google Scholar] [CrossRef]
- Fu, Y.; Piao, S.; Op de Beeck, M.; Cong, N.; Zhao, H.; Zhang, Y.; Menzel, A.; Janssens, I. Recent Spring Phenology Shifts in Western Central Europe Based on Multiscale Observations. Glob. Ecol. Biogeogr. 2014, 23, 1255–1263. [Google Scholar] [CrossRef]
- Garonna, I.; de Jong, R.; de Wit, A.J.W.; Mücher, C.A.; Schmid, B.; Schaepman, M.E. Strong Contribution of Autumn Phenology to Changes in Satellite-Derived Growing Season Length Estimates across Europe (1982–2011). Glob. Chang. Biol. 2014, 20, 3457–3470. [Google Scholar] [CrossRef] [PubMed]
- Jeganathan, C.; Dash, J.; Atkinson, P. Remotely Sensed Trends in the Phenology of Northern High Latitude Terrestrial Vegetation, Controlling for Land Cover Change and Vegetation Type. Remote Sens. Environ. 2014, 143, 154–170. [Google Scholar] [CrossRef]
- Jia, K.; Liang, S.; Wei, X.; Yao, Y.; Su, Y.; Jiang, B.; Wang, X. Land Cover Classification of Landsat Data with Phenological Features Extracted from Time Series MODIS NDVI Data. Remote Sens. 2014, 6, 11518–11532. [Google Scholar] [CrossRef] [Green Version]
- Karlsen, S.; Elvebakk, A.; Hogda, K.; Grydeland, T. Spatial and Temporal Variability in the Onset of the Growing Season on Svalbard, Arctic Norway—Measured by MODIS-NDVI Satellite Data. Remote Sens. 2014, 6, 8088–8106. [Google Scholar] [CrossRef] [Green Version]
- Kaushalya, R.; Gayatri, M.; Praveen, V.; Satish, J. Use of NDVI Variations to Analyse the Length of Growing Period in Andhra Pradesh. J. Agrometeorol. 2014, 16, 112–115. [Google Scholar]
- Kim, Y.; Kimball, J.; Didan, K.; Henebry, G. Response of Vegetation Growth and Productivity to Spring Climate Indicators in the Conterminous United States Derived from Satellite Remote Sensing Data Fusion. Agric. For. Meteorol. 2014, 194, 132–143. [Google Scholar] [CrossRef]
- Kim, Y.; Kimball, J.; Zhang, K.; Didan, K.; Velicogna, I.; McDonald, K. Attribution of Divergent Northern Vegetation Growth Responses to Lengthening Non-Frozen Seasons Using Satellite Optical-NIR and Microwave Remote Sensing. Int. J. Remote Sens. 2014, 35, 3700–3721. [Google Scholar] [CrossRef] [Green Version]
- Klisch, A.; Atzberger, C. Evaluating Phenological Metrics Derived from the MODIS Time Series over the European Continent. Photogramm. Fernerkund. Geoinf. 2014, 5, 409–421. [Google Scholar] [CrossRef]
- Li, F.; Chen, W.; Zeng, Y.; Zhao, Q.; Wu, B. Improving Estimates of Grassland Fractional Vegetation Cover Based on a Pixel Dichotomy Model: A Case Study in Inner Mongolia, China. Remote Sens. 2014, 6, 4705–4722. [Google Scholar] [CrossRef] [Green Version]
- Li, Z.; Xu, D.; Guo, X. Remote Sensing of Ecosystem Health: Opportunities, Challenges, and Future Perspectives. Sensors 2014, 14, 21117–21139. [Google Scholar] [CrossRef] [Green Version]
- Lin, X.; Hubbard, K.; Mahmood, R.; Sassenrath, G. Assessing Satellite-Based Start-of-Season Trends in the US High Plains. Environ. Res. Lett. 2014, 9, 104016. [Google Scholar] [CrossRef] [Green Version]
- Lukasova, V.; Lang, M.; Skvarenina, J. Seasonal Changes in NDVI in Relation to Phenological Phases, LAI and PAI of Beech Forests. Balt. For. 2014, 20, 248–262. [Google Scholar]
- Meroni, M.; Rembold, F.; Verstraete, M.; Gommes, R.; Schucknecht, A.; Beye, G. Investigating the Relationship between the Inter-Annual Variability of Satellite-Derived Vegetation Phenology and a Proxy of Biomass Production in the Sahel. Remote Sens. 2014, 6, 5868–5884. [Google Scholar] [CrossRef] [Green Version]
- Zillmann, E.; Gonzalez, A.; Herrero, E.; van Wolvelaer, J.; Esch, T.; Keil, M.; Weichelt, H.; Garzon, A. Pan-European Grassland Mapping Using Seasonal Statistics From Multisensor Image Time Series. IEEE J. Sel. Top. Appl. Earth Obs. Remote Sens. 2014, 7, 3461–3472. [Google Scholar] [CrossRef]
- Badr, G.; Hoogenboom, G.; Davenport, J.; Smithyman, J. Estimating Growing Season Length Using Vegetation Indices Based on Remote Sensing: A Case Study for Vineyards in Washington State. Trans. Asabe 2015, 58, 551–564. [Google Scholar] [CrossRef]
- Choler, P. Growth Response of Temperate Mountain Grasslands to Inter-Annual Variations in Snow Cover Duration. Biogeosciences 2015, 12, 3885–3897. [Google Scholar] [CrossRef] [Green Version]
- Keenan, T.; Richardson, A. The Timing of Autumn Senescence Is Affected by the Timing of Spring Phenology: Implications for Predictive Models. Glob. Chang. Biol. 2015, 21, 2634–2641. [Google Scholar] [CrossRef] [Green Version]
- Liu, L.; Liang, L.; Schwartz, M.; Donnelly, A.; Wang, Z.; Schaaf, C.; Liu, L. Evaluating the Potential of MODIS Satellite Data to Track Temporal Dynamics of Autumn Phenology in a Temperate Mixed Forest. Remote Sens. Environ. 2015, 160, 156–165. [Google Scholar] [CrossRef]
- Pazhanivelan, S.; Kannan, P.; Mary, P.; Subramanian, E.; Jeyaraman, S.; Nelson, A.; Setiyono, T.; Holecz, F.; Barbieri, M.; Yadav, M. Rice Crop Monitoring and Yield Estimation through Cosmo Skymed and Terrasar-X: A Sar-Based Experience in India, Proceedings of the 36th International Symposium on Remote Sensing on Environment, Berlin, Germany, 11–15 May 2015; Schreier, G., Skrovseth, P., Staudenrausch, H., Eds.; Volume 47, pp. 85–98.
- Tang, H.; Li, Z.; Zhu, Z.; Chen, B.; Zhang, B.; Xin, X. Variability and Climate Change Trend in Vegetation Phenology of Recent Decades in the Greater Khingan Mountain Area, Northeastern China. Remote Sens. 2015, 7, 11914–11932. [Google Scholar] [CrossRef] [Green Version]
- Whitcraft, A.K.; Vermote, E.F.; Becker-Reshef, I.; Justice, C.O. Cloud Cover throughout the Agricultural Growing Season: Impacts on Passive Optical Earth Observations. Remote Sens. Environ. 2015, 156, 438–447. [Google Scholar] [CrossRef]
- Zhu, L.; Meng, J. Determining the Relative Importance of Climatic Drivers on Spring Phenology in Grassland Ecosystems of Semi-Arid Areas. Int. J. Biometeorol. 2015, 59, 237–248. [Google Scholar] [CrossRef] [PubMed]
- Araya, S.; Lyle, G.; Lewis, M.; Ostendorf, B. Phenologic Metrics Derived from MODIS NDVI as Indicators for Plant Available Water-Holding Capacity. Ecol. Indic. 2016, 60, 1263–1272. [Google Scholar] [CrossRef]
- Bottcher, K.; Markkanen, T.; Thum, T.; Aalto, T.; Aurela, M.; Reick, C.; Kolari, P.; Arslan, A.; Pulliainen, J. Evaluating Biosphere Model Estimates of the Start of the Vegetation Active Season in Boreal Forests by Satellite Observations. Remote Sens. 2016, 8, 580. [Google Scholar] [CrossRef] [Green Version]
- Chen, J.; Rao, Y.; Shen, M.; Wang, C.; Zhou, Y.; Ma, L.; Tang, Y.; Yang, X. A Simple Method for Detecting Phenological Change From Time Series of Vegetation Index. IEEE Trans. Geosci. Remote Sens. 2016, 54, 3436–3449. [Google Scholar] [CrossRef]
- Diouf, A.; Hiernaux, P.; Brandt, M.; Faye, G.; Djaby, B.; Diop, M.; Ndione, J.; Tychon, B. Do Agrometeorological Data Improve Optical Satellite-Based Estimations of the Herbaceous Yield in Sahelian Semi-Arid Ecosystems? Remote Sens. 2016, 8, 668. [Google Scholar] [CrossRef] [Green Version]
- Ffrench-Constant, R.; Somers-Yeates, R.; Bennie, J.; Economou, T.; Hodgson, D.; Spalding, A.; McGregor, P. Light Pollution Is Associated with Earlier Tree Budburst across the United Kingdom. Proc. R. Soc. B-Biol. Sci. 2016, 283, 20160813. [Google Scholar] [CrossRef]
- Kang, X.; Hao, Y.; Cui, X.; Chen, H.; Huang, S.; Du, Y.; Li, W.; Kardol, P.; Xiao, X.; Cui, L. Variability and Changes in Climate, Phenology, and Gross Primary Production of an Alpine Wetland Ecosystem. Remote Sens. 2016, 8, 391. [Google Scholar] [CrossRef] [Green Version]
- Langford, Z.; Kumar, J.; Hoffman, F.; Norby, R.; Wullschleger, S.; Sloan, V.; Iversen, C. Mapping Arctic Plant Functional Type Distributions in the Barrow Environmental Observatory Using WorldView-2 and LiDAR Datasets. Remote Sens. 2016, 8, 733. [Google Scholar] [CrossRef] [Green Version]
- Melaas, E.; Sulla-Menashe, D.; Gray, J.; Black, T.; Morin, T.; Richardson, A.; Friedl, M. Multisite Analysis of Land Surface Phenology in North American Temperate and Boreal Deciduous Forests from Landsat. Remote Sens. Environ. 2016, 186, 452–464. [Google Scholar] [CrossRef]
- Misra, G.; Buras, A.; Menzel, A. Effects of Different Methods on the Comparison between Land Surface and Ground PhenologyA Methodological Case Study from South-Western Germany. Remote Sens. 2016, 8, 753. [Google Scholar] [CrossRef] [Green Version]
- Pacheco, A.; McNairn, H.; Li, Y.; Lampropoulos, G.; Powers, J. Using RADARSAT-2 and TerraSAR-X Satellite Data for the Identification of Canola Crop Phenology; Neale, C., Maltese, A., Eds.; SPIE: Edinburgh, UK, 2016; Volume 9998. [Google Scholar]
- Antonucci, S.; Rossi, S.; Deslauriers, A.; Morin, H.; Lombardi, F.; Marchetti, M.; Tognetti, R. Large-Scale Estimation of Xylem Phenology in Black Spruce through Remote Sensing. Agric. For. Meteorol. 2017, 233, 92–100. [Google Scholar] [CrossRef]
- Ho, C.-H.; Lee, E.-J.; Lee, I.; Jeong, S.-J. Earlier Spring in Seoul, Korea. Int. J. Climatol. 2006, 26, 2117–2127. [Google Scholar] [CrossRef]
- Tassopoulos, D.; Kalivas, D.; Giovos, R.; Lougkos, N.; Priovolou, A. Sentinel-2 Imagery Monitoring Vine Growth Related to Topography in a Protected Designation of Origin Region. Agriculture 2021, 11, 785. [Google Scholar] [CrossRef]
- Kelsey, K.; Pedersen, S.; Leffler, A.; Sexton, J.; Feng, M.; Welker, J. Winter Snow and Spring Temperature Have Differential Effects on Vegetation Phenology and Productivity across Arctic Plant Communities. Glob. Chang. Biol. 2021, 27, 1572–1586. [Google Scholar] [CrossRef]
- White, M.; de Beurs, K.; Didan, K.; Inouye, D.; Richardson, A.; Jensen, O.; O’Keefe, J.; Zhang, G.; Nemani, R.; van Leeuwen, W.; et al. Intercomparison, Interpretation, and Assessment of Spring Phenology in North America Estimated from Remote Sensing for 1982-2006. Glob. Chang. Biol. 2009, 15, 2335–2359. [Google Scholar] [CrossRef]
- Lloyd, D. A Phenological Classification of Terrestrial Vegetation Cover Using Shortwave Vegetation Index Imagery. Int. J. Remote Sens. 1990, 11, 2269–2279. [Google Scholar] [CrossRef]
- White, M.A.; Thornton, P.E.; Running, S.W. A Continental Phenology Model for Monitoring Vegetation Responses to Interannual Climatic Variability. Glob. Biogeochem. Cycles 1997, 11, 217–234. [Google Scholar] [CrossRef]
- Moulin, S.; Kergoat, L.; Viovy, N.; Dedieu, G. Global-Scale Assessment of Vegetation Phenology Using NOAA/AVHRR Satellite Measurements. J. Clim. 1997, 10, 1154–1170. [Google Scholar] [CrossRef]
- Zhang, X.; Friedl, M.A.; Schaaf, C.B.; Strahler, A.H.; Hodges, J.C.F.; Gao, F.; Reed, B.C.; Huete, A. Monitoring Vegetation Phenology Using MODIS. Remote Sens. Environ. 2003, 84, 471–475. [Google Scholar] [CrossRef]
- White, M.A.; Running, S.W.; Thornton, P.E. The Impact of Growing-Season Length Variability on Carbon Assimilation and Evapotranspiration over 88 Years in the Eastern US Deciduous Forest. Int. J. Biometeorol. 1999, 42, 139–145. [Google Scholar] [CrossRef]
- Jakubauskas, M.E.; Legates, D.R.; Kastens, J.H. Crop Identification Using Harmonic Analysis of Time-Series AVHRR NDVI Data. Comput. Electron. Agric. 2002, 37, 127–139. [Google Scholar] [CrossRef]
- Chen, X.; Hu, B.; Yu, R. Spatial and Temporal Variation of Phenological Growing Season and Climate Change Impacts in Temperate Eastern China. Glob. Chang. Biol. 2005, 11, 1118–1130. [Google Scholar] [CrossRef]
- Balzter, H.; Gerard, F.; George, C.; Weedon, G.; Grey, W.; Combal, B.; Bartholome, E.; Bartalev, S.; Los, S. Coupling of Vegetation Growing Season Anomalies and Fire Activity with Hemispheric and Regional-Scale Climate Patterns in Central and East Siberia. J. Clim. 2007, 20, 3713–3729. [Google Scholar] [CrossRef] [Green Version]
- Brown, M.; de Beurs, K.; Vrieling, A. The Response of African Land Surface Phenology to Large Scale Climate Oscillations. Remote Sens. Environ. 2010, 114, 2286–2296. [Google Scholar] [CrossRef] [Green Version]
- Mayer, A. Phenology and Citizen Science: Volunteers Have Documented Seasonal Events for More than a Century, and Scientific Studies Are Benefiting from the Data. BioScience 2010, 60, 172–175. [Google Scholar] [CrossRef] [Green Version]
- Elmore, A.; Guinn, S.; Minsley, B.; Richardson, A. Landscape Controls on the Timing of Spring, Autumn, and Growing Season Length in Mid-Atlantic Forests. Glob. Change Biol. 2012, 18, 656–674. [Google Scholar] [CrossRef] [Green Version]
- Bhatt, U.; Walker, D.; Raynolds, M.; Bieniek, P.; Epstein, H.; Comiso, J.; Pinzon, J.; Tucker, C.; Polyakov, I. Recent Declines in Warming and Vegetation Greening Trends over Pan-Arctic Tundra. Remote Sens. 2013, 5, 4229–4254. [Google Scholar] [CrossRef] [Green Version]
- Begue, A.; Vintrou, E.; Saad, A.; Hiernaux, P. Differences between Cropland and Rangeland MODIS Phenology (Start-of-Season) in Mali. Int. J. Appl. Earth Obs. Geoinf. 2014, 31, 167–170. [Google Scholar] [CrossRef]
- Comiso, J.C.; Hall, D.K. Climate Trends in the Arctic as Observed from Space. WIREs Clim. Chang. 2014, 5, 389–409. [Google Scholar] [CrossRef]
- Keenan, T.; Darby, B.; Felts, E.; Sonnentag, O.; Friedl, M.; Hufkens, K.; O’Keefe, J.; Klosterman, S.; Munger, J.; Toomey, M.; et al. Tracking Forest Phenology and Seasonal Physiology Using Digital Repeat Photography: A Critical Assessment. Ecol. Appl. 2014, 24, 1478–1489. [Google Scholar] [CrossRef] [Green Version]
- Wu, C.; Gonsamo, A.; Gough, C.; Chen, J.; Xu, S. Modeling Growing Season Phenology in North American Forests Using Seasonal Mean Vegetation Indices from MODIS. Remote Sens. Environ. 2014, 147, 79–88. [Google Scholar] [CrossRef]
- Calders, K.; Schenkels, T.; Bartholomeus, H.; Armston, J.; Verbesselt, J.; Herold, M. Monitoring Spring Phenology with High Temporal Resolution Terrestrial LiDAR Measurements. Agric. For. Meteorol. 2015, 203, 158–168. [Google Scholar] [CrossRef]
- Meier, G.; Brown, J.; Evelsizer, R.; Vogelmann, J. Phenology and Climate Relationships in Aspen (Populus Tremuloides Michx.) Forest and Woodland Communities of Southwestern Colorado. Ecol. Indic. 2015, 48, 189–197. [Google Scholar] [CrossRef]
- Wu, X.; Lu, A.; Xu, G.; Zhang, H. Using Remote Sensing Technology to Estimate Phenology Change in the Hinterland on Tibet Plateau; Yang, S., Ed.; Atlantis Press: Amsterdam, The Netherlands, 2015; Volume 28, pp. 724–732. [Google Scholar]
- Lin, Y.; West, G. Reflecting Conifer Phenology Using Mobile Terrestrial LiDAR: A Case Study of Pinus Sylvestris Growing under the Mediterranean Climate in Perth, Australia. Ecol. Indic. 2016, 70, 1–9. [Google Scholar] [CrossRef]
- Liu, S.; Zhao, W.; Shen, H.; Zhang, L. Regional-Scale Winter Wheat Phenology Monitoring Using Multisensor Spatio-Temporal Fusion in a South Central China Growing Area. J. Appl. Remote Sens. 2016, 10, 046029. [Google Scholar] [CrossRef]
- Liu, Y.; Wu, C.; Peng, D.; Xu, S.; Gonsamo, A.; Jassal, R.; Arain, M.; Lu, L.; Fang, B.; Chen, J. Improved Modeling of Land Surface Phenology Using MODIS Land Surface Reflectance and Temperature at Evergreen Needleleaf Forests of Central North America. Remote Sens. Environ. 2016, 176, 152–162. [Google Scholar] [CrossRef]
- Melaas, E.; Wang, J.; Miller, D.; Friedl, M. Interactions between Urban Vegetation and Surface Urban Heat Islands: A Case Study in the Boston Metropolitan Region. Environ. Res. Lett. 2016, 11, 054020. [Google Scholar] [CrossRef] [Green Version]
- Atzberger, C.; Klisch, A.; Mattiuzzi, M.; Vuolo, F. Phenological Metrics Derived over the European Continent from NDVI3g Data and MODIS Time Series. Remote Sens. 2014, 6, 257–284. [Google Scholar] [CrossRef] [Green Version]
- Magney, T.; Eitel, J.; Huggins, D.; Vierling, L. Proximal NDVI Derived Phenology Improves In-Season Predictions of Wheat Quantity and Quality. Agric. For. Meteorol. 2016, 217, 46–60. [Google Scholar] [CrossRef]
- Pastor-Guzman, J.; Dash, J.; Atkinson, P. Remote Sensing of Mangrove Forest Phenology and Its Environmental Drivers. Remote Sens. Environ. 2018, 205, 71–84. [Google Scholar] [CrossRef] [Green Version]
- Yuan, H.; Wu, C.; Lu, L.; Wang, X. A New Algorithm Predicting the End of Growth at Five Evergreen Conifer Forests Based on Nighttime Temperature and the Enhanced Vegetation Index. ISPRS J. Photogramm. Remote Sens. 2018, 144, 390–399. [Google Scholar] [CrossRef]
- Wolfe, D.W.; Schwartz, M.D.; Lakso, A.N.; Otsuki, Y.; Pool, R.M.; Shaulis, N.J. Climate Change and Shifts in Spring Phenology of Three Horticultural Woody Perennials in Northeastern USA. Int. J. Biometeorol. 2005, 49, 303–309. [Google Scholar] [CrossRef]
- Richardson, A.D.; Keenan, T.F.; Migliavacca, M.; Ryu, Y.; Sonnentag, O.; Toomey, M. Climate Change, Phenology, and Phenological Control of Vegetation Feedbacks to the Climate System. Agric. For. Meteorol. 2013, 169, 156–173. [Google Scholar] [CrossRef]
- Ruan, Y.; Zhang, X.; Xin, Q.; Ao, Z.; Sun, Y. Enhanced Vegetation Growth in the Urban Environment Across 32 Cities in the Northern Hemisphere. J. Geophys. Res.-Biogeosci. 2019, 124, 3831–3846. [Google Scholar] [CrossRef]
- Templ, B.; Koch, E.; Bolmgren, K.; Ungersböck, M.; Paul, A.; Scheifinger, H.; Rutishauser, T.; Busto, M.; Chmielewski, F.-M.; Hájková, L.; et al. Pan European Phenological Database (PEP725): A Single Point of Access for European Data. Int. J. Biometeorol. 2018, 62, 1109–1113. [Google Scholar] [CrossRef] [PubMed]
- Van Vliet, A.J.H.; de Groot, R.S.; Bellens, Y.; Braun, P.; Bruegger, R.; Bruns, E.; Clevers, J.; Estreguil, C.; Flechsig, M.; Jeanneret, F.; et al. The European Phenology Network. Int. J. Biometeorol. 2003, 47, 202–212. [Google Scholar] [CrossRef] [PubMed]
- Zhou, K.; Cheng, T.; Zhu, Y.; Cao, W.; Ustin, S.L.; Zheng, H.; Yao, X.; Tian, Y. Assessing the Impact of Spatial Resolution on the Estimation of Leaf Nitrogen Concentration Over the Full Season of Paddy Rice Using Near-Surface Imaging Spectroscopy Data. Front. Plant Sci. 2018, 9, 964. [Google Scholar] [CrossRef] [Green Version]
- Burkart, A.; Hecht, V.L.; Kraska, T.; Rascher, U. Phenological Analysis of Unmanned Aerial Vehicle Based Time Series of Barley Imagery with High Temporal Resolution. Precis. Agric. 2018, 19, 134–146. [Google Scholar] [CrossRef]
- Ngie, A.; Tesfamichael, S.; Ahmed, F. Monitoring The Impacts of El Niño on the Extent of Cultivated Fields using Sar Data around the Agricultural Region of the Free State, South Africa. Int. Arch. Photogramm. Remote Sens. Spat. Inf. Sci. 2017, XLII-3/W2, 151–155. [Google Scholar] [CrossRef] [Green Version]
- Chen, W.J.; Black, T.A.; Yang, P.C.; Barr, A.G.; Neumann, H.H.; Nesic, Z.; Blanken, P.D.; Novak, M.D.; Eley, J.; Ketler, R.J.; et al. Effects of Climatic Variability on the Annual Carbon Sequestration by a Boreal Aspen Forest. Glob. Chang. Biol. 1999, 5, 41–53. [Google Scholar] [CrossRef]
- Hyvönen, R.; Ågren, G.I.; Linder, S.; Persson, T.; Cotrufo, M.F.; Ekblad, A.; Freeman, M.; Grelle, A.; Janssens, I.A.; Jarvis, P.G.; et al. The Likely Impact of Elevated [CO2], Nitrogen Deposition, Increased Temperature and Management on Carbon Sequestration in Temperate and Boreal Forest Ecosystems: A Literature Review. New Phytol. 2007, 173, 463–480. [Google Scholar] [CrossRef] [PubMed]
- Ericsson, K.; Nilsson, L.J. Assessment of the Potential Biomass Supply in Europe Using a Resource-Focused Approach. Biomass Bioenergy 2006, 30, 1–15. [Google Scholar] [CrossRef] [Green Version]
- van Wart, J.; van Bussel, L.G.J.; Wolf, J.; Licker, R.; Grassini, P.; Nelson, A.; Boogaard, H.; Gerber, J.; Mueller, N.D.; Claessens, L.; et al. Use of Agro-Climatic Zones to Upscale Simulated Crop Yield Potential. Field Crops Res. 2013, 143, 44–55. [Google Scholar] [CrossRef] [Green Version]
- Chapman, S.C.; Chakraborty, S.; Dreccer, M.F.; Howden, S.M.; Chapman, S.C.; Chakraborty, S.; Dreccer, M.F.; Howden, S.M. Plant Adaptation to Climate Change—Opportunities and Priorities in Breeding. Crop Pasture Sci. 2012, 63, 251–268. [Google Scholar] [CrossRef] [Green Version]
- Georgopoulou, E.; Mirasgedis, S.; Sarafidis, Y.; Vitaliotou, M.; Lalas, D.P.; Theloudis, I.; Giannoulaki, K.-D.; Dimopoulos, D.; Zavras, V. Climate Change Impacts and Adaptation Options for the Greek Agriculture in 2021–2050: A Monetary Assessment. Clim. Risk Manag. 2017, 16, 164–182. [Google Scholar] [CrossRef]
- Milosevic, T.; Zornic, B.; Glisic, I. A Comparison of Low-Density and High-Density Plum Plantings for Differences in Establishment and Management Costs, and in Returns over the First Three Growing Seasons—A Mini-Review. J. Hortic. Sci. Biotechnol. 2008, 83, 539–542. [Google Scholar] [CrossRef]
- Yang, K.; Wu, H.; Qin, J.; Lin, C.; Tang, W.; Chen, Y. Recent Climate Changes over the Tibetan Plateau and Their Impacts on Energy and Water Cycle: A Review. Glob. Planet. Chang. 2014, 112, 79–91. [Google Scholar] [CrossRef]
- Shen, M.; Piao, S.; Dorji, T.; Liu, Q.; Cong, N.; Chen, X.; An, S.; Wang, S.; Wang, T.; Zhang, G. Plant Phenological Responses to Climate Change on the Tibetan Plateau: Research Status and Challenges. Natl. Sci. Rev. 2015, 2, 454–467. [Google Scholar] [CrossRef] [Green Version]
- Tang, J.; Körner, C.; Muraoka, H.; Piao, S.; Shen, M.; Thackeray, S.J.; Yang, X. Emerging Opportunities and Challenges in Phenology: A Review. Ecosphere 2016, 7, e01436. [Google Scholar] [CrossRef] [Green Version]
- Čejka, T.; Trnka, M.; Krusic, P.J.; Stobbe, U.; Oliach, D.; Václavík, T.; Tegel, W.; Büntgen, U. Predicted Climate Change Will Increase the Truffle Cultivation Potential in Central Europe. Sci. Rep. 2020, 10, 21281. [Google Scholar] [CrossRef]
- Peichl, M.; Öquist, M.; Ottosson Löfvenius, M.; Ilstedt, U.; Sagerfors, J.; Grelle, A.; Lindroth, A.; Nilsson, M.B. A 12-Year Record Reveals Pre-Growing Season Temperature and Water Table Level Threshold Effects on the Net Carbon Dioxide Exchange in a Boreal Fen. Environ. Res. Lett. 2014, 9, 055006. [Google Scholar] [CrossRef]
- Pook, M.J.; Risbey, J.S.; McIntosh, P.C. A Comparative Synoptic Climatology of Cool-Season Rainfall in Major Grain-Growing Regions of Southern Australia. Theor. Appl. Climatol. 2014, 117, 521–533. [Google Scholar] [CrossRef]
- Chen, B.; Jin, Y.; Brown, P. An Enhanced Bloom Index for Quantifying Floral Phenology Using Multi-Scale Remote Sensing Observations. ISPRS J. Photogramm. Remote Sens. 2019, 156, 108–120. [Google Scholar] [CrossRef]
- Delbart, N.; Beaubien, E.; Kergoat, L.; Toan, T. Comparing Land Surface Phenology with Leafing and Flowering Observations from the PlantWatch Citizen Network. Remote Sens. Environ. 2015, 160, 273–280. [Google Scholar] [CrossRef]
- Araya, S.; Ostendorf, B.; Lyle, G.; Lewis, M. CropPhenology: An R Package for Extracting Crop Phenology from Time Series Remotely Sensed Vegetation Index Imagery. Ecol. Inform. 2018, 46, 45–56. [Google Scholar] [CrossRef]
- Bartoszek, K. Usefulness of MODIS Data for Assessment of the Growth and Development of Winter Oilseed Rape. Zemdirb.-Agric. 2014, 101, 445–452. [Google Scholar] [CrossRef] [Green Version]
- Kellner, J.; Hubbell, S. Adult Mortality in a Low-Density Tree Population Using High-Resolution Remote Sensing. Ecology 2017, 98, 1700–1709. [Google Scholar] [CrossRef]
- Tamondong, A.; Cruz, C.; Quides, R.; Garcia, M.; Cruz, J.; Guihawen, J.; Blanco, A. Remote Sensing-Based Estimation of Seagrass Percent Cover and LAI for Above Ground Carbon Sequestration Mapping; Frouin, R., Murakami, H., Eds.; SPIE: Honolulu, HI, USA, 2018; Volume 10778. [Google Scholar]
- Wang, Y.; Tian, Q.; Huang, Y.; Wei, H. NDVI Difference Rate Recognition Model of Deciduous Broad-Leaved Forest Based on HJ-CCD Remote Sensing Data. Spectrosc. Spectr. Anal. 2013, 33, 1018–1022. [Google Scholar] [CrossRef]
- Chattaraj, S.; Chakraborty, D.; Garg, R.; Singh, G.; Gupta, V.; Singh, S.; Singh, R. Hyperspectral Remote Sensing for Growth-Stage-Specific Water Use in Wheat. Field Crops Res. 2013, 144, 179–191. [Google Scholar] [CrossRef]
- Fernandez-Ordonez, Y.; Soria-Ruiz, J. Maize Crop Yield Estimation with Remote Sensing and Empirical Models; IEEE: Piscataway, NJ, USA, 2017; pp. 3035–3038. [Google Scholar]
- Guo, L.; Pei, Z.; Zhang, S.; Wang, Q.; McNairn, H.; Shang, J.; Jiao, X. Rice Identification Using TerraSAR-X Data; Tong, Q., Gu, X., Zhu, B., Eds.; SPIE: Hangzhou, China, 2011; Volume 8203. [Google Scholar]
- Herbei, M.; Sala, F. Use landsat image to evaluate vegetation stage in sunflower crops. Agrolife Sci. J. 2015, 4, 79–86. [Google Scholar]
- Heumann, B.; Hackett, R.; Monfils, A. Testing the Spectral Diversity Hypothesis Using Spectroscopy Data in a Simulated Wetland Community. Ecol. Inform. 2015, 25, 29–34. [Google Scholar] [CrossRef]
- Monroe, J.; Powell, T.; Price, N.; Mullen, J.; Howard, A.; Evans, K.; Lovell, J.; McKay, J. Drought Adaptation in Arabidopsis Thaliana by Extensive Genetic Loss-of-Function. Elife 2018, 7, e41038. [Google Scholar] [CrossRef] [PubMed]
- Nagai, S.; Akitsu, T.; Saitoh, T.; Busey, R.; Fukuzawa, K.; Honda, Y.; Ichie, T.; Ide, R.; Ikawa, H.; Iwasaki, A.; et al. 8 Million Phenological and Sky Images from 29 Ecosystems from the Arctic to the Tropics: The Phenological Eyes Network. Ecol. Res. 2018, 33, 1091–1092. [Google Scholar] [CrossRef]
- Pena-Barragan, J.; Lopez-Granados, F.; Jurado-Expoosito, M.; Garcia-Torres, L. Spectral Discrimination of Ridolfia Segetum and Sunflower as Affected by Phenological Stage. Weed Res. 2006, 46, 10–21. [Google Scholar] [CrossRef]
- Song, Y.; Yan, F.; Shan, X.; Fan, X.; Zhou, W.; Chen, S.; Zhu, L.; Du, X.; Wang, L. Identification of the Strike Slip System of Maergaichaka Fault, Tibet, China, Using Remote Sensing Data; IEEE: Piscataway, NJ, USA, 2004; pp. 2995–2997. [Google Scholar]
- Tuvdendorj, B.; Wu, B.; Zeng, H.; Batdelger, G.; Nanzad, L. Determination of Appropriate Remote Sensing Indices for Spring Wheat Yield Estimation in Mongolia. Remote Sens. 2019, 11, 2568. [Google Scholar] [CrossRef] [Green Version]
- Gonzalez-Piqueras, J.; Jara, F.; Lopez, H.; Villodre, J.; Hernandez, D.; Calera, A.; Lopez-Urrea, R.; Sanchez, J. Determining Crop Phenology for Different Varieties of Barley and Wheat on Intensive Plots Using Proximal Remote Sensing; Neale, C., Maltese, A., Eds.; SPIE: Strasbourg, France, 2019; Volume 11149. [Google Scholar]
- Hebbar, K.; Venugopalan, M.; Seshasai, M.; Rao, K.; Patil, B.; Prakash, A.; Kumar, V.; Hebbar, K.; Jeyakumar, P.; Bandhopadhyay, K.; et al. Predicting Cotton Production Using Infocrop-Cotton Simulation Model, Remote Sensing and Spatial Agro-Climatic Data. Curr. Sci. 2008, 95, 1570–1579. [Google Scholar]
- Jacob, B.; Muturi, E.; Mwangangi, J.; Funes, J.; Caamano, E.; Muriu, S.; Shililu, J.; Githure, J.; Novak, R. Remote and Field Level Quantification of Vegetation Covariates for Malaria Mapping in Three Rice Agro-Village Complexes in Central Kenya. Int. J. Health Geogr. 2007, 6, 1–11. [Google Scholar] [CrossRef] [Green Version]
- Jia, K.; Wu, B.; Tian, Y.; Li, Q.; Du, X. Spectral Discrimination of Opium Poppy Using Field Spectrometry. IEEE Trans. Geosci. Remote Sens. 2011, 49, 3414–3422. [Google Scholar] [CrossRef]
- Potgieter, A.; Lawson, K.; Huete, A. Determining Crop Acreage Estimates for Specific Winter Crops Using Shape Attributes from Sequential MODIS Imagery. Int. J. Appl. Earth Obs. Geoinf. 2013, 23, 254–263. [Google Scholar] [CrossRef]
- Shuai, Y.; Schaaf, C.; Zhang, X.; Strahler, A.; Roy, D.; Morisette, J.; Wang, Z.; Nightingale, J.; Nickeson, J.; Richardson, A.; et al. Daily MODIS 500 m Reflectance Anisotropy Direct Broadcast (DB) Products for Monitoring Vegetation Phenology Dynamics. Int. J. Remote Sens. 2013, 34, 5997–6016. [Google Scholar] [CrossRef]
- Sicre, C.; Baup, F.; Fieuzal, R. Determination of the Crop Row Orientations from Formosat-2 Multi-Temporal and Panchromatic Images. ISPRS J. Photogramm. Remote Sens. 2014, 94, 127–142. [Google Scholar] [CrossRef] [Green Version]
- Song, X.; Cui, B.; Yang, G.; Feng, H. Comparison of Winter Wheat Growth with Multi-Temporal Remote Sensing Imagery; Guo, H., Ed.; IOP Publishing Ltd.: Beijing, China, 2014; Volume 17. [Google Scholar]
- Sun, P.; Yu, Z.; Liu, S.; Wei, X.; Wang, J.; Zegre, N.; Liu, N. Climate Change, Growing Season Water Deficit and Vegetation Activity along the North-South Transect of Eastern China from 1982 through 2006. Hydrol. Earth Syst. Sci. 2012, 16, 3835–3850. [Google Scholar] [CrossRef] [Green Version]
- Xu, K.; Zhang, X.; Chen, B.; Hua, K.; Zheng, K.; Wu, T. Based on MODIS NDVI Data to Monitor the Growing Season of the Deciduous Forest in Beijing, China. In Earth Resources and Environmental Remote Sensing/GIS Applications II; SPIE: Berlin, Germany, 2011; Volume 8181. [Google Scholar]
- Sun, C.; Bian, Y.; Zhou, T.; Pan, J. Using of Multi-Source and Multi-Temporal Remote Sensing Data Improves Crop-Type Mapping in the Subtropical Agriculture Region. Sensors 2019, 19, 2401. [Google Scholar] [CrossRef] [PubMed] [Green Version]
- Supriatna; Rokhmatuloh; Wibowo, A.; Shidiq, I.; Pratama, G.; Gandharum, L. Spatio-temporal analysis of rice field phenology using sentinel-1 image in karawang regency west java, indonesia. Int. J. Geomate 2019, 17, 101–106. [Google Scholar] [CrossRef]
- Jin, X.; Li, Z.; Yang, G.; Yang, H.; Feng, H.; Xu, X.; Wang, J.; Li, X.; Luo, J. Winter Wheat Yield Estimation Based on Multi-Source Medium Resolution Optical and Radar Imaging Data and the AquaCrop Model Using the Particle Swarm Optimization Algorithm. ISPRS J. Photogramm. Remote Sens. 2017, 126, 24–37. [Google Scholar] [CrossRef]
- Li, J.; Wang, S. Using SAR-Derived Vegetation Descriptors in a Water Cloud Model to Improve Soil Moisture Retrieval. Remote Sens. 2018, 10, 1370. [Google Scholar] [CrossRef] [Green Version]
- Mirzaee, S.; Motagh, M.; Arefi, H.; Nooryazdan, A. Phenological Tracking of Agricultural Feilds Investigated by using Dual Polarimetry Tandem-X Images; Schreier, G., Skrovseth, P., Staudenrausch, H., Eds.; ISPRS: Hannover, Germany, 2015; Volume 47, pp. 73–76. [Google Scholar]
- Poyry, J.; Bottcher, K.; Fronzek, S.; Gobron, N.; Leinonen, R.; Metsamaki, S.; Virkkala, R. Predictive Power of Remote Sensing versus Temperature-Derived Variables in Modelling Phenology of Herbivorous Insects. Remote Sens. Ecol. Conserv. 2018, 4, 113–126. [Google Scholar] [CrossRef]
- Yang, B.; He, M.; Shishov, V.; Tychkov, I.; Vaganov, E.; Rossi, S.; Ljungqvist, F.; Brauning, A.; Griessinger, J. New Perspective on Spring Vegetation Phenology and Global Climate Change Based on Tibetan Plateau Tree-Ring Data. Proc. Natl. Acad. Sci. USA 2017, 114, 6966–6971. [Google Scholar] [CrossRef] [Green Version]
- Yu, S.; Xia, J.; Yan, Z.; Yang, K. Changing Spring Phenology Dates in the Three-Rivers Headwater Region of the Tibetan Plateau during 1960–2013. Adv. Atmos. Sci. 2018, 35, 116–126. [Google Scholar] [CrossRef]
- Zhao, G.; Shi, P. Sources of Uncertainty in Exploring Rangeland Phenology: A Case Study in an Alpine Meadow on the Central Tibetan Plateau. J. Mt. Sci. 2017, 14, 1827–1838. [Google Scholar] [CrossRef]
- Zipper, S.; Schatz, J.; Singh, A.; Kucharik, C.; Townsend, P.; Loheide, S. Urban Heat Island Impacts on Plant Phenology: Intra-Urban Variability and Response to Land Cover. Environ. Res. Lett. 2016, 11, 054023. [Google Scholar] [CrossRef]
- Beamish, A.; Coops, N.; Hermosilla, T.; Chabrillat, S.; Heim, B. Monitoring Pigment-Driven Vegetation Changes in a Low-Arctic Tundra Ecosystem Using Digital Cameras. Ecosphere 2018, 9, e02123. [Google Scholar] [CrossRef] [Green Version]
- Gessner, U.; Knauer, K.; Kuenzer, C.; Dech, S. Land Surface Phenology in a West African Savanna: Impact of Land Use, Land Cover and Fire. In Remote Sensing Time Series: Revealing Land Surface Dynamics; Kuenzer, C., Dech, S., Wagner, W., Eds.; Springer: Berlin, Germany, 2015; Volume 22, ISBN 978-3-319-15967-6. [Google Scholar]
- Jin, Y.; Xu, B.; Yang, X.; Qin, Z.; Wu, Q.; Zhao, F.; Chen, S.; Li, J.; Ma, H. MODIS-Based Vegetation Growth of Temperate Grassland and Its Correlation with Meteorological Factors in Northern China. Int. J. Remote Sens. 2015, 36, 5123–5136. [Google Scholar] [CrossRef]
- Ren, S.; Qin, Q.; Ren, H. Contrasting Wheat Phenological Responses to Climate Change in Global Scale. Sci. Total Environ. 2019, 665, 620–631. [Google Scholar] [CrossRef] [PubMed]
- Gao, F.; Anderson, M.; Zhang, X.; Yang, Z.; Alfieri, J.; Kustas, W.; Mueller, R.; Johnson, D.; Prueger, J. Toward Mapping Crop Progress at Field Scales through Fusion of Landsat and MODIS Imagery. Remote Sens. Environ. 2017, 188, 9–25. [Google Scholar] [CrossRef] [Green Version]
- Shen, J.; Huete, A.; Tran, N.; Devadas, R.; Ma, X.; Eamus, D.; Yu, Q. Diverse Sensitivity of Winter Crops over the Growing Season to Climate and Land Surface Temperature across the Rainfed Cropland-Belt of Eastern Australia. Agric. Ecosyst. Environ. 2018, 254, 99–110. [Google Scholar] [CrossRef]
- Small, E.; Roesler, C.; Larson, K. Vegetation Response to the 2012-2014 California Drought from GPS and Optical Measurements. Remote Sens. 2018, 10, 630. [Google Scholar] [CrossRef] [Green Version]
- Berman, E.; Graves, T.; Mikle, N.; Merkle, J.; Johnston, A.; Chong, G. Comparative Quality and Trend of Remotely Sensed Phenology and Productivity Metrics across the Western United States. Remote Sens. 2020, 12, 2538. [Google Scholar] [CrossRef]
- Arzac, A.; Tychkov, I.; Rubtsov, A.; Tabakova, M.; Brezhnev, R.; Koshurnikova, N.; Knorre, A.; Buntgen, U. Phenological Shifts Compensate Warming-Induced Drought Stress in Southern Siberian Scots Pines. Eur. J. For. Res. 2021, 140, 1487–1498. [Google Scholar] [CrossRef]
- Baumann, M.; Ozdogan, M.; Richardson, A.; Radeloff, V. Phenology from Landsat When Data Is Scarce: Using MODIS and Dynamic Time-Warping to Combine Multi-Year Landsat Imagery to Derive Annual Phenology Curves. Int. J. Appl. Earth Obs. Geoinf. 2017, 54, 72–83. [Google Scholar] [CrossRef]
- Liu, F.; Wang, X.; Wang, C. Measuring Vegetation Phenology with Near-Surface Remote Sensing in a Temperate Deciduous Forest: Effects of Sensor Type and Deployment. Remote Sens. 2019, 11, 1063. [Google Scholar] [CrossRef] [Green Version]
- Rankine, C.; Sanchez-Azofeifa, A.; do Espirito-Santo, M.; Viera, M. Optical Wireless Sensor Networks Observe Leaf Phenology and Photosynthetic Radiation Interception in a Brazilian Tropical Dry Forest; IEEE: Piscataway, NJ, USA, 2012; pp. 6914–6915. [Google Scholar]
- Gonsamo, A.; Chen, J.; Wu, C.; Dragoni, D. Predicting Deciduous Forest Carbon Uptake Phenology by Upscaling FLUXNET Measurements Using Remote Sensing Data. Agric. For. Meteorol. 2012, 165, 127–135. [Google Scholar] [CrossRef]
- Middleton, E.; Cheng, Y.; Hilker, T.; Black, T.; Krishnan, P.; Coops, N.; Huemmrich, K. Linking Foliage Spectral Responses to Canopy-Level Ecosystem Photosynthetic Light-Use Efficiency at a Douglas-Fir Forest in Canada. Can. J. Remote Sens. 2009, 35, 166–188. [Google Scholar] [CrossRef]
- Yu, L.; Liu, T. The Impact of Artificial Wetland Expansion on Local Temperature in the Growing Season-the Case Study of the Sanjiang Plain, China. Remote Sens. 2019, 11, 2915. [Google Scholar] [CrossRef] [Green Version]
- Chen, S.; Huang, Y.; Gao, S.; Wang, G. Impact of Physiological and Phenological Change on Carbon Uptake on the Tibetan Plateau Revealed through GPP Estimation Based on Spaceborne Solar-Induced Fluorescence. Sci. Total Environ. 2019, 663, 45–59. [Google Scholar] [CrossRef] [PubMed]
- White, K.; Pontius, J.; Schaberg, P. Remote Sensing of Spring Phenology in Northeastern Forests: A Comparison of Methods, Field Metrics and Sources of Uncertainty. Remote Sens. Environ. 2014, 148, 97–107. [Google Scholar] [CrossRef]
- Wu, C.; Peng, D.; Soudani, K.; Siebicke, L.; Gough, C.; Arain, M.; Bohrer, G.; Lafleur, P.; Peichl, M.; Gonsamo, A.; et al. Land Surface Phenology Derived from Normalized Difference Vegetation Index (NDVI) at Global FLUXNET Sites. Agric. For. Meteorol. 2017, 233, 171–182. [Google Scholar] [CrossRef]
- Boyte, S.; Wylie, B.; Major, D.; Brown, J. The Integration of Geophysical and Enhanced Moderate Resolution Imaging Spectroradiometer Normalized Difference Vegetation Index Data into a Rule-Based, Piecewise Regression-Tree Model to Estimate Cheatgrass Beginning of Spring Growth. Int. J. Digit. Earth 2015, 8, 118–132. [Google Scholar] [CrossRef]
- Kubert, C.; Conrad, C.; Klein, D.; Dech, S. Land Surface Phenology From Modis Data in Germany; IEEE: Piscataway, NJ, USA, 2013. [Google Scholar]
- Lu, L.; Wang, C.; Guo, H.; Zhang, X.; Sui, Y. Land Surface Phenology Detection with Multisource Remote Sensing Data: A Comparative Analysis; Jackson, T., Chen, J., Gong, P., Liang, S., Eds.; SPIE: Beijing, China, 2014; Volume 9260. [Google Scholar]
- Roetzer, T.; Wittenzeller, M.; Haeckel, H.; Nekovar, J. Phenology in Central Europe—Differences and Trends of Spring Phenophases in Urban and Rural Areas. Int. J. Biometeorol. 2000, 44, 60–66. [Google Scholar] [CrossRef]
- Ghosh, S.; Nandy, S.; Mohanty, S.; Subba, R.; Kushwaha, S. Are Phenological Variations in Natural Teak (Tectona Grandis) Forests of India Governed by Rainfall? A Remote Sensing Based Investigation. Environ. Monit. Assess. 2019, 191, 1–10. [Google Scholar] [CrossRef]
- Garonna, I.; de Jong, R.; Stockli, R.; Schmid, B.; Schenkel, D.; Schimel, D.; Schaepman, M. Shifting Relative Importance of Climatic Constraints on Land Surface Phenology. Environ. Res. Lett. 2018, 13, 024025. [Google Scholar] [CrossRef] [Green Version]
- Ji, W.; Wang, L. Phenology-Guided Saltcedar (Tamarix spp.) Mapping Using Landsat TM Images in Western US. Remote Sens. Environ. 2016, 173, 29–38. [Google Scholar] [CrossRef]
- Huang, K.; Zu, J.; Zhang, Y.; Cong, N.; Liu, Y.; Chen, N. Impacts of Snow Cover Duration on Vegetation Spring Phenology over the Tibetan Plateau. J. Plant Ecol. 2019, 12, 583–592. [Google Scholar] [CrossRef]
- Kiapasha, K.; Darvishsefat, A.; Zargham, N.; Julien, Y.; Sobrino, J.; Nadi, M. Shifts of Start and End of Season in Response to Air Temperature Variation Based on Gimms Dataset in Hyrcanian Forests; Karimipour, F., Samadzadegan, F., Eds.; ISPRS: Teheran, Iran, 2017; Volume 42–44, pp. 155–160. [Google Scholar]
- Ryan, C.; Williams, M.; Hill, T.; Grace, J.; Woodhouse, I. Assessing the Phenology of Southern Tropical Africa: A Comparison of Hemispherical Photography, Scatterometry, and Optical/NIR Remote Sensing. IEEE Trans. Geosci. Remote Sens. 2014, 52, 519–528. [Google Scholar] [CrossRef] [Green Version]
- Zhu, Y.; Zhang, Y.; Zu, J.; Wang, Z.; Huang, K.; Cong, N.; Tang, Z. Effects of Data Temporal Resolution on Phenology Extractions from the Alpine Grasslands of the Tibetan Plateau. Ecol. Indic. 2019, 104, 365–377. [Google Scholar] [CrossRef]
- Kiapasha, K.; Darvishsefat, A.; Julien, Y.; Sobrino, J.; Zargham, N.; Attarod, P.; Schaepman, M. Trends in Phenological Parameters and Relationship Between Land Surface Phenology and Climate Data in the Hyrcanian Forests of Iran. IEEE J. Sel. Top. Appl. Earth Obs. Remote Sens. 2017, 10, 4961–4970. [Google Scholar] [CrossRef]
- Xie, J.; Kneubuhler, M.; Garonna, I.; de Jong, R.; Notarnicola, C.; De Gregorio, L.; Schaepman, M. Relative Influence of Timing and Accumulation of Snow on Alpine Land Surface Phenology. J. Geophys. Res.-Biogeosci. 2018, 123, 561–576. [Google Scholar] [CrossRef]
- Zu, J.; Zhang, Y.; Huang, K.; Liu, Y.; Chen, N.; Cong, N. Biological and Climate Factors Co-Regulated Spatial-Temporal Dynamics of Vegetation Autumn Phenology on the Tibetan Plateau. Int. J. Appl. Earth Obs. Geoinf. 2018, 69, 198–205. [Google Scholar] [CrossRef]
- Eisavi, V.; Homayouni, S.; Rezaei-Chiyaneh, E. Apple Orchard Phenology Response to Desiccation and Temperature Changes in Urmia Lake Region. Int. J. Environ. Sci. Technol. 2017, 14, 1865–1878. [Google Scholar] [CrossRef]
- Van Eck, N.J.; Waltman, L. VOSviewer Manual. 54. Available online: https://www.vosviewer.com/documentation/Manual_VOSviewer_1.6.8.pdf (accessed on 15 October 2021).
- Van Eck, N.J.; Waltman, L. Visualizing Bibliometric Networks. In Measuring Scholarly Impact: Methods and Practice; Ding, Y., Rousseau, R., Wolfram, D., Eds.; Springer International Publishing: Cham, Switzerland, 2014; pp. 285–320. ISBN 978-3-319-10377-8. [Google Scholar]
- Kaiser, A.; Duchesne-Onoro, R. Discrimination of Wheat and Oat Crops Using Field Hyperspectral Remote Sensing. Bannon, D., Ed.; SPIE: Anaheim, CA, USA, 2017; Volume 10213. [Google Scholar]
- Liu, L.; Zhang, X.; Yu, Y.; Gao, F.; Yang, Z. Real-Time Monitoring of Crop Phenology in the Midwestern United States Using VIIRS Observations. Remote Sens. 2018, 10, 1540. [Google Scholar] [CrossRef] [Green Version]
- Liu, W.; Dong, J.; Xiang, K.; Wang, S.; Han, W.; Yuan, W. A Sub-Pixel Method for Estimating Planting Fraction of Paddy Rice in Northeast China. Remote Sens. Environ. 2018, 205, 305–314. [Google Scholar] [CrossRef]
- Hawinkel, P.; Swinnen, E.; Lhermitte, S.; Verbist, B.; Van Orshoven, J.; Muys, B. A Time Series Processing Tool to Extract Climate-Driven Interannual Vegetation Dynamics Using Ensemble Empirical Mode Decomposition (EEMD). Remote Sens. Environ. 2015, 169, 375–389. [Google Scholar] [CrossRef] [Green Version]
- Bullock, P.R. A Comparison of Growing Season Agrometeorological Stress and Single-Date Landsat NDVI for Wheat Yield Estimation in West Central Saskatchewan. Can. J. Remote Sens. 2004, 30, 101–108. [Google Scholar] [CrossRef]
- Gitelson, A.A. Wide Dynamic Range Vegetation Index for Remote Quantification of Biophysical Characteristics of Vegetation. J. Plant Physiol. 2004, 161, 165–173. [Google Scholar] [CrossRef] [Green Version]
- Xue, W.; Ko, J.; Werner, C.; Tenhunen, J. A Spatially Hierarchical Integration of Close-Range Remote Sensing, Leaf Structure and Physiology Assists in Diagnosing Spatiotemporal Dimensions of Field-Scale Ecosystem Photosynthetic Productivity. Agric. For. Meteorol. 2017, 247, 503–519. [Google Scholar] [CrossRef]
- Brown, T.B.; Hultine, K.R.; Steltzer, H.; Denny, E.G.; Denslow, M.W.; Granados, J.; Henderson, S.; Moore, D.; Nagai, S.; SanClements, M.; et al. Using Phenocams to Monitor Our Changing Earth: Toward a Global Phenocam Network. Front. Ecol. Environ. 2016, 14, 84–93. [Google Scholar] [CrossRef] [Green Version]
- Li, S.; Sun, Z.; Zhang, X.; Zhu, W.; Li, Y. An Improved Threshold Method to Detect the Phenology of Winter Wheat; IEEE: Piscataway, NJ, USA, 2018; pp. 172–176. [Google Scholar]
- Liebisch, F.; Kirchgessner, N.; Schneider, D.; Walter, A.; Hund, A. Remote, Aerial Phenotyping of Maize Traits with a Mobile Multi-Sensor Approach. Plant Methods 2015, 11, 1–20. [Google Scholar] [CrossRef] [Green Version]
- Wu, C.; Gonsamo, A.; Chen, J.M.; Kurz, W.A.; Price, D.T.; Lafleur, P.M.; Jassal, R.S.; Dragoni, D.; Bohrer, G.; Gough, C.M.; et al. Interannual and Spatial Impacts of Phenological Transitions, Growing Season Length, and Spring and Autumn Temperatures on Carbon Sequestration: A North America Flux Data Synthesis. Glob. Planet. Chang. 2012, 92–93, 179–190. [Google Scholar] [CrossRef] [Green Version]
- Sloat, L.; Lin, M.; Butler, E.; Johnson, D.; Holbrook, N.; Huybers, P.; Lee, J.; Mueller, N. Evaluating the Benefits of Chlorophyll Fluorescence for In-Season Crop Productivity Forecasting. Remote Sens. Environ. 2021, 260, 112478. [Google Scholar] [CrossRef]
- Bonan, G.B. Forests and Climate Change: Forcings, Feedbacks, and the Climate Benefits of Forests. Science 2008, 320, 1444–1449. [Google Scholar] [CrossRef] [Green Version]
- Polgar, C.; Primack, R. Leaf-out Phenology of Temperate Woody Plants: From Trees to Ecosystems. New Phytol. 2011, 191, 926–941. [Google Scholar] [CrossRef] [PubMed]
- Piao, S.; Liu, Q.; Chen, A.; Janssens, I.; Fu, Y.; Dai, J.; Liu, L.; Lian, X.; Shen, M.; Zhu, X. Plant Phenology and Global Climate Change: Current Progresses and Challenges. Glob. Change Biol. 2019, 25, 1922–1940. [Google Scholar] [CrossRef] [PubMed]
- Yue, X.; Unger, N.; Keenan, T.; Zhang, X.; Vogel, C. Probing the Past 30-Year Phenology Trend of US Deciduous Forests. Biogeosciences 2015, 12, 4693–4709. [Google Scholar] [CrossRef] [Green Version]
- Berra, E.; Gaulton, R. Remote Sensing of Temperate and Boreal Forest Phenology: A Review of Progress, Challenges and Opportunities in the Intercomparison of in-Situ and Satellite Phenological Metrics. For. Ecol. Manag. 2021, 480, 118663. [Google Scholar] [CrossRef]
- Commission Delegated Regulation (EU) 2019/945 of 12 March 2019 on Unmanned Aircraft Systems and on Third-Country Operators of Unmanned Aircraft Systems. 2019, Volume 152. Available online: https://www.consilium.europa.eu/media/40525/delegated-act_drones.pdf (accessed on 7 December 2021).
- Chen, Y.; Song, X.; Wang, S.; Huang, J.; Mansaray, L.R. Impacts of Spatial Heterogeneity on Crop Area Mapping in Canada Using MODIS Data. ISPRS J. Photogramm. Remote Sens. 2016, 119, 451–461. [Google Scholar] [CrossRef]
- Anderson, J.R. A Land Use and Land Cover Classification System for Use with Remote Sensor Data; U.S. Government Printing Office: Arlington, TX, USA, 1976.
- Rao, Y.; Zhu, X.; Chen, J.; Wang, J. An Improved Method for Producing High Spatial-Resolution NDVI Time Series Datasets with Multi-Temporal MODIS NDVI Data and Landsat TM/ETM+ Images. Remote Sens. 2015, 7, 7865–7891. [Google Scholar] [CrossRef] [Green Version]
- Sidike, P.; Sagan, V.; Qumsiyeh, M.; Maimaitijiang, M.; Essa, A.; Asari, V. Adaptive Trigonometric Transformation Function With Image Contrast and Color Enhancement: Application to Unmanned Aerial System Imagery. IEEE Geosci. Remote Sens. Lett. 2018, 15, 404–408. [Google Scholar] [CrossRef]
- Zhao, X.; Zhou, D.; Fang, J. Satellite-Based Studies on Large-Scale Vegetation Changes in China. J. Integr. Plant Biol. 2012, 54, 713–728. [Google Scholar] [CrossRef]
- Misra, G.; Cawkwell, F.; Wingler, A. Status of Phenological Research Using Sentinel-2 Data: A Review. Remote Sens. 2020, 12, 2760. [Google Scholar] [CrossRef]
- Motohka, T.; Nasahara, K.; Murakami, K.; Nagai, S. Evaluation of Sub-Pixel Cloud Noises on MODIS Daily Spectral Indices Based on in Situ Measurements. Remote Sens. 2011, 3, 1644–1662. [Google Scholar] [CrossRef] [Green Version]
- Richardson, A.D.; Hollinger, D.Y.; Dail, D.B.; Lee, J.T.; Munger, J.W.; O’keefe, J. Influence of Spring Phenology on Seasonal and Annual Carbon Balance in Two Contrasting New England Forests. Tree Physiol. 2009, 29, 321–331. [Google Scholar] [CrossRef] [PubMed]
- Nagai, S.; Saitoh, T.M.; Nasahara, K.N.; Suzuki, R. Spatio-Temporal Distribution of the Timing of Start and End of Growing Season along Vertical and Horizontal Gradients in Japan. Int. J. Biometeorol. 2015, 59, 47–54. [Google Scholar] [CrossRef] [PubMed]


Publisher’s Note: MDPI stays neutral with regard to jurisdictional claims in published maps and institutional affiliations. |
© 2022 by the authors. Licensee MDPI, Basel, Switzerland. This article is an open access article distributed under the terms and conditions of the Creative Commons Attribution (CC BY) license (https://creativecommons.org/licenses/by/4.0/).
Share and Cite
Siłuch, M.; Bartmiński, P.; Zgłobicki, W. Remote Sensing in Studies of the Growing Season: A Bibliometric Analysis. Remote Sens. 2022, 14, 1331. https://doi.org/10.3390/rs14061331
Siłuch M, Bartmiński P, Zgłobicki W. Remote Sensing in Studies of the Growing Season: A Bibliometric Analysis. Remote Sensing. 2022; 14(6):1331. https://doi.org/10.3390/rs14061331
Chicago/Turabian StyleSiłuch, Marcin, Piotr Bartmiński, and Wojciech Zgłobicki. 2022. "Remote Sensing in Studies of the Growing Season: A Bibliometric Analysis" Remote Sensing 14, no. 6: 1331. https://doi.org/10.3390/rs14061331