Article

An Interpretation Approach of Ascending–Descending SAR Data for Landslide Identification

1
Faculty of Engineering, China University of Geosciences, Wuhan 430074, China
2
State Key Laboratory of Internet of Things for Smart City, Department of Civil and Environment Engineering, University of Macau, Macao 999078, China
3
Center for Ocean Research in Hong Kong and Macau (CORE), Hong Kong 999077, China
*
Author to whom correspondence should be addressed.
Remote Sens. 2022, 14(5), 1299; https://doi.org/10.3390/rs14051299
Submission received: 24 January 2022 / Revised: 1 March 2022 / Accepted: 3 March 2022 / Published: 7 March 2022
(This article belongs to the Section Remote Sensing in Geology, Geomorphology and Hydrology)

Abstract

:
The technique of interferometric synthetic aperture radar (InSAR) is increasingly employed for landslide detection over large areas, even though the limitations of initial InSAR analysis results have been well acknowledged. Steep terrain in mountainous areas may cause geometric distortions of SAR images, which could affect the accuracy of InSAR analysis results. In addition, due to the existence of massive ground deformation points in the initial InSAR analysis results, accurate landslide recognition from the initial results is challenging. To efficiently identify potential landslide areas from the ascending–descending SAR datasets, this paper presents a novel interpretation approach to analyze the initial time-series InSAR analysis results. Within the context of the proposed approach, SAR visibility analysis, conversion analysis of deformation rates obtained from the time-series InSAR analysis, and spatial analysis and statistics tools for cluster extraction are incorporated. The effectiveness of the proposed approach is illustrated through a case study of landslide identification in Danba, a county in Sichuan, China. The potential landslide regions in the study area are identified based on the interpretation of small baseline subset InSAR (SBAS-InSAR) results, obtained with ascending–descending Sentinel-1A datasets. Finally, on the basis of the field survey results, a total of 21 landslides are detected in the potential landslide regions identified, through which the results obtained from the proposed interpretation approach are tested.

1. Introduction

With accelerated population growth and limited land resources, human settlements and activities have gradually expanded to mountainous areas susceptible to landslides [1]. As a result, landslides have led to huge loss of life and property around the world every year. For example, the Maierato landslide, which occurred on 15 February 2010 in Calabria, Southern Italy, caused the destruction of a main road and the loss of several hectares of farmland [2]; the Xinmo landslide on 24 June 2010 in Mao County, Sichuan, China, buried 64 buildings with 10 fatalities and 73 people missing [3]; and the Xiaoba landslide on 27 August 2014 in Fuquan, Guizhou, China, damaged 77 residences with 45 casualties [4]. Hence, effective identification and forecasting of landslides play a vital role in risk management and mitigation in mountainous regions.
The identification of landslides in remote areas with steep and mountainous terrain is quite challenging. In the context of the traditional approaches, the potential landslides are identified based upon field surveys of geomorphologic evidence and in situ observations [5]. Field surveys and in situ observations with tilting, level, total stations and Global Positioning Systems (GPS) can provide detailed characteristics of ground changes, but require extensive labor, economic investment, and time [6,7]. As such, these traditional means may only be suitable for detailed and high-quality landslide identification over small areas. Benefiting from advances in remote sensing technologies, potential landslides might be detected through geomorphological interpretation of remote sensing data such as optical and radar images [8,9,10]. Optical remote sensing technology may detect landslides through visual interpretation or deep learning-based image processing of ground surface features [11,12,13]. It should be mentioned that the quality of optical images is highly dependent upon the external condition at the time of acquisition (e.g., light, weather, and atmosphere), and the optical remote sensing technology could hardly detect slow-moving landslides with slight deformations. The technique of interferometric synthetic aperture radar (InSAR) could overcome the aforementioned limitations, which could detect the subtle ground deformation with high precision for the landslide identification over large areas [14,15,16].
With easy and free access to satellite synthetic aperture radar (SAR) data, such as SAR images acquired by ALOS PALSAR, ENVISAT ASAR, and Sentinel-1A/B, the technique of InSAR, particularly the time-series InSAR (TS-InSAR), is now increasingly applied to detect potential landslides in the mountainous region [17]. The previous studies indicated that the InSAR technology is a powerful tool for landslide identification in large-scale areas and could contribute to the construction of landslide inventory maps [6,18,19,20]. With the aid of the time-series analysis of ground surface deformations obtained with InSAR technology, the accuracy of the landslide susceptibility mapping, stability analysis, and risk assessment can also be improved [8,21,22]. Despite the wide application of the InSAR technology to landslide identification, there exist some challenges that may degrade its effectiveness in mountainous regions [10,23]. For example, the terrain could cause geometric distortions (e.g., foreshortening, layover, and shadow) of SAR images [24,25], due to the side-view imaging mode of satellite radar. The distribution of geometric distortion regions in the SAR images depends upon the local terrain characteristics and the acquisition direction of the satellite radar. To avoid this problem, SAR visibility analysis is often performed on multi-track SAR images, then effective ground deformation data in non-geometric distortion areas that are obtained from the TS-InSAR analysis are adopted for landslide identification [15,26,27]. Further, the technique of InSAR could only obtain the component of the ground deformation along the line-of-sight (LOS) direction of the satellite radar [18,23,28,29]. To derive the true three-dimensional (3-D) displacement vector of the ground surface, at least three SAR datasets with different LOS directions are required; whereas, if there is only one or two independent SAR datasets available in the study area, additional assumptions about ground motion are required to construct the real surface deformation information. As the overall deformation of most landslides reported tends to move downward along the slope direction, the ground deformation along the LOS direction, obtained by InSAR technology, is often converted into that along the steepest slope for ease of effective landslide identification [15,17,23,28,29]. The converted ground deformation could provide a reasonable measure of slope deformation in the absence of adequate SAR datasets.
With the aid of the TS-InSAR technique, such as the persistent scatterer interferometry (PSI) technique and the SBAS-InSAR technique, a large number of measurement points (MPs) could be identified within a wide coverage. The effective extraction of useful information for landslide identification from multiple MPs requires close collaboration between geologists and experts from remote sensing. In order to detect landslides automatically, various spatial analysis and statistics tools on the geographic information system (GIS) platform, such as buffer, hot spot analysis, and kernel density estimation, have been developed to analyze deformation rates of MPs in TS-InSAR analysis results [20,30,31,32,33,34,35,36]. Among the various approaches, hot spot analysis and buffer are relatively popular. The hot spot analysis could be adopted for locating MPs with high or low deformation rates from the TS-InSAR analysis results. The buffer method can automatically cluster adjacent MPs within a specified distance according to a prespecified deformation rate threshold. However, these spatial analysis and statistics tools were often adopted to analyze the initial TS-InSAR analysis results, without addressing the impact of the terrain visibility of SAR images and the limitation of InSAR technology (e.g., obtaining ground surface deformation rates along the LOS direction of the satellite radar, not the true 3-D ground deformation rates) [32,33,34]. In summary, there is space for improvement, and a novel interpretation method of SAR data for landslide identification is warranted.
It is acknowledged that, for areas with less than three SAR datasets, the converted ground surface deformation along the steepest slope provides more reliable information on the slope stability, and the MPs with good visibility can be more suitable for the spatial analysis and thus landslide identification. In such a situation, an interpretation approach, which is composed of the SAR visibility analysis, the conversion analysis of deformation rates obtained from the TS-InSAR analysis, and the spatial analysis and statistics tools for cluster extraction, is proposed in this paper. The interpretation approach adopts a standardized implementation procedure that is very suitable for users who are not familiar with SAR data. With the proposed approach, the effective information from a large number of MPs of the TS-InSAR analysis results can be extracted efficiently for landslide identification, and a map of potential landslide regions can be easily constructed in the study area, which provides valuable information for the geohazard and risk management. The rest of this paper is organized as follows. First, the principle and key components of the proposed interpretation approach are briefly introduced, and the implementation procedure of the proposed approach is provided. Second, a case study of landslide identification in Danba, China is undertaken and the results are tested based on the field survey results, through which the effectiveness of the proposed approach is demonstrated. Finally, the concluding remarks are provided.

2. Methodology and Implementation Procedure of the Proposed Approach

The key components, including SAR visibility analysis, conversion analysis of deformation rates obtained from the TS-InSAR analysis, and spatial analysis and statistics tools for cluster extraction and the implementation procedure of the proposed approach are introduced.

2.1. Principle and Main Components of the Proposed Approach

In reference to Figure 1, the proposed interpretation approach of ascending–descending SAR data for landslide recognition mainly consists of the following three components. First, the SAR visibility analysis is conducted based on a recently improved R-index model [25], through which the areas with good SAR visibility are identified and a large number of MPs in the areas with good SAR visibility could be obtained from the TS-InSAR analysis. Second, a conversion analysis of the obtained deformation rates is undertaken, through which the ground surface deformation rates of the MPs along the LOS direction of the satellite radar are converted into those along the steepest slope such that the deformation of the concerned slope could be better characterized. Third, clusters of MPs with significant ground movements are identified, utilizing the spatial analysis and statistics tools on the GIS platform, and these areas can readily be recognized as potential landslide regions.

2.1.1. Improved R-index Model for SAR Visibility Analysis

According to the acquisition direction of the satellite radar with respect to the imaged terrain, three types of geometric distortions might be induced in SAR images, in terms of the foreshortening, layover, and shadow [37]. In the foreshortening region of SAR images, slopes dipping towards the satellite radar are compressed, and such slopes are imaged with poor resolutions and the detected surface deformation could be inaccurate. The other two types of geometric distortion regions in SAR images are the areas with poor terrain visibility, which cannot be monitored by the TS-InSAR technique. Among the various terrain visibility analysis methods, a recently improved R-index model by the authors [25], which is calculated from the orientation parameters of the satellite LOS (in terms of incidence angle and azimuth) and the terrain parameters (in terms of slope and aspect), can be more effective in detecting the layover regions in SAR images. Thus, the recently improved R-index model is adopted in this approach for identifying the areas with good SAR visibility and extracting the related MPs in TS-InSAR analysis results. According to Ren et al. [25] the improved R-index, denoted as R-index(im), is formulated as follows.
R - i n d e x ( i m ) = sin { θ + arctan [ tan ( α ) × cos ( φ - β ) ] } × S h × L a × F a
where θ is the incidence angle of the satellite LOS; φ is the azimuth angle of the satellite LOS; α is the slope of the terrain; β is the aspect of the terrain; Sh is the shadow coefficient, the value of which is 0 in the shadow region while that in the other region is 1.0; La is the layover coefficient, the value of which is 0 in the active layover and near passive regions while that in the other region is 1.0; and Fa is the far passive layover coefficient, the value of which is 0 in the active layover and passive layover regions while that in the other region is 1.0. The shadow coefficient (Sh), layover coefficient (La), and far passive layover coefficient (Fa) can be calculated using the hillshade model in ArcGIS, and more information about the three coefficients can be found in Notti et al. [30] and Ren et al. [25].
Note that the calculated value of the improved R-index, R-index(im), is between 0 and 1.0, based on which the visibility of an area can be evaluated: (1) if R-index(im) is greater than or equal to sin(θ) (i.e., R-index(im) ≥ sin(θ)), the related area is an area with good visibility; (2) if R-index(im) is between 0 and sin(θ) (i.e., 0 < R-index(im) < sin(θ)), the corresponding area is a foreshortening region and the visibility is medium; and (3) if R-index(im) is equal to 0 (i.e., R-index(im) = 0), the related area is a layover or shadow region and the visibility is poor.

2.1.2. Conversion Analysis of Deformation Rates Obtained from the TS-InSAR Analysis

According to Colesanti and Wasowski [17], the effectiveness of InSAR technology to monitor the ground surface deformation of a slope could be strongly affected by the terrain parameters (i.e., slope α and aspect β) and the orientation parameters of the satellite LOS (i.e., incidence angle θ and azimuth φ). Figure 2 depicts an imaging scenario with the satellite in ascending mode and the slope dipping away from the radar, through which the limitation of the InSAR technology in acquiring the ground surface deformation can be easily illustrated. As mentioned above, the ground surface deformation rate obtained from the TS-InSAR analysis results can only capture the component of the true ground surface deformation rate projected to the LOS direction of the satellite radar. However, the overall deformation of most landslides reported tends to move downward along the slope directions. For ease of improved landslide mapping, mathematical formulations were developed by Colesanti and Wasowski [17], Cascini et al. [15], and Herrera et al. [29] to calculate the deformation rate along the steepest slope direction from the ground surface deformation rate obtained from the TS-InSAR analysis. In this study, the mathematical formulation in Colesanti and Wasowski [17] and Herrera al. [29] is adopted for the conversion analysis of the deformation rates obtained from the TS-InSAR analysis, the formulation of which is provided below.
V s l o p e = V L O S / λ V
λ V = sin ( θ ) × cos ( α ) × cos ( φ β ) + cos ( θ ) × sin ( α )
where Vslope is the deformation rate along the steepest slope direction; VLOS is the ground surface deformation rate along the LOS direction of the satellite radar, which can be derived from the TS-InSAR analysis directly; and λV is the conversion coefficient from VLOS to Vslope, the value of which is between 0 to 1.0. Note that when the value of λV is close to 0, the calculated Vslope tends to infinity. To avoid this anomalous solution, the minimum absolute value of λV is often set to be not less than 0.3 [29,38]. In other words, λV is rounded to 0.3 when it ranges from 0 and 0.3, while λV is rounded to −0.3 when it ranges from −0.3 and 0.

2.1.3. Cluster Extraction of MPs Using Spatial Analysis and Statistics Tools

In general, landslides are located in areas covered by MPs with deformation rates exceeding a specified threshold value in the context of the TS-InSAR analysis [17,21]. However, due to the heterogeneity of the measurements with various SAR images, the determination of the threshold value of deformation rate is site-specific and there is no fixed regulation on defining a stable threshold value [30]. Nevertheless, the MPs located within the ranges of the potential landslides, obtained from the TS-InSAR analysis, tend to cluster. Compared to the determination of the threshold value of deformation rates and decision of whether the deformation rates of MPs exceed the threshold, the spatial statistics approach (e.g., hot spot analysis) is thought to be a more effective method for the rapid detection of landslides or areas affected by landslides [32]. Although the sign of deformation rates of MPs in the TS-InSAR analysis results represents the direction, the deformation rates are treated as a scalar in spatial statistics. Hot spot analysis such as the Getis-Ord Gi* statistic could help statistically identify significant spatial clusters of MPs with high deformation rates (known as hot spots) and low deformation rates (known as cold spots) [39,40]. Thus, Getis-Ord Gi* statistic-based hot spot analysis is employed in this study for identifying the clusters of MPs with significant ground movements, formulated as follows [32].
G i * ( d ) = x j + x i - n i j x ¯ s * ( n × n i j ) - n i j 2 / ( n - 1 ) 0.5
where n is the total number of MPs; nij is the number of MPs centered at the ith MP within the searching distance of d, namely the summation of MP at site i and its neighboring MPs (i = 1, 2, ···, n; j = 1, 2, ···, nij); x is the deformation rates recorded by the MP (in terms of Vslope in this study); x ¯ and s * are the mean and the standard deviation of the surface deformation rates of the whole MPs, respectively; and Gi*(d) is the calculated statistic, in terms of the z-score, of the ith MP given the searching distance of d. The calculation method of the searching distance d is referred to Lu et al. [32]. It is noted that the threshold z-score of each MP corresponding to the statistical significance of clustering at 90% (p-value = 0.10), 95% (p-value = 0.05), and 99% (p-value = 0.01) is ±1.65, ±1.96, and ±2.58, respectively.
Noises in SAR images might be processed by the TS-InSAR technique into some isolated MPs with significant ground displacements. To eliminate the influence of these noises, Meisina et al. [31] proposed the definition of “anomalous areas” and concluded that potential landslides or areas affected by landslides should consist of clusters with a minimum of three MPs (characterized by significant ground movements) and a maximum distance of 50 m. Buffer, a spatial analysis tool in ArcGIS, can be adopted to create polygons containing clusters of MPs with large ground displacements within a specified distance. According to the number of MPs and geometry of the polygons generated by the Buffer, anomalous areas and non-landslide isolated MPs could be screened out easily, then the potential landslides or areas affected by landslides can readily be identified.

2.2. Procedure for Implementing the Proposed Interpretation Approach

As shown in Figure 1, the procedure for implementing the proposed approach is summarized in the following steps.
Step 1: Process the ascending and descending SAR image datasets of the concerned area, utilizing the TS-InSAR technique, for obtaining two sets of MPs with the ground surface deformation rates. Note that these two sets of MPs are basic inputs to the proposed approach.
Step 2: Evaluate the visibility of ascending and descending SAR images based on the terrain parameters and the orientation parameters of the satellite LOS, with the improved R-index model introduced in Section 2.1.1. The orientation parameters of the satellite LOS can be available from the metadata files generated from SAR images, and the slope (α) and aspect (β) of the terrain can be calculated from the digital elevation model (DEM). Note that a DEM with a higher resolution is preferred in the SAR visibility analysis.
Step 3: Extract MPs in the good visibility areas of these two SAR image datasets, and then merge these two sets of MPs to form into a new dataset. It should be noted that the good visibility areas in the ascending and descending SAR images (of the study area) may partially overlap, thus the MPs in the coincident area with a small R-index(im) value should be removed.
Step 4: Convert the surface deformation rate along the LOS direction VLOS of the MPs, in the dataset obtained in Step 3, into the deformation rate along the steepest slope direction Vslope with the formulation provided in Section 2.1.2. Although upward displacements may occur at the foot of landslides, the overall displacement vector of landslides remains downhill oriented, thus the MPs with positive Vslope values (or upward movement) should be discarded.
Step 5: Conduct spatial statistic of the Vslope of the MPs, obtained in Step 4, with hot spot analysis in ArcGIS. As the value of Vslope is non-positive, in the context of the hot spot analysis, the hot spots generally correspond to MPs with high values of Vslope, representing stable areas, whereas the cold spots generally correspond to MPs with low values of Vslope, representing unstable areas. Some nonsignificant spot clusters can be derived from the hot spot analysis, and the deformation rate of the MPs in these clusters is not significant; thus, these clusters cannot be classified as potential landslides or areas affected by landslides.
Step 6: Extract the MPs corresponding to the cold spots with a confidence level greater than or equal to 99% of the hot spot analysis results, obtained in Step 5, to form into a new dataset. The adopted confidence interval of cold spots is from Lu et al. [20], the value of which is fairly high to ensure that the MPs in the obtained new dataset all have relatively large surface deformations. Build the buffer of each MPs in the new dataset at a fixed distance of 50 m in ArcGIS and then merge the intersecting buffers into new polygons. Here, a polygon that consists of clusters with a minimum of three MPs is classified as a potential landslide area [31].

3. Application of the Proposed Approach: Landslide Identification in Danba

A case study of landslide identification in Danba, a county on the southeastern edge of the Qinghai–Tibet Plateau, China, is conducted in this section to demonstrate the effectiveness of the proposed interpretation approach for landslide identification; this case study could also serve as an illustrative application of the proposed method.

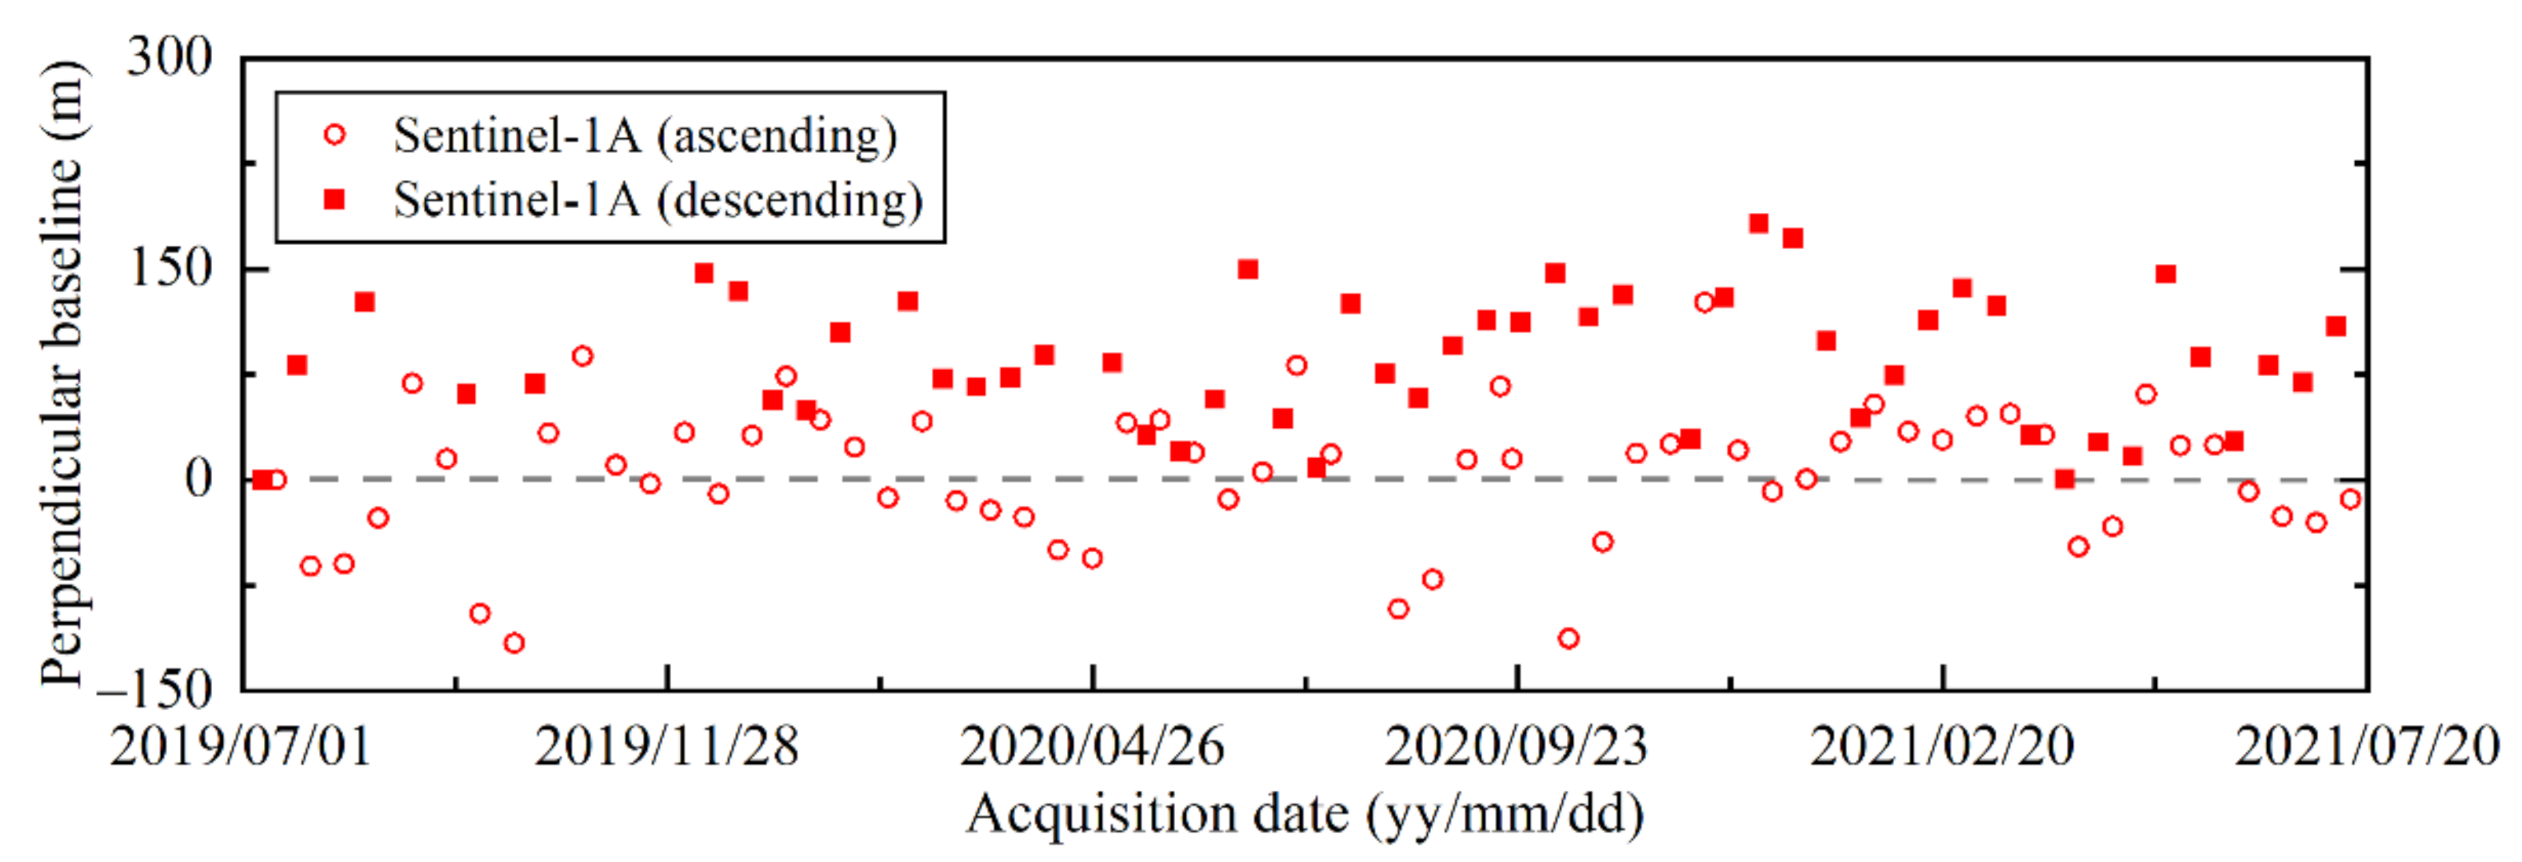
3.1. The Geological Setting of the Study Area and the Parameters of the Adopted SAR Data

As shown in Figure 3, the study area is situated in the central area of Danba, Sichuan, China (101°18′16″~102°11′56″E, 30°23′36″~31°23′13″N), covering an area of about 1258 km2. The topography of the study area is mainly characterized by steep terrains and alpine valleys with elevations ranging from 1704 m to greater than 5400 m. The valleys in the eastern, middle, and northern parts of the study area are mostly predominantly asymmetric V-shaped, while those in the northwest and southern parts are relatively gentle and mostly U-shaped. The lithology in the study area mainly consists of Quaternary sediments, Sinian metamorphic rocks, Tertiary carbonaceous slate, silty slate, and a small amount of deep metamorphic rocks. The outcrops are severely eroded [41]. The climate in the study area is the Qinghai–Tibet plateau monsoon climate, with an average annual rainfall of 600 mm, which is mainly concentrated in the rainy season from May to September [42,43]. There are several rivers in the study area that flow into the Dadu River, which runs through the whole study area from north to south, with an average annual discharge of 743 m3/s. Plenty of landslides have occurred on the banks of the Dadu River and its tributaries, attributed to the geological setting and the changes in the global climate since the Quaternary. Due to the limited land resources, many buildings have been built on landslide deposits or alluvial fans [44]. Thus, the safety of local residents and buildings has long been threatened by landslide hazards, and landslide identification in this area is of vital importance.
For demonstration purposes, two sets of interferometric wide-swath (IW) mode, VV polarization, single-look complex (SLC) products of C-band Sentinel-1A datasets are studied to detect the unstable slopes or landslides in the study area, the orbit information of which are ascending scenes (path 26 frames 94 and 99) and descending scenes (path 135 frame 488). The acquisition dates and perpendicular baselines of the two sets of SAR images are provided in Figure 4. All SAR images acquired by Sentinel-1A can be downloaded from the Copernicus Open Access Hub and the NASA Distributed Active Archive Center at the Alaska Satellite Facility. The coverage areas of these two sets of SAR images are depicted in Figure 3, and the orientation parameters of the related satellite LOSs are tabulated in Table 1.

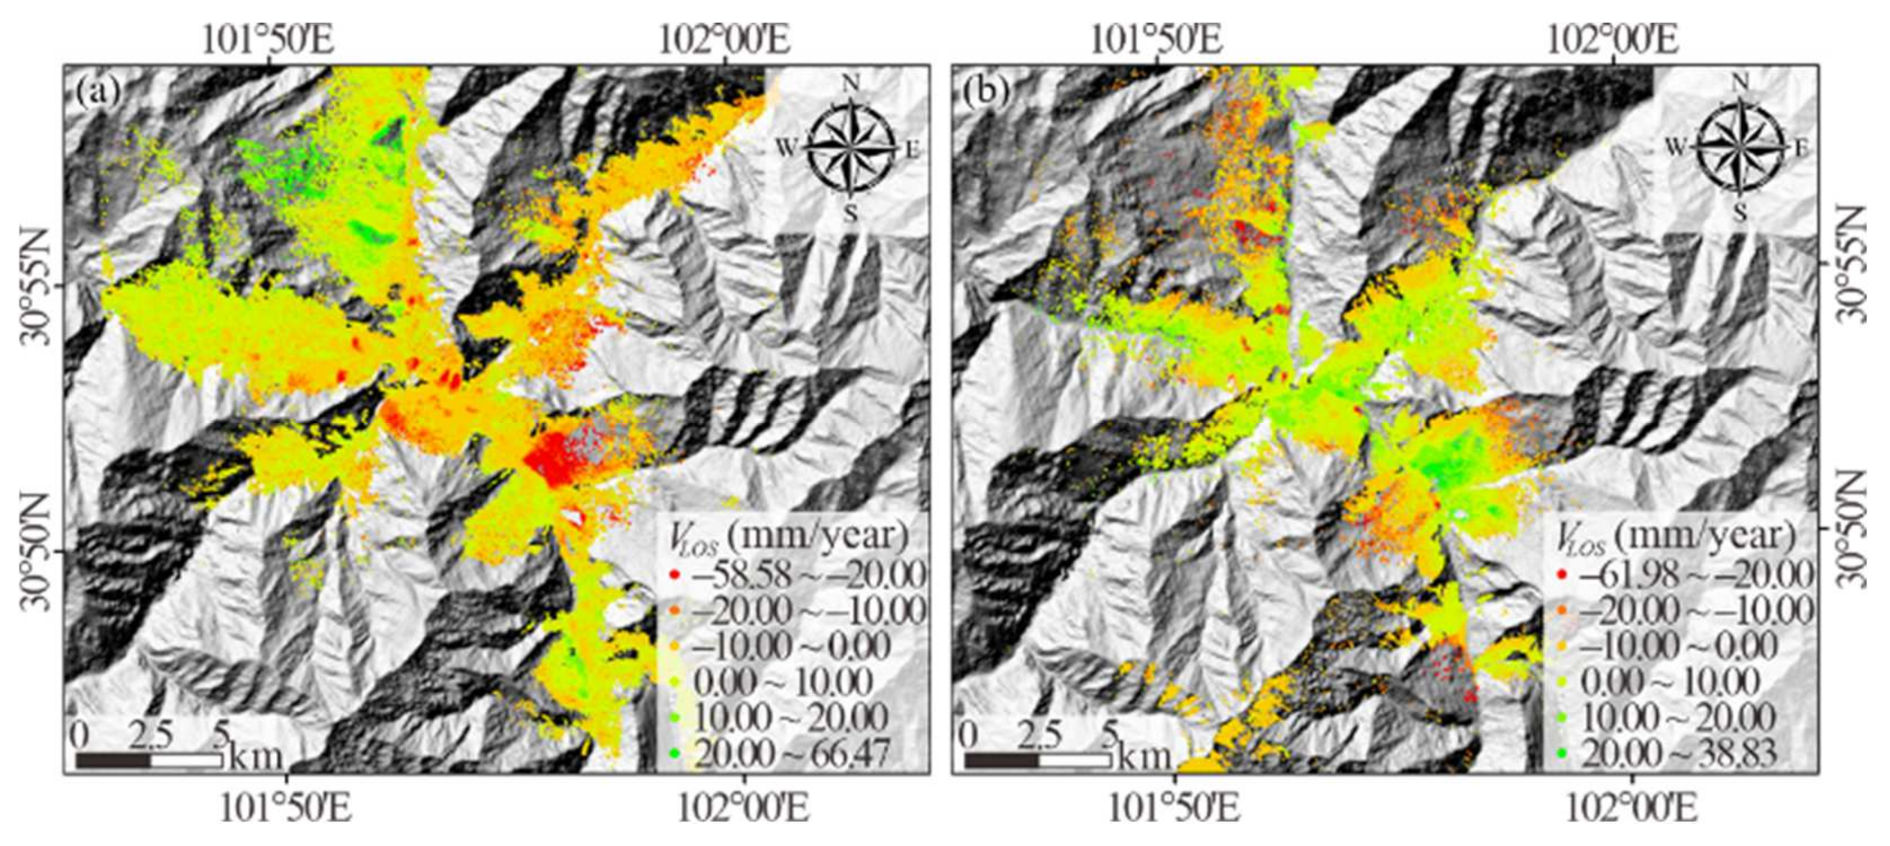
3.2. Surface Deformation Monitoring in the Study Area with SBAS-InSAR Technique

SBAS-InSAR technique is a typical TS-InSAR technique that is widely employed for ground surface deformation monitoring and landslide identification. The basic principle of the SBAS-InSAR technique is to generate differential interferograms from SAR image pairs with short spatial-temporal baselines to obtain the time series ground surface deformations; more detailed information about this technique is referred to Berardino et al. [45]. In this study, the SBAS-InSAR technique is adopted to process the ascending and descending Sentinel-1A datasets for monitoring the surface deformation in the study area, and the implementation procedures of the SBAS-InSAR technique are processed using ENVI SARscape. The interferograms are generated with a maximum spatial baseline of 200 m and a temporal baseline of 120 days, and the generated interferometric combinations of the two datasets are illustrated in Figure 5. The SBAS-InSAR module of the ENVI SARscape can automatically select the master image to ensure that all slave image pairs are well coregistered to the master image. Finally, the Shuttle Radar Topography Mission (SRTM) DEM of Danba with a resolution of about 30 m/pixel from the National Aeronautics and Space Administration is input into the SBAS-InSAR module to remove the topographic phase and geocode the output result.
The maps of the ground surface deformation rate along the LOS direction VLOS of the study area obtained from the two Sentinel-1A datasets are illustrated in Figure 6 (see Step 1 in Section 2.2). A total of 369,066 MPs are generated from the ascending Sentinel-1A dataset with an average density of 293 MPs/km2, whereas 205,779 MPs are generated from the descending Sentinel-1A dataset with an average density of 163 MPs/km2. Thus, the density of MPs obtained by the ascending dataset is about twice that obtained by the descending dataset. The surface deformation rate values obtained by the ascending dataset vary from −58.58 mm/year to 66.47 mm/year, while those by the descending dataset vary from −61.98 mm/year to 38.83 mm/year. Note that the positive deformation rate indicates that the ground moves towards the satellite radar while the negative deformation rate indicates that the ground moves away from the satellite radar.

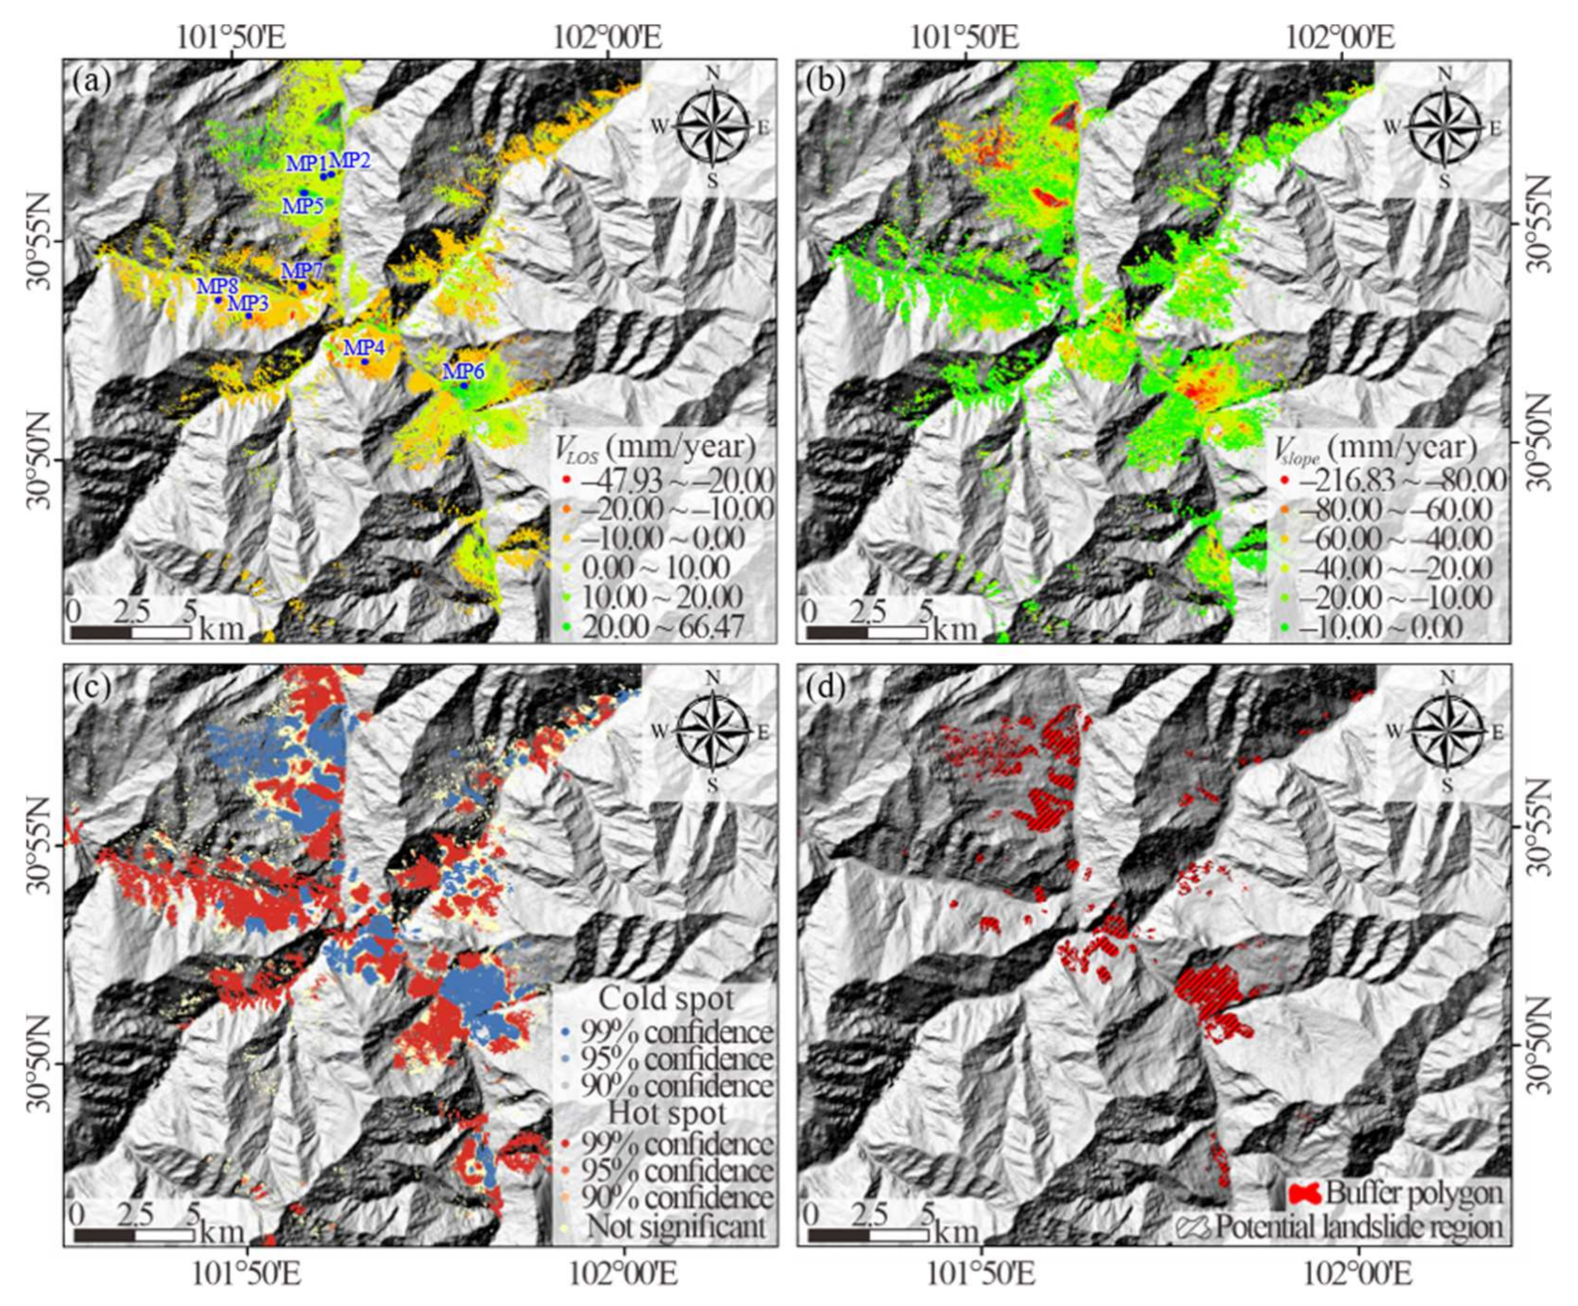
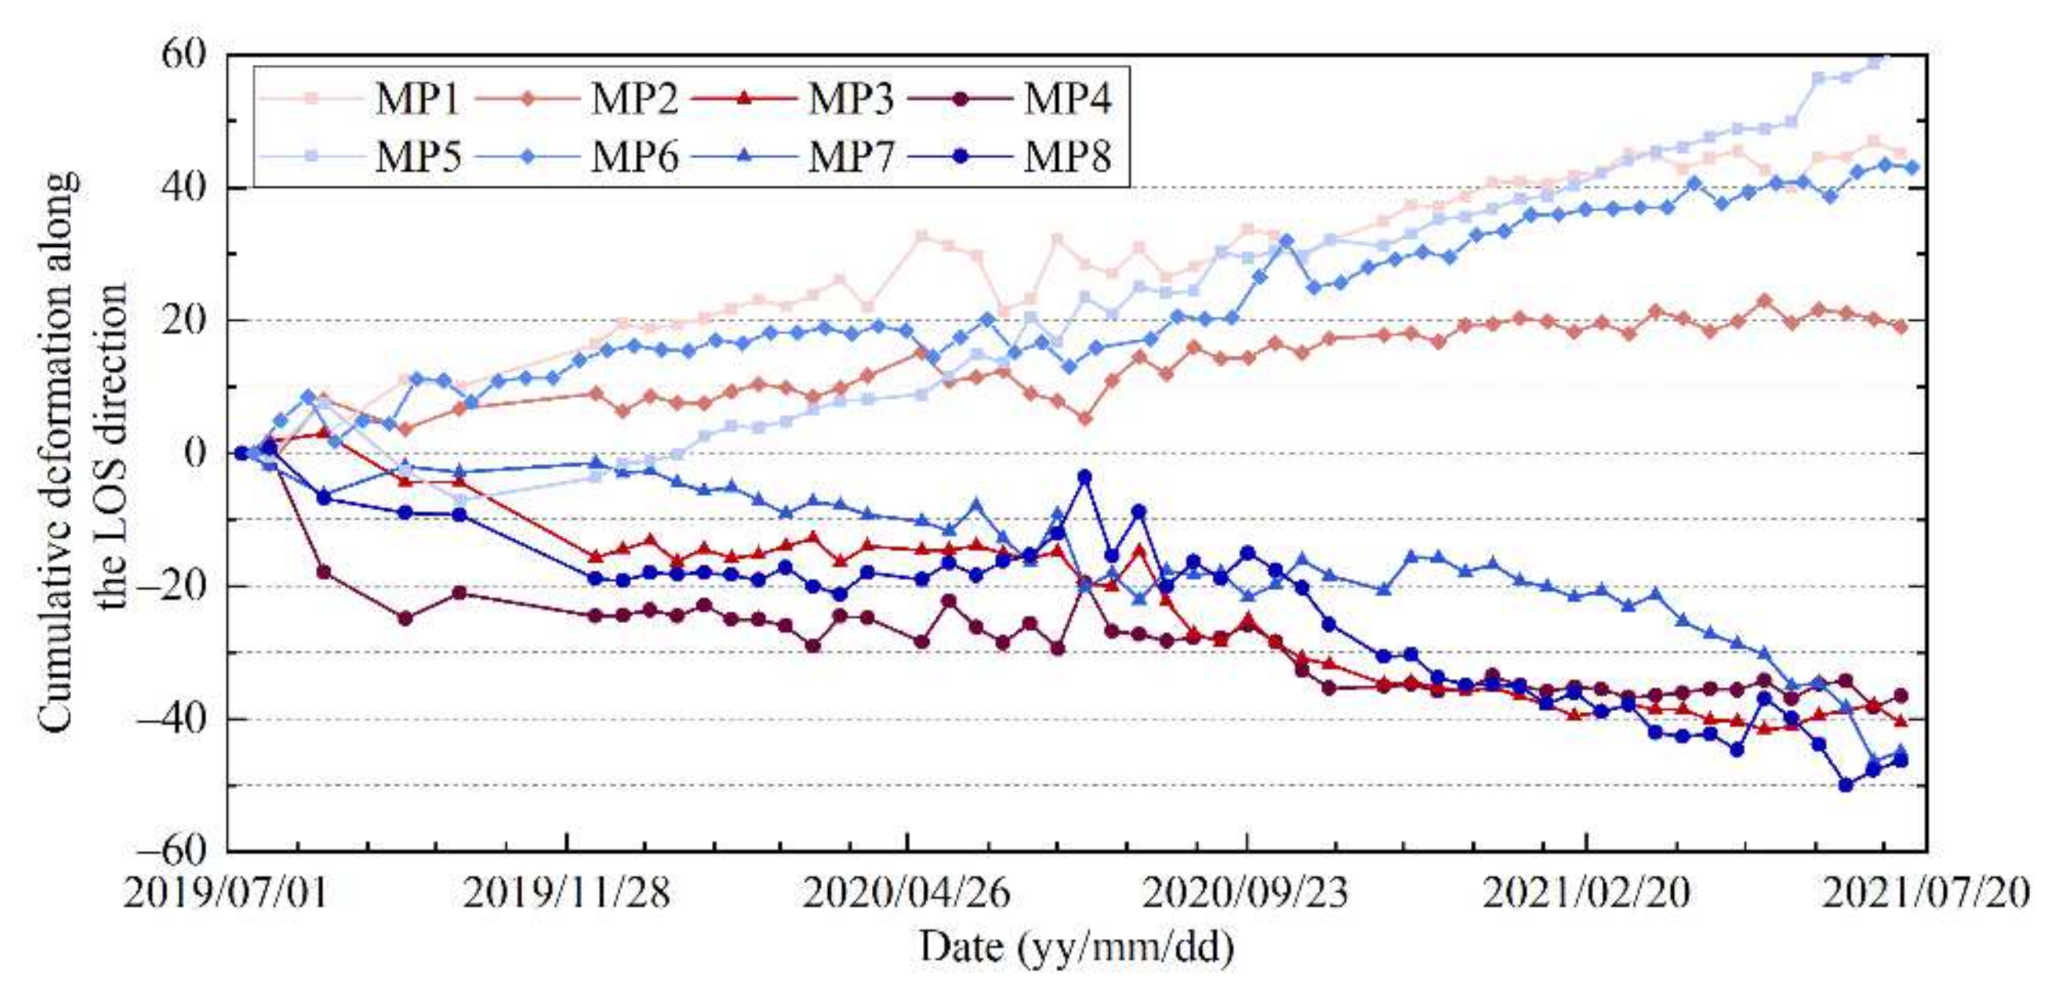
3.3. Landslide Identification in the Study Area with the Proposed Interpretation Approach

Figure 7 depicts the SAR visibility analysis results of the ascending and descending Sentinel-1A images in the study area (see Step 2 in Section 2.2). According to the mathematical formulation of the improved R-index model (see Equation (1)), the sine value of the incidence angle of the satellite LOS, in terms of sin(θ), is the threshold value for locating the area with good visibility. As such, the related threshold values of the ascending and descending Sentinel-1A images are 0.67 and 0.62, respectively. On the basis of comparisons between the obtained R-index(im) values and the threshold values, the terrain visibility in the study area can be evaluated. The assessment results are provided in Figure 7, and the statistical information of the areas with different levels of SAR visibility is listed in Table 2.
The plots in Figure 7 show that these two sets of SAR images can lead to a significant difference in the terrain visibility. Meanwhile, a single set of SAR images (either ascending or descending SAR images) is not sufficient for landslide detection in the whole study area. For example, only 46.59% of the total area (i.e., 586.07 km2) can be categorized into the area with good visibility adopting ascending images, whereas, only 47.64% of the total area (i.e., 599.31 km2) can be categorized into the area with good visibility adopting descending images. Next, the areas with good visibility, in these two sets of SAR images, are integrated, through which the influence of geometric distortions on the landslide identification in the study area could be alleviated. As an outcome, 94.05% of the total area (i.e., 1183.15 km2) in the study area could be categorized into the area with good visibility. Then, a total of 112,874 MPs are obtained in the good visibility areas of these two SAR image datasets, and these MPs are merged into a new dataset, as illustrated in Figure 8a (see Step 3 in Section 2.2). This new dataset could provide more comprehensive information on the ground surface deformation in the study area.
Figure 8b shows the conversion analysis results of the deformation rates of the MPs shown in Figure 8a (see Step 4 in Section 2.2). Here, the obtained deformation rate along the steepest slope direction Vslope ranges from −216.83 mm/year to 0 mm/year in the study area. Through such a conversion analysis, the influence of the orientation parameters of the satellite LOS on the effectiveness of the InSAR technology in monitoring the ground surface deformation could be eliminated [38], and the deformation rates of the MPs obtained from the two sets of SAR images can be unified. It is noted that a negative value of the converted deformation rate Vslope signals that the ground moves downward along the steepest slope direction. Compared to the initial SBAS-InSAR analysis results (see Figure 6), the deformation rate along the steepest slope direction shown in Figure 8b could capture the deformation mode of various slopes in the study area more effectively. For example, all the MPs tend to move downward along the slope direction, which is more consistent with the intuition and the state of knowledge on slope deformations.
Figure 8c depicts the hotspot analysis result of the obtained surface deformation rate along the steepest slope direction Vslope of MPs (see Step 5 in Section 2.2). The searching distance of d for the Getis-Ord Gi* statistic in this study is determined to be 201 m. Here, 33,584 MPs with low deformation rates are grouped into the cold spots with a confidence level greater than or equal to 99%, which account for 29.75% of the total MPs shown in Figure 8a. The areas covered by these MPs in the study area tend to have relatively large surface deformations, which might be landslides or areas affected by landslides. Figure 8d shows the buffer analysis results of the MPs grouped into cold spots in the study area (see Step 6 in Section 2.2). A total of 884 polygons have been identified, and the number of MPs contained in these polygons ranges from 1 to 10,094, and the largest polygon covers an area of 1.24 km2. As mentioned above, these polygons capture the areas with large surface deformations detected by the InSAR technology, and the polygons consisting of three or more MPs can be classified as a potential landslide area [31]. Then, landslides or areas affected by landslides in the study area can readily be identified with a total area of about 19.60 km2; the results are also illustrated in Figure 8d. The potential landslide regions are mainly distributed on the banks of rivers, which is in line with the records in the literature [41,44,46].

4. Testing of the Landslide Identification Results in Danba through Field Surveys

An in-depth field survey was conducted in the study area from 25 September to 5 October 2021, through which the landslide identification results in Danba can be tested and the effectiveness of the proposed interpretation approach is demonstrated. In this section, testing of the landslide identification results obtained in the previous section is conducted.
According to the locations and ranges of the potential landslides or areas affected by landslides shown in Figure 8d, an in-depth field survey was conducted in these regions. As a result, a total of 21 real landslides can be identified in the study area, as illustrated in Figure 9. As can be seen, these landslides are mainly distributed on the banks of the Dadu River and its tributaries. Thus, river erosions and water level fluctuations in these rivers may be important triggering factors causing landslides in the study area. A comparison of potential landslide regions and real landslides in Figure 9 indicates that the results of the proposed interpretation approach and the field survey results are comparable. The area of the potential landslide regions with real landslides is 11.16 km2, accounting for about 56.94% of the total potential landslide area. Thus, the effectiveness of the proposed approach can be demonstrated. Figure 10 depicts the panoramic view of these real landslides taken by Unmanned Aerial Vehicle (UAV). The general information of these real landslides (in terms of the latitude and longitude, area, slope, and aspect) is tabulated in Table 3. The field survey results of these real landslides are discussed below.
Landslides No. 1–4, shown in Figure 10a–d, belong to the Niexia landslide complex, which is well documented in the literature [46]. Landslide No. 1 has been stabilized by anti-slide piles and is now in a stable state; however, some road slopes have collapsed, partially due to the influence of rainfall. The road G248, which is one of the main connections in Danba, is located at the toe of this landslide, an, a 30 m long road is affected by the ground subsidence and the width of the related pavement crack is up to 10 cm (see Figure 11a). Loadings from heavy-duty trucks and river erosions at the slope toe are the possible triggering factors for road subsidence. Landslide No. 2 is located in the Jiaju village, which is a famous tourist attraction with Tibetan-style buildings. The development of local tourism would be threatened by this landslide, which has received widespread attention in recent years [46,47,48]. This landslide is divided into northern and southern parts with a boundary shape similar to a capital M (see Figure 10b). A crack with a width of about 10 cm is found on the road at the rear of the northern part of this landslide (see Figure 11b), and multiple cracks are detected on the gravel retaining wall at the rear of the southern part of the landslide (see Figure 11c). Landslides No. 3 and 4 are adjacent to each other on the right bank of the Dajinchuan River; the front edges of these two landslides are both eroded by the river, thus local sliding phenomena could be observed. Landslide No. 5, the boundary of which is fairly clear (see Figure 10e), is situated on the opposite side of Landslide No. 4, and a scarp with a width of about 2 m can be discovered at the rear of this landslide (see Figure 11d).
Landslides No. 6 and 7, shown in Figure 10f,g, are located in Yuezha, a township in the northeast of the study area. It should be noted that due to the influence of dense vegetation, the geomorphic features at the site of Landslide No. 6 cannot be acquired by the UAV survey, the Google Earth™ image of this landslide archived in November 2019, shown in Figure 11e, is analyzed in this study. As can be seen, the overall shape of this landslide is tongue-shaped with gullies on both edges of this landslide, and a few upwardly curved cracks are developed at the rear of this landslide. Landslide No. 7 is a shallow landslide situated along the country road from the Yuejiaba village to the Balong village. Thus, road construction might have led to the degradation of the stability of the original slopes, which might be treated as a triggering factor for this landslide. Consequently, there are many collapsed and/or slipped rock deposits on the road slopes (see Figure 11f,g), and cracks and damages of the road can be observed.
Landslides No. 8 and 9, shown in Figure 10h,i, are located in the center of Danba. The slope at the site of Landslide No. 8 is steep and its surface is covered by loose rock debris. A few shallow slips are found at the front edge of this landslide (see Figure 11h,i), which might be caused by long-term river erosion. Gullies exist on both sides of Landslide No. 9 and an arc-shaped scarp is discovered at the back edge of this landslide. Note that Landslide No. 9 has been stabilized by anti-slide piles and anchor rods. The field survey shows that there is no sign of deformation within the road on the landslide, indicating that this landslide is relatively stable and the stabilization effect of anti-slide piles and anchor rods is deemed satisfactory. As the landslide area is mainly covered by loose massive Quaternary sediments, shallow slips still occur near the head of this landslide (see Figure 11j).
Landslides No. 10 and 11, illustrated in Figure 10j, belong to the Suopo landslide complex, which is also reported in the existing literature [46]. Suopo landslide complex, facing southwest with a slope angle of 20°~30°, is a huge deposit slope in Suopo, another township in the study area. A total of three scarps (indicated by yellow dashed lines in Figure 11k) can be discovered at the site of Landslide No. 10. The main scarp, with a width of about 3 m, is located at the rear of this landslide, whereas the left two are located within the landslide body. Many Tibetan-style buildings are distributed within the area of Landslide No. 11. Due to the ground deformations of the landslide, some ancient watchtowers on the landslide body are inclined (see Figure 11l). It is worth noting that a shallow landslide, called Landslide No. 12, is detected at the upper part of the Suopo landslide complex. The road to the Basuo village is severely damaged by this landslide and parts of this road have become unavailable for vehicles (see Figure 11m).
Apart from the Suopo landslide complex discussed above, Landslides No. 13, 14, 15, 16, and 17, shown in Figure 10k–m, are also located in the Suopo township. Landslide No. 13, with an obvious geometry boundary, is located along the road to the Dongfeng village, and Landslides No. 14 and 15, two unconsolidated soil landslides, are adjacent to this landslide, as shown in Figure 10k. Landslide No. 16 is located in the Dongfeng village, and the road on this landslide is seriously damaged. For example, a 5 m long road is covered by rock debris, the guardrail slips about 1 m (see Figure 11n), and a ground surface displacement of about 5 cm is discovered within a 2 m long road (see Figure 11o). Landslide No. 17 is located in the Zuodong village. Two gullies pass through the central area of this landslide, lots of cracks are detected within the road on this landslide, a 9 m long road collapses (see Figure 11p,q), and the road is encroached by the slipped rock mass at a turn (see Figure 11r). Landslide No. 18, shown in Figure 10n, is the Zhongluxiang landslide complex, which is also documented in the existing literature [43]. This landslide complex, which is 630 m long and 570 m wide, is located on the left bank of the Xiaojinchuan River. There are still signs of deformation in the bottom area of the landslide complex. During the field investigation, a newly occurred rock avalanche composed of soft quartz-mica schist blocked the road (see Figure 11s).
Further, there are some landslides identified near the villages in the study area. Shown in Figure 10o is Landslide No. 19, which is located on the right bank of the Dadu River near the Gezong village. There are gullies on both sides of this landslide; meanwhile, some small-scale slope failures occur in the middle and lower parts of this landslide (see Figure 11t). A small shallow landslide, called Landslide No. 20, is detected near the Jiniu village, as shown in Figure 10u. The roads on this landslide are cracked and collapsed in many places (see Figure 11u–w). According to the observations of road slope failures (see Figure 11x,y), it can be inferred that road construction could be one of the main factors leading to the formation of this landslide. Landslide No. 21, shown in Figure 10q, is located along the country road to the Masuozhai village. Possibly affected by river erosions, a small slope failure with an obvious boundary is formed at the toe of this landslide (Figure 11z).

5. Discussions

According to the results presented above, real landslides are identified in the potential landslide regions of the study area through field surveys; thus, the effectiveness of the proposed interpretation approach can be demonstrated. The output of the potential landslide area map clearly indicates the areas where landslides may occur, which could be vital for the identification and risk management of landslide hazards. As the input data of the proposed approach are TS-InSAR analysis results, some limitations of InSAR technology can be reflected from the intermediate results generated during the interpretation process and the interpretation result. For example, in Figure 6, the deformation rates of MPs in the two maps can be different in the same area, which leads to challenges in adopting the initial TS-InSAR analysis results to assess the true ground deformation. This observation clearly shows the influence of the orientation parameters of the satellite LOS on the effectiveness of the InSAR technology in monitoring the ground surface deformation, and it also highlights the significance of the conversion analysis of the surface deformation rates of the TS-InSAR analysis results in landslide identification. According to the landslide source areas of Dadu River Basin identified by Zou et al. [49] (see Figure 12a), landslides are widely distributed in the study area. As the TS-InSAR technique requires input SAR image pairs with good coherence, it is suitable for detecting slow-moving landslides. The loose rock and soil mass in the landslide source areas are susceptible to rapid sliding under the effect of heavy rainfall, which often causes the decoherence of the SAR images. However, rapidly deforming landslides often produce bare surfaces, and thus can be easily identified from the optical remote sensing images [12,13] or SAR intensity images [50,51]. Hence, the combined use of multiple remote sensing technologies may provide a promising approach for detecting multiple types of landslides.
Even though the interpretation of the TS-InSAR analysis results obtained with ascending–descending SAR data using the proposed approach could provide effective information for landslide identification, there is space for improvement. The comparison of potential landslide regions and real landslides in Figure 9 indicates the area of landslides or areas affected by landslides identified with the proposed approach is larger than that of the real landslides identified through field surveys. The occurrence of these non-landslide areas might not be harshly taken as an error of the interpretation of SBAS-InSAR analysis results. For example, the ground surface deformation induced by many other non-landslide factors (e.g., human activities, rainfall, and other geological disasters) could also be processed by the InSAR technology into MPs with large deformation rates. In the study area, the loose gravel on the steep hillsides is easily displaced by rainfall, and road construction in mountainous areas often results in lots of suspended surfaces on road slopes, which are extremely susceptible to deformation. In addition, in the initial TS-InSAR results, the cumulative surface deformations along the LOS direction of some MPs (e.g., MPs 1–4 in Figure 8a) could not be neglected in the potential landslide regions, while no real landslide can be identified in field investigations, which might be attributed to the fact that these areas might become stable prior field surveys (see Figure 13). Due to the steep terrain and dense vegetation in the study area, manual surveys and UAV photography may not be sufficient to collect evidences of some dormant landslides. For example, Dong et al. [46] detected a total of 17 landslides in the Dadu River Basin with ALOS PALSAR data from 2006 to 2011 (see Figure 12b), which are in good agreement with the true landslides depicted in Figure 9. However, the Niexiaping landslide, in the potential landslide region where M1 and M2 are located, was not identified during our field investigations. Thus, the cumulative deformation of MPs in the TS-InSAR analysis results is helpful to determine the trend of the ground surface deformation. Compared with dormant landslides, the landslide areas with continuous deformation (e.g., MPs 5–8 in Figure 8a) require more monitoring and prevention (see Figure 13). The proposed approach may be improved through considering the cumulative deformation of MPs to obtain more useful information for landslide risk management.

6. Concluding Remarks

This paper presented an interpretation approach for landslide identification from the TS-InSAR analysis results obtained from ascending–descending SAR datasets. The proposed approach mainly consists of three components, in terms of the SAR visibility analysis, the conversion analysis of deformation rates obtained from TS-InSAR analysis, and the spatial analysis and statistics tools for cluster extraction. With the proposed interpretation approach, the effective information from a large number of MPs in the TS-InSAR analysis results can be extracted effectively and efficiently for landslide identification. To depict the effectiveness of the proposed interpretation approach, a case study of landslide identification in Danba, China, is conducted. The following conclusions are reached based upon the results presented.
(1)
With the proposed interpretation approach, the potential landslides or areas affected by landslides in the study area were successfully identified from the SBAS-InSAR analysis results of ascending and descending Sentinel-1A datasets. The potential landslides are mainly distributed on the banks of the Dadu River and its tributaries.
(2)
Field surveys were undertaken in the study area and a total of 21 landslides were confirmed in the potential landslide areas obtained with the proposed interpretation approach, through which the landslide identification results were tested and the effectiveness of the proposed approach was illustrated. According to the failure characteristics of these landslides, river erosion and road construction might be important factors triggering these landslides.
(3)
Note that the input data of the proposed approach are TS-InSAR analysis results, the obtained map of potential landslide regions in the study area is helpful for the identification of slow-moving landslides, and in order to detect other types of landslides, the integration of multiple remote sensing technologies may provide a promising approach. The cumulative deformation of MPs in the TS-InSAR analysis results is also helpful to determine the trend of the ground surface deformation, and the proposed approach may also be improved through considering the cumulative deformation of MPs.

Author Contributions

Conceptualization, T.R. and W.G.; methodology, T.R. and F.Z.; investigation, T.R. and Z.C.; writing—original draft preparation, T.R. and W.G.; writing—review and editing, W.G. and L.G.; funding acquisition, W.G. All authors have read and agreed to the published version of the manuscript.

Funding

This research was funded by the National Natural Science Foundation of China (Grant No. 41977242) and the Major Program of National Natural Science Foundation of China (Grant No. 42090055).

Institutional Review Board Statement

Not applicable.

Informed Consent Statement

Not applicable.

Data Availability Statement

The SAR images acquired by Sentinel-1A were downloaded from the Copernicus Open Access Hub and the NASA Distributed Active Archive Center at the Alaska Satellite Facility (https://earthdata.nasa.gov/eosdis/daacs/asf) (10 September 2021). The Shuttle Radar Topography Mission (SRTM) DEM with a resolution of about 30 m/pixel were downloaded from the National Aeronautics and Space Administration (https://data.nasa.gov) (10 September 2021).

Conflicts of Interest

The authors declare no conflict of interest.

References

  1. Gong, W.; Juang, C.H.; Wasowski, J. Geohazards and human settlements: Lessons learned from multiple relocation events in Badong, China-Engineering geologist’s perspective. Eng. Geol. 2021, 285, 106051. [Google Scholar] [CrossRef]
  2. Conte, E.; Donato, A.; Pugliese, L.; Troncone, A. Analysis of the Maierato landslide (Calabria, Southern Italy). Landslides 2018, 15, 1935–1950. [Google Scholar] [CrossRef]
  3. Su, L.J.; Hu, K.H.; Zhang, W.F.; Wang, J.; Lei, Y.; Zhang, C.L.; Peng, C.; Pasuto, A.; Zheng, Q.H. Characteristics and triggering mechanism of Xinmo landslide on 24 June 2017 in Sichuan, China. J. Mt. Sci. 2017, 14, 1689–1700. [Google Scholar] [CrossRef]
  4. Lin, F.; Wu, L.Z.; Huang, R.Q.; Zhang, H. Formation and characteristics of the Xiaoba landslide in Fuquan, Guizhou, China. Landslides 2018, 15, 669–681. [Google Scholar] [CrossRef]
  5. Morelli, S.; Pazzi, V.; Frodella, W.; Fanti, R. Kinematic reconstruction of a deep-Seated gravitational slope deformation by geomorphic analyses. Geosciences 2018, 8, 26. [Google Scholar] [CrossRef] [Green Version]
  6. Bekaert, D.P.; Handwerger, A.L.; Agram, P.; Kirschbaum, D.B. InSAR-Based detection method for mapping and monitoring slow-moving landslides in remote regions with steep and mountainous terrain: An application to Nepal. Remote Sens. Environ. 2020, 249, 111983. [Google Scholar] [CrossRef]
  7. Qu, F.; Qiu, H.; Sun, H.; Tang, M. Post-Failure landslide change detection and analysis using optical satellite Sentinel-2 images. Landslides 2021, 18, 447–455. [Google Scholar] [CrossRef]
  8. Zhao, F.; Meng, X.; Zhang, Y.; Chen, G.; Su, X.; Yue, D. Landslide susceptibility mapping of karakorum highway combined with the application of SBAS-InSAR technology. Sensors 2019, 19, 2685. [Google Scholar] [CrossRef] [Green Version]
  9. Mohan, A.; Singh, A.K.; Kumar, B.; Dwivedi, R. Review on remote sensing methods for landslide detection using machine and deep learning. Trans. Emerg. Telecommun. Technol. 2021, 32, e3998. [Google Scholar] [CrossRef]
  10. Wasowski, J.; Bovenga, F. Remote sensing of landslide motion with emphasis on satellite multi-Temporal interferometry applications: An overview. Landslide Hazards Risks Disasters 2022, 365–438. [Google Scholar] [CrossRef]
  11. Travelletti, J.; Delacourt, C.; Allemand, P.; Malet, J.P.; Schmittbuhl, J.; Toussaint, R.; Bastard, M. Correlation of multi-Temporal ground-Based optical images for landslide monitoring: Application, potential and limitations. ISPRS J. Photogramm. Remote Sens. 2012, 70, 39–55. [Google Scholar] [CrossRef] [Green Version]
  12. Kurtz, C.; Stumpf, A.; Malet, J.P.; Gançarski, P.; Puissant, A.; Passat, N. Hierarchical extraction of landslides from multiresolution remotely sensed optical images. ISPRS J. Photogramm. Remote Sens. 2014, 87, 122–136. [Google Scholar] [CrossRef] [Green Version]
  13. Cheng, Z.; Gong, W.; Tang, H.; Juang, C.H.; Deng, Q.; Chen, J.; Ye, X. UAV photogrammetry-Based remote sensing and preliminary assessment of the behavior of a landslide in Guizhou, China. Eng. Geol. 2021, 289, 106172. [Google Scholar] [CrossRef]
  14. Hilley, G.E.; Bürgmann, R.; Ferretti, A.; Novali, F.; Rocca, F. Dynamics of slow-Moving landslides from permanent scatterer analysis. Science 2004, 304, 1952–1955. [Google Scholar] [CrossRef] [Green Version]
  15. Cascini, L.; Fornaro, G.; Peduto, D. Advanced low-and full-Resolution DInSAR map generation for slow-Moving landslide analysis at different scales. Eng. Geol. 2010, 112, 29–42. [Google Scholar] [CrossRef]
  16. Chen, Q.; Cheng, H.; Yang, Y.; Liu, G.; Liu, L. Quantification of mass wasting volume associated with the giant landslide Daguangbao induced by the 2008 Wenchuan earthquake from persistent scatterer InSAR. Remote Sens. Environ. 2014, 152, 125–135. [Google Scholar] [CrossRef]
  17. Colesanti, C.; Wasowski, J. Investigating landslides with space-Borne Synthetic Aperture Radar (SAR) interferometry. Eng. Geol. 2006, 88, 173–199. [Google Scholar] [CrossRef]
  18. Zhao, C.; Lu, Z.; Zhang, Q.; de La Fuente, J. Large-Area landslide detection and monitoring with ALOS/PALSAR imagery data over Northern California and Southern Oregon, USA. Remote Sens. Environ. 2012, 124, 348–359. [Google Scholar] [CrossRef]
  19. Rosi, A.; Tofani, V.; Tanteri, L.; Stefanelli, C.T.; Agostini, A.; Catani, F.; Casagli, N. The new landslide inventory of Tuscany (Italy) updated with PS-InSAR: Geomorphological features and landslide distribution. Landslides 2018, 15, 5–19. [Google Scholar] [CrossRef] [Green Version]
  20. Lu, P.; Bai, S.; Tofani, V.; Casagli, N. Landslides detection through optimized hot spot analysis on persistent scatterers and distributed scatterers. ISPRS J. Photogramm. Remote Sens. 2019, 156, 147–159. [Google Scholar] [CrossRef]
  21. Cigna, F.; Bianchini, S.; Casagli, N. How to assess landslide activity and intensity with Persistent Scatterer Interferometry (PSI): The PSI-Based matrix approach. Landslides 2013, 10, 267–283. [Google Scholar] [CrossRef] [Green Version]
  22. Di Maio, C.; Fornaro, G.; Gioia, D.; Reale, D.; Schiattarella, M.; Vassallo, R. In situ and satellite long-Term monitoring of the Latronico landslide, Italy: Displacement evolution, damage to buildings, and effectiveness of remedial works. Eng. Geol. 2018, 245, 218–235. [Google Scholar] [CrossRef]
  23. Wasowski, J.; Bovenga, F. Investigating landslides and unstable slopes with satellite Multi Temporal Interferometry: Current issues and future perspectives. Eng. Geol. 2014, 174, 103–138. [Google Scholar] [CrossRef]
  24. Dai, K.; Li, Z.; Tomás, R.; Liu, G.; Yu, B.; Wang, X.; Cheng, H.; Chen, J.; Stockamp, J. Monitoring activity at the Daguangbao mega-Landslide (China) using Sentinel-1 TOPS time series interferometry. Remote Sens. Environ. 2016, 186, 501–513. [Google Scholar] [CrossRef] [Green Version]
  25. Ren, T.; Gong, W.; Bowa, V.M.; Tang, H.; Chen, J.; Zhao, F. An Improved R-Index Model for Terrain Visibility Analysis for Landslide Monitoring with InSAR. Remote Sens. 2021, 13, 1938. [Google Scholar] [CrossRef]
  26. Guo, R.; Sumin, L.I.; Chen, Y.N.; Li, X.; Yuan, L. Identification and monitoring landslides in longitudinal range-Gorge region with InSAR fusion integrated visibility analysis. Landslides 2021, 18, 551–568. [Google Scholar] [CrossRef]
  27. Cascini, L.; Fornaro, G.; Peduto, D. Analysis at medium scale of low-Resolution DInSAR data in slow-moving landslide-Affected areas. ISPRS J. Photogramm. Remote Sens. 2009, 64, 598–611. [Google Scholar] [CrossRef]
  28. Plank, S.; Singer, J.; Minet, C.; Thuro, K. Pre-Survey suitability evaluation of the differential synthetic aperture radar interferometry method for landslide monitoring. Int. J. Remote Sens. 2012, 33, 6623–6637. [Google Scholar] [CrossRef]
  29. Herrera, G.; Gutiérrez, F.; García-Davalillo, J.C.; Guerrero, J.; Notti, D.; Galve, J.P.; Fernández-Merodo, J.A.; Cooksley, G. Multi-sensor advanced DInSAR monitoring of very slow landslides: The Tena Valley case study (Central Spanish Pyrenees). Remote Sens. Environ. 2013, 128, 31–43. [Google Scholar] [CrossRef]
  30. Notti, D.; Herrera, G.; Bianchini, S.; Meisina, C.; García-Davalillo, J.C.; Zucca, F. A methodology for improving landslide PSI data analysis. Int. J. Remote Sens. 2014, 35, 2186–2214. [Google Scholar] [CrossRef]
  31. Meisina, C.; Zucca, F.; Notti, D.; Colombo, A.; Cucchi, A.; Savio, G.; Giannico, C.; Bianchi, M. Geological interpretation of PSInSAR data at regional scale. Sensors 2008, 8, 7469–7492. [Google Scholar] [CrossRef] [PubMed] [Green Version]
  32. Lu, P.; Casagli, N.; Catani, F.; Tofani, V. Persistent Scatterers Interferometry Hotspot and Cluster Analysis (PSI-HCA) for detection of extremely slow-Moving landslides. Int. J. Remote Sens. 2012, 33, 466–489. [Google Scholar] [CrossRef]
  33. Solari, L.; Del Soldato, M.; Montalti, R.; Bianchini, S.; Raspini, F.; Thuegaz, P.; Bertolo, D.; Tofani, V.; Casagli, N. A Sentinel-1 based hot-Spot analysis: Landslide mapping in north-Western Italy. Int. J. Remote Sens. 2019, 40, 7898–7921. [Google Scholar] [CrossRef]
  34. Bianchini, S.; Cigna, F.; Righini, G.; Proietti, C.; Casagli, N. Landslide hotspot mapping by means of persistent scatterer interferometry. Environ. Earth Sci. 2012, 67, 1155–1172. [Google Scholar] [CrossRef]
  35. Zhang, J.; Zhu, W.; Cheng, Y.; Li, Z. Landslide Detection in the Linzhi–Ya’an Section along the Sichuan–Tibet Railway Based on InSAR and Hot Spot Analysis Methods. Remote Sens. 2021, 13, 3566. [Google Scholar] [CrossRef]
  36. Zhu, K.; Xu, P.; Cao, C.; Zheng, L.; Liu, Y.; Dong, X. Preliminary identification of geological hazards from songpinggou to feihong in mao county along the minjiang river using SBAS-InSAR technique integrated multiple spatial analysis methods. Sustainability 2021, 13, 1017. [Google Scholar] [CrossRef]
  37. Cigna, F.; Bateson, L.B.; Jordan, C.J.; Dashwood, C. Simulating SAR geometric distortions and predicting Persistent Scatterer densities for ERS-1/2 and ENVISAT C-Band SAR and InSAR applications: Nationwide feasibility assessment to monitor the landmass of Great Britain with SAR imagery. Remote Sens. Environ. 2014, 152, 441–466. [Google Scholar] [CrossRef] [Green Version]
  38. Zhang, Y.; Meng, X.; Jordan, C.; Novellino, A.; Dijkstra, T.; Chen, G. Investigating slow-Moving landslides in the Zhouqu region of China using InSAR time series. Landslides 2018, 15, 1299–1315. [Google Scholar] [CrossRef]
  39. Getis, A.; Ord, J.K. The Analysis of Spatial Association by Use of Distance Statistics. Geogr. Anal. 1992, 24, 127–145. [Google Scholar] [CrossRef]
  40. Ord, J.K.; Getis, A. Local spatial autocorrelation statistics: Distributional issues and an application. Geogr. Anal. 1995, 27, 286–306. [Google Scholar] [CrossRef]
  41. Yan, Y.; Cui, Y.; Liu, D.; Tang, H.; Li, Y.; Tian, X.; Zhang, L.; Hu, S. Seismic signal characteristics and interpretation of the 2020 “6.17” Danba landslide dam failure hazard chain process. Landslides 2021, 18, 2175–2192. [Google Scholar] [CrossRef]
  42. Chen, F.; Deng, J.H.; Gao, M.Z.; Wang, D.K.; Meng, Y.L.; Huang, R.T. Geological cause and stability evaluation of Moluocun landslide, Danba county. Rock Soil Mech. 2012, 33, 1781–1786. [Google Scholar]
  43. Bai, Y.J.; Wang, Y.S.; Ge, H.; Tie, Y.B. Slope structures and formation of rock-soil aggregate landslides in deeply incised valleys. J. Mt. Sci. 2020, 17, 316–328. [Google Scholar] [CrossRef]
  44. Li, M.H.; Zheng, W.M.; Chen, Q.G. Development characteristic of geological hazard in Danba County and its cause discussion. J. Nat. Disasters 2008, 17, 49–53. [Google Scholar]
  45. Berardino, P.; Fornaro, G.; Lanari, R.; Sansosti, E. A new algorithm for surface deformation monitoring based on small baseline differential SAR interferograms. IEEE Trans. Geosci. Remote Sens. 2002, 40, 2375–2383. [Google Scholar] [CrossRef] [Green Version]
  46. Dong, J.; Liao, M.; Xu, Q.; Zhang, L.; Tang, M.; Gong, J. Detection and displacement characterization of landslides using multi-Temporal satellite SAR interferometry: A case study of Danba County in the Dadu River Basin. Eng. Geol. 2018, 240, 95–109. [Google Scholar] [CrossRef]
  47. Yin, Y.; Zheng, W.; Liu, Y.; Zhang, J.; Li, X. Integration of GPS with InSAR to monitoring of the Jiaju landslide in Sichuan, China. Landslides 2010, 7, 359–365. [Google Scholar] [CrossRef]
  48. Ao, M.; Zhang, L.; Shi, X.; Liao, M.; Dong, J. Measurement of the three-dimensional surface deformation of the Jiaju landslide using a surface-Parallel flow model. Remote Sens. Lett. 2019, 10, 776–785. [Google Scholar] [CrossRef]
  49. Zou, Q.; Jiang, H.; Cui, P.; Zhou, B.; Jiang, Y.; Qin, M.; Liu, Y.; Li, C. A new approach to assess landslide susceptibility based on slope failure mechanisms. Catena 2021, 204, 105388. [Google Scholar] [CrossRef]
  50. Mondini, A.C. Measures of spatial autocorrelation changes in multitemporal SAR images for event landslides detection. Remote Sens. 2017, 9, 554. [Google Scholar] [CrossRef] [Green Version]
  51. Santangelo, M.; Cardinali, M.; Bucci, F.; Fiorucci, F.; Mondini, A.C. Exploring event landslide mapping using Sentinel-1 SAR backscatter products. Geomorphology 2022, 397, 108021. [Google Scholar] [CrossRef]
Figure 1. Key components and implementation procedure of the proposed interpretation approach of ascending–descending SAR data for landslide recognition.
Remotesensing 14 01299 g001
Figure 2. An imaging scenario with the satellite in ascending mode and the slope dipping away from the radar: (a) The azimuth angle of satellite LOS and terrain aspect; (b) The geometric relationship between satellite position and local terrain.
Remotesensing 14 01299 g002
Figure 3. Location of the study area and coverage areas of SAR datasets.
Remotesensing 14 01299 g003
Figure 4. Acquisition dates and perpendicular baselines of ascending–descending Sentinel-1A datasets (with respect to the earliest SAR image in each dataset).
Remotesensing 14 01299 g004
Figure 5. Generated interferometric combinations of the two datasets: (a) Ascending Sentinel-1A dataset; (b) Descending Sentinel-1A dataset.
Remotesensing 14 01299 g005
Figure 6. Ground surface deformation rate along the LOS direction VLOS in the study area obtained from the two SAR datasets: (a) Ascending Sentinel-1A dataset; (b) Descending Sentinel-1A dataset.
Remotesensing 14 01299 g006
Figure 7. SAR visibility analysis results of the SAR images in the study area: (a) Ascending Sentinel-1A images; (b) Descending Sentinel-1A images.
Remotesensing 14 01299 g007
Figure 8. Some results produced during implementing the proposed interpretation approach: (a) MPs obtained in the good visibility areas of the ascending–descending Sentinel-1A datasets; (b) Conversion analysis results of the deformation rates of the MPs; (c) Hotspot analysis result of the obtained deformation rate along the steepest slope direction Vslope of MPs.; and (d) Buffer analysis results of the MPs grouped into cold spots in the study area.
Remotesensing 14 01299 g008
Figure 9. Locations of the real landslides identified through field surveys in the study area.
Remotesensing 14 01299 g009
Figure 10. Panoramic views of the real landslides taken by the Unmanned Aerial Vehicle (UAV): Landslide Nos. 1–21 (aq).
Remotesensing 14 01299 g010
Figure 11. Onsite photos of the real landslides: (a) Landslide No. 1; (b,c) Landslide No. 2; (d) Landslide No. 5; (e) Landslide No. 6; (f,g) Landslide No. 7; (h,i) Landslide No. 8; (j) Landslide No. 9; (k) Landslide No. 10; (l) Landslide No. 11; (m) Landslide No. 12; (n,o) Landslide No. 16; (pr) Landslide No. 17; (s) Landslide No. 18; (t) Landslide No. 19; (uy) Landslide No. 20; and (z) Landslide No. 21.
Remotesensing 14 01299 g011
Figure 12. Landslide identification results obtained in previous studies: (a) Landslide source areas in Dadu River Basin (modified from [49]); (b) InSAR-derived LOS deformation rate maps for the upper reach of the Dadu River Basin (modified from [46]) (note: white boxes contain the names of the detected landslides).
Remotesensing 14 01299 g012
Figure 13. Cumulative deformations along the LOS direction of some MPs.
Remotesensing 14 01299 g013
Table 1. Orientation parameters of the satellite LOSs.
SAR SatelliteFlight DirectionRadar AzimuthRadar Incidence
Sentinel-1AAscending77.34°43.32°
Descending−77.26°38.34°
Table 2. Statistical information of the areas with different levels of SAR visibility.
Level of VisibilitySentinel-1A (Ascending)Sentinel-1A (Descending)
R-index(im)Area (km2)R-index(im)Area (km2)
Good visibility0.67~1.00586.070.62~1.00599.31
Medium visibility0.00~0.67462.160.00~0.62528.16
Poor visibility0.00209.770.00130.53
Table 3. General information of the real landslides detected from field surveys.
Landslide No.Latitude (°N)Longitude (°E)Slope (°)Aspect (°)Area (km2)
130.91101.8815~251050.02
230.93101.8715~251001.20
330.95101.8715~25900.74
430.96101.8825~401300.37
530.96101.8830~452660.08
630.93101.9320~451301.17
730.95101.9630~451770.06
830.88101.9020~402000.42
930.87101.9015~30500.27
1030.86101.9320~352360.32
1130.85101.9415~202270.98
1230.87101.9420~352000.02
1330.84101.9415~303100.02
1430.84101.9420~252900.001
1530.84101.9425~302600.005
1630.84101.9415~253070.29
1730.83101.9725~302802.18
1830.89101.9415~353006.21
1930.78101.9425~35600.64
2030.89101.8320~25400.05
2130.90101.8620~401300.02
Publisher’s Note: MDPI stays neutral with regard to jurisdictional claims in published maps and institutional affiliations.

