Article

Super-Resolving Ocean Dynamics from Space with Computer Vision Algorithms

by
Bruno Buongiorno Nardelli
1,*,
Davide Cavaliere
2,
Elodie Charles
3 and
Daniele Ciani
2
1
Consiglio Nazionale delle Ricerche, Istituto di Scienze Marine (CNR-ISMAR), 80133 Naples, Italy
2
Consiglio Nazionale delle Ricerche, Istituto di Scienze Marine (CNR-ISMAR), 00133 Rome, Italy
3
Collecte Localisation Satellites, 11 Rue Hermès, Parc Technologique du Canal, 31520 Ramonville Saint-Agne, France
*
Author to whom correspondence should be addressed.
Remote Sens. 2022, 14(5), 1159; https://doi.org/10.3390/rs14051159
Submission received: 17 January 2022 / Revised: 23 February 2022 / Accepted: 24 February 2022 / Published: 26 February 2022
(This article belongs to the Special Issue AI for Marine, Ocean and Climate Change Monitoring)

Abstract

:
Surface ocean dynamics play a key role in the Earth system, contributing to regulate its climate and affecting the marine ecosystem functioning. Dynamical processes occur and interact in the upper ocean at multiple scales, down to, or even less than, few kilometres. These scales are not adequately resolved by present observing systems, and, in the last decades, global monitoring of surface currents has been based on the application of geostrophic balance to absolute dynamic topography maps obtained through the statistical interpolation of along-track satellite altimeter data. Due to the cross-track distance and repetitiveness of satellite acquisitions, the effective resolution of interpolated data is limited to several tens of kilometres. At the kilometre scale, sea surface temperature pattern evolution is dominated by advection, providing indirect information on upper ocean currents. Computer vision techniques are perfect candidates to infer this dynamical information from the combination of altimeter data, surface temperature images and observing-system geometry. Here, we exploit one class of image processing techniques, super-resolution, to develop an original neural-network architecture specifically designed to improve absolute dynamic topography reconstruction. Our model is first trained on synthetic observations built from a numerical general-circulation model and then tested on real satellite products. Provided concurrent clear-sky thermal observations are available, it proves able to compensate for altimeter sampling/interpolation limitations by learning from primitive equation data. The algorithm can be adapted to learn directly from future surface topography, and eventual surface currents, high-resolution satellite observations.

1. Introduction

In the last decade, technological progress has opened new prospects for the application of deep-learning techniques in a wide range of fields. This revolutionary change originated from the concurrent increase of computational power at widely affordable costs and impressive growth of openly available data. Computer vision is one specific branch of artificial intelligence (AI) that is driving significant improvements thanks to the possibility to design and implement complex model architectures based on deep convolutional neural networks (CNN). Computer vision originally aimed to emulate the human capability to immediately discriminate objects and features in a picture or video, as well as to extrapolate/predict relevant information from partial or degraded input, either for recreational, medical, security or other commercial uses, e.g., for automated focusing on specific subjects in consumer and professional cameras, for semantic/instance segmentation and anomaly detection in medical imagery or in support of self-driving automated vehicles.
The Earth system research community is increasingly exploring and developing AI technologies to solve complex data processing and analysis problems and go beyond the present limitations of numerical models (see also [1]). Indeed, to discover the laws governing Earth system processes and better predict their evolution over several spatial and temporal scales, a combination of precise observations and theoretical/numerical models is needed [2]. In fact, even considering the significant increase in the number of acquisitions by remote sensing platforms and autonomous instruments, it will never be possible to describe and predict the state of the Earth system at all scales (or even of just one of its subsystems, such as the ocean) only through observed data. Satellite observations over the ocean, for example, only measure surface properties, with distinct temporal sampling and coverage depending on the sensor and mission. Conversely, information on the vertical distribution of properties along the water column can only be provided through in situ sensors that clearly lack the ability to simultaneously provide large spatial coverage and high space-time resolution. Empirical/statistical methodologies and historical data are thus often used to interpolate or reconstruct approximated 2D or 3D descriptions of ocean dynamics from a limited number of observed state variables, with poor to no physically driven constraints (e.g., [3]). On the other hand, full descriptions of the ocean state evolution (over a predefined set of scales) can be obtained through numerical models, still requiring a prior knowledge/guess of the initial state and of the forcings over time, as well as the parameterization of sub-grid physics. Due to the uncertainties in the initial conditions and parameterizations and the non-linearity of the dynamics, model predictions easily drift away from what is seen in the observations, unless observations are ingested within the simulation itself through data assimilation (DA), e.g., [4]. At present, DA is mostly based on probabilistic approaches, and it is also not rigorously tractable due to the huge number of variables and nonlinear processes involved, as well as the difficulty in simultaneously and properly characterizing model and observation errors.
Despite some scepticism due to the generally limited interpretability and explainability of complex neural networks, deep learning methods are perfect candidates to cope with the high-dimensional spaces, multiple processes, non-linear relations and noisy data involved in Earth system observations and models [5]. While it is beyond our scope to provide a comprehensive list of the ever-growing applications of AI algorithms to Earth system science, it is worth citing some of the most relevant objectives, which span from hybrid modelling approaches, such as the development of new sub-grid-scale parameterizations [6,7] and the improvement of DA techniques to be used in classical numerical circulation models [8,9], to the downscaling of low resolution models [10], to supervised learning approaches for data augmentation, filtering, interpolation or prediction [11,12,13,14,15,16,17,18], to the detection of dynamical features [19], to the set-up of neural networks for partial differential equation solution/identification and modelling of latent dynamics, e.g., [20,21,22,23,24]. Indeed, whenever sufficient information is available, physically informed neural network models can be designed to explicitly include physical constraints, for example, by building custom loss-functions that enforce the structure of the network to obey a known governing equation (through automatic differentiation), and/or by exploiting the similarities between residual networks and the numerical schemes used to integrate the ordinary differential equations that govern dynamical systems. However, sometimes sequential observations can merely resolve the large-scale dynamics, as high-resolution spatial snapshots are available only episodically and provide only limited information to describe (and directly learn) the evolution of small-scale processes. In those cases, alternative approaches can be tested to improve the dynamical reconstruction and eventually recover high-resolution information from existing data.
Actually, many advanced computer vision algorithms can be adapted to geoscientific analysis, making the most of past efforts dedicated to addressing similar problems. One such example is given by a specific class of techniques, known as super-resolution (SR), that aims to recover high-resolution (HR) details from low-resolution images [25]. In the single-image super-resolution algorithms, deep convolutional neural networks are optimized to identify the features of an image by looking at its different channels and learning how to recover the original features from their degraded versions. This is done by combining the translation invariance and locality properties of convolutional layers with the impressive learning properties of deep architectures coupled with non-linear activations. In computer vision applications, this problem is inherently ill-posed since multiple HR images could correspond to a single LR image, and the performance of the models is highly dependent on the extensiveness of the catalogue of images it was trained with. State-of-the-art super-resolution algorithms do achieve impressive results in the processing of blurred/low-resolution photographs, though, and some attempts to adapt them to Earth observation problems have already been carried out: DeepSD (Deep Statistical Downscaling), a stacked SR-CNN algorithm based on the early three-layer model by [26], has been applied to downscale Earth system model simulations, and CNN models have been tested for sea surface temperature (SST) and wind field downscaling, with positive results [27,28]).
Here, we aim to recover high-resolution sea surface dynamical features by combining low-resolution ocean absolute dynamic topography (ADT) fields based on satellite altimetry (resolving O(100 km) wavelengths) and high-resolution SST acquired by thermal imaging spaceborne radiometers (between O(1 km) and O(10 km) depending on the sensor). This represents a different problem with respect to simple model output downscaling or single variable super-resolution, as we want to combine the information provided by channels at both original and degraded resolution in a multi-channel image, taking advantage of the physical relations among the variables we include in the different channels. In fact, even if it only implies a weak constraint, our strategy includes physical considerations in the choice of the predictor variables, building upon the role of surface water mass advection in the local evolution of the SST [29], but we also aim to exploit the repetitiveness of satellite observing system geometries. We thus consider also the temporal SST variation and the ADT mapping error as additional predictors.
High-resolution observations of ocean dynamic topography through imaging sensors (thus ‘natively’ 2D), however, will not be available before the launch of the joint NASA/CNES/CSA ASC/UK Space Agency surface water and ocean topography (SWOT) mission, expected by the end of 2022, while more direct observations of surface currents could be provided by ESA Earth Explorer 10 Harmony mission only after 2027–2028, if present phase A, namely the design consolidation and feasibility studies, proves successful [30], or even later by SEASTAR ESA Earth Explorer 11 candidate mission [31]. As such, we rely here on an observing system simulation experiment (OSSE). In practice, we use the output of an ocean general circulation numerical model to simulate both predictor and target variables, considering that, in the future, our network can be trained directly with remotely sensed data. After training with OSSE data, our model can be applied to real altimeter-derived ADT and SST data in the test/prediction phase. In practice, learning first from primitive equation simulations and known observing-system geometry and successively testing over true observation-based products can also be interpreted as a means to assimilate model physics in our data-driven reconstruction. Presently, core estimates of ocean surface currents are obtained by measuring absolute dynamic topography (i.e., the surface height referenced to an empirical geoid) through radar altimeters installed on a constellation of polar-orbiting satellite platforms. Sea level observations are acquired by altimeters along a discrete number of tracks, and surface geostrophic currents are obtained by first interpolating the ADT onto a regular 2D grid [32] and then computing ADT gradients (geostrophy implies velocities are perpendicular to the pressure gradients associated with sea surface level differences, with an inverse dependence on the Coriolis parameter). ADT-interpolated products reach an effective resolution of O(100 km) at mid-latitudes [33], but recent studies [34,35] also revealed that many unresolved structures are aliased into larger structures and that the gridded altimetry products contain an unrealistic number of large mesoscale eddies. Hence, even for large scale eddies, having a typical wavelength larger than 100 km, the standard altimetry may be biased, with such large-scale bias mainly occurring in cyclonic eddies.
Altimeter-derived ADT maps can thus be thought of as a deformed view of true surface elevation, obtained through a transformation that combines the satellite observation geometry and the space-time surface elevation evolution effectively captured by the interpolation algorithm. Our objective is to set up a neural network that is able to learn the inverse mapping from our limited input ADT to the true sea surface elevation. To do that, we explicitly include as tentative predictors the low-resolution ADT field, the SST field and its temporal derivative, ∂SST/∂t, as well as the formal interpolation error (ΔADT) that is associated with the input ADT product (retrieved as part of the optimal interpolation algorithm), and we set the high-resolution ADT as our target. In fact, at the large scale, SST responds to air-sea fluxes and related upper layer mixing with the deeper oceanic layers, but when getting close to the mesoscale and sub-mesoscale dynamical range (namely at scales between a few kms and a few tens of km, over day-to-weeks timescales), a significant contribution to the local SST variations is given by horizontal advection (though vertical advection is also expected to play a significant role, especially at the sub-mesoscale, e.g., [36]). SST products obtained from thermal images provide synoptic high-resolution data up to (nominal) 1 km spatial resolution over wide portions of the ocean surface [37,38]. Even if their effective spatial resolution rarely exceeds a few kilometres to tens of kilometres, they allow an almost continuous monitoring of SST changes at daily intervals and longer timescales. As such, several past attempts to improve surface current retrieval have been based on the use of the sequential information provided by SST products, either through maximum cross-correlation techniques [39] or by directly considering tracers’ advection equation [40,41,42,43].
Our work exploits the data prepared for an OSSE that was originally designed for different objectives in the framework of the European Space Agency ocean CIRculation from ocean COLour observations (CIRCOL) project [44]. They consist of one year of synthetic, daily ADT and surface geostrophic currents data over the Mediterranean Basin. Full details explaining how we simulate the observing system geometry are reported in Section 2, where all pre-processing steps to prepare our training and test datasets are described. It must be stressed that for this OSSE, SST data have been assumed to be void-free and error-free, which is clearly not true, especially when looking at kilometre-scale features; so our work must be considered as a first exploratory step that will need to be significantly expanded for eventual operational applications.

2. Materials and Methods

2.1. Primitive Equation Model Data

The Mediterranean Forecasting System (MFS) is a hydrodynamic model for the Mediterranean Basin and the Atlantic Ocean off the Strait of Gibraltar [45]. Monthly to 15-minute instantaneous outputs of 3D horizontal currents and sea surface height (SSH), as well as monthly to hourly estimates of 3D temperature and salinity fields are available via the Copernicus Marine Service web portal (Product ID: MEDSEA-ANALYSIS-FORECAST-PHY-006-013). For the present study, we relied on daily outputs of SSH and SST, extracting information within the boundaries of the Mediterranean Basin (30 to 46° N and −6 to 37° E). These fields are provided on a 1/24° regular grid and 125 unequally spaced vertical levels. The simulations are based on the NEMO model (Nucleus for European Modelling of the Ocean) used in combination with Wave Watch-III for the wave component. The MFS simulations also account for data-assimilation of 2D satellite-derived SST, salinity vertical profiles, as well as along-track sea-level anomaly observations.

2.2. Satellite Absolute Dynamic Topography

The sea surface geostrophic currents were obtained from the Copernicus Marine Service and are derived from optimally interpolated absolute dynamic topography data merging observations from a constellation of radar altimeters. Such a constellation is composed of four to six altimeters in the 2008–2019 temporal range [32]. The geostrophic currents are provided as daily fields with nominal 1/8° horizontal resolution. The 2008–2019 time series was extracted. The corresponding Copernicus Marine Service product and dataset ID are SEALEVEL_MED_PHY_L4_REP_OBSERVATIONS_008_051/dataset-duacs-rep-medsea-merged-allsat-phy-l4, respectively (accessed on 1 March 2021 and now included as part of the SEALEVEL_EUR_PHY_L4_MY_008_068/cmems_obs-sl_eur_phy-ssh_my_allsat-l4-duacs-0.125deg_P1D dataset).

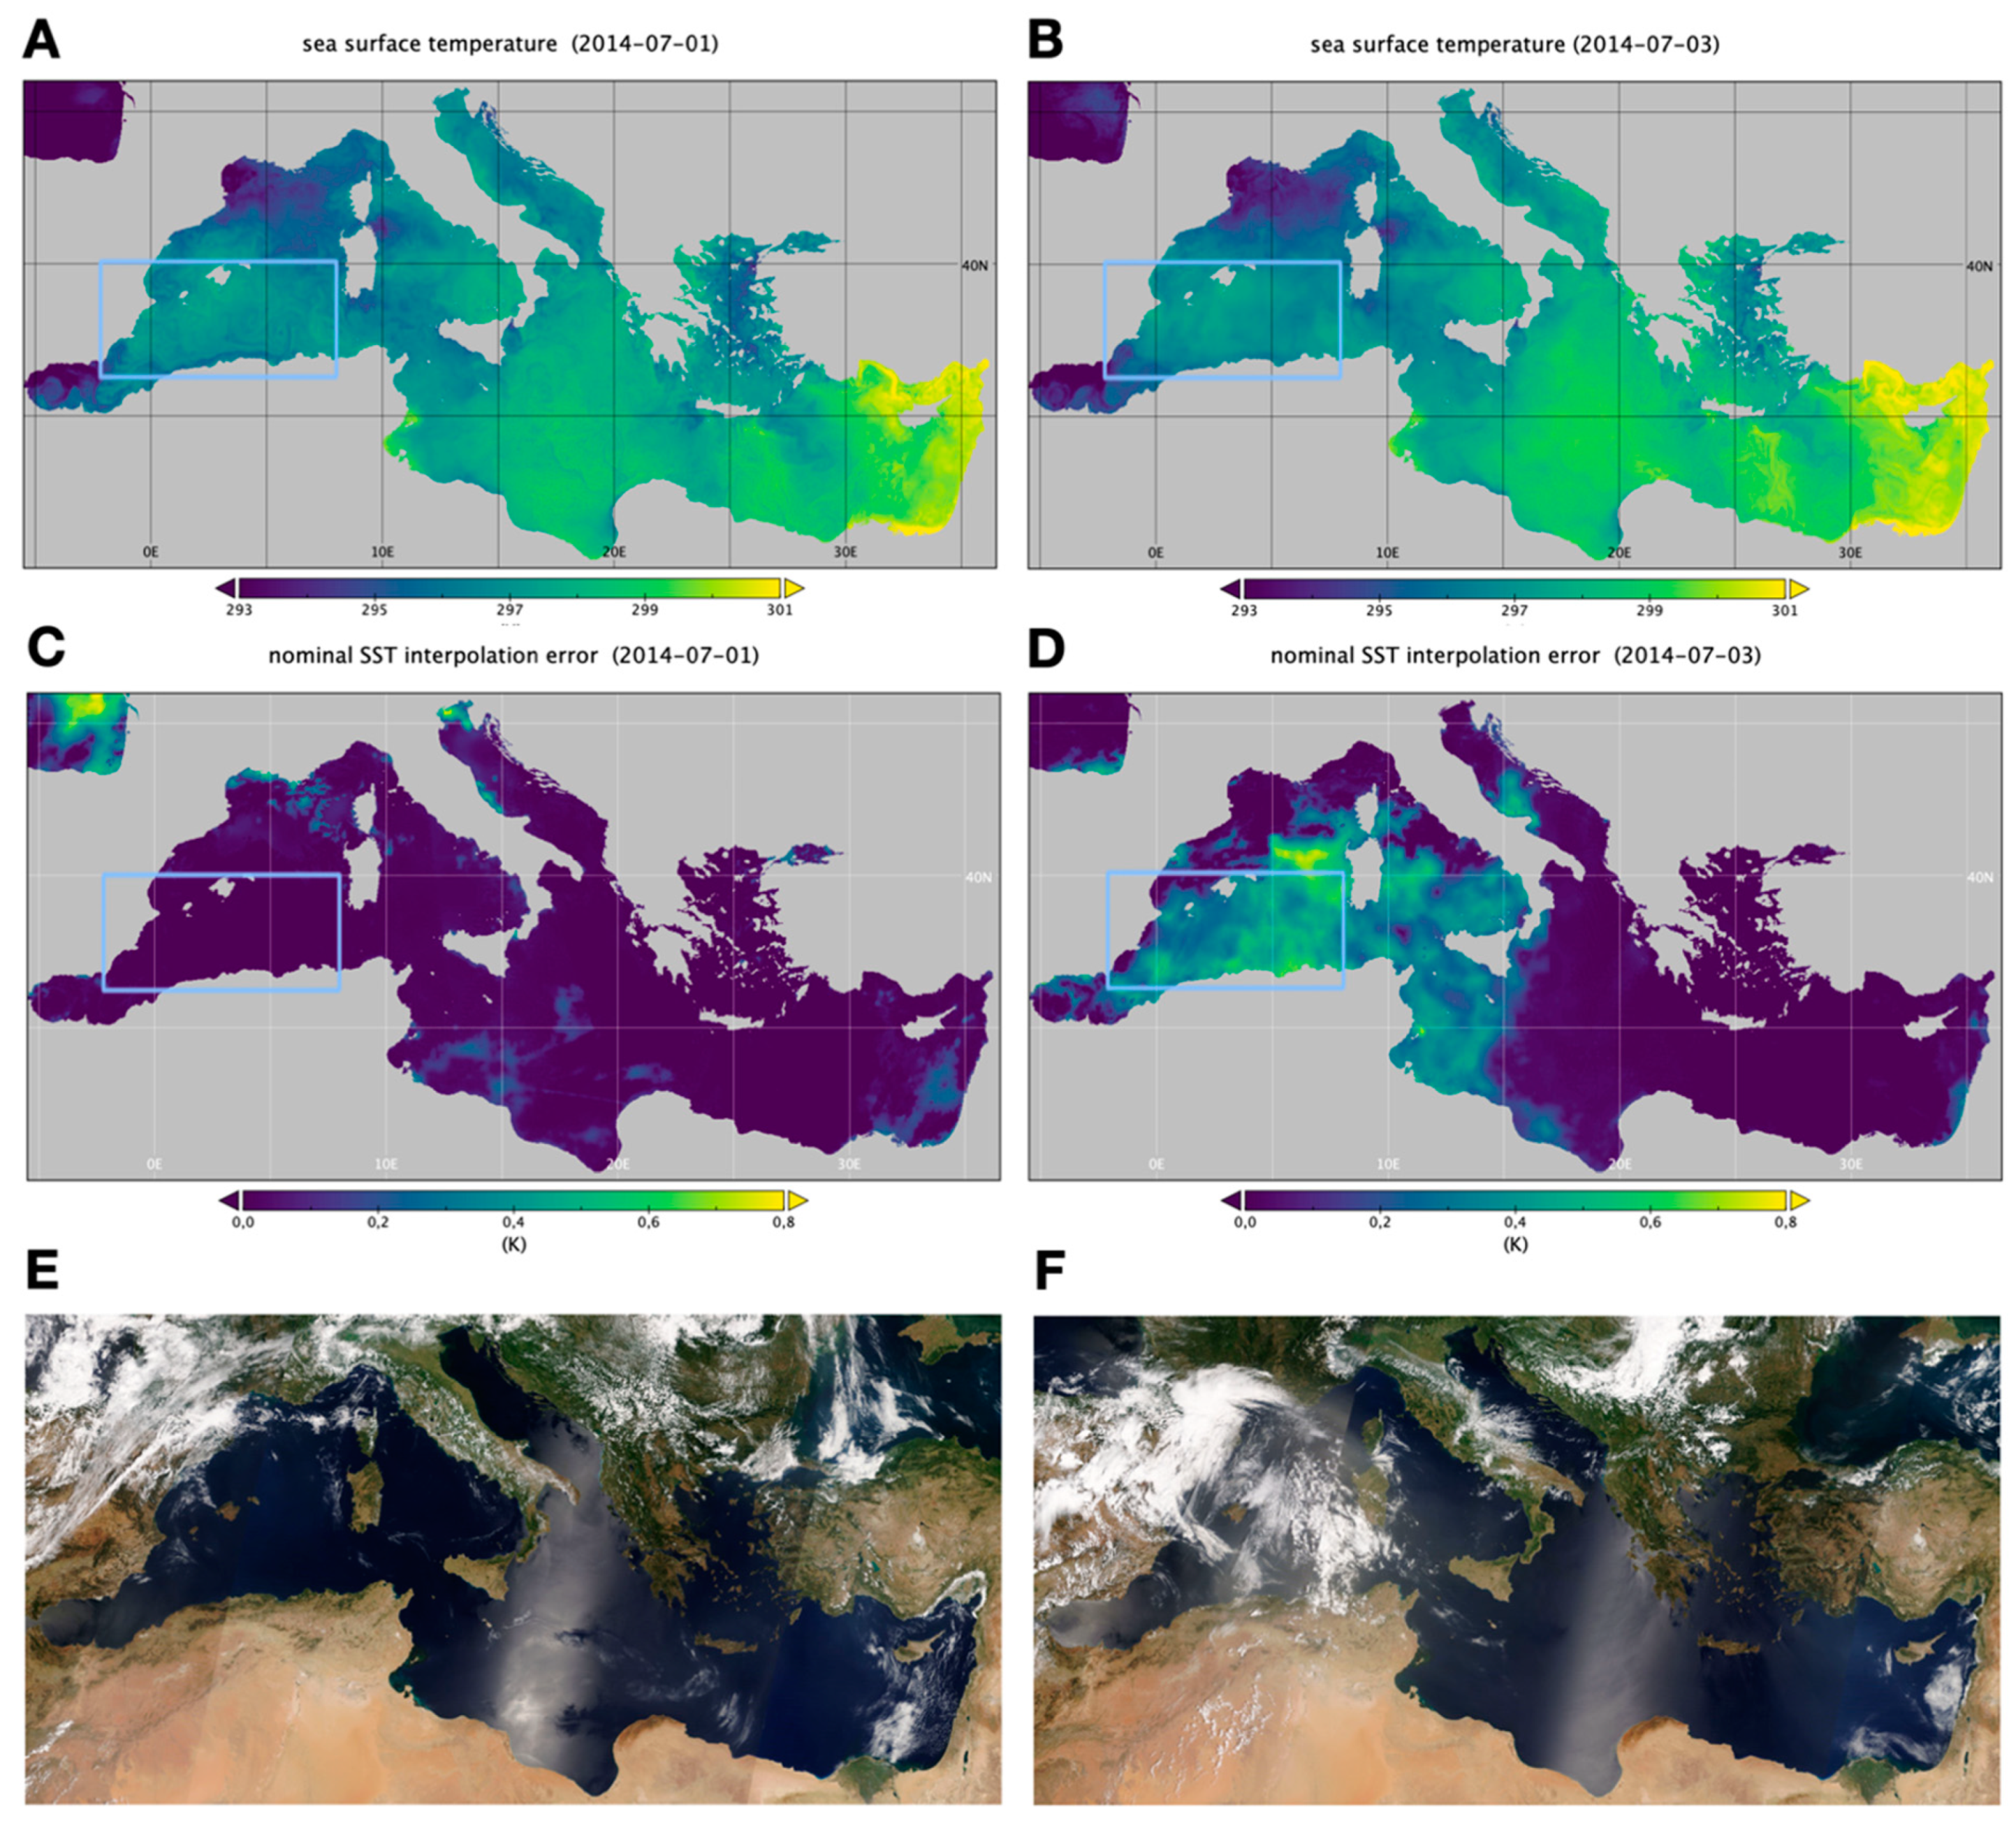
2.3. Satellite Sea Surface Temperature Data

Remotely sensed SST data are taken from the European Copernicus Marine Service (https://marine.copernicus.eu/access-data, last accessed 14 January 2022). They are Level-4 (L4) products, which means they provide gap-free estimates on a regular grid and are operationally produced and freely distributed in near-real time. We have used here 11 years (2008–2019) of the ultra-high-spatial-resolution (UHR) Mediterranean dataset, reaching a nominal 0.01° × 0.01° resolution (Product ID: SST_MED_SST_L4_NRT_OBSERVATIONS_010_004_c_V2). This SST dataset is retrieved by first combining the night-time images collected by multi-platform infrared sensors, after specific quality control and cloudy pixel removal, and by successively running a two-step optimal interpolation algorithm [37]. Before using satellite SST L4 data to build our predictor tensor, we had to map them on the same grid used for the model training. To obtain a consistent prediction, we preliminary assessed the effective spatial scales resolved by the model SST, and eventually filtered the UHR to remove scales that have never been seen by the network. This was achieved by applying a low-pass Lanczos 2D filter (with window size = 9 and cutoff = 1/8) directly to the UHR data before remapping on the final 1/24° grid (through a basic bilinear interpolation). As discussed in the Results section, this pre-processing has the drawback of further smoothing the SST field in areas not covered by concurrent infrared satellite measurements due to cloud contamination or other coverage issues.

2.4. Sea Surface Drifter Data

In situ measurements of sea surface currents were obtained from autonomous Lagrangian drifting buoys that are passively transported by the ocean surface currents [46,47]. During the drifting buoy evolution, the data on the position are interpolated at uniform intervals (~30 minutes) relying on the kriging interpolation method developed by [47]. The velocities are finally computed via a finite-difference method of the interpolated positions and provided with six-hourly temporal resolution. The data covering the period of our study have originally been provided by the Italian Institute of Oceanography and Experimental Geophysics (OGS) for the purposes of the ESA-CIRCOL project. The timeseries are accessible via http://doi.org/10.6092/7a8499bc-c5ee-472c-b8b5-03523d1e73e9, last accessed 14 January 2022); buoy-derived surface current values are only retained if the buoy is equipped with a drogue: a device that guarantees the buoy evolution to be driven by the ocean currents rather than by surface winds [48].

2.5. Simulating Altimeter-like ADT Maps

One year (2017) of synthetic altimeter-derived ADT maps was obtained from the outputs of the Copernicus Marine Service MFS hydrodynamic simulation, using the data unification and altimeter combination system (DUACS) mapping method. The different steps are detailed below. Firstly, sea level anomaly (SLA) was computed from model outputs by means of Equation (1):
SLA = SSH − (MDT − 0.344)
where the mean dynamic topography (MDT) is provided as a static field together with the model outputs. A 0.344 constant (expressed in m) allows us to adjust the SLA values in the Mediterranean Sea to guarantee that the spatio–temporal average of SLA is zero during 2017. The large-scale, high-frequency variability, usually removed by applying a dynamic atmospheric correction (DAC) [49] is filtered out of these synthetic data by applying a Loess filter. The SLA is then sampled along the actual tracks of a synthetic constellation composed of four radar altimeters: Jason-3, Sentinel-3A, SARAL/Altika and Cryosat-2 missions. This step is achieved by running the SWOT simulator software [50], which allows us to account for the actual orbits, errors and noise that characterize each mission. The chosen four-satellite constellation is representative of the constellation ingested in Copernicus Marine Service processing during 2017. Such along-track synthetic measurements are then ingested by the DUACS processing chain to produce L4 SLA maps. The optimal interpolation (OI) scheme follows the DUACS DT2018 (Delayed Time) configuration for the Mediterranean area, described in [32]. The reconstructed small-scale maps are then recombined with the filtered large-scale maps. Such data are provided on a daily basis and over a regular 1/8° grid (more details available in [44]).

2.6. Preparation of Training and Test Datasets for Deep Convolutional Learning

The OSSE data were simulated starting from year one of the primitive equation model daily output described above. The original input images cover the entire Mediterranean domain at 1/24° spatial resolution, leading to an individual image size of 380 × 1000 pixels. We randomly chose 40 dates (~11% of the total) to be kept aside as independent test data, and we successively resampled the original images, extracting much smaller tiles (76 × 100), which were later used as input to the network training. Despite the random holdout strategy being a standard, different choices of the test dataset could also be done. However, the test on OSSE prediction only serves here to assess the relative performance of the different network architectures, not its absolute performance, which is not relevant per se, when looking at simulated input data. The tiles are then extracted by going through a double loop on latitude and longitude, imposing a spatial overlap of 50%, so that a total of 42,250 samples is finally available for the training. The dimension of the tiles has been chosen to simplify the pre-processing and reduce the memory required by the training steps. In fact, all tiles are normalized before entering the network. In the case of the SST, ADT and ∂SST/∂t, they are first transformed into anomalies estimated with respect to the tile spatial mean and are successively scaled by dividing the anomalies by the maximum value (in absolute value) recorded throughout the series. The ΔADT only goes through the normalization step. As the tiles cover an area of approximately 300 km × 400 km, the anomaly computation is indeed serving as a high-pass filter, removing the background variability associated with basin scale processes and seasonal variations (e.g., steric and thermal variations driven by large-scale, air–sea interactions), which are not relevant to reveal the impact of mesoscale processes on SST evolution related to horizontal advection. This filtering is consistent with the tests described in [44]. After the test/prediction, the tiles are merged together to compute a weighted average on overlapping areas.

2.7. Deep Convolutional Models Learning Strategy and Configuration

All deep convolutional models considered in this work (Section 3) have been written in Python using the open-source library Keras. They are trained adopting an early stopping rule to avoid overfitting and minimize the generalization error. In practice, the original training dataset is randomly split into a proper training set (85% of data) and a validation set (15%) (not to be confused with the fully independent test dataset described above, which is never seen during the training) based on which both training (hindcast) and validation losses are updated during the network optimization. The validation loss, in particular, is used as an estimate of the generalization error, and early stopping consists in terminating the iterative learning as soon as its values start to increase. As the estimations can be rather noisy, early stopping admits a “patience” parameter, which defines the number of epochs to be completed before the loss function minimum can be considered such. Here we have set the patience equal to 20 for the SRCNN model (whose computations are very fast but require many more epochs to converge) and reduced it to five for all deeper models. The adaptive moment estimator, Adam, is applied for the stochastic optimization of models’ parameters [51], with the learning rates (lr) and numerical stability constants (ε) kept as in the original implementations of the baseline networks (i.e., lr = 3 × 10⁻⁴ and ε = 10−7 for SRCNN; lr = 10−4 and ε = 10−8 for the other networks). The latter values are also adopted for dADR-SR. Within the dADR-SR model, we have also tested the implementation of a DropBlock strategy [52] to improve the network regularization with minimal performance differences.

2.8. Automatic Eddy Detection
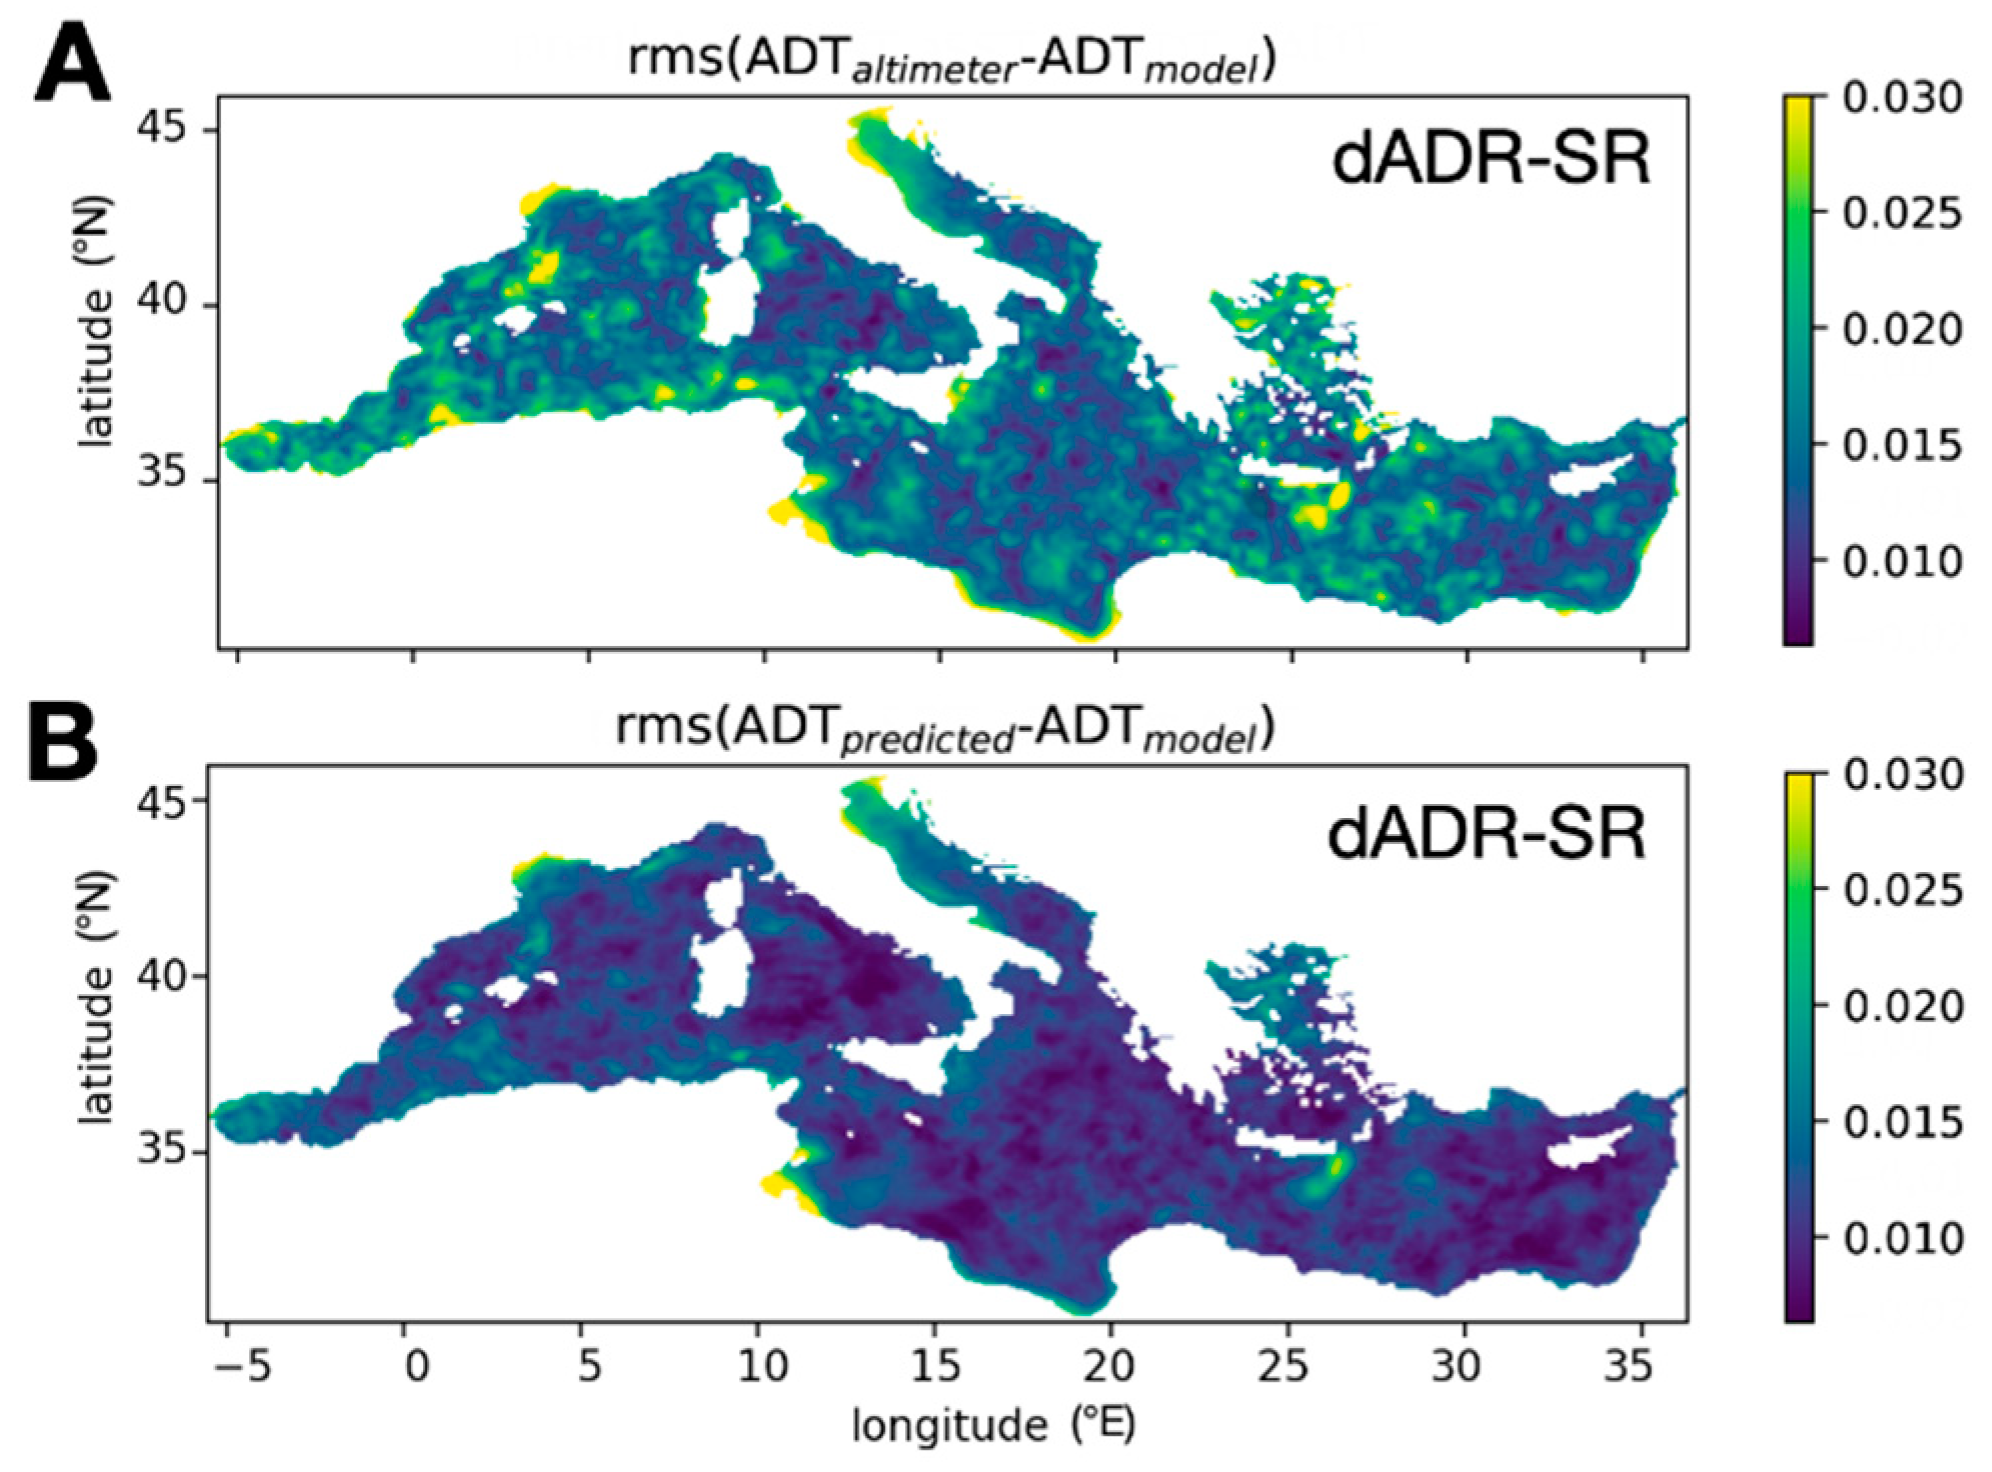
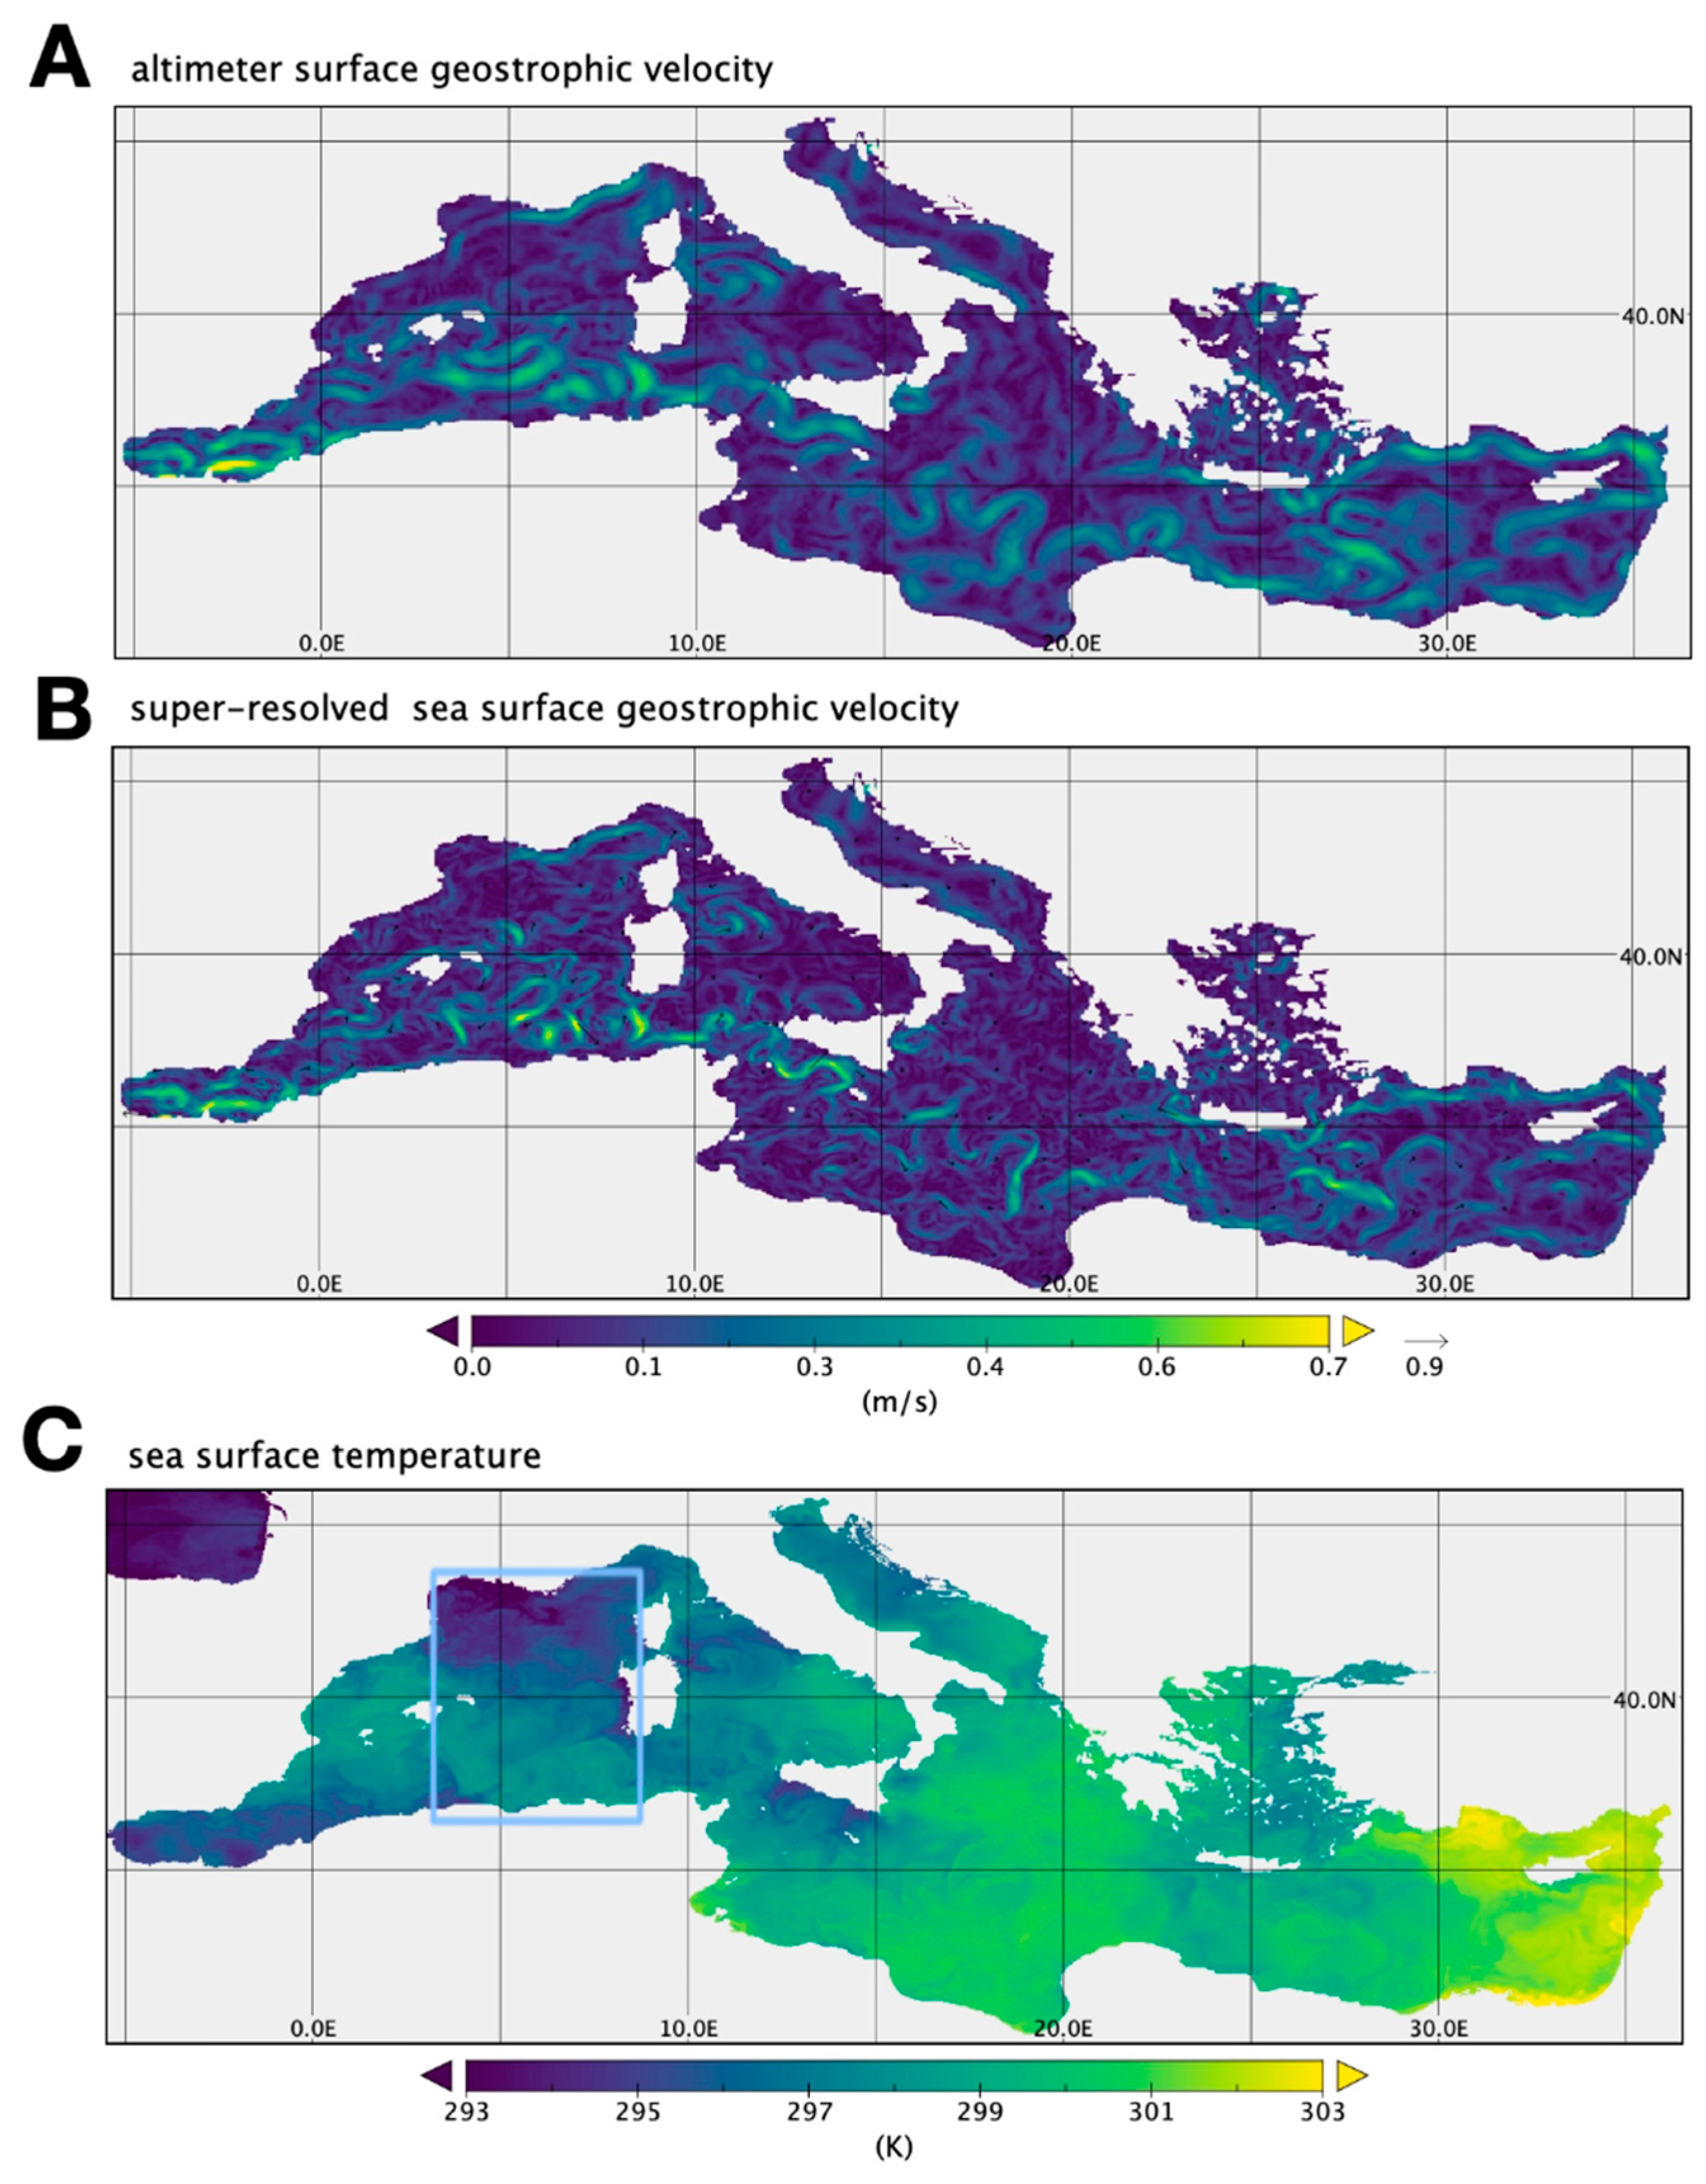
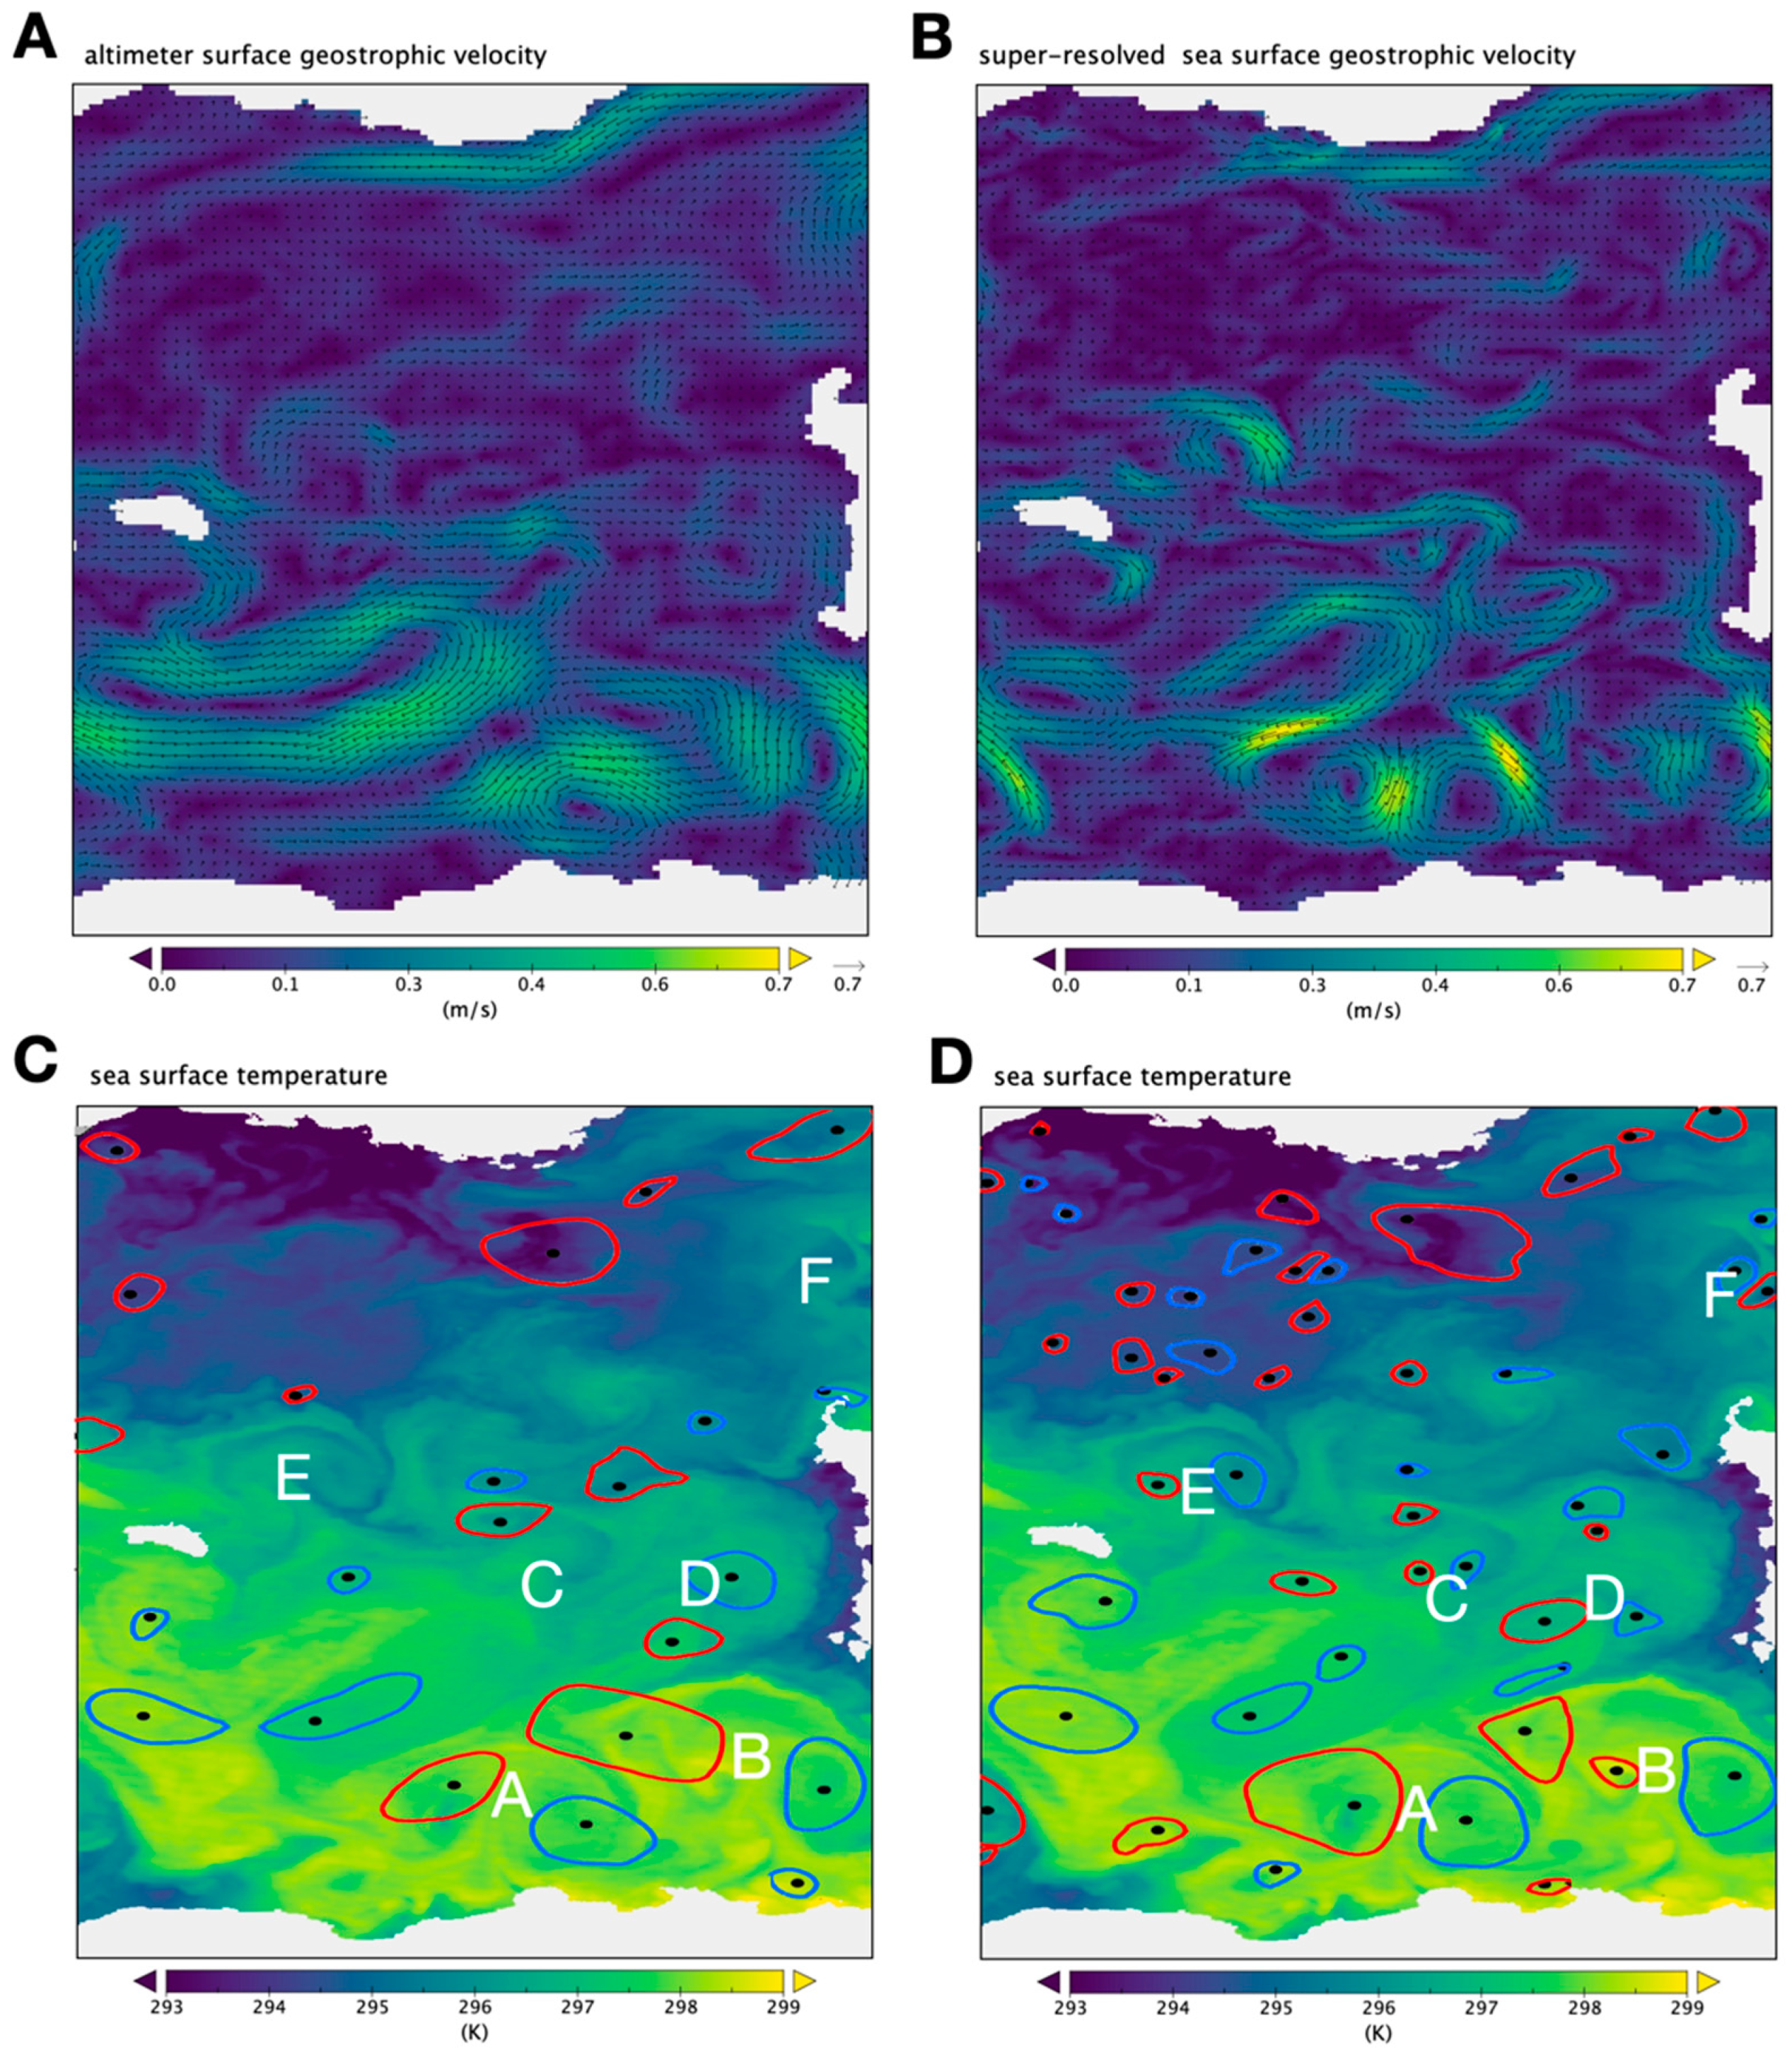
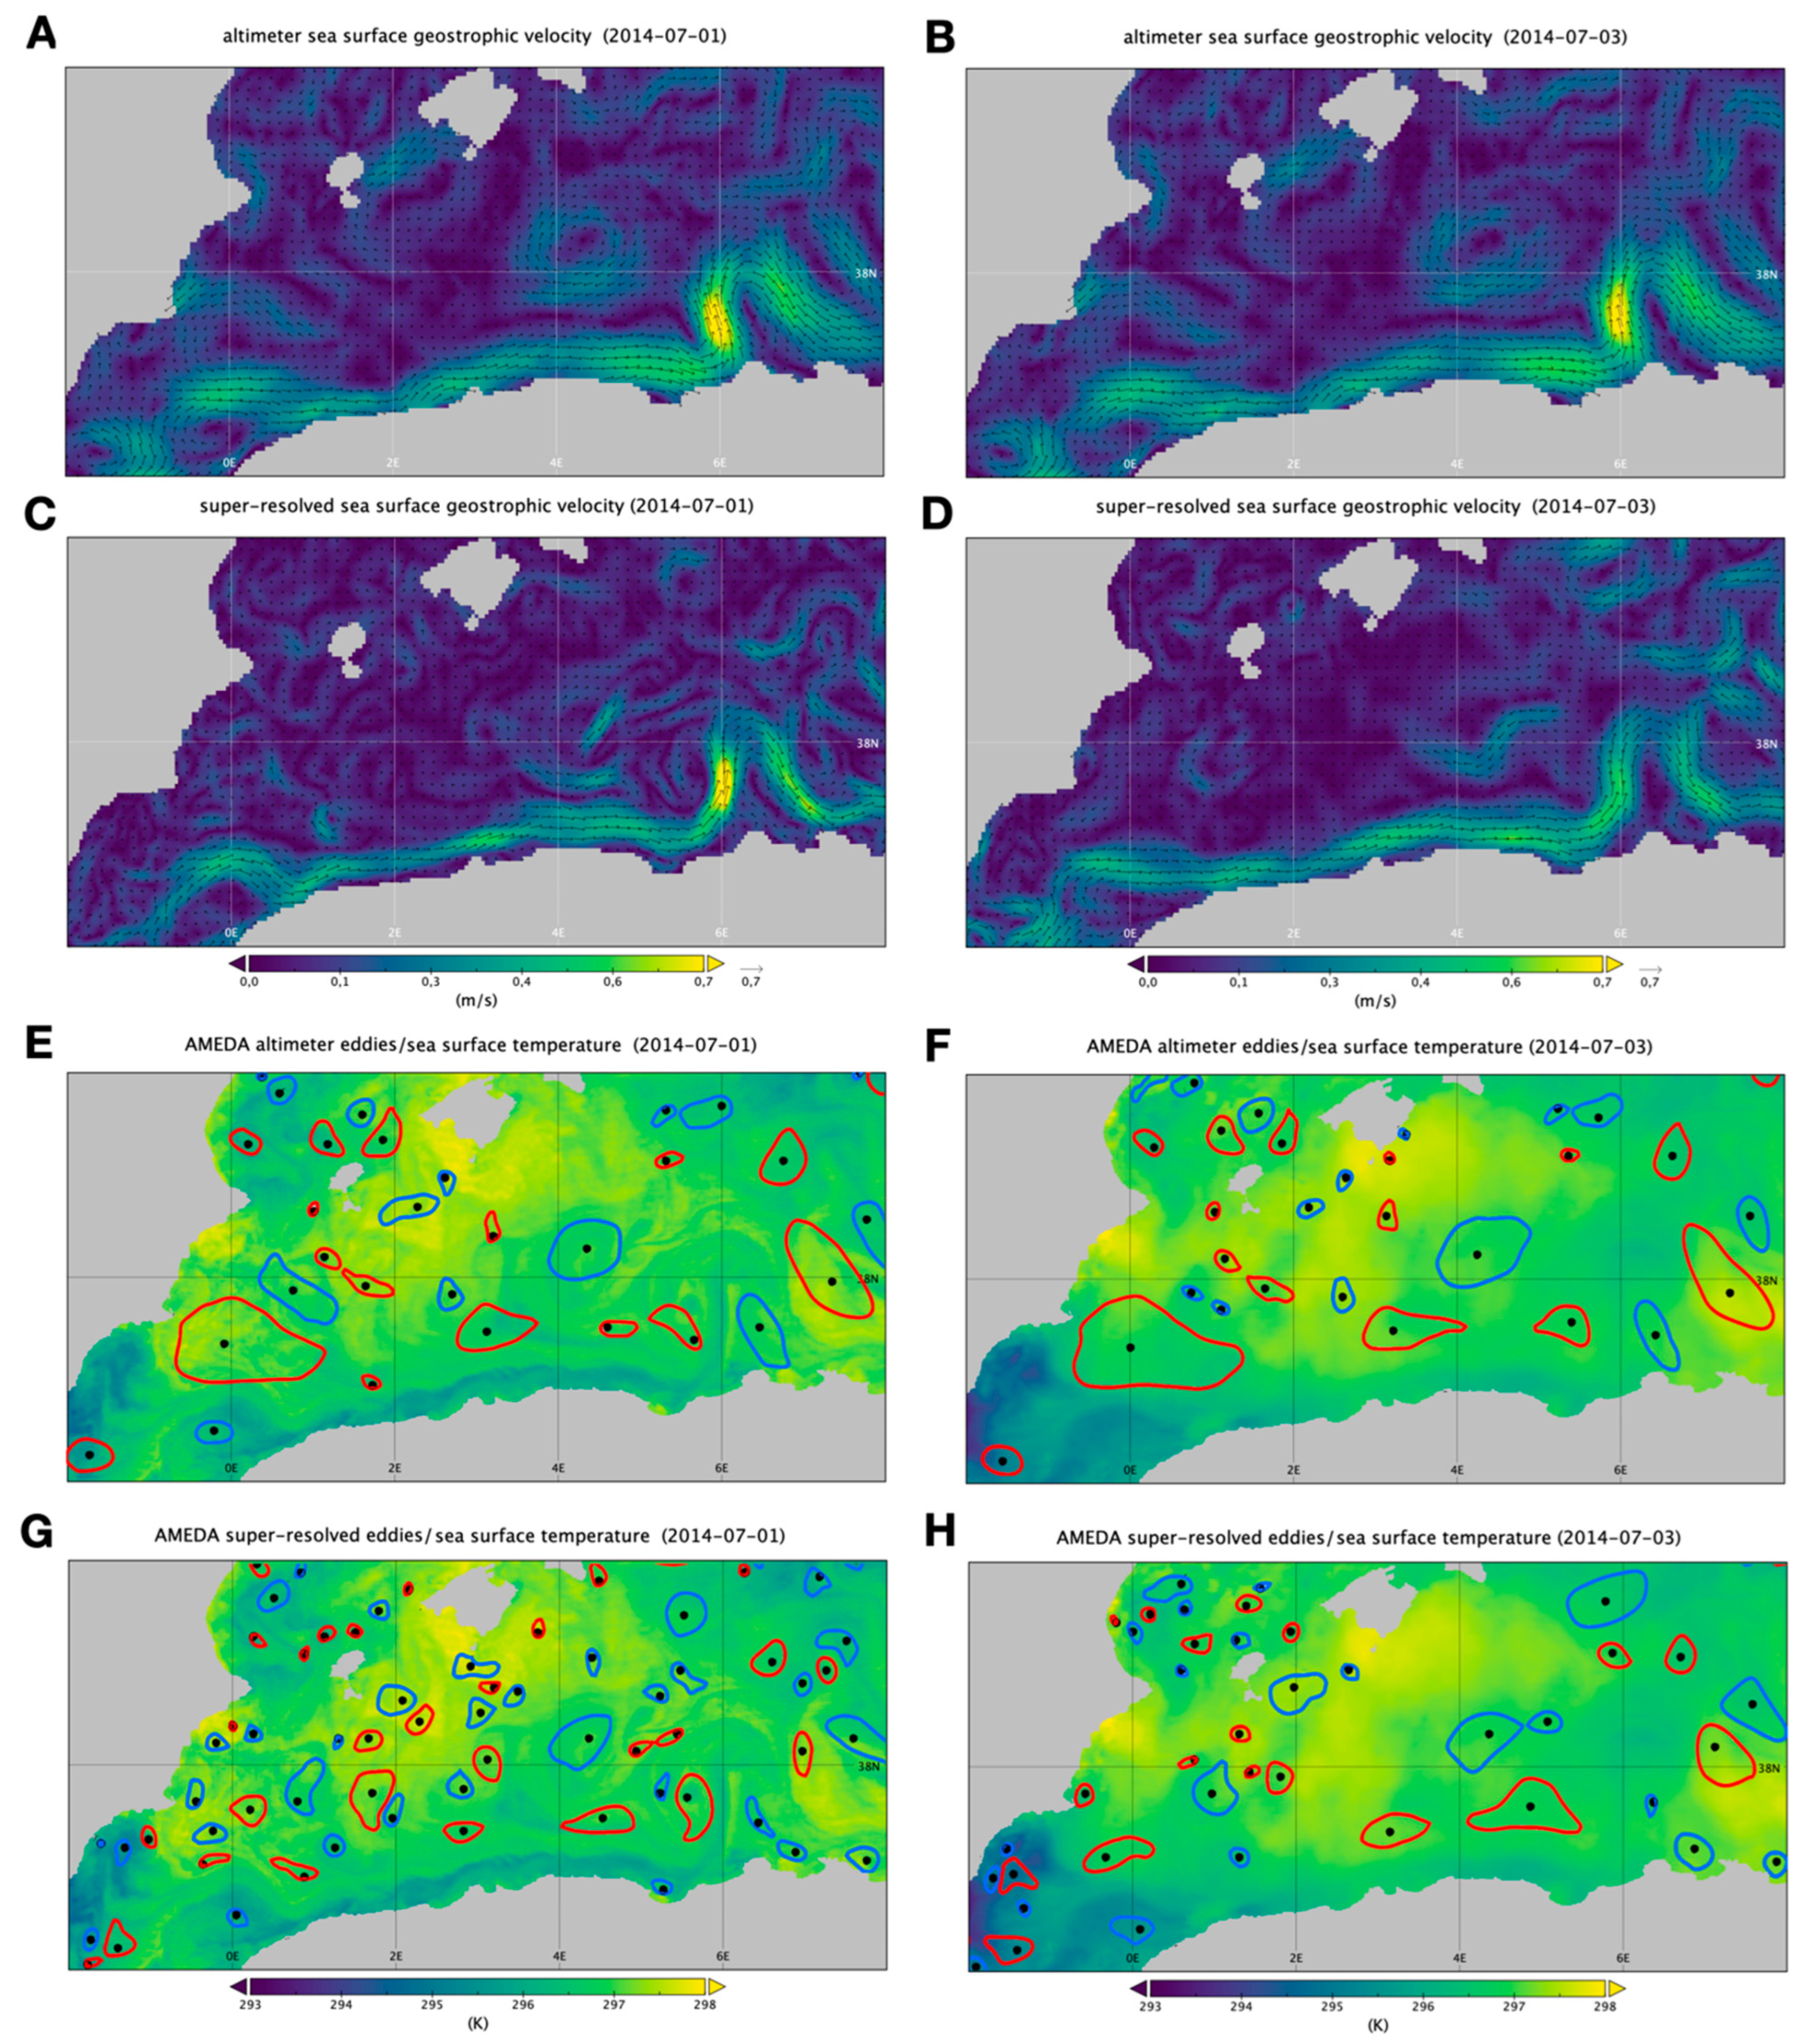
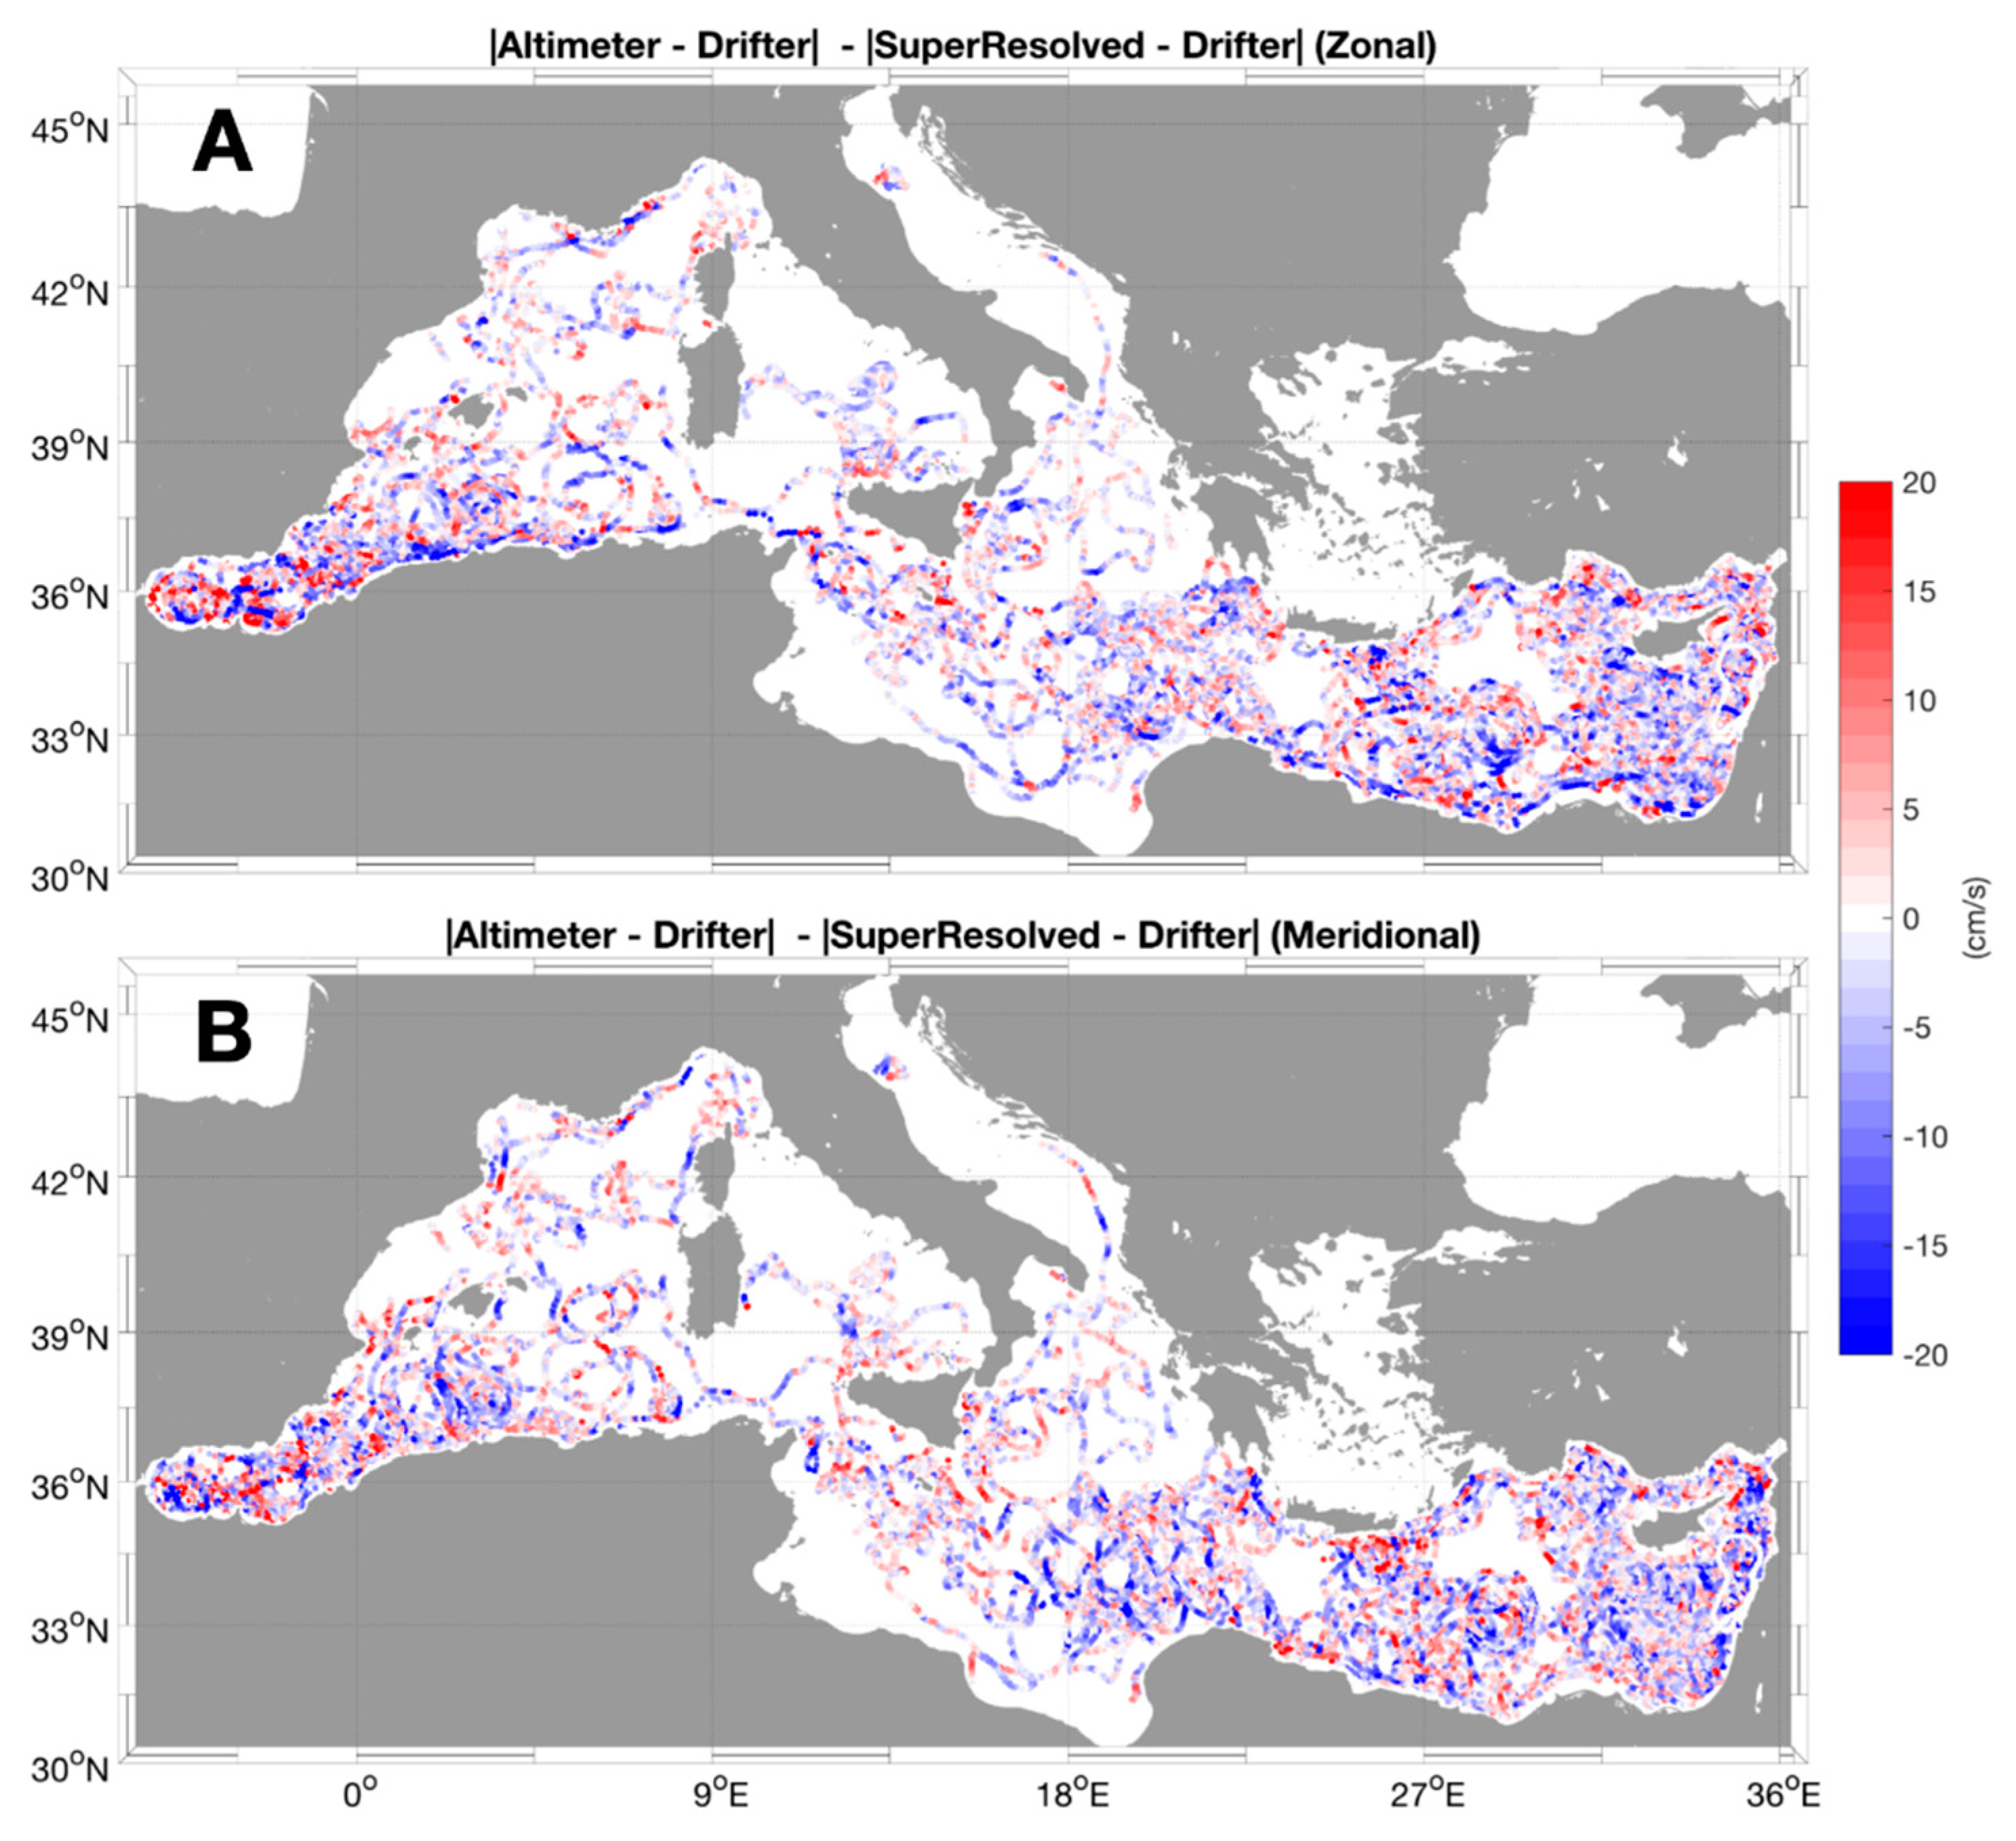
The angular momentum for eddy detection and tracking algorithm (AMEDA) is freely available software for the detection and tracking of oceanic eddies from 2D gridded fields of surface currents and/or sea surface height [53]. It is based on the computation of eddy local normalized angular momentum (LNAM) and on the observations of closed streamlines around the LNAM extrema. The algorithm was successfully applied to remotely sensed 2D fields and model outputs, e.g., [35,53,54], and enables the determination of eddies’ contour and trajectories as well as eddy merger/splitting events. In this study, AMEDA was used to identify eddy shapes seen by standard altimetry products (described in Section 2.2) and the fields obtained from the combination of satellite altimetry ADT and high-resolution satellite SSTs. We relied on the AMEDA default configuration, accounting for the expected perturbation lengths in the Mediterranean area (i.e., considering the typical Mediterranean Rossby deformation radii).

3. Results

3.1. Testing Single-Image, Super-Resolution Configurations and Designing a Multi-Scale Adaptive Model

A large variety of neural network architectures have been proposed to achieve single-image super-resolution, even considering only those dealing with input–output images of the same size [25]. Comparing all of them is clearly beyond the scope of our work, which is rather to demonstrate whether the super-resolution class of techniques can be efficiently used for quantitatively accurate dynamical retrievals based on multiple variables and observation types. As such, we have implemented here four different models, three of them basically reproducing already published (baseline) networks, and a third one that includes elements from different models but represents an original network architecture. All models are trained considering the mean-squared error as the reference loss function.
The first model is the Super-Resolution Convolutional Neural Network (SRCNN) proposed by [26]. It consists of three 2D convolutional layers: the first one includes 128 filters with a 9 × 9 kernel size, the second one with 64 filters and a 3 × 3 kernel size and the third one with a single 5 × 5 filter. The first two layers include a nonlinear activation (rectified linear unit, ReLU), and zero-padding is applied in every layer to keep the original image size end-to-end (Figure 1A). Each layer represents a specific operation in the conceptual explanation of the SRCNN given by [26]: overlapping patches extraction from the low-resolution image (where the patches have the same size as the kernel) and representation into a high-dimensional vector (feature mapping, with vector dimensions equal to the number of filters); non-linear mapping of each high-dimensional vector onto another high-dimensional vector comprising a second set of high-resolution feature maps; these are directly linked to the final image in the third step (reconstruction). We applied SRCNN in four different configurations, namely considering SST, ∂SST/∂t, ADT and ΔADT in input (all together) and alternately removing either ∂SST/∂t, ΔADT or both ∂SST/∂t and ΔADT from the predictor variables. After training the networks (see details in Section 2), we used the fully independent test data to assess the accuracy of the prediction over the entire Mediterranean Basin, comparing the root-mean-squared differences (RMSD) between the altimeter-like ADT and the “true” ADT, as well as those between the super-resolved ADT field and our simulated “ground truth”. SCRNN gave us some first indications (Figure 1B–E): overall, we could not find an improvement in the ADT reconstruction by incorporating all predictors, but what appeared to be actually detrimental was the inclusion of the ADT interpolation error. In fact, excluding ΔADT from the input already improves the accuracy of the simple SRCNN’s reconstruction. Conversely, including ∂SST/∂t always appeared beneficial. Even if our initial hypothesis on the relevance of the information on the observing geometry (as provided by the ADT interpolation error) seemed wrong, we must stress that the features that dominate the patterns of ΔADT are much larger than the scales of the dynamical features we want to super-resolve, and SRCNN is plausibly a too shallow/simple network to deal with such different scales due to a very limited ability to learn complex interdependencies between channels (it actually contains only around 110k trainable parameters). Thus, we are still confident that a properly defined network architecture would be able to exploit the information on where the altimeter-like ADT field is expected to be more accurate and where it deserves stronger corrections. As such, we decided to test all successive (and gradually more complex) network architectures with both the configuration with the four predictors and the one without the ADT error.
The second network we have implemented is the baseline Enhanced Deep Residual network for Super-Resolution (EDSR) proposed by [55]. EDSR was designed to exploit the possibility to significantly deepen the networks (i.e., to increase the number of layers) opened by residual learning frameworks. Instead of learning fully unreferenced functions, residual networks (ResNet) define the layers as residual functions (actually they are based on residual blocks, including different convolutional and batch normalization layers, and activation functions, where the residual is referenced to the block input) and have been proven much easier to optimize than conventional networks, allowing users to train considerably deeper networks and obtain significantly better accuracies [56]. EDSR simplified the network architecture with respect to models based on original ResNet by reducing the number of parameters employed in each residual block (Figure 2A). In its baseline formulation, it includes a first 2D convolutional layer made up of 64 filters with 3 × 3 kernel size, followed by 16 residual blocks, increasing the number of trainable parameters to approximately 1.2 M, one order of magnitude higher than SRCNN. The first layer output and the output of the last residual block in the sequence are also summed up (skip connection) before entering the output convolutional layer (including a single 3 × 3 filter), which connects to the target image. Residual blocks include two convolutional layers with the number of filters equal to the input channels (64) and a 3 × 3 kernel size. These two layers are connected through a non-linear activation (ReLU). The outputs of the second convolutional layer within the residual block are summed to the input channels to obtain the residual, after applying them a fixed scaling factor of 0.1. Notably, the scaling strategy applied within the EDSR residual block was formerly proven to stabilize the training of complex networks, allowing users to safely increase the number of filters [57].
The minimum of the loss function reached during the model training was around ~4.5 × 10⁻³ for SRCNN, whatever the configuration, with small differences between hindcast and validation. The same numbers would indicate a much better performance of ESDR, with validation loss values of around 1.8 × 10⁻³ for the configuration excluding the ADT error from the predictors and values close to 1.6 × 10⁻³ for the full predictors set. The minimum hindcast loss got close to 1.1 × 10⁻³ in both EDSR configurations. However, the test run on the independent data clearly indicated that the improvement only occurred in some parts of the domain, while worse reconstructions can be obtained in dynamically relevant areas, both including the ADT error or not in the predictor list (Figure 2B,C). Not too surprisingly, in the first case, higher RMSD are found along some of the repeated altimeter tracks, well visible as diamond/rhomboid shapes (Figure 2B), which again indicates that the network is not able to efficiently exploit the information on the ADT interpolation error. In the latter, though, higher errors in the reconstruction are found also in some areas that are well known for being dynamically very active (e.g., offshore the Algerian coast, Figure 2C).
The third network considered is the Adaptive Deep Residual Network for Super-Resolution (ADR-SR) proposed by [58]. ADR-SR represents an interesting evolution of the EDSR. Its main improvement consists in substituting the learned feature fixed scaling applied within the EDSR residual block with an adaptive scaling, obtained by introducing a squeeze-and-excitation (SE) module [59]. Within the adaptive residual block (ARB), channel-wise feature responses are adaptively recalibrated through an SE module before summing them to the block input, allowing the network to more efficiently model complex interdependencies between the learned feature channels (Figure 3A). Conceptually, we might thus expect it to drive a substantial advance with respect to simpler networks.
The SE module first reduces all 2D feature channels into 1D values through global average pooling (squeeze). The excitation operation then consists in learning a weight vector, built through a self-gating mechanism that takes the output of the global average pooling as input and provides per-channel modulation weights. The self-gating consists in a bottleneck with two, fully connected layers (including non-linear activations), the first one reducing the dimensionality by a predefined factor (and including a ReLU activation), and the second one increasing it back to the number of channels in the input to the module (followed by a sigmoid activation). These weights are successively used to suppress or enhance individual channel features (feature recalibration) before summation to get the residuals. With respect to baseline EDSR, ADR-SR increases the number of filters within each block from 64 to 192 but limits the number of feature channels in input to the residual block from 64 to 32. The ADR-SR network implemented here employs 16 residual blocks and finally includes slightly less than 1.8M trainable parameters.
ADR-SR performance assessed on the test dataset significantly improved with respect to that of the other networks, and, for the first time, including the information on the low-resolution ADT interpolation error leads to a tangible reduction of the RMSD over most of the basin (Figure 3B,C). Still, a lower accuracy is found close to some of the altimeter repeated tracks (visible as diamond shapes), which might be due to the limited ability either of ADR-SR and of the previously tested networks to correctly handle the information provided at different spatial scales by the input predictor variables. This specifically reflects the larger scale of ADT mapping error patterns with respect to the geophysical variables.
To overcome this issue, we have developed here a novel deep convolutional architecture, which combines the successful developments of previously tested super-resolution models with the dilated-convolution-based multi-scale information learning inception module proposed by [60]. Dilated convolution allows users to extract information at different scales and significantly expands the network’s receptive field even without enlarging the kernel size [61]. Choosing a dilation rate, r, r-adjacent pixels are skipped by the convolution kernel, so that related weights refer to samples taken at tuneable distances. In the inception module designed by [60], the channels input to each module first pass through three parallel dilated convolution layers with kernel size 3 × 3 and dilation factor of 1, 2 and 3, respectively. Then, all convolution outputs are concatenated and passed to the successive layers.
We have named the new model “dilated Adaptive Deep Residual Network for Super-Resolution (dADR-SR)”. Its architecture is depicted in Figure 4. In the first step, dADR-SR input channels are passed to three parallel convolutional layers, each one with ten filters and a 3 × 3 kernel size, but with an increasing dilation factor of 1, 3 and 5, respectively. The output of the three convolutional layers is then concatenated into a single multiscale feature tensor, which represents the input to a sequence of multiscale adaptive residual blocks. Indeed, within each residual block, the same multiscale parallel feature extraction is carried out, thus defining a multiscale adaptive residual block (M-ARB). To avoid excessively increasing the number of parameters to train, the number of residual blocks is here kept to 12 (four fewer than in the EDSR/ADR-SR baseline), and the number of filters included in the two sets of convolutional layers inside each M-ARB is chosen as 120 and 10, respectively. Within the M-ARB, after concatenating the learned multiscale features, a SE module is included (with a predefined dimensionality reduction factor of 10 instead of 16, so that the bottleneck in dADR-SR is shaped 30-3-30, instead of 32-2-32). The final number of trainable parameters in the dADR-SR model is slightly below 1.6 M.
The dADR-SR model outperforms any of the previous networks when tested on the independent dataset, displaying a marked reduction of the RMSD over the entire basin (Figure 5), with only extremely few and very small spots showing a minimal degradation (Figure 4B,C). The information captured at the different scales by including all predictors thus further enhances the accuracy of the reconstruction with respect to the model that does not consider the low-resolution ADT interpolation error.

3.2. Applying Dilated Adaptive Residual Super-Resolution Trained on Simulated Data to Real Satellite Observations

Our successive analysis is aimed to verify to what extent we can use the features learned from observing system simulations based on primitive equation modelling to improve present-day, data-driven reconstructions, but also to identify eventual limitations of the present OSSE set up and issues related to real observation-based products. We have thus applied the model trained on OSSE data to predict high-resolution ADT starting from properly pre-processed, satellite-altimeter-based, low-resolution ADT and high-resolution SST products (e.g., Figure 6). For both variables, we have actually taken optimally interpolated data (also known as Level 4 (L4), see Section 2), covering the 2008–2019 period. Assessing the accuracy of the observation-based, super-resolved maps is not trivial, as large-coverage, high-resolution observations of the surface topography/currents are not presently available. As such we followed a double approach: on the one hand, we performed a qualitative analysis of the reconstructed patterns, looking at areas of intense mesoscale activity visible in the satellite SST L4 data and comparing the (sub)mesoscale eddies identified by the AMEDA automatic detection algorithm in original and super-resolved data; on the other hand, we built a match-up database with the surface current estimates provided by surface drifters (see Section 2) and used it to compute the statistics of the differences with respect to the geostrophic currents estimated from standard altimeter ADT and super-resolved ADT field.
The dADR-SR model reveals impressive potential to resolve mesoscale turbulent features that are generally smeared out, often misplaced or even totally missed by standard altimetry, when clear-sky thermal data are present. Figure 7 presents a wonderful example of such a turbulent field, with many mesoscale eddies, dipoles and current meanderings well visible, especially in the western Mediterranean Basin, detaching from the Algerian current towards the centre of the basin along the North Balearic front and Liguro-Provençal current. Surface geostrophic currents estimated from the dADR-SR ADT (Figure 6B) not only appear much sharper than those depicted by low-resolution altimetric data (Figure 6A) but prove also able to reconstruct dynamical features that were completely absent in the standard product (Figure 7).
Specifically, dADR-SR recovers the strong cyclonic eddies associated with two mushroom-like dipoles along the Algerian coast, marked with the letters “A” and “B” in the zoomed panels of Figure 7, displaying much more consistent shapes and intensities. The cyclonic circulation in (B) is actually described as two eddies by the AMEDA eddy contours estimated from the super-resolved field, which is much more consistent with the SST patterns, while a single and almost rectangular shape is found in standard altimeter estimates. Consistency is not meant here as a perfect alignment between the SST gradients and the geostrophic currents—which is not at all to be expected in non-stationary current fields—but to the impossibility of having so many isotherms being crossed by very large-scale currents, considering the well-developed structures found in the SST field, even assuming a strong chaotic stirring. The dADR-SR prediction also recovers much more reliable patterns associated with the weaker meanders and smaller-scale recirculations in the centre of the sub-basin (C and D) and also the highly asymmetric, strong dipole visible east of Menorca Island (E). Remarkably, it is also capable of identifying the winding north-eastward current close to Corsica (F) that is seen as a rather straight and uniform flow in low-resolution altimetry and completely missed by corresponding AMEDA, while being detected as a small dipole in super-resolved AMEDA contours.
The situation looks very different when the original thermal-infrared data are masked by clouds, because in these cases SST data interpolation leads to much smoother SST structures and gradients than what is observed in clear-sky conditions. This filtering unfortunately reflects on the structures retrieved by the dADR-SR model as well, evidently dumping surface current intensities and also eventually clearing out several of the mesoscale features.
One such example is given in Figure 8, which shows the interpolated SST and the associated nominal interpolation error on the 1st of July 2014 and the same fields taken three days apart. During these three days, clouds gradually moved into the southwestern Mediterranean from Morocco, completely hiding the sea surface to the satellite infrared radiometers on the second date (Figure 8B,E). The corresponding SST field, presenting very clear and distinct structures on the first day, is dramatically blurred by the interpolation in data-void areas (Figure 9). Similar to the example presented in Figure 7, the dADR-SR reconstruction is able to recover much more consistent surface current patterns in the presence of clear-sky thermal observations, e.g., aligning the currents to the true shape/position of the jet found close to 6°E (Figure 9G) along the Algerian coast. This jet is actually feeding a mushroom-like mesoscale structure whose cyclonic eddy is much better retrieved in the super-resolved image and significantly misplaced by the standard product (Figure 9E). Likewise, SR fields also reconstruct the small-scale features observed in the Almeria–Oran front region (i.e., to the north of the SST front found around the Greenwich meridian), which is seen as a unique and quite large cyclone in altimetry maps (consistent with what was noticed by [35]). Notably, however, the geostrophic current field based on altimetry only suffers minor evolutions after three days (Figure 9F), while dADR-SR actually appears to have smeared out most of the features observed previously. Current intensities are also significantly and unrealistically reduced on the 3rd of July, especially in the intense, anticyclonic meander observed along the Algerian coast at 6°E (Figure 9H).
Several similar cases can be picked up by looking at the entire time series, but our qualitative understanding of the power and limitations of the model and observations analysed in this first work are fully confirmed also by the successive quantitative assessment. This latter exercise was carried out by matching the independent estimates of surface currents obtained from in situ drifting floats with co-located/concurrent data-driven modelling and altimeter data. Actually, the error associated with the super-resolved and standard altimetric estimates (assessed here as the absolute value of the difference with respect to drifter data) does not display a unique behaviour along the individual drifters’ trajectories, with alternating improvements and degradations of the current velocity components, which do not present marked geographical characterization (Figure 10). Overall, though, SR fields seem to provide slightly more accurate values in some (mostly offshore) areas of the western basin, while, on average, they seem to perform worse in the easternmost part of the Levantine basin (close to Israel/Lebanon coasts).

4. Discussion

While our findings could be of general interest to a broad range of scientists, we expect them to stimulate further investigations and suggest new ways to efficiently combine Earth system data from multiple sensors and models. In fact, the adaptation and development of AI and deep-learning tools for Earth observation encompasses an ever-growing number of potential applications. We have tested here a novel approach that not only allows users to take advantage of neural network techniques for the combination of multi-sensor, remotely sensed data, but proposes an innovative way to merge satellite observations and numerical models, building an observation-based product that implicitly includes knowledge of the physics of the system in a way different from classical statistical interpolation or data assimilation.
We performed an observing system simulation experiment to test the applicability of computer vision algorithms (originally designed for single image super resolution) for the improved estimation of ocean absolute dynamic topography. Usually, OSSEs provide a controlled testing environment, targeted to better tune observing system design or to set up the retrieval algorithms for future satellite missions. Indeed, one interesting aspect of the experiment carried out here is that, while it will hopefully be possible in the future to train our super-resolution model directly from observations (as soon as SWOT, Harmony or SEASTAR measurements become available), it is already possible to apply it to super-resolve present altimeter products, provided the area and period under study are effectively covered by cloud-free/noise-free infrared images.
In fact, we have identified a number of issues and aspects that will need further investigation and new developments. First of all, a dedicated effort would be needed to take into account the limitations of present, satellite-based SST L4 data, which are obtained through spatio-temporal statistical interpolation of eventually cloud-contaminated infrared images and thus provide uneven spatial spectral information (depending on the persistence of cloud cover and interpolation strategy adopted) [41]. One possible strategy to expand the applicability of algorithms based on super-resolution would thus be to also fully simulate SST interpolation and related error in an improved OSSE. This could be achieved by adding realistic data voids to model data and implementing the same algorithm used operationally for SST interpolation. The interpolated SST and related formal interpolation error could then be included as predictors rather than the original model SST. As an alternative, one could test the applicability of the model to non-interpolated SST data (also known as Level 3), starting already from the training phase. Moreover, this approach requires a specific OSSE and dedicated tests.
One additional aspect that deserves to be mentioned is that we carried out our tests in the Mediterranean Sea, which is likely one of the most complex areas in terms of upper ocean dynamics (though cloud coverage is less critical than elsewhere) [62]. This is due to the small Rossby radius of deformation (i.e., the scale at which buoyancy and rotation effects are comparable, which set the characteristic size of dominant flow instabilities) and the occurrence of intense, small-scale air–sea interactions (modulated by highly variable orography) that drive complex coastal dynamics that can significantly affect the source/sink terms in the upper-ocean-temperature-evolution equation. This may undermine our working hypothesis that small scale changes are substantially dominated by advection. It would thus be interesting to train (or even only to test) our model in other areas where intense mesoscale activity is observed (e.g., western boundary currents, Antarctic Circumpolar Current, etc.), eventually starting from different numerical simulations. Additionally, we plan to further improve the network architecture by implementing and testing the latest modules and ideas emerging from computer vision research (e.g., convolutional block attention module (CBAM)), [63]. Major advances might then come from the design of network architectures that admit the explicit use of sequences of ADT and SST data as predictors, which could then allow users to define physically informed loss functions (e.g., by enforcing some approximate potential vorticity/tracer conservation) to jointly improve the reconstruction of both current and tracer evolution over time.

Author Contributions

Conceptualization, B.B.N.; methodology, B.B.N., D.C. (Daniele Ciani), D.C. (Davide Cavaliere) and E.C.; investigation, B.B.N. and D.C. (Daniele Ciani); visualization, B.B.N. and D.C. (Daniele Ciani); supervision, B.B.N.; writing—original draft, B.B.N. and D.C. (Daniele Ciani); writing—review and editing, B.B.N. and D.C. (Daniele Ciani), D.C. (Davide Cavaliere) and E.C. All authors have read and agreed to the published version of the manuscript.

Funding

This work has been partly supported by the Copernicus Marine Environment Monitoring Service Multi Observations Thematic Assembly Center (CMEMS MOB TAC), funded through subcontracting agreement no. CLS-SCO-18-0004 between Consiglio Nazionale delle Ricerche and Collecte Localisation Satellites (CLS), the latter of which is presently leading the CMEMS MOB TAC. The 83-CMEMS-TAC-MOB contract was funded by Mercator Ocean as part of its delegation agreement with the European Union, represented by the European Commission, to set up and manage CMEMS. The data used for the observation system simulation experiment have been provided by the ocean CIRculation from ocean COLour observations (CIRCOL) project, funded by the European Space Agency via the contract grant no. 4000128147/19/I-DT.

Institutional Review Board Statement

Not applicable.

Informed Consent Statement

Not applicable.

Data Availability Statement

The dADR-SR code is available at: https://github.com/bbuong/dADR-SR (last accessed 14 January 2022) and training/test datasets are available at: https://doi.org/10.5281/zenodo.5815330 (last accessed 14 January 2022). The AMEDA code and description are freely accessible through https://github.com/briaclevu/AMEDA (last accessed 14 January 2022).

Acknowledgments

We thank Emanuela Clementi for providing support on the numerical simulation data used for the setup of the observing system simulation experiment and Milena Menna for providing support on the drifter database. We also wish to thank Claudia Cesarini for critical reading of the paper and useful suggestions on the presentation of the results. We acknowledge the use of imagery from the NASA Worldview application (https://worldview.earthdata.nasa.gov, last accessed 14 January 2022), part of the NASA Earth Observing System Data and Information System (EOSDIS).

Conflicts of Interest

The authors declare no conflict of interest.

References

  1. Schultz, M.G.; Betancourt, C.; Gong, B.; Kleinert, F.; Langguth, M.; Leufen, L.H.; Mozaffari, A.; Stadtler, S. Can deep learning beat numerical weather prediction? Philos. Trans. R. Soc. Lond. Ser. A Math. Phys. Eng. Sci. 2021, 379, 20200097. [Google Scholar] [CrossRef] [PubMed]
  2. Schneider, T.; Lan, S.; Stuart, A.; Teixeira, J. Earth System Modeling 2.0: A Blueprint for Models That Learn From Observations and Targeted High-Resolution Simulations. Geophys. Res. Lett. 2017, 44, 12396–12417. [Google Scholar] [CrossRef] [Green Version]
  3. Mulet, S.; Rio, M.-H.; Mignot, A.; Guinehut, S.; Morrow, R. A new estimate of the global 3D geostrophic ocean circulation based on satellite data and in-situ measurements. Deep Sea Res. Part II: Top. Stud. Oceanogr. 2012, 77–80, 70–81. [Google Scholar] [CrossRef]
  4. Moore, A.M.; Martin, M.J.; Akella, S.; Arango, H.G.; Balmaseda, M.A.; Bertino, L.; Ciavatta, S.; Cornuelle, B.; Cummings, J.; Frolov, S.; et al. Synthesis of Ocean Observations Using Data Assimilation for Operational, Real-Time and Reanalysis Systems: A More Complete Picture of the State of the Ocean. Front. Mar. Sci. 2019, 6. [Google Scholar] [CrossRef] [Green Version]
  5. Reichstein, M.; Camps-Valls, G.; Stevens, B.; Jung, M.; Denzler, J.; Carvalhais, N.; Prabhat. Deep learning and process understanding for data-driven Earth system science. Nature 2019, 566, 195–204. [Google Scholar] [CrossRef] [PubMed]
  6. Bolton, T.; Zanna, L. Applications of Deep Learning to Ocean Data Inference and Subgrid Parameterization. J. Adv. Model. Earth Syst. 2019, 11, 376–399. [Google Scholar] [CrossRef] [Green Version]
  7. Brajard, J.; Carrassi, A.; Bocquet, M.; Bertino, L. Combining data assimilation and machine learning to emulate a dynamical model from sparse and noisy observations: A case study with the Lorenz 96 model. J. Comput. Sci. 2020, 44, 101171. [Google Scholar] [CrossRef]
  8. Ruckstuhl, Y.; Janjić, T.; Rasp, S. Training a convolutional neural network to conserve mass in data assimilation. Nonlinear Process. Geophys. 2021, 28, 111–119. [Google Scholar] [CrossRef]
  9. Storto, A.; De Magistris, G.; Falchetti, S.; Oddo, P. A Neural Network-Based Observation Operator for Coupled Ocean-Acoustic Variational Data Assimilation. Mon. Weather Rev. 2021, 149, 1967–1985. [Google Scholar] [CrossRef]
  10. Vandal, T.; Kodra, E.; Ganguly, S.; Michaelis, A.; Nemani, R.; Ganguly, A.R. DeepSD: Generating high resolution climate change projections through single image super-resolution. arXiv 2017, arXiv:1703.03126. [Google Scholar]
  11. Barth, A.; Alvera-Azcárate, A.; Licer, M.; Beckers, J.-M. DINCAE 1.0: A convolutional neural network with error estimates to reconstruct sea surface temperature satellite observations. Geosci. Model Dev. 2020, 13, 1609–1622. [Google Scholar] [CrossRef] [Green Version]
  12. Sammartino, M.; Nardelli, B.B.; Marullo, S.; Santoleri, R. An Artificial Neural Network to Infer the Mediterranean 3D Chlorophyll-a and Temperature Fields from Remote Sensing Observations. Remote Sens. 2020, 12, 4123. [Google Scholar] [CrossRef]
  13. Nardelli, B.B. A Deep Learning Network to Retrieve Ocean Hydrographic Profiles from Combined Satellite and In Situ Measurements. Remote Sens. 2020, 12, 3151. [Google Scholar] [CrossRef]
  14. Han, Z.; He, Y.; Liu, G.; Perrie, W. Application of DINCAE to Reconstruct the Gaps in Chlorophyll-a Satellite Observations in the South China Sea and West Philippine Sea. Remote Sens. 2020, 12, 480. [Google Scholar] [CrossRef] [Green Version]
  15. Sauzède, R.; Claustre, H.; Uitz, J.; Jamet, C.; Dall’Olmo, G.; D’Ortenzio, F.; Gentili, B.; Poteau, A.; Schmechtig, C. A neural network-based method for merging ocean color and Argo data to extend surface bio-optical properties to depth: Retrieval of the particulate backscattering coefficient. J. Geophys. Res. Oceans 2016, 121, 2552–2571. [Google Scholar] [CrossRef] [Green Version]
  16. Sauzède, R.; Bittig, H.; Claustre, H.; De Fommervault, O.P.; Gattuso, J.-P.; Legendre, L.; Johnson, K.S. Estimates of Water-Column Nutrient Concentrations and Carbonate System Parameters in the Global Ocean: A Novel Approach Based on Neural Networks. Front. Mar. Sci. 2017, 4. [Google Scholar] [CrossRef]
  17. Sinha, A.; Abernathey, R. Estimating Ocean Surface Currents With Machine Learning. Front. Mar. Sci. 2021, 8. [Google Scholar] [CrossRef]
  18. Zheng, G.; Li, X.; Zhang, R.-H.; Liu, B. Purely satellite data–driven deep learning forecast of complicated tropical instability waves. Sci. Adv. 2020, 6, eaba1482. [Google Scholar] [CrossRef]
  19. Liu, Y.; Zheng, Q.; Li, X. Characteristics of Global Ocean Abnormal Mesoscale Eddies Derived From the Fusion of Sea Surface Height and Temperature Data by Deep Learning. Geophys. Res. Lett. 2021, 48, e2021GL094772. [Google Scholar] [CrossRef]
  20. Fablet, R.; Amar, M.; Febvre, Q.; Beauchamp, M.; Chapron, B. End-to- end physics-informed representation learning from and for satellite ocean remote sensing data. In Proceedings of the XXIV ISPRS 2021: Intenational Society for Photogrammetry and Remote Sensing Congress, Nice, France, 4–10 July 2021; p. hal-03189218. [Google Scholar]
  21. Pannekoucke, O.; Fablet, R. PDE-NetGen 1.0: From symbolic partial differential equation (PDE) representations of physical processes to trainable neural network representations. Geosci. Model Dev. 2020, 13, 3373–3382. [Google Scholar] [CrossRef]
  22. Raissi, M.; Perdikaris, P.; Karniadakis, G. Physics-informed neural networks: A deep learning framework for solving forward and inverse problems involving nonlinear partial differential equations. J. Comput. Phys. 2018, 378, 686–707. [Google Scholar] [CrossRef]
  23. Ouala, S.; Nguyen, D.; Drumetz, L.; Chapron, B.; Pascual, A.; Collard, F.; Gaultier, L.; Fablet, R. Learning latent dynamics for partially observed chaotic systems. Chaos Interdiscip. J. Nonlinear Sci. 2020, 30, 103121. [Google Scholar] [CrossRef] [PubMed]
  24. Fablet, R.; Beauchamp, M.; Drumetz, L.; Rousseau, F. Joint Interpolation and Representation Learning for Irregularly Sampled Satellite-Derived Geophysical Fields. Front. Appl. Math. Stat. 2021, 7, 655224. [Google Scholar] [CrossRef]
  25. Wang, Z.; Chen, J.; Hoi, S.C.H. Deep Learning for Image Super-Resolution: A Survey. IEEE Trans. Pattern Anal. Mach. Intell. 2020, 43, 3365–3387. [Google Scholar] [CrossRef] [Green Version]
  26. Dong, C.; Loy, C.C.; He, K.; Tang, X. Image Super-Resolution Using Deep Convolutional Networks. IEEE Trans. Pattern Anal. Mach. Intell. 2016, 38, 295–307. [Google Scholar] [CrossRef] [Green Version]
  27. Ducournau, A.; Fablet, R. Deep learning for ocean remote sensing: An application of convolutional neural networks for super-resolution on satellite-derived SST data. In Proceedings of the 9th IAPR Workshop on Pattern Recogniton in Remote Sensing (PRRS), Cancun, Mexico, 4 December 2016; pp. 1–6. [Google Scholar] [CrossRef]
  28. Höhlein, K.; Kern, M.; Hewson, T.; Westermann, R. A comparative study of convolutional neural network models for wind field downscaling. Meteorol. Appl. 2020, 27, e1961. [Google Scholar] [CrossRef]
  29. Rio, M.-H.; Santoleri, R.; Bourdalle-Badie, R.; Griffa, A.; Piterbarg, L.; Taburet, G. Improving the Altimeter-Derived Surface Currents Using High-Resolution Sea Surface Temperature Data: A Feasability Study Based on Model Outputs. J. Atmospheric Ocean. Technol. 2016, 33, 2769–2784. [Google Scholar] [CrossRef]
  30. Lopez-Dekker, P.; Biggs, J.; Chapron, B.; Hooper, A.; Kääb, A.; Masina, S.; Mouginot, J.; Buongiorno Nardelli, B.; Pasquero, C. The Harmony Mission: End of Phase-0 Science Overview. In Proceedings of the 2021 IEEE International Geoscience and Remote Sensing Symposium IGARSS, Brussels, Belgium, 11–16 July 2021; pp. 7752–7755. [Google Scholar]
  31. Gommenginger, C.; Chapron, B.; Hogg, A.; Buckingham, C.; Fox-Kemper, B.; Eriksson, L.; Soulat, F.; Ubelmann, C.; Ocampo-Torres, F.; Burbidge, G. SEASTAR: A Mission to Study Ocean Submesoscale Dynamics and Small-Scale Atmosphere-Ocean Processes in Coastal, Shelf and Polar Seas. Front. Mar. Sci. 2019, 6, 457. [Google Scholar] [CrossRef] [Green Version]
  32. Taburet, G.; Sanchez-Roman, A.; Ballarotta, M.; Pujol, M.-I.; Legeais, J.-F.; Fournier, F.; Faugere, Y.; Dibarboure, G. DUACS DT2018: 25 years of reprocessed sea level altimetry products. Ocean Sci. 2019, 15, 1207–1224. [Google Scholar] [CrossRef] [Green Version]
  33. Ballarotta, M.; Ubelmann, C.; Pujol, M.-I.; Taburet, G.; Fournier, F.; Legeais, J.-F.; Faugère, Y.; Delepoulle, A.; Chelton, D.; Dibarboure, G.; et al. On the resolutions of ocean altimetry maps. Ocean Sci. 2019, 15, 1091–1109. [Google Scholar] [CrossRef] [Green Version]
  34. Amores, A.; Jordà, G.; Arsouze, T.; Le Sommer, J. Up to What Extent Can We Characterize Ocean Eddies Using Present-Day Gridded Altimetric Products? J. Geophys. Res. Ocean. 2018, 123, 7220–7236. [Google Scholar] [CrossRef]
  35. Stegner, A.; Le Vu, B.; Dumas, F.; Ghannami, M.A.; Nicolle, A.; Durand, C.; Faugere, Y. Cyclone-Anticyclone Asymmetry of Eddy Detection on Gridded Altimetry Product in the Mediterranean Sea. J. Geophys. Res. Oceans 2021, 126, e2021JC017475. [Google Scholar] [CrossRef]
  36. Mahadevan, A.; Tandon, A. An analysis of mechanisms for submesoscale vertical motion at ocean fronts. Ocean Model. 2006, 14, 241–256. [Google Scholar] [CrossRef]
  37. Nardelli, B.B.; Tronconi, C.; Pisano, A.; Santoleri, R. High and Ultra-High resolution processing of satellite Sea Surface Temperature data over Southern European Seas in the framework of MyOcean project. Remote Sens. Environ. 2013, 129, 1–16. [Google Scholar] [CrossRef]
  38. Chin, T.M.; Vazquez-Cuervo, J.; Armstrong, E.M. A multi-scale high-resolution analysis of global sea surface temperature. Remote Sens. Environ. 2017, 200, 154–169. [Google Scholar] [CrossRef]
  39. Bowen, M.M.; Emery, W.; Wilkin, J.; Tildesley, P.C.; Barton, I.J.; Knewtson, R. Extracting Multiyear Surface Currents from Sequential Thermal Imagery Using the Maximum Cross-Correlation Technique. J. Atmospheric Ocean. Technol. 2002, 19, 1665–1676. [Google Scholar] [CrossRef] [Green Version]
  40. Ciani, D.; Rio, M.-H.; Menna, M.; Santoleri, R. A Synergetic Approach for the Space-Based Sea Surface Currents Retrieval in the Mediterranean Sea. Remote Sens. 2019, 11, 1285. [Google Scholar] [CrossRef] [Green Version]
  41. Ciani, D.; Rio, M.-H.; Nardelli, B.B.; Etienne, H.; Santoleri, R. Improving the Altimeter-Derived Surface Currents Using Sea Surface Temperature (SST) Data: A Sensitivity Study to SST Products. Remote Sens. 2020, 12, 1601. [Google Scholar] [CrossRef]
  42. Isern-Fontanet, J.; García-Ladona, E.; González-Haro, C.; Turiel, A.; Rosell-Fieschi, M.; Company, J.B.; Padial, A. High-Resolution Ocean Currents from Sea Surface Temperature Observations: The Catalan Sea (Western Mediterranean). Remote Sens. 2021, 13, 3635. [Google Scholar] [CrossRef]
  43. Rio, M.-H.; Santoleri, R. Improved global surface currents from the merging of altimetry and Sea Surface Temperature data. Remote Sens. Environ. 2018, 216, 770–785. [Google Scholar] [CrossRef]
  44. Ciani, D.; Charles, E.; Nardelli, B.B.; Rio, M.-H.; Santoleri, R. Ocean Currents Reconstruction from a Combination of Altimeter and Ocean Colour Data: A Feasibility Study. Remote Sens. 2021, 13, 2389. [Google Scholar] [CrossRef]
  45. Clementi, E.; Pistoia, J.; Escudier, R.; Delrosso, D.; Drudi, M.; Grandi, A.; Lecci, R.; Cretí, S.; Ciliberti, S.; Coppini, G.; et al. Mediterranean Sea Analysis and Forecast (CMEMS MED-Currents 2016–2019) (Version 1) [Data Set]; Copernicus Monitoring Environment Marine Service (CMEMS): Ramonville-Saint-Agne, France, 2021. [Google Scholar] [CrossRef]
  46. Poulain, P.-M.; Menna, M.; Mauri, E. Surface Geostrophic Circulation of the Mediterranean Sea Derived from Drifter and Satellite Altimeter Data. J. Phys. Oceanogr. 2012, 42, 973–990. [Google Scholar] [CrossRef]
  47. Hansen, D.V.; Poulain, P.-M. Quality Control and Interpolations of WOCE-TOGA Drifter Data. J. Atmospheric Ocean. Technol. 1996, 13, 900–909. [Google Scholar] [CrossRef] [Green Version]
  48. Menna, M.; Poulain, P.-M.; Bussani, A.; Gerin, R. Detecting the drogue presence of SVP drifters from wind slippage in the Mediterranean Sea. Measurement 2018, 125, 447–453. [Google Scholar] [CrossRef]
  49. Carrère, L.; Lyard, F. Modeling the barotropic response of the global ocean to atmospheric wind and pressure forcing—comparisons with observations. Geophys. Res. Lett. 2003, 30. [Google Scholar] [CrossRef] [Green Version]
  50. Gaultier, L.; Ubelmann, C.; Fu, L.-L. The Challenge of Using Future SWOT Data for Oceanic Field Reconstruction. J. Atmospheric Ocean. Technol. 2016, 33, 119–126. [Google Scholar] [CrossRef]
  51. Kingma, D.P.; Ba, J.L. Adam: A method for stochastic optimization. In Proceedings of the International Conference on Learning Representations (ICLR), San Diego, CA, USA, 7–9 May 2015; pp. 1–15. Available online: https://hdl.handle.net/11245/1.505367 (accessed on 1 March 2021).
  52. Ghiasi, G.; Lin, T.Y.; Le, Q.V. Dropblock: A regularization method for convolutional networks. Adv. Neural Inf. Process. Syst. 2018, arXiv:1810.12890v1 [cs.CV], 10727–10737. [Google Scholar]
  53. Le Vu, B.; Stegner, A.; Arsouze, T. Angular Momentum Eddy Detection and Tracking Algorithm (AMEDA) and Its Application to Coastal Eddy Formation. J. Atmospheric Ocean. Technol. 2018, 35, 739–762. [Google Scholar] [CrossRef]
  54. Bagaglini, L.; Falco, P.; Zambianchi, E. Eddy Detection in HF Radar-Derived Surface Currents in the Gulf of Naples. Remote Sens. 2019, 12, 97. [Google Scholar] [CrossRef] [Green Version]
  55. Lim, B.; Son, S.; Kim, H.; Nah, S.; Lee, K.M. Enhanced deep residual networks for single image super-resolution. In Proceedings of the IEEE Conference on Computer Vision and Pattern Recognition Workshops (CVPRW), Honolulu, HI, USA, 21–26 July 2017; pp. 136–144. [Google Scholar] [CrossRef] [Green Version]
  56. He, K.; Zhang, X.; Ren, S.; Sun, J. Deep residual learning for image recognition. In Proceedings of the IEEE Conference on Computer Vision and Pattern Recognition (CVPR), Las Vegas, NV, USA, 27–30 June 2016. [Google Scholar]
  57. Szegedy, C.; Ioffe, S.; Vanhoucke, V.; Alemi, A.A. Inception-v4, inception-ResNet and the impact of residual connections on learning. In Proceedings of the 31st AAI Conference on Artificial Intelligence, San Francisco, CA, USA, 4–9 February 2017; pp. 4278–4284. [Google Scholar]
  58. Liu, S.; Gang, R.; Li, C.; Song, R. Adaptive deep residual network for single image super-resolution. Comput. Vis. Media 2019, 5, 391–401. [Google Scholar] [CrossRef] [Green Version]
  59. Hu, J.; Shen, L.; Albanie, S.; Sun, G.; Wu, E. Squeeze-and-Excitation Networks. IEEE Trans. Pattern Anal. Mach. Intell. 2020, 42, 2011–2023. [Google Scholar] [CrossRef] [PubMed] [Green Version]
  60. Shi, W.; Jiang, F.; Zhao, D. Single image super-resolution with dilated convolution based multi-scale information learning inception module. In Proceedings of the IEEE International Conference on Image Processing (ICIP), Beijing, China, 17–20 September 2017; pp. 977–981. [Google Scholar] [CrossRef] [Green Version]
  61. Luo, W.; Li, Y.; Urtasun, R.; Zemel, R. Understanding the effective receptive field in deep convolutional neural networks. In Proceedings of the 30th Conference on Neural Information Processing Systems (NIPS 2016), Barcelona, Spain, 5–10 December 2016; pp. 4905–4913. [Google Scholar]
  62. Malanotte-Rizzoli, P.; Artale, V.; Borzelli-Eusebi, G.L.; Brenner, S.; Crise, A.; Gacic, M.; Kress, N.; Marullo, S.; D’Alcalà, M.R.; Sofianos, S.; et al. Physical forcing and physical/biochemical variability of the Mediterranean Sea: A review of unresolved issues and directions for future research. Ocean Sci. 2014, 10, 281–322. [Google Scholar] [CrossRef] [Green Version]
  63. Woo, S.; Park, J.; Lee, J.; Kweon, I.S. CBAM: Convolutional Block Attention Module. In Proceedings of the European Conference on Computer Vision, Munich, Germany, 8–14 September 2018. [Google Scholar] [CrossRef] [Green Version]
Figure 1. Super-Resolution Convolutional Neural Network (SRCNN) adapted to the reconstruction of absolute dynamic topography from multiple channel inputs. (A) SRCNN network architecture. (BE) Relative performance of the SRCNN reconstructions, assessed on the independent test data as the difference between the RMSD between the altimeter-like and original model output and the RMSD between the super-resolved absolute dynamic topography (ADT) and the original model ADT (red indicates smaller RMSD from model predictions). The panels show the performance of the models trained/tested considering: (B) the full set of predictor variables; (C) removing ∂SST⁄∂t from the predictors; (D) removing ∆ADT from the predictors; (E) removing both ∂SST⁄∂t and ∆ADT. ADT and related RMSD values are expressed in m.
Remotesensing 14 01159 g001
Figure 2. Enhanced Deep Super-Resolution (EDSR) baseline model tested for the reconstruction of high-resolution absolute dynamic topography from multiple channel inputs. (A) EDSR network architecture. EDSR is based on a specific residual block design. (B,C) Relative performance of the EDSR reconstructions, assessed on the independent test data as the difference between the RMSD between the altimeter-like and original model output and the RMSD between the super-resolved ADT and the original model ADT (red indicates smaller RMSD from model predictions). The panels show the performance of the models trained/tested considering: (B) EDSR and the full set of predictor variables; (C) EDSR removing ∆ADT from the predictors. ADT and related RMSD values are expressed in m.
Remotesensing 14 01159 g002
Figure 3. Adaptive Super-Resolution (ADR-SR) baseline model tested for the reconstruction of high-resolution absolute dynamic topography from multiple channel inputs. (A) ADR-SR network. ADR-SR is based on the inclusion of a squeeze-and-excitation module within its residual block design. (B,C) Relative performance of the ADR-SR reconstructions, assessed on the independent test data as the difference between the RMSD between the altimeter-like and original model output and the RMSD between the super-resolved ADT and the original model ADT (red indicates smaller RMSD from model predictions). The panels show the performance of the models trained/tested considering: (B) ADR-SR and the full set of predictor variables; (C) ADR-SR removing ∆ADT from the predictors. ADT and related RMSD values are expressed in m.
Remotesensing 14 01159 g003
Figure 4. The dilated Adaptive Super-Resolution (dADR-SR) model developed to reconstruct high-resolution absolute dynamic topography from multiple channel inputs. (A) The dADR-SR network architecture; dADR-SR is based on the inclusion of dilated, convolution-based learning inception modules in the core layers of ADR-SR. (B,C) Relative performance of the dADR-SR reconstructions, assessed on the independent test data as the difference between the RMSD between the altimeter-like and original model output and the RMSD between the super-resolved ADT and the original model ADT (red indicates smaller RMSD from model predictions). The panels show the performance of the models trained/tested considering: (B) dADR-DR and the full set of predictor variables; (C) dADR-SR removing ∆ADT from the predictors. ADT and related RMSD values are expressed in m.
Remotesensing 14 01159 g004
Figure 5. The dADR-SR model performance compared to simulated standard altimetry. (A) RMSD between the altimeter-like and original model output and (B) RMSD between the super-resolved absolute dynamic topography (ADT) obtained with dADR-SR (using full predictors set) and the original model ADT. ADT and related RMSD values are expressed in m.
Remotesensing 14 01159 g005
Figure 6. The dADR-SR prediction from real satellite-derived absolute dynamic topography (ADT) and sea surface temperature data (SST) for one example date (17-07-2016). (A) Original altimeter-based surface geostrophic currents (obtained from the ADT gradients); (B) super-resolved surface geostrophic currents; (C) satellite SST field. The cyan box in (C) identifies the area plotted in Figure 7.
Remotesensing 14 01159 g006
Figure 7. Dynamical structures reconstructed by dADR-SR prediction from real satellite-derived absolute dynamic topography (ADT) and sea surface temperature data (SST) (zoomed from Figure 6). (A) Original altimeter-based surface geostrophic currents; (B) super-resolved surface geostrophic currents; (C,D) satellite SST field with overplot of the eddy contours identified through AMEDA detection algorithm (red = cyclonic, blue = anticyclonic, black dots stand for automatically detected eddy centres) applied to original altimeter currents (C) and to super-resolved field (D). A–F letters serve to more easily locate the dynamical features that are recovered by dADR-SR and missed/misplaced by standard altimetry products (discussed in the text).
Remotesensing 14 01159 g007
Figure 8. Impact of cloud cover on satellite SST interpolated data. Interpolated field; (A,B), related nominal interpolation error; (C,D), MODIS Terra pseudo-true colour images; (E,F) from NASA Worldview (https://worldview.earthdata.nasa.gov, last accessed on 14 January 2022). On the first date, clear-sky conditions (E) lead to extremely clear and distinct SST patterns and low interpolation errors in all the Mediterranean (A,C). Three days later, clouds arriving from Morocco (F) prevent the reconstruction of small-scale dynamical features in the SST field and lead to increased interpolation errors (B,D). The thin cyan box identifies the area zoomed in Figure 9.
Remotesensing 14 01159 g008
Figure 9. Impact of the smoothing introduced by SST data interpolation on the dynamical reconstruction (zoomed from Figure 8). (A,B) original altimeter-based surface geostrophic currents; (C,D) super-resolved surface geostrophic currents; (EH) SST L4 field with overplot of the eddy contours identified through AMEDA detection algorithm (red = cyclonic, blue = anticyclonic, black dots stand for automatically detected eddy centres) applied to original altimeter currents (E,F) and to super-resolved field (G,H). Current vectors are overplot in (AD) plots.
Remotesensing 14 01159 g009
Figure 10. Performance of dADR-SR reconstruction of the geostrophic currents with respect to standard altimeter L4 data along drifter trajectories. The plots show the difference between the absolute error of altimetry and that of super-resolved currents, estimated vs the drifter velocities: (A) zonal component; (B) meridional component. Positive values indicate an improvement with respect to altimetry.
Remotesensing 14 01159 g010
Publisher’s Note: MDPI stays neutral with regard to jurisdictional claims in published maps and institutional affiliations.

