Article

Quantitatively Assessing the Contributions of Dust Aerosols to Direct Radiative Forcing Based on Remote Sensing and Numerical Simulation

Laboratory of Climate Resource Development and Disaster Prevention in Gansu Province, College of Atmospheric Sciences, Lanzhou University, Lanzhou 730000, China
*
Author to whom correspondence should be addressed.
Remote Sens. 2022, 14(3), 660; https://doi.org/10.3390/rs14030660
Submission received: 23 December 2021 / Revised: 24 January 2022 / Accepted: 27 January 2022 / Published: 29 January 2022

Abstract

:
Dust aerosols substantially impinge on the Earth’s climate by altering its energy balance, particularly over Northwest China, where dust storms occur frequently. However, the quantitative contributions of dust aerosols to direct radiative forcing (DRF) are not fully understood and warrant in-depth investigations. Taking a typical dust storm that happened during 9–12 April 2020 over Northwest China as an example, four simulation experiments based on the Weather Research and Forecasting model coupled with Chemistry (WRF-Chem) were designed, including a real scenario with dust emissions and three hypothetical scenarios without dust emissions, with dust emissions doubled, and with dust emissions reduced by half, to quantitatively evaluate the contributions of dust aerosols to DRF and then to surface temperature, with particular attention to the differences between daytime and nighttime. Moreover, multi-satellite observations were used to reveal the behavior of dust events and to evaluate the model performance. During the daytime, the net dust radiative forcing induced by dust aerosols was –3.76 W/m2 at the surface (SFC), 3.00 W/m2 in the atmosphere (ATM), and –0.76 W/m2 at the top of the atmosphere (TOA), and thus led to surface air temperature cooling by an average of –0.023 °C over Northwest China. During the nighttime, the net dust radiative forcing was 2.20 W/m2 at the SFC, –2.65 W/m2 in the ATM, and –0.45 W/m2 at the TOA, which then resulted in surface temperature warming by an average of 0.093 °C over Northwest China. These results highlight that the contribution of dust aerosols to DRF is greater during the daytime than that during the nighttime, while exhibiting the opposite impact on surface temperature, as dust can slow down the rate of surface temperature increases (decreases) by reducing (increasing) the surface energy during the daytime (nighttime). Our findings are critical to improving the understanding of the climate effects related to dust aerosols and provide scientific insights for coping with the corresponding disasters induced by dust storms in Northwest China.

1. Introduction

Large amounts of dust aerosols are emitted every year from semiarid or arid areas [1]. The interaction of dust particles with longwave (LW) and shortwave (SW) radiation, which changes the radiation flux and thus affects surface and atmospheric temperatures depending on the size, shape, and mineral composition of dust particles, is known as the direct aerosol effect [2,3]. The direct effect of dust aerosols not only affects many of the processes that regulate regional climate but can also affect the efficiency of solar installations [4,5,6,7]. In addition, dust aerosols can affect climate through semidirect effects [8,9] and indirect effects [10,11,12]. These results highlight that dust aerosols have important effects on regional and even global climate change [13,14,15]. According to Zhang et al. [16], the dust surface concentration is about 85 μg/m3 in Northwest China, accounting for 35–60% of the total aerosol mass concentration. Meanwhile, Northwest China has the Gobi Desert and Taklimakan Desert, which are the two main dust sources in East Asia [17]. Previous observations have shown that East Asian dust is more absorptive, with a single-scattering albedo at 500 nm as low as 0.76, considerably smaller than the relevant values measured in Africa [18]. The regional mean dust direct radiative forcing (DRF) in China is much larger than that on the global scale and has great uncertainty, which may have a significant impact on the climate in East Asia [19,20,21]. Meanwhile, Northwest China belongs to the semiarid and arid regions that are very sensitive to climate change [14,22]. Therefore, it is of great significance to assess dust DRF and its climatic effects in Northwest China.
The technology of satellite remote sensing, which has the features of spatial continuity, wide coverage, and dynamic observation, plays a significant role in dust storm monitoring [23]. Satellite remote sensing has been widely adopted for studies related to dust storms [24,25,26]. Using Moderate Resolution Imaging Spectroradiometer (MODIS) and Multiangle Imaging Spectroradiometer (MISR) data, Yu et al. [27] found that dust storms in Saudi Arabia occur most frequently in the spring and summer in north-central Saudi Arabia and in the early spring and summer in southwestern Saudi Arabia. Wang et al. [28] studied the impact of dust on the retrieval of cloud top height from multisource remote sensing data in Northwest China, and the results indicate that dust has the greatest effect on the retrieval of cloud top height from nimbostratus and the least impact on cirrus. Through the Cloud-Aerosol Lidar and Infrared Pathfinder Satellite Observation (CALIPSO) products, Huang et al. [29] pointed out that the frequency of occurrence of dust is 53% during summer over Tibet, which is much higher than that observed by ground-based stations. Combining CALIPSO, the Clouds and the Earth’s Radiant Energy System (CERES), and the Fu–Liou radiation model, Huang et al. [4] indicated that dust has an important effect on the radiative energy balance in the Taklamakan Desert. Overall, it is necessary to use multisource satellite data to quantitatively assess the direct radiative contribution of dust aerosols in Northwest China and to validate the model results.
Numerical simulation is a very effective approach to assess the subsequent effects of dust aerosols and therefore has been used by many researchers to study the radiative effects of dust [30,31,32]. However, most previous studies focused on estimating the dust DRF throughout the day during the study period and have not quantitatively examined the difference between daytime and nighttime dust DRF in Northwest China. There are also still uncertainties in the simulation of dust DRF. Chen et al. [33] found that –3.97, 1.61, and –5.58 W/m2 of dust DRF were generated at the top of the atmosphere (TOA), in the atmosphere (ATM), and at the surface (SFC), respectively, from a dust event that appeared in Northwest China during 26–30 July 2007. Over the Tibetan Plateau, Hu et al. [34] pointed out that the annual mean SW, LW, and net dust DRF is –1.40, 0.13, and –1.27 W/m2 at the TOA; 0.67, –0.26, and 0.41 W/m2 in the ATM; and –2.08, 0.39, and –1.69 W/m2 at the SFC, respectively. By simulating the dust in East Asia from 2007 to 2011, Zhang et al. [35] noted that the annual dust DRF under all-sky conditions over East Asia is –0.84 W/m2 at the TOA, –1.23 W/m2 at the SFC, and 0.39 W/m2 in the ATM. Furthermore, most previous studies focused on validating the model’s ability to simulate dust (e.g., dust loading and optical properties), yet few studies combined satellite remote sensing data to validate model-simulated radiative fluxes [36,37], which are important for estimating the dust DRF by using models.
From 9 to 11 April 2020, affected cold air and strong winds caused by the Mongolia cyclone, blowing sand, and floating dust weather occurred in parts of eastern Xinjiang and northern Xinjiang, western Gansu and western Inner Mongolia, and dust storms occurred in the southern Xinjiang Basin and some parts of western Gansu. Taking this dust event as a case study, this study attempts to quantitatively assess the contributions of dust aerosols to DRF and then to surface temperature over Northwest China, with particular attention to the differences between daytime and nighttime, by using numerical simulation and multi-satellite observations. The findings are expected to improve the understanding of climate effects related to dust aerosols and to provide scientific insights for coping with the corresponding disasters induced by dust storms in Northwest China. In Section 2, the model settings, methods, and data used in the study are briefly introduced. The main results, including the model evaluation, the dust DRF of different dust emissions, and the impact of dust aerosols on the energy budget and temperature at the SFC, are given in Section 3. The major findings are summarized in Section 4.

2. Materials and Methods

2.1. Model Description
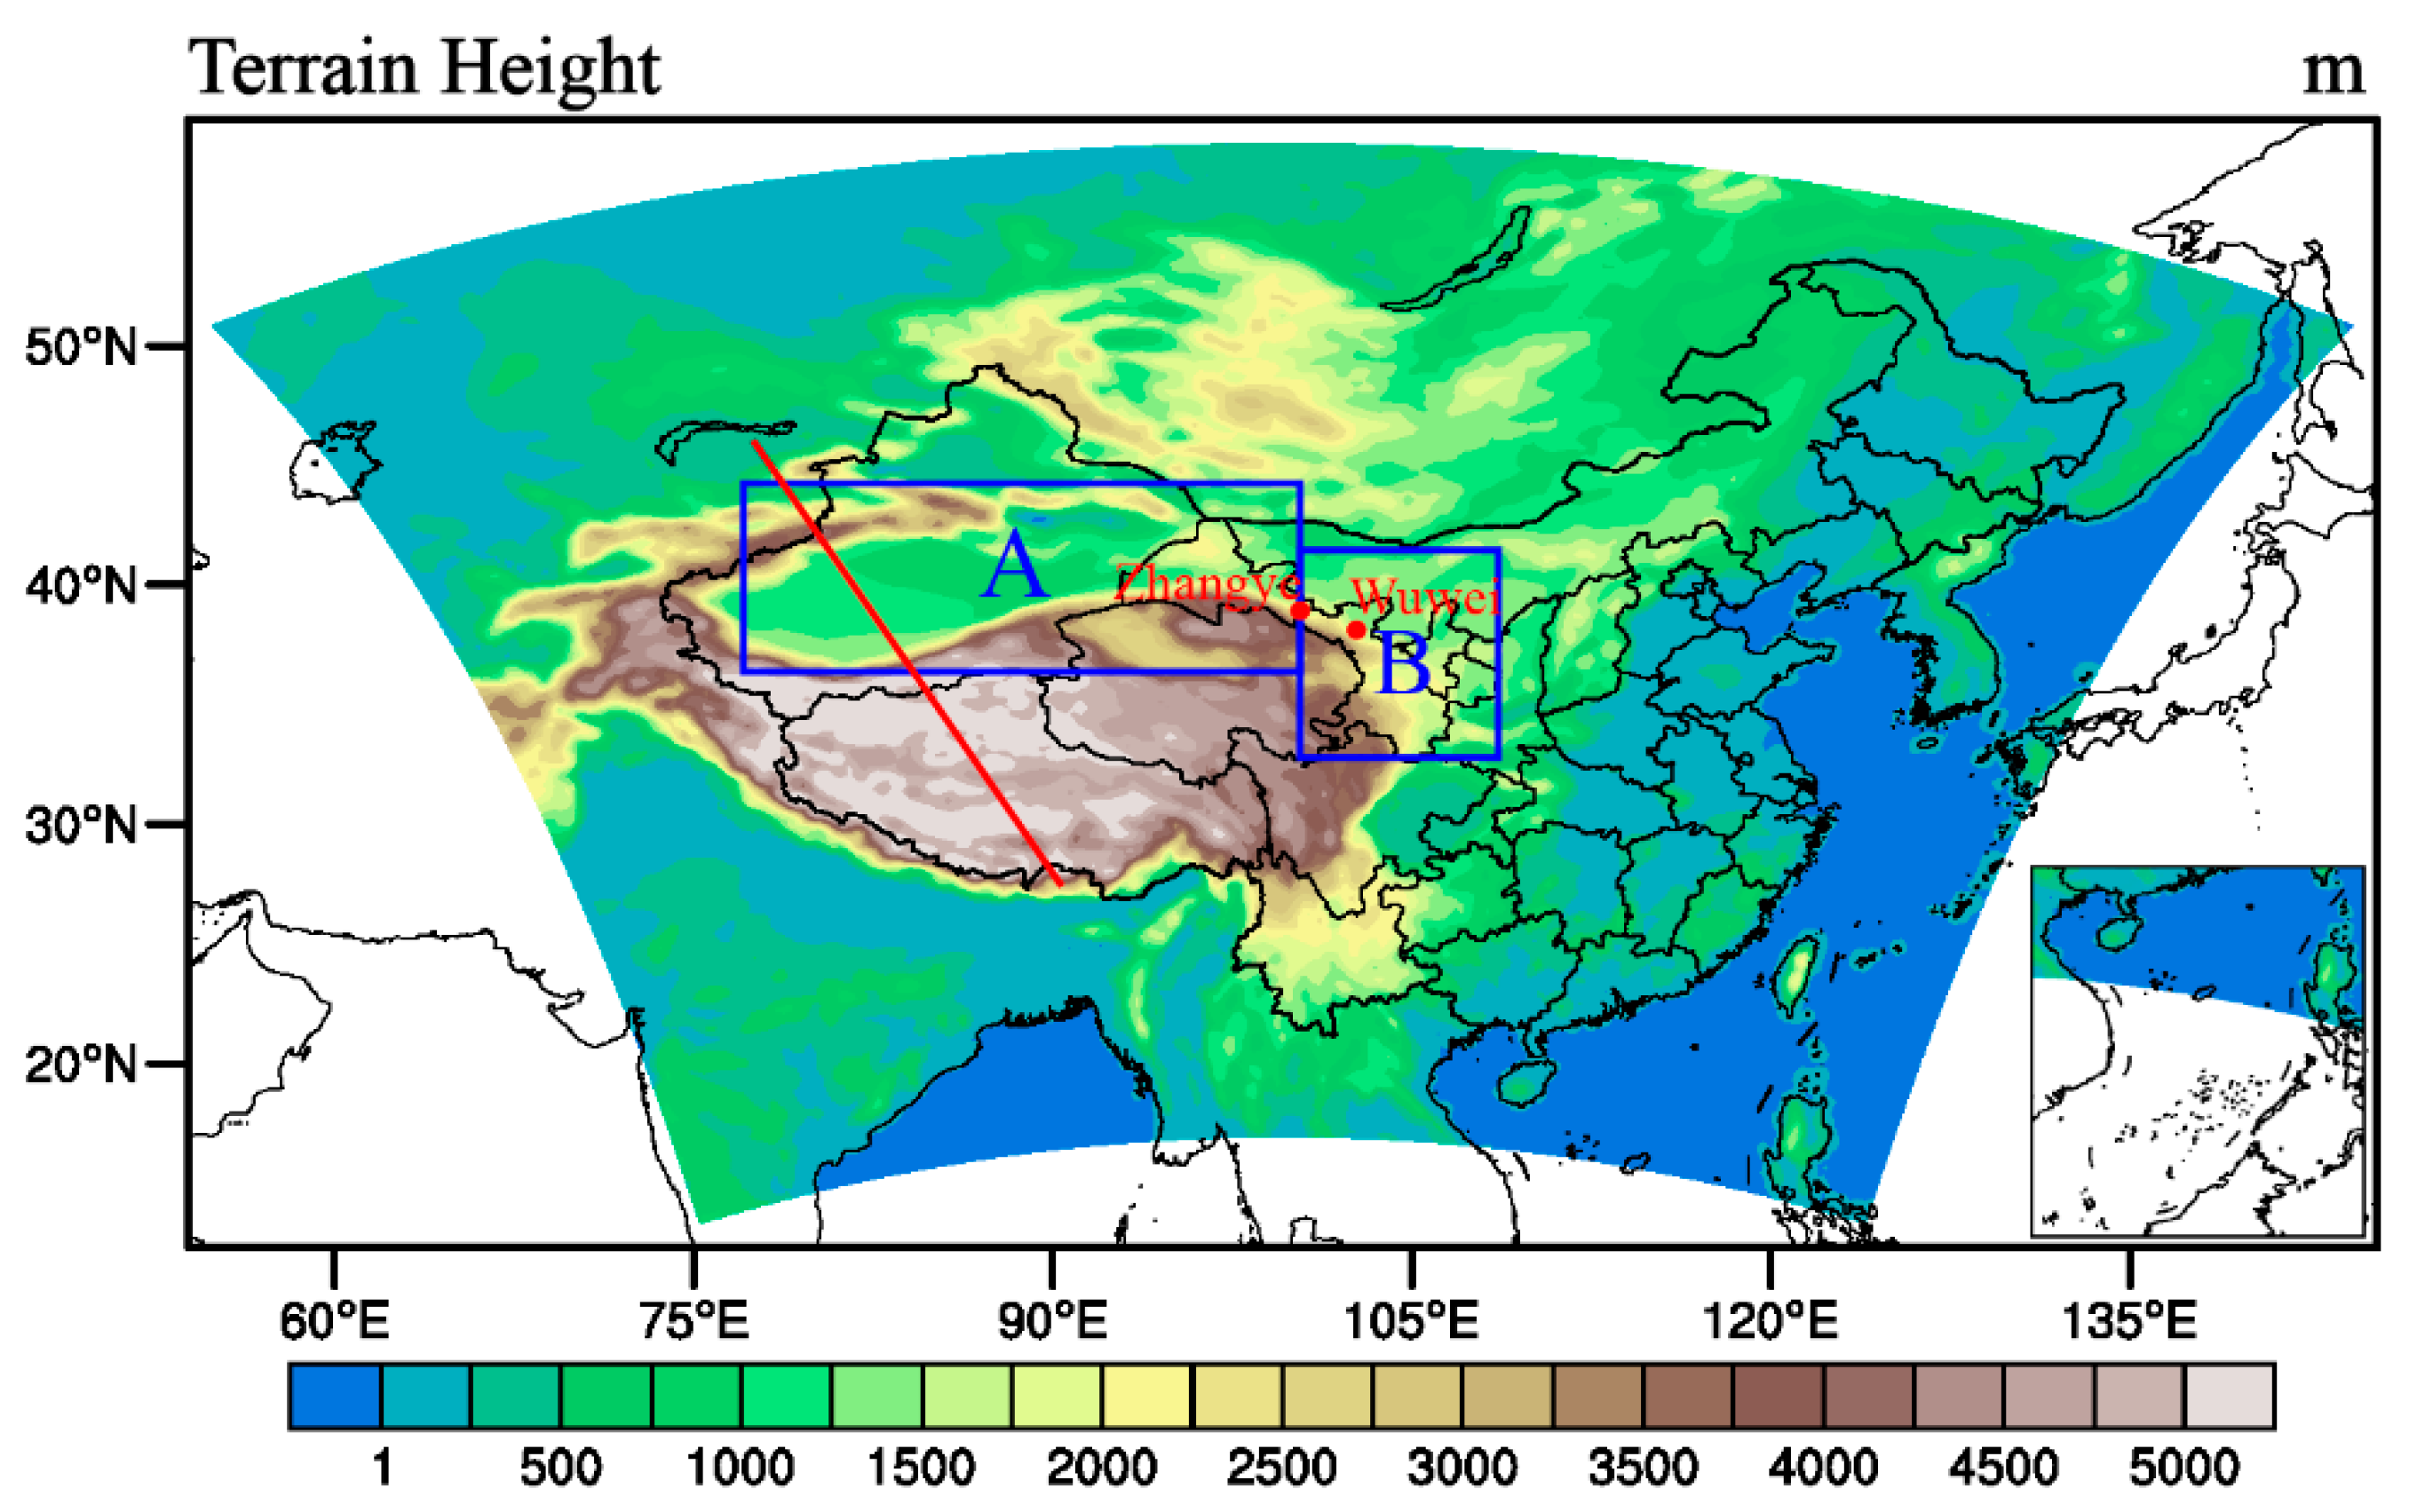
Here, the Weather Research and Forecasting model coupled with Chemistry (WRF-Chem, V4.1.3) was selected to quantitatively assess the contributions of dust aerosols to DRF. The model domain is given in Figure 1, centered at 37°N, 100°E with a horizontal resolution of 30 km and 216 × 172 grids. The model atmosphere was divided into 48 vertical layers up to 50 hPa, with higher density of vertical levels in the lower layers (25 layers below the troposphere). The dust simulated by the model was initialized by a "cold start" method. The simulation period was from 8 April 2020 to 12 April 2020 and the first 24 h of the simulation was spin-up. The boundary and initial meteorological conditions were obtained from the National Centers for Environmental Prediction (NCEP) Final Analysis (FNL) data at 1° horizontal resolution and 6 h temporal.
The model used the Lin microphysics scheme [38], the Rapid Radiative Transfer Model for General Circulation Models (RRTMG) shortwave and longwave radiation scheme [39], the Grell–Freitas Cumulus Parameterization scheme [40], the Noah land surface scheme [41], the Yonsei University (YSU) planetary boundary scheme [42], and the Monin–Obukhov surface layer scheme [43]. For the chemical process, the GOCART coupled with the RACM-KPP scheme [44], the Shao04 dust emission scheme [45], and the Fast-J photolysis scheme [46] were used, and the Maxwell approximation [47] was used for the dust aerosol optical properties. The model considered dust aerosols and radiative feedback but did not consider mechanisms such as biological aerosols, sea salt aerosols, or wet cleaning processes (dust-only simulation). The modeled atmospheric wind was nudged towards the FNL data with a timescale of 6 h and a nudging coefficient G = 0.0003 s−1 to generate a more realistic simulation of the major weather systems and large-scale circulation.
The Shao04 scheme, a simplified version of the dust emission flux calculation in the Shao01 scheme [48], pointed out that the mechanism for generating dust emissions should be composed of two parts: saltation bombardment and aggregate disintegration through wind tunnel experiments. The performance of the Shao04 scheme was tested by Shao et al. [49] using Japan–Australia Dust Experiment data, and the evaluated dust plume was generally consistent with the measurements. Here follows the Shao04 scheme:
F ( d i , d s ) = c y η f i [ ( 1 γ ) + γ p m ( d i ) p f ( d i ) ] Q d s g u * 2 ( 1 + σ m )
where F ( d i , d s ) is the vertical dust flux of particle size d i induced by the saltation of particle d s , c y is a dimensionless coefficient (default is 0.00001), η f i is the fully disturbed dust fraction in bin d i , γ describes the ability of aggregated dust to be released, p m ( d i ) is the minimally disturbed particle size distribution and p f ( d i ) is the fully disturbed particle size distribution, Q d s is the saltation flux of particles d s , g is the gravitational acceleration, u * is the friction velocity, and σ m is the bombardment efficiency.
Q d s = ( 1 c f ) 2.3 ρ a g u * 3 ( 1 u * t u * ) ( 1 + u * t u * ) 2 ,   u * u * t
where c f is vegetation fraction, ρ a is the air density, u * t is the threshold friction velocity, and 2.3 is an adjustable empirical factor.

2.2. Study Area

In order to describe the contribution of dust to DRF in Northwest China in detail, we divided the study area into the dust source region (DSR) and the dust affected region (DAR) according to the desert (Taklimakan and Gobi deserts) and the dust distribution during the study period, as shown in Figure 1. According to the spatial distribution of arid and semi-arid regions in Asia described by Huang et al. [50], the DSR belongs to the hyper-arid region and the DAR to the semi-arid region. The geographical information of the two regions is shown in Table S1.

2.3. Sensitivity Experiments

Four sensitivity experiments were designed to investigate the impact of dust on radiation and temperature, one without dust aerosols and their feedback, and the others with these factors.
The first set of experiments simulated dust aerosols under actual conditions, and the feedback between dust and radiation was turned on (CTL). The second set of experiments did not include dust aerosols, with the chemical composition set to zero (NoDust). In the third experiment, except for modifying the empirical proportionality constant to make the dust aerosol concentration twice that of CTL, the other settings were the same as those of CTL (DoubleDust). The last experiment had the same settings as CTL, except that the dust aerosol concentration was half (HalfDust). We modified the dust emission by modifying the empirical factor (2.3 in Equation (2)). The difference between the four experiments made it possible to quantitatively examine the dust impact on radiation, temperature, and surface energy budget.

2.4. Data

The Moderate Resolution Imaging Spectroradiometer (MODIS) was carried on the Terra and Aqua satellites. The Terra and Aqua satellites pass over the equator at approximately 10:30 local time (descending orbit) and 13:30 local time (ascending orbit), respectively. MODIS has a total of 36 bands at different bandwidths. The 1st–7th wavelengths (from 620 to 2155 nm) are available for retrieval of aerosol data. There are two methods for retrieving aerosol optical depth (AOD) in MODIS data: “dark target” (DT) and “deep blue” (DB). The DT algorithm cannot be implemented over bright surfaces (e.g., desert and snow), whereas the DB algorithm can retrieve AOD even over bright surfaces [51,52]. The AOD that combines both the DB algorithm and the DB algorithm at 550 nm with a resolution of 10 × 10 pixel scale (10 km at nadir) from MODIS level 2 collection 6 products (MYD04_L2 and MOD04_L2) was used to evaluate the model simulations (https://ladsweb.modaps.eosdis.nasa.gov/search/ (accessed on 28 May 2021)). More information about the data can be found in Table S2. Data with Confidence Flag of 2 (good) and 3 (very good) were selected for analysis for quality control. Compared to the aerosol robot network (AERONET) ground-based observation, the uncertainty of 550 nm AOD from MODIS is about 0.069 in northeast Asia [53]. The correlation coefficient between MODIS AOD (550 nm) and in situ observations in Castilla y León, Spain is 0.78 [54].
The Cloud-Aerosol Lidar with Orthogonal Polarization (CALIOP) carried on CALIPSO supplies high-resolution vertical profiles of aerosols and clouds. The 532 nm extinction coefficient from the CALIPSO level 2 aerosol profile product version 4.2 with a resolution of 60 m vertically (–0.5 to 20 km) and 5 km horizontally was used to verify the vertical simulation capability of the model in this study. We used the data along the orbital path on 11 April 2020 at 07:00 UTC due to the few values of data retrieved along the orbital path during the dust storm period (9–12 April). The data can be found at https://www-calipso.larc.nasa.gov/ (accessed on 19 June 2021). More information about the data can be found in Table S2. Data with an extinction quality control flag (Extinction_QC_Flag_532) equal to 0 and 1 were selected for quality control. The root mean square deviation between 532 nm AOD of CALIPSO and the US Navy Aerosol Analysis and Prediction System (NAAPS) is between 0.1 and 0.3, and the correlation coefficient is close to 0.8 [55].
The Clouds and the Earth’s Radiant Energy System (CERES) is a project by the National Aeronautics and Space Administration (NASA). CERES provides satellite-based observations of the Earth’s radiation budget and clouds, and one of its purposes is to support climate model evaluation and improvement by model–observation intercomparisons. CERES instruments are carried out on the Aqua, Terra, Suomi National Polar-orbiting Partnership (S-NPP), and NOAA-20 satellites. The adjusted clear-sky fluxes at TOA and SFC from the SYN1deg-Level 3 product (https://ceres.larc.nasa.gov/data/ (accessed on 25 June 2021)) with 1 h temporal resolution and 1° × 1° spatial resolution were used to validate the radiative fluxes from the model. More information about the data can be found in Table S2. The monthly average downward flux calculated from SYN1deg compared to ground-based observations has a standard deviation of 3.0 W/m2 for SW and –4.0 W/m2 for LW [56]. Information on data quality control can be found at https://ceres.larc.nasa.gov/documents/DQ_summaries/CERES_SYN1deg_Ed4A_DQS.pdf (accessed on 21 June 2021).
In addition to satellite data, validation with ground-based observation is also important [57]. The PM10 observations at national stations in Wuwei and Zhangye with 1 h temporal resolution supplied by the Ministry of Ecology and Environment of the People’s Republic of China were used to validate the modeled dust concentrations (https://air.cnemc.cn:18007/ (accessed on 21 June 2021)). Wuwei has a temperate continental arid climate with an average annual temperature of 7.7 °C, an average annual precipitation of 212.2 mm, and an annual average of 65 precipitation days. Zhangye also has a temperate continental arid climate with an average annual temperature of 6.5 °C, an average annual precipitation of 197.2 mm, and an annual average number of 67.1 precipitation days. Geographic information about the two sites is shown in Table S1. The study also used FNL reanalysis data (https://rda.ucar.edu/datasets/ds083.2/index.html (accessed on 13 May 2021)) from the NCEP as boundary and initial meteorological conditions of WRF-Chem and verified the modeled temperature.

3. Results and Discussion

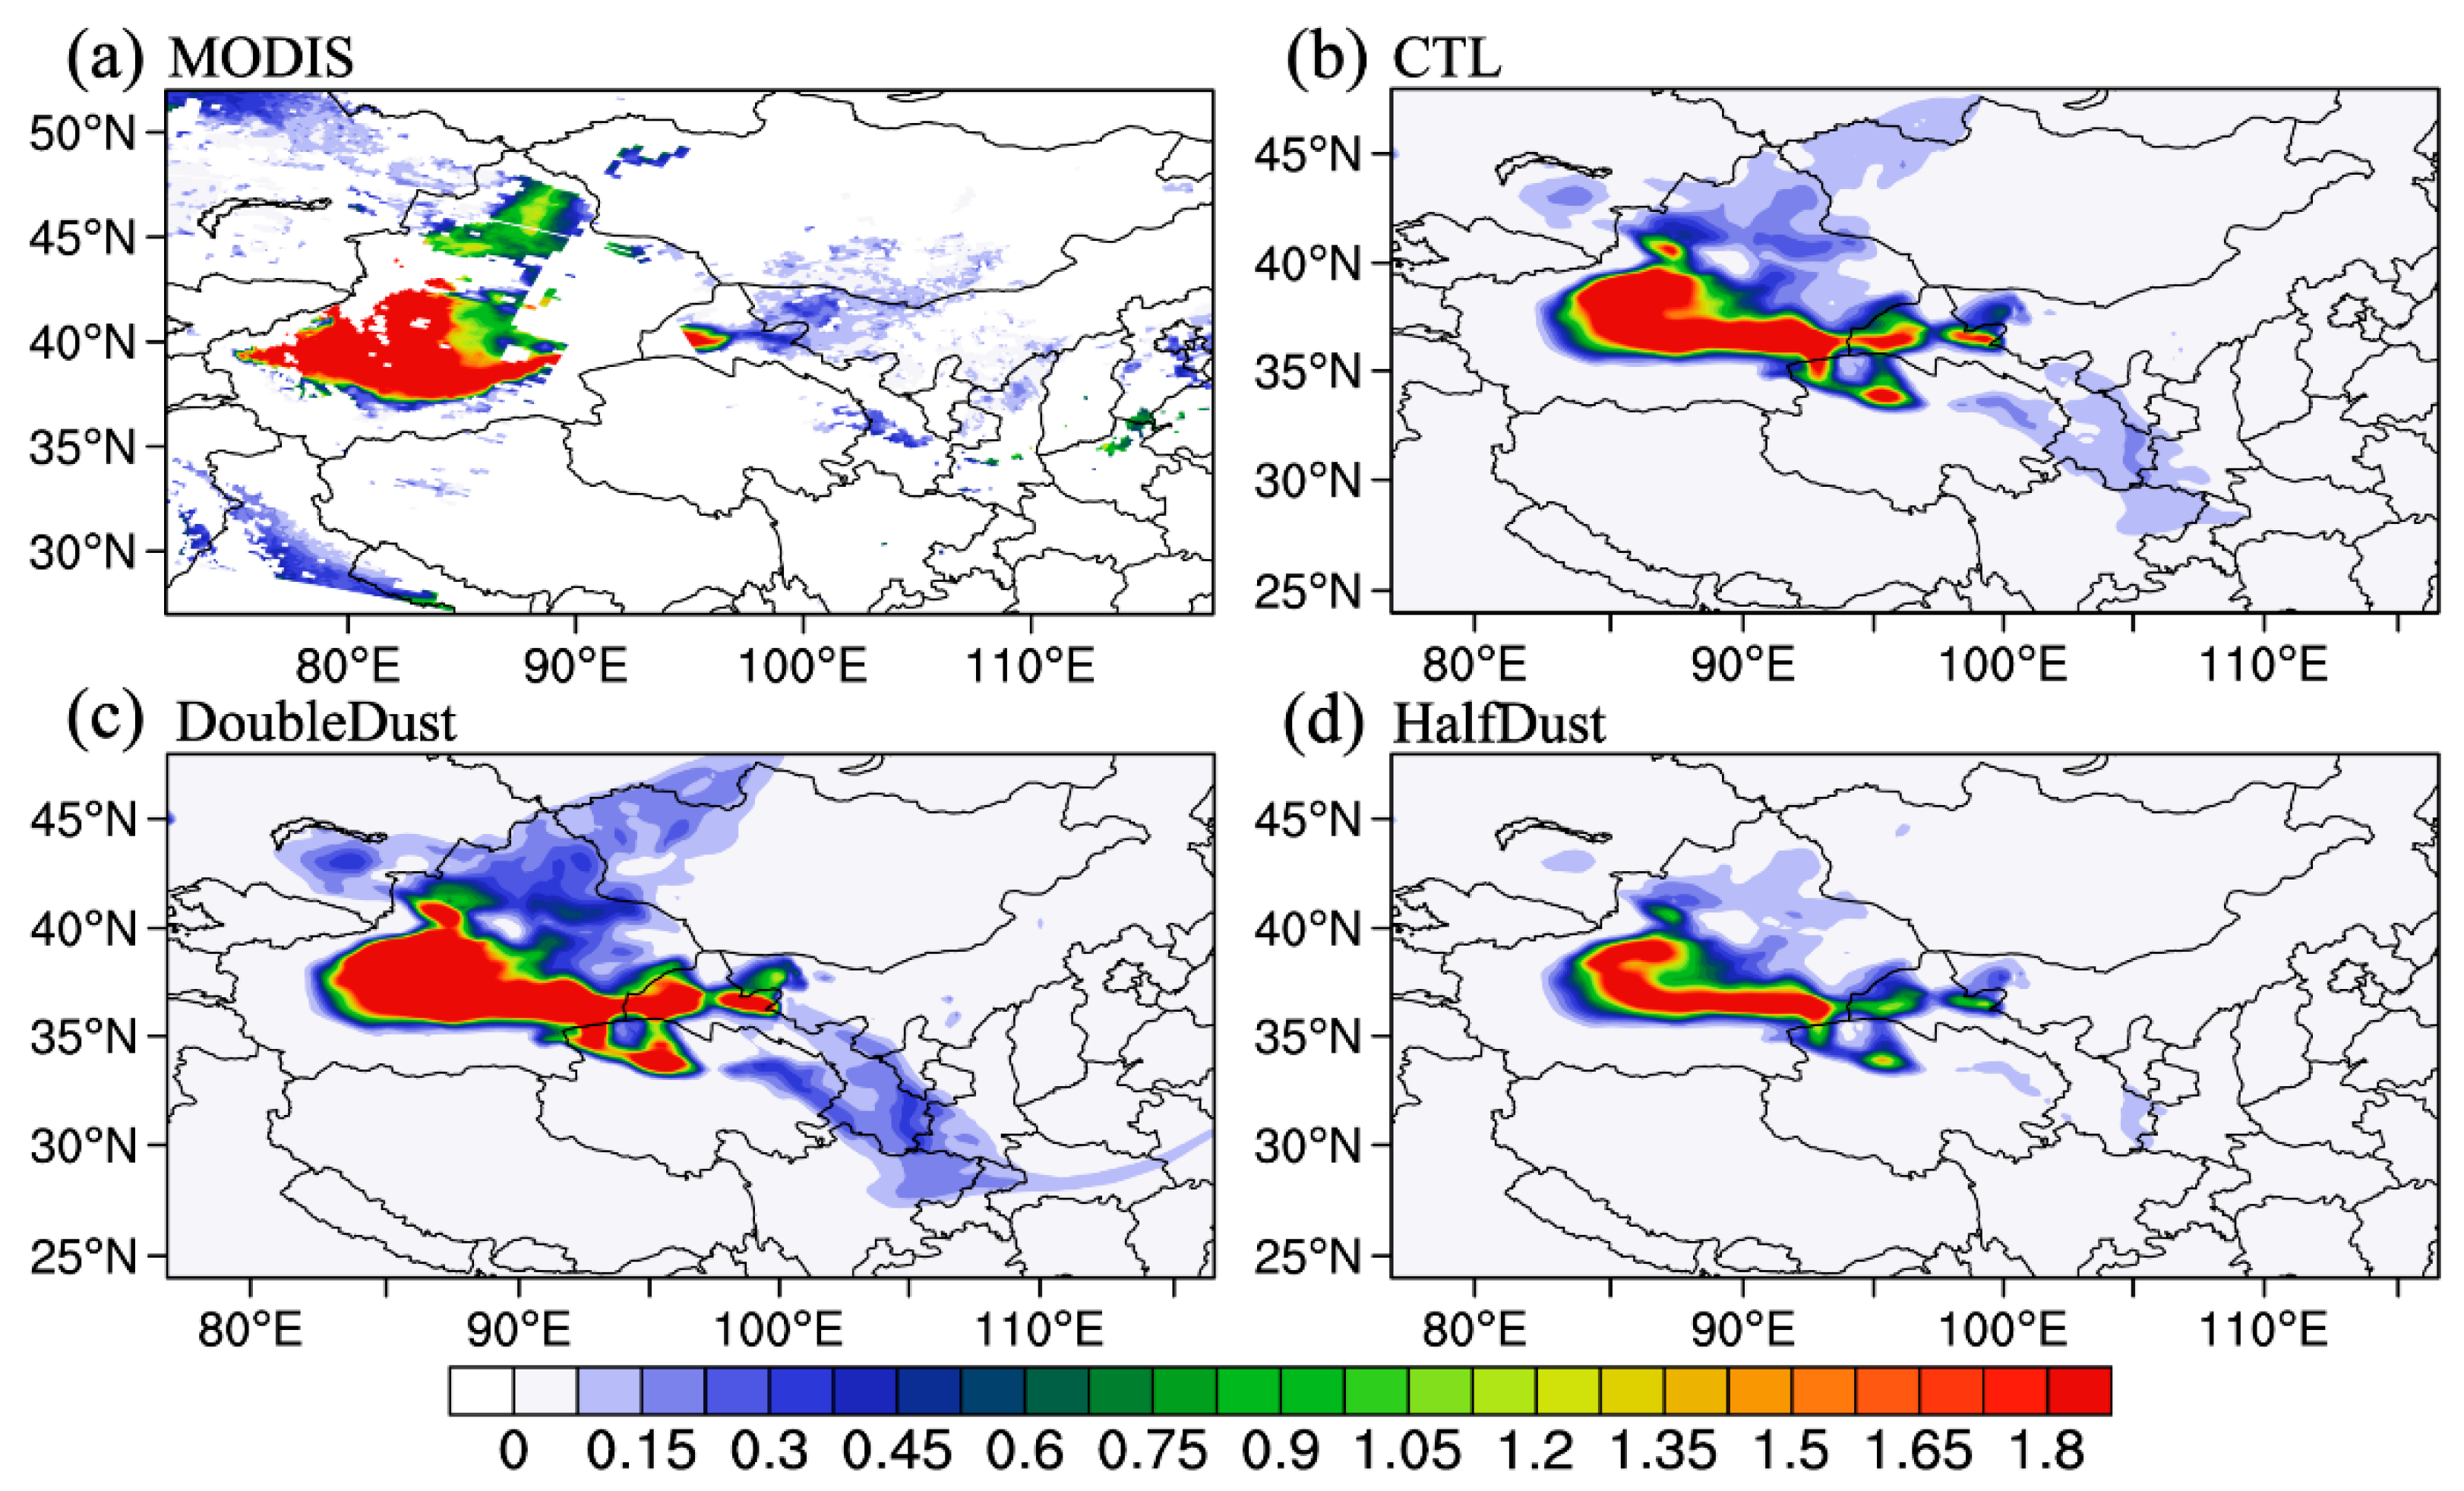
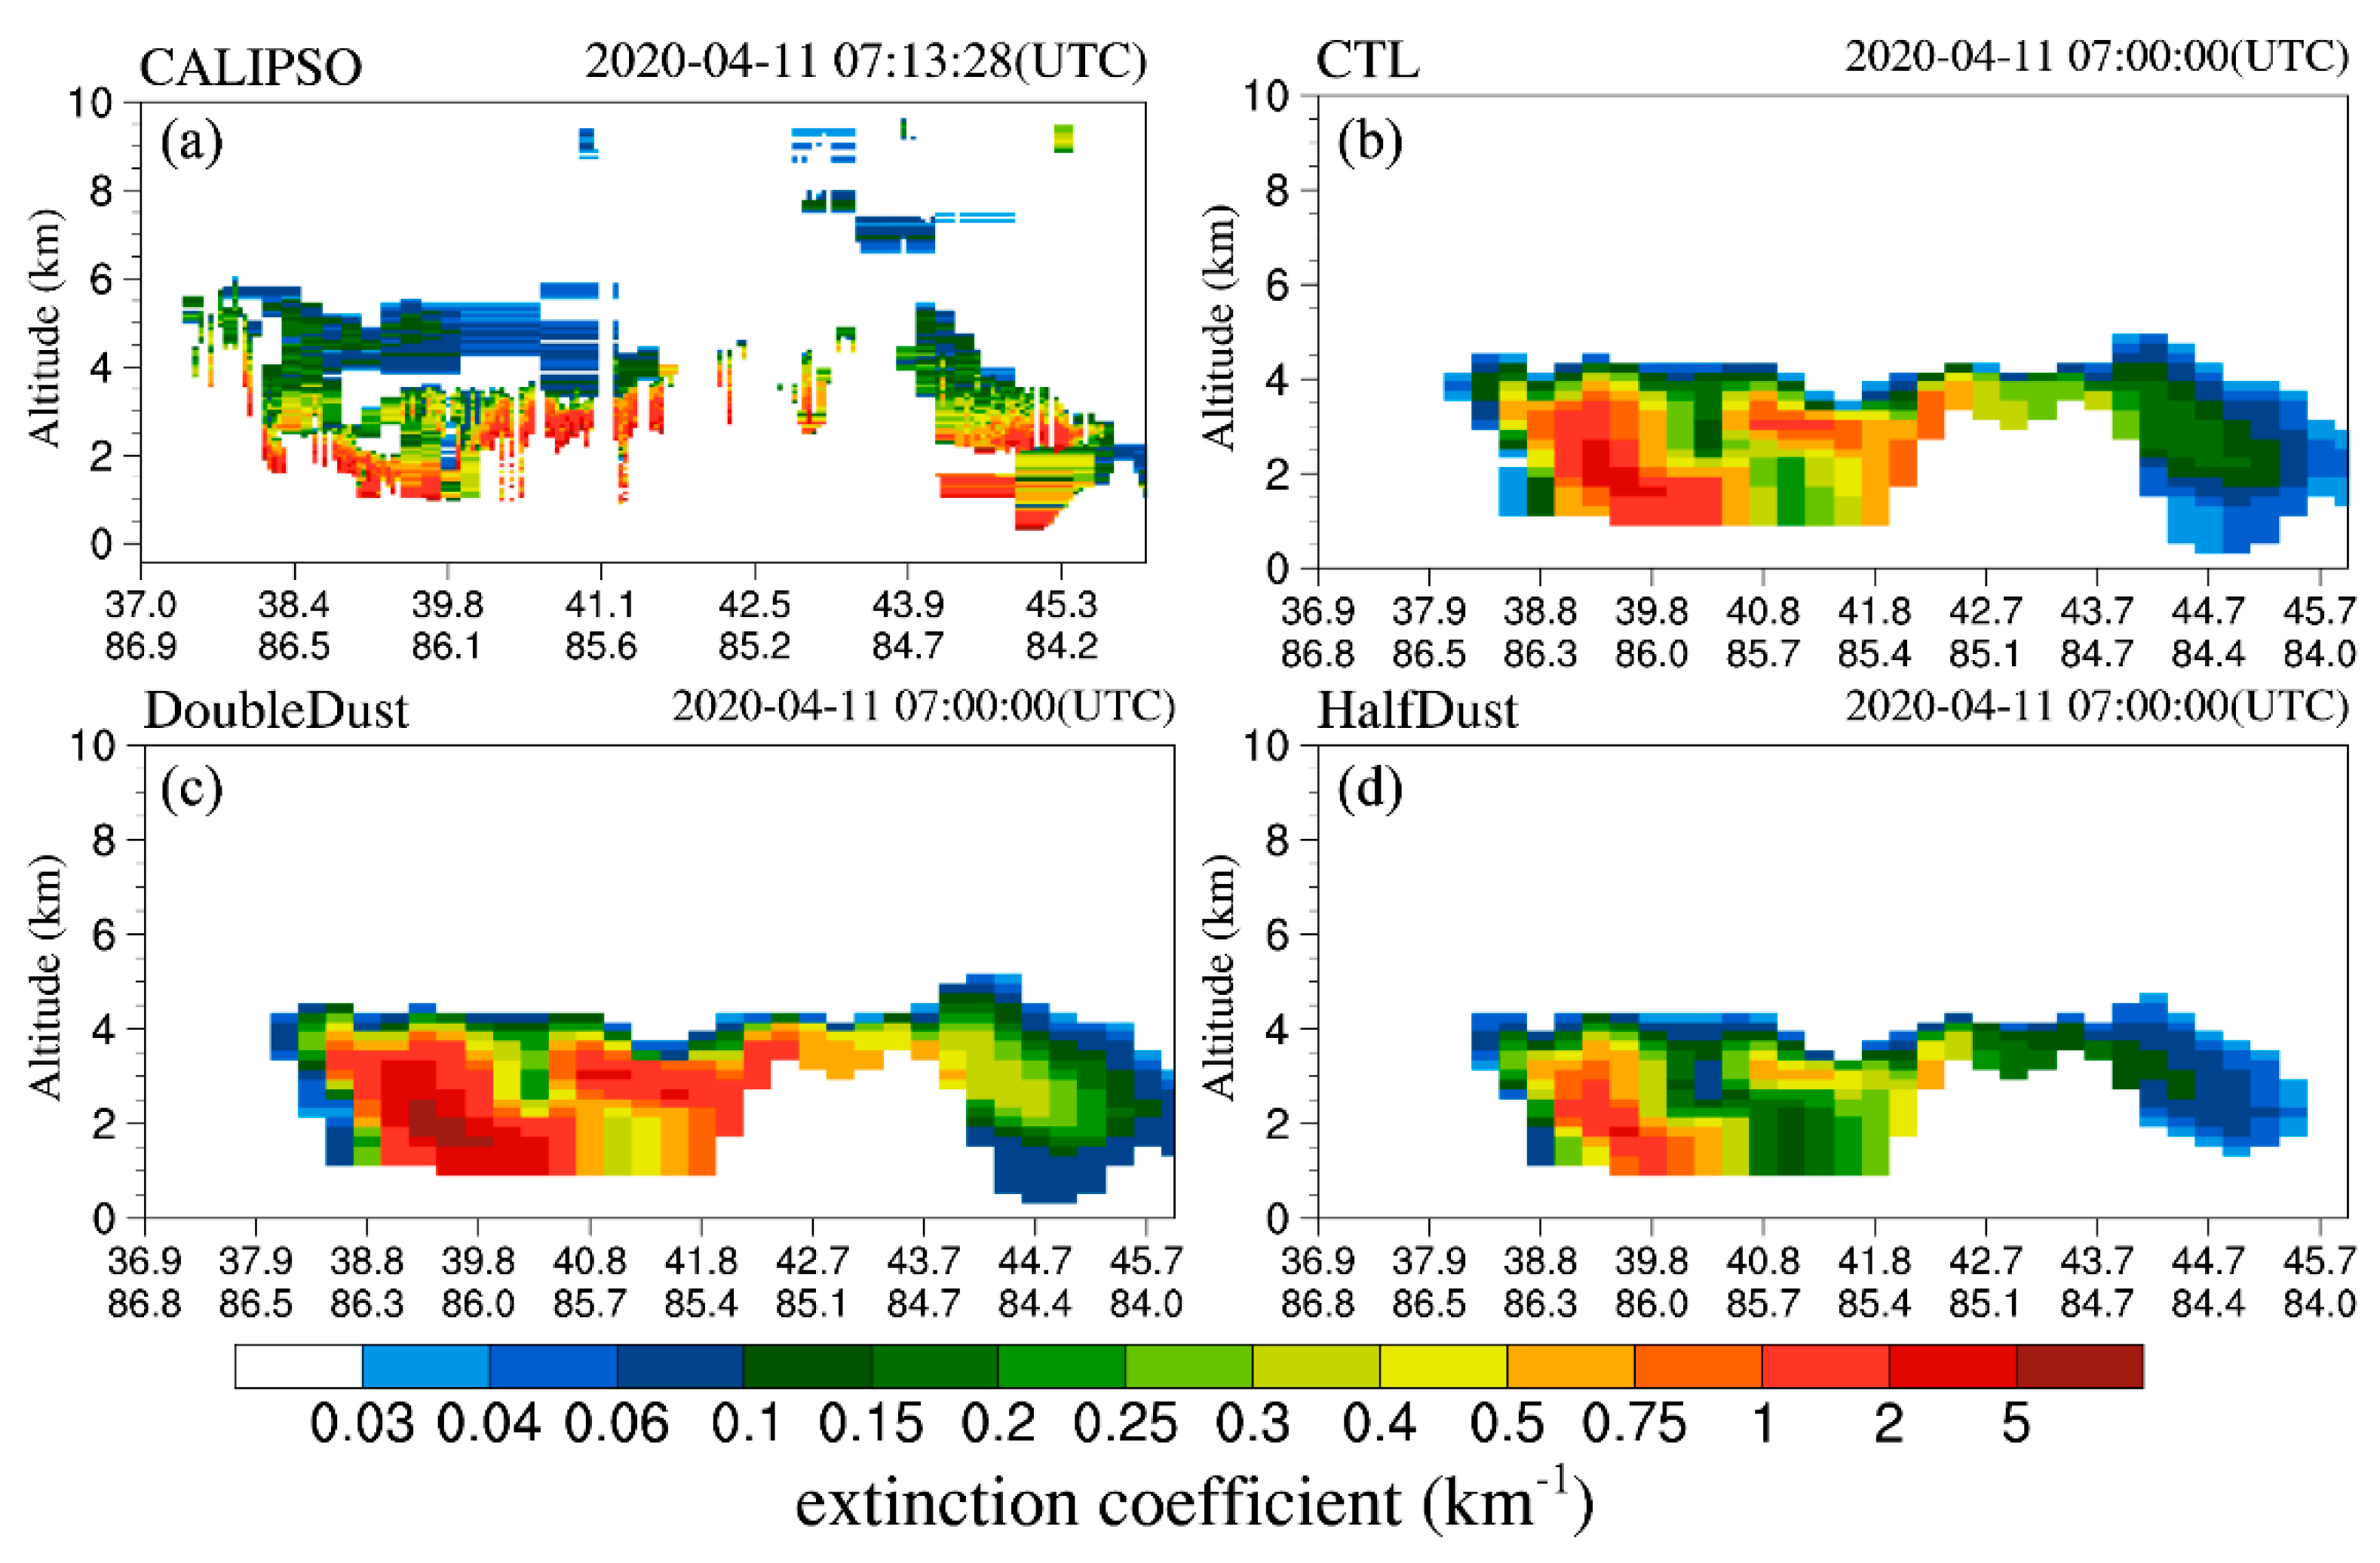
3.1. Model Evaluation

The results of the WRF-Chem were validated by comparing the optical properties of the simulated dust with those from satellite retrievals. Dust in the ATM during dust events accounts for above 90% of the AOD and total aerosol mass [29], so AOD, in general, can reflect the changing and distribution characteristics of dust in the area during the study period. Since WRF-Chem does not calculate 550 nm AOD, AOD was calculated by integrating the 550 nm extinction coefficient over the entire atmospheric column.
The spatial distribution of 550 nm AOD acquired by MODIS shows that the areas with AOD greater than 1.8 were mainly distributed in the Taklimakan Desert and western Gansu (Figure 2a). The model simulated well the high-value distribution of AOD in central Xinjiang and western Gansu (Figure 2b). However, the model underestimated AOD values in the western Taklamakan Desert as well as in northern Xinjiang. Additionally, a spurious AOD distribution was simulated in Northwestern Qinghai. This was probably because of the uncertainty of the wind field as well as surface/soil information and surface land use conditions from the model [58]. Overall, the AOD from WRF-Chem revealed a consistent spatial distribution in comparison with the MODIS retrievals, although there were some differences. When dust emissions were doubled, the model-simulated AOD values increased and the distribution range also expanded (Figure 2c). At the same time, a similar result indicates that the value and distribution range of AOD was subsequently reduced when the dust emissions were reduced by half (Figure 2d). The simulation results reproduced the spatial pattern of MODIS-retrieved AODs, illustrating that the dust source distribution in Northwest China was well described by the dust source function in the Shao04 emission scheme.
The vertical structure of dust plays a significant role in clear-sky LW radiative forcing and cloudy-sky SW radiative forcing [2,59], thereby directly affecting the climate system. Figure 3 displays the vertical patterns of the aerosol extinction coefficient from CALIPSO and WRF-Chem along the CALIPSO satellite overpass at 07:00 UTC on 11 April 2020 (as shown in Figure 1). In the area of 37°N–43°N, many regions with extinction coefficients greater than 1 appeared below 4 km, indicating that these areas were dominated by dust aerosols at this time. Meanwhile, the presence of dust aerosols was clearly shown above an altitude of 6 km (Figure 3 a). The comparison between CALIPSO and WRF-chem indicates that the model properly reproduced the 532 nm extinction coefficient over the Taklimakan Desert (38°N–42°N), which was the main study area of this work. However, the model underestimated the extinction coefficient at 43°N–45°N and did not capture dust aerosols above 5 km (Figure 3b). Similar to the AOD distribution, the underestimation might be related to the uncertainty of the wind field as well as surface/soil information and surface land use conditions from the model [54].
When dust emissions became twice as high as CTL, the maximum and average values of the simulated aerosol extinction coefficient increased from 4.06 and 0.06 km−1 to 7.61 and 0.11 km−1, respectively. The distribution of extinction coefficients also expanded, especially in the areas (38°N–41°N) with high values (Figure 3c). When dust emissions reached half, the maximum and average values of the simulated aerosol extinction coefficient decreased to 2.16 and 0.03, respectively. Similar to DoubleDust, the distribution of extinction coefficients became narrower (Figure 3d).
During dust events, PM10 is usually the main pollutant in the atmosphere [60], so the intensity of dust events can be reflected by the PM10 concentration observed at the site. The observed and modeled PM10 concentrations at the dust-affected sites (Wuwei and Zhangye) were compared (Figure S1). The locations of the two sites are indicated in Figure 1 in red. The results show that the model reproduced variation trends of PM10 concentration. The correlation coefficient between the model results (CTL) and ground-based observations at the Wuwei and Zhangye sites was 0.91 and 0.80, respectively, and both passed the significance test with a 99% confidence level. The average temperature at 2 m from the WRF-Chem simulation and the NCEP/FNL reanalysis data was also compared in the modeling period (Figure S2). The simulated temperature fields provided confidence for the subsequent analysis of the effect of dust on surface temperature. The details of the model performance regarding PM10 and temperature can be found in the Supplementary Materials.
The above evaluation results show that the spatial and temporal characteristics of dust aerosols can be reproduced by using the WRF-Chem model within the modeling domain, and the results can be reliably used for the investigation of dust DRF and its effect on temperature in Northwest China.

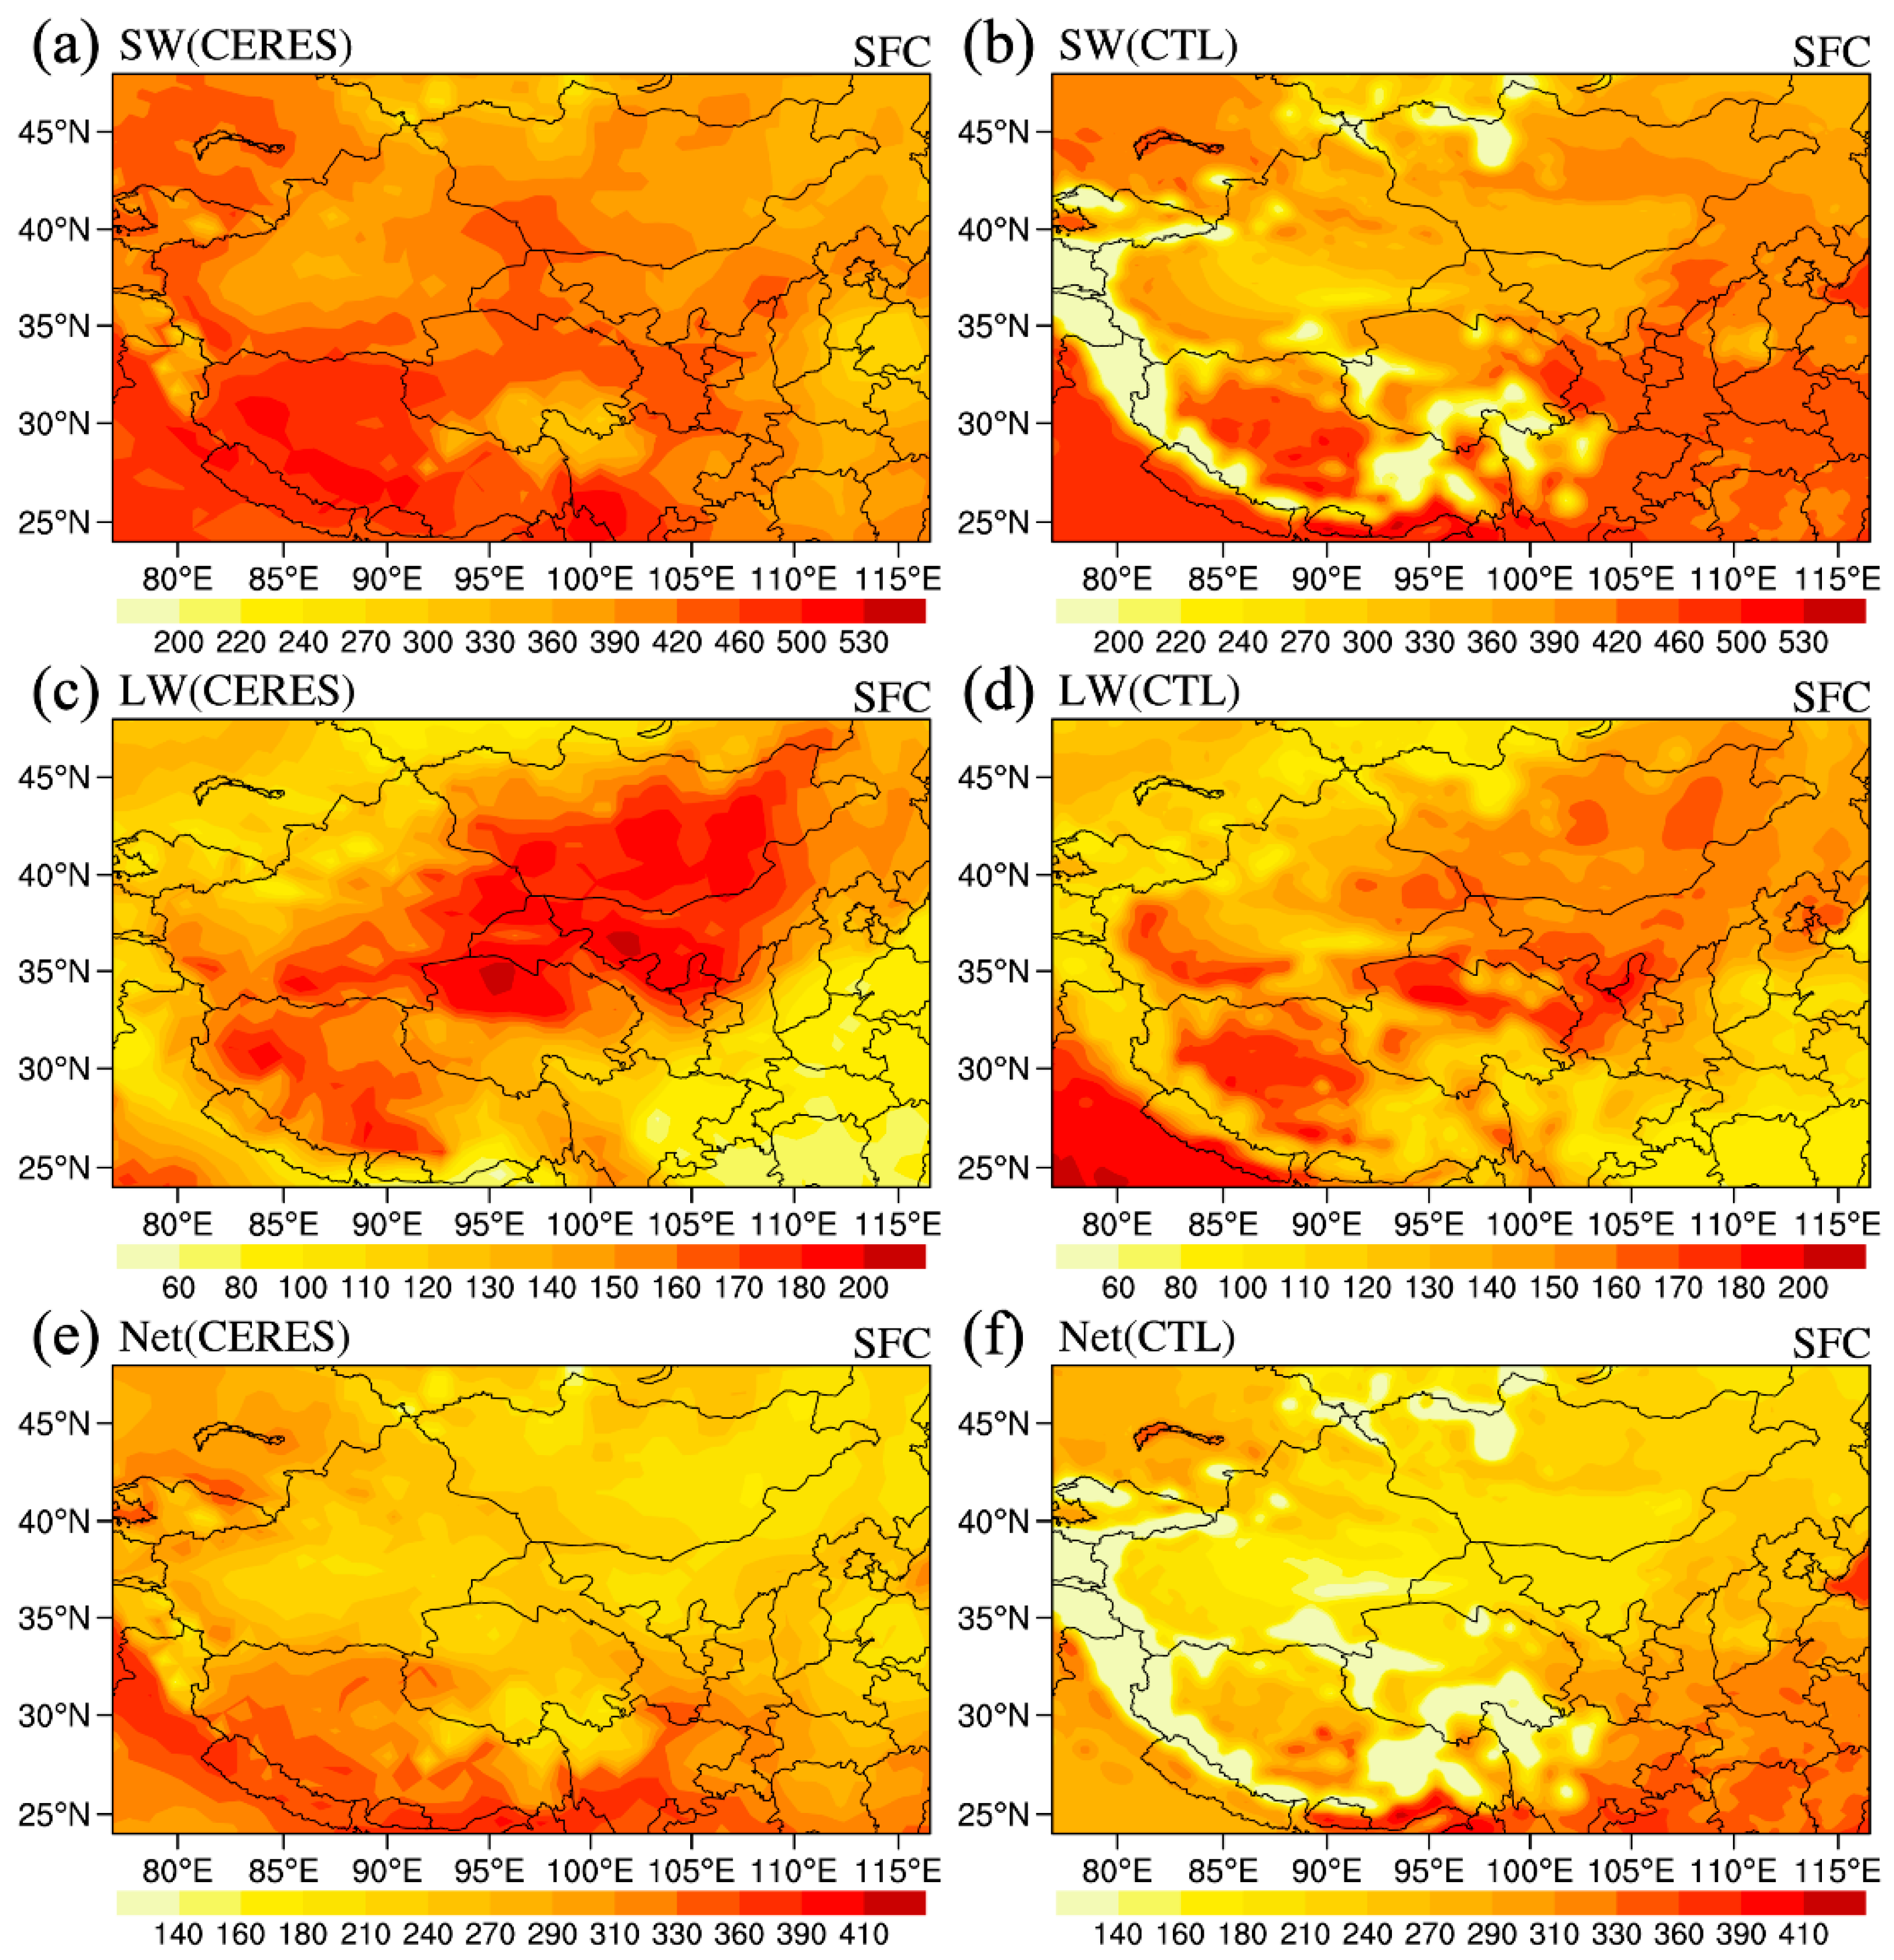
3.2. Spatial Distribution of Radiation Fluxes

Apart from the assessment of the model’s capability to simulate dust, the simulated results of radiation fluxes were further verified by comparison with the CERES results. At the SFC, the model captured the SW, LW, and net radiation distribution characteristics observed by CERES in Northwest China, especially in the desert area (Figure 4). The model overestimated the radiation in the Himalayas and the Kunlun Mountains, which were not included in the study area. The overestimation may be related to the albedo in the model being higher than the actual value in these areas. Table 1 summarizes the averaged radiation fluxes at the TOA and the SFC from the CERES and CTL simulations. At the TOA, the model-simulated regional averages of downward SW radiation and upward LW radiation in Northwest China were closer to CERES, which were 691 and 704 W/m2 and 255 and 262 W/m2, respectively. The simulated values of SW and net radiation were smaller than the CERES values, which were 465 and 533 W/m2 and 210 and 271 W/m2, respectively, mainly due to the model overestimating the upward shortwave radiation. Although there were some differences between the modeled and observed results, the characteristics of the radiation flux distribution at the TOA could be reflected in general. Similar to the TOA, the model-simulated regional average LW radiation at SFC in Northwest China was more consistent with the observations, whereas the values of SW and net radiation were smaller than the observations, mainly due to the overestimation of upward SW radiation of the model. In general, the WRF-Chem performed well with CERES measurements over Northwest China. The results provided confidence for subsequent studies of the dust DRF.

3.3. Dust DRF Induced by Different Dust Emissions

The dust DRF in East Asia accounts for approximately 42% of the total aerosol radiative forcing and thus plays a significant role in the radiative budget as well as regional climate [61]. In this study, the difference between the simulations with and without dust aerosols was applied to quantitatively evaluate the magnitude of the dust DRF. The impacts of dust emission changes on the dust DRF in Northwest China were discussed in the daytime (09:00 to 21:00 local time) and nighttime (22:00 local time on the same day to 06:00 local time the next day).

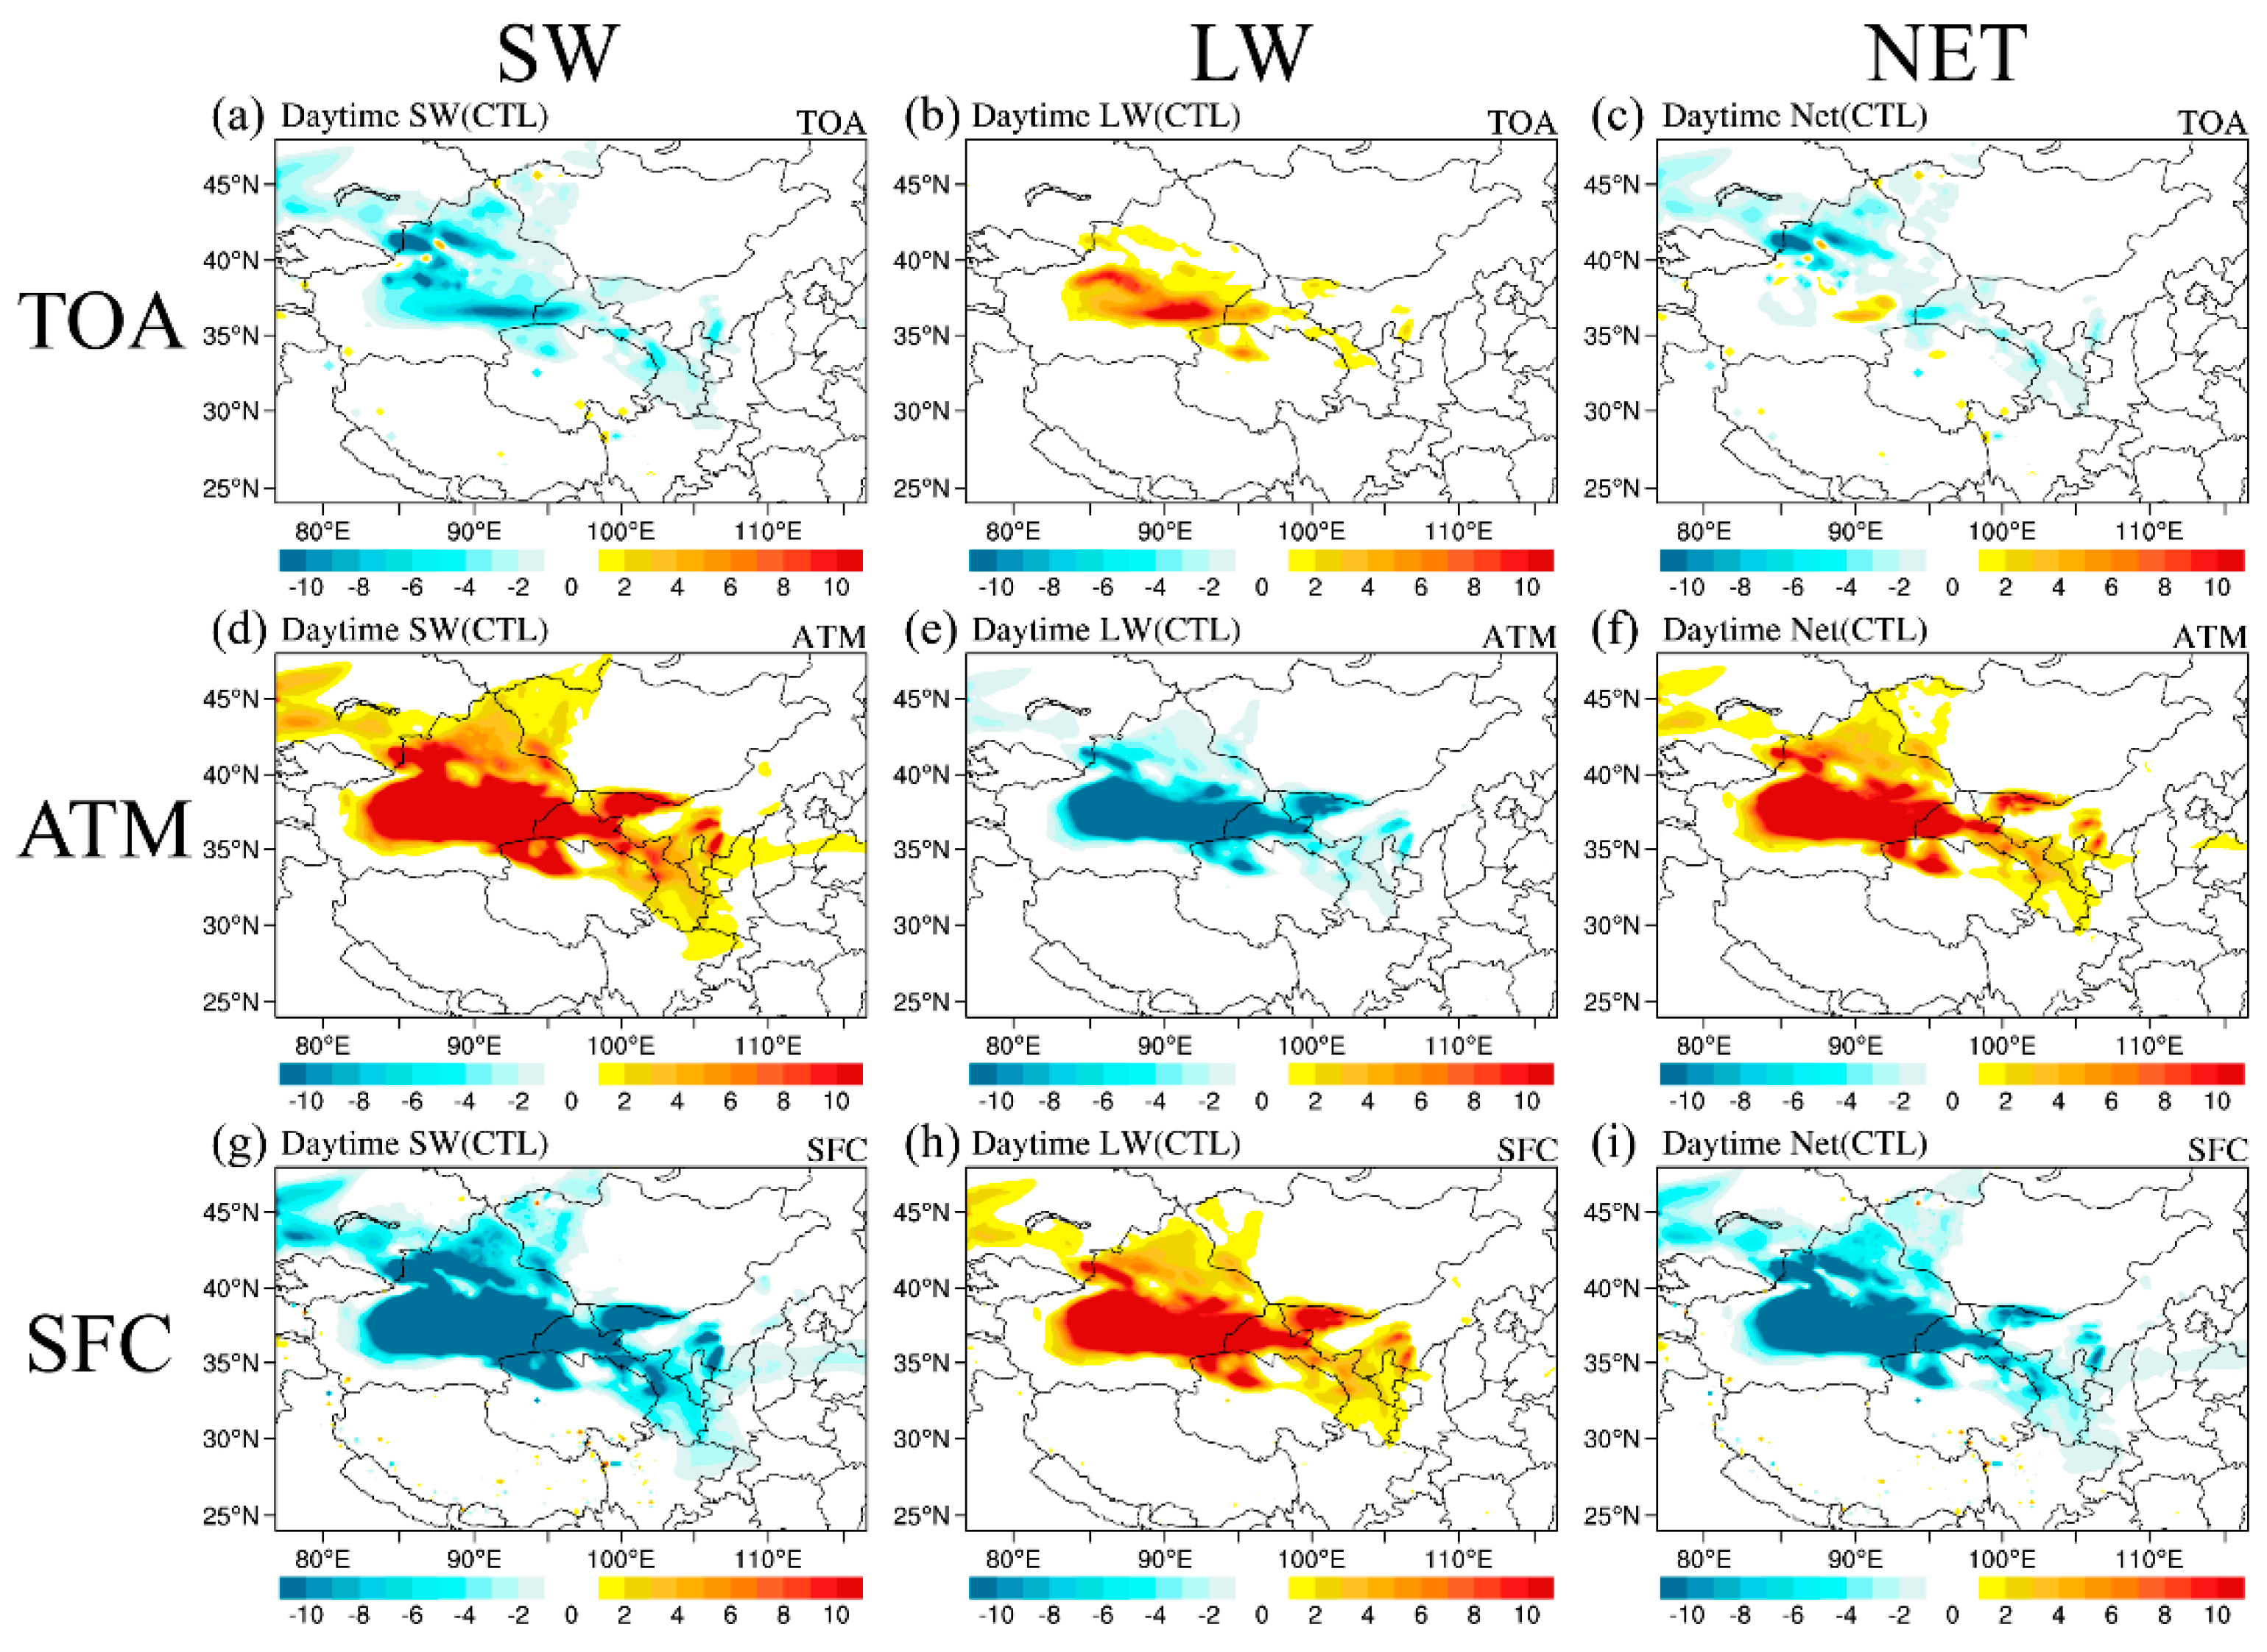
3.3.1. Dust DRF in the Daytime

The daytime SW, LW, and net dust DRF simulated by CTL in clear-sky conditions were calculated at the SFC, TOA, and ATM, respectively, during the study period, as shown in Figure 5. In the daytime at the TOA, dust enhanced the upward shortwave radiation due to reflection and scattering and increased the upward longwave radiation. The net DRF was overall cooling and locally warming the TOA. The average SW, LW, and net DRF of dust at the TOA during the daytime of the simulation period were –1.83, 0.61, and –1.22 W/m2 over DSR, respectively; –0.36, 0.18, and –0.18 W/m2 over DAR, respectively; and –1.23, 0.47, and –0.76 W/m2 over Northwest China, respectively. At the ATM, dust absorbed SW radiation while releasing LW radiation, and the net effect led to warming of the ATM. The average SW, LW, and net DRF of dust in the ATM during the daytime were 6.92, –3.13, and 3.79 W/m2 over DSR, respectively; 1.76, –0.87, and 0.89 W/m2 over DAR, respectively; and 5.58, –2.58, and 3.00 W/m2 over Northwest China, respectively. At the SFC, dust attenuated the downward SW radiation and enhanced the downward LW radiation, with the net effect of cooling the SFC. The average SW, LW, and net DRF of dust at the SFC during the daytime were –8.75, 3.74, and –5.01 W/m2 over DSR, respectively; –2.12, 1.05, and –1.07 W/m2 over DAR, respectively; and –6.81, 3.05, and –3.76 W/m2 over Northwest China, respectively. The average radiative effect of dust was in accordance with the results of Chen et al. [33] and Chen et al. [62] but with lower values, which might have been caused by the larger average area and the lower intensity of dust events in this study. In general, during the day, the dust DRF was consistent at DSR and DAR, but was stronger at DSR.
The impacts of dust emission changes on DRF were further investigated. When dust emissions became twice the CTL, the range and absolute values of the dust DRF distribution also expanded (positive values became larger, negative values decreased) at different heights, and the range of high-value area in the ATM and at the SFC in particular extended to cover almost all of the Xinjiang and Gansu regions (Figure S3a–c). During the simulation period, the average values from DoubleDust were –3.04, 0.99, and –2.05 W/m2 at the TOA; 11.28, –5.07, and 6.21 W/m2 in the ATM; and –14.32, 6.06, and –8.26 W/m2 at the SFC over DSR for daytime SW. The average values from DoubleDust for daytime LW were –0.58, 0.33, and –0.25 W/m2 at the TOA; 3.24, –1.57, and 1.67 W/m2 in the ATM; and –3.82, 1.90, and –1.92 W/m2 at the SFC over DAR. Last, the average values from DoubleDust for daytime net dust DRF were –2.02, 0.77, and –1.25 W/m2 at the TOA; 9.01, –4.15, and 4.86 W/m2 in the ATM; and –11.03, 4.92, and –6.11 W/m2 at the SFC over Northwest China. Similar to the situation of dust emission increasing, when dust emission became half, the absolute values of dust DRF distribution at different heights were reduced (positive values decreased, negative values became larger) (Figure S3d–f). The average values from HalfDust were –1.09, 0.35, and –0.74 W/m2 at the TOA; 4.00, –1.84, and 2.16 W/m2 in the ATM; and –5.09, 2.19, and –2.90 W/m2 at the SFC over DSR for daytime SW. The average values from HalfDust were –0.21, 0.10, and –0.11 W/m2 at the TOA; 0.93, –0.47, and 0.46 W/m2 in the ATM; and –1.14, 0.57, and –0.57 W/m2 at the SFC over DAR for daytime LW. Last, the average values from HalfDust were –0.74, 0.27, and –0.47 W/m2 at the TOA; 3.28, –1.55, and 1.73 W/m2 in the ATM; and –4.02, 1.82, and –2.20 W/m2 at the SFC for daytime net dust DRF over Northwest China.
Mean values of daytime dust DRF at different heights (SFC, ATM, and TOA) in Northwest China (30°N–45°N, 75°E–110°E) from CTL, DoubleDust, and HalfDust during the study period are summarized in Table 2. In the daytime, when dust emissions doubled compared to the CTL results, the SW radiative forcing decreased by 64% (–5.57 W/m2) at the SFC, increased by 63% (4.36 W/m2) in the ATM, and decreased by 66% (–1.21 W/m2) at the TOA over DSR; decreased by 80% (–1.7 W/m2) at the SFC, increased by 84% (1.48 W/m2) in the ATM, and decreased by 61% (–0.22 W/m2) at the TOA over DAR; and decreased by 62% (–4.22 W/m2) at the SFC, increased by 61% (3.43 W/m2) in the ATM, and decreased by 64% (–0.79 W/m2) at the TOA over Northwest China. The LW radiative forcing increased by 67% (2.32 W/m2) at the SFC, decreased by 62% (–1.94 W/m2) in the ATM, and increased by 62% (0.38 W/m2) at the TOA over DSR; increased by 81% (1.05 W/m2) at the SFC, decreased by 80% (–0.7 W/m2) in the ATM, and increased by 83% (0.15 W/m2) at the TOA over DAR; and increased by 0.61% (1.87 W/m2) at the SFC, decreased by 61% (–1.57 W/m2) in the ATM, and increased by 64% (0.30 W/m2) at the TOA over Northwest China. The net radiative forcing decreased by 65% (–3.25 W/m2) at the SFC, increased by 64% (2.42 W/m2) in the ATM, and decreased by 68% (–0.83 W/m2) at the TOA over DSR; decreased by 79% (–0.85 W/m2) at the SFC, increased by 88% (0.78 W/m2) in the ATM, and decreased by 39% (–0.07 W/m2) at the TOA over DAR; and decreased by 63% (–2.35 W/m2) at the SFC, increased by 62% (1.86 W/m2) in the ATM, and decreased by 64% (–0.49 W/m2) at the TOA over Northwest China. When dust emissions were reduced to half compared to CTL, the SW radiative forcing increased by 42% (3.66 W/m2) at the SFC, decreased by 42% (–2.92 W/m2) in the ATM, and increased by 40% (0.74 W/m2) at the TOA over DSR; increased by 46% (0.98 W/m2) at the SFC, decreased by 47% (–0.83 W/m2) in the ATM, and increased by 42% (0.15 W/m2) at the TOA over DAR; and increased by 41% (2.79 W/m2) at the SFC, decreased by 41% (–2.30 W/m2) in the ATM, and increased by 40% (0.49 W/m2) at the TOA over Northwest China. The LW radiative forcing decreased by 41% (–1.55 W/m2) at the SFC, increased by 41% (1.29 W/m2) in the ATM, and decreased by 43% (–0.26 W/m2) at the TOA over DSR; decreased by 46% (–0.48 W/m2) at the SFC, increased by 46% (0.40 W/m2) in the ATM, and decreased by 44% (–0.08 W/m2) at the TOA over DAR; and decreased by 40% (–1.23 W/m2) at the SFC, increased by 40% (1.03 W/m2) in the ATM, and decreased by 43% (–0.20 W/m2) at the TOA over Northwest China. The net radiative forcing increased by 42% (2.11 W/m2) at the SFC, decreased by 43% (–1.63 W/m2) in the ATM, and increased by 39% (0.48 W/m2) at the TOA over DSR; increased by 47% (0.5 W/m2) at the SFC, decreased by 48% (–0.43 W/m2) in the ATM, and increased by 39% (0.07 W/m2) at the TOA over DAR; and increased by 41% (1.56 W/m2) at the SFC, decreased by 42% (–1.27 W/m2) in the ATM, and increased by 38% (0.29 W/m2) at the TOA over Northwest China. Overall, during the day, the impact of changes in dust emissions over DAR was greater than DSR. Meanwhile, the effect of DoubleDust on DRF was greater than the effect of HalfDust.

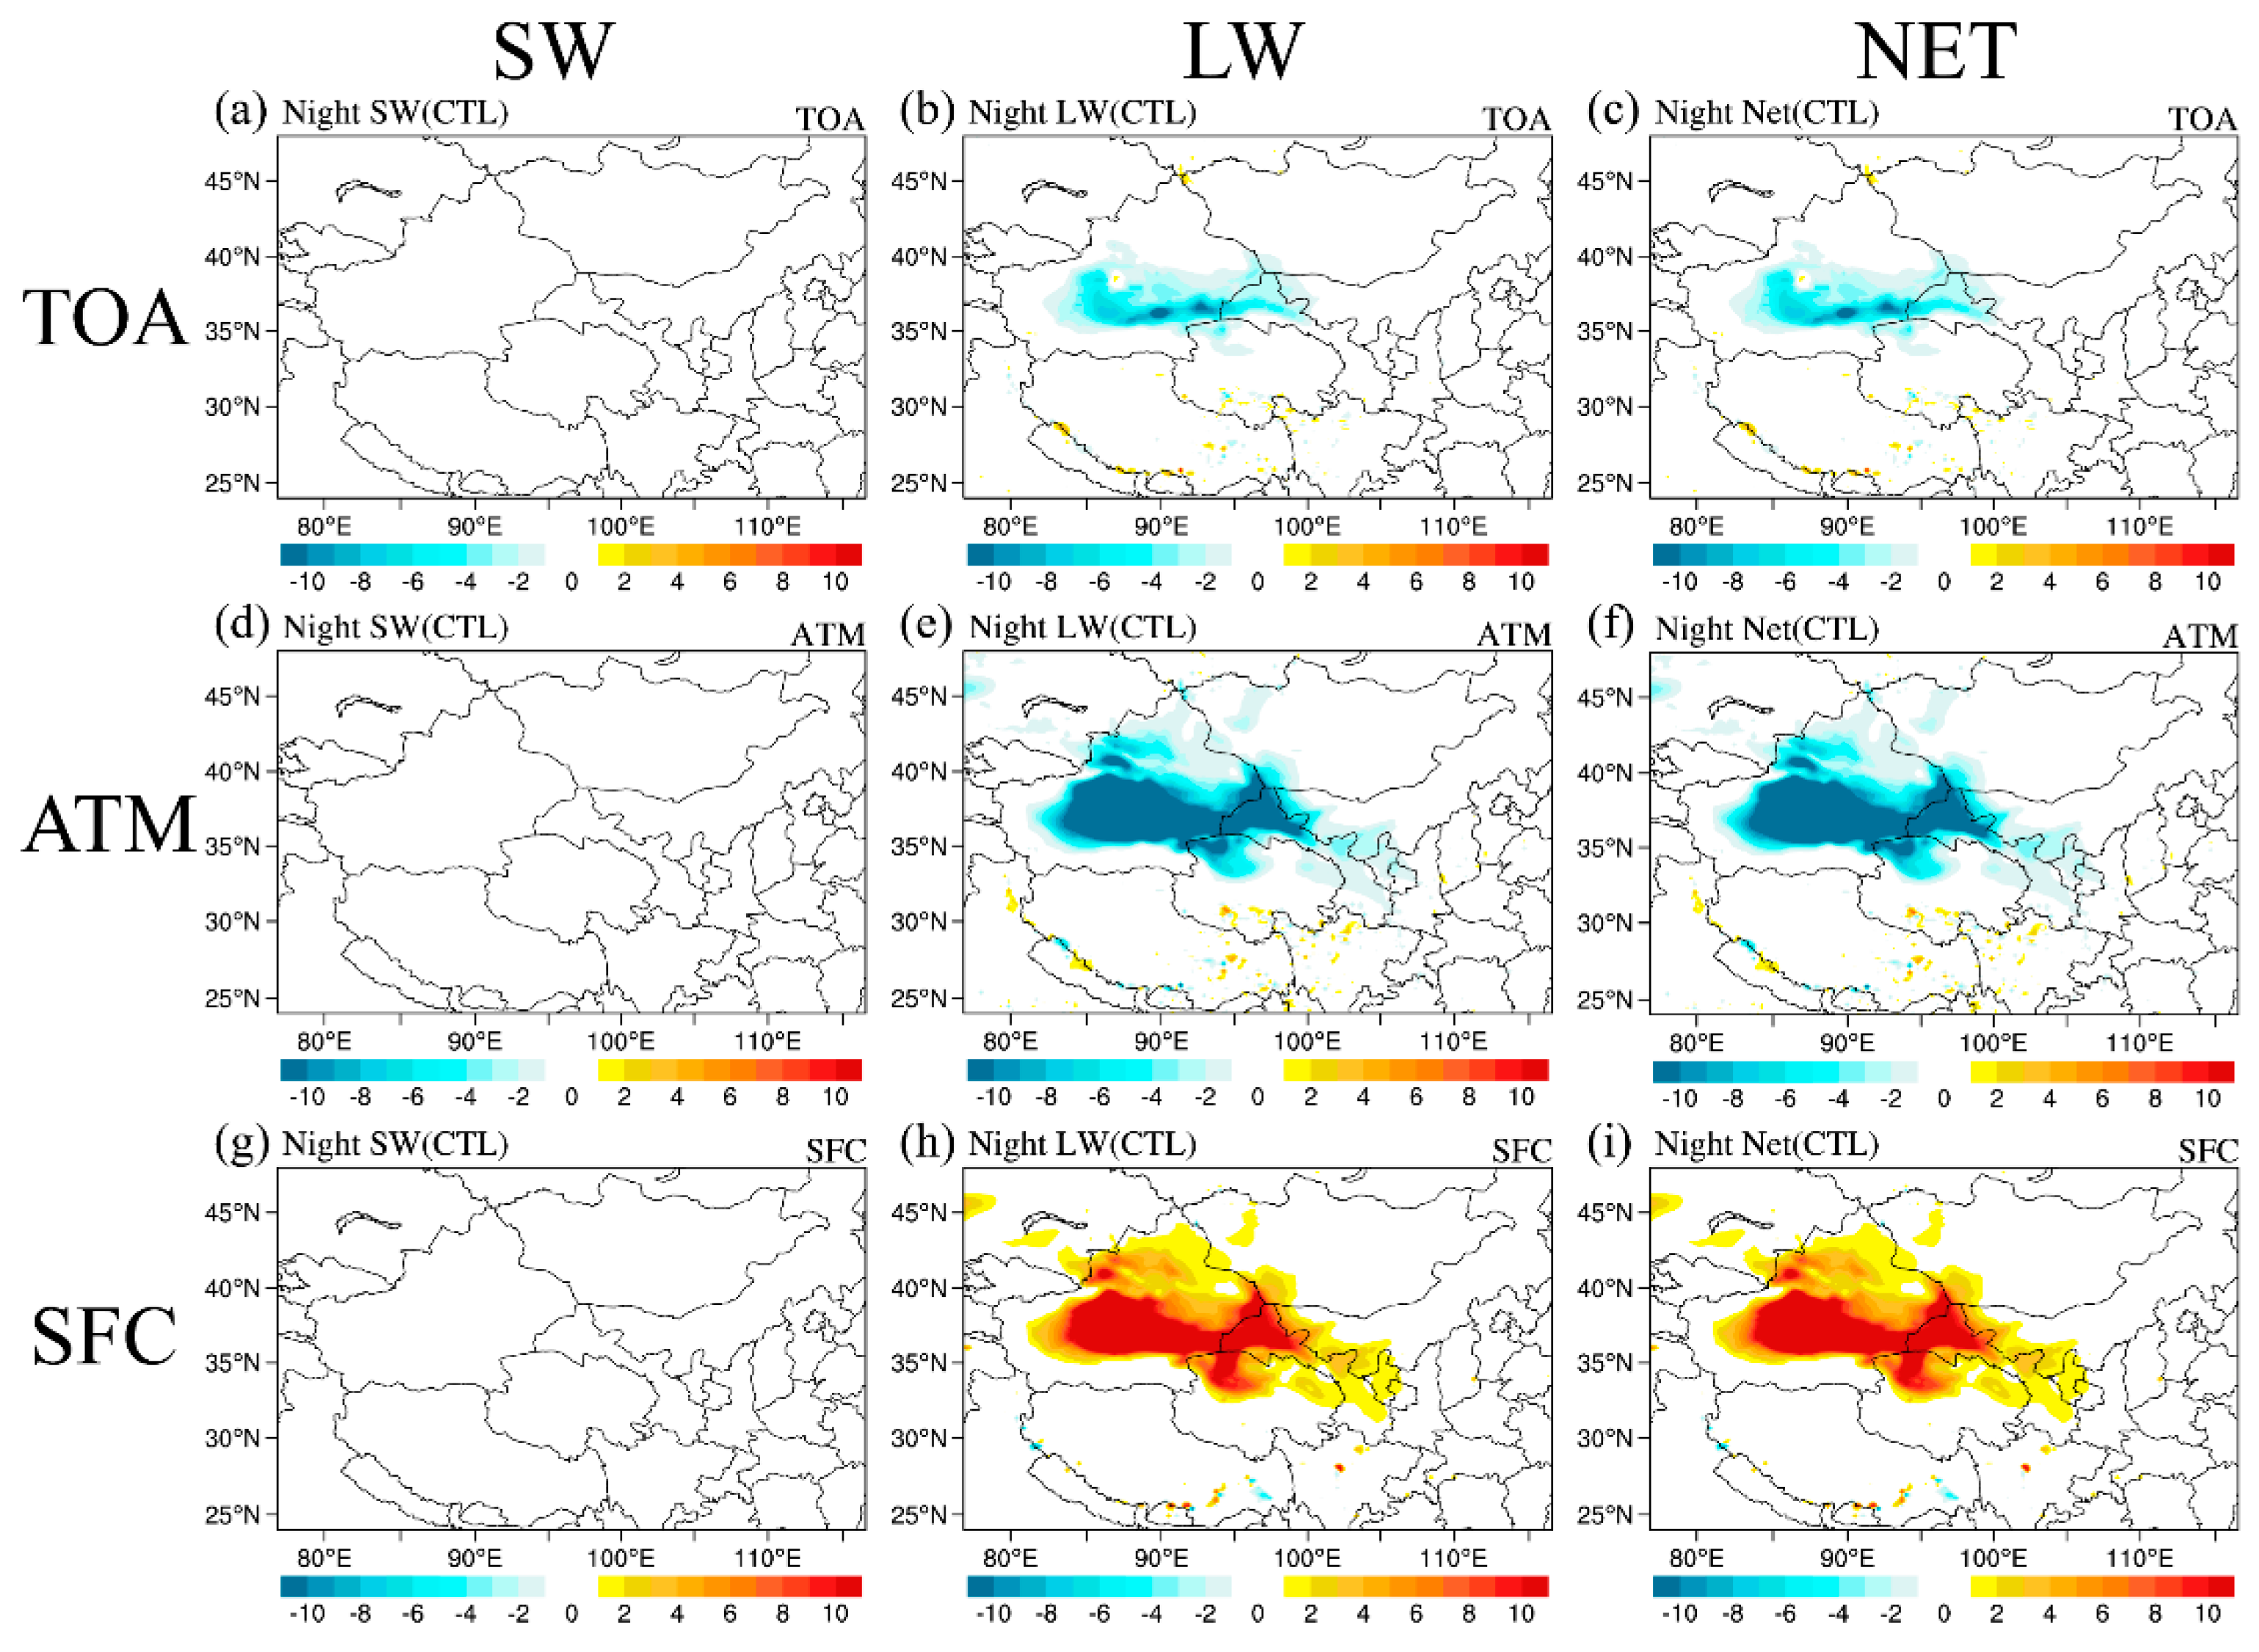
3.3.2. Dust DRF in the Nighttime

To analyze the difference between daytime and nighttime dust DRF, the nighttime dust DRF simulated by CTL in clear-sky conditions during the study period was calculated (Figure 6). At the TOA during the night, dust decreased the upward LW radiation, causing a net effect of cooling the TOA because there was no solar SW radiation. The average LW and net DRF of dust at the TOA during the night of the simulation period were –0.48 and –0.48 W/m2 over DSR, respectively; –0.05 and –0.05 W/m2 over DAR, respectively; and –0.45 and –0.45 W/m2 over Northwest China, respectively. In the ATM, dust released LW radiation with the net effect of cooling the atmosphere. The average LW and net DRF of dust in the ATM during the night were –3.21 and –3.21 W/m2 over DSR, respectively; –0.44 and –0.44 W/m2 over DAR, respectively; and –2.65 and –2.65 W/m2 over Northwest China, respectively. At the SFC, dust reduced downward SW radiation and enhanced downward LW radiation. Overall, the net dust DRF at the SFC had a warming effect (2.73 W/m2 over DSR, 0.39 W/m2 over DAR, and 2.20 W/m2 over DAR). The results show that in the ATM and at the SFC, the DRF of dust at nighttime was opposite to that in the daytime.
Consistent with the daytime, the distribution range and absolute values of the dust DRF at different heights also increased (positive values became larger, negative values decreased) when dust emission became two times the CTL (Figure S4). During the simulation period, the average values of nighttime net dust DRF from DoubleDust were –0.66 W/m2 at the TOA, –5.12 W/m2 in the ATM, and 4.46 W/m2 at the SFC over DSR; –0.12 W/m2 at the TOA, –0.82 W/m2 in the ATM, and 0.70 W/m2 at the SFC over DAR; and –0.61 W/m2 at the TOA, –4.18 W/m2 in the ATM, and 3.57 W/m2 at the SFC over Northwest China. Nevertheless, when dust emission became half of the CTL, the distribution range and absolute values of the dust DRF at different heights decreased (positive values decreased, negative values increased). The average values of nighttime net dust DRF from HalfDust were –0.33 W/m2 at the TOA, –1.93 W/m2 in the ATM, and 1.60 W/m2 at the SFC over DSR; –0.02 W/m2 at the TOA, –0.23 W/m2 in the ATM, and 0.21 W/m2 at the SFC over DAR; and –0.31 W/m2 at the TOA, –1.61 W/m2 in the ATM, and 1.30 W/m2 at the SFC over Northwest China.
At night, when dust emissions doubled compared to CTL, the net radiative forcing increased by 63% (1.73 W/m2) at the SFC, decreased by 60% (–1.91 W/m2) in the ATM, and decreased by 38% (–0.18 W/m2) at the TOA over DSR; increased by 79% (0.31 W/m2) at the SFC, decreased by 86% (–0.38 W/m2) in the ATM, and decreased by 140% (0.07 W/m2) at the TOA over DAR; and increased by 62% (1.37 W/m2) at the SFC, decreased by 58% (–1.53 W/m2) in the ATM, and decreased by 35% (–0.16 W/m2) at the TOA over Northwest China. When dust emissions became half of the CTL, the net radiative forcing decreased by 41% (–1.13 W/m2) at the SFC, increased by 40% (1.28 W/m2) in the ATM, and increased by 31% (0.15 W/m2) at the TOA over DSR; decreased by 46% (–0.18 W/m2) at the SFC, increased by 48% (0.21 W/m2) in the ATM, and increased by 60% (0.03 W/m2) at the TOA over DAR; and decreased by 41% (–0.9 W/m2) at the SFC, increased by 39% (1.04 W/m2) in the ATM, and increased by 31% (0.14 W/m2) at the TOA over Northwest China. Overall, at night, the impact of changes in dust emissions over DAR was greater than DSR. Meanwhile, the effect of DoubleDust on DRF was greater than the effect of HalfDust. Whether at the SFC, in the ATM, or at the TOA, the net radiative effect of dust during the day was greater than that at night, mainly due to the differences in SW radiation. In addition, the impact of changes in dust emissions on DRF was greater during the day than during the night (Table 3).

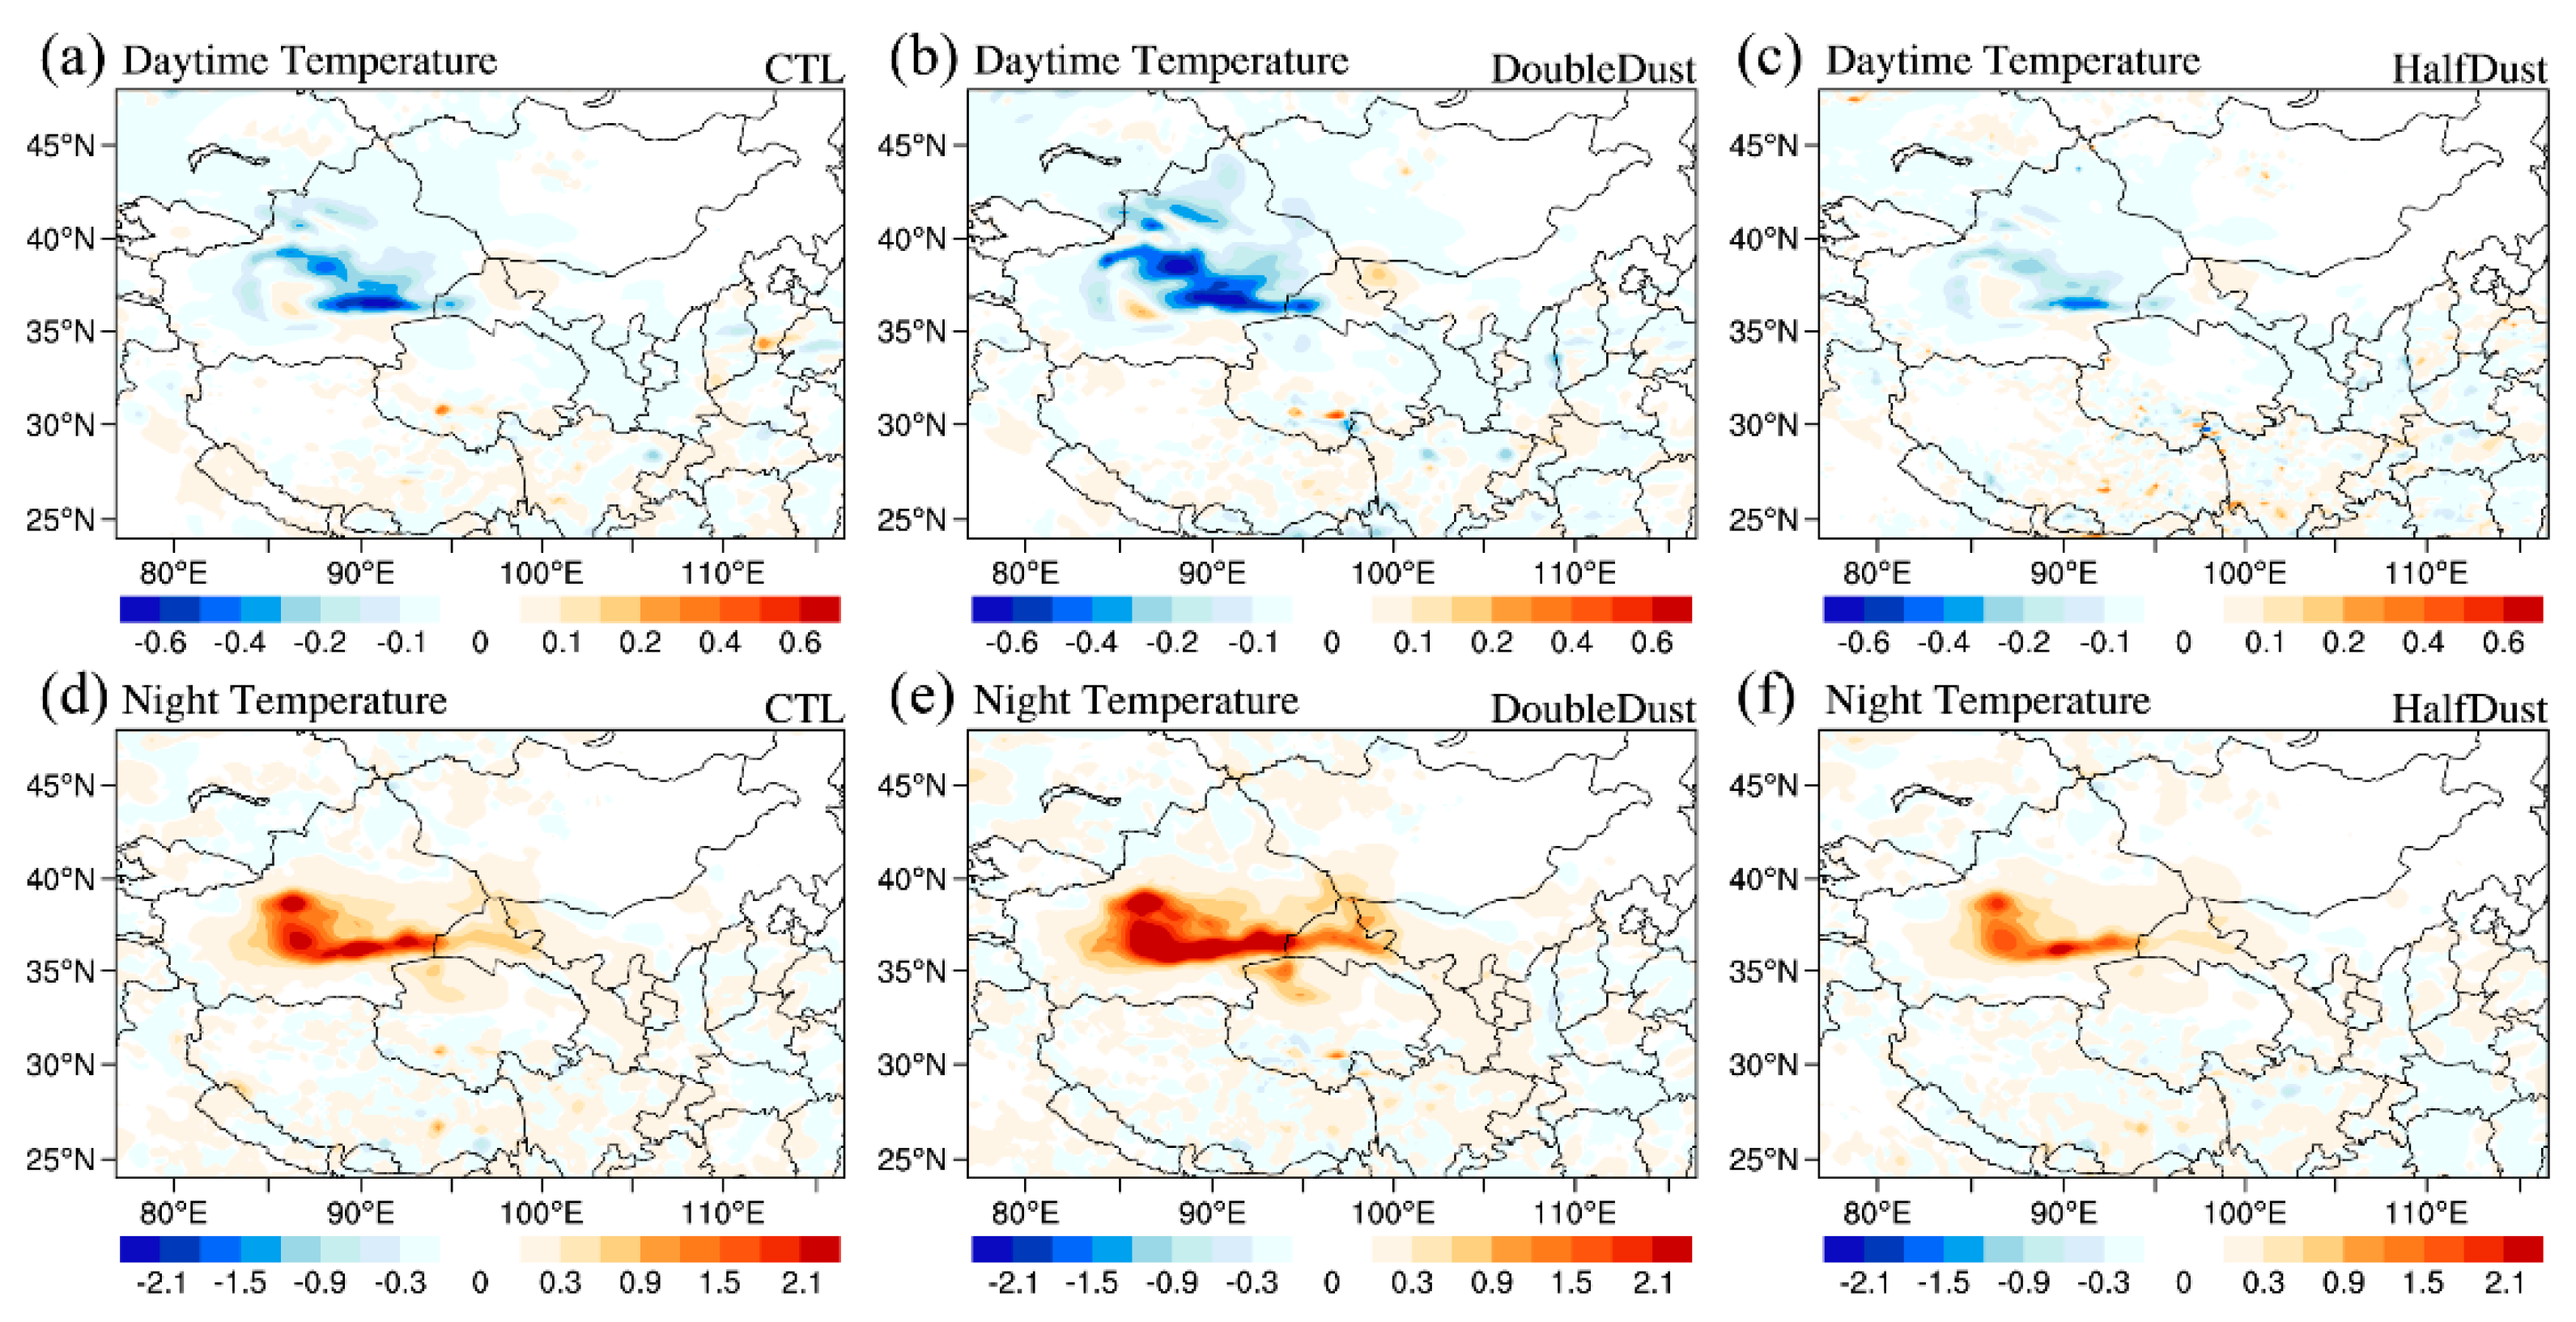
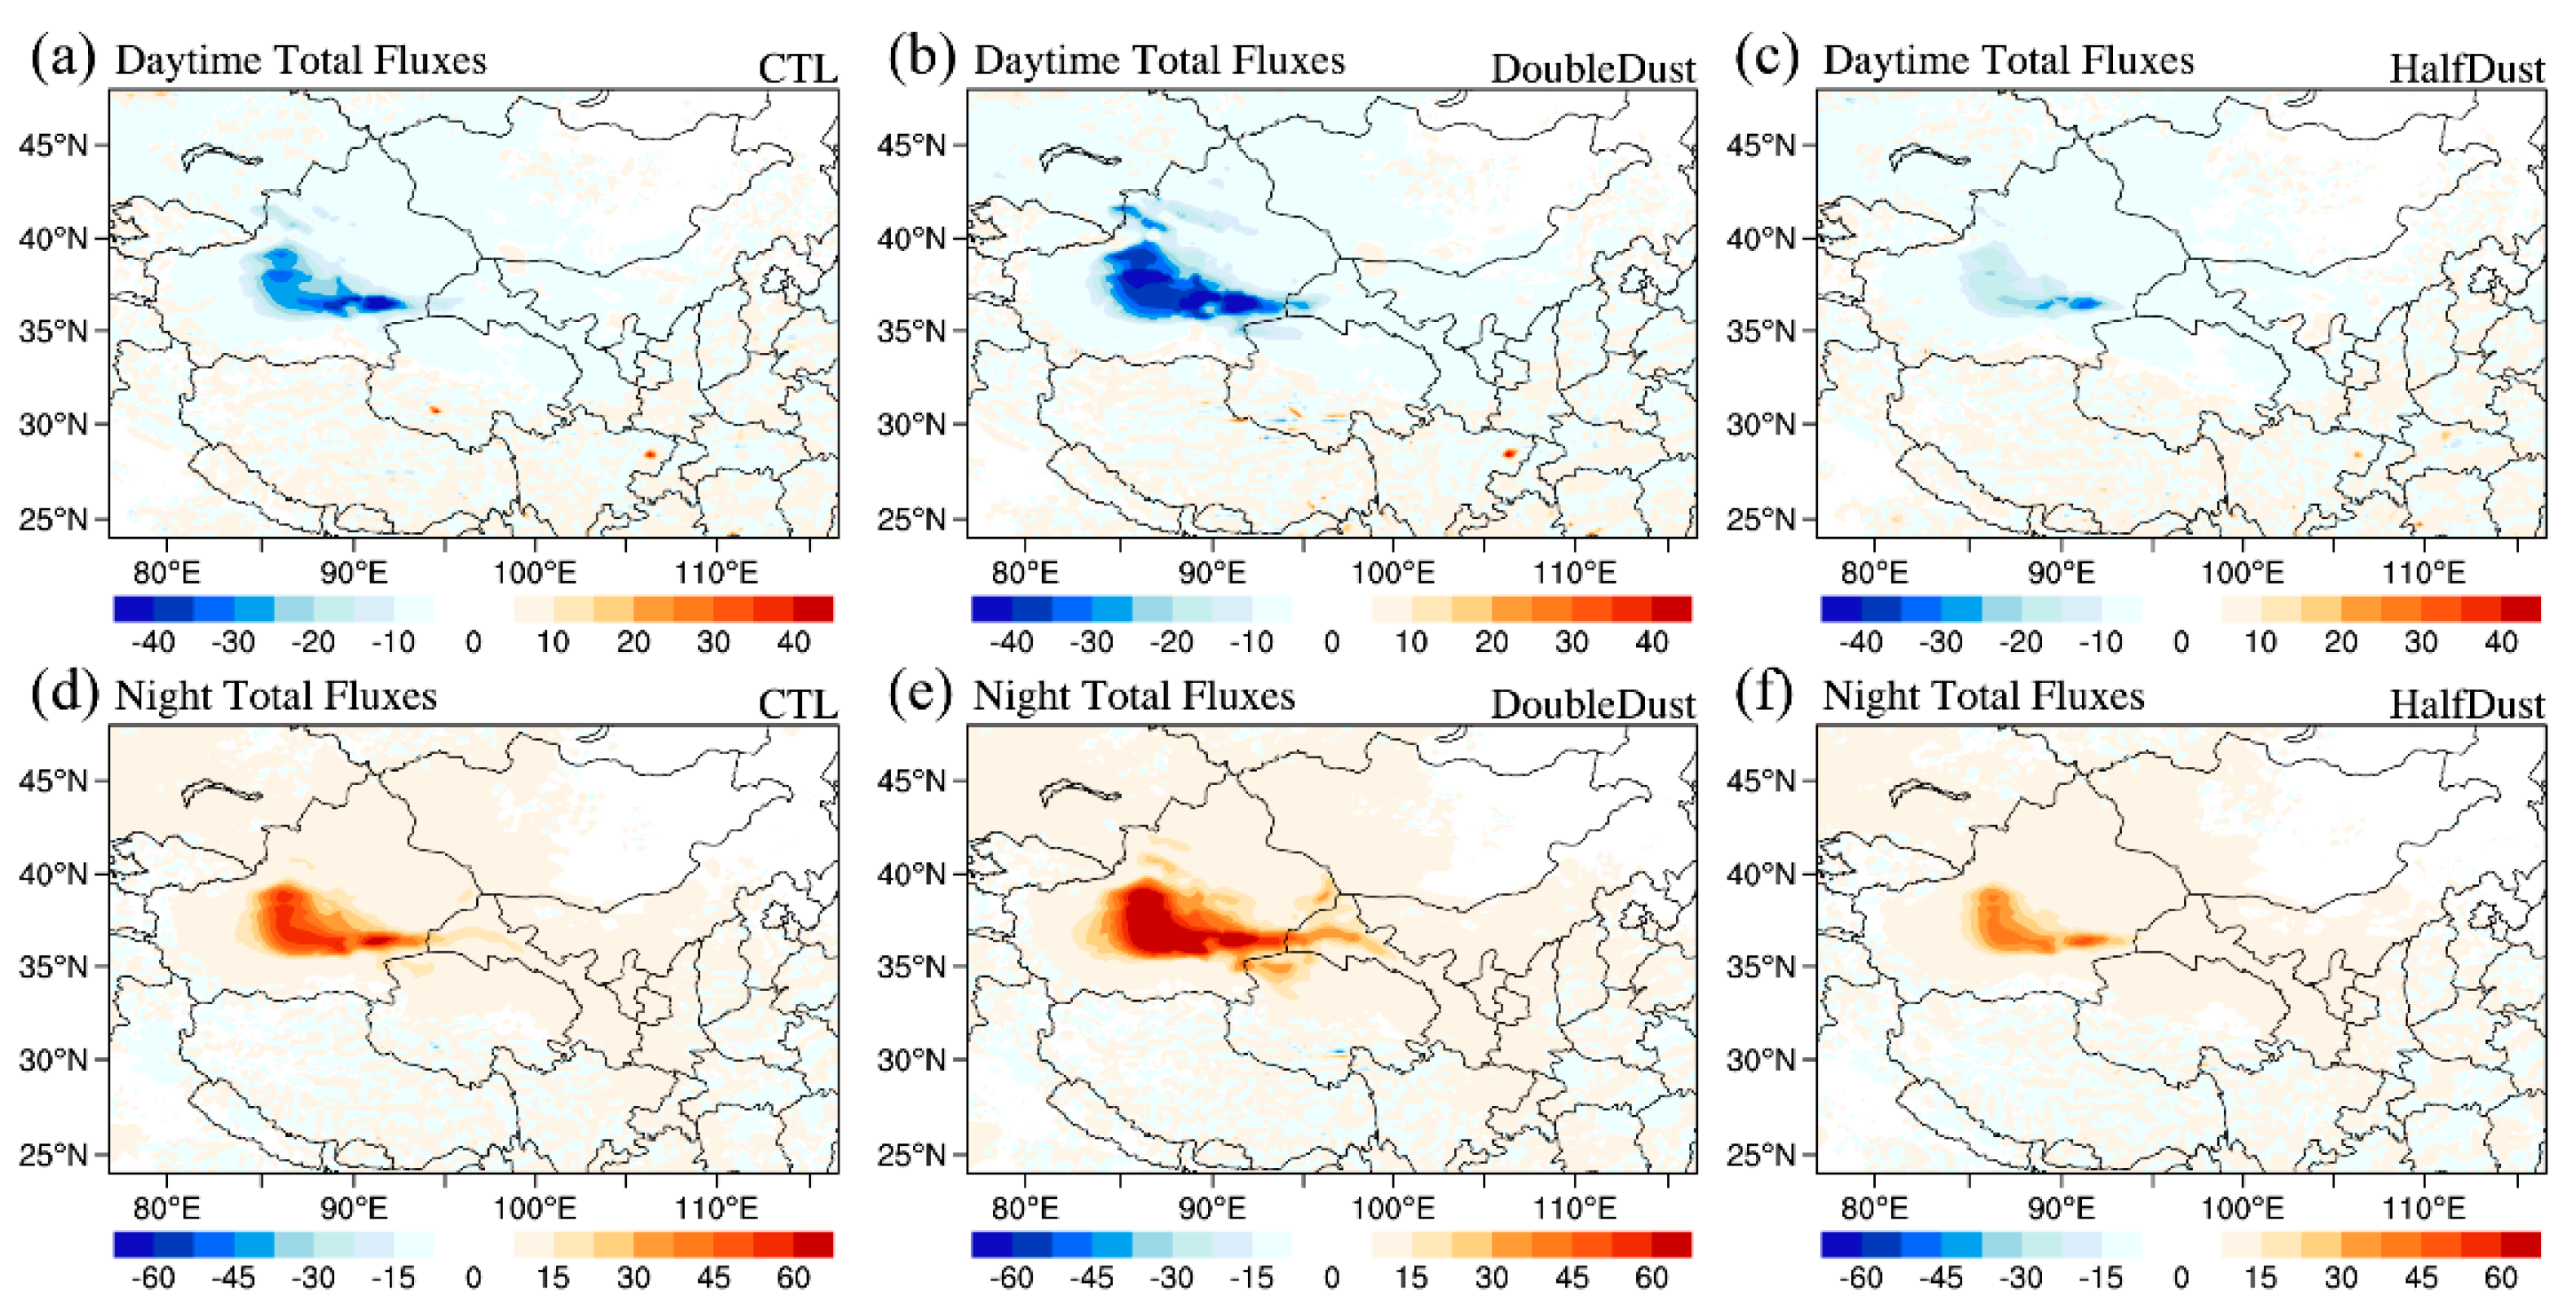
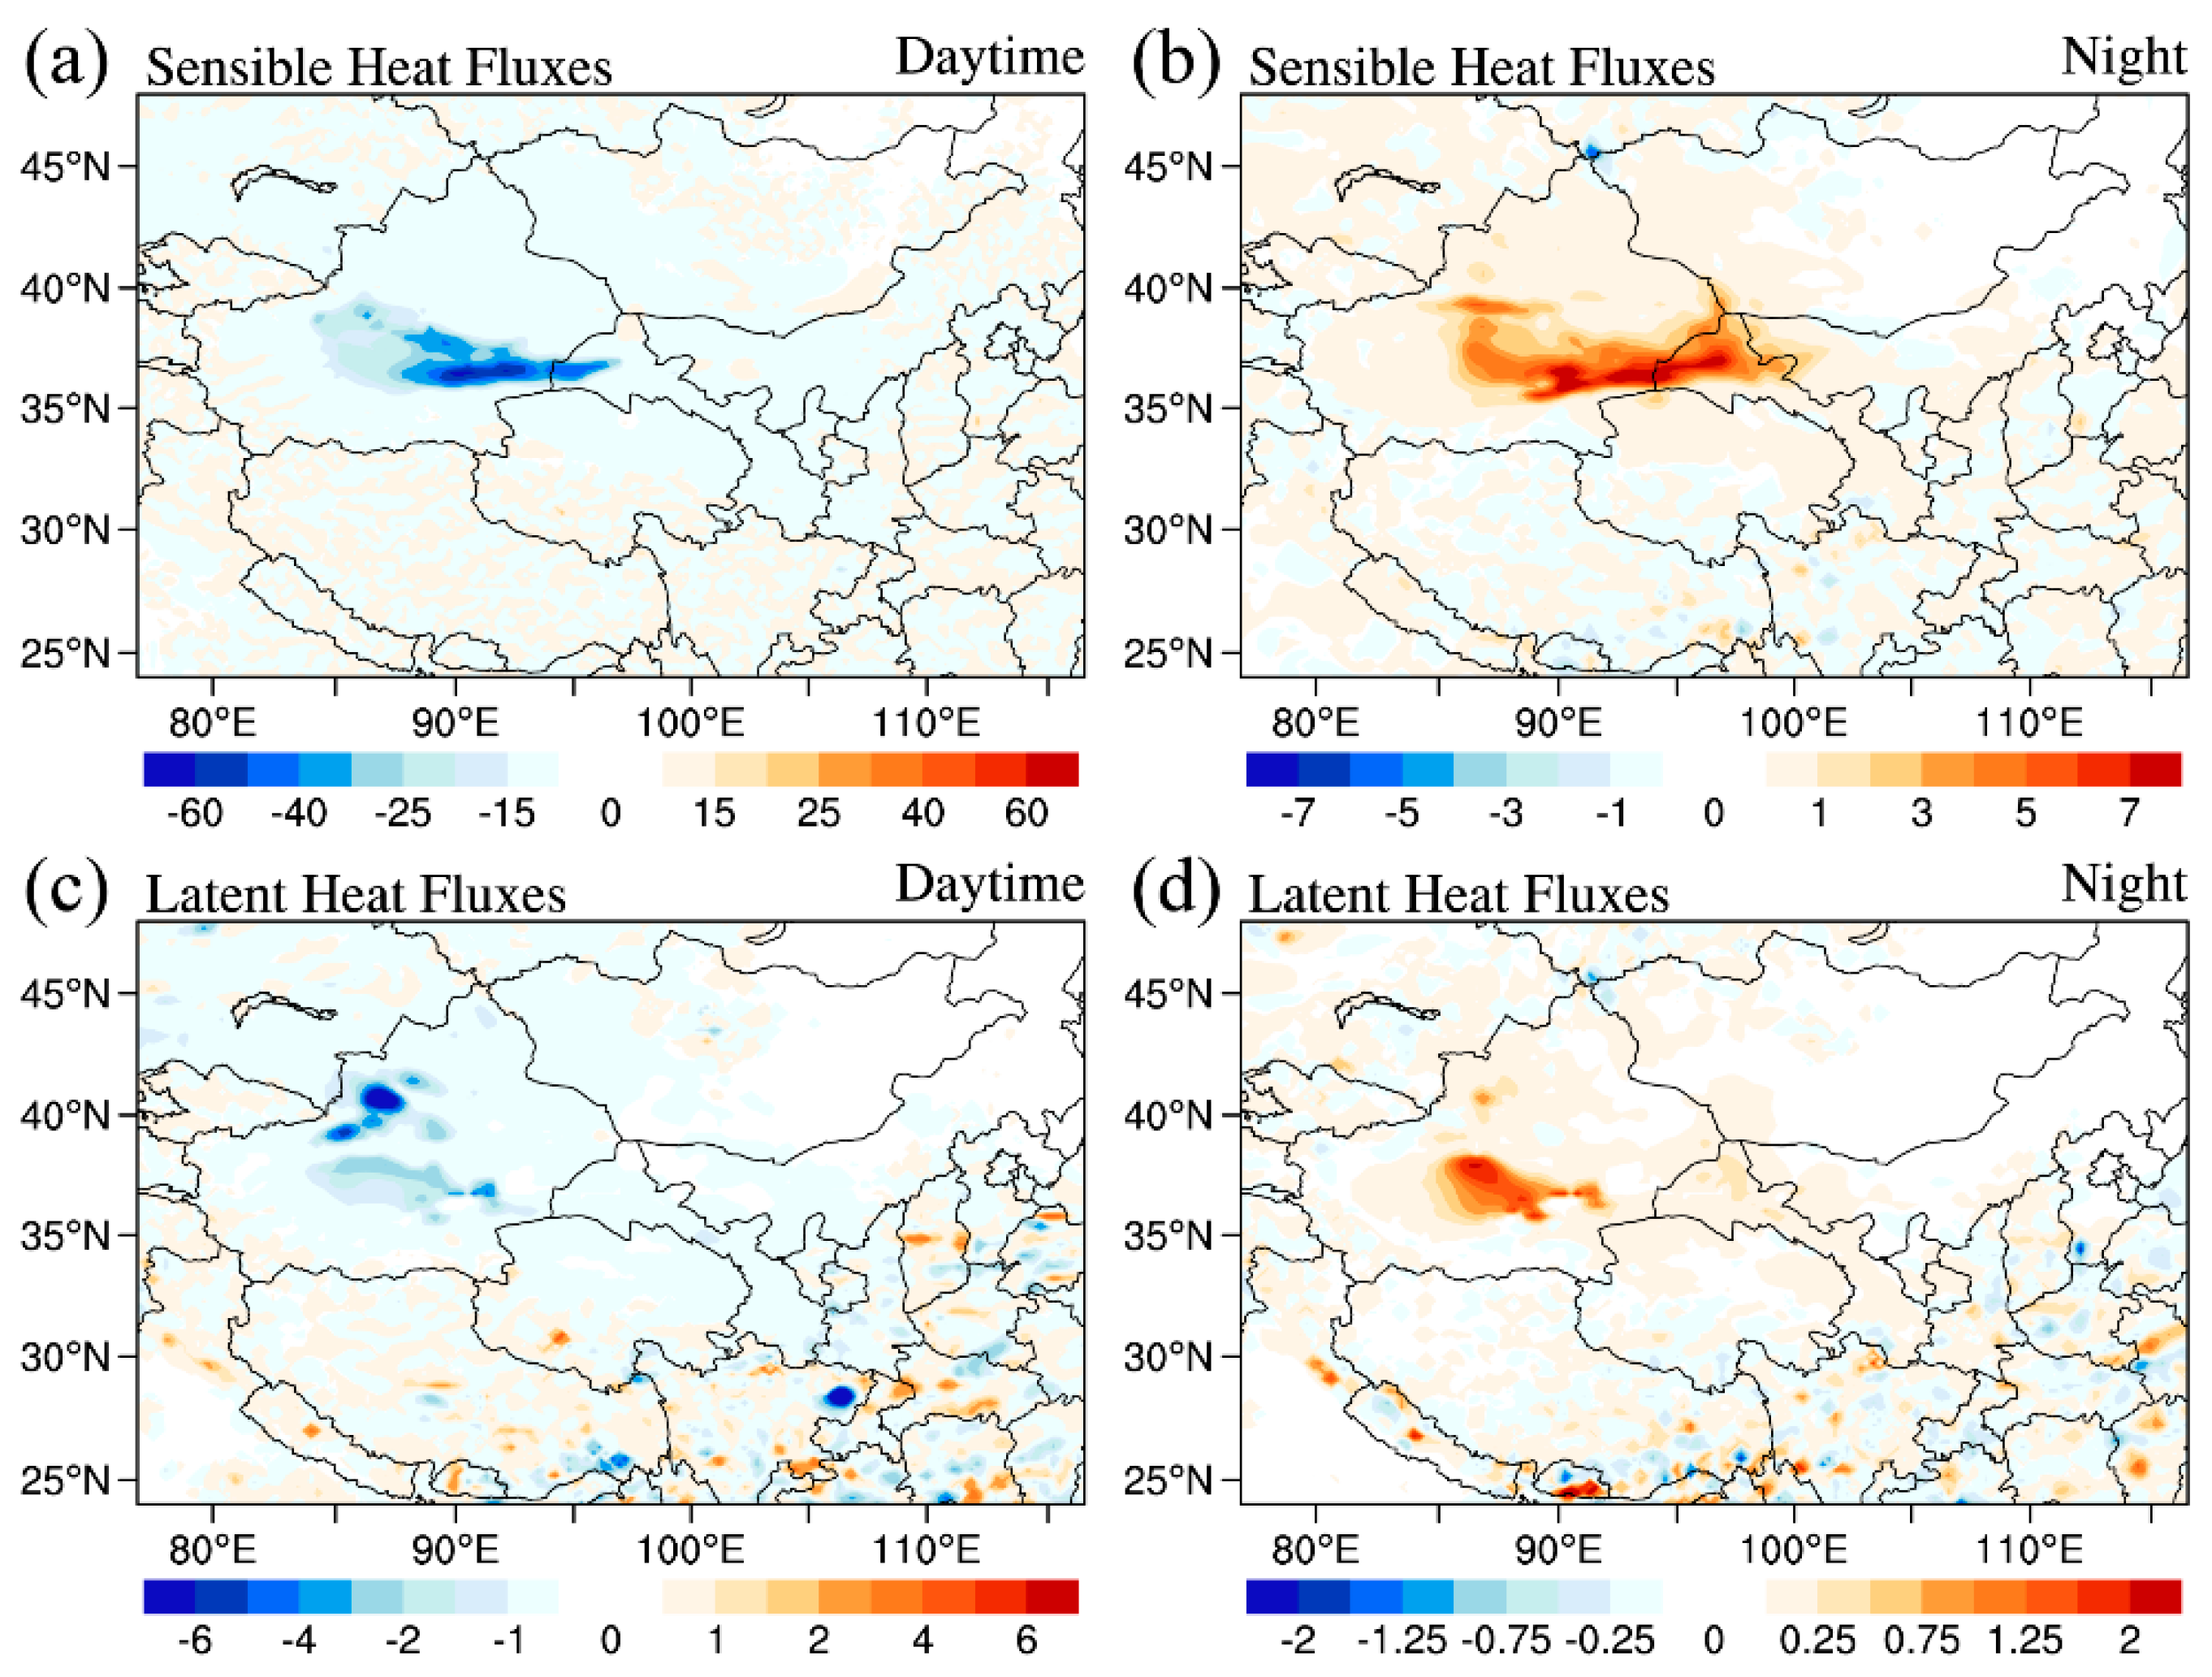
3.4. Impact of Dust Emission Changes on Surface Temperature

The impact of dust aerosols on surface temperature during the study period of day and night was calculated by the difference between simulations with and without dust. The results indicate that dust had a cooling effect at the SFC in the daytime and thus reduced the rate of the surface temperature (Figure 7). The area with a large drop in temperature was in southeastern Xinjiang, with a maximum drop of –0.88 °C. When dust emissions were doubled, the high-value area of cooling expanded. During the simulation period, the mean value changed from –0.035 °C to –0.059 °C over DSR, from –0.0065 °C to –0.008 °C over DAR, and from –0.023 °C to –0.035 °C over Northwest China. When dust emissions were halved, the high-value region of cooling decreased. The average cooling became –0.021 °C over DSR, –0.005 °C over DAR, and –0.015 °C over Northwest China. At night, dust had a heat preservation effect at the SFC, slowing the rate of surface temperature reduction at night. The increase in temperature was large over southeast of Xinjiang, with a maximum exceeding 2 °C. When dust emissions were doubled, the regional average value changed from 0.100 to 0.164 °C over DSR, from 0.0062 to 0.022 °C over DAR, and from 0.093 to 0.154 °C over Northwest China, and when dust emissions were halved, the regional average value changed to 0.060 °C over DSR, 0.001 °C over DAR, and 0.056 °C over DAR. Similar to the DRF, the impact of dust on temperature was consistent at DSR and DAR, but was stronger at DSR.
During the simulation period, dust was mainly distributed below 4 km along the transport path, regardless of daytime or nighttime (Figure S5). In addition, at 80°E–82°E, more dust accumulated below 2 km during the day than at night. For the low dust layer, turbulent fluxes and vertical mixing within the planetary boundary layer moderately offset cooling at the SFC by transporting heat absorbed by the dust layer downward to the SFC [17]. In addition, dust aerosols from East Asia are more absorbent than the Sahara Desert [50] and therefore can transfer more heat to the surface. Thus, during the simulation, the insulation effect of dust at night was stronger than the cooling effect during the day over DSR and Northwest China (Table 4). This result is consistent with the results of Chen et al. [62], who studied a dust storm from 14–17 April 2015 and found that dust aerosols decreased near-surface temperature in the North China Plain and dust source by 0.06 °C and 0.01 °C during the day and increased by 0.14 °C and 0.13 °C at night, respectively. However, over DAR, when the dust concentrations were low, the cooling effect during the day was greater than the insulation effect at night. This might be due to the fact that the heat brought to the SFC by the lower concentrations of dust did not offset the cooling effect as it did over the DSR.
The effects of changes in dust emissions on surface energy were further investigated. The difference in the distribution of the surface energy balance (Q, positive downward, calculated by Equation (S4) in the Supplementary Materials) during the day and night is given in Figure 8. Dust caused negative anomalies during the day (–2.95 W/m2 over DSR, –0.35 W/m2 over DAR, and –2.17 W/m2 over Northwest China) and caused positive anomalies (4.07 W/m2 over DSR, 0.46 W/m2 over DAR, and –3.28 W/m2 over Northwest China) at night (Figure 8a,d). Regardless of day or night, the difference in Q increased and decreased with increasing and decreasing dust emissions. Table 4 shows the average differences in temperature and Q over DSR, DAR, and Northwest China during the simulation period. During the daytime, dust reduced the surface energy, thus slowing down the rate of surface temperature increases. In contrast, at night, dust increased the surface energy and slowed the rate of surface temperature decreases. When dust emissions doubled compared to normal emissions, the difference in Q decreased by 65% over DSR, 48% over DAR, and 61% over Northwest China during the daytime and increased by 63% over DSR, 80% over DAR, and 63% over Northwest China at nighttime. The differences in temperature decreased by 68% over DSR, 23% over DAR, and 52% over Northwest China in the daytime and increased by 64% over DSR, 255% over DAR, and 66% over Northwest China at nighttime. When dust emissions were halved, the difference in Q increased by 41% over DSR, 49% over DAR, and 41% over Northwest China during the daytime and decreased by 41% over DSR, 48% over DAR, and 40% over Northwest China during the nighttime. The differences in temperature increased by 40% over DSR, 23% over DAR, and 35% over Northwest China in the daytime and decreased by 40% over DSR, 84% over DAR, and 40% over Northwest China at nighttime. Overall, during the daytime, the impact of dust concentration changes on temperature was greater over DSR than over DAR, but it was the opposite at night. In contrast to the effect on DRF, the influence of dust emission changes on surface temperature was less in the daytime than in the nighttime.
The mean values of differences in surface sensible and latent heat fluxes caused by dust at daytime and nighttime from CTL during the simulation are given in Figure 9. During the daytime, dust reduced the surface sensible heat flux in southern Xinjiang due to the cooling effect, resulting in an average reduction of –3.21 W/m2 over DSR, –0.88 W/m2 over DAR, and –2.51 W/m2 over Northwest China. Over dry land surfaces, latent heat flux at the SFC is usually small, so surface cooling is mainly balanced by the reduction in sensible heat fluxes at the SFC [63,64]. At night, the insulation effect of dust at the SFC caused an average increase of 0.44 W/m2 in surface sensible heat fluxes over DSR, 0.07 W/m2 over DAR, and 0.36 W/m2 over Northwest China. The decrease in daytime sensible heat fluxes exceeded the increase at night, which was in accordance with the results of Yue et al. [65] because turbulence is much more active during the day than at night. Since no precipitation occurred, the cooling effect of dust decreased the latent heat fluxes at the SFC in the daytime, with the maximum reduction (–15.12 W/m2) occurring in the Tianshan Mountains in northern Xinjiang. The latent heat flux decreased by an average of –0.36 W/m2 over DSR, –0.03 W/m2 over DAR, and –0.21 W/m2 over Northwest China. At night, the insulation effect of dust increased the evaporation of soil water vapor, resulting in an average increase in latent heat flux of 0.05 W/m2 over DSR, 0.008 W/m2 over DAR, and 0.04 W/m2 over Northwest China. Although the decrease in latent and sensible heat fluxes at the SFC would lead to an increase in total fluxes during the day, dust reduced the total energy at the SFC due to the domination of downward SW radiation on the total fluxes. Similarly, dust increased total flux due to the dominance of LW radiation flux at night (Equation (S4) in the Supplementary Materials).

4. Conclusions

The objective of this study was to quantitatively assess the contributions of dust aerosols to DRF and then to surface temperature, with particular attention on the differences between daytime and nighttime, by using numerical simulation and multi-satellite observations. A typical dust event that occurred during 9–12 April 2020 over Northwest China was taken as an example. Multi-satellite observations were selected to reveal the behaviors of typical dust events and to assess the model performance. Results indicate that the model was able to simulate dust, radiation fluxes, and temperature in Northwest China during the simulation. The results of the model could therefore be used to quantitatively assess the contributions of dust aerosols to DRF and then to surface temperature.
During the daytime, the net radiative effects of dust aerosols warmed the ATM and cooled the SFC and TOA over Northwest China. The net dust DRF was –3.76 W/m2 at the SFC, 3.00 W/m2 in the ATM, and –0.76 W/m2 at the TOA. At night, the net radiative effect of dust warmed the SFC and cooled the ATM and the TOA. The net dust DRF was 2.20 W/m2 at the SFC, –2.65 W/m2 in the ATM, and –0.45 W/m2 at the TOA. Whether at the TOA, in the ATM, or at the SFC, the net radiative impact of dust during the daytime was greater than that at nighttime, mainly due to the differences in SW radiation. Whether during the day or at night, the impact of changes in dust emissions over DAR was greater than DSR. In addition, the impact of changes in dust emissions on DRF was greater during the day than during the nighttime.
The important dust–radiation interaction had a nonnegligible feedback on the air temperature at the SFC. During the daytime, dust reduced the surface energy, thus slowing the rate of surface temperature increase. In contrast, at night, dust increased the surface energy and slowed the rate of surface temperature decrease. During the daytime, dust cooled the SFC air temperature by an average of –0.023 °C and warmed it by an average of 0.093 °C at night in Northwest China. Overall, during the daytime, the impact of dust concentration changes on temperature was greater over DSR than over DAR, but it was the opposite at night. Contrary to the impact on DRF, the influence of dust emission changes on surface temperature was lower during the daytime than at nighttime. When dust emissions were doubled compared to normal emissions, differences in temperature decreased by 52% in the daytime and increased by 66% at nighttime. When dust emissions were halved, changes in temperature increased by 35% in the daytime and decreased by 40% at nighttime.
In the daytime, dust reduced the surface energy, thus slowing down the rate of surface temperature increase. In contrast, at night, dust increased the surface energy and slowed the rate of surface temperature decrease. When dust emissions were doubled compared to normal emissions, the difference in Q decreased by 61% during the daytime and increased by 63% at nighttime. When dust emissions were halved, the difference in Q increased by 41% during the daytime and decreased by 40% during the nighttime. During the daytime, dust reduced the surface sensible heat flux by an average of –2.51 W/m2 in Northwest China, and the latent heat flux decreased by an average of –0.21 W/m2. At night, dust caused an average increase of 0.36 W/m2 in surface sensible heat fluxes and led to an average increase in surface latent heat flux of 0.04 W/m2. Although the decrease in latent and sensible heat fluxes at the SFC led to an increase in total fluxes during the day, dust reduced the total energy at the surface due to the domination of downward SW radiation on the total fluxes. Similarly, dust led to an increase in total flux due to the dominance of LW radiation flux at night (Equation (S4) in the Supplementary Materials).
This study focused on validating the model’s ability to simulate radiation flux and quantitatively assess the impacts of dust emission variations on dust DRF and surface temperature. We chose a dust event on 9–12 April 2020 as a case study. Assemblage simulations including numerous dust events will be executed to make the results more reliable. In addition, the indirect effects of dust on meteorological parameters will be further investigated.

Supplementary Materials

The following supporting information can be downloaded at: https://www.mdpi.com/article/10.3390/rs14030660/s1, Determination of Radiation Fluxes: Equations (S1)–(S4) [66,67,68,69,70]; Figure S1: Time series of observed and modeled PM10 concentrations ( μ g / m 3 ) at the Wuwei and Zhangye sites during 9–12 April 2020; Figure S2: The NCEP/FNL reanalysis data and simulated average temperature at 2 m and from 9–12 April 2020 [71]; Figure S3: Spatial distribution of daytime dust DRF (W/m2) at SFC under clear-sky conditions from DoubleDust and HalfDust simulation averaged during 9–12 April 2020; Figure S4: Spatial distribution of nighttime dust DRF (W/m2) at SFC under clear-sky conditions from DoubleDust and HalfDust simulation averaged during 9–12 April 2020; Figure S5: Cross-sections of the simulated daytime and nighttime extinction coefficients (km−1) at 532 nm along the dust transport path from CTL averaged during 9–12 April 2020; Table S1: Summary of geographical locations and ground-based sites for this study; Table S2: Summary of the description of the satellite data for this study.

Author Contributions

Conceptualization, J.W. and S.S.; methodology, J.W. and S.S.; software, J.W. and S.S.; validation, J.W. and S.S.; investigation, J.W., S.S., Z.Y. and C.S.; visualization, J.W., S.S. and X.X.; writing—original draft preparation, J.W., S.S., Z.Y., T.W., D.Y., J.C. and Y.Y.; writing—review and editing, J.W., S.S., Z.Y., C.S., X.X., T.W., D.Y., J.C., X.Z. and Y.Y.; supervision, J.W.; project administration, J.W.; funding acquisition, J.W. All authors have read and agreed to the published version of the manuscript.

Funding

This research was funded by the National Key Research and Development Program of China (2020YFA0608402) and the Natural Science Foundation of Gansu Province of China (21JR7RA501, 21JR7RA497).

Institutional Review Board Statement

Not applicable.

Informed Consent Statement

Not applicable.

Acknowledgments

We acknowledge NOAA/ESRL, NOAA/NCEP, and NCAR for developing the WRF-Chem model. Thank you for the support from the Supercomputing Center of Lanzhou University. We thank the Level-1 and Atmosphere Archive & Distribution System (LAADS) Distributed Active Archive Center (DAAC) for the MODIS 550 nm AOD (https://ladsweb.modaps.eosdis.nasa.gov/search/ (accessed on 28 May 2021)). The extinction coefficients from CALIPSO were obtained online (https://www-calipso.larc.nasa.gov/ (accessed on 19 June 2021)). We thank the National Aeronautics and Space Administration (NASA) for the CERES radiative flux data (https://ceres.larc.nasa.gov/data/ (accessed on 25 June 2021)). Thanks to NCEP for the FNL reanalysis data (https://rda.ucar.edu/datasets/ds083.2/index.html (accessed on 13 May 2021)). We thank the Ministry of Ecology and Environment of the People’s Republic of China for the PM10 observation data (https://air.cnemc.cn:18007/ (accessed on 21 June 2021)). In addition, we sincerely appreciate the editors and reviewers for their instructions and suggestions.

Conflicts of Interest

The authors declare no conflict of interest.

References

  1. Monks, P.; Granier, C.; Fuzzi, S.; Stohl, A.; Williams, M.; Akimoto, H.; Amann, M.; Baklanov, A.; Baltensperger, U.; Bey, I.; et al. Atmospheric composition change—Global and regional air quality. Atmos. Environ. 2009, 43, 5268–5350. [Google Scholar] [CrossRef] [Green Version]
  2. Liao, H.; Seinfeld, J.H. Radiative forcing by mineral dust aerosols: Sensitivity to key variables. J. Geophys. Res. Earth Surf. 1998, 103, 31637–31645. [Google Scholar] [CrossRef]
  3. Sokolik, I.N.; Toon, O.B. Incorporation of mineralogical composition into models of the radiative properties of mineral aerosol from UV to IR wavelengths. J. Geophys. Res. Earth Surf. 1999, 104, 9423–9444. [Google Scholar] [CrossRef]
  4. Huang, J.; Fu, Q.; Su, J.; Tang, Q.; Minnis, P.; Hu, Y.; Yi, Y.; Zhao, Q. Taklimakan dust aerosol radiative heating derived from CALIPSO observations using the Fu-Liou radiation model with CERES constraints. Atmos. Chem. Phys. 2009, 9, 4011–4021. [Google Scholar] [CrossRef]
  5. Zhao, C.; Hu, Z.; Qian, Y.; Leung, L.R.; Huang, J.; Huang, M.; Jin, J.; Flanner, M.G.; Zhang, R.; Wang, H.; et al. Simulating black carbon and dust and their radiative forcing in seasonal snow: A case study over North China with field campaign measurements. Atmos. Chem. Phys. 2014, 14, 11475–11491. [Google Scholar] [CrossRef] [Green Version]
  6. Zheng, X. Mechanics of Wind-Blown Sand Movements; Springer: Berlin/Heidelberg, Germany, 2009. [Google Scholar] [CrossRef]
  7. Yousif, C.; Quecedo, G.O.; Santos, J.B. Comparison of solar radiation in Marsaxlokk, Malta and Valladolid, Spain. Renew. Energy 2013, 49, 203–206. [Google Scholar] [CrossRef]
  8. Hansen, J.; Sato, M.; Ruedy, R. Radiative forcing and climate response. J. Geophys. Res. Earth Surf. 1997, 102, 6831–6864. [Google Scholar] [CrossRef]
  9. Huang, J.; Lin, B.; Minnis, P.; Wang, T.; Wang, X.; Hu, Y.; Yi, Y.; Ayers, J.K. Satellite-based assessment of possible dust aerosols semi-direct effect on cloud water path over East Asia. Geophys. Res. Lett. 2006, 33. [Google Scholar] [CrossRef] [Green Version]
  10. Koren, I.; Kaufman, Y.J.; Remer, L.A.; Martins, J.V. Measurement of the Effect of Amazon Smoke on Inhibition of Cloud Formation. Science 2004, 303, 1342–1345. [Google Scholar] [CrossRef] [Green Version]
  11. Su, J.; Minnis, P.; Huang, J.; Fu, Q.; Ge, J.; Bi, J. Estimation of Asian dust aerosol effect on cloud radiation forcing using Fu-Liou radiative model and CERES measurements. Atmos. Chem. Phys. 2008, 8, 2763–2771. [Google Scholar] [CrossRef] [Green Version]
  12. Li, J.; Jian, B.; Huang, J.; Hu, Y.; Zhao, C.; Kawamoto, K.; Liao, S.; Wu, M. Long-term variation of cloud droplet number concentrations from space-based Lidar. Remote Sens. Environ. 2018, 213, 144–161. [Google Scholar] [CrossRef]
  13. Park, S.-U.; Chang, L.-S.; Lee, E.-H. Direct radiative forcing due to aerosols in East Asia during a Hwangsa (Asian dust) event observed on 19–23 March 2002 in Korea. Atmos. Environ. 2005, 39, 2593–2606. [Google Scholar] [CrossRef]
  14. Huang, J.; Minnis, P.; Yan, H.; Yi, Y.; Chen, B.; Zhang, L.; Ayers, J.K. Dust aerosol effect on semi-arid climate over Northwest China detected from A-Train satellite measurements. Atmos. Chem. Phys. 2010, 10, 6863–6872. [Google Scholar] [CrossRef] [Green Version]
  15. Nie, W.; Ding, A.; Wang, T.; Kerminen, V.-M.; George, C.; Xue, L.; Wang, W.; Zhang, Q.; Petäjä, T.; Qi, X.; et al. Polluted dust promotes new particle formation and growth. Sci. Rep. 2014, 4, 6634. [Google Scholar] [CrossRef] [Green Version]
  16. Zhang, X.Y.; Wang, Y.Q.; Niu, T.; Gong, S.L.; Zhang, Y.M.; Sun, J.Y. Atmospheric aerosol compositions in China: Spatial/temporal variability, chemical signature, regional haze distribution and comparisons with global aerosols. Atmos. Chem. Phys. 2012, 12, 779–799. [Google Scholar] [CrossRef] [Green Version]
  17. Choobari, O.A.; Zawar-Reza, P.; Sturman, A. The global distribution of mineral dust and its impacts on the climate system: A review. Atmos. Res. 2014, 138, 152–165. [Google Scholar] [CrossRef]
  18. Costa, M.J.; Sohn, B.-J.; Levizzani, V.; Silva, A.M. Radiative Forcing of Asian Dust Determined from the Synergized GOME and GMS Satellite Data-A Case Study. J. Meteorol. Soc. Jpn. Ser. II 2006, 84, 85–95. [Google Scholar] [CrossRef] [Green Version]
  19. Haywood, J.; Boucher, O. Estimates of the direct and indirect radiative forcing due to tropospheric aerosols: A review. Rev. Geophys. 2000, 38, 513–543. [Google Scholar] [CrossRef]
  20. Wang, H.; Zhao, T.; Zhang, X.; Gong, S. Dust direct radiative effects on the earth-atmosphere system over east Asia: Early spring cooling and late spring warming. Chin. Sci. Bull. 2011, 56, 1020–1030. [Google Scholar] [CrossRef] [Green Version]
  21. Zhang, J.; Xia, X.; Zong, X.; Fan, X.; Chen, H.; Li, J. Dust Properties and Radiative Impacts at a Suburban Site during 2004–2017 in the North China Plain. Remote Sens. 2019, 11, 1842. [Google Scholar] [CrossRef] [Green Version]
  22. Ma, Z.; Fu, C. Some evidence of drying trend over northern China from 1951 to 2004. Chin. Sci. Bull. 2006, 51, 2913–2925. [Google Scholar] [CrossRef]
  23. Sun, K.; Su, Q.; Ming, Y. Dust Storm Remote Sensing Monitoring Supported by MODIS Land Surface Reflectance Database. Remote Sens. 2019, 11, 1772. [Google Scholar] [CrossRef] [Green Version]
  24. Kaufman, Y.J.; Tanré, D.; Boucher, O. A Satellite View of Aerosols in the Climate System. Nature 2002, 419, 215–223. [Google Scholar] [CrossRef] [PubMed]
  25. Prospero, J.M.; Ginoux, P.; Torres, O.; Nicholson, S.E.; Gill, T.E. Environmental characterization of global sources of atmospheric soil dust identified with the nimbus 7 total ozone mapping spectrometer (toms) absorbing aerosol product. Rev. Geophys. 2002, 40, 2-1–2-31. [Google Scholar] [CrossRef]
  26. Li, J.; Wong, M.S.; Lee, K.H.; Nichol, J.; Chan, P. Review of dust storm detection algorithms for multispectral satellite sensors. Atmos. Res. 2020, 250, 105398. [Google Scholar] [CrossRef]
  27. Yu, Y.; Notaro, M.; Liu, Z.; Kalashnikova, O.; Alkolibi, F.; Fadda, E.; Bakhrjy, F. Assessing temporal and spatial variations in atmospheric dust over Saudi Arabia through satellite, radiometric, and station data. J. Geophys. Res. Atmos. 2013, 118, 13253–13264. [Google Scholar] [CrossRef]
  28. Wang, W.; Sheng, L.; Dong, X.; Qu, W.; Sun, J.; Jin, H.; Logan, T. Dust aerosol impact on the retrieval of cloud top height from satellite observations of CALIPSO, CloudSat and MODIS. J. Quant. Spectrosc. Radiat. Transf. 2017, 188, 132–141. [Google Scholar] [CrossRef]
  29. Huang, J.; Minnis, P.; Yi, Y.; Tang, Q.; Wang, X.; Hu, Y.; Liu, Z.; Ayers, K.; Trepte, C.; Winker, D. Summer dust aerosols detected from CALIPSO over the Tibetan Plateau. Geophys. Res. Lett. 2007, 34. [Google Scholar] [CrossRef] [Green Version]
  30. Chen, S.; Huang, J.; Kang, L.; Wang, H.; Ma, X.; He, Y.; Yuan, T.; Yang, B.; Huang, Z.; Zhang, G. Emission, transport, and radiative effects of mineral dust from the Taklimakan and Gobi deserts: Comparison of measurements and model results. Atmos. Chem. Phys. 2017, 17, 2401–2421. [Google Scholar] [CrossRef] [Green Version]
  31. Chaibou, A.A.S.; Ma, X.; Sha, T. Dust radiative forcing and its impact on surface energy budget over West Africa. Sci. Rep. 2020, 10, 12236. [Google Scholar] [CrossRef]
  32. Liu, X.; Chen, S.; Guo, Z.; Zhou, H.; Chen, Y.; Kang, Y.; Liu, Q.; Huang, G.; Liu, T.; Chen, C.; et al. The influence of dusts on radiation and temperature over the eastern Asia with a regional climate model. Sci. Total Environ. 2021, 792, 148351. [Google Scholar] [CrossRef] [PubMed]
  33. Chen, S.; Huang, J.; Zhao, C.; Qian, Y.; Leung, L.R.; Yang, B. Modeling the transport and radiative forcing of Taklimakan dust over the Tibetan Plateau: A case study in the summer of 2006. J. Geophys. Res. Atmos. 2013, 118, 797–812. [Google Scholar] [CrossRef]
  34. Hu, Z.; Huang, J.; Zhao, C.; Jin, Q.; Ma, Y.; Yang, B. Modeling dust sources, transport, and radiative effects at different altitudes over the Tibetan Plateau. Atmos. Chem. Phys. 2020, 20, 1507–1529. [Google Scholar] [CrossRef] [Green Version]
  35. Zhang, X.; Chen, S.; Kang, L.; Yuan, T.; Luo, Y.; Alam, K.; Li, J.; He, Y.; Bi, H.; Zhao, D. Direct Radiative Forcing Induced by Light-Absorbing Aerosols in Different Climate Regions Over East Asia. J. Geophys. Res. Atmos. 2020, 125, e2019JD032228. [Google Scholar] [CrossRef]
  36. Liu, L.; Huang, X.; Ding, A.; Fu, C. Dust-induced radiative feedbacks in north China: A dust storm episode modeling study using WRF-Chem. Atmos. Environ. 2016, 129, 43–54. [Google Scholar] [CrossRef]
  37. Li, L.; Li, Z.; Chang, W.; Ou, Y.; Goloub, P.; Li, C.; Li, K.; Hu, Q.; Wang, J.; Wendisch, M. Aerosol solar radiative forcing near the Taklimakan Desert based on radiative transfer and regional meteorological simulations during the Dust Aerosol Observation-Kashi campaign. Atmos. Chem. Phys. 2020, 20, 10845–10864. [Google Scholar] [CrossRef]
  38. Chen, S.-H.; Sun, W.-Y. A one-dimensional time dependent cloud model. J. Meteorol. Soc. Jpn. 2002, 80, 99–118. [Google Scholar] [CrossRef] [Green Version]
  39. Iacono, M.J.; Delamere, J.S.; Mlawer, E.J.; Shephard, M.W.; Clough, S.A.; Collins, W.D. Radiative forcing by long-lived greenhouse gases: Calculations with the AER radiative transfer models. J. Geophys. Res. 2008, 113. [Google Scholar] [CrossRef]
  40. Grell, G.A.; Freitas, S.R. A scale and aerosol aware stochastic convective parameterization for weather and air quality modeling. Atmos. Chem. Phys. 2014, 14, 5233–5250. [Google Scholar] [CrossRef] [Green Version]
  41. Chen, F.; Dudhia, J. Coupling an advanced land surface-hydrology model with the Penn State-NCAR MM5 modeling system. Part II: Preliminary model validation. Mon. Weather Rev. 2001, 129, 587–604. [Google Scholar] [CrossRef]
  42. Hong, S.-Y.; Noh, Y.; Dudhia, J. A New Vertical Diffusion Package with an Explicit Treatment of Entrainment Processes. Mon. Weather Rev. 2006, 134, 2318–2341. [Google Scholar] [CrossRef] [Green Version]
  43. Jiménez, P.A.; Dudhia, J.; González-Rouco, J.F.; Navarro, J.; Montávez, J.P.; García-Bustamante, E. A Revised Scheme for the WRF Surface Layer Formulation. Mon. Weather Rev. 2012, 140, 898–918. [Google Scholar] [CrossRef] [Green Version]
  44. Hewson, M.; McGowan, H.; Phinn, S. Comparing Remotely Sensed and Modelled Aerosol Properties for a Region of Low Aerosol Optical Depth. In Proceedings of the IEEE International Geoscience and Remote Sensing Symposium (IGARSS), Munich, Germany, 22–27 July 2012; pp. 2512–2515. [Google Scholar]
  45. Shao, Y. Simplification of a dust emission scheme and comparison with data. J. Geophys. Res. Earth Surf. 2004, 109. [Google Scholar] [CrossRef] [Green Version]
  46. Fast, J.D.; Gustafson, W.I., Jr.; Easter, R.C.; Zaveri, R.A.; Barnard, J.C.; Chapman, E.G.; Grell, G.A.; Peckham, S.E. Evolution of ozone, particulates, and aerosol direct radiative forcing in the vicinity of Houston using a fully coupled meteorology-chemistry-aerosol model. J. Geophys. Res. Atmos. 2006, 111. [Google Scholar] [CrossRef]
  47. Bohren, C.F.; Huffman, D.R. Absorption and Scattering of Light by Small Particles; Wiley: Hoboken, NJ, USA, 1983. [Google Scholar]
  48. Shao, Y. A model for mineral dust emission. J. Geophys. Res. Earth Surf. 2001, 106, 20239–20254. [Google Scholar] [CrossRef]
  49. Shao, Y.; Ishizuka, M.; Mikami, M.; Leys, J.F. Parameterization of size-resolved dust emission and validation with measurements. J. Geophys. Res. Earth Surf. 2011, 116. [Google Scholar] [CrossRef]
  50. Huang, J.; Wang, T.; Wang, W.; Li, Z.; Yan, H. Climate effects of dust aerosols over East Asian arid and semiarid regions. J. Geophys. Res. Atmos. 2014, 119, 11398–11416. [Google Scholar] [CrossRef]
  51. Kaufman, Y.J.; Tanré, D.; Remer, L.A.; Vermote, E.F.; Chu, A.; Holben, B.N. Operational remote sensing of tropospheric aerosol over land from EOS moderate resolution imaging spectroradiometer. J. Geophys. Res. Space Phys. 1997, 102, 17051–17067. [Google Scholar] [CrossRef]
  52. Hsu, N.C.; Tsay, S.-C.; King, M.D.; Herman, J.R. Aerosol Properties over Bright-Reflecting Source Regions. IEEE Trans. Geosci. Remote Sens. 2004, 42, 557–569. [Google Scholar] [CrossRef]
  53. Sayer, A.M.; Munchak, L.A.; Hsu, N.C.; Levy, R.C.; Bettenhausen, C.; Jeong, M.-J. MODIS Collection 6 aerosol products: Comparison between Aqua’s e-Deep Blue, Dark Target, and “merged” data sets, and usage recommendations. J. Geophys. Res. Atmos. 2014, 119, 13965–13989. [Google Scholar] [CrossRef]
  54. Bilbao, J.; Román, R.; Miguel, A. Turbidity coefficients from normal direct solar irradiance in Central Spain. Atmos. Res. 2014, 143, 73–84. [Google Scholar] [CrossRef]
  55. Campbell, J.R.; Tackett, J.L.; Reid, J.S.; Zhang, J.; Curtis, C.A.; Hyer, E.J.; Sessions, W.R.; Westphal, D.L.; Prospero, J.M.; Welton, E.J.; et al. Evaluating nighttime CALIOP 0.532 μm aerosol optical depth and extinction coefficient retrievals. Atmos. Meas. Tech. 2012, 5, 2143–2160. [Google Scholar] [CrossRef] [Green Version]
  56. Rutan, D.A.; Kato, S.; Doelling, D.R.; Rose, F.G.; Nguyen, L.T.; Caldwell, T.E.; Loeb, N.G. CERES Synoptic Product: Methodology and Validation of Surface Radiant Flux. J. Atmos. Ocean. Technol. 2015, 32, 1121–1143. [Google Scholar] [CrossRef]
  57. Bilbao, J.; González, P.S.; Castrillo, A.D.M. UV-B climatology in Central Spain. Int. J. Clim. 2008, 28, 1933–1941. [Google Scholar] [CrossRef]
  58. Uno, I.; Wang, Z.; Chiba, M.; Chun, Y.S.; Gong, S.L.; Hara, Y.; Jung, E.; Lee, S.-S.; Liu, M.; Mikami, M.; et al. Dust model intercomparison (DMIP) study over Asia: Overview. J. Geophys. Res. Earth Surf. 2006, 111. [Google Scholar] [CrossRef] [Green Version]
  59. Meloni, D.; di Sarra, A.; Di Iorio, T.; Fiocco, G. Influence of the vertical profile of Saharan dust on the visible direct radiative forcing. J. Quant. Spectrosc. Radiat. Transf. 2005, 93, 397–413. [Google Scholar] [CrossRef]
  60. Wang, S.; Yuan, W.; Shang, K. The impacts of different kinds of dust events on PM10 pollution in northern China. Atmos. Environ. 2006, 40, 7975–7982. [Google Scholar] [CrossRef]
  61. Chen, S.; Huang, J.; Qian, Y.; Zhao, C.; Kang, L.; Yang, B.; Wang, Y.; Liu, Y.; Yuan, T.; Wang, T.; et al. An overview of mineral dust modeling over East Asia. J. Meteorol. Res. 2017, 31, 633–653. [Google Scholar] [CrossRef]
  62. Chen, L.; Zhang, M.; Zhu, J.; Skorokhod, A. Model analysis of soil dust impacts on the boundary layer meteorology and air quality over East Asia in April 2015. Atmos. Res. 2017, 187, 42–56. [Google Scholar] [CrossRef]
  63. Luo, C.; Mahowald, N.M.; Del Corral, J. Surface radiative forcing by soil dust aerosols and the hydrologic cycle. J. Geophys. Res. 2004, 109, 4203. [Google Scholar] [CrossRef]
  64. Mallet, M.; Tulet, P.; Serça, D.; Solmon, F.; Dubovik, O.; Pelon, J.; Pont, V.; Thouron, O. Impact of dust aerosols on the radiative budget, surface heat fluxes, heating rate profiles and convective activity over West Africa during March 2006. Atmos. Chem. Phys. 2009, 9, 7143–7160. [Google Scholar] [CrossRef] [Green Version]
  65. Yue, X.; Wang, H.; Liao, H.; Fan, K. Simulation of dust aerosol radiative feedback using the GMOD: 2. Dust-climate interactions. J. Geophys. Res. Earth Surf. 2010, 115. [Google Scholar] [CrossRef]
  66. Sokolik, I.N.; Winker, D.M.; Bergametti, G.; Gillette, D.A.; Carmichael, G.; Kaufman, Y.J.; Gomes, L.; Schuetz, L.; Penner, J.E. Introduction to special section: Outstanding problems in quantifying the radiative impacts of mineral dust. J. Geophys. Res. Earth Surf. 2001, 106, 18015–18027. [Google Scholar] [CrossRef]
  67. Heald, C.L.; Ridley, D.A.; Kroll, J.H.; Barrett, S.R.H.; Cady-Pereira, K.E.; Alvarado, M.J.; Holmes, C.D. Contrasting the direct radiative effect and direct radiative forcing of aerosols. Atmos. Chem. Phys. 2014, 14, 5513–5527. [Google Scholar] [CrossRef] [Green Version]
  68. Kantha, L.H.; Clayson, C.A. Chapter 4 surface exchange processes. Int. Geophys. 2000, 67, 417–509. [Google Scholar] [CrossRef]
  69. Parker, D.J. Local weather. In Meteorology of Tropical West Africa; Parker, D.J., Diop-Kane, M., Eds.; Wiley: Hoboken, NJ, USA, 2017; pp. 130–174. [Google Scholar]
  70. Hartmann, D.L. Chapter 4 the energy balance of the surface. Int. Geophys. 1994, 56, 81–114. [Google Scholar]
  71. Chen, S.; Yuan, T.; Zhang, X.; Zhang, G.; Feng, T.; Zhao, D.; Zang, Z.; Liao, S.; Ma, X.; Jiang, N.; et al. Dust modeling over East Asia during the summer of 2010 using the WRF-Chem model. J. Quant. Spectrosc. Radiat. Transf. 2018, 213, 1–12. [Google Scholar] [CrossRef]
Figure 1. Model domain with the location of sites on the surface elevation topography (m). The Wuwei and Zhangye sites are indicated in red. The red line stands for the CALIPSO overpass at 07:13 UTC on 11 April 2020. The blue rectangular areas A and B represent the dust source region (DSR) and dust affected region (DAR), respectively.
Remotesensing 14 00660 g001
Figure 2. Spatial distribution of 550 nm aerosol optical depth (AOD) from MODIS retrievals and WRF-Chem simulations: (a) MODIS, (b) CTL, (c) DoubleDust, (d) HalfDust. The simulated AOD was extracted at the same overpass time as MODIS (06:00 UTC on 11 April 2020).
Remotesensing 14 00660 g002
Figure 3. Cross sections of 532 nm extinction coefficient (km−1) along the CALIPSO orbit path (as shown in Figure 1) from CALIPSO at 07:13 UTC and WRF-Chem simulations at 07:00 UTC on 11 April 2020: (a) CALIPSO, (b) CTL, (c) DoubleDust, (d) HalfDust.
Remotesensing 14 00660 g003
Figure 4. Spatial distribution of daytime net radiation fluxes (W/m2) at the surface from CERES observations and CTL simulations averaged during 9–12 April 2020: (a) SW from CERES, (b) SW from CTL, (c) LW from CERES, (d) LW from CTL, (e) net from CERES, (f) net from CTL.
Remotesensing 14 00660 g004
Figure 5. Spatial distribution of daytime dust direct radiative forcing (DRF) (in W/m2) under clear-sky conditions from CTL simulation averaged during 09–12 April 2020: (a) SW DRF at the TOA, (b) LW DRF at the TOA, (c) net DRF at the TOA, (d) SW DRF in the ATM, (e) LW DRF in the ATM, (f) net DRF in the ATM, (g) SW DRF at the SFC, (h) LW DRF at the SFC, (i) net DRF at the SFC.
Remotesensing 14 00660 g005
Figure 6. Spatial distribution of nighttime dust DRF (W/m2) under clear-sky conditions from CTL simulation averaged during 9–12 April 2020: (a) SW DRF at the TOA, (b) LW DRF at the TOA, (c) net DRF at the TOA, (d) SW DRF in the ATM, (e) LW DRF in the ATM, (f) net DRF in the ATM, (g) SW DRF at the SFC, (h) LW DRF at the SFC, (i) net DRF at the SFC.
Remotesensing 14 00660 g006
Figure 7. Differences in modeled daytime and nighttime temperature (°C) caused by dust at the SFC from WRF-Chem simulations averaged during 9–12 April 2020: (a) CTL during the day, (b) DoubleDust during the day, (c) HalfDust during the day, (d) CTL at night, (e) DoubleDust at night, (f) HalfDust at night.
Remotesensing 14 00660 g007
Figure 8. Differences in simulated daytime and nighttime total fluxes (positive downward, W/m2) induced by dust at the SFC from the model averaged during 9–12 April 2020: (a) CTL during the day, (b) DoubleDust during the day (c) HalfDust during the day, (d) CTL at night, (e) DoubleDust at night, (f) HalfDust at night.
Remotesensing 14 00660 g008
Figure 9. Differences in modeled daytime and nighttime sensible heat fluxes and latent heat fluxes (both are positive upward, W/m2) caused by dust at the SFC from CTL averaged during 9–12 April 2020: (a) sensible heat fluxes during the day, (b) sensible heat fluxes at night, (c) latent heat fluxes during the day, (d) latent heat fluxes at night.
Remotesensing 14 00660 g009
Table 1. Daytime radiation fluxes (W/m2) at the TOA and the SFC from CERES and CTL simulation averaged over Northwest China (30°N–45°N, 75°E–110°E) during 9–12 April 2020.
SWDN 1SWUP 2LWDN 3LWUP 4SW 5LW 6Net 7
CERES_TOA7041710262533262271
CTL_TOA6912260255465255210
CERES_SFC550135230382415152263
CTL_SFC556206232369350137213
1 Downward shortwave radiation flux (W/m2). 2 Upward shortwave radiation flux (W/m2). 3 Downward longwave radiation flux (W/m2). 4 Upward longwave radiation flux (W/m2). 5 Net shortwave radiation flux (SWDN—SWUP) (W/m2). 6 Net longwave radiation flux (LWUP—LWDN) (W/m2). 7 Net radiation flux (SW—LW) (W/m2).
Table 2. Mean values of daytime dust DRF (W/m2) from WRF-Chem simulations at the TOA, in the ATM, and at the SFC over DSR (37°N–45°N, 77°E–100°E), DAR (33°N–42°N, 100°E–108°E), and Northwest China (30°N–45°N, 75°E–110°E) during 9–12 April 2020. All variables are downward positive.
TOAATMSFC
CTLDoubleDustHalfDustCTLDoubleDustHalfDustCTLDoubleDustHalfDust
DSRSW(W/m2)–1.83–3.04–1.096.9211.284.00–8.75–14.32–5.09
LW(W/m2)0.610.990.35–3.13–5.07–1.843.746.062.19
Net(W/m2)–1.22–2.05–0.743.796.212.16–5.01–8.26–2.90
DARSW(W/m2)–0.36–0.58–0.211.763.240.93–2.12–3.82–1.14
LW(W/m2)0.180.330.10–0.87–1.57–0.471.051.900.57
Net(W/m2)–0.18–0.25–0.110.891.670.46–1.07–1.92–0.57
NorthwestChinaSW(W/m2)–1.23–2.02–0.745.589.013.28–6.81–11.03–4.02
LW(W/m2)0.470.770.27–2.58–4.15–1.553.054.921.82
Net(W/m2)–0.76–1.25–0.473.004.861.73–3.76–6.11–2.20
Table 3. Mean values of nighttime dust DRF (W/m2) from WRF-Chem simulations at the TOA, in the ATM, and at the SFC over DSR (37°N–45°N, 77°E–100°E), DAR (33°N–42°N, 100°E–108°E), and Northwest China (30°N–45°N, 75°E–110°E) during 9–12 April 2020. All variables are downward positive.
TOAATMSFC
CTLDoubleDustHalfDustCTLDoubleDustHalfDustCTLDoubleDustHalfDust
DSRSW(W/m2)000000000
LW(W/m2)–0.48–0.66–0.33–3.21–5.12–1.932.734.461.60
Net(W/m2)–0.48–0.66–0.33–3.21–5.12–1.932.734.461.60
DARSW(W/m2)000000000
LW(W/m2)–0.05–0.12–0.02–0.44–0.82–0.230.390.700.21
Net(W/m2)–0.05–0.12–0.02–0.44–0.82–0.230.390.700.21
NorthwestChinaSW(W/m2)000000000
LW(W/m2)–0.45–0.61–0.31–2.65–4.18–1.612.203.571.30
Net(W/m2)–0.45–0.61–0.31–2.65–4.18–1.612.203.571.30
Table 4. Mean values of daytime and nighttime temperature (°C) and total fluxes (positive downward, W/m2) induced by dust at the SFC from WRF-Chem simulations over DSR (37°N–45°N, 77°E–100°E), DAR (33°N–42°N, 100°E–108°E), and Northwest China (30°N–45°N, 75°E–110°E) during 9–12 April 2020.
DaytimeNighttime
CTLDoubleDustHalfDustCTLDoubleDustHalfDust
DSRT(°C)–0.035–0.059–0.0210.1000.1640.060
Q(W/m2)–2.95–4.86–1.754.076.642.42
DART(°C)–0.0065–0.008–0.0050.00620.0220.001
Q(W/m2)–0.35–0.67–0.180.460.830.24
NorthwestChinaT(°C)–0.023–0.035–0.0150.0930.1540.056
Q(W/m2)–2.17–3.49–1.293.285.331.96
Publisher’s Note: MDPI stays neutral with regard to jurisdictional claims in published maps and institutional affiliations.

