Article

Assessing the Accuracy of MODIS MCD64A1 C6 and FireCCI51 Burned Area Products in Mediterranean Ecosystems

Laboratory of Forest Management and Remote Sensing, School of Forestry and Natural Environment, Aristotle University of Thessaloniki, P.O. Box 248, 54124 Thessaloniki, Greece
*
Author to whom correspondence should be addressed.
Remote Sens. 2022, 14(3), 602; https://doi.org/10.3390/rs14030602
Submission received: 23 December 2021 / Revised: 18 January 2022 / Accepted: 25 January 2022 / Published: 27 January 2022
(This article belongs to the Special Issue Inauguration of Earth Observation for Emergency Management Section)

Abstract

:
The catastrophic impact of wildfires on the economy and ecosystems of Mediterranean countries in recent years, along with insufficient policies that favor disproportionally high funding for fire suppression, demand a more comprehensive understanding of fire regimes. Satellite remote sensing products support the generation of relevant burned-area (BA) information, since they provide the means for the systematic monitoring of large areas worldwide at low cost. This research study assesses the accuracy of the two publicly available MODIS BA products, MCD64A1 C6 and FireCCI51, at a national scale in a Mediterranean country. The research period covered four fire seasons, and a comparison was conducted against a higher-resolution Sentinel-2 dataset. The specific objectives were to assess their performance in detecting fire events occurring primarily in forest and semi-natural lands and to investigate their spatial and temporal uncertainties. Monthly fire observations were processed and analyzed to derive a comprehensive set of accuracy metrics. We found that fire size has an impact on their detection accuracy, with higher detection occurring in fires larger than 100 ha. Detection of smaller (<100 ha) fires was favored by the 250 m FireCCI51 product, but not from MCD64A1 C6, which exhibited less than 50% detection probability in the same range. Their spatial estimates of burned area exhibited a fairly satisfactory agreement with the reference data, reaching an average of 78% in detection rate. MCD64A1 C6 exhibited a more consistent spatial performance overall and better temporal accuracy, whereas FireCCI51 did not substantially outperform the former despite its finer resolution. Additional research is required for a more rigorous assessment of the variability of these burned area products, yet this research provides further insight and has implications for their use in fire-related applications at the local to the national scale.

Graphical Abstract

1. Introduction

Wildfires constitute a complex worldwide phenomenon, burning annually an area approximately equivalent to the size of Europe [1]. Despite being a natural disturbance process in many ecosystems, at the same time they pose imminent and unpredictable threats to human lives and properties, especially in certain regions. Cases of such highly destructive wildfires include those during the summer of 2018 in Australia and North America [2], the deadly fire in a wildland–urban interface area near Athens in Greece during the same summer, which resulted in the loss of a hundred people [3], and the recent extreme fires in Greece again that swept across vast areas of forests and built-up zones. Due to the unpredictable climatic variations that affect weather-driven hazards, such as drought periods and heat waves, the occurrence and severity of wildfires are projected to change even more over the coming years [4]. Of course, we cannot neglect the human-related causes of ignitions (e.g., arsons) or human interventions in the landscape that have severely altered fire regimes over the last decades, in regions such as the Mediterranean [5] or the Amazon [6].
Detailed and consistent information on burned areas at various spatial scales is therefore of great importance for fire managers, agencies and countries in order to quantify the ecological and economic impacts of fires, to provide reliable statistics, to identify agents that control fire activity and to implement effective pre-fire plans and mitigation measures [7]. Furthermore, long-term records on burned areas are essential for the scientific community and climate modelers for validating dynamic global vegetation and emission models [8,9].
Satellite remote sensing has significantly supported the generation of burned area (BA) information during the past decades, since it provides the means for the systematic monitoring of large areas worldwide at low cost [8]. Polar-orbiting sensors such as MODIS (Moderate Resolution Imaging Spectroradiometer), VIIRS (Visible Infrared Imaging Radiometer suite) and MERIS (Medium Resolution Imaging Spectrometer) have been traditionally utilized for monitoring fire activity [10,11,12] at the regional to the global scale. At the cost of medium to low nominal resolution (250–1000 m), these sensors provide the advantage of daily or near-daily imagery acquisitions that can be used for operational activities including early detection, fire suppression and direct impact assessment [12]. Global BA products provide the essential pixel-level information that can be further processed to provide the size and distribution of single fire events over space and time [10,13]. Though finer resolution BA assessments from Landsat or Sentinel-2 satellites are now becoming available [14,15], yet these cannot compete with the systematic and long-term coverage provided by the former systems.
Several global BA products have been developed in the past two decades, with MODIS-derived ones being the predominant source for monitoring fire activity worldwide. The latest publicly available versions include the MCD64A1 Collection 6 at 500 m [1] and the ESA FireCCI51 product at 250 m [16], which cover the longest period among BA products, from 2000 onwards. Other BA products that have been released are the SPOT-Vegetation (1 km) and PROBA-V (333 m) Copernicus BA [17], GLOBCARBON (1 km) [18], the MERIS FireCCI41 (300 m) [19], or the GFED (Global Fire Emissions Database) (0.5°) [20]. Besides the inherent spatial resolution bias, the reliability of these products is affected by the quality of input data, the specific algorithms used for surface reflectance correction and processing, and other factors such as clouds, land cover type or fire persistence [21].
The detection and mapping capabilities of the implemented algorithms in the global BA products have improved over the years; however, there are still uncertainties in the global estimates of the area burned. For example, the actual burned area has been underestimated by global products compared with regional ones [22,23], although MODIS-derived products present a relatively good alternative for national reporting in North America or Russia [2]. Other studies have reported significant variations in spatial estimates and fire detections among different BA products [24,25], which are emphasized at smaller spatial scales and fire sizes smaller than 100 ha [14]. Therefore, accuracy evaluation or validation of these satellite products is necessary to determine their usefulness.
A standard procedure for validation of global BA products is their comparison with independent reference datasets generated from higher-resolution sensors [26,27]. This can be achieved by applying statistical methods of stratified spatial and temporal sampling, resulting in a qualitative evaluation over different biomes and conditions [28]. Nonetheless, the major limitation in regional or global validation studies is the unavailability or limited existence of low-error reference data. Instead, the relative performance of satellite BA products can be assessed by means of intercomparison [24]. MODIS-derived BA products have been utilized in several studies across different regions and ecosystems in recent years, with their spatial and temporal accuracy being thoroughly assessed. These studies focus on typical (tropical forests, savannas, grasslands) [6,25,29,30] or less fire-prone (boreal forests or tundra) ecosystems [31] with the time period of investigation commonly spanning, with few exceptions, few seasons as a result of the limited availability of higher-resolution reference datasets, especially when extensive spatial scales are considered.
In this work we conducted validation of the two publicly available MODIS BA products, MCD64A1 C6 and FireCCI51 for the country of Greece. Our research was based on a comparison of these products against higher-resolution Sentinel-2 reference data, spanning a period of four consecutive fire seasons from 2016 to 2019. More specifically, we evaluated the detection accuracy of the MODIS products, and then evaluated their spatial estimates of burned area and temporal uncertainties. The analysis was conducted at the fire-patch scale in typical Mediterranean ecosystems and across different fire sizes, excluding agricultural fires. Although MODIS BA datasets have been utilized in validation studies for five Mediterranean countries over multiple years, the comparisons are conducted mostly against national field-based reports of burned areas [2,32,33]. To the best of our knowledge, validation of the most recent MODIS BA products at the national level in the Mediterranean is quite limited. Following our recent preliminary study [34], this research could provide additional insight into the spatial–temporal scale at which these products can be reliable to end users for various applications, such as deriving individual fire events, compiling reports and analyzing fire regimes at the local to the national scale.

2. Study Area

Greece is one of the five large countries of the European Mediterranean region, with a total area of approximately 132,000 km2 (Figure 1). The climate of the country is typically Mediterranean, with mild, rainy winters and hot, dry summers. The primary vegetation classes range from forests to (transitional) woodlands, shrublands and grasslands. The typical Mediterranean vegetation types that can be found are shrubs of evergreen/hardwood broadleaves, sclerophylous oak shrubs, pine forests (P. Halepensis and P. Brutia) and the most drought-resistant phryganic ecosystems.
Fires constitute one of the major disturbances of Greek forests and wildland areas, with most fires being induced directly or indirectly by human activity and occurring in altitudes of less than a thousand meters. More than 50% occur in evergreen broadleaf shrubs, 15% in pine forests (P. Halepensis and P. Brutia), only 6% in deciduous oak forests, 11% in grasslands, and 4% in agricultural lands [35]. The abundance of WUI (wildland–urban interface) zones, the abandonment of rural activities in forest land leading to the increase of fuel load, insufficient forest and fire management practices, and climate conditions are among the principal agents that further contribute to increasing fire risk and more intense wildfires in the region [36,37]. In the previous decade the number of fires in Greece decreased compared to the 2000s [38]; however, the total burned area exhibits notable differences annually (Figure 2). It is worth observing how the annual burned area increases in years with fewer fire events, particularly in the period from 2017 to 2020.

3. Datasets

3.1. Burned-Area Products

The two global BA products that were selected for this research are the publicly available MCD64A1 Collection 6 [1] and the ESA FireCCI51 [16]. Both are based on the integration of surface reflectance measurements and standard products generated by the MODIS sensors onboard the Terra and Aqua satellite platforms. The latest versions of these broadly used products cover a common period from 2001 to 2019, thus facilitating validation and comparison studies at the continental to the global scale. The MCD64A1 (C6) hybrid algorithm combines MODIS Terra and Aqua daily surface reflectance (MOD09GHK/MYD09GHK) products at 500 m with MODIS active fire data (MOD14A1 and MYD14A1, respectively) at 1 km in order to detect and map daily fires at 500 m. The algorithm exploits the spectral information from red (0.65 μm) and infrared (1.24 μm and 2.13 μm) reflectance bands to estimate a burn-sensitive vegetation index and then apply a dynamic threshold on the time series of composite imagery to detect candidate burned pixels [1]. The C6 is an improvement on the previous MCD64A1 C5.1 and MCD45A1 [39] versions, since it detects more burned area in total, has increased sensitivity in detecting smaller fires, and reduces the temporal uncertainty in the estimation of the date of the burn [24,26]. This product has been also utilized for generating additional fire global datasets [40] and the Global Fire Atlas [10].
The FireCCI51 product was developed to complement existing BA products by providing higher spatial resolution at 250 m. It is funded under the ESA’s Climate Change Initiative program and is an improvement on the previous versions FireCCI50 [41] and FireCCI41 [42]. The product algorithm integrates daily Terra MODIS red (R) and near-infrared (NIR) reflectance measurements (MOD09GQ) and MODIS monthly active fire data (MCD14ML) to identify and map burned areas. This two-phase algorithm initially identifies candidate seed pixels (burned) and then applies a region-growing algorithm within a ten-day window post-fire. Details regarding the algorithm structure and its latest improvements can be found in the publication by Lizundia-Loiola et al. [16]. FireCCI51 exhibits similar errors to those of the previous version, although it presented lower errors of omission and commission than MCD64A1 and improved detection capability of smaller fires in a validation study in sub-Saharan Africa [16].

3.2. Validation Dataset
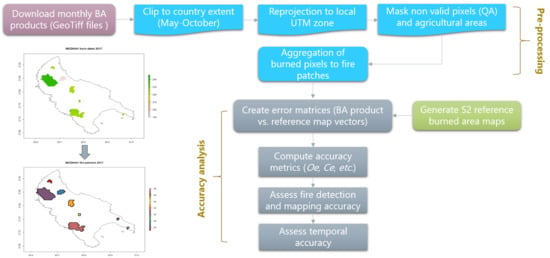
The validation dataset consists of higher-resolution fire perimeters derived by Sentinel-2 images for the years 2016 to 2019 (Figure 1). Part of this dataset was initially generated in the framework of the Greek National Observatory of Forest Fires (NOFFi) and its Object-based burned area mapping (OBAM) service [43]. The NOFFi-OBAM is an on-demand service that has been operating from 2016 to the present, and is activated upon request by local forest offices after fire events usually larger than 100 ha, though wildfires of smaller sizes have also been mapped in specific cases [44]. Because NOFFi-OBAM is an on-demand service, we performed a cross-check of the existing reference dataset, comprising 140 fire events, with the Greek Fire Service official statistics. We discovered that a number of small and larger fires throughout the years had not been mapped. Therefore, we had to conduct a classification of approximately 50 more fires, following the general methodology implemented by NOFFi, in order to complement the validation reference set for the needs of this research.
The burned area classification method is fully automated and follows a supervised learning approach in which two Sentinel-2 images, pre- and post-fire, are utilized for labelling automatically a set of training patterns via empirical rules. Then, an initial pixel-based classification is applied using this training set by means of a support vector machine (SVM) classifier. The latter is subsequently smoothed following a multiple spectral-spatial classification (MSSC) approach, which increases the mapping accuracy of the final burned-area delineation [45]. The generation of the reference dataset followed the general criteria defined by the Global Burned Area Satellite Product Validation Protocol [27], which refer to the temporal window for the selection of the high-resolution images, the selection of cloud-free images or images with less than 10% cloud coverage and the thematic consistency of the final reference maps.

4. Methods

4.1. Generation of Low-Resolution Fire Database

The first part of the methodology included the acquisition of the two BA datasets for the time period of this study and its subsequent processing to derive individual fire events for the whole of Greece. While in several studies the analysis and comparison of BA information are performed at the pixel level, we opted for an approach that would consider comparison at the fire-patch level between the low- and high-resolution datasets.
The monthly 500 m MCD64A1 C6 dataset was downloaded as GeoTiff images for the years 2016 to 2019, via the Application for Extracting and Exploring Analysis Ready Samples (AppEEARS) service (https://lpdaacsvc.cr.usgs.gov/appeears/, accessed on 1 October 2020) [46]. The product includes layers of burn date (Julian days), burn date uncertainty, first and last day of detection, plus QA information. The images were reprojected in the local UTM zone and masked to the country’s exact extent. We selected all pixels flagged as land and having valid data according to the QA layer for every year, but only for the months from May to October (Julian days 92 to 305), which correspond to the official fire season in Greece. The vast majority of forest and wildland fires occur within this period. Likewise, the 250 m FireCCI51 dataset was acquired as monthly GeoTiff images via the official portal (https://geogra.uah.es/fire_cci/firecci51.php, accessed on 1 October 2020) [47] for the same time period. The product files contain per-pixel information on the Julian date of burn, confidence level and the land cover of the pixel labelled as burned. The same basic reprojection and masking processes were implemented for these time series.
Our research focused on the basic Mediterranean land cover types affected by fires and did not include regular seasonal burns due to farming practices or following harvests that, for example, occur in large agricultural areas of the country. Furthermore, MODIS-derived assessments over burned croplands have been reported as quite inaccurate due to their size and spatiotemporal heterogeneity [48]. Therefore, BA pixels located over agricultural land, according to the annual MODIS (MCD12Q1) Land Cover Type (https://lpdaac.usgs.gov/products/mcd12q1v006/, accessed on 20 October 2020) product [49], were also excluded.
The final processing step of the BA time series was to perform a spatial and temporal aggregation of the pixels to generate annual databases consisting of single fire events. Based on the location and date of burn information of each pixel, a pixel clumping process was followed based on: (i) spatial adjacency containing neighboring diagonal pixels (eight possible neighbors) or with a maximum distance of one pixel, and (ii) temporal difference of the spatially adjacent pixels that did not exceed 16 days. This “cut-off” or temporal distance value is related to the temporal uncertainty of the BA products and may affect the size and number of the resulting fire patches, particularly when larger values are selected to minimize uncertainty [21,29]. We opted for the 16-day maximum sequential day after performing several tests that ensured the consistency of the fire patches for the study area.

4.2. Assessment of Spatial and Temporal Accuracy of BA Products

The validation methods for global BA products commonly rely on cross tabulation comparisons between the product and a sample of independent reference data, resulting in the generation of error matrices at the pixel level. Based on these matrices, several standard accuracy metrics are estimated: omission and commission errors, the relative bias of maps or the dice coefficient (DC) [26,41,50]. If the sampling design of the validation includes multiple locations over extended time periods and intercomparison is considered as well, then the product is also assessed for its quality [26]. Another approach is the comparison by means of regression between the proportion of the burned area reported by the product and the proportion reported by the reference maps, within a specified coarse-resolution grid cell. The latter is applied to compensate for mixed pixels in the low- or coarse-resolution maps and thus for the low-resolution bias introduced [1,27]. Several variations of the aforementioned methods have been utilized in relevant studies; in any case, the validation strategy should be related to the potential use of the product by the end users.
In this work our initial intention was to assess the fire detection capability of the MODIS BA products for Greece over the four fire seasons. Hence, we compared the number and location of fire events derived by these against the reference fires derived by Sentinel-2 imagery. In this perspective, complete or partial intersections of fire polygons between MODIS and reference maps counted as true detections. Errors of omission (OE) and commission (CE) were calculated from the standard error matrix for the fire counts, without accounting for true negative (correctly detected non-fire polygons) data. In addition, the dice coefficient (DC) [50,51] was calculated, which is a balanced measure that summarizes OE and CE of a given class and considers these equally important. A high DC value means that there is a higher probability that the product will identify as burned the same pixel or area identified as burned by the reference dataset. The equations for calculating these metrics are as follows:
OE = 1 − Mtr/S2
CE = 1 − Mtr/Mtotal
DC = 2 * Mtr/(S2 + Mtotal)
where Mtr is the number of correct fire detections by MODIS BA products, S2 is the Sentinel-2 reference fires and Mtotal is the total number of fires mapped by MODIS BA products.
The next step in our analysis was to assess the spatial accuracy of the BA products at the fire-patch level. Initially we compared the total areas mapped on an annual basis by the two products in their original resolution against the Sentinel-2 reference areas. Secondly, a cross tabulation was performed by overlaying the resampled product and reference maps in order to estimate errors on burned area estimates. Consequently, the proportion of the area per fire patch not mapped by the product was characterized as omission error, whereas the related proportion of the fire patch erroneously mapped was characterized as commission error. In this case we did not include contributions to CE of burned areas from fires that did not overlap with any reference polygon. These correspond to “pure commissions”, which obviously can have an impact on overall accuracy and CE, as mentioned by Campagnolo et al. [29]. Equations (1)–(3) were likewise utilized, but here the error matrix elements included burned area measurements instead of fire counts. Accordingly, S2 refers to the corresponding area mapped by the reference data, Mtotal refers to the area mapped by the resampled 20 m MODIS products to match the Sentinel-2 resolution, and Mtr is the intersection of the resampled MODIS and Sentinel-2 burned area.
The spatial agreement between the product and reference maps was further evaluated by estimating the proportion of the reference burned areas that was correctly mapped by the MODIS products. This metric can be useful for determining the detection rate (DR) of the products while accounting for the difference among the resolutions of the datasets involved [31,52]. The DR corresponds to the actual MODIS area burned divided by the reference (Sentinel-2) area. Due to the much higher resolution of the Sentinel-2 reference maps, very small fires <10 ha (approximately half a 500 m MODIS pixel) were sieved, and the metrics were estimated for two different fire size groups: (i) all fires > 10 ha (includes smaller and larger fires), and (ii) fires > 100 ha (includes larger fires). This size group consideration is justified since the average size of fires in Greece is approximately less than 40 ha [38], except for the years with extreme events.
We assessed the temporal accuracy of the two MODIS BA products in terms of the reported start date of all correctly detected fires. In the MODIS-derived databases, for each identified fire the burn dates (Julian days or DOY) were summarized and descriptive statistics (min, max, mean, etc.) were calculated. Then, the absolute difference between the minimum burn date (DOY) of each individual fire and the start date reported by the corresponding Sentinel-2 reference perimeter was calculated. The date information in the reference data was utilized due to its high reporting accuracy, after being additionally cross-checked with the Greek Fire Service’s official fire statistics. This comparison was performed for all spatially overlapping fires.

5. Results and Discussion
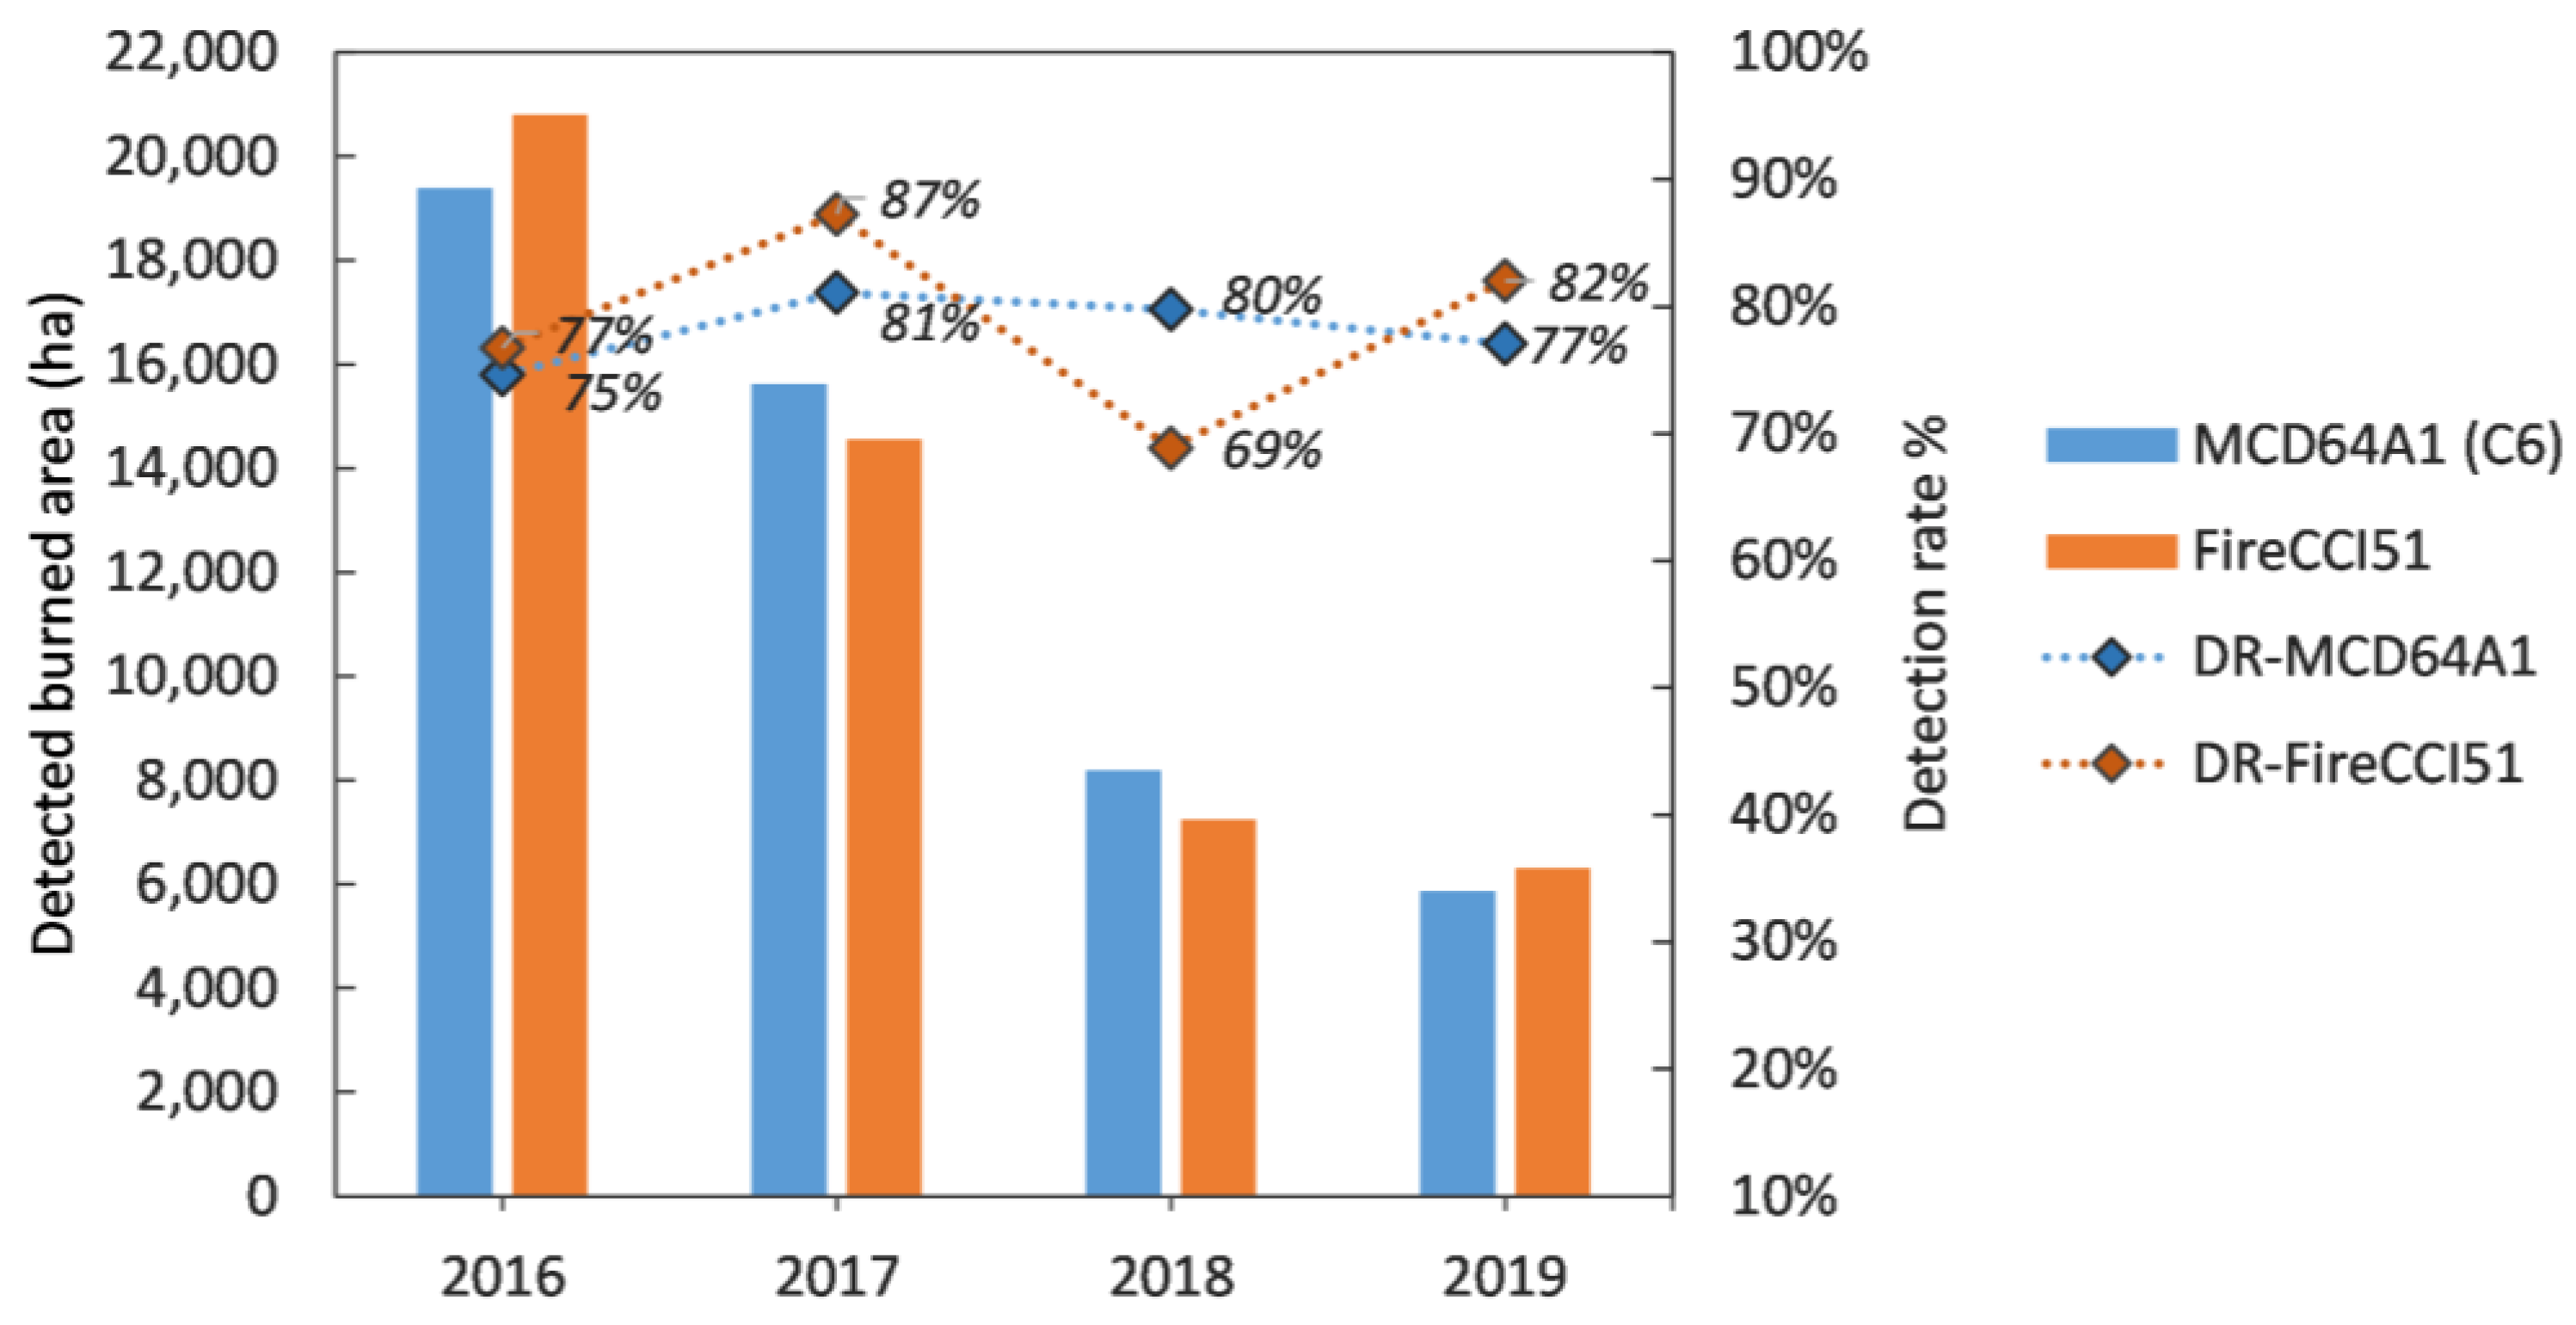
5.1. Fire Detection

The first part of our assessment focused on the detection capability of the two BA products by considering the number and location of fires occurring mainly in non-agricultural vegetated land. The aggregated accuracy measures from all years show that both products achieved similar mediocre dice coefficient (DC) scores for fire sizes > 10 ha (Table 1). MCD64A1 C6 had higher omission (OE = 0.52) but less commission error (CE = 0.19) than FireCCI51 (OE = 0.36, CE = 0.40), respectively. MCD64A1 C6 is consistently “missing” smaller fires of less than 100 ha, with an error ranging from 50 to 54% for all years. A distinguishable difference is visible for 2016, when FireCCI51 displayed quite good performance in detecting fires with size smaller than 100 ha (OE = 0.15). According to the reference data, a total of 48 fires were mapped in 2016, with the 21 classified as smaller ranging from 25 to 97 ha. While FireCCI51 detected 18 out of the 21 small fires, the MCD64A1 detected only 1. In the 2017 fire season, more than 55% (47) of the fires were classified as small by the reference map, with 14 being smaller than 25 ha. As a result, MCD64A1 detected only 8 (OE = 0.51) and FireCCI51 detected 17 (OE = 0.46) out of the 47 events less than 100 ha. The 250 m FireCCI product demonstrates better detection of smaller fires for all seasons when considering the whole dataset (>10 ha), but at the same time it has more false detections (commissions) every year than MCD64A1 C6.
The detection capability of the two products increased substantially when fires <100 ha, according to the reference dataset, were excluded. In fact, MCD64A1 C6 benefitted the most, since it achieved a noteworthy reduction in OE by 70% (0.16 from 0.52) overall. Likewise, FireCCI51 displayed a significant reduction in OE (0.22 from 0.36), although it performed better than MCD64A1 only for the 2018 season (OE: 0.19 vs. 0.31). This indicates that the SWIR spectral information is still important in detecting larger fires.

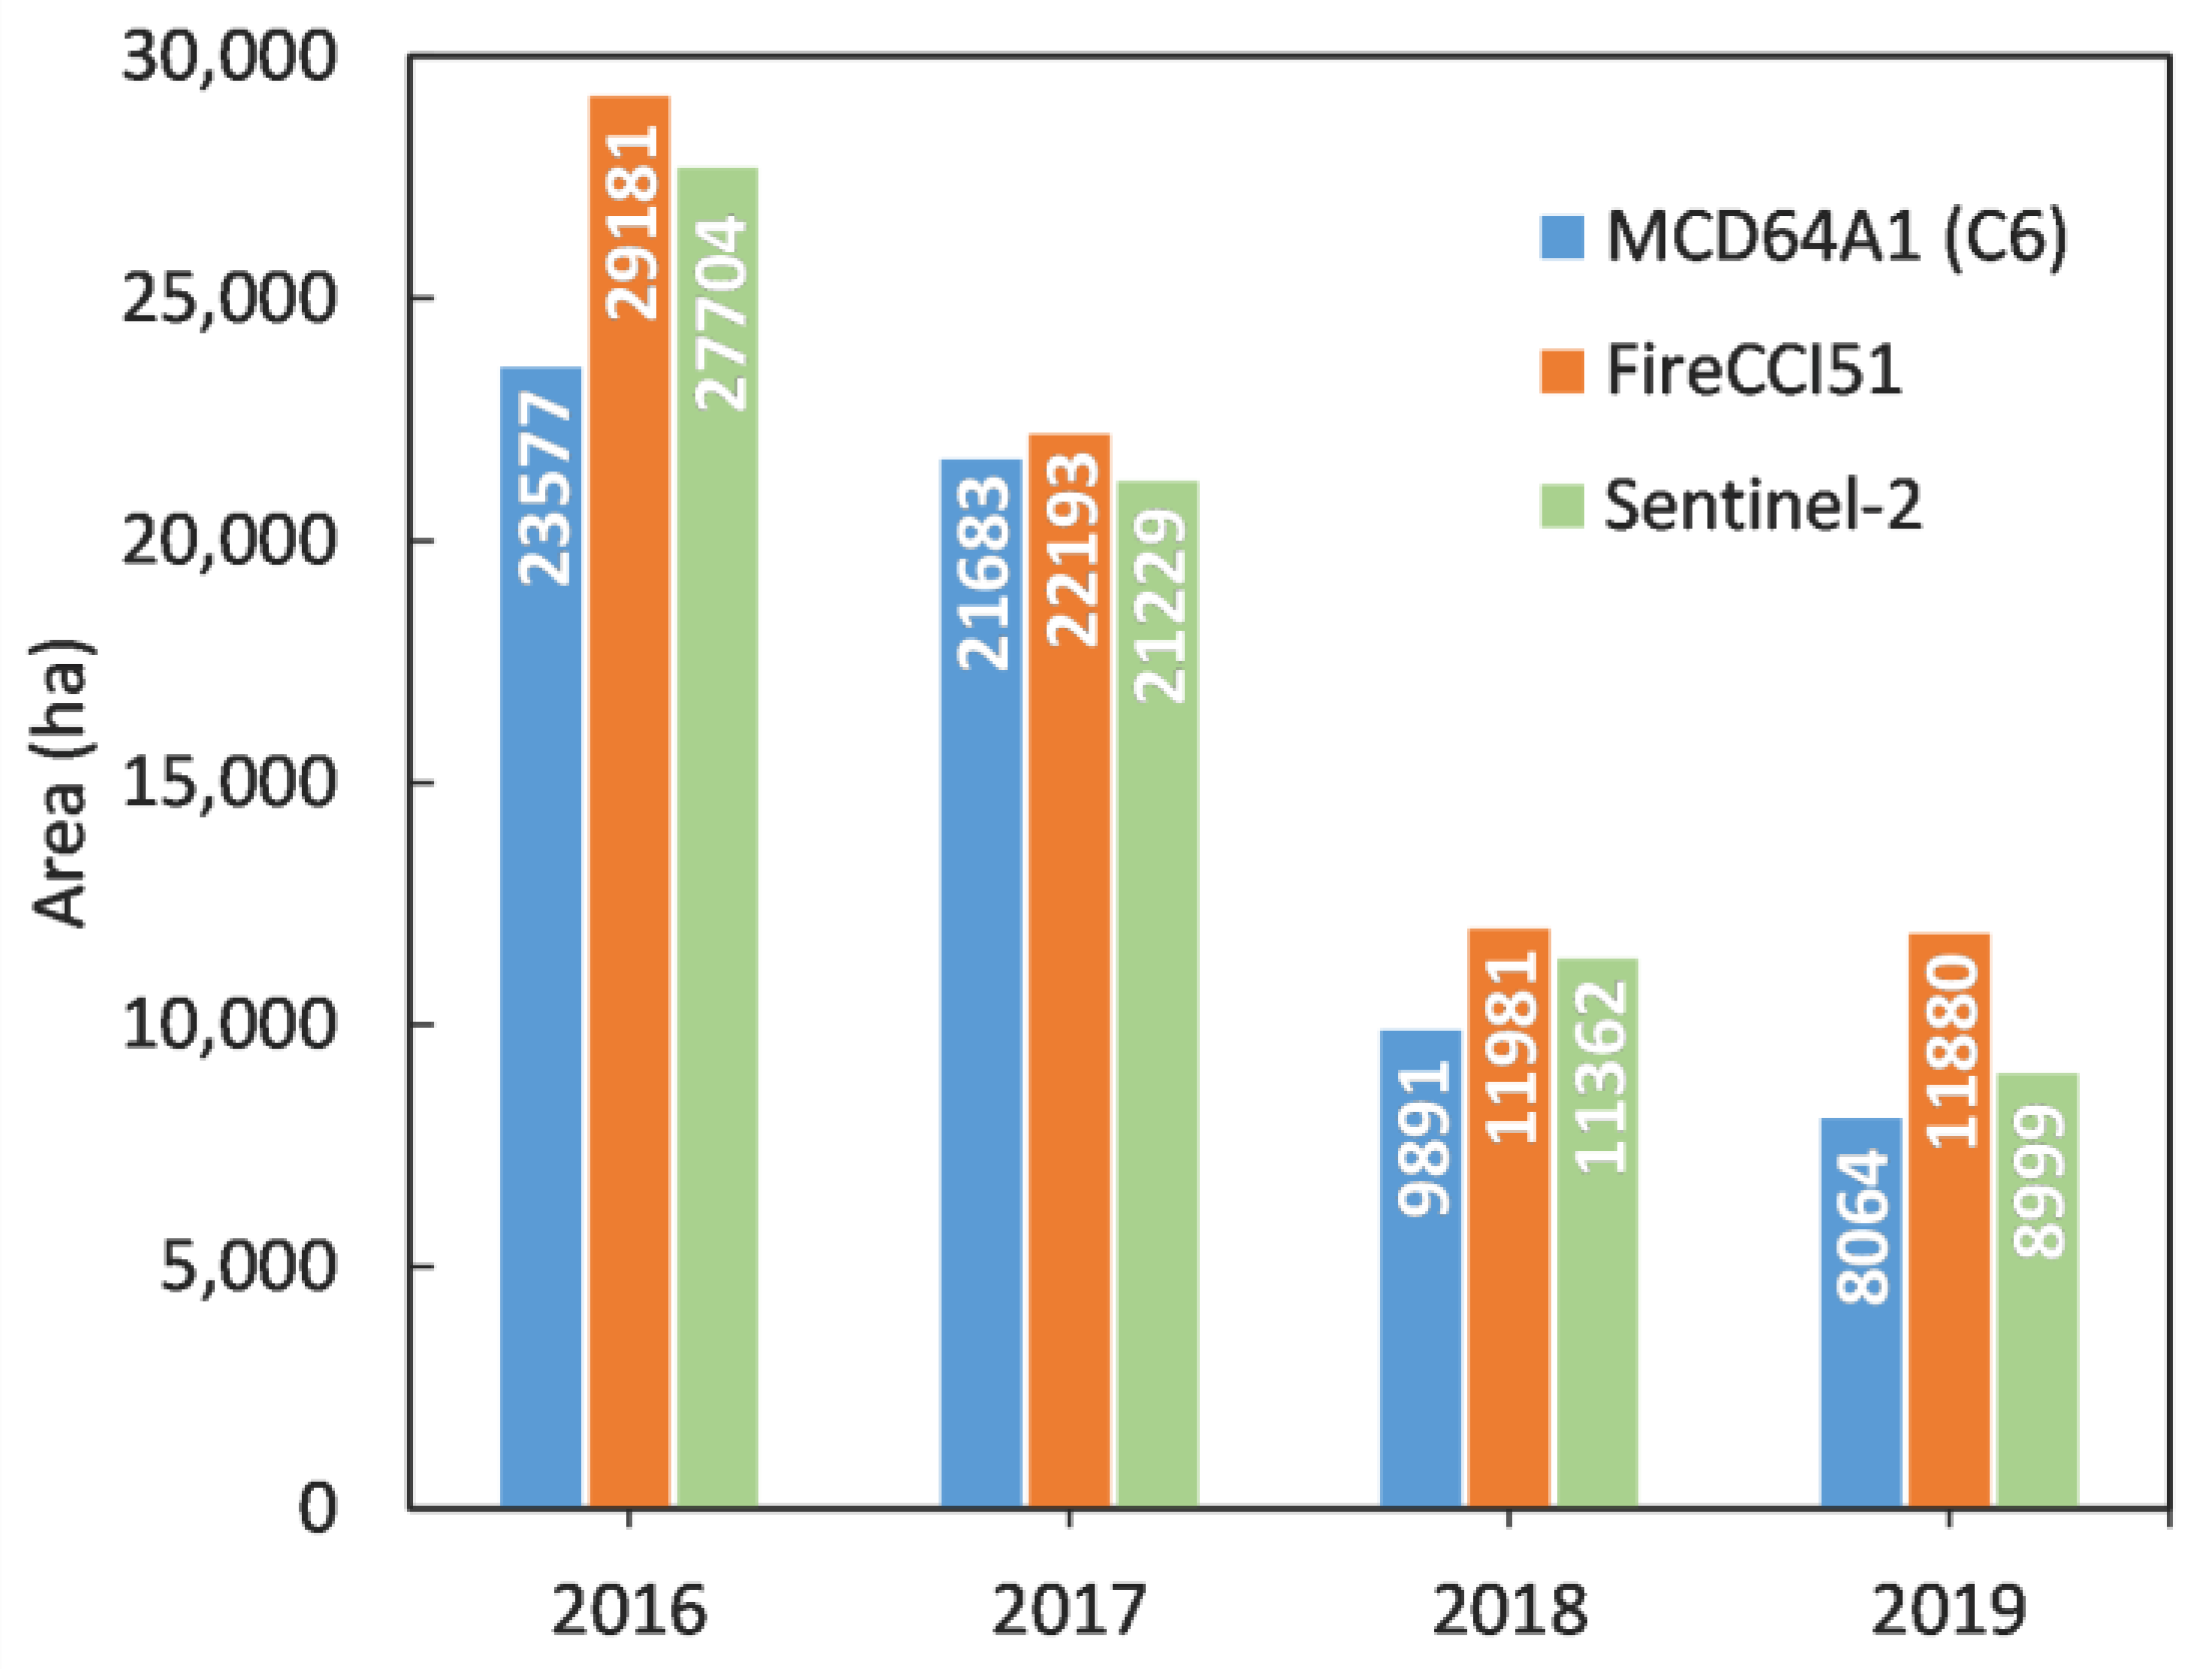
5.2. Spatial Accuracy

The burned area mapped by the two MODIS BA products per fire season is displayed in Figure 3. These numbers correspond to the total reported area and not only to the spatially coincident fires between each product and the Sentinel-2 reference map. FireCCI51 reports the largest area for every year compared to MCD64A1 C6 but also to the Sentinel-2 reference BA. More specifically, FireCCI51 reports from approximately 5% (2016, 2017, 2018) to 30% (2019) more area than Sentinel-2. Larger differences between the products are estimated for 2016 and 2019, with FireCCI51 mapping 20% and 33% more area, respectively. The total area for all years reveals that MCD64A1 underestimates (63,214 ha) and FireCCI51 overestimates (75,233 ha) the actual burned area (69,300 ha), by almost the same percentage (8%). While concrete conclusions cannot be drawn from these 4 years of examination, the products’ estimates seem to follow the general trend of the reported actual burned area.
The spatial accuracy of the two products in terms of burned area mapped was assessed at the fire-patch level by conducting comparisons only for spatially coincident fires with the reference perimeters. At a first glance, the aggregated DC values display similar yet satisfactory performance for the two products, considering both size groups (Table 2). Annual differences in DC values between them are marginal, except for 2018, when MCD64A1 C6 outperformed FireCCI51 by 11% (0.82 vs. 0.73). In general, the BA products exhibit a fairly consistent performance over the four seasons. Examining the OE, CE errors at fire sizes >10 ha show that FireCCI51 has lower omission rates, except for 2018 (0.31 vs. 0.20), which compensates for its constantly higher commission rates than MCD64A1. For fire sizes larger than 100 ha, we notice that accuracy rates are similar or improving mostly by a slight percentage. Larger reductions are observed in the CE of FireCCI51, ranging from approximately 14% (0.26 from 0.30, 2017) to 20% (0.20 from 0.25, 2016; 0.22 from 0.27, 2019). The slight differences in overall accuracy and metrics can be attributed to the fact that more than 90% (65,100 ha) of the total burned area mapped by the reference data corresponds to fire sizes larger than 100 ha.
The detection rates vary from year to year, ranging from 75 to 81% for MCD64A1 and 69 to 82% for FireCCI51 (Figure 4). The latter exhibits better results than MCD64A1 for all years except 2018, when MCD64A1 outperforms the ESA product (80% vs. 69%). The total detection rate over these 4 years is 77.7% (49,089 out of 63,146 ha) and 78.9% (48,933 out of 62,019) for MCD64A1 C6 and FireCCI51, respectively, which indicates similar performance overall. The above results are presented for all fires >10 ha, since changes in DR scores were insignificant when smaller fires (accounting for less than 7% of the total reference BA) were excluded.

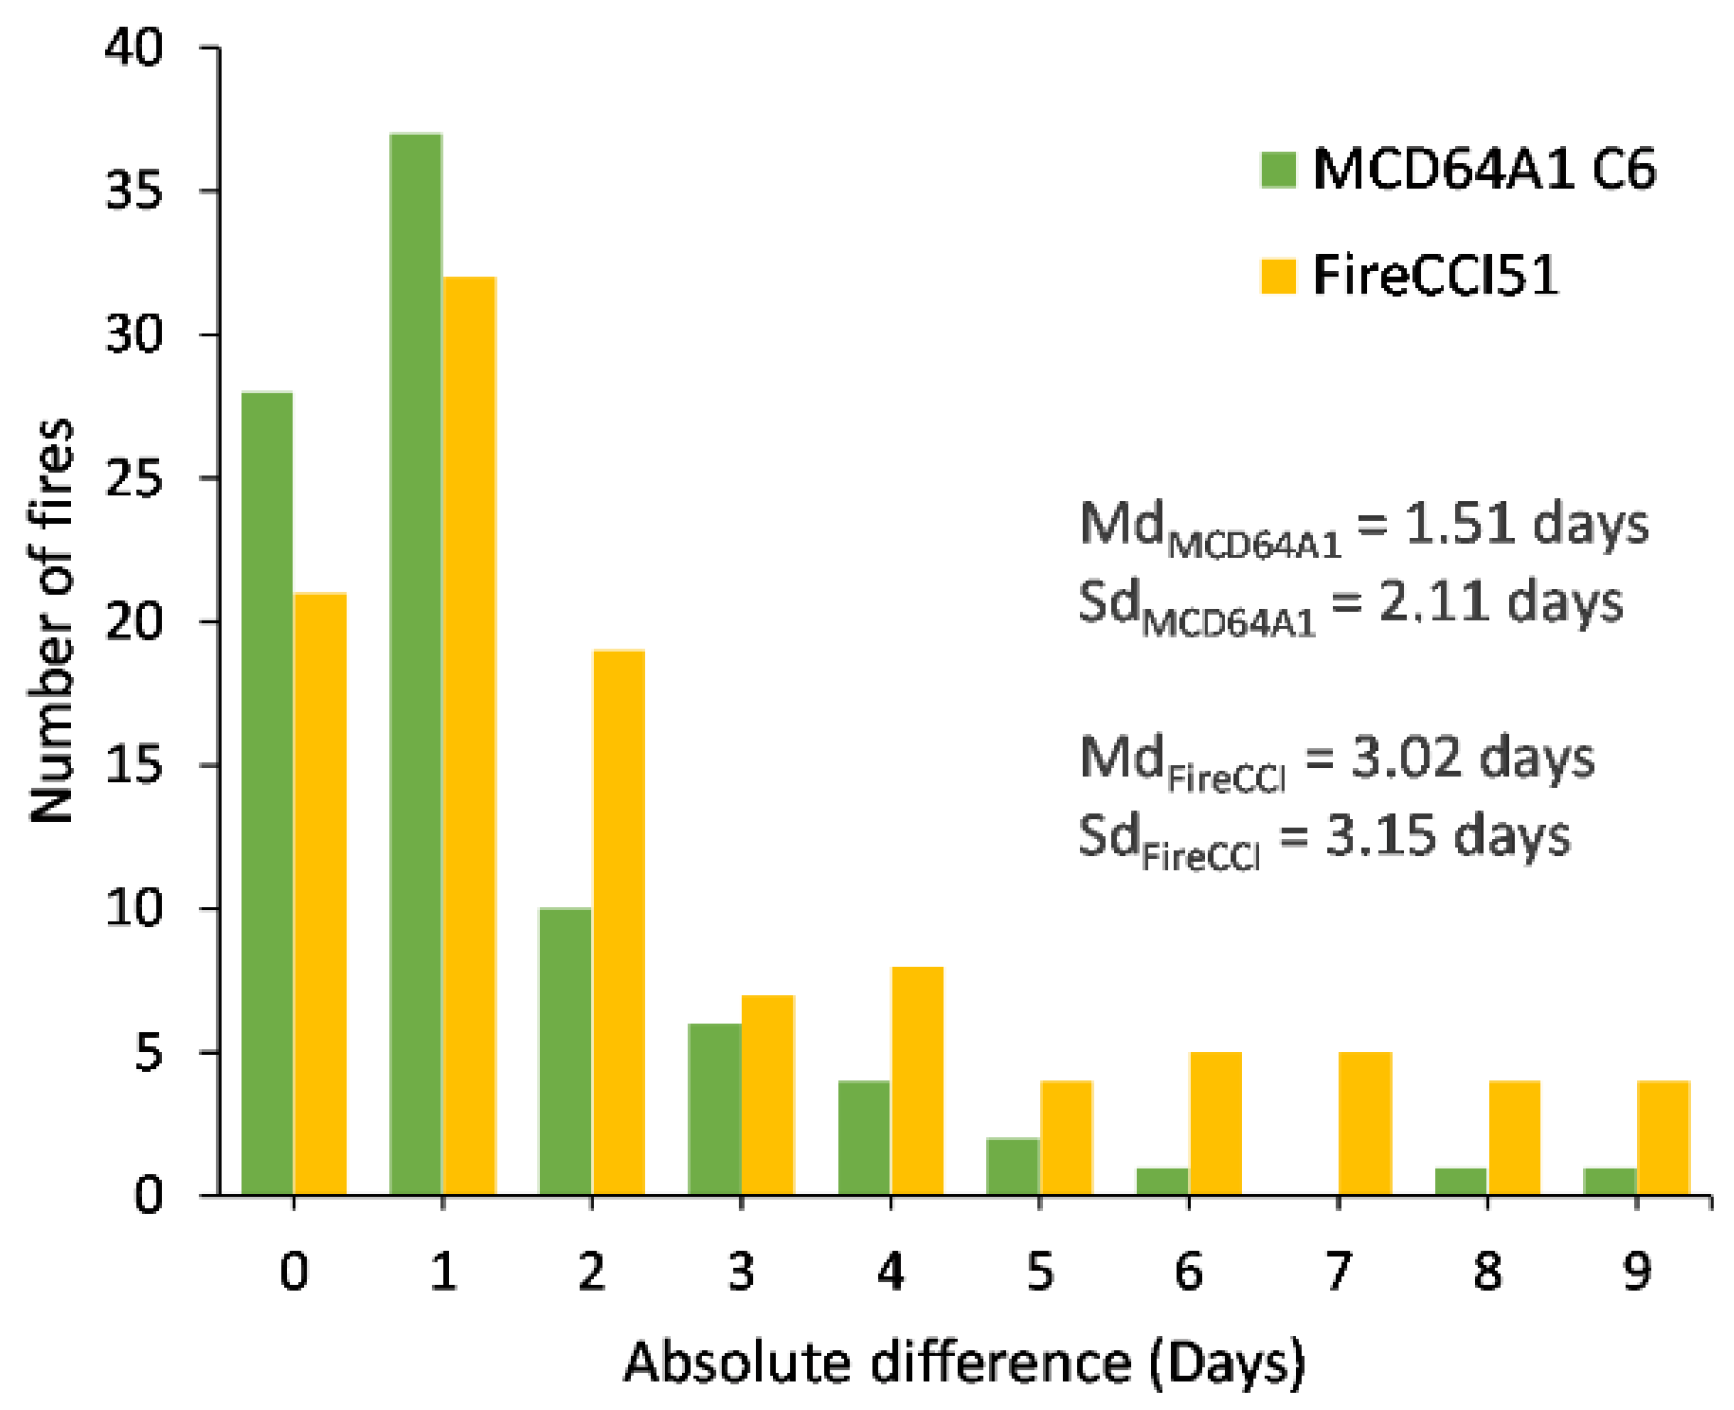
5.3. Temporal Accuracy

Examination of the temporal uncertainties of global BA products is commonly accomplished by comparing the time difference between the pixel labeled as burned by the product and the spatially overlapping active fire data by MODIS or VIIRS products [53]. In our study we estimated differences in reported start dates between the MODIS and the Sentinel-2 databases at the fire-patch level. We found that 31% of the total fires (28 out of 91) detected by MCD64A1 C6 occurred on the same day as the reference fires, 82% within two days, and 90% within 3 days, with a mean absolute difference of 1.5 days (Figure 5). For FireCCI51, 18% of the total fires (21 out of 118) occurred on the same day, 62% occurred within two days and 90% within 8 days, with a mean absolute difference of 3 days. Our findings corroborate previous reports regarding the higher temporal accuracy of MCD64A1 C6 [1] and the lower precision of FireCCI51 in burn date estimation [16].

5.4. Overall Product Performance

The two BA products were assessed for their accuracy in fire detection and mapping over four fire seasons in Greece and for their temporal precision. While we did not completely account for sub-pixel accuracy in our research, nevertheless we conducted our analysis by taking into account the effect of different fire sizes in both detection and mapping capabilities of the low-resolution products. To this end, two types of error matrices were generated, namely, one with its elements containing single fire detections and the other including burned area measurements.
In terms of fire detection, the individual performance of MCD64A1 (Collection 6) and FireCCI51 appears to be year- and size-dependent, as reported in similar research [29,52,54]. When only fires larger than 100 ha are included in the comparison with the reference data, their performance can be considered quite satisfactory. Despite its lower resolution than the 250 m product, MCD64A1 C6 displays higher detection accuracy than FireCCI51, with the exception of one fire season (2018). This indicates that the integration of richer spectral information in the algorithm results in more reliable detection of fire scars larger than 100 ha [41].
When smaller fires, between 10 and 100 ha, are included in the assessment, the accuracies fluctuate annually for each product. Here, FireCCI51 outperformed MCD64A1 only for 2016 (DC: 0.73 vs. 0.62) while demonstrating a larger range of DC values, from 0.58 to 0.73. The higher resolution of FireCCI51 contributes to an increased sensitivity in the detection of small fires [16,41]; however, the lower omission rates come at the cost of higher commission rates. For MCD64A1 C6, levels of omission errors were substantially higher than those of commission errors [26]. Moreover, the number of fires with sizes less than 100 ha, especially those less than 50 ha, appears to greatly affect detection capability, as in the fire season of 2017. Here, it should be mentioned that part of the false detections can be attributed to errors introduced by the MODIS agricultural mask used to remove fires over croplands [48,54]. Consequently, residual detections of rather small size (3 to 5 pixels) were considered commissions and affected mainly the FireCCI51 product performance.
Regarding the burned area’s agreement with the reference dataset at the fire-patch level, both algorithms exhibit in general a comparable and consistent performance, judging by the aggregated dice coefficient and detection rate scores over the four years of study. The consideration of different fire size groups does not have a pronounced impact on the accuracy metrics due to the largest proportion (>90%) of the actual burned area belonging to fires larger than 100 ha. Nevertheless, slight-to-moderate improvements are observed for both products when the smaller size group is excluded. The 250 m FireCCI51 product detects more actual burned area (lower OE) regardless of size and displays higher commission than MCD64A1 at smaller fire sizes for all years. At fires larger than 100 ha, FireCCI51 achieves larger reductions in commission errors than MCD64A1; however, its performance cannot be considered outstanding since it presents higher DC values only for the years 2017 and 2019. This indicates that the finer 250 m resolution does not provide distinct benefits over spectral information when mapping larger fires.
We provide a few indicative examples of the performance of the two relevant algorithms implemented in the BA products of our research. These were selected in order to highlight certain points and weaknesses already mentioned in the discussion. What is quite noticeable in these examples (Figure 6) is the implementation of the region-growing algorithm of FireCCI51. More specifically, while it appears to correctly detect small fires about 40–50 ha that are not detected by MCD64A1 C6, on the other hand the delineation of two of these areas is quite inaccurate, resulting in large commission errors (upper and lower right panel). The mapped areas were found to be around 4 to 7 times larger than the actual area burned. Secondly, in the example provided in the lower left panel in Figure 6, a fire in a sparsely vegetated area that burned approximately 500 ha is detected only by MCD64A1 C6. The SWIR information utilized by the MCD64A1 algorithm undoubtedly assists in fire detection; however, because of the size of the burn, we would expect detection by the 250 m product. It is not quite clear from these examples if the land cover type affects performance, as FireCCI51 detects the smaller fires occurring in low-vegetated land but fails to detect the larger one occurring in a similar landscape.

6. Conclusions

In this study we assessed the accuracy of two publicly available satellite burned area products, MCD64A1 C6 and FireCCI51, against reference data derived from Sentinel 2 for Greece from 2016 to 2019. Our findings corroborate to some extent similar national and regional validation studies and highlight certain strengths and inherent limitations of the products, arising primarily from their low spatial resolution. Here, fire size remains a critical agent affecting the detection capability of MODIS algorithms. FireCCI51 demonstrated higher sensitivity in detecting fires between 10 and 100 ha, whereas MCD64A1 C6 had less than 50% detection probability in the same size range. Both performed substantially better when only fires in forest and semi-natural areas larger than 100 ha were compared, even though FireCCI51 did not outperform MCD64A1 C6 overall. We assume that exploitation of richer spectral information or combination of finer spectral and spatial resolution is preferable at larger fire sizes, both for the detection and the mapping of fires. Ιn terms of spatial agreement with the reference burned area, the detection rates of the total actual burned area do not differ significantly between the two products (~78%), even though MCD64A1 C6 underestimates and FireCCI51 overestimates the burned areas in general. The latter exhibits lower omission rates in the mapped burned area for most seasons, but equal or higher levels of commission error than MCD64A1 C6, regardless of fire size. Lastly, MCD64A1 C6 demonstrates higher accuracy in reporting the burn date than FireCCI51 at the fire-patch scale, which agrees with the results of previous studies.
Even though higher spatial detail is more advantageous for providing accurate statistics and implementing fire management practices, MODIS time-series information is considered valuable for characterizing fire regimes, understanding their interactions with climate changes and quantifying emissions. Their effective usage undoubtedly requires prior knowledge for their behavior and performance under various climate conditions and ecosystems. Further work is required for a more rigorous assessment at the country level by including additional fire seasons, thus increasing the sample size. This would enable, for example, a more robust investigation of the impact of land cover diversity on the performance of the burned area products. In conclusion, we believe our research could provide additional insight on the reliability and usage of global MODIS products at the local to the national scale in these Mediterranean areas.

Author Contributions

Conceptualization, T.K.; methodology, T.K.; validation, T.K.; investigation, T.K.; writing—original draft preparation, T.K.; writing—review and editing, T.K. and I.Z.G.; visualization, T.K.; supervision, I.Z.G.; funding acquisition, T.K. All authors have read and agreed to the published version of the manuscript.

Funding

This research is co-financed by Greece and the European Union (European Social Fund- ESF) through the Operational Programme “Human Resources Development, Education and Lifelong Learning” in the context of the project “Reinforcement of Postdoctoral Researchers—2nd Cycle” (MIS-5033021), implemented by the State Scholarships Foundation (ΙΚΥ).

Data Availability Statement

The remote sensing datasets used in this project are publicly available through their respective portals, mentioned in the manuscript. The code used for processing these datasets is available upon request from the authors.

Conflicts of Interest

The authors declare no conflict of interest.

References

  1. Giglio, L.; Boschetti, L.; Roy, D.P.; Humber, M.L.; Justice, C.O. The Collection 6 MODIS burned area mapping algorithm and product. Remote Sens. Environ. 2018, 217, 72–85. [Google Scholar] [CrossRef] [PubMed]
  2. Turco, M.; Herrera, S.; Tourigny, E.; Chuvieco, E.; Provenzale, A. A comparison of remotely-sensed and inventory datasets for burned area in Mediterranean Europe. Int. J. Appl. Earth Obs. Geoinf. 2019, 82, 101887. [Google Scholar] [CrossRef] [Green Version]
  3. Efthimiou, N.; Psomiadis, E.; Panagos, P. Fire severity and soil erosion susceptibility mapping using multi-temporal Earth Observation data: The case of Mati fatal wildfire in Eastern Attica, Greece. Catena 2020, 187, 104320. [Google Scholar] [CrossRef] [PubMed]
  4. Turco, M.; Von Hardenberg, J.; AghaKouchak, A.; Llasat, M.C.; Provenzale, A.; Trigo, R.M. On the key role of droughts in the dynamics of summer fires in Mediterranean Europe. Sci. Rep. 2017, 7, 81. [Google Scholar] [CrossRef] [Green Version]
  5. Chergui, B.; Fahd, S.; Santos, X.; Pausas, J.G. Socioeconomic Factors Drive Fire-Regime Variability in the Mediterranean Basin. Ecosystems 2018, 21, 619–628. [Google Scholar] [CrossRef] [Green Version]
  6. Pessôa, A.C.M.; Anderson, L.O.; Carvalho, N.S.; Campanharo, W.A.; Silva Junior, C.H.L.; Rosan, T.M.; Reis, J.B.C.; Pereira, F.R.S.; Assis, M.; Jacon, A.D.; et al. Intercomparison of burned area products and its implication for carbon emission estimations in the amazon. Remote Sens. 2020, 12, 3864. [Google Scholar] [CrossRef]
  7. Katagis, T.; Gitas, I.Z.; Mitri, G.H. An object-based approach for fire history reconstruction by using three generations of landsat sensors. Remote Sens. 2014, 6, 5480–5496. [Google Scholar] [CrossRef] [Green Version]
  8. Chuvieco, E.; Mouillot, F.; van der Werf, G.R.; San Miguel, J.; Tanase, M.; Koutsias, N.; García, M.; Yebra, M.; Padilla, M.; Gitas, I.; et al. Historical background and current developments for mapping burned area from satellite Earth observation. Remote Sens. Environ. 2019, 225, 45–64. [Google Scholar] [CrossRef]
  9. Van Der Werf, G.R.; Randerson, J.T.; Giglio, L.; Van Leeuwen, T.T.; Chen, Y.; Rogers, B.M.; Mu, M.; Van Marle, M.J.E.; Morton, D.C.; Collatz, G.J.; et al. Global fire emissions estimates during 1997–2016. Earth Syst. Sci. Data 2017, 9, 697–720. [Google Scholar] [CrossRef] [Green Version]
  10. Andela, N.; Morton, D.C.; Giglio, L.; Paugam, R.; Chen, Y.; Hantson, S.; Van Der Werf, G.R.; Anderson, J.T. The Global Fire Atlas of individual fire size, duration, speed and direction. Earth Syst. Sci. Data 2019, 11, 529–552. [Google Scholar] [CrossRef] [Green Version]
  11. Schroeder, W.; Oliva, P.; Giglio, L.; Csiszar, I.A. The New VIIRS 375m active fire detection data product: Algorithm description and initial assessment. Remote Sens. Environ. 2014, 143, 85–96. [Google Scholar] [CrossRef]
  12. Mouillot, F.; Schultz, M.G.; Yue, C.; Cadule, P.; Tansey, K.; Ciais, P.; Chuvieco, E. Ten years of global burned area products from spaceborne remote sensing—A review: Analysis of user needs and recommendations for future developments. Int. J. Appl. Earth Obs. Geoinf. 2014, 26, 64–79. [Google Scholar] [CrossRef] [Green Version]
  13. Balch, J.K.; St. Denis, L.A.; Mahood, A.L.; Mietkiewicz, N.P.; Williams, T.M.; McGlinchy, J.; Cook, M.C. Fired (Fire events delineation): An open, flexible algorithm and database of us fire events derived from the modis burned area product (2001–2019). Remote Sens. 2020, 12, 3498. [Google Scholar] [CrossRef]
  14. Roteta, E.; Bastarrika, A.; Padilla, M.; Storm, T.; Chuvieco, E. Development of a Sentinel-2 burned area algorithm: Generation of a small fire database for sub-Saharan Africa. Remote Sens. Environ. 2019, 222, 1–17. [Google Scholar] [CrossRef]
  15. Hawbaker, T.J.; Vanderhoof, M.K.; Schmidt, G.L.; Beal, Y.J.; Picotte, J.J.; Takacs, J.D.; Falgout, J.T.; Dwyer, J.L. The Landsat Burned Area algorithm and products for the conterminous United States. Remote Sens. Environ. 2020, 244, 111801. [Google Scholar] [CrossRef]
  16. Lizundia-Loiola, J.; Otón, G.; Ramo, R.; Chuvieco, E. A spatio-temporal active-fire clustering approach for global burned area mapping at 250 m from MODIS data. Remote Sens. Environ. 2020, 236, 111493. [Google Scholar] [CrossRef]
  17. Tansey, K.; Grégoire, J.M.; Defourny, P.; Leigh, R.; Pekel, J.F.; van Bogaert, E.; Bartholomé, E. A new, global, multi-annual (2000–2007) burnt area product at 1 km resolution. Geophys. Res. Lett. 2008, 35, 1–6. [Google Scholar] [CrossRef]
  18. Plummer, S.; Arino, O.; Simon, M.; Steffen, W. Establishing A Earth Observation Product Service For The Terrestrial Carbon Community: The Globcarbon Initiative. Mitig. Adapt. Strateg. Glob. Chang. 2006, 11, 97–111. [Google Scholar] [CrossRef]
  19. Alonso-Canas, I.; Chuvieco, E. Global burned area mapping from ENVISAT-MERIS and MODIS active fire data. Remote Sens. Environ. 2015, 163, 140–152. [Google Scholar] [CrossRef]
  20. Giglio, L.; Randerson, J.T.; van der Werf, G.R.; Kasibhatla, P.S.; Collatz, G.J.; Morton, D.C.; DeFries, R.S. Assessing variability and long-term trends in burned area by merging multiple satellite fire products. Biogeosciences 2010, 7, 1171–1186. [Google Scholar] [CrossRef] [Green Version]
  21. Laurent, P.; Mouillot, F.; Yue, C.; Ciais, P.; Moreno, M.V.; Nogueira, J.M.P. FRY, a global database of fire patch functional traits derived from space-borne burned area products. Sci. Data 2018, 5, 180132. [Google Scholar] [CrossRef] [PubMed] [Green Version]
  22. Hall, J.V.; Loboda, T.V.; Giglio, L.; McCarty, G.W. A MODIS-based burned area assessment for Russian croplands: Mapping requirements and challenges. Remote Sens. Environ. 2016, 184, 506–521. [Google Scholar] [CrossRef] [Green Version]
  23. Fusco, E.J.; Finn, J.T.; Abatzoglou, J.T.; Balch, J.K.; Dadashi, S.; Bradley, B.A. Detection rates and biases of fire observations from MODIS and agency reports in the conterminous United States. Remote Sens. Environ. 2019, 220, 30–40. [Google Scholar] [CrossRef]
  24. Humber, M.L.; Boschetti, L.; Giglio, L.; Justice, C.O. Spatial and temporal intercomparison of four global burned area products. Int. J. Digit. Earth 2019, 12, 460–484. [Google Scholar] [CrossRef]
  25. Tsela, P.; Wessels, K.; Botai, J.; Archibald, S.; Swanepoel, D.; Steenkamp, K.; Frost, P. Validation of the two standard MODIS satellite burned-area products and an empirically-derived merged product in South Africa. Remote Sens. 2014, 6, 1275–1293. [Google Scholar] [CrossRef] [Green Version]
  26. Boschetti, L.; Roy, D.P.; Giglio, L.; Huang, H.; Zubkova, M.; Humber, M.L. Global validation of the collection 6 MODIS burned area product. Remote Sens. Environ. 2019, 235, 111490. [Google Scholar] [CrossRef]
  27. Roy, D.P.; Boschetti, L. Southern Africa Validation of the MODIS, L3JRC, and GlobCarbon Burned-Area Products. IEEE Trans. Geosci. Remote Sens. 2009, 47, 1032–1044. [Google Scholar] [CrossRef]
  28. Boschetti, L.; Stehman, S.V.; Roy, D.P. A stratified random sampling design in space and time for regional to global scale burned area product validation. Remote Sens. Environ. 2016, 186, 465–478. [Google Scholar] [CrossRef]
  29. Campagnolo, M.L.; Libonati, R.; Rodrigues, J.A.; Pereira, J.M.C. A comprehensive characterization of MODIS daily burned area mapping accuracy across fire sizes in tropical savannas. Remote Sens. Environ. 2021, 252, 112115. [Google Scholar] [CrossRef]
  30. Vetrita, Y.; Cochrane, M.A.; Priyatna, M.; Sukowati, K.A.D.; Khomarudin, M.R. Evaluating accuracy of four MODIS-derived burned area products for tropical peatland and non-peatland fires. Environ. Res. Lett. 2021, 16, 035015. [Google Scholar] [CrossRef]
  31. Chen, D.; Shevade, V.; Baer, A.; Loboda, T.V. Missing Burns in the High Northern Latitudes: The Case for Regionally Focused Burned Area Products. Remote Sens. 2021, 13, 4245. [Google Scholar] [CrossRef]
  32. Vilar, L.; Camia, A.; San-Miguel-Ayanz, J. A comparison of remote sensing products and forest fire statistics for improving fire information in Mediterranean Europe. Eur. J. Remote Sens. 2015, 48, 345–364. [Google Scholar] [CrossRef] [Green Version]
  33. Loepfe, L.; Lloret, F.; Román-Cuesta, R.M. Comparison of burnt area estimates derived from satellite products and national statistics in Europe. Int. J. Remote Sens. 2012, 33, 3653–3671. [Google Scholar] [CrossRef]
  34. Katagis, T.; Gitas, I.Z. Accuracy estimation of two global burned area products at national scale. IOP Conf. Ser. Earth Environ. Sci. 2021, 932, 12001. [Google Scholar] [CrossRef]
  35. Koutsias, N.; Xanthopoulos, G.; Founda, D.; Xystrakis, F.; Nioti, F.; Pleniou, M.; Mallinis, G.; Arianoutsou, M.; Aldersley, A.; Murray, S.; et al. On the relationships between forest fires and weather conditions in Greece from long-term national observations (1894–2010). Int. J. Wildl. Fire 2013, 22, 493. [Google Scholar] [CrossRef] [Green Version]
  36. Molina-Terrén, D.M.; Xanthopoulos, G.; Diakakis, M.; Ribeiro, L.; Caballero, D.; Delogu, G.M.; Viegas, D.X.; Silva, C.A.; Cardil, A. Analysis of forest fire fatalities in Southern Europe: Spain, Portugal, Greece and Sardinia (Italy). Int. J. Wildl. Fire 2019, 28, 85–98. [Google Scholar] [CrossRef] [Green Version]
  37. Raftoyannis, Y.; Nocentini, S.; Marchi, E.; Sainz, R.C.; Guemes, C.G.; Pilas, I.; Peric, S.; Paulo, J.A.; Moreira-Marcelino, A.C.; Costa-Ferreira, M.; et al. Perceptions of forest experts on climate change and fire management in European Mediterranean forests. IForest 2014, 7, 33–41. [Google Scholar] [CrossRef] [Green Version]
  38. San-Miguel-Ayanz, J.; Durrant, T.; Boca, R.; Maianti, P.; Libertá, G.; Vivancos, T.A.-; Oom, D.; Branco, A.; de Rigo, D.; Ferrari, D.; et al. Forest Fires Europe Middle East and North Africa 2019; EUR30402 EN; Publications Office of the European Union: Luxembourg, 2020. [Google Scholar]
  39. Roy, D.P.; Jin, Y.; Lewis, P.E.; Justice, C.O. Prototyping a global algorithm for systematic fire-affected area mapping using MODIS time series data. Remote Sens. Environ. 2005, 97, 137–162. [Google Scholar] [CrossRef]
  40. Artés, T.; Oom, D.; de Rigo, D.; Durrant, T.H.; Maianti, P.; Libertà, G.; San-Miguel-Ayanz, J. A global wildfire dataset for the analysis of fire regimes and fire behaviour. Sci. Data 2019, 6, 296. [Google Scholar] [CrossRef]
  41. Chuvieco, E.; Lizundia-Loiola, J.; Lucrecia Pettinari, M.; Ramo, R.; Padilla, M.; Tansey, K.; Mouillot, F.; Laurent, P.; Storm, T.; Heil, A.; et al. Generation and analysis of a new global burned area product based on MODIS 250 m reflectance bands and thermal anomalies. Earth Syst. Sci. Data 2018, 10, 2015–2031. [Google Scholar] [CrossRef] [Green Version]
  42. Chuvieco, E.; Yue, C.; Heil, A.; Mouillot, F.; Alonso-Canas, I.; Padilla, M.; Pereira, J.M.; Oom, D.; Tansey, K. A new global burned area product for climate assessment of fire impacts. Glob. Ecol. Biogeogr. 2016, 25, 619–629. [Google Scholar] [CrossRef] [Green Version]
  43. National Observatory of Forest Fires (NOFFi). Available online: http://epadap.web.auth.gr/?lang=en (accessed on 1 September 2021).
  44. Franquesa, M.; Vanderhoof, M.K.; Stavrakoudis, D.; Gitas, I.Z.; Roteta, E.; Padilla, M.; Chuvieco, E. Development of a standard database of reference sites for validating global burned area products. Earth Syst. Sci. Data 2020, 12, 3229–3246. [Google Scholar] [CrossRef]
  45. Stavrakoudis, D.; Katagis, T.; Minakou, C.; Gitas, I.Z. Automated Burned Scar Mapping Using Sentinel-2 Imagery. J. Geogr. Inf. Syst. 2020, 12, 221–240. [Google Scholar] [CrossRef]
  46. AppEEARS Team Application for Extracting and Exploring Analysis Ready Samples (AppEEARS). Ver. 2.46. NASA EOSDIS Land Processes Distributed Active Archive Center (LP DAAC), USGS/Earth Resources Observation and Science (EROS) Center, Sioux Falls, SD, USA. Available online: https://lpdaacsvc.cr.usgs.gov/appeears (accessed on 1 October 2020).
  47. ESA Climate Change Initiative-Fire_cci Burned Area Dataset. Available online: https://geogra.uah.es/fire_cci/firecci51.php (accessed on 1 October 2020).
  48. Melchiorre, A.; Boschetti, L.; Melchiorre, A.; Boschetti, L. Global Analysis of Burned Area Persistence Time with MODIS Data. Remote Sens. 2018, 10, 750. [Google Scholar] [CrossRef] [Green Version]
  49. MODIS/Terra+Aqua Land Cover Type Yearly L3 Global 500 m SIN Grid (MCD12Q1 v006). Available online: https://lpdaac.usgs.gov/products/mcd12q1v006/ (accessed on 20 October 2020).
  50. Padilla, M.; Stehman, S.V.; Chuvieco, E. Validation of the 2008 MODIS-MCD45 global burned area product using stratified random sampling. Remote Sens. Environ. 2014, 144, 187–196. [Google Scholar] [CrossRef]
  51. Fleiss, J.L.; Levin, B.; Paik, M.C. Statistical Methods for Rates and Proportions; John Wiley & Sons, Inc.: Hoboken, NJ, USA, 2003. [Google Scholar]
  52. Zhu, C.; Kobayashi, H.; Kanaya, Y.; Saito, M. Size-dependent validation of MODIS MCD64A1 burned area over six vegetation types in boreal Eurasia: Large underestimation in croplands. Sci. Rep. 2017, 7, 4181. [Google Scholar] [CrossRef]
  53. Boschetti, L.; Roy, D.P.; Justice, C.O.; Giglio, L. Global assessment of the temporal reporting accuracy and precision of the MODIS burned area product. Int. J. Wildl. Fire 2010, 19, 705. [Google Scholar] [CrossRef]
  54. Fornacca, D.; Ren, G.; Xiao, W. Performance of Three MODIS fire products (MCD45A1, MCD64A1, MCD14ML), and ESA Fire_CCI in a mountainous area of Northwest Yunnan, China, characterized by frequent small fires. Remote Sens. 2017, 9, 1131. [Google Scholar] [CrossRef] [Green Version]
Figure 1. The study area is the country of Greece. The colored triangles show the reference fire locations, determined by Sentinel-2 images. (Basemap sources: Esri, Garmin, USGS, NOAA, NPS).
Remotesensing 14 00602 g001
Figure 2. Fire statistics for the years 2009–2021 for Greece derived by the European Forest Fire Information System (EFFIS) reports (https://effis.jrc.ec.europa.eu/apps/effis.statistics/effisestimates, accessed on 1 October 2021).
Remotesensing 14 00602 g002
Figure 3. The annual total burned area (in hectares) reported for Greece by MCD64A1 C6, FireCCI51 and Sentinel-2 datasets.
Remotesensing 14 00602 g003
Figure 4. Annual estimations of correctly detected burned area (ha) in Greece and corresponding detection rates (DR) by the MODIS BA products.
Remotesensing 14 00602 g004
Figure 5. Histogram of absolute temporal difference (in days) between MODIS and Sentinel-2 reference fires for all years. The difference is calculated between the minimum DOY of each MODIS fire and the start date of the corresponding reference fire. The mean (Md) and standard deviation (Sd) of the absolute differences in days are also presented.
Remotesensing 14 00602 g005
Figure 6. Fire polygons derived from the MODIS BA products overlaid on Sentinel-2 fire perimeters. The background consists of Sentinel-2 false color images over various locations in Greece displaying recent burns during the summer of 2016. (a,b) Small fire scars, approximately 45 to 50 ha each, that are detected by FireCCI51 only. However, the region-growing algorithm delineation is less than accurate in two of the three scars, resulting in an overestimation of the actual area; (c) A fire scar of 550 ha is detected only by MCD64A1 C6. The burned area is mainly occupied by open spaces with sparse vegetation.
Remotesensing 14 00602 g006
Table 1. Confusion matrix and accuracy metrics considering fire detections by MCD64A1 C6 and FireCCI51 in Greece (2016–2019). The dice coefficient (DC), omission (OE) and commission (CE) errors are estimated for all fires (>10 ha); only the OE is estimated for larger fires (>100 ha).
Size > 10 haSize > 100 ha
ProductMtrMtotalS2OECEDCMtrS2OE
2016MCD64A12430480.500.200.6223270.15
FireCCI5141650.150.370.73230.15
2017MCD64A14047820.510.150.6232350.09
FireCCI5144690.460.360.58270.23
2018MCD64A11116230.520.310.5611160.31
FireCCI5113250.430.480.54130.19
2019MCD64A11620350.540.200.5815190.21
FireCCI5122410.370.460.58130.32
TotalMCD64A1911131880.520.190.6181970.16
FireCCI511202000.360.400.62760.22
Table 2. Confusion matrix and accuracy metrics for the burned area mapped by the MODIS BA products in Greece (2016–2019), considering the spatially coincident fires with Sentinel-2 reference data. The same metrics as in Table 1 are estimated, for two size groups. BTRUE is the common area mapped by MODIS and Sentinel-2, BMOD is the area mapped by MODIS only and BS2 is the actual area mapped by Sentinel-2.
Burned Area (Size > 10 ha)Burned Area (Size > 100 ha)
ProductBTRUEBMODBS2OECEDCBTRUEBMODBS2OECEDC
2016MCD64A119,39823,44525,9920.250.170.7719,37423,41225,9030.250.170.79
FireCCI5120,80727,57627,1140.230.250.7620,22725,41026,2130.230.200.78
2017MCD64A115,62421,33419,2630.190.270.7715,33720,79218,7320.180.260.78
FireCCI5114,56020,75616,6840.130.300.7814,00618,92815,8210.110.260.80
2018MCD64A18195966010,2720.200.150.828195966010,2720.200.150.82
FireCCI517247945410,5210.310.230.737247945410,5210.310.230.73
2019MCD64A15873791476180.230.260.765859789775430.220.250.76
FireCCI516318826877000.180.270.775992771172470.170.220.80
TotalMCD64A149,09062,35363,1450.220.210.7848,76561,57562,4500.220.210.79
FireCCI5148,93266,05462,0190.210.260.7647,44261,50359,8020.210.230.78
Publisher’s Note: MDPI stays neutral with regard to jurisdictional claims in published maps and institutional affiliations.

