Article

Local Enhancement of Marine Gravity Field over the Spratly Islands by Combining Satellite SAR Altimeter-Derived Gravity Data

1
School of Earth Sciences and Engineering, Hohai University, Nanjing 211100, China
2
Institute of Geodesy and Geoinformation, University of Bonn, 53012 Bonn, Germany
3
MOE Key Laboratory of Fundamental Physical Quantities Measurement, School of Physics, Huazhong University of Science and Technology, Wuhan 430074, China
4
School of Geodesy and Geomatics, Wuhan University, Wuhan 430072, China
*
Author to whom correspondence should be addressed.
Remote Sens. 2022, 14(3), 474; https://doi.org/10.3390/rs14030474
Submission received: 29 November 2021 / Revised: 13 January 2022 / Accepted: 14 January 2022 / Published: 20 January 2022
(This article belongs to the Special Issue Space-Geodetic Techniques)

Abstract

:
The marine gravity field recovery close to land/island is challenging owing to the scarcity of measured gravimetric observations and sorely contaminated satellite radar altimeter-derived data. The satellite missions that carried the synthetic aperture radar (SAR) altimeters supplied data with improved quality compared to that retrieved from the conventional radar altimeters. In this study, we combine the satellite altimeter-derived gravity data for marine gravity field augmentation over island areas; in particular, the feasibility for regional augmentation by incorporating the SAR altimeter-derived gravity data is investigated. The gravity field modeling results over the Spratly Islands demonstrate that the marine gravity field is augmented by the incorporation of newly published satellite altimeter-derived gravity data. By merging the gravity models computed with the Sentinel-3A/B SAR altimetry data, the quasi-geoid and mean dynamic topography are dramatically improved, by a magnitude larger than 4 cm around areas close to islands, in comparison with the results directly derived from a combined global geopotential model alone. Further comparison of regional solutions computed from heterogeneous gravity models shows that the ones modeled from the SAR-based gravity models have better performances, the errors of which are reduced by a magnitude of 2~4 cm over the regions close to islands, in comparison with the solutions modeled with the gravity models developed without SAR altimetry data. These results highlight the superiority of using the SAR-based gravity data in marine gravity field recovery, especially over the regions close to land/island.

1. Introduction

High-resolution gravity field determination at seas is a basic task in geodesy. Thanks to the Gravity Recovery and Climate Experiment (GRACE) [1,2] and Gravity Field and Steady-State Ocean Circulation Explorer (GOCE) missions [3,4], the global gravity field has been prominently strengthened at long wavelength up to hundreds of kilometers [5,6,7,8]. On the other hand, by incorporating ground-based data at short-wavelength, the derived Global Geopotential Models (GGMs) (known as high-degree or combined GGMs) can map the gravity signals at a mean spatial resolution of 5 arc-minutes (~10 km) in global scale [9,10,11].
Despite the tremendous progresses made in global geopotential model computation over decades, the lack of globally distributed gravity data is still a major barrier to improve the combined GGMs. For regions inland, such as most areas in Asia and Africa, the measured land/airborne gravimetric observations are limited; accessible and fill-in measurements were involved in the computation of combined GGMs [9,12,13], whereas satellite altimetric gravity data was usually used over oceans as shipborne/airborne gravimetric measurements were usually inaccessible or confidentially kept due to political reasons [14]. However, the satellite altimeter-derived data is notoriously known to be of low quality close to land/island, owing to the contamination of radar altimeter waveforms and degraded quality of geophysical models used for data corrections [15,16,17,18]. Inevitably, the errors in satellite altimeter-derived gravimetric data were spread to the combined GGMs. As a result, the errors in the combined GGMs reached 6~10 centimeters over most oceans [9], and even a magnitude of decimeter level or larger over polar areas and coastal regions [19,20]. The errors in a GGM may bring about dramatic disturbances in the investigation of the mean ocean state in detail [21,22].
The improved satellite altimetry techniques result in the augmentation of global marine gravity field, by a factor of 2~4, in comparison with the gravity field models developed with old altimeter-derived records [23,24,25]. In particular, the CryoSat-2 and Sentinel-3A/B missions that carried synthetic aperture radar (SAR) altimeters derived precise records of sea surface height up to several kilometers from the coast [17,26]. The CryoSat-2 applies the low-resolution mode (LRM), SAR mode, and SAR interferometry (SARIn) mode over different areas [27,28,29]. Sentinel-3A/B inherited the SAR altimeter from CryoSat-2, and it retrieved observations with denser spatial coverage in comparison with the conventional altimetry (or operated in the LRM mode). Moreover, the data derived from the SAR waveforms have higher signal-to-noise ratio and lower speckle noise [30,31,32], and the accuracy of SAR altimetry data reaches several centimeters to decimeter level close to coast and lakes [33,34,35]. By incorporating recent altimetry observations, the derived gravimetric products have improved precision versus the ones developed without these observations [36].
The launch of the satellite altimetry missions carrying the SAR altimeter provides solid basis for local gravity field recovery close to land/island; however, little attention has been paid to gravity field enhancement over coastal or island areas by combing the SAR altimetry data, especially for the use of recently released data from Sentinel-3A/B. To our best knowledge, no existing literature has investigated and quantified the additional signals introduced from the SAR-based data retrieved from Sentinel-3A/B on regional gravity field modeling. This study aims at strengthening the marine gravity field over regions close to land/island on a regional scale based on gravity data derived from satellite altimeters. In particular, we study the feasibility for local augmentation based on SAR-based gravity data. Moreover, we compare the performances of different altimetric gravity models in marine gravity field recovery. In the following, the study area and data sources are included in Section 2. Section 3 displays the gravity field modeling results, where the added signals retrieved from the newly published satellite altimeter-derived gravity data are quantified and validated; in particular, the possibility for local enhancement based on SAR-based gravity data is investigated. Section 4 contains a summary of the study and the main conclusions.

2. Study Area and Data

We chose the study area as the Spratly Islands located in the southern part of the South China Sea (SCS) (see the area inside the red rectangle in Figure 1a), and the bathymetry is retrieved from the General Bathymetric Chart of the Oceans (GEBCO) [37]. The Spratly Islands are the largest archipelago in the SCS and are also the southernmost archipelago, where small islands, sandbanks, shoals, and coral reefs are the predominant structures [38] (see Figure 1b). The Spratly Islands archipelago is rich in natural resources, and is also a disputed archipelago with complicate governances. As a result, it is hard to implement shipborne/airborne gravimetric surveys over this area. The lack of measured gravimetric observations brings about the difficulty for marine gravity field recovery over the Spratly Islands, and the current combined GGMs were computed by using satellite altimetric gravity data. Moreover, small islands, atolls, sandbanks, shoals, and reefs are in abundance in the Spratly Islands, and the return waveforms from radar altimeters have been severely contaminated; as such, there exist multiple challenges in local marine gravity refinement. However, this offers a chance to research the feasibility of using SAR-based gravimetric data in regional augmentation.
As there were no measured gravimetric observations available over the Spratly Islands, we use the satellite altimeter-derived data for marine gravity field modeling. For this purpose, several recently released altimetric gravity models are used. First, the widely used models developed at the Technical University of Denmark (DTU) space and Scripps Institution of Oceanography (SIO) are introduced. For the series of models developed at DTU space, the latest model, namely DTU21GRA, and several predecessors, i.e., DTU13GRA, DTU15GRA, and DTU17GRA [36,39], are used. Typically, for the models that were developed in the DTU space, the updated gravity models had improved accuracy versus the previous versions, which were mainly due to the use of newly released altimeter data and the updated data preprocessing methods. For instance, the comparison with an airborne survey over North Greenland showed that the standard deviation (SD) of the misfits between DTU17GRA and the airborne data was 3.78 mGal. This value increased to 8.81, 5.91, and 5.45 mGal when DTU10GRA, DTU13GRA, and DTU15GRA were evaluated, respectively. The major improvement of DTU17GRA over DTU15GRA is that the computation of DTU17GRA contained more CryoSat-2 data and SARAL/AltiKa data from 2016 to 2017 in the geodetic phase, while the improvement of DTU21GRA over DTU17GRA is that the former was computed by combining 5 years of Sentinel-3A and 3 years of Sentinel-3B and reprocessed Cryosat-2 data (processed with the SAMOSA+ physical retracker).
For the models developed in SIO, the latest model, called SIO V31.1, and its previous version, namely, SIO V30.1 (hereinafter referred to as SIO31 and SIO30, respectively) [23,24,40], are introduced. In addition, two recently published regional models over the SCS, i.e., SCSGA V1.0 [41] and HY-2A V1.0 [42], are used. In short, we call these two regional models SCSGA and HY2A, respectively. All these satellite altimetric gravity models have the spatial resolutions of one arc-minute, and the datasets used in these models’ development and other associated information are shown in Table 1.
For the models developed at the DTU space, it is noticeable that although DTU13GRA/DTU15GRA/DTU17GRA was computed with CryoSat-2 data, CryoSat-2 operated in the LRM over the SCS, and no SAR altimetry data was used in the computation of these models. For the same reason, SCSGA and HY2A are the models that were computed without combining SAR altimetry data, whereas the development of SIO30, SIO31, and DTU21GRA incorporated Sentinel-3A/B SAR altimeter measurements over the SCS, and the altimeter in the Sentinel-3A/B mission operated in the SAR mode all around the world.
The comparisons with an airborne survey over North Greenland and the marine gravity data from the NGA showed that DTU17GRA had improved accuracy, compared to the previous versions, e.g., DTU10GRA, DTU13GRA, and DTU15GRA [36]. Moreover, the validation with independent shipborne gravity data over the SCS displayed that the SCSGA model had comparable precision to SIO V27.1 but had better performance than DTU13GRA/DTU17GRA [41], whereas HY2A had degraded precision compared with SIO V27.1 and DTU17GRA [42].

3. Results and Discussions

3.1. Local Refinement with SAR-Based Altimetric Gravity Data

The remove–compute–restore approach is applied for modeling [43,44], and we use the residual terrain model (RTM) to reduce the high-frequency topographical signals [45]. XGM2019e_2159, with a full degree and order (d/o) of 2190/2159, is chosen as the reference model [46]. A satellite-only GGM, namely, GOCO06S, was used to represent the long-wavelength component of XGM2019e_2159, and the gravimetric data sources from National Geospatial-Intelligence Agency (NGA) and DTU13GRA were used to compute the short-wavelength component of this model [46]. The validation against local airborne gravimetric observations demonstrated that XGM2019e_2159 had improved precision, by a magnitude of ~1 mGal, compared to the GGMs that have similar expansion degrees [47].
We model the residual gravity field by using Poisson wavelets, and the long- and short-wavelength components of gravity field are recovered from the reference model and RTM, respectively [48,49]. To compute the residual gravity data, the gravity anomalies synthesized from XGM2019e_2159 up to degree 2190 and the associated RTM corrections are subtracted from the satellite altimeter-derived gravity data. Then, we parameterized the residual gravity field based on Poisson wavelets, and the function that links the gravity anomaly to the disturbing potential is seen in Klee et al. (2008) [50]. The area extends 7° N to 12° N in the latitudinal direction, and 111.0° E to 116° E in the longitudinal direction is chosen as the computational region. We locate the Poisson wavelets 5 km beneath the terrain, and we set the mean resolution of Poisson wavelets as 10 km. Moreover, we compute the quasi-geoid model with a spatial resolution of ~2 km, in correspondence with the mean resolution of the satellite altimeter-derived gravity models.
To highlight the use of SAR altimetry data in local augmentation, we investigate the performances of various solutions modeled with different altimetric gravity models that are computed with and without SAR altimetry data. To do this, four different versions of altimetric gravity models that were developed at DTU space, i.e., DTU13GRA, DTU15GRA, DTU17GRA, and DTU21GRA, are used. It is of note that only the DTU21GRA model was developed with the SAR altimetry data retrieved from Sentinel-3A/B over the Spratly Islands, while the other three models were developed without SAR altimetry data. The residual quasi-geoids computed with various satellite altimeter-derived gravity models are seen in Figure 2 and reach a magnitude of several centimeters (see the statistics in Table 2). The magnitude of the contents retrieved from DTU13GRA is slightly larger than 3 cm, and the standard deviation value is ~0.6 cm. Although the reference model in local gravity field modeling, i.e., XGM2019e_2159, was computed based on the DTU13GRA data over oceans, there may still be the additional contents in the DTU13GRA data that were unresolved in XGM2019e_2159, whereas the minimum/maximum value changes to −3.0/4.0 cm (−3.4/4.8 cm) when DTU15GRA (DTU17GRA) is applied for modeling. The additional signals derived from these satellite altimeter-derived gravity models concentrate over the areas close to islands, e.g., close to the Zhongye Reefs (11.1° N, 114.3° E), Daoming Reefs (10.8° N, 114.5° E), Zhenghe Reefs (10.4° N, 114.6° E), and Jiuzhang Reefs (9.8° N, 114.5° E). The added signals retrieved from DTU17GRA have stronger structures than those derived from the DTU13GRA data, which may be due to that the computation of DTU17GRA involved more high-quality data, including more data from Jason-1, CryoSat-2, and SARAL/AltiKa, as well as the updated data preprocessing strategies. As a result, DTU17GRA had improved accuracy compared to DTU13GRA [36].
In contrast, the added signals range from –5.2 to 5.3 cm (the SD value is ~1.0 cm) when DTU21GRA is used. The contents retrieved from DTU21GRA have stronger structures than those derived from the three models above, particularly over the northern part and the regions close to islands. The DTU21GRA data computed with the SAR altimetry data retrieved from Sentinel-3A/B may further contribute to the marine gravity field augmentation, especially over island areas, compared to the altimetric gravity models computed without SAR altimeter data, as the SAR waveforms have the relatively high signal-to-noise ratio and can alleviate the well-known coast problem. Moreover, the SAR altimeters supply observations with denser spatial coverage than conventional radar altimeters, and the incorporation of DTU21GRA is beneficial to recover the short-wavelength component of local gravity field.
Further, the geodetic mean dynamic topography (MDT) solutions based on the quasi-geoids derived from different altimetric gravity data are computed and compared. The MDT represents the departure of the MSS from the geoid [51,52,53,54], and we use the quasi-geoid rather than the geoid, due to fact that the quasi-geoid coincides with the geoid at seas [55]. We choose DTU21MSS as the MSS model. For the derivation of DTU21MSS, more than 5 years of Sentinel-3A data and 2 years of Sentinel-3B data were combined [56]. Moreover, an updated waveform retracker, i.e., the SAMOSA+ physical retracker, was used to preprocess the Cryosat-2 data. This further improves the quality of the MSS model over coastal regions compared to its previous version, e.g., DTU18MSS [57].
The raw MDTs are seen in Figure 3, and we find that the dramatic oscillations exist in the model derived from XGM2019e_2159 over island areas. The errors of the quasi-geoid computed from a combined GGM spread to the MDT, which possibly brings about errors larger than several centimeters at seas [9], and even to decimeter level over coastal regions and polar areas [19,20]. In comparison, smaller disturbances are seen in the solutions computed by using the quasi-geoids that are augmented by incorporating the satellite altimeter-derived gravity data (see Figure 3b–e). For instance, see the patterns around the Shuangzi Reefs (11.4° N, 114.4° E), Zhongye Reefs (11.1° N, 114.3° E), Daoming Reefs (10.8° N, 114.5° E), Zhenghe Reefs (10.4° N, 114.6° E), and Jiuzhang Reefs (9.8° N, 114.5° E). By using the newly published satellite altimeter-derived gravity data, the quasi-geoid and mean dynamic topography are augmented, compared to the GGM-derived solutions. The mutual comparisons demonstrate that the MDT computed with the quasi-geoid enhanced by DTU21GRA shows relatively smooth structures, especially in the regions close to islands. This is probably owing to that the computation of DTU21GRA involved the Sentinel-3A/3B SAR altimetry data, which brings about regional augmentation.
The raw MDTs are further investigated along latitude 10.4° N and longitude 114.6° E, and the profiles are seen in Figure 3e. In Figure 4a, we see that the MDT derived from the quasi-geoid augmented by merging DTU21GRA has smoother properties than the one directly derived from XGM2019e_2159 and the solutions computed from other altimetric gravity models. This is particularly the case when this profile crosses the Zhenghe Reefs (114.6° E) and Wufang Reef (115.7° E), where the spike-like patterns appear in the MDTs. These spikes are usually identified as the errors due to the degraded quality of satellite altimeter-derived data close to land/island [58]. Over these regions, the XGM2019e_2159-derived solution has the most prominent disturbances; and the inconsistencies between this model and the one strengthened by combining DTU21GRA is greater than 3 cm close to the Zhenghe Reefs. The mutual comparison shows that the MDTs computed from DTU13GRA, DTU15GRA, and DTU17GRA almost have consistent structures, although the computation of DTU17GRA incorporated more CryoSat-2 and SARAL/AltiKa data that was not included in the derivation of DTU13GRA/DTU15GRA. In contrast, the application of the DTU21GRA data reduces these spike-like errors, by a magnitude exceeding 2 cm close to the Zhenghe Reefs and Wufang Reef, compared to the associated MDTs modeled with the altimetric gravity data computed without SAR altimetry data. This also corresponds with the results shown in Figure 3, where the MDT modeled with the DTU21GRA data has relatively smooth structures. These results demonstrate the superiority of using the SAR-based gravity data in the determination of marine quasi-geoid and mean dynamic topography over the areas close to land/island.
The properties of the MDTs along longitude 114.6° N are seen in Figure 4b. We also find that the mean dynamic topography computed with the augmentation of DTU21GRA has relatively small variations, especially when this profile crosses the Zhenghe Reefs (10.4° E) and Lesi Shoal (11.35° E). Moreover, the discrepancy between the XGM2019e_2159-derived MDT and the one strengthened by using the DTU21GRA data exceeds 3 cm (4 cm) over the Zhenghe Reefs (Lesi Shoal). Similarly, compared to the MDT modeled with the altimetric gravity model computed without SAR altimeter data, i.e., DTU13GRA, DTU15GRA, and DTU17GRA, the use of DTU21GRA data can reduce these spike-like errors by a magnitude exceeding 2 cm (3 cm) over the Zhenghe Reefs (Lesi Shoal).

3.2. Performances of Heterogeneous Altimetric Gravity Models

Moreover, we investigate the performances of heterogeneous gravity models released from different institutes in marine gravity field modeling. To achieve this, five representative models, i.e., HY2A, SCSGA, SIO30, SIO31, and DTU21GRA, are selected for the case study. The magnitudes of the added signals in terms of quasi-geoid heights derived from different gravity models are not consistent (see Figure 5). The maximum/minimum of the additional signals retrieved from HY2A is –5.5/7.0 cm (see Table 3). In comparison, the signals derived from SCSGA have weaker patterns, and the maximum/minimum value is –4.2/4.4 cm, whereas the added signals computed from the altimetric gravity data modeled with the Sentinel-3A/B SAR altimeter data, i.e., SIO30/SIO31/DTU21GRA, reach a magnitude greater than 5 cm. The differences among different MDTs result from the different data preprocessing techniques and weighting methods, as well as the different datasets used in model development.
Further, the quasi-geoids computed from different altimetric gravity models are assessed in MDT modeling. Figure 6 displays the raw MDTs, and the comparison of the MDTs computed from various gravity models shows that the structures of different MDTs are heterogeneous. For the MDTs augmented by HY2A and SCSGA, the variations are still significant over the island areas. In comparison, the models enhanced by SIO30, SIO31, and DTU21GRA have smaller disturbances, especially over the regions close to the Shuangzi Reefs (11.4° N, 114.4° E), Zhongye Reefs (11.1° N, 114.3° E), Daoming Reefs (10.8° N, 114.5° E), Zhenghe Reefs (10.4° N, 114.6° E), Jiuzhang Reefs (9.8° N, 114.5° E), and Wufang Reef (10.4° N, 115.7° E). The heterogeneous data preprocessing strategies, as well as data combination methods used in model development, partially cause these discrepancies among different MDTs. However, the most important reason may be due to that the computation of SIO30, SIO31, and DTU21GRA involved the Sentinel-3A/B SAR altimeter data over the study area. These results agree with the validation of heterogeneous gravity models against independent gravimetric observations over the SCS, which showed that HY2A had degraded quality versus SIO V27.1/DTU17GRA [42].
Figure 7a shows the different MDTs along latitude 10.4° N. Although the MDT derived from the quasi-geoid enhanced by HY2A/SCSGA has smaller turbulences than that derived from XGM2019e_2159, the spike-like errors are still dramatic close to the Zhenghe Reefs (114.6° E) and Wufang Reef (115.7° E). The spikes are reduced in the solutions strengthened by using SIO31/DTU21GRA, with a reduction greater than 2 cm over the Zhenghe Reefs and 3 cm over the Wufang Reef, compared to the MDT modeled with the HY2A data. It agrees well with the modeling results in Figure 6, where the MDT modeled with the SIO31/DTU21GRA data has relatively smooth structures close to islands. The MDTs computed with the SIO30, SIO31, and DTU21GRA data almost show consistent structures along this profile, and the mutual discrepancies among these three solutions are within 2 cm. The properties of different MDTs along longitude 114.6° N show similar results to the profile along latitude 10.4° E (see Figure 7b). The MDTs from the altimetric gravity data computed with the SAR altimetry data, i.e., SIO30, SIO31, and DTU21GRA, have relatively small variations compared with the one derived from XGM2019e_2159 alone and the solution derived from the HY2A/SCSGA data. The application of the SAR altimetry data reduces the spike-like errors by a magnitude larger than 2 cm (4 cm) over the Zhenghe Reefs (Lesi Shoal), compared with the MDT modeled with the HY2A data. These results show that the performances of heterogeneous gravity models are not consistent, and the SAR-based models may be preferable.

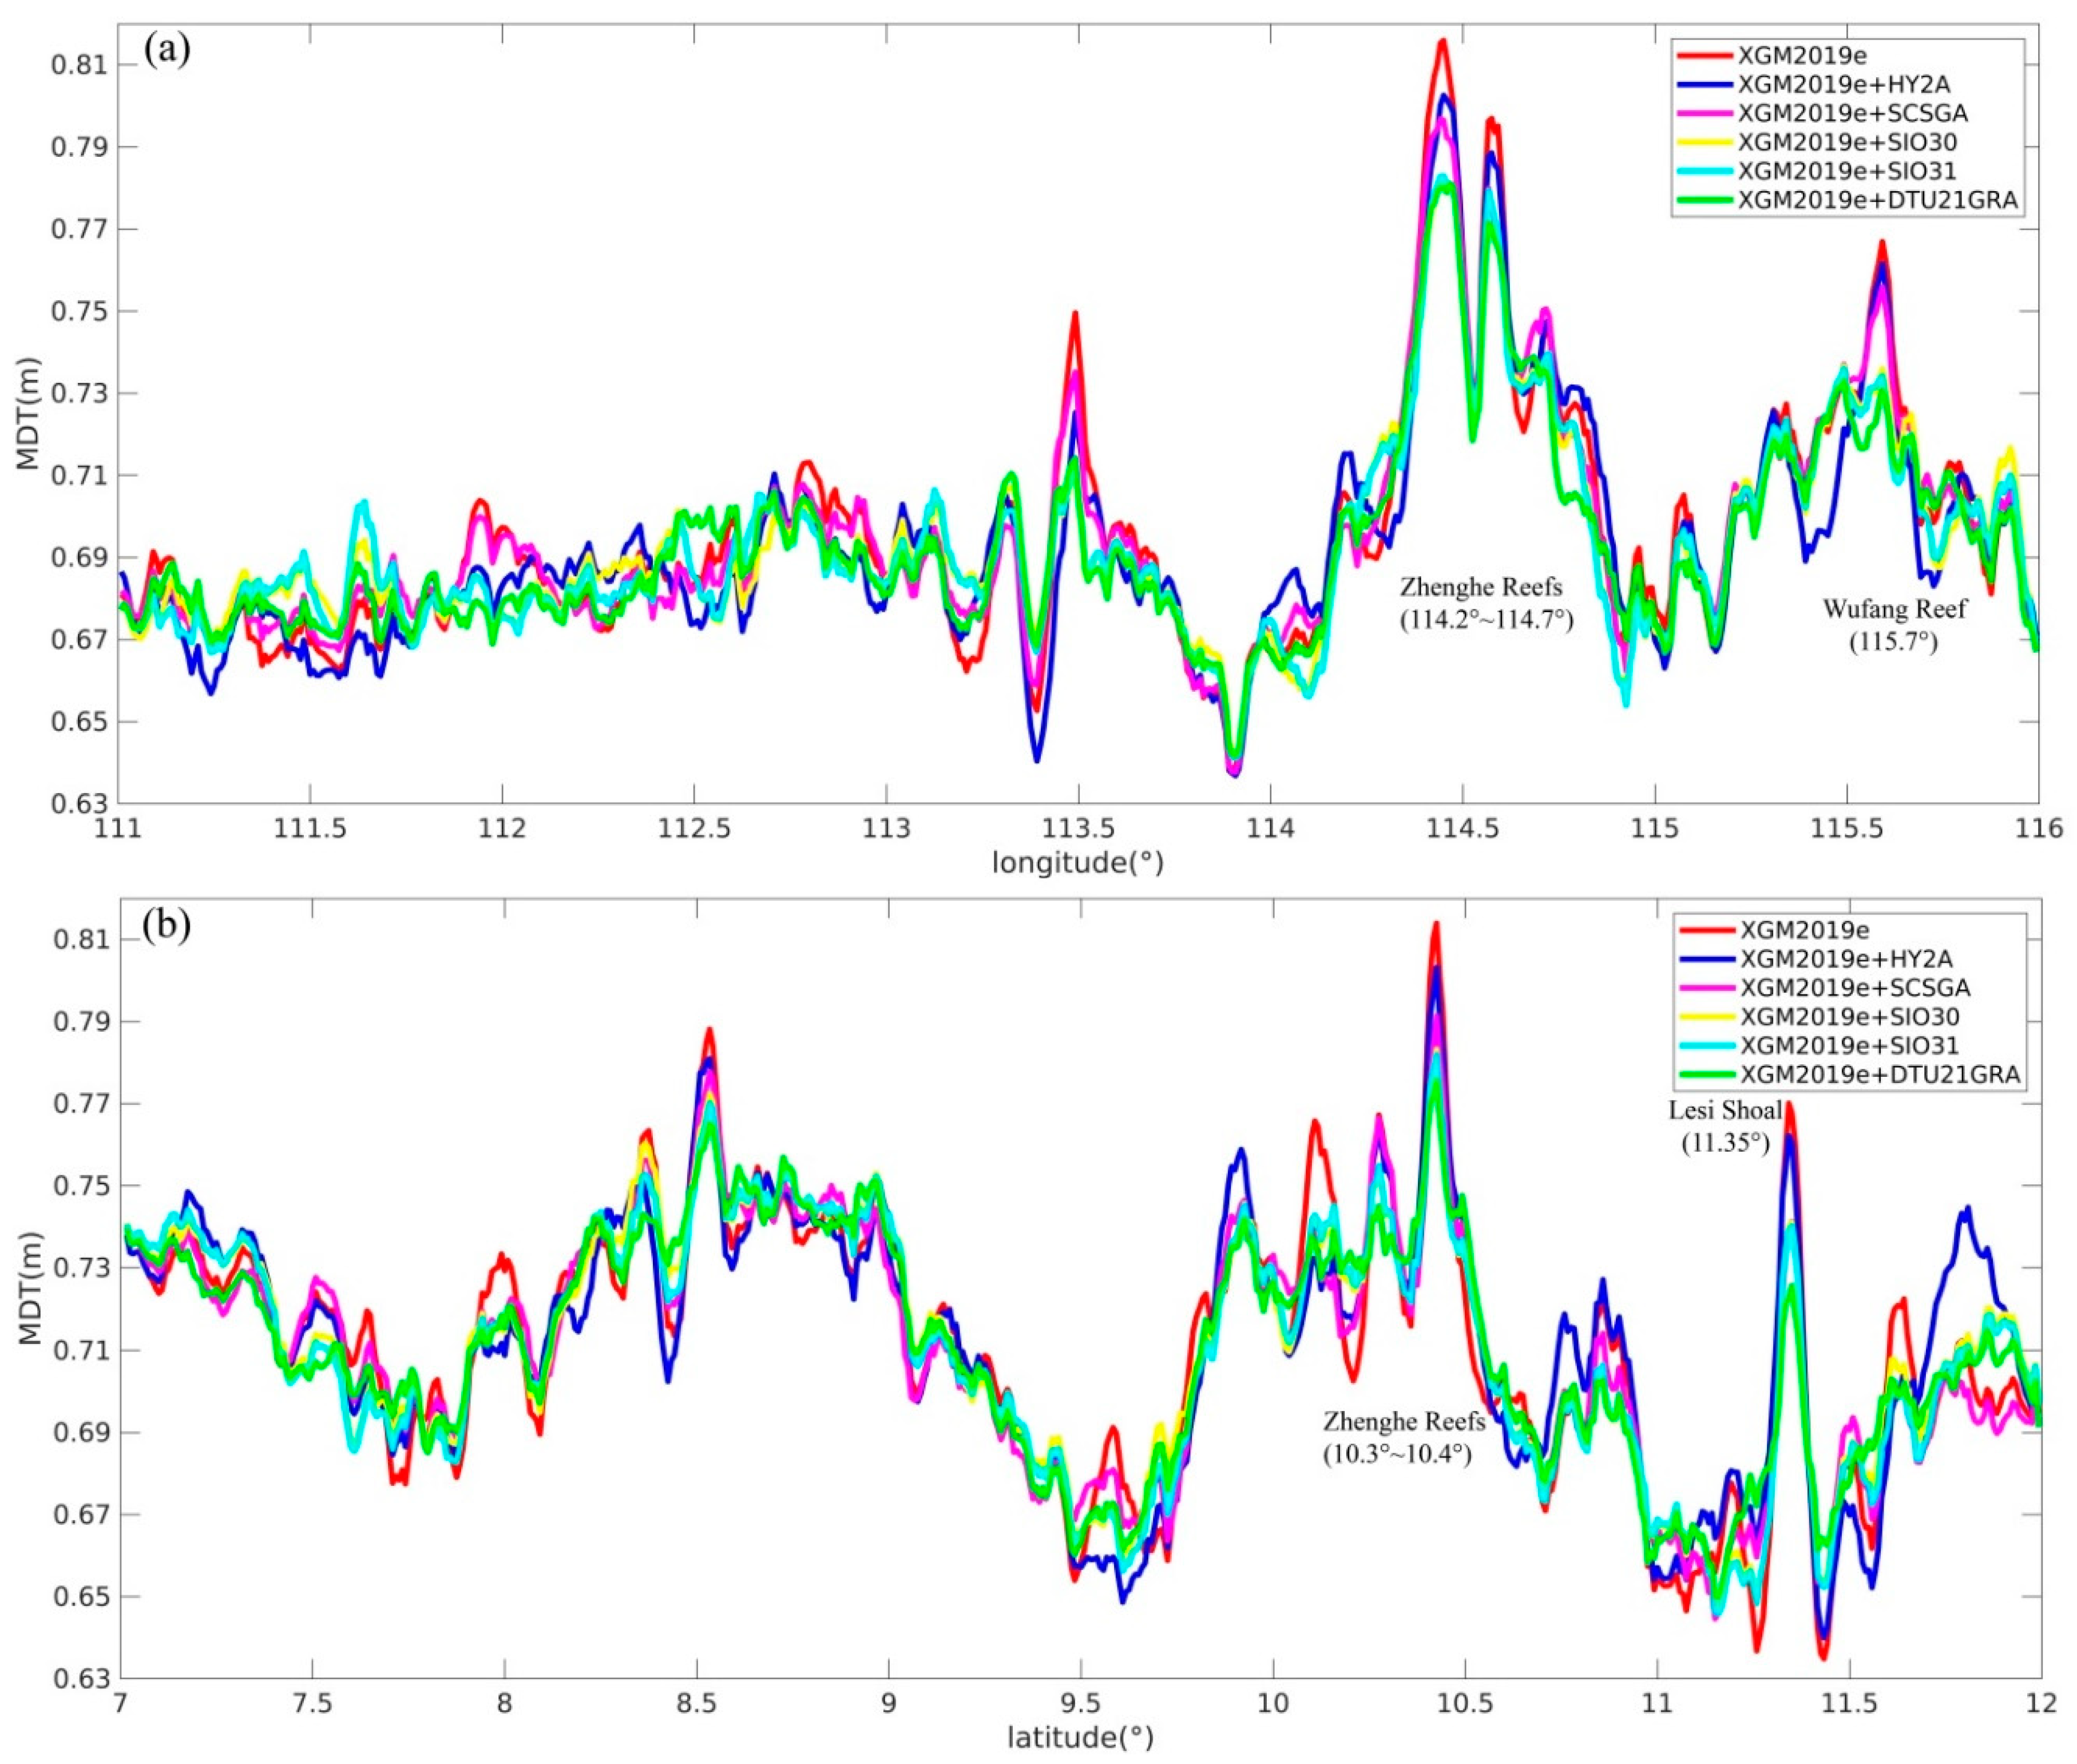
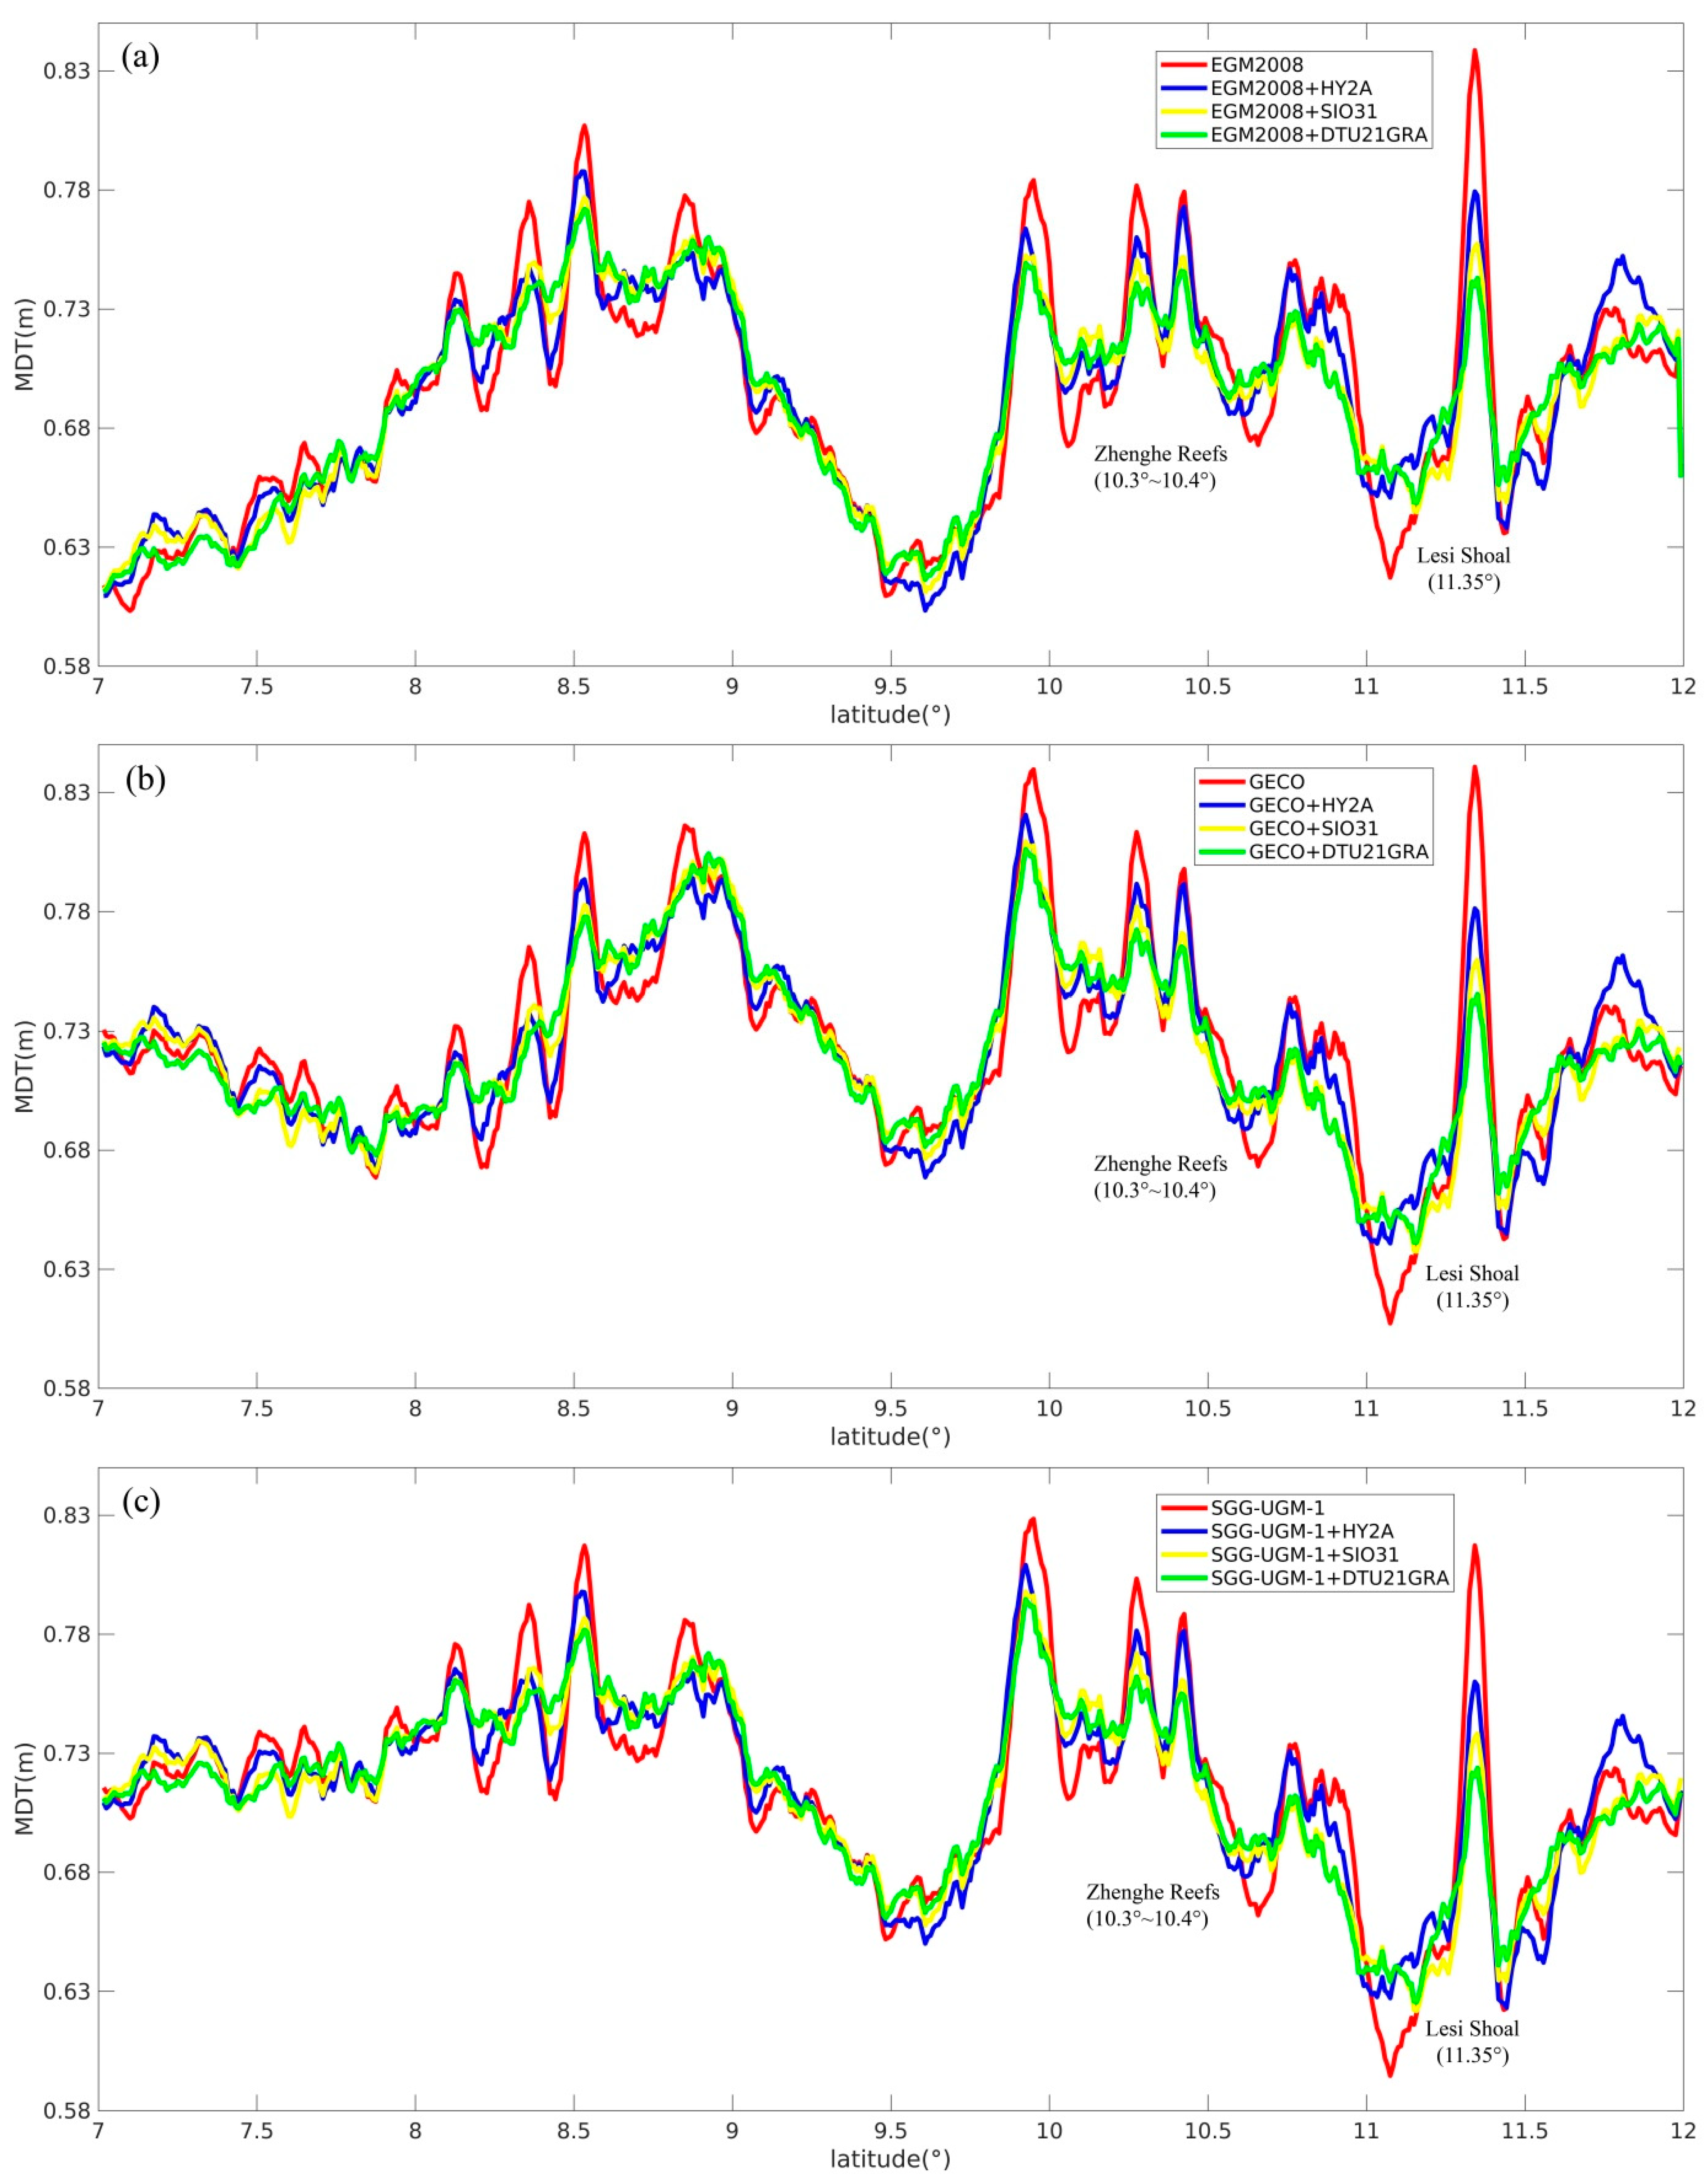
3.3. The MDTs Modeled with Different Reference Models

In addition, we research the performances of various satellite altimeter-derived gravity models in marine gravity field modeling based on heterogeneous reference models, where three combined models that have similar expansion degrees to XGM2019e_2159, i.e., EGM2008, SGG-UGM-1, and GECO, are introduced. EGM2008 (d/o 2190/2159) was computed by merging GRACE observations with ground-based gravity data [9]. Moreover, two models computed by combining GOCE gravity gradients, namely GECO (d/o 2190/2159) [11] and SGG-UGM-1 (d/o 2159/2159) [59], are used. The application of GOCE gradients enhanced the global gravity field at low-frequency bands, approximately from degree 30 to 220 [60].
Three representative altimetric gravity models, i.e., HY2A, SIO31, and DTU21GRA, are used, where HY2A represents the altimetric gravity model computed by only using the conventional radar altimeter data, and SIO31 and DTU21GRA represent the SAR-based altimetric gravity models. Figure 8 shows the MDTs modeled from different reference models; for all the MDTs directly modeled from the GGMs alone, we find dramatic variations over areas close to islands. The associated solution augmented by using HY2A demonstrates smaller turbulences in comparison with the MDTs directly derived from these GGMs. This is mainly due to the incorporation of heterogeneous satellite altimeter-derived gravity data in model development, where EGM2008/SGG-UGM-1/GECO was computed by involving DNSC07GRA data at short-wavelength over the SCS. However, limited high-quality altimeter data was used in developing DNSC07GRA, where no SARAL/AltiKa or CryoSat-2 data was included. In comparison, five years of CryoSat-2 data, two years of SARAL/AltiKa, and data from the HY-2A geodetic mission were included in the computation of the HY2A model, and, consequently, the HY2A model had improved accuracy versus DTU10GRA/DNSC07GRA [42]. The MDTs computed from the SIO31/DTU21GRA data further reduce these disturbances over island areas, by a magnitude of several centimeters, compared with the solutions modeled from the HY2A data. Moreover, the inconsistencies among the MDTs modeled from different reference models are prominent over the northern and eastern study area, owing to the heterogeneous data sources and modeling approaches adopted in those reference models’ computation.
Figure 9 and Figure 10 show the MDTs computed from different reference models along latitude 10.4° N and longitude 114.6° E, respectively. For all the MDTs, we see that the GGM-derived MDT has the largest variations, whereas the MDTs modeled additionally with the HY2A data reduces these disturbances: see the Zhenghe Reefs and Wufang Reef along latitude 10.4° N and the Zhenghe Reefs and Lesi Shoal along longitude 114.6° E. Moreover, the MDTs modeled from the SIO31/DTU21GRA data computed with the SAR altimetry data have less oscillations than those computed from the HY2A data. This is especially a case close to the Lesi Shoal along longitude 114.6° E, where the use of DTU21GRA data reduces the spikes significantly, by a magnitude larger than 10 cm and 4 cm, compared to the results computed from these GGMs alone and ones modeled by additionally combining the HY2A data, respectively. This also demonstrates that the use of altimetric gravity data computed with the SAR altimetry data can significantly enhance the marine gravity field, no matter which global geopotential model is applied for modeling.

4. Conclusions

In this study, the satellite altimeter-derived gravity models are used in marine gravity field augmentation over island areas; in particular, we study the feasibility of regional enhancement by using SAR-based gravity models. The gravity field modeling results in the Spratly Islands demonstrate that the incorporation of the newly published satellite altimeter-derived gravity observations strengthens the marine gravity field. By involving the gravity data computed with the Sentinel-3A/B SAR altimetry data, the accuracies of regional solutions (including quasi-geoid and MDT models) are dramatically improved, by a magnitude larger than 4 cm around areas close to islands, in comparison with the results directly derived from a newly released high-degree GGM, namely, XGM2019e_2159. This suggests that the newly published altimetric gravity models contain additional signals that were unresolved in the currently available GGMs.
Moreover, we model local gravity field based on heterogeneous combined GGMs. For all the solutions derived from the GGMs alone, significant variations are observed, which may bring about errors that are greater than 10 cm. These results show that the application of a GGM alone is inadequate in MDT modeling with centimeter-level accuracy over the areas close to land/island.
Further comparison of the solutions modeled from heterogeneous gravity models show that the performances of different models are heterogeneous, where the quasi-geoid/MDT solutions augmented with the SAR-based gravity models have better results. The use of the SAR-based gravity models in local augmentation improves the quasi-geoid/MDT solutions, by a magnitude of 2~4 cm, versus the solutions computed from the gravity models developed without SAR altimetry data. These results highlight the superiority of using the SAR-based altimetric gravity data in marine gravity field recovery, especially over the regions close to land/island. Moreover, the use of SAR altimetry data can alleviate the well-known coast problem, which also allays the issue of data scarcity in narrow/shallow waters. It is noticeable that the use of SAR-based altimetry data cannot fully overcome the coast problem; moreover, it also cannot replace the role of ground-based gravity data in gravity field modeling. By combing the ground-based gravity data, the local gravity field can be further improved.
Future work involves the further improvement of local gravity field model and the application of the model computed in this study in research fields such as geodesy and oceanography. By merging SAR altimeter records from the missions such as Sentinel-6 and using the improved waveform retracking methods, the local gravity field may be improved. Moreover, the quasi-geoid and mean dynamic topography models computed with the SAR altimetric gravity data are beneficial in understanding sea level change, ocean currents, and water exchanges with the surrounding regions close to the Spratly Islands. More importantly, these models are useful for establishing a unified vertical height datum over the Spratly Islands, where extensive coastlines and many islands exist, which make the traditionally used methods, such as the hydrostatic leveling, oceanic dynamic leveling, and trigonometric leveling methods, difficult to use for height datum unification.

Author Contributions

Conceptualization, Y.W. and A.A.; methodology, Y.W. and J.W.; software, Y.W.; validation, Y.W. and A.A.; formal analysis, Y.W.; writing—original draft preparation, Y.W.; writing—review and editing, Y.W. and H.S.; visualization, H.W. and H.S.; supervision, X.H. and Z.L.; project administration, Y.W. and Y.D.; funding acquisition, Y.W. All authors have read and agreed to the published version of the manuscript.

Funding

This research was funded by the National Natural Science Foundation of China, grant numbers 42004008, 41830110, 41931074, and 41974016; the Natural Science Foundation of Jiangsu Province, China, grant numbers BK20190498 and BK20190495; the Fundamental Research Funds for the Central Universities, grant number B210201013; the State Scholarship Fund from Chinese Scholarship Council, grant number 201306270014; and the Guangxi Key Laboratory of Spatial Information and Geomatics, grant number 19-185-10-06.

Institutional Review Board Statement

Not applicable.

Informed Consent Statement

Not applicable.

Data Availability Statement

The satellite altimetric gravity models and mean sea surface models that developed at DTU space are available on https://ftp.space.dtu.dk/pub, accessed on 28 November 2021, and the altimetric gravity models computed by the Scripps Institution of Oceanography are freely accessible at https://topex.ucsd.edu/pub/global_grav_1min, accessed on 28 November 2021. All the global geopotential models can be publicly accessed from http://icgem.gfz-potsdam.de/home, accessed on 28 November 2021.

Acknowledgments

The authors would like to give our sincerest thanks to the three anonymous reviewers for their constructive suggestions and comments, which are of great value for improving the manuscript. The authors also thank the Editor for the kind assistances and beneficial comments. The authors are grateful for the kind support from the editorial office. We gratefully acknowledge the funders of this study.

Conflicts of Interest

The authors declare no conflict of interest.

References

  1. Tapley, B.D.; Chambers, D.P.; Bettadpur, S.; Ries, J.C. Large scale ocean circulation from the GRACE GGM01 geoid. Geophys. Res. Lett. 2003, 30, 2163. [Google Scholar] [CrossRef] [Green Version]
  2. Tapley, B.D.; Bettadpur, S.; Watkins, M.; Reigber, C. The gravity recovery and climate experiment: Mission overview and early results. Geophys. Res. Lett. 2004, 31, L09607. [Google Scholar] [CrossRef] [Green Version]
  3. Pail, R.; Bruinsma, S.; Migliaccio, F.; Förste, C.; Goiginger, H.; Schuh, W.D.; Höck, E.; Reguzzoni, M.; Brockmann, J.M.; Abrikosov, O.; et al. First GOCE gravity field models derived by three different approaches. J. Geod. 2011, 85, 819–843. [Google Scholar] [CrossRef] [Green Version]
  4. Pail, R.; Goiginger, H.; Schuh, W.-D.; Höck, E.; Brockmann, J.M.; Fecher, T.; Gruber, T.; Mayer-Gürr, T.; Kusche, J.; Jäggi, A.; et al. Combined satellite gravity field model GOCO01S derived from GOCE and GRACE. Geophys. Res. Lett. 2010, 37, L20314. [Google Scholar] [CrossRef]
  5. Bruinsma, S.L.; Förste, C.; Abrikosov, O.; Marty, J.C.; Rio, M.H.; Mulet, S.; Bonvalot, S. The new ESA satellite-only gravity field model via the direct approach. Geophys. Res. Lett. 2013, 40, 3607–3612. [Google Scholar] [CrossRef] [Green Version]
  6. Brockmann, J.M.; Schubert, T.; Schuh, W.D. An improved model of the Earth’s static gravity field solely derived from reprocessed GOCE Data. Surv. Geophys. 2021, 42, 277–316. [Google Scholar] [CrossRef]
  7. Brockmann, J.M.; Zehentner, N.; Höck, E.; Pail, R.; Loth, I.; Mayer-Gürr, T.; Schuh, W.-D. EGM_TIM_RL05: An independent geoid with centimeter accuracy purely based on the GOCE mission. Geophys. Res. Lett. 2014, 41, 8089–8099. [Google Scholar] [CrossRef]
  8. Kvas, A.; Brockmann, J.M.; Krauss, S.; Schubert, T.; Gruber, T.; Meyer, U.; Mayer-Gürr, T.; Schuh, W.D.; Jäggi, A.; Pail, R. GOCO06s—A satellite-only global gravity field model. Earth Syst. Sci. Data 2021, 13, 99–118. [Google Scholar] [CrossRef]
  9. Pavlis, N.K.; Holmes, S.A.; Kenyon, S.C.; Factor, J.K. The development and evaluation of Earth Gravitational Model (EGM2008). J. Geophys. Res. Solid Earth 2012, 117, B04406, Erratum in J. Geophys. Res. Solid Earth. 2013, 118, 2633. [Google Scholar] [CrossRef] [Green Version]
  10. Förste, C.; Bruinsma, S.L.; Abrikosov, O.; Lemoine, J.M.; Schaller, T.; Götze, H.J.; Ebbing, J.; Marty, J.C.; Flechtner, F.; Balmino, G.; et al. EIGEN-6C4 The latest combined global gravity field model including GOCE data up to degree and order 2190 of GFZ Potsdam and GRGS Toulouse. In Proceedings of the 5th GOCE User Workshop, Paris, France, 25–28 November 2014. [Google Scholar]
  11. Gilardoni, M.; Reguzzoni, M.; Sampietro, D. GECO: A global gravity model by locally combining GOCE data and EGM2008. Stud. Geophys. Geod. 2015, 60, 228–247. [Google Scholar] [CrossRef]
  12. Fecher, T.; Pail, R.; Gruber, T. GOCO05c: A new combined gravity field model based on full normal equations and regionally varying weighting. Surv. Geophys. 2017, 38, 571–590. [Google Scholar] [CrossRef]
  13. Zingerle, P.; Pail, R.; Gruber, T.; Oikonomidou, X. The combined global gravity field model XGM2019e. J. Geod. 2020, 94, 66. [Google Scholar] [CrossRef]
  14. Schwabe, J.; Scheinert, M. Regional geoid of the Weddell Sea, Antarctica, from heterogeneous ground-based gravity data. J. Geod. 2014, 88, 821–838. [Google Scholar] [CrossRef]
  15. Deng, X.; Featherstone, W.E. A coastal retracking system for satellite radar altimeter waveforms: Application to ERS2 around Australia. J. Geophys. Res. Oceans 2006, 111, C06012. [Google Scholar] [CrossRef] [Green Version]
  16. Andersen, O.B.; Scharroo, R. Range and geophysical corrections in coastal regions: And implications for mean sea surface determination. In Coastal Altimetry; Vignudelli, S., Ed.; Springer: Berlin/Heidelberg, Germany, 2011. [Google Scholar]
  17. Abulaitijiang, A.; Andersen, O.B.; Stenseng, L. Coastal sea level from inland CryoSat-2 interferometric SAR altimetry. Geophys. Res. Lett. 2015, 42, 1841–1847. [Google Scholar] [CrossRef]
  18. Idžanović, M.; Ophaug, V.; Andersen, O.B. The coastal mean dynamic topography in Norway observed by CryoSat-2 and GOCE. Geophys. Res. Lett. 2017, 44, 5609–5617. [Google Scholar] [CrossRef] [Green Version]
  19. McAdoo, D.C.; Farrell, S.L.; Laxon, S.; Ridout, A.; Zwally, H.J.; Yi, D. Gravity of the Arctic Ocean from satellite data with validations using airborne gravimetry: Oceanographic implications. J. Geophys. Res. Oceans 2013, 118, 917–930. [Google Scholar] [CrossRef]
  20. Wu, Y.; Abulaitijiang, A.; Featherstone, W.E.; McCubbine, J.C.; Andersen, O.B. Coastal gravity field refinement by combining airborne and ground-based data. J. Geod. 2019, 93, 2569–2584. [Google Scholar] [CrossRef]
  21. Farrell, S.L.; McAdoo, D.C.; Laxon, S.W.; Zwally, H.J.; Yi, D.; Ridout, A.; Giles, K. Mean dynamic topography of the Arctic Ocean. Geophys. Res. Lett. 2012, 39, L01601. [Google Scholar] [CrossRef] [Green Version]
  22. Skourup, H.; Farrell, S.L.; Hendricks, S.; Ricker, R.; Armitage, T.W.K.; Ridout, A.; Anderson, O.B.; Haas, C.; Baker, S. An assessment of state-of-the-art mean sea surface and geoid models of the Arctic Ocean: Implications for sea ice freeboard retrieval. J. Geophys. Res. Oceans 2017, 122, 8593–8613. [Google Scholar] [CrossRef] [Green Version]
  23. Sandwell, D.T.; Garcia, E.; Soofi, K.; Wessel, P.; Smith, W.H.F. Towards 1mGal global marine gravity from CryoSat-2, Envisat, and Jason-1. Lead. Edge 2013, 32, 892–899. [Google Scholar] [CrossRef] [Green Version]
  24. Sandwell, D.T.; Müller, R.D.; Smith, W.H.F.; Garcia, E.; Francis, R. New global marine gravity model from CryoSat-2 and Jason-1 reveals buried tectonic structure. Science 2014, 346, 65–67. [Google Scholar] [CrossRef] [PubMed]
  25. Garcia, E.S.; Sandwell, D.T.; Smith, W.H.F. Retracking CryoSat-2, Envisat and Jason-1 radar altimetry waveforms for improved gravity field recovery. Geophys. J. Int. 2014, 196, 1402–1422. [Google Scholar] [CrossRef] [Green Version]
  26. Aldarias, A.; Gomez-Enri, J.; Laiz, I.; Tejedor, B.; Cipollini, P. Validation of Sentinel-3A SRAL Coastal Sea Level Data at High Posting Rate: 80 Hz. IEEE Trans. Geosci. Remote Sens. 2020, 58, 3809–3821. [Google Scholar] [CrossRef]
  27. Wingham, D.J.; Francis, C.R.; Baker, S.; Bouzinac, C.; Cullen, R.; de Chateau-Thierry, P.; Laxon, S.W.; Mallow, U.; Mavrocordatos, C.; Phalippou, L.; et al. CryoSat: A mission to determine the fluctuations in Earth’s land and marine ice fields. Adv. Space Res. 2006, 37, 841–871. [Google Scholar] [CrossRef]
  28. Calafat, F.M.; Cipollini, P.; Bouffard, J.; Snaith, H.; Féménias, P. Evaluation of new cryosat-2 products over the ocean. Remote Sens. Environ. 2017, 191, 131–144. [Google Scholar] [CrossRef]
  29. García, P.; Martin-Puig, C.; Roca, M. SARin mode, and a window delay approach, for coastal altimetry. Adv. Space Res. 2018, 62, 1358–1370. [Google Scholar] [CrossRef]
  30. Boy, F.; Desjonquères, J.D.; Picot, N.; Moreau, T.; Raynal, M. CryoSat-2 SAR-mode over oceans: Processing methods, global assessment, and benefits. IEEE Trans. Geosci. Remote Sens. 2017, 55, 148–158. [Google Scholar] [CrossRef]
  31. Dinardo, S.; Fenoglio-Marc, L.; Buchhaupt, C.; Becker, M.; Scharroo, R.; Fernandes, M.J.; Benveniste, J. Coastal SAR and PLRM altimetry in German Bight and west Baltic Sea. Adv. Space Res. 2018, 62, 1371–1404. [Google Scholar] [CrossRef]
  32. Peng, F.; Deng, X. Validation of Sentinel-3A SAR mode sea level anomalies around the Australian coastal region. Remote Sens. Environ. 2020, 237, 111548. [Google Scholar] [CrossRef]
  33. Nielsen, K.; Stenseng, L.; Andersen, O.B.; Villadsen, H.; Knudsen, P. Validation of cryosat-2 sar mode based lake levels. Remote Sens. Environ. 2015, 171, 162–170. [Google Scholar] [CrossRef] [Green Version]
  34. Cipollini, P.; Calafat, F.M.; Jevrejeva, S.; Melet, A.; Prandi, P. Monitoring sea level in the coastal zone with satellite altimetry and tide gauges. Surv. Geophys. 2017, 38, 33–57. [Google Scholar] [CrossRef] [Green Version]
  35. Kleinherenbrink, M.; Naeije, M.; Slobbe, C.; Egido, A.; Smith, W. The performance of CryoSat-2 fully-focussed SAR for inland water-level estimation. Remote Sens. Environ. 2020, 237, 111589. [Google Scholar] [CrossRef]
  36. Andersen, O.B.; Knudsen, P. The DTU17 Global Marine Gravity Field: First Validation Results. In International Association of Geodesy Symposia; Springer: Berlin/Heidelberg, Germany, 2019. [Google Scholar]
  37. Weatherall, P.; Marks, K.M.; Jakobsson, M.; Schmitt, T.; Tani, S.; Arndt, J.E.; Rovere, M.; Chayes, D.; Ferrini, V.; Wigley, R. A new digital bathymetric model of the world’s oceans. Earth Space Sci. 2015, 2, 331–345. [Google Scholar] [CrossRef]
  38. Dong, Y.; Liu, Y.; Hu, C.; Xu, B. Coral reef geomorphology of the spratly islands: A simple method based on time-series of landsat-8 multi-band inundation maps. ISPRS J. Photogramm. Remote Sens. 2019, 157, 137–154. [Google Scholar] [CrossRef]
  39. Andersen, O.B.; Knudsen, P.; Kenyon, S.; Factor, J.K.; Holmes, S. The DTU13 Global marine gravity field—First evaluation. In Proceedings of the OSTST Meeting, Boulder, CO, USA, 8–11 October 2013. [Google Scholar]
  40. Sandwell, D.T.; Harper, H.; Tozer, B.; Smith, W.H.F. Gravity field recovery from geodetic altimeter missions. Adv. Space Res. 2021, 68, 1059–1072. [Google Scholar] [CrossRef]
  41. Zhu, C.; Guo, J.; Gao, J.; Liu, X.; Hwang, C.; Yu, S.; Yuan, J.; Ji, B.; Guan, B. Marine gravity determined from multi-satellite GM/ERM altimeter data over the South China Sea: SCSGA V1.0. J. Geod. 2020, 94, 50. [Google Scholar] [CrossRef]
  42. Zhang, S.; Andersen, O.B.; Kong, X.; Li, H. Inversion and validation of improved marine gravity field recovery in south china sea by incorporating HY-2A altimeter waveform data. Remote Sens. 2020, 12, 802. [Google Scholar] [CrossRef] [Green Version]
  43. Omang, O.C.D.; Forsberg, R. How to handle topography in practical geoid determination: Three examples. J. Geod. 2000, 74, 458–466. [Google Scholar] [CrossRef]
  44. Featherstone, W.E.; McCubbine, J.C.; Brown, N.J.; Claessens, S.J.; Filmer, M.S.; Kirby, J.F. The first Australian gravimetric quasigeoid model with location-specific uncertainty estimates. J. Geod. 2018, 92, 149–168. [Google Scholar] [CrossRef] [Green Version]
  45. Forsberg, R. A Study of Terrain Reductions, Density Anomalies and Geophysical Inversion Methods in Gravity Field Modelling; Report No. 355; Department of Geodetic Science and Surveying, The Ohio State University: Colombus, OH, USA, 1984. [Google Scholar]
  46. Zingerle, P.; Pail, R.; Gruber, T.; Oikonomidou, X. The Experimental Gravity Field Model XGM2019e; GFZ Data Services: Potsdam, Germany, 2019. [Google Scholar] [CrossRef]
  47. Wu, Y.; He, X.; Luo, Z.; Shi, H. An Assessment of Recently Released High-Degree Global Geopotential Models Based on Heterogeneous Geodetic and Ocean Data. Front. Earth Sci. 2021, 9, 749611. [Google Scholar] [CrossRef]
  48. Wu, Y.; Zhou, H.; Zhong, B.; Luo, Z. Regional gravity field recovery using the GOCE gravity gradient tensor and heterogeneous gravimetry and altimetry data. J. Geophys. Res. Solid Earth 2017, 122, 6928–6952. [Google Scholar] [CrossRef]
  49. Wu, Y.; Luo, Z.; Chen, W.; Chen, Y. High-resolution regional gravity field recovery from Poisson wavelets using heterogeneous observational techniques. Earth Planets Space 2017, 69, 1–15. [Google Scholar] [CrossRef] [Green Version]
  50. Klees, R.; Tenzer, R.; Prutkin, I.; Wittwer, T. A data-driven approach to local gravity field modelling using spherical radial basis functions. J. Geod. 2008, 82, 457–471. [Google Scholar] [CrossRef] [Green Version]
  51. Becker, S.; Brockmann, J.M.; Schuh, W.D. Mean dynamic topography estimates purely based on GOCE gravity field models and altimetry. Geophys. Res. Lett. 2014, 41, 2063–2069. [Google Scholar] [CrossRef]
  52. Bingham, R.J.; Knudsen, P.; Andersen, O.B.; Pail, R. An initial estimate of the North Atlantic steady-state geostrophic circulation from GOCE. Geophys. Res. Lett. 2011, 38, L01606. [Google Scholar] [CrossRef] [Green Version]
  53. Rio, M.H.; Guinehut, S.; Larnicol, G. New CNES-CLS09 global mean dynamic topography computed from the combination of GRACE data, altimetry, and in situ measurements. J. Geophys. Res. Oceans 2011, 116, C07018. [Google Scholar] [CrossRef]
  54. Rio, M.H.; Mulet, S.; Picot, N. Beyond GOCE for the ocean circulation estimate: Synergetic use of altimetry, gravimetry, and in situ data provides new insight into geostrophic and Ekman currents. Geophys. Res. Lett. 2014, 41, 8918–8925. [Google Scholar] [CrossRef]
  55. Tenzer, R.; Foroughi, I. Effect of the Mean Dynamic Topography on the Geoid-to-Quasigeoid Separation Offshore. Mar. Geod. 2018, 41, 368–381. [Google Scholar] [CrossRef]
  56. Andersen, O.B.; Abulaitijiang, A.; Zhang, S.; Rose, S.K. A new high resolution Mean Sea Surface (DTU21MSS) for improved sea level monitoring. In Proceedings of the EGU General Assembly (EGU21-16084), Vienna, Austria, 19–30 April 2021. [Google Scholar] [CrossRef]
  57. Andersen, O.B.; Knudsen, P.; Stenseng, L. A New DTU18 MSS Mean Sea Surface–Improvement from SAR Altimetry. In Proceedings of the 25 Years of Progress in Radar Altimetry Symposium, Ponta Delgada, Portugal, 24–29 September 2018. [Google Scholar]
  58. Wu, Y.; Abulaitijiang, A.; Andersen, O.B.; He, X.; Luo, Z.; Wang, H. Refinement of mean dynamic topography over island areas using airborne gravimetry and satellite altimetry data over the northern of South China Sea. J. Geophys. Res. Solid Earth 2021, 126, e2021JB021805. [Google Scholar] [CrossRef]
  59. Liang, W.; Xu, X.; Li, J.; Zhu, G. The determination of an ultra-high gravity field model SGG-UGM-1 by combining EGM2008 gravity anomaly and GOCE observation data. Acta Geod. Cartogr. Sin. 2018, 47, 425–434. [Google Scholar] [CrossRef]
  60. Gruber, T.; Rummel, R.; Abrikosov, O.; Hees, V.R. GOCE Level 2 Product Data Handbook, GO-MA-HPF-GS-0110. 2014. Issue 4.2. Available online: https://earth.esa.int/documents/10174/1650485/GOCE_Product_Data_Handbook_Level-2 (accessed on 28 November 2021).
Figure 1. (a) Study area and (b) the primary islands of the Spratly Islands. The geographical coordinates are expressed in the Plate Carrée projection.
Remotesensing 14 00474 g001
Figure 2. The added signals in terms of quasi-geoid heights derived from (a) DTU13GRA, (b) DTU15GRA, (c) DTU17GRA, and (d) DTU21GRA. The geographical coordinates are expressed in the Plate Carrée projection. Note: only DTU21GRA was computed with the SAR altimetry data derived from Sentinel-3A/B over the Spratly Islands.
Remotesensing 14 00474 g002
Figure 3. MDT modeled with the quasi-geoid computed from (a) XGM2019e_2159, (b) DTU13GRA, (c) DTU15GRA, (d) DTU17GRA, and (e) DTU21GRA. The geographical coordinates are expressed in the Plate Carrée projection. Note: only DTU21GRA was computed with the SAR altimetry data derived from Sentinel-3A/B over the study area.
Remotesensing 14 00474 g003
Figure 4. Profiles of various MDTs computed from different gravity field models along latitude 10.4° N (a) and longitude 114.6° E (b). Note: only DTU21GRA was computed with the SAR altimeter data over the study area.
Remotesensing 14 00474 g004
Figure 5. The added signals in terms of quasi-geoid heights modeled with (a) HY2A, (b) SCSGA, (c) SIO30, (d) SIO31, and (e) DTU21GRA. The geographical coordinates are expressed in the Plate Carrée projection. Note: only SIO30, SIO31, and DTU21GRA were computed with the SAR altimetry data derived from Sentinel-3A/B over the study area.
Remotesensing 14 00474 g005
Figure 6. MDTs derived from the quasi-geoid model computed from (a) XGM2019e_2159, (b) HY2A, (c) SCSGA, (d) SIO30, (e) SIO31, and (f) DTU21GRA. The geographical coordinates are expressed in the Plate Carrée projection. Note: only SIO30, SIO31, and DTU21GRA were computed with the SAR altimetry data derived from Sentinel-3A/B over the study area.
Remotesensing 14 00474 g006
Figure 7. Profiles of various MDTs modeled with different altimetric gravity models along latitude 10.4° N (a) and longitude 114.6° E (b).
Remotesensing 14 00474 g007
Figure 8. MDTs derived from various satellite altimeter-derived gravity models when different global geopotential models are used as the reference models. The first, second, and third rows are the solutions modeled when EGM2008, GECO, and SGG-UGM-1 are used as reference models, respectively. The first column (a,e,i) demonstrates the solutions modeled with different global geopotential models (up to the maximal d/o), the second column (b,f,j) manifests the solutions enhanced by HY2A, the third column (c,g,k) displays the solutions strengthened by SIO31, and the fourth column (d,h,l) shows the solutions augmented by DTU21GRA. The geographical coordinates are expressed in the Plate Carrée projection.
Remotesensing 14 00474 g008
Figure 9. Profiles of the MDTs modeled with (a) EGM2008, (b) GECO, and (c) SGG-UGM-1 based on different altimetric gravity models along latitude 10.4° N.
Remotesensing 14 00474 g009
Figure 10. Profiles of the MDTs modeled with (a) EGM2008, (b) GECO, and (c) SGG-UGM-1 based on different altimetric gravity models along longitude 114.6° N.
Remotesensing 14 00474 g010
Table 1. Description of the selected satellite altimeter-derived marine gravity field models.
ModelYearReference Gravity Field and Reference Mean Dynamic TopographyData Used in Model DevelopmentIs This Model Used for Regional Gravity Field Enhancement?
DTU13GRA2013EGM2008+DOT2008The modeling of DTU13GRA additionally involved data from CryoSat-2 and Jason-1, compared to its predecessor, i.e., DTU10GRA, which was derived by combining data from Topex/Poseidon (T/P), Geosat, ICESat, Jason-1, GFO, Envisat, and retracked data from ERS-1.Yes
DTU15GRA2015EGM2008+DOT2008Added more data from Geosat, ERS-1, Cryosat-2, and Jason-1.Yes
DTU17GRA2017EGM2008+DOT2008Added more CryoSat-2 data and SARAL/AltiKa data from 2016 to 2017 in the geodetic phase.Yes
DTU21GRA2021EGM2008+DOT2008The major improvement of DTU21GRA over DTU17GRA is that 5 years of Sentinel-3A and 3 years of Sentinel-3B and reprocessed Cryosat-2 data (processed with the SAMOSA+ physical retracker) were added. Yes
SIO V23.12013EGM2008+DOT2008This model was derived by incorporating data from T/P, Geosat, Envisat, Jason-1, ERS-1/2, and CryoSat-2. No
SIO V28.12019EGM2008+DOT2008Involved more data from Jason-2 and Cryosat-2 and added data from SARAL/Altika. No
SIO V29.12019EGM2008+DOT2008Included 2 years data from Sentinel-3A/B. No
SIO V30.12020EGM2008+DOT2008Involved data from SARAL/Altika as well as more data from Cryosat-2 and Sentinel-3A/B. Yes
SIO V31.12021EGM2008+DOT2008Included more data from Cryosat-2, SARAL/Altika, and Sentinel-3A/B. Yes
SCSGA V1.02020EGM2008+CNES-CLS13MDTIncluded data from T/P, GFO, ERS-1/2, Envisat, Jason-1/2, HY-2A, CryoSat-2, and SARAL/AltiKa. Yes
HY-2A V1.02020EGM2008+DOT2008This model was developed by incorporating data from HY-2A and data from T/P, Geosat, Jason-1, Envisat, ERS-1/2, CryoSat-2, and SARAL/AltiKa.Yes
Table 2. Statistics of the residual quasi-geoid heights derived from various satellite altimeter-derived gravity models developed at DTU space (units: cm).
MaxMinMeanSD
DTU13GRA3.4−3.20.00.6
DTU15GRA4.0−3.00.00.6
DTU17GRA4.8−3.40.00.7
DTU21GRA5.3−5.2−0.01.0
Table 3. Statistics of the residual quasi-geoid signals modeled with heterogeneous gravity models (units: cm).
MaxMinMeanSD
HY2A 5.5−7.0−0.01.2
SCSGA 4.4−4.20.00.6
SIO306.0−5.4−0.01.0
SIO316.2−5.6−0.01.0
DTU21GRA5.3−5.2−0.01.0
Publisher’s Note: MDPI stays neutral with regard to jurisdictional claims in published maps and institutional affiliations.

