Article

Internal Geometric Quality Improvement of Optical Remote Sensing Satellite Images with Image Reorientation

1
School of Computer Science, Hubei University of Technology, Wuhan 430068, China
2
Beijing Institute of Space Mechanics & Electricity, Beijing 100076, China
3
Northwest Engineering Corporation Limited, Power China Group, Xi’an 710064, China
*
Author to whom correspondence should be addressed.
Remote Sens. 2022, 14(3), 471; https://doi.org/10.3390/rs14030471
Submission received: 9 December 2021 / Revised: 13 January 2022 / Accepted: 17 January 2022 / Published: 19 January 2022

Abstract

:
When the in-orbit geometric calibration of optical satellite cameras is not performed in a precise or timely manner, optical remote sensing satellite images (ORSSIs) are produced with inaccurate camera parameters. The internal orientation (IO) biases of ORSSIs caused by inaccurate camera parameters show a discontinuous distorted characteristic and cannot be compensated by a simple orientation model. The internal geometric quality of ORSSIs will, therefore, be worse than expected. In this study, from the ORSSI users’ perspective, a feasible internal geometric quality improvement method is presented for ORSSIs with image reorientation. In the presented method, a sensor orientation model, an external orientation (EO) model, and an IO model are successively established. Then, the EO and IO model parameters are estimated with ground control points. Finally, the original image is reoriented with the estimated IO model parameters. Ten HaiYang-1C coastal zone imager (CZI) images, a ZiYuan-3 02 nadir image, a GaoFen-1B panchromatic image, and a GaoFen-1D panchromatic image, were tested. The experimental results showed that the IO biases of ORSSIs caused by inaccurate camera parameters could be effectively eliminated with the presented method. The IO accuracies of all the tested images were improved to better than 1.0 pixel.

Graphical Abstract

1. Introduction

The sensor orientation accuracy is a very important indicator to measure the geometric quality of optical remote sensing satellite images (ORSSIs). Sensor orientation can mainly be divided into two categories: external orientation (EO) and internal orientation (IO). Usually, EO represents the sensor orientation of a satellite camera as a whole. It is defined by a single vector in a camera reference frame and is the main contributor to the sensor orientation accuracy. IO refers to the internal geometric parameters of the satellite camera and gives the exact coordinates of each individual pixel in the camera’s reference frame. The external geometric quality of ORSSIs often refers to an EO accuracy, and the internal geometric quality often refers to an IO accuracy. In practice, both the external and internal geometric qualities of ORSSIs can be achieved by a physical sensor model (PSM) or an alternative rational function model (RFM).
The external geometric quality of ORSSIs is mainly determined by the observation accuracy of satellite positions and attitudes. The EO biases caused by satellite position and attitude errors are often simple. A shift model, an affine transformation model, or a quadratic polynomial model is, therefore, sufficient to compensate the biases in both the PSM and the RFM with few ground-control points (GCPs) [1,2,3,4,5,6]. The external geometric quality plays a very import role in global mapping, because it is very difficult or even impossible to collect worldwide GCPs. The IO biases of ORSSIs are more complicated than the EO biases. The factors affecting the internal geometric quality include satellite attitude jitters, camera distortions, multiple-charge-coupled device (CCD) misalignments, focal length errors, etc. [7,8,9]. The IO biases of ORSSIs that are caused by these factors often cannot be effectively modeled and compensated by a simple orientation model in the whole image [9,10,11,12].
The internal geometric quality of ORSSIs directly affects the geometric quality of geospatial information products (e.g., digital orthophoto maps (DOMs) and digital elevation models (DEMs)) derived from ORSSIs [13,14]. In order to improve the internal geometric quality of ORSSIs, researchers have conducted many studies and achieved many impressive results. For example, in terms of satellite attitude jitters, Wang et al. presented a distortion correction method for ZiYuan-3 satellite images based on virtual steady reimaging [15]. Teshima and Iwasaki presented a satellite attitude jitter correction method for the Terra spacecraft using ASTER/SWIR images with parallax observation [16]. Cao et al. presented a nonlinear bias compensation method for ZiYuan-3 satellite images with cubic splines [17]. Tong et al. presented a detection and estimation method for ZiYuan-3 three-line array image distortions caused by satellite attitude jitters [18]. Zhang et al. presented an attitude jitter compensation method for remote sensing images using a convolutional neural network [19]. With the help of these methods, the negative influence of satellite attitude jitters could often be effectively eliminated and the internal geometric quality of ORSSIs could be obviously improved.
With the exception of satellite attitude jitters, the internal geometric quality degradation of ORSSIs caused by camera distortions, multiple CCD misalignments, and focal length errors is actually caused by inaccurate camera parameters. As long as the above influence factors are modeled by proper camera models and camera parameters determined in a are timely and precise manner, the internal geometric quality of ORSSIs can often be improved. At present, the in-orbit geometric calibration of optical satellite cameras is a widely used method to obtain accurate camera parameters. In fact, in order to improve the internal geometric quality of ORSSIs, many in-orbit geometric calibration methods have been developed. The majority of optical satellite cameras were geometrically calibrated during the whole in-orbit life of optical satellites. For example, Gachet detailed an accurate interior parameter determination method for SPOT-5 HRG and HRS cameras [20]. Leprince et al. described a generalized internal calibration method for any pushbroom cameras and particularly focused on the distortions caused by CCD misalignments [21]. Radhadevi and Solanki discussed the individual sensor alignment calibration, inter-camera alignment calibration, and focal-plane calibration of different IRS-P6 cameras [22]. Cao et al. presented an in-orbit geometric calibration method for ZiYuan-3 three-line cameras based on CCD-detector look angles [23]. Wang et al. presented a generalized external and internal calibration method for optical satellite cameras, and the presented method was successfully used by many Chinese optical satellites, such as ZiYuan-3, ZiYuan-1 02C, and GaoFen-1/2/6 satellites [9,24,25,26]. It is noted that in-orbit geometric calibration can only calibrate the static geometric parameters, such as camera installation angles and camera distortions. The dynamic part of the geometric model errors (e.g., satellite attitude jitters) often differs for different ORSSIs. These variable errors should be compensated before the geometric calibration.
With the help of in-orbit geometric calibration, the internal geometric quality of ORSSIs can, indeed, be improved. However, the camera status is not always constant during the whole in-orbit life of optical satellites. Space environment changes and camera depletions perhaps change the camera status to some extent. This means that in-orbit geometric calibration should be performed aperiodically, depending on the camera status. Otherwise, the currently used camera parameters will be unable to describe the changed camera status, and these inaccurate camera parameters will reduce the internal geometric quality of ORSSIs. At present, the in-orbit geometric calibration of optical satellite cameras is often performed by ORSSI vendors. As the number of in-orbit optical satellites increases, it is very difficult for ORSSI vendors to guarantee that each satellite camera has accurate camera parameters at all times. When users receive ORSSIs that were produced with inaccurate camera parameters, they are unable to perform geometric calibration. The reason for this is that satellite positions, satellite attitudes, and imaging time parameters are unavailable for ORSSI users. They are unable to establish geometric calibration models. In this case, the internal geometric quality of ORSSIs cannot be improved for ORSSI users with widely used in-orbit geometric calibration methods.
From the ORSSI users’ perspective, a feasible internal geometric quality improvement method for ORSSIs with image reorientation is presented in this study. In the presented method, a sensor orientation model, an EO model, and an IO model are successively established. Then, with the help of GCPs extracted from reference DOMs and DEMs, the EO and IO model parameters are estimated. Finally, ORSSIs are reoriented with the estimated IO model parameters. With the presented method, the internal biases of ORSSIs, caused by inaccurate camera parameters, can effectively be eliminated, and the internal geometric quality can, therefore, be improved.
The remainder of this paper is organized as follows. Section 2 details the presented internal geometric quality improvement method, including the establishment of the sensor orientation, EO, and IO models, and the image reorientation. Section 3 describes the use of ten HaiYang-1C coastal zone imager (CZI) images, a ZiYuan-3 02 nadir image, a GaoFen-1B panchromatic image, and a GaoFen-1D panchromatic image to analyze the feasibility and effectiveness of the presented method. All the tested images are in level 1; that is, geometric positioning, band registration, geometric stitching, and relative radiometric correction are completed. Section 4 gives the conclusions.

2. Methodology

2.1. Sensor Orientation Model

Existing sensor orientation models of ORSSIs can mainly be divided into two categories: PSMs and empirical sensor models [3,27]. Establishing a PSM involves a series of very complicated space coordinate transformations. Moreover, different ORSSIs perhaps have different PSMs, due to their different imaging mechanisms, different camera structures, and different satellite position and attitude definitions. For ORSSI users, satellite positions, satellite attitudes, and imaging time parameters are often unavailable, so they are unable to establish the PSM of an ORSSI. Instead, they can establish the RFM, since the rational polynomial coefficients (RPCs) are often supplied by ORSSI vendors, together with the corresponding image.
The RFM is a widely used empirical sensor model in spaceborne photogrammetry. Compared with the PSM, the RFM has the characteristics of simplicity and universality and is free of professionalism. The RFM has been taken as a standard sensor orientation model by many optical satellites, such as IKONOS, QuickBird, ZiYuan-3, and GaoFen-1 satellites. Hence, we employ the RFM as the sensor orientation model of ORSSIs in this study.
Mathematically, the RFM describes the geometric relationship between an image point and the corresponding ground point with the ratios of cubic polynomials, as follows:
r n = p 1 ( φ n , λ n , h n ) p 2 ( φ n , λ n , h n ) c n = p 3 ( φ n , λ n , h n ) p 4 ( φ n , λ n , h n )
p 1 ( φ n , λ n , h n ) = a 1 + a 2 λ n + a 3 φ n + a 4 h n + a 5 λ n φ n + a 6 λ n h n + a 7 φ n h n + a 8 λ n 2 + a 9 φ n 2 + a 10 h n 2 + a 11 λ n φ n h n + a 12 λ n 3 + a 13 λ n φ n 2 + a 14 λ n h n 2 + a 15 λ n 2 φ n + a 16 φ n 3 + a 17 φ n h n 2 + a 18 λ n 2 h n + a 19 φ n 2 h n + a 20 h n 3
where (rn, cn) are the normalized values of the image point coordinates (r, c); and (φn, λn, hn) are the normalized latitude, longitude, and height of the corresponding ground point, respectively; a1, a2, …, a20 are the coefficients of the polynomial p1, and the coefficients of p2, p3, and p4 are defined similarly. The coefficients of the polynomials p1, p2, p3, and p4 are named RPCs.

2.2. External Orientation Model

The RFM is actually a fitting model that uses a mathematical model to fit the PSM. Although the fitting errors from the PSM to the RFM can often be ignored, the biases in the PSM, caused by satellite position and attitude errors, are undoubtedly propagated into the estimated RPCs. In order to better improve the IO accuracy of ORSSIs, we should first eliminate the external biases caused by satellite position and attitude errors.
Satellite position and attitude errors often result in temporal line of sight (LOS) variations over a full linear-array satellite image; that is, different image lines perhaps have different and temporal external biases. Previous studies have shown that an affine transformation model or even a shift model is sufficient to compensate such external biases in the RFM [28,29]. The EO model of ORSSIs can, therefore, be expressed as follows:
r = e 0 + e 1 r p + e 2 c p c = f 0 + f 1 r p + f 2 c p
where (e0, f0) model the shift, (e0, e1, f0, f1) model the shift and drift, and (e0, e1, e2, f0, f1, f2) describe an affine transformation; (rp, cp) are the projected image point coordinates of the ground point and can be obtained as follows:
r p = p 1 ( φ n , λ n , h n ) p 2 ( φ n , λ n , h n ) r s + r o c p = p 3 ( φ n , λ n , h n ) p 4 ( φ n , λ n , h n ) c s + c o
where (ro, co) and (rs, cs) are the offset and scaling values of the image point coordinates (r, c).

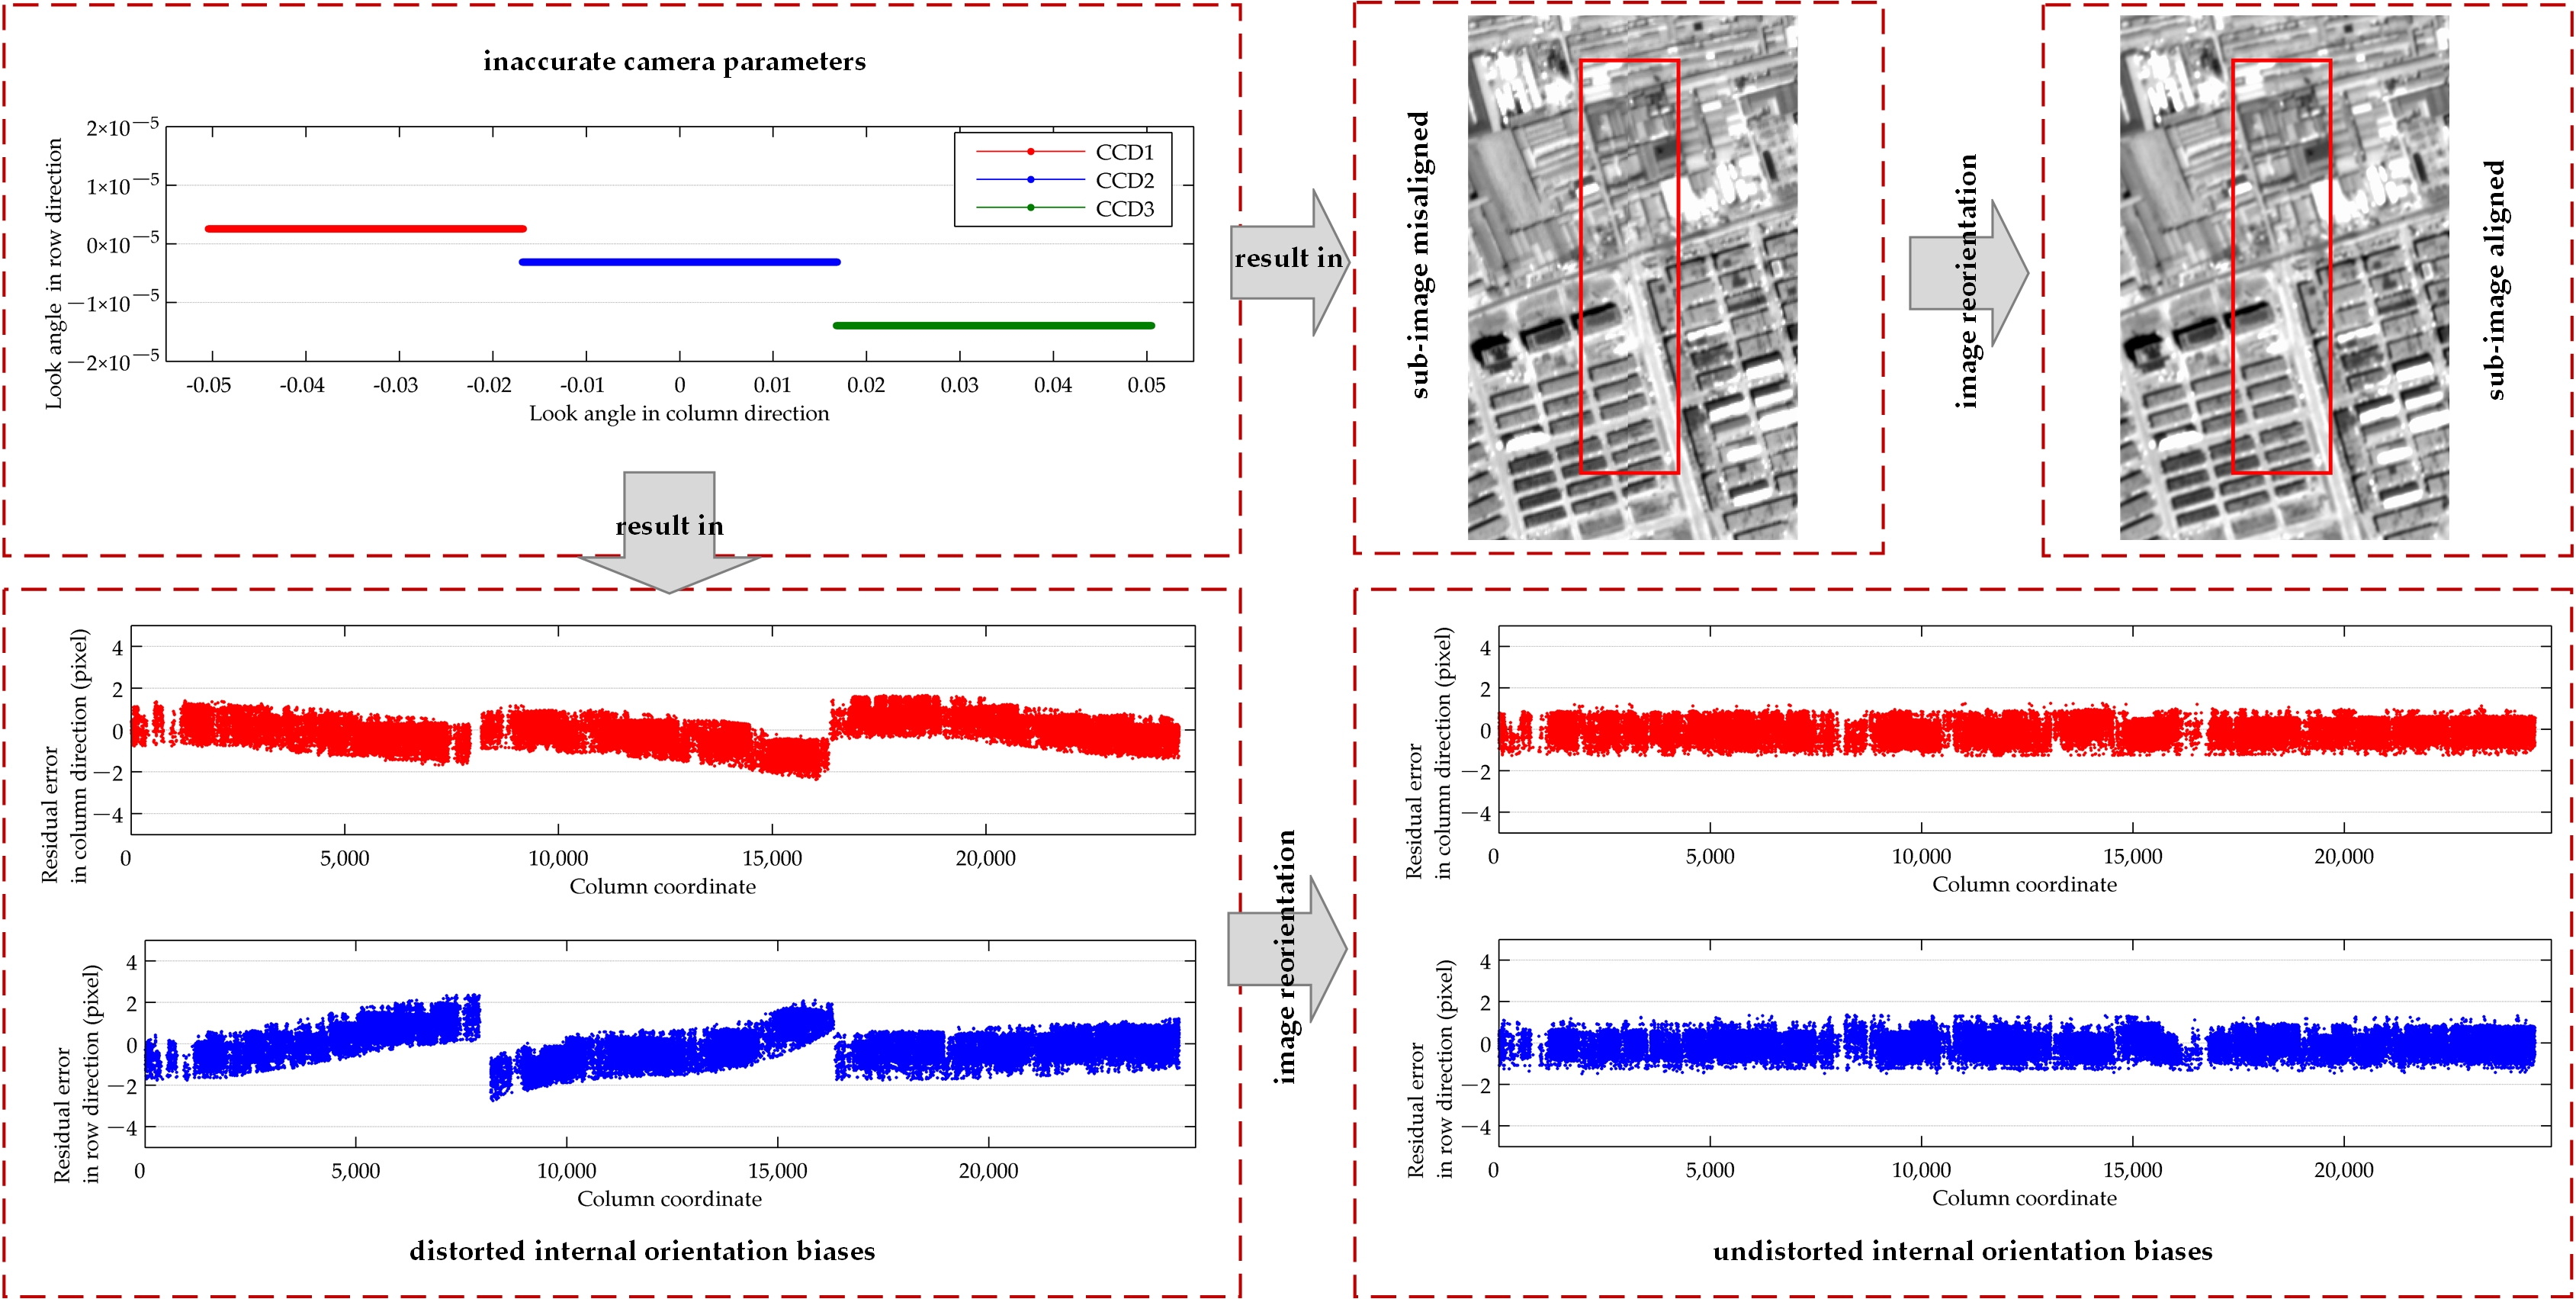
2.3. Internal Orientation Model

Currently, multiple satellite cameras or multiple linear-array CCDs are often used to increase the total image swath of ORSSIs. In ORSSI ground-processing, a virtual linear-array CCD is often set, and then multiple sub-images collected by each CCD are geometrically stitched together [30,31]. The ORSSIs provided by ORSSI vendors are actually stitched images rather than original sub-images.
In the geometric stitching procedures, the camera parameters of the virtual CCD are manually set and free of errors. The RPCs, together with ORSSIs provided by ORSSI vendors, are generated with the virtual CCD. The RPCs of ORSSIs are, therefore, free of internal biases. In fact, the inaccurate camera parameters of original CCDs only affect the stitched image rather than the corresponding RPCs. The influences caused by the inaccurate camera parameters on the stitched image mainly include image distortions, sub-image misalignment, and band misalignment. These influences will undoubtedly reduce the internal geometric quality of ORSSIs.
In order to improve the internal geometric quality of ORSSIs, we can borrow ideas from widely used in-orbit geometric calibration methods. In in-orbit geometric calibration, a look-angle model is often employed as the internal calibration model. Previous studies have shown that the look-angle model can indeed describe the internal biases caused by CCD translation and rotation errors, focal length errors, and camera distortions [9,26,30]. Mathematically, the look-angle model is actually a polynomial model. The IO biases caused by in accurate camera parameters, i.e., inaccurate polynomial model parameters, can theoretically be compensated by a polynomial model. Based on the above analysis, we establish the IO model of ORSSIs as follows:
r e r = s 0 , i + s 1 , i c + s 2 , i c 2 + s 3 , i c 3 + c e c = t 0 , i + t 1 , i c + t 2 , i c 2 + t 3 , i c 3 +
where (re, ce) are the projected image point coordinates of the ground point after EO bias compensation; (s0,i, s1,i, s2,i, s3,i, …, t0,i, t1,i, t2,i, t3,i, …) (i = 1, 2, 3, …, n) are IO model parameters. It is noted that each CCD has a set of look-angle model parameters in in-orbit geometric calibration. Accordingly, a set of IO model parameters is needed in Equation (5), and n denotes the number of original sub-images.
It is noted that this study only focuses on ORSSIs collected by multiple collinear linear-array CCDs. All the CCD detectors distribute collinearly in the across-track direction on the camera focal plane. Hence, only the coordinate c is sufficient to compensate the IO biases in Equation (5). For the ORSSIs collected by frame CCDs, both coordinates r and c should be considered.

2.4. Image Reorientation

With the sensor orientation model, EO model, and IO model established above, the sketch map of the presented internal geometric quality improvement method is shown in Figure 1.
The main procedures of the presented method are as follows:
  • Dense GCPs in an original image are automatically extracted from the reference DOMs and DEMs by image matching.
  • Each ground point p(φ, λ, h) is projected onto the image according to Equation (4), and a projected image point pp(rp, cp) is obtained. With the point pp(rp, cp) and the corresponding point p(r, c), the EO model parameters in Equation (3) are estimated according to the least squares adjustment method.
  • With the estimated EO model parameters, EO bias compensation of each projected image point pp(rp, cp) is performed, and an EO-bias-compensated image point pe(re, ce) is obtained. With the point pe(re, ce) and the corresponding point p(r, c), the IO model parameters in Equation (5) are estimated.
  • With the estimated IO model parameters, IO bias compensation of each image point p′(r, c) in a reoriented image is performed, and an IO-bias-compensated image point pi(ri, ci) is obtained. According to the image-space coordinates (ri, ci), a grey value is resampled from the original image and assigned to the image point p′(r, c).
After the original image is reoriented with the presented method, the IO biases can be eliminated and the internal geometric quality of the reoriented image can be improved.

3. Experimental Results

3.1. Experimental Datasets

In this study, ten HaiYang-1C CZI images in level 1 were first tested. The general characteristics of ten images are listed in Table 1. The size of each image was 21,800 × 7600 pixels. The ground sample distance (GSD) of CZI images was approximately 50 m. In order to evaluate the internal geometric quality of CZI images, we used the globally publicized Landsat DOMs with a resolution of 15 m and shuttle radar topography mission (SRTM) DEMs with a resolution of 90 m as the reference data. The planimetric accuracy of the Landsat DOM is 12 m [32], and the height accuracy of the SRTM DEM is 16 m [33]. The evaluation errors caused by the reference data are theoretically smaller than 0.3 pixel, which is acceptable for evaluating the internal geometric quality of CZI images. It is noted that CZI images have four bands. The presented internal geometric quality improvement method is the same for different bands. Hence, only band 1 of the ten CZI images was used to demonstrate the effectiveness of the presented method.

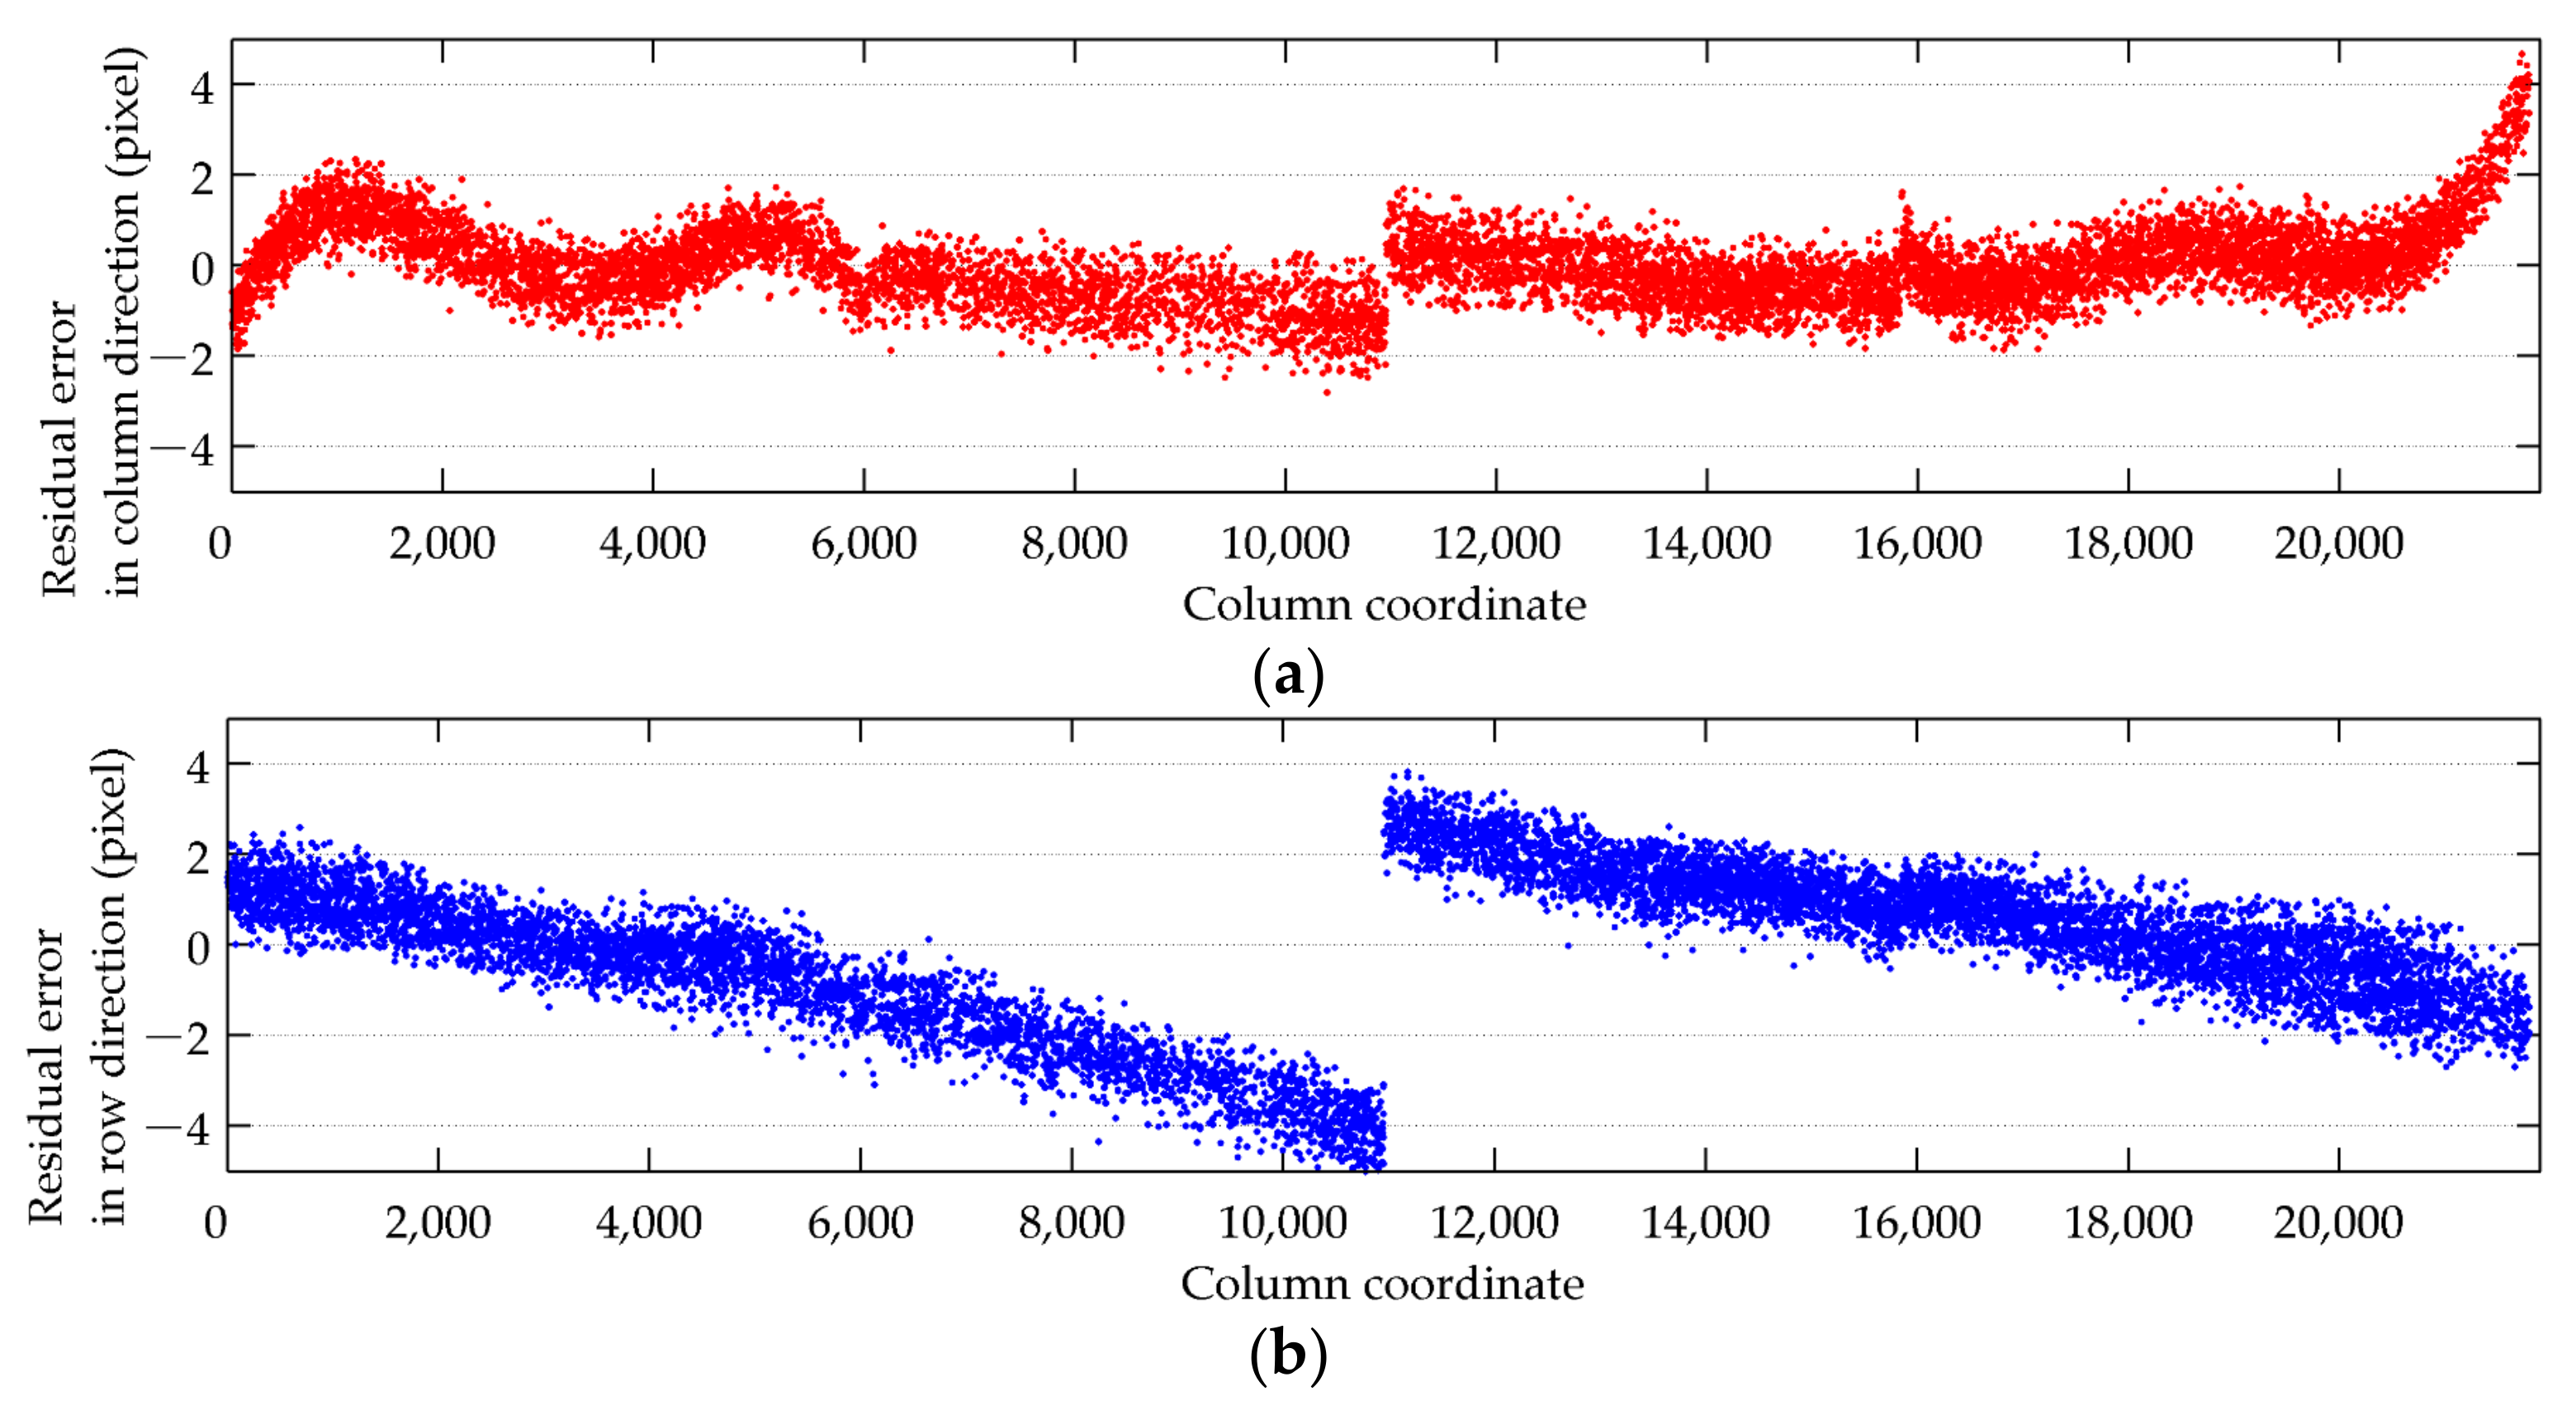
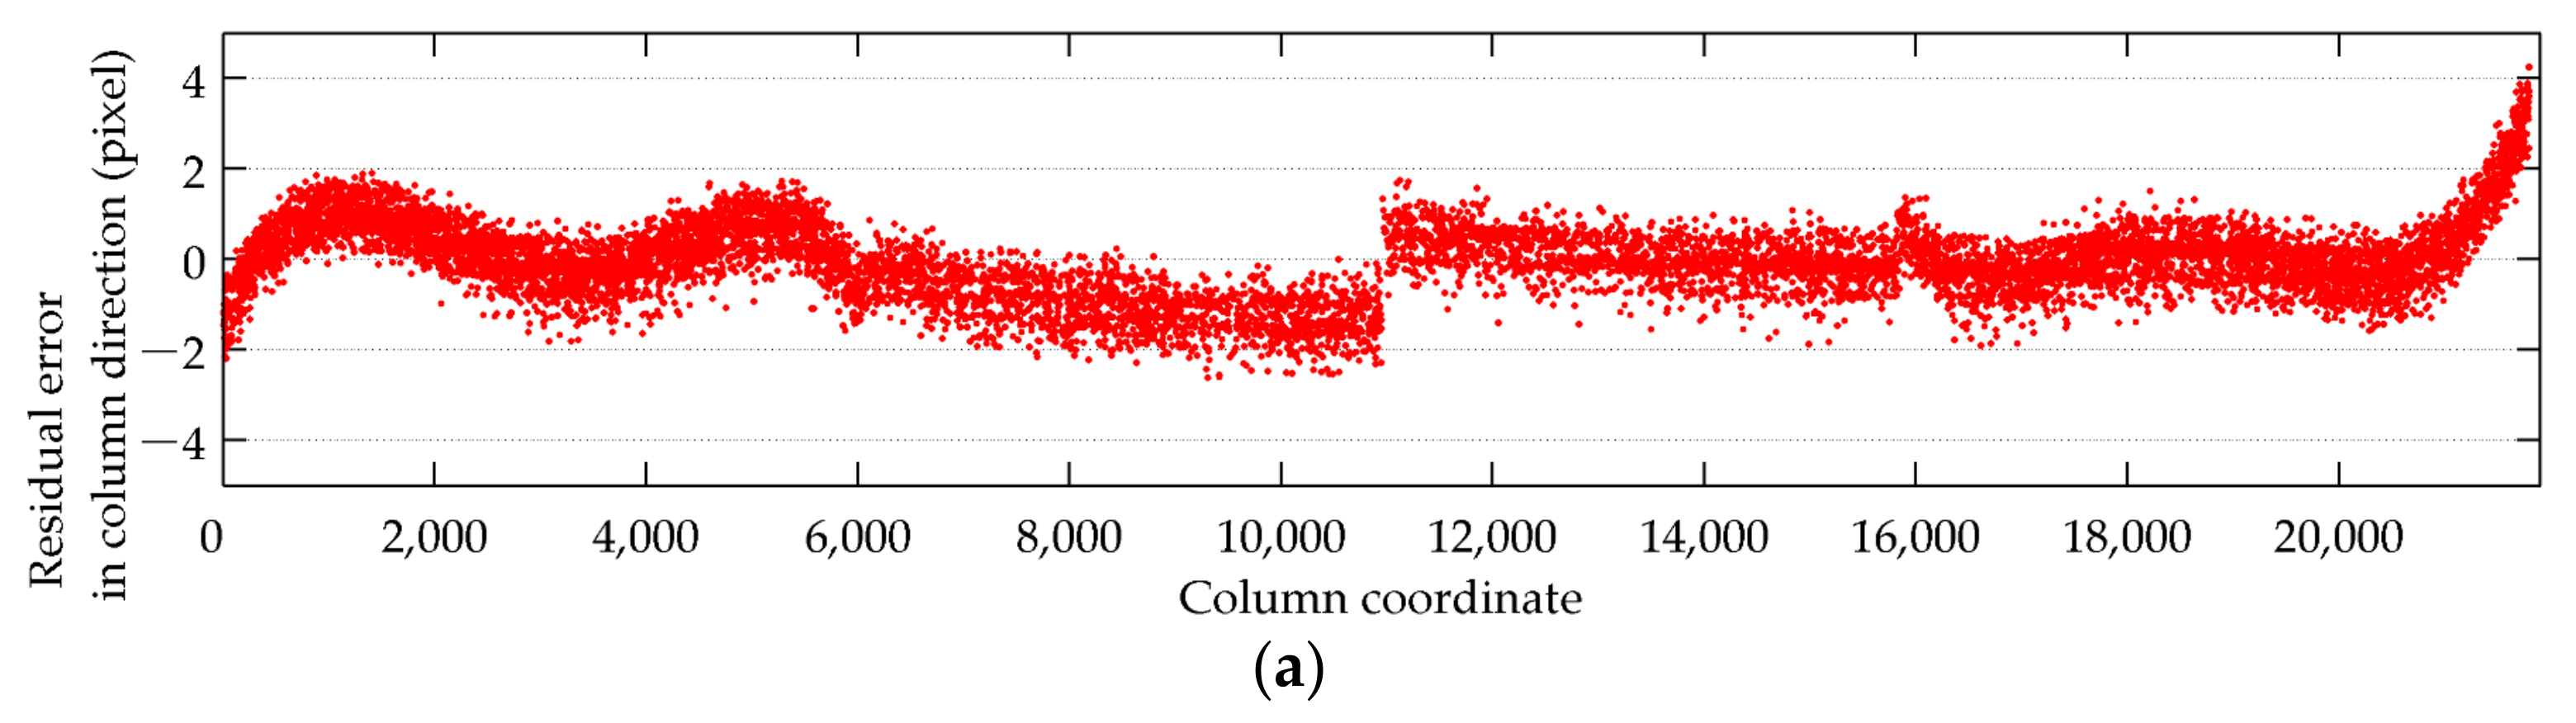
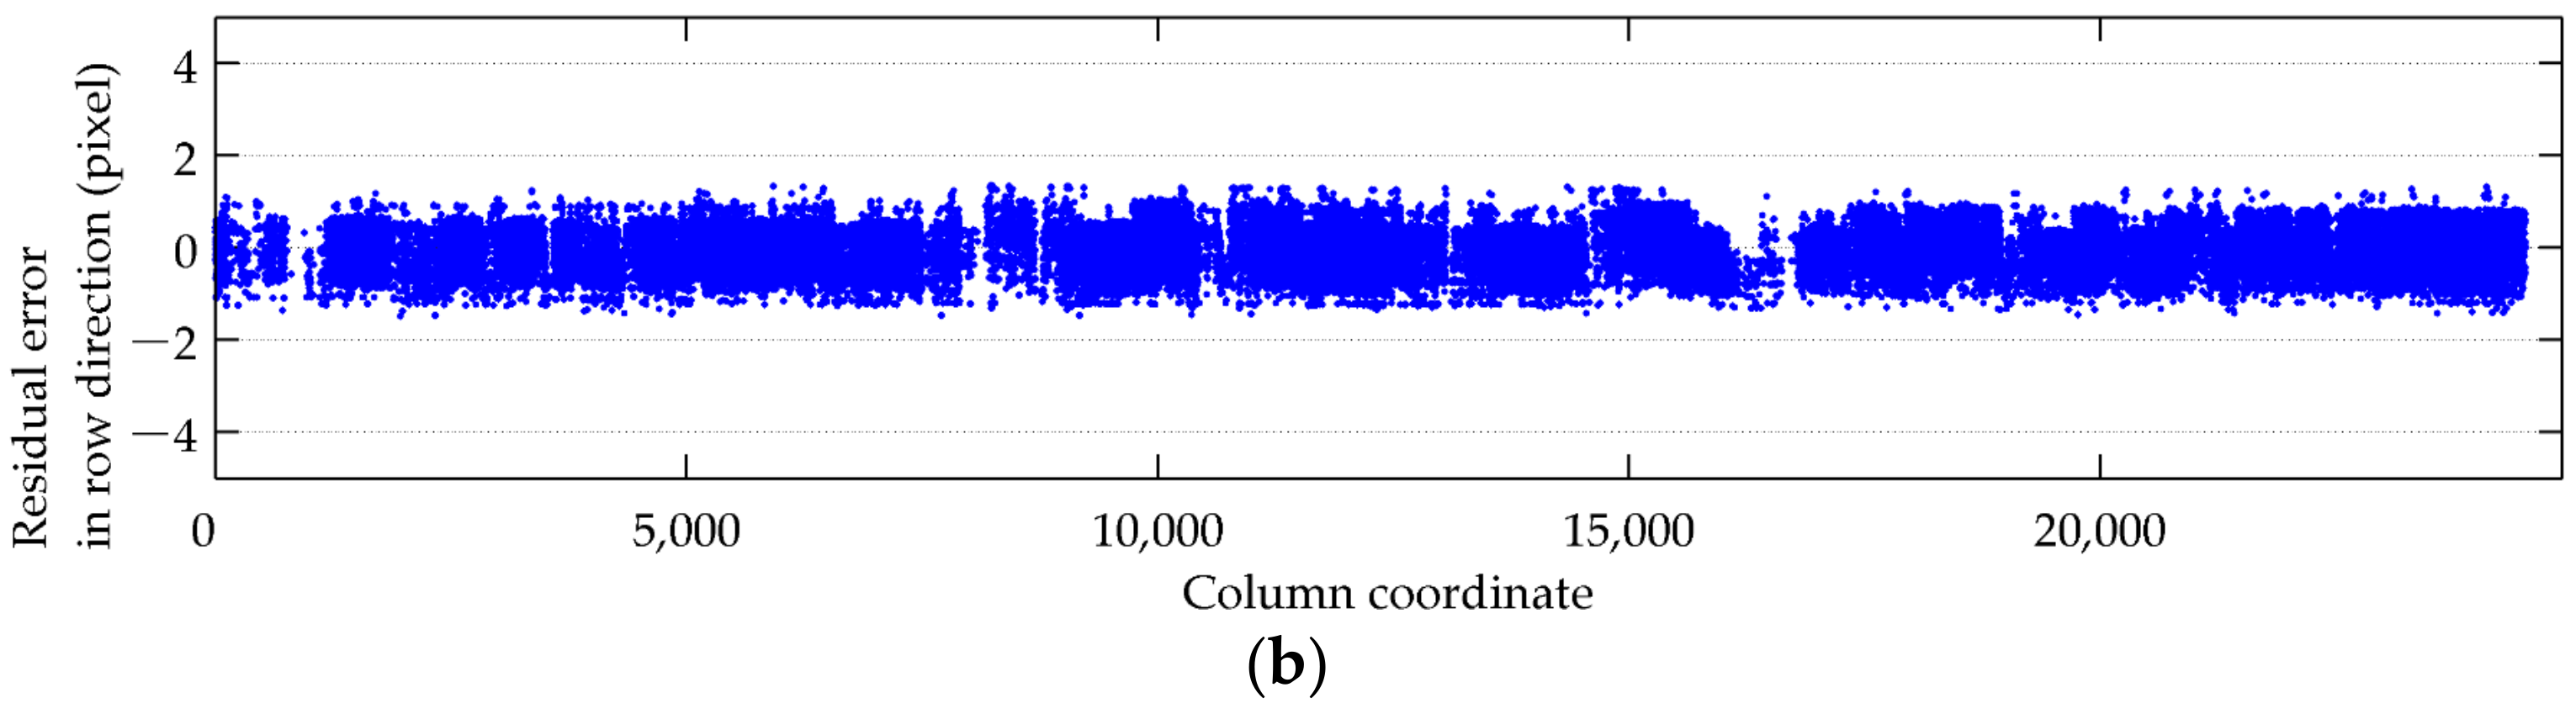
3.2. Internal Geometric Quality Analysis

In this section, image 1 in Table 1 was used to evaluate the presented method. Dense image matching was first performed and 49480 GCPs in image 1 were extracted from the reference DOM and DEM. For ORSSIs collected by multiple collinear linear-array CCDs, the IO biases of different image lines are theoretically the same. Hence, GCPs distributed in several hundred image lines rather than the whole image were sufficient to estimate the IO model parameters, as shown in Figure 2. Moreover, using GCPs that were distributed in a few lines can reduce the negative influence of satellite attitude jitters on the estimation of IO model parameters. The EO model parameters estimated with these lines may be unable to represent the LOS variations over the full image. This situation actually has no influence on the presented method, because only the IO model parameters are used to reorient ORSSIs.
With the extracted GCPs, the EO model parameters in Equation (3) and the IO model parameters in Equation (5) were successively estimated. Then, image 1 was reoriented with the estimated IO model parameters, as described in Section 2.4. In order to comparatively demonstrate the effectiveness of the presented method, we designed two experiments, as follows:
Experiment E1: The extracted GCPs in the original image were taken as checkpoints and used to evaluate the internal geometric quality without image reorientation;
Experiment E2: GCPs in the reoriented image were extracted from the reference DOM and DEM. The extracted GCPs were also taken as checkpoints and used to evaluate the internal geometric quality with image reorientation.
With regard to the internal geometric quality evaluation, the EO model parameters in Equation (3) were first estimated with GCPs. The EO biases of each projected image point of checkpoints were then compensated. Finally, the max errors and the root mean square errors (RMSEs) of coordinate residual errors between the EO-bias-compensated image points and the corresponding points were calculated and taken as the IO accuracy, i.e., internal geometric quality, as listed in Table 2. The residual error distributions of checkpoints in experiments E1 and E2 are shown in Figure 3 and Figure 4, respectively.
In experiment E1, the IO accuracy of image 1 without image reorientation was worse than 2.0 pixels. Image 1 had obvious IO biases, as shown in Figure 3. From the residual error distributions of the checkpoints, we could intuitively see that different parts of image 1 had different IO biases. The IO biases of image 1 were discontinuous in both the column and row directions and could not be modeled by a single IO model, expressed in Equation (5). In fact, the HaiYang-1C satellite is equipped with two CZI cameras, and each camera has two linear-array CCDs. Image 1 was geometrically stitched by four sub-images, collected by four corresponding CCDs. According to the residual error distributions of checkpoints, image 1 could be divided into four sub-images in the column direction. Each sub-image corresponded to a CCD. The inaccurate camera parameters of different CCDs resulted in different IO biases. Therefore, we could see discontinuous IO biases, shown in Figure 3, and sub-image misalignments, shown in Figure 5a.
When image 1 was logically divided into four sub-images, the residual error distributions of checkpoints in each sub-image presented an obvious polynomial characteristic, as shown in Figure 3. This polynomial characteristic was theoretically consistent with the look-angle model, i.e., a polynomial model, used in in-orbit geometric calibration. Hence, in experiment E2, the four IO models expressed in Equation (5) were used for each divided sub-image in image 1. The reoriented image of image 1 could then be obtained with the estimated IO model parameters. For image 1 with image reorientation, the IO biases could be effectively eliminated, as shown in Figure 4. The residual errors of checkpoints no longer showed a distorted characteristic. The sub-image misalignments could also be effectively eliminated, as shown in Figure 5b. Consequently, the IO accuracy of image 1 with image reorientation was improved to better than 1.0 pixel. This demonstrated that the IO model established in this study could precisely model the IO biases of CZI images caused by inaccurate camera parameters. This conclusion could also, theoretically, be supported by the model consistency between the look-angle model in in-orbit geometric calibration and the IO model established in this study.

3.3. Performance Analysis of Estimated Internal Orientation Parameters

As far as we know, if camera parameters of optical satellites are not precisely and timely determined, the IO biases of ORSSIs caused by inaccurate camera parameters should be theoretically systematic at least in several months. In order to further confirm that the IO biases of image 1 were indeed caused by inaccurate camera parameters, the IO model parameters estimated with image 1 in Section 3.2 were used to reorient images 2–10 in Table 2. Two comparative experiments were designed as follows.
Experiment S1: The checkpoints in original images 2–10 were extracted, and the internal geometric quality of images 2–10, without image reorientation, were evaluated;
Experiment S2: The checkpoints in reoriented images 2–10 were extracted, and the internal geometric quality of images 2–10, with image reorientation, were evaluated.
The IO accuracies of images 2–10 achieved in experiments S1 and S2 are listed in Table 3. Images 2 and 3 were taken as two examples. The checkpoint distributions in images 2 and 3 are shown in Figure 6. The residual error distributions of the checkpoints in image 2, achieved in experiments S1 and S2, are shown in Figure 7 and Figure 8, respectively. The residual error distributions of the checkpoints in image 3 are shown in Figure 9 and Figure 10.
Comparing Figure 7 and Figure 9 with Figure 3, we can intuitively see that the residual error distributions of the checkpoints in images 2 and 3, without image reorientation, were almost the same as those in image 1. The IO accuracies for images 2–10 achieved in experiment S1 were also worse than expected. It could be concluded that the IO biases of these images were systematic biases caused by inaccurate camera parameters.
In experiment S2, the IO biases of images 2–10 with image reorientation were effectively eliminated, and all the IO accuracies were better than 1.0 pixel. The residual error distributions of the checkpoints in Figure 8 and Figure 10 no longer showed an obvious distorted characteristic. The remained residual errors showed a different distribution for different images. These may be caused by some unknown random factors and could be neglected. This demonstrated that the IO model parameters estimated in image 1 performed very well in other images. That is to say, with the presented method, the IO model parameters estimated in one image could be used to effectively eliminate the IO biases of other images caused by inaccurate camera parameters, as in-orbit geometric calibration. The internal geometric quality of other images could, therefore, be improved.
Comparing the IO accuracies of the HaiYang-1C images in experiment S2 with those achieved in Table 5 in [34], we could see that the IO accuracies achieved by the presented method were almost the same as those achieved by the widely used in-orbit geometric calibration method. This demonstrates that the presented method could perform as well as the geometric calibration method in improving the internal geometric accuracy. However, the in-orbit geometric calibration method is generally impractical for ORSSI users, due to the unavailability of satellite positions and attitudes and some other imaging parameters. Users are often supplied with ORSSIs and the corresponding RPCs. Hence, the presented method is much more practical for users than the in-orbit geometric calibration method.

3.4. Experiments with Other Optical Satellite Images

In this section, a ZiYuan-3 02 nadir image in level 1, a GaoFen-1B panchromatic image in level 1, and a GaoFen-1D panchromatic image in level 1 were tested. The general characteristics of three images are listed in Table 4. The GSDs of the ZiYuan-3 02, GaoFen-1B, and GaoFen-1D images were 2.1 m, 2.0 m, and 2.0 m, respectively. In order to evaluate the internal geometric quality, a DOM with a GSD of 0.4 m and a DEM with a GSD of 5.0 m were used as the reference data for the ZiYuan-3 02 and GaoFen-1D images. A DOM with a GSD of 0.5 m and a DEM with a GSD of 2.1 m were used as the reference data for the GaoFen-1B image. Generally, the evaluation errors caused by the reference data could be neglected.
The ZiYuan-3 02 nadir camera, the GaoFen-1B panchromatic camera, and the GaoFen-1D panchromatic camera all have three linear-array CCDs. That is to say, the ZiYuan-3 02, GaoFen-1B, and GaoFen-1D images provided by image vendors were actually stitched by three sub-images collected by three corresponding CCDs. In order to further evaluate the effectiveness of the presented method, a set of inaccurate camera parameters for the three satellite cameras were intentionally used to produce the three images. The accurate and inaccurate camera parameters of the ZiYuan-3 02 camera were taken as an example and are shown in Figure 11.
For comparative demonstration, experiments E1 and E2, designed in Section 3.2, were also used here. The extracted GCPs in the three images are shown in Figure 12. The IO accuracies of the three images achieved in both experiments are listed in Table 5. The ZiYuan-3 02 image was taken as an example, and the residual error distributions of checkpoints are shown in Figure 13 and Figure 14.
In Figure 11a, the accurate camera parameters, i.e., look-angles, of the ZiYuan-3 02 camera are represented with a three-order polynomial model. When a one-order polynomial model, shown in Figure 11b, was used to represent the look angles, the camera parameters were obviously inaccurate. The unmodeled internal distortions in the inaccurate camera parameters were undoubtedly propagated into the stitched images, which could be proved by Figure 13. The residual error distributions of checkpoints were intuitively divided into three parts. Each part actually corresponded to a sub-image collected by one CCD. Due to the inaccurate camera parameters that were used, each part of the residual error distributions showed an obvious polynomial characteristic. Moreover, the residual error distributions between the adjacent parts were discontinuous. In the stitched image, we could then see sub-image misalignments, as shown in Figure 15a. The internal geometric quality achieved in experiment E1 was, therefore, worse, as listed in Table 5.
Comparing Figure 14 with Figure 13, we can see that the residual error distributions of checkpoints in the reoriented image were continuous and had no obvious distorted characteristic. That is to say, the IO biases of the original image caused by inaccurate camera parameters in experiment E1 were effectively eliminated. Consequently, the sub-image misalignments in the reoriented image were also effectively eliminated, as shown in Figure 15b, and the IO accuracies of the three images were improved to better than 1.0 pixel, as listed in Table 5.
The tested GaoFen-1B and GaoFen-1D images listed in Table 4 were also produced with inaccurate camera parameters. The internal distortions in the inaccurate camera parameters of the GaoFen-1B camera were manually set to be larger than those of the ZiYuan-3 02 and GaoFen-1D cameras. Hence, the IO accuracy of the GaoFen-1B image reached worse than 7.0 pixels, as listed in Table 5. With the presented method, the IO accuracy of the reoriented GaoFen-1B image was also improved to better than 1.0 pixel, just like the ZiYuan-3 02 and GaoFen-1D images. This demonstrates that the presented method could greatly improve the internal geometric quality.

4. Discussions

In this study, we present a feasible internal geometric quality improvement method for ORSSIs. One important procedure of the presented method is to establish a mathematical model to represent the IO biases of ORSSIs caused by inaccurate camera parameters. In order to establish a precise and practical model, we actually borrowed ideas from the widely used in-orbit geometric calibration methods. At present, an increasing number of remote sensing image processing tasks (e.g., image recognition, scene classification, landslide detection, and building extraction) employ the deep learning method, and many impressive results have been achieved [35,36,37,38,39]. We can also borrow ideas from these image processing tasks; that is, a neural network rather than a precise mathematical model can be used to represent the IO biases. The internal geometric quality of ORSSIs could also possibly also improved. More studies should be conducted to confirm this.

5. Conclusions

In-orbit geometric calibration is the most widely used method to improve the internal geometric quality of ORSSIs in applications. However, due to delayed or imprecise geometric calibration, the internal geometric quality of ORSSIs is sometimes worse than expected. From the ORSSI users’ perspective, it is very difficult or even impossible to perform in-orbit geometric calibration with ORSSIs in level 1, because satellite positions, satellite attitudes, and imaging parameters are unavailable for ORSSIs. In this study, a feasible internal geometric quality improvement method for ORSSIs with image reorientation is presented. In the presented method, ORSSIs in level 1 are taken as input images, and the RFM rather than the PSM is employed as the sensor orientation model. Based on the RFM, the EO and IO models are successively established. With the estimated IO model parameters, the original ORSSIs are then reoriented. After image orientation, the internal geometric quality of reoriented ORSSIs can be improved. Unlike in-orbit geometric calibration, the presented method requires ORSSIs in level 1 with the corresponding RPCs, rather than ORSSIs in level 0 with satellite attitudes and positions. ORSSIs in level 1 with the corresponding RPCs are conveniently available for ORSSI users. Hence, the presented method is very practical for ORSSI users.
The presented internal geometric quality improvement method was tested on ten HaiYang-1C CZI images, a ZiYuan-3 02 nadir image, a GaoFen-1B panchromatic image, and a GaoFen-1D panchromatic image. The experimental results showed that the IO model established in this study could precisely model the IO biases of ORSSIs caused by inaccurate camera parameters. With the help of image reorientation, the IO biases with a discontinuous distorted characteristic could be effectively eliminated and the internal geometric quality could then be improved. Moreover, the IO model parameters estimated with one ORSSI could be used to reorient other ORSSIs and improve their internal geometric quality, as in-orbit geometric calibration. As such, the experimental results demonstrated the effectiveness of the presented method.
It should be noted that the influence mechanism of satellite attitude jitters on the internal geometric quality of ORSSIs is different from that of inaccurate camera parameters. The presented method mainly focuses on the IO biases caused by inaccurate camera parameters, whilst satellite attitude jitters are not considered. Special methods should be developed or used to eliminate the IO biases caused by satellite attitude jitters. Whether the internal geometric quality improvement in ORSSIs can improve the quality of downstream tasks (e.g., image recognition, scene classification, landslide detection, and building extraction) needs to be further studied.

Author Contributions

Conceptualization, J.C. and Z.Y.; methodology, J.C. and N.Z.; software, H.S.; validation, Z.Y. and Z.Z.; writing—original draft preparation, J.C. and N.Z.; writing—review and editing, H.S., Z.Y. and Z.Z. All authors have read and agreed to the published version of the manuscript.

Funding

This research was funded in part by the National Natural Science Foundation of China (NSFC), grant number 61801331 and 61901307, in part by the Scientific Research Foundation of Hubei University of Technology, grant number BSQD2020055, and in part by the Northwest Engineering Corporation Limited Major Science and Technology Projects, grant number XBY-ZDKJ-2020-08.

Institutional Review Board Statement

Not applicable.

Informed Consent Statement

Not applicable.

Data Availability Statement

Not applicable.

Acknowledgments

The authors would like to thank the anonymous reviewers and members of the editorial team for their comments and contributions.

Conflicts of Interest

The authors declare no conflict of interest.

Abbreviations

For the sake of easier text reading, a nomenclature of the used symbols and acronyms is listed as follows.
ORSSIsoptical remote sensing satellite images;
EOexternal orientation;
IOinternal orientation;
PSMphysical sensor model;
RFMrational function model;
GCPsground control points;
CCDcharge-coupled device;
DOMsdigital orthophoto maps;
DEMsdigital elevation models;
CZIcoastal zone imager;
RPCsrational polynomial coefficients;
LOSline of sight;
GSDground sample distance;
SRTMshuttle radar topography mission;
RMSEsroot mean square errors.

References

  1. Tong, X.; Liu, S.; Weng, Q. Bias-Corrected Rational Polynomial Coefficients for High Accuracy Geo-positioning of QuickBird Stereo Imagery. ISPRS J. Photogram. Remote Sens. 2010, 65, 218–226. [Google Scholar] [CrossRef]
  2. Hong, Z.; Tong, X.; Liu, S.; Chen, P.; Xie, H.; Jin, Y. A Comparison of the Performance of Bias-Corrected RSMs and RFMs for the Geo-Positioning of High-Resolution Satellite Stereo Imagery. Remote Sens. 2015, 7, 16815–16830. [Google Scholar] [CrossRef] [Green Version]
  3. Poli, D. A Rigorous Model for Spaceborne Linear Array Sensors. Photogramm. Eng. Remote Sens. 2007, 73, 187–196. [Google Scholar] [CrossRef] [Green Version]
  4. Aguilar, M.A.; Aguilar, F.J.; Saldaña, M.M.; Fernández, I. Geopositioning Accuracy Assessment of GeoEye-1 Panchromatic and Multispectral Imagery. Photogramm. Eng. Remote Sens. 2012, 78, 247–257. [Google Scholar] [CrossRef]
  5. Aguilar, M.A.; Saldaña, M.M.; Aguilar, F.J. Assessing Geometric Accuracy of the Orthorectification Process from GeoEye-1 and WorldView-2 Panchromatic Images. Int. J. Appl. Earth Obs. Geoinform. 2013, 21, 427–435. [Google Scholar] [CrossRef]
  6. Zheng, M.; Zhang, Y.; Zhu, J.; Xiong, X. Self-Calibration Adjustment of CBERS-02B Long-Strip Imagery. IEEE Trans. Geosci. Remote Sens. 2015, 53, 3847–3854. [Google Scholar] [CrossRef]
  7. Zhu, Y.; Wang, M.; Cheng, Y.; He, L.; Xue, L. An Improved Jitter Detection Method Based on Parallax Observation of Multispectral Sensors for Gaofen-1 02/03/04 Satellites. Remote Sens. 2019, 11, 16. [Google Scholar] [CrossRef] [Green Version]
  8. Tong, X.; Ye, Z.; Li, L.; Liu, S.; Jin, Y.; Chen, P.; Xie, H.; Zhang, S. Detection and Estimation of Along-Track Attitude Jitter from ZiYuan-3 Three-Line-Array Images Based on Back-Projection Residuals. IEEE Trans. Geosci. Remote Sens. 2017, 55, 4272–4284. [Google Scholar] [CrossRef]
  9. Wang, M.; Yang, B.; Hu, F.; Zang, X. On-Orbit Geometric Calibration Model and Its Applications for High-Resolution Optical Satellite Imagery. Remote Sens. 2014, 6, 4391–4408. [Google Scholar] [CrossRef] [Green Version]
  10. Shen, X.; Liu, B.; Li, Q. Correcting Bias in the Rational Polynomial Coefficients of Satellite Imagery Using Thin-Plate Smoothing Splines. ISPRS J. Photogram. Remote Sens. 2017, 125, 125–131. [Google Scholar] [CrossRef]
  11. Shen, X.; Li, Q.; Wu, G.; Zhu, J. Bias Compensation for Rational Polynomial Coefficients of High-Resolution Satellite Imagery by Local Polynomial Modeling. Remote Sens. 2017, 9, 200. [Google Scholar] [CrossRef] [Green Version]
  12. Cao, J.; Yang, B.; Wang, M. Jitter Compensation of ZiYuan-3 Satellite Imagery Based on Object Point Coincidence. Int. J. Remote Sens. 2019, 40, 6116–6133. [Google Scholar] [CrossRef]
  13. Schwind, P.; Schneider, M.; Palubinskas, G.; Storch, T.; Müller, R.; Richter, R. Processors for ALOS Optical Data: Deconvolution, DEM Generation, Orthorectification, and Atmospheric Correction. IEEE Trans. Geosci. Remote Sens. 2009, 47, 4074–4082. [Google Scholar] [CrossRef]
  14. Takaku, J.; Tadono, T. PRISM On-Orbit Geometric Calibration and DSM Performance. IEEE Trans. Geosci. Remote Sens. 2009, 47, 4060–4073. [Google Scholar] [CrossRef]
  15. Wang, M.; Zhu, Y.; Jin, S.; Pan, J.; Zhu, Q. Correction of ZY-3 Image Distortion Caused by Satellite Jitter via Virtual Steady Reimaging Using Attitude Data. ISPRS J. Photogram. Remote Sens. 2016, 119, 108–123. [Google Scholar] [CrossRef]
  16. Teshima, Y.; Iwasaki, A. Correction of Attitude Fluctuation of Terra Spacecraft Using ASTER/SWIR Imagery with Parallax Observation. IEEE Trans. Geosci. Remote Sens. 2008, 46, 222–227. [Google Scholar] [CrossRef]
  17. Cao, J.; Fu, J.; Yuan, X.; Gong, J. Nonlinear Bias Compensation of ZiYuan-3 Satellite Imagery with Cubic Splines. ISPRS J. Photogram. Remote Sens. 2017, 133, 174–185. [Google Scholar] [CrossRef]
  18. Tong, X.; Li, L.; Liu, S.; Xu, Y.; Ye, Z.; Jin, Y.; Wang, F.; Xie, H. Detection and Estimation of ZY-3 Three-Line Array Image Distortions Caused by Attitude Oscillation. ISPRS J. Photogram. Remote Sens. 2015, 101, 291–309. [Google Scholar] [CrossRef]
  19. Zhang, Z.; Iwasaki, A.; Xu, G. Attitude Jitter Compensation for Remote Sensing Images Using Convolutional Neural Network. IEEE Geosci. Remote Sens. Lett. 2019, 16, 1358–1362. [Google Scholar] [CrossRef]
  20. Gachet, R. SPOT5 In-Flight Commission: Inner Orientation of HRG and HRS Instruments. Int. Arch. Photogramm. Remote Sens. Spatial Inform. 2004, 35, 535–539. [Google Scholar]
  21. Leprince, S.; Musé, P.; Avouac, J.P. In-Flight CCD Distortion Calibration for Pushbroom Satellites Based on Subpixel Correlation. IEEE Trans. Geosci. Remote Sens. 2008, 46, 2675–2683. [Google Scholar] [CrossRef]
  22. Radhadevi, P.V.; Solanki, S.S. In-Flight Geometric Calibration of Different Cameras of IRS-P6 Using a Physical Sensor Model. Photogramm. Rec. 2008, 23, 69–89. [Google Scholar] [CrossRef]
  23. Cao, J.; Yuan, X.; Gong, J. In-Orbit Geometric Calibration and Validation of ZY-3 Three-Line Cameras Based on CCD-Detector Look Angles. Photogramm. Rec. 2015, 30, 211–226. [Google Scholar] [CrossRef]
  24. Wang, M.; Guo, B.; Long, X.; Xue, L.; Cheng, Y.; Jin, S.; Zhou, X. On-Orbit Geometric Calibration and Accuracy Verification of GF-6 WFV Camera. Acta Geod. Cartogr. Sin. 2020, 49, 171–180. [Google Scholar] [CrossRef]
  25. Cheng, Y.; Wang, M.; Jin, S.; He, L.; Tian, Y. New On-Orbit Geometric Interior Parameters Self-Calibration Approach Based on Three-View Stereoscopic Images from High-Resolution Multi-TDI-CCD Optical Satellites. Opt. Express 2018, 26, 7475–7493. [Google Scholar] [CrossRef]
  26. Cheng, Y.; Jin, S.; Wang, M.; Zhu, Y.; Dong, Z. A New Image Mosaicking Approach for the Multiple Camera System of the Optical Remote Sensing Satellite GaoFen1. Remote Sens. Lett. 2017, 8, 1042–1051. [Google Scholar] [CrossRef]
  27. Habib, A.F.; Shin, S.W.; Kim, K.; Kim, C.; Bang, K.I.; Kim, E.M.; Lee, D.C. Comprehensive Analysis of Sensor Modeling Alternatives for High Resolution Imaging Satellites. Photogramm. Eng. Remote Sens. 2007, 73, 1241–1251. [Google Scholar] [CrossRef]
  28. Fraser, C.S.; Hanley, H.B. Bias-Compensated RPCs for Sensor Orientation of High-Resolution Satellite Imagery. Photogramm. Eng. Remote Sens. 2005, 71, 909–915. [Google Scholar] [CrossRef]
  29. Cao, J.; Yuan, X.; Fu, J.; Gong, J. Precise Sensor Orientation of High-Resolution Satellite Imagery with the Strip Constraint. IEEE Trans. Geosci. Remote Sens. 2017, 55, 5313–5323. [Google Scholar] [CrossRef]
  30. Cao, J.; Zhang, Z.; Jin, S.; Chang, X. Geometric Stitching of a HaiYang-1C Ultra Violet Imager with a Distorted Virtual Camera. Opt. Express 2020, 28, 14109–14116. [Google Scholar] [CrossRef] [PubMed]
  31. Cheng, Y.; Jin, S.; Wang, M.; Zhu, Y.; Dong, Z. Image Mosaicking Approach for a Double-Camera System in the GaoFen2 Optical Remote Sensing Satellite Based on the Big Virtual Camera. Sensors 2017, 17, 1441. [Google Scholar] [CrossRef] [Green Version]
  32. Wang, M.; Cheng, Y.; Tian, Y.; He, L.; Wang, Y. A New On-Orbit Geometric Self-Calibration Approach for the High-Resolution Geostationary Optical Satellite GaoFen4. IEEE J. Sel. Top. Appl. Earth Obs. Remote Sens. 2018, 11, 1670–1683. [Google Scholar] [CrossRef]
  33. CGIAR. SRTM 90m DEM Digital Elevation Database. Available online: https://srtm.csi.cgiar.org/ (accessed on 14 November 2021).
  34. Cao, J.; Wang, F.; Zhou, Y.; Ye, Z. In-Orbit Geometric Calibration of HaiYang-1C Coastal Zone Imager with Multiple Fields. Opt. Express 2021, 29, 18950–18965. [Google Scholar] [CrossRef] [PubMed]
  35. Xie, M.; Jean, N.; Burke, M.; Lobell, D.; Ermon, S. Transfer Learning from Deep Features for Remote Sensing and Poverty Mapping. In Proceedings of the 13th AAAI Conference on Artificial Intelligence, Phoenix, AZ, USA, 12–17 February 2016; pp. 3929–3935. [Google Scholar]
  36. Pires de Lima, R.; Marfurt, K. Convolutional Neural Network for Remote Sensing Scene Classification: Transfer Learning Analysis. Remote Sens. 2020, 12, 86. [Google Scholar] [CrossRef] [Green Version]
  37. Qin, S.; Guo, X.; Sun, J.; Qiao, S.; Zhang, L.; Yao, J.; Cheng, Q.; Zhang, Y. Landslide Detection from Open Satellite Imagery Using Distant Domain Transfer Learning. Remote Sens. 2021, 13, 3383. [Google Scholar] [CrossRef]
  38. Rostami, M.; Kolouri, S.; Eaton, E.; Kim, K. Deep Transfer Learning for Few-Shot SAR Image Classification. Remote Sens. 2019, 11, 1374. [Google Scholar] [CrossRef] [Green Version]
  39. Ji, S.; Wei, S.; Lu, M. A Scale Robust Convolutional Neural Network for Automatic Building Extraction from Aerial and Satellite Imagery. Int. J. Remote Sens. 2019, 40, 3308–3322. [Google Scholar] [CrossRef]
Figure 1. The sketch map of the presented method.
Remotesensing 14 00471 g001
Figure 2. GCP distributions in image 1.
Remotesensing 14 00471 g002
Figure 3. Residual error distributions of checkpoints in (a) column and (b) row directions in experiment E1.
Remotesensing 14 00471 g003
Figure 4. Residual error distributions of checkpoints in (a) column and (b) row directions in experiment E2.
Remotesensing 14 00471 g004
Figure 5. Sub-image misalignments in image 1 in (a) experiment E1 and (b) experiment E2.
Remotesensing 14 00471 g005
Figure 6. Checkpoint distributions in (a) image 2 and (b) image 3.
Remotesensing 14 00471 g006
Figure 7. Residual error distributions of checkpoints in (a) column and (b) row directions of image 2 in experiment S1.
Remotesensing 14 00471 g007
Figure 8. Residual error distributions of checkpoints in (a) column and (b) row directions of image 2 in experiment S2.
Remotesensing 14 00471 g008
Figure 9. Residual error distributions of checkpoints in (a) column and (b) row directions of image 3 in experiment S1.
Remotesensing 14 00471 g009aRemotesensing 14 00471 g009b
Figure 10. Residual error distributions of checkpoints in (a) column and (b) row directions of image 3 in experiment S2.
Remotesensing 14 00471 g010
Figure 11. (a) Accurate and (b) inaccurate camera parameters of the ZiYuan-3 02 nadir camera.
Remotesensing 14 00471 g011
Figure 12. GCP distributions in the (a) ZiYuan-3 02, (b) GaoFen-1B, and (c) GaoFen-1D images.
Remotesensing 14 00471 g012
Figure 13. Residual error distributions of checkpoints in (a) column and (b) row directions of the ZiYuan-3 02 image in experiment E1.
Remotesensing 14 00471 g013
Figure 14. Residual error distributions of checkpoints in (a) column and (b) row directions of the ZiYuan-3 02 image in experiment E2.
Remotesensing 14 00471 g014aRemotesensing 14 00471 g014b
Figure 15. Sub-image misalignments in (a) experiment E1 and (b) experiment E2.
Remotesensing 14 00471 g015
Table 1. General characteristics of the HaiYang-1C CZI images.
ImageAcquisition DateLatitude and Longitude of Scene Center (°)Terrain Relief (m)
Image 18 October 201986.65°W, 40.69°N145~435
Image 27 November 2019147.21°E, 30.52°S0~1432
Image 325 July 201922.28°E, 26.49°S578~2047
Image 429 July 201931.09°E, 24.85°S0~2295
Image 519 August 201945.74°E, 36.35°N7~4096
Image 612 June 201952.58°E, 31.99°N0~4108
Image 710 December 201986.17°E, 29.75°N589~7772
Image 89 December 2019105.81°E, 39.68°N622~3121
Image 914 October 2019117.13°E, 48.42°N134~2262
Image 1024 September 2019125.26°E, 48.05°N50~1655
Table 2. The IO accuracy of image 1.
ImageExperimentNumber
of GCPs
Max (Pixel)RMSE (Pixel)
rcPlanimetryrcPlanimetry
1E149,480−4.4793.7574.8031.9370.9032.137
E249,4321.198−1.1971.5500.3780.3760.533
Table 3. The IO accuracies of images 2–10.
ImageExperimentNumber
of GCPs
Max (Pixel)RMSE (Pixel)
rcPlanimetryrcPlanimetry
2S111,410−5.0264.2545.3841.4280.8301.651
S211,404−1.506−1.4991.9810.5010.4820.696
3S18619−4.1742.6344.4300.8951.6571.884
S286221.5001.5001.9860.5200.5000.721
4S114,579−5.0404.5065.6231.7180.8801.930
S214,585−1.495−1.4862.0160.4870.4370.655
5S114,454−4.5944.0405.0221.5120.7211.675
S214,452−1.584−1.4112.0430.5620.4480.719
6S114,183−4.7554.8415.7991.8580.9602.092
S214,186−1.820−1.4992.3220.5920.5310.796
7S111,894−5.3803.7475.6011.6570.7851.834
S211,888−1.701−1.6762.1790.5400.5590.778
8S112,415−5.0794.0645.3701.6630.7941.843
S212,418−1.482−1.6782.1750.6020.4910.777
9S111,898−5.1333.8835.6471.7320.8191.916
S211,888−1.537−1.4932.0920.5050.5200.725
10S110,504−5.8464.6695.8461.5600.8121.759
S210,507−1.5661.4952.1410.4580.5050.682
Table 4. General characteristics of the ZiYuan-3 02, GaoFen-1B, and GaoFen-1D images.
ImageAcquisition DateLatitude and Longitude of Scene Center (°)Terrain Relief (m)
ZiYuan-3 0216 April 2019117.866°E, 39.785°N1~399
GaoFen-1B20 June 2020117.647°E, 37.552°N1~124
GaoFen-1D5 June 2018117.877°E, 39.654°N1~334
Table 5. The IO accuracies of the ZiYuan-3 02, GaoFen-1B, and GaoFen-1D images.
ImageExperimentNumber
of GCPs
Max (Pixel)RMSE (Pixel)
rcPlanimetryrcPlanimetry
ZiYuan-3 02E195,525−2.746−2.3612.9300.7380.6150.961
E295,537−1.481−1.2731.9220.4280.4160.597
GaoFen-1BE116,641−25.812−21.37131.6615.9214.0197.156
E216,699−1.815−2.0512.6570.5770.6500.870
GaoFen-1DE153,8763.260−3.1174.1651.0911.0551.518
E253,9212.0212.1122.7080.6250.6500.903
Publisher’s Note: MDPI stays neutral with regard to jurisdictional claims in published maps and institutional affiliations.

